Embed Size (px)
Citation preview
1
Aqua regia activated Au/C catalysts for the hydrochlorination of
acetylene
Marco Conte,a,*
Catherine J. Davies,a David J. Morgan,
a Thomas E. Davies,
a David J.
Elias,a Albert F. Carley,
a Peter Johnston,
b and Graham J. Hutchings
a,*
a Cardiff Catalysis Institute, School of Chemistry, Cardiff University, Cardiff, CF10
3AT, UK
b Johnson Matthey Catalysts, Orchard Road, Royston, Herts, SG8 5HE, UK
*E-mail: [email protected], [email protected]
2
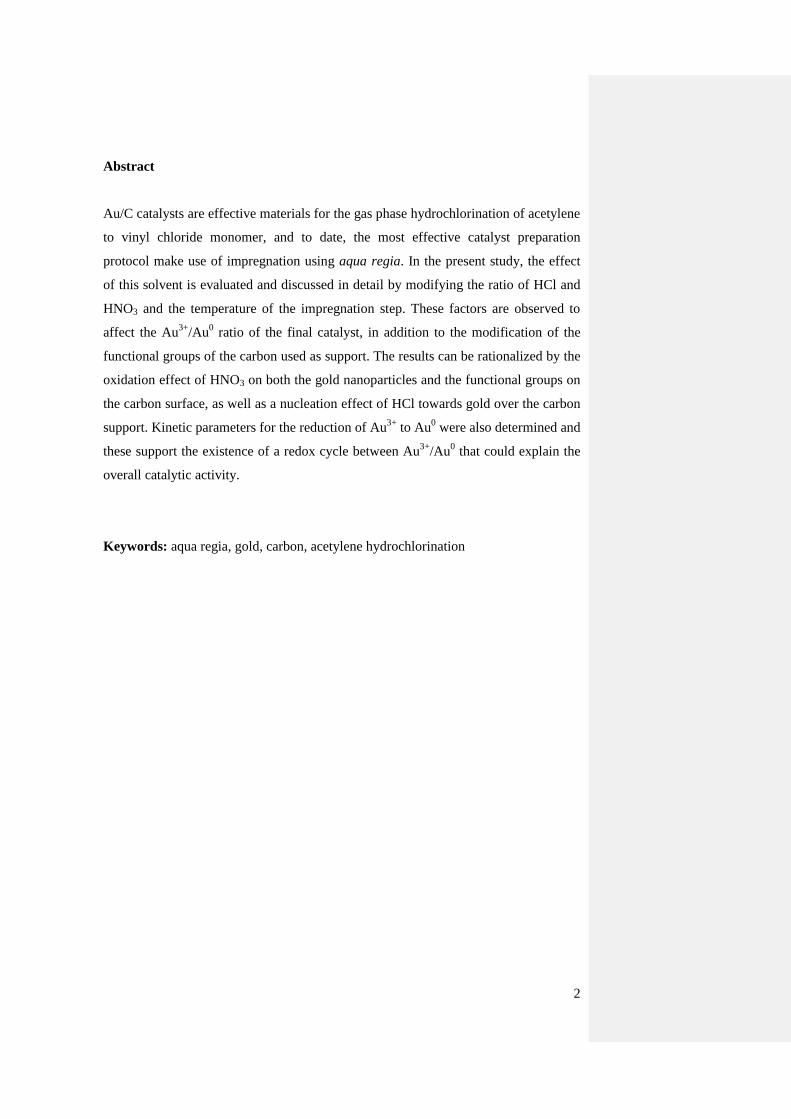
Abstract
Au/C catalysts are effective materials for the gas phase hydrochlorination of acetylene
to vinyl chloride monomer, and to date, the most effective catalyst preparation
protocol make use of impregnation using aqua regia. In the present study, the effect
of this solvent is evaluated and discussed in detail by modifying the ratio of HCl and
HNO3 and the temperature of the impregnation step. These factors are observed to
affect the Au3+
/Au0 ratio of the final catalyst, in addition to the modification of the
functional groups of the carbon used as support. The results can be rationalized by the
oxidation effect of HNO3 on both the gold nanoparticles and the functional groups on
the carbon surface, as well as a nucleation effect of HCl towards gold over the carbon
support. Kinetic parameters for the reduction of Au3+
to Au0 were also determined and
these support the existence of a redox cycle between Au3+
/Au0 that could explain the
overall catalytic activity.
Keywords: aqua regia, gold, carbon, acetylene hydrochlorination
3
1. Introduction
The manufacture of vinyl chloride monomer (VCM) is an essential chemical process
with an average VCM production around 30 million tons per year [1] and it is
primarily used as building block of poly-vinyl chloride The reaction is industrially
carried out either via an oxychlorination reaction using ethylene as a substrate [2, 3],
or via hydrochlorination of acetylene, by means of supported chloride catalysts,
mainly mercuric chloride supported on carbon [4-6]. Due to a renewed interest in coal
as derived feedstock the latter route has returned to being economically advantageous.
However, the industrial catalysts based on mercuric chloride for the hydroclorination
route have relatively short life time, due to the volatility of mercuric chloride, which
presents clear environmental concerns. In contrast, Au3+
was postulated, and
demonstrated, to be the most active catalyst for the hydrochlorination of acetylene [7,
8]. Previous studies have shown that the reaction occurs via the formation of a
C2H2/Au/HCl complex [9, 10] with an activation effect by HCl and a detrimental
effect by C2H2 on the catalyst performance during on stream studies. The catalysts are
also affected by a slow deactivation [11], and this was found to be due to the
reduction of Au3+
to Au0 during the reaction. On-stream studies showed that it is
possible to regenerate the catalyst by means of Cl2 and NO [12]. On the other hand, it
was possible to demonstrate that an off-line treatment that involves boiling the
catalyst in aqua regia was an effective regeneration method [13], and at present it
appears that aqua regia is also the best solvent for the preparation of this catalyst.
This prompted us to investigate the catalyst preparation process in detail, with the aim
of identifying the key factors enabling enhanced activity, and hence to determine what
is so particular in the HCl:HNO3 mixture used during the preparation process. The
chemistry and the effects of aqua regia on either metal nanoparticles or carbon, is an
area that has received virtually no attention to date, despite the vast use of metal based
nanoparticles deposited on carbon [14-17] as the role of this solvent has been limited
to a mere dissolving agent. On the contrary aqua regia is a complex mixture for
which the generation and formation of native NOCl, Cl2 and NOx is still not well
understood, and that could have serious implications in the preparation of catalytic
materials, as in the case that is investigated and reported here. In addition, the
nucleation process of Au3+
on carbon matrixes from chlorinated precursors such as
HAuCl4, is likely to be similar to that of widely used catalysts comprising Pd and Pt,

4
prepared from H2PdCl4 and H2PtCl4 respectively [18, 19], and consequently
implications could be expected for reactions other than hydrochlorination e.g. partial
oxidation of alcohols [20-22] and hydrocarbons [23-25]. In this way we anticipate that
this work may have a wider relevance to catalyst design for such reactions.
2. Experimental
2.1 Catalyst preparation
All the catalysts were prepared by a wet impregnation method. The gold precursor,
HAuCl4·xH2O (Alfa Aesar, 40 mg, assay 49%) was dissolved in aqua regia (3:1 HCl
(Fisher, 32%) : HNO3 (Fisher, 70%) by volume, 5.4 ml) and the solution added
dropwise with stirring to the activated carbon support (Norit ROX 0.8) (1.98 g) in
order to obtain a catalyst with a final metal loading of 1% wt. Stirring was continued
at ambient temperature until NOx production subsided, approximately 10 minutes. The
product was dried for 16 h at 110 °C and used as a catalyst. Variations to this protocol
were introduced by changing drying temperature, (110, 140 and 185 oC), and the ratio
of HCl and HNO3 which was varied from 1:10 to 10:1. Catalysts including acid pre-
treated carbons, were prepared in an identical manner than the impregnated samples
but without initially adding the HAuCl4 precursor.
2.2 Catalytic tests and characterization of the products
Catalysts were tested for acetylene hydrochlorination in a fixed-bed glass
microreactor. Acetylene (5 mL min-1
, 0.5 bar) and hydrogen chloride (6 mL min-1
, 1
bar) were fed though a mixing vessel and preheater (70 oC), and further mixed in a N2
flow (10 mL min-1
, 1 bar) via calibrated mass flow controllers to a heated glass
reactor containing catalyst (200 mg), with a total GHSV of 740 h−1
. A reaction
temperature of 180 o C was chosen, and blank tests using an empty reactor filled with
quartz wool did not reveal any catalytic activity, even at 250 o C with the reactants
under these flow conditions, SiC (2 x 2.5g) was used to extend the bed length, above
and below the catalyst itself, separated by quartz wool. The pressure of the reactants,
HCl, C2H2 and N2, was chosen both for safety reasons and to test the catalyst under

5
mild conditions. As the VCM product is a class A carcinogen, and HCl as a gas can be
corrosive, the time on-stream experimentation was fixed at 300 min (5h) as a
maximum time. This was due to the trapping and venting capability of both HCl and
VCM with the equipment in use and safety regulations in place at the laboratories
where the experiments were performed. On an exceptional basis, a single 12 h test
only was carried out in order to ascertain if the catalyst reached steady state
conditions. The gas phase products were analyzed on-line by GC using a Varian
450GC equipped with a flame ionisation detector (FID). Chromatographic separation
and identification of the products was carried out using a Porapak N packed column
(6 ft x 1/8” stainless steel).
2.2.1 Reactor model and nature of the products
To combine the common use terms in the field of laboratory practice (i.e. the use of
conversion in percentages) and the more appropriate description of the results in a
industrial/engineering context (i.e. the use of productivity), we present conversion
values in percentage in the manuscript but we replicate the data in full as
productivities in the supplementary data. 100 % C2H2 conversion gives a VCM
productivity of 80.7 mol kgcat-1
h-1
under the reaction conditions we are using, due to
the low values of GHSV and C2H2 concentration, we consider that we can
approximate the reactor used to a differential reactor model. It is also important to
note that the reactor feeding parameters, as well as the size of the catalytic bed, are
constrained by the trapping and venting capability of HCl and VCM.
2.3 Characterization of the catalysts
2.3.1 X-ray powder diffraction
X-ray powder diffraction spectra (XRPD) were acquired using a X’Pert PanAlytical
diffractometer operating at 40 kV and 40 mA selecting the Cu K radiation. Analysis
of the spectra was carried out using X’Pert HighScore Plus software. Particle size was
determined using the Scherrer equation [26] assuming spherical particles shapes and a
K factor of 0.89. The line broadening was determined using a Voigt profile function
6
[27] convoluting the Gaussian and Lorentzian profile part of the reflection peak and
the instrumental broadening for the Bragg-Brentano geometry used was estimated to
be 0.06o 2.
2.3.2 X-ray photoelectron spectroscopy
X-ray photoelectron spectroscopy (XPS) was performed with a Kratos Axis Ultra
DLD spectrometer using a monochromatised AlKα X-ray source (120 W) with an
analyzer pass energy of 160 eV for survey scans and 40 eV for detailed elemental
scans. Binding energies are referenced to the C(1s) binding energy of carbon, taken to
be 284.7 eV.
2.3.3 Scanning electron microscopy
Scanning electron microscopy (SEM) and energy dispersive X-ray (EDX) analyses
were performed using a Carl Zeiss EVO-40 microscope and Oxford instrument SiLi
detector respectively. Samples were mounted on aluminium stubs using adhesive
carbon discs. EDX data was averaged from multiple overscans and spot analysis is
considered representative of the sample. SEM was used to analyse the morphology of
the samples, while SEM-EDX to determine the chemical composition of the samples
2.3.4 Transmission electron microscopy
Samples were prepared for transmission electron microscopy (TEM) analysis by
dispersing the catalyst powders in high-purity ethanol and allowing a drop of the
suspension to dry on a carbon film supported on a 200-mesh Cu TEM grid. Bright-
field (BF) imaging and selected-area ring diffraction patterns were acquired using a
Philips CM12 operating at 200 keV with a W filament. Particle size histograms were
calculated from sets of 200 particles.
2.3.5 Temperature programmed reduction
Temperature programmed reduction (TPR) analysis was carried out on a Thermo
TPD/R/O 1100 Series instrument equipped with a thermal conductivity detector
(TCD). The sample (100 mg) was heated up to 800°C at a ramp rate of 5 °C min-1
,
under a flow of hydrogen (10% in Ar, 20 mL min-1
). For activation energy
determination, heating ramp rates of 10, 15 and 20°C min-1
were also used.

7
Calibration of the TPR plots for the Au3+
amount was carried out for the Au/C sample
prepared at 140 oC and using HCl as a solvent used as standard.
2.3.6 Titration of carbon functional groups
Acidity of carbon functional groups was carried out using a potentiometric method
with a pH-meter [28] in a manner complementary to the Boehm protocol [29] which
uses bases of different strength followed by back titration with HCl. Typically, the
sample to be analysed (100 mg) was suspended in deionised water (10 mL) with
stirring, and dilute HCl (0.02 M) or NaOH as appropriate, added step-wise (200 L)
and the pH measured after a stabilisation time (typically 1 minute) after each addition.
Quantification of the functional groups was carried out by plotting the pH against
volume of titrant added, and pKa values of the carbon functional groups were
identified.
3. Results and discussion
3.1 Effect of the impregnation drying temperature on the catalyst activity
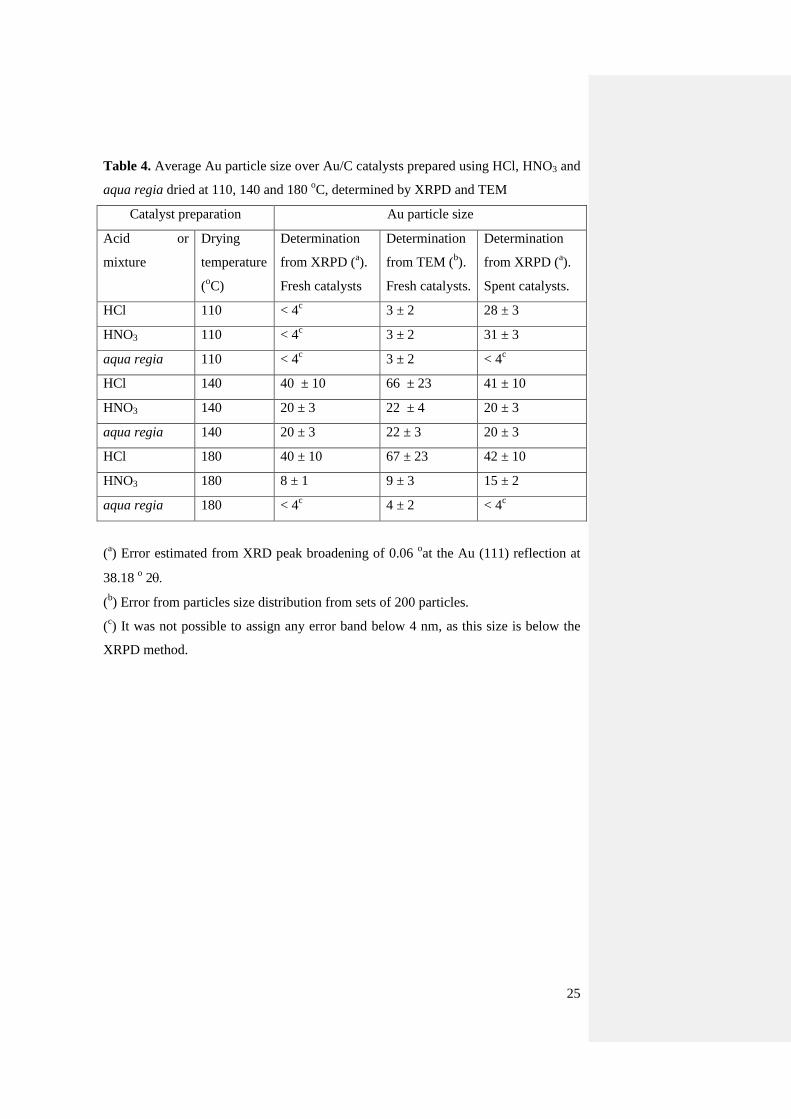
The activity of the Au/C catalyst prepared via impregnation using aqua regia and a
drying temperature of 110 oC is reported in Fig. 1. It is possible to observe that the
catalyst initially exhibit low conversion (ca. 15%) followed by an increase in activity
after about 3 h per time on stream, up to eventually reach ca. 50% conversion after 5
h. It should be highlighted that for all the tests carried out and reported in the current
study the selectivity to VCM was virtually 100% with traces amounts (< 0.1%) of 1,2-
dichlorethane and chlorinated oligomers only [9, 10, 12].
Previous studies on Au/C catalysts for hydrochlorination [10, 11] showed a
monotonic deactivation trend ascribed to the reduction of Au3+
to Au0 and not an
activity trend with enhanced activity per time on stream. On the other hand, for the
catalyst reported in the present study, XRPD patterns permit an estimate of a mean
particle below 4 nm, while in previous cases catalysts having an average particles size
> 5nm were used, and this could affect the observed trend. As differences in drying

8
temperature could also affect the different particle size and the interface
metal/support, two catalysts were prepared using a drying temperature of 140 and 180
oC (Fig. 1 and Fig. S1). The temperature of 180
oC was chosen because equals to the
reaction temperature. This could possibly provide indications if the conversion trend
could be affected by the drying temperature, if the catalysts were dried below 180 oC.
However, it is also possible that these discrepancies with previous studies are also due
to a sintering of the Au nanoparticles after reaction with the particular kind of carbon
used, although this effect was not observed when aqua regia was used as a solvent
(see paragraph 3.5). The catalyst dried at 185 oC has a similar trend to those dried at
110 oC, in contrast, the one dried at 140
oC is markedly different with an increase in
activity from ca. 10% at the beginning of the reaction up to 70% after 5 h of time on
stream. In order to assess if the catalyst reached steady state condition with a
maximum of activity after 5h, a 12h catalytic test was carried out (Fig. S2). It was
possible to observe that after 5h the steady state performance had been obtained.
3.2 Aqua regia as a solvent and contribution of HCl and HNO3 to the catalyst
activity
Investigation on the activity of aqua regia and studies on its activity have been so far
limited to dissolution and corrosion studies with limited applications in the area or
organic synthesis as chlorinating agent [30, 31]. In contrast, the use of solely HNO3
with carbon matrixes has been the subject of investigations as HNO3 can increase the
number of oxygenated groups at the carbon surface. While HCl, despite a limited
effect to carbon surfaces, can affect the nucleation process of metal nanoparticles,
especially gold, from the metal salt precursors [32]. It should be noted that, in case of
Au/C catalysts, once gold was deposited on the carbon surface, subsequent treatments
with aqua regia were not capable of dissolving the gold, but rather change its
oxidation state re-oxidizing it [13].
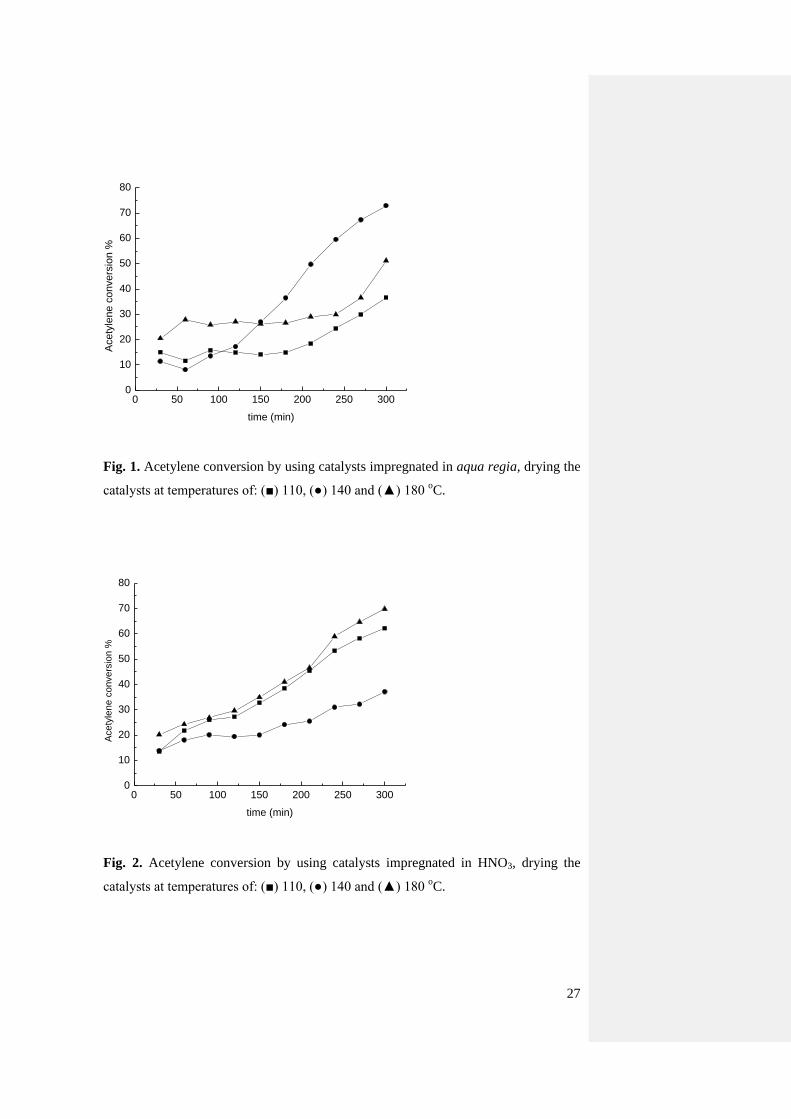
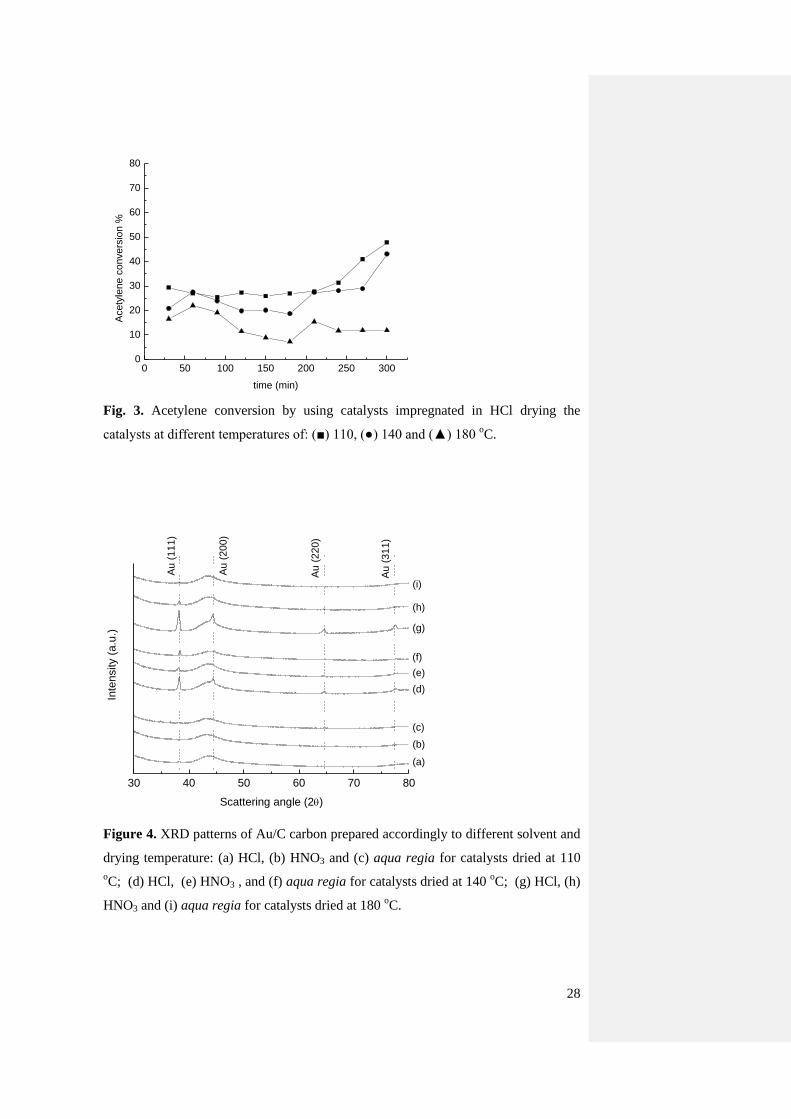
In view of this, and to investigate the effects of these two acids, catalysts obtained by
impregnating the Au precursor from solutions containing only concentrated nitric acid
(Fig. 2 and Fig. S3) and hydrochloric acid (Fig. 3 and Fig. S4) were used. Also in this

9
case, the effect of different drying temperatures was evaluated using 110, 140 and 180
oC. Considering the whole set of catalysts, the most active was the material prepared
in aqua regia dried at 140 oC, with an activity of >70% to VCM after 5 h time on
stream. However, for drying temperatures of 110 and 185 oC the most active catalyst
was the one obtained using HNO3 only as a solvent, with conversion values in the
range of 60 and 70%. In contrast, the materials prepared using HCl only, always
displayed lower activity, in the range of 20-30%. This is an important experimental
result because it can shed light on the role that HNO3 and HCl play on the final
catalyst activity and stability of the catalyst. The enhanced effect of HNO3 could be
ascribed to enriched Au3+
content or modifications to the carbon surface structure [33,
34]. On the other hand it should be considered that Cl- anions are well known
nucleation centres for Au clusters and promoting sintering [32, 35]. This is well
evident from the XRPD patterns of catalysts dried at 140 oC (Fig. 4) using HCl, HNO3
and aqua regia as solvent. The sample obtained using HCl contains large Au particles,
estimated in the range from 30 to 50 nm, while in those prepared using aqua regia or
HNO3, the particles size was estimated in the range of 20 nm. In addition, the XRPD
patterns highlight that the drying temperature has an effect on the nucleation process
of Au particles. In fact, using a temperature of 110 oC no discernible Au reflection is
detected, indicating particles below 4 nm or a material with a large amount of Au3+
centres. Finally, the Au reflection intensity in case of HCl progressively increase (and
so Au reduction) as long as the drying temperature is increased.
3.3 Modification induced to the catalyst structure by HCl, HNO3 and aqua regia
at different drying temperatures
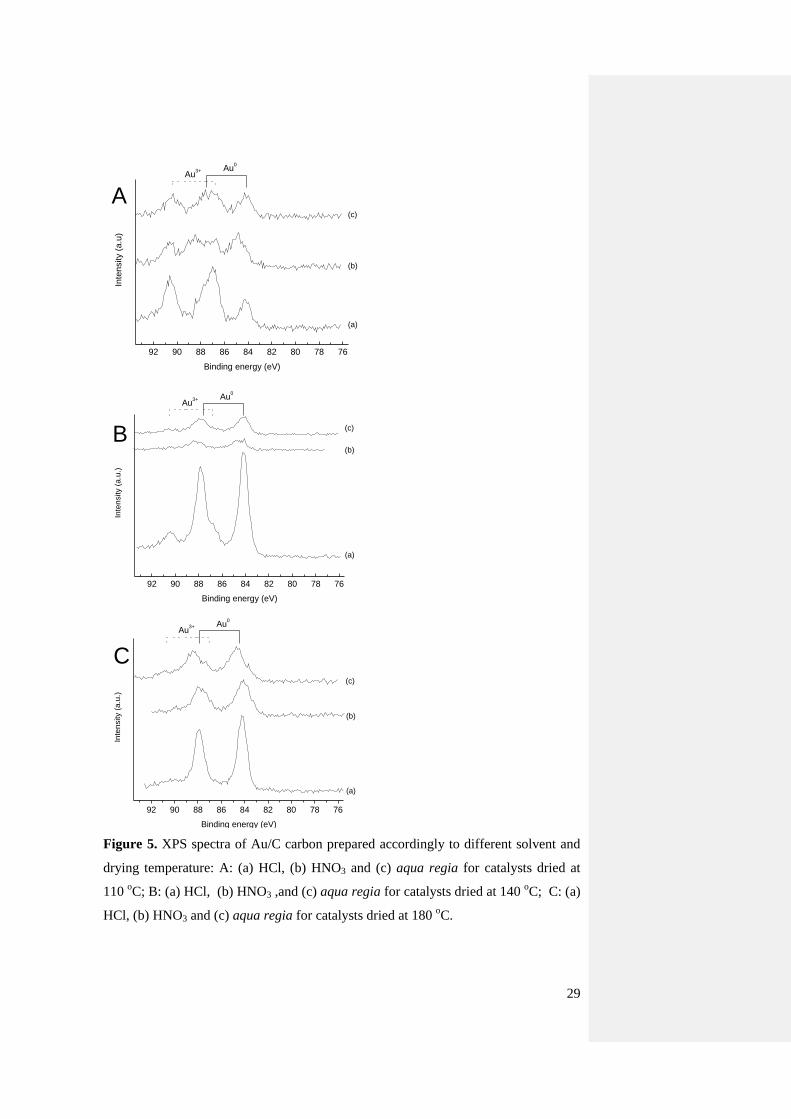
Since previous literature studies ascribed the activity of the catalyst to the presence of
Au3+
species postulating them as active sites [9-11, 13] XPS was systematically
carried out for the samples dried at the three different temperatures in presence of
HCl, HNO3 and aqua regia (Fig. 5, Table 1 and Table 2) in order to quantify surface
Au3+
. It is immediately evident that the material prepared at 110 oC presents a high
amount of Au3+
, which was estimated between 43 and 67% (Table 1). As the drying
temperature is increased, the amount of Au0 increased, and this can relate with the
reduction property of carbon towards Au3+
[11, 36]. However, considering both the
XPS signal intensity (Fig. 5) and the intensity of the Au reflections detected by XRPD
10
(Fig. 4), a counter-intuitive obervation is obtained. From the XPS data, the samples
prepared using HCl have invariably a higher intensity. Because XPS is a surface
technique the signal is a function of the surface to bulk atoms ratio, therefore this
trend would be explained by a decrease in the Au particle size. However, this is
exactly the opposite trend obtained by XRPD, which is a bulk technique, where larger
particles would lead to a higher signal. On the other hand there is another important
aspect that needs to be considered, i.e. HNO3 is known to induce textural changes in
carbon [18, 34, 37] by changing the pore size, as well as functional groups on the
surface, while HCl basically does not. In view of this, the different intensity of Au
signal from XPS would arise by the presence of Au at different depths in the carbon
support. It is extremely interesting to note (Table 3) that a quantification of the atomic
species present on the catalysts surface shows a systematic, decreasing trend, of the
Au/C surface ratio with the sequence HCl > HNO3 > aqua regia, regardless the drying
temperature used. And this trend is exactly the one that would be expected for the
oxidizing force of the acids used, and therefore capable to alter the support properties.
In view of this, because all the catalysts were prepared via impregnation at the same
gold loading, to match the trend observed using XPS and XRPD, the decreasing in
Au/C surface ratio could be explained assuming that when HNO3 is present, gold
particles are present also inside the carbon pores and not just at the surface of it. To
test this hypothesis all the samples were characterized by means of SEM-EDX (Table
3). Unlike XPS, which is a pure surface technique, (and that for our purposes it can be
considered capable of a penetration depth of ca. two monolayers), SEM-EDX is a
technique capable to penetrate the samples for few microns, and therefore capable to
detect sub-surface particles. SEM-EDX proved to be more sensitive to the local
composition of the samples, which were found to have a highly non homogenous
composition distribution (see supplementary data, Figs. S5 to S14). In fact, while the
XPS samples were prepared using ground samples, for the SEM-EDX analysis
extrudates were directly analyzed in order to ensure flat surfaces to analyze. Also in
this case, a decreasing surface gold content was detected, in addition it was possible to
systematically highlight that, as long as HNO3 was present a strong oxidation of the
carbon support was detected, and thus corroborating the results obtained via XRPD
and XPS. It should also be noted that SEM-EDX, unlike XPS detected the presence of
additional elements (Al and S) (Table 3) This is observed for the following reasons:
11
the analysed area in EDX is 1 x 1 mm, while in the XPS is 0.3x0.4 mm, therefore
cable of intrinsically detect elements in low amount with a lower detection limit. In
addition, SEM-EDX is substantially a bulk technique when compared with XPS,
which is purely surface sensitive, and the EDX penetration depth through the carbon
extrudes we analyzed is almost 100%, thus sampling almost the entirely of the bulk in
the analysed area, under the cross section of the SEM beam. Therefore atomic
percentages such as 0.03% Al for example is at/beyond the limits of the XPS
detection and so with such percentages any at the surface would be undetectable.
TEM was also carried out (Table 4, Figs. S15 - S23), showing that the samples dried
at 110 oC, had a particle size in the range of 3 nm, while for the samples dried at 140
oC, the particle size order per solvent was: HCl >HNO3 ≈, aqua regia ranging from
ca. 66 to 20 nm, and finally for the samples dried at 180 oC the particle size order per
solvent was HCl > HNO3 >aqua regia, ranging from ca. 67 to 3 nm These values are
broadly similar to those obtained by XRPD, due to lack of homogeneity of the
distribution of the gold nanoparticles both on the surface and within the pores of the
carbon support. In fact, it was possible to identify some catalyst regions are rich in
metal nanoparticles, while in others the particles are nearly absent (see supplementary
data, Fig. S24). This inhomogeneity could be due to intrinsic properties of the wetness
impregnation technique used in this case. Similar phenomena have been reported for
impregnated solutions of platinum salts on carbon [38] after thermal treatment for
impregnation. This is also reflected in the wide particle size distribution obtained via
TEM (Table 4, and Figs S15 to S23). In fact the particles size values obtained via
XRPD are invariably lower than those obtained using TEM, because of this wide
distribution that further contribute to the line broadening of the XRD peaks [39,40].
3.4 Effect of HCl:HNO3 ratio and TPR analysis of Au/C catalysts
The results reported so far, shed light also in a further important aspect of this
reaction; at present all the studies on the reaction mechanism reported for this reaction
postulated Au3+
associated with Au nanoparticles as active sites, and a strong
dependency of the activity on the [Au3+
] [7-13]. On the other hand it is quite clear,
from the data reported above, that the catalysts with very high Au3+
content (> 50%,
for the materials dried at 110 oC), are not the most active. In addition, while it is

12
confirmed the effect of HNO3 on the final catalyst by enhancing its activity, no
obvious difference is present for the samples treated with HNO3 when different drying
temperatures are used. It should be stressed that all the current models explaining the
activity of the Au/C catalysts, proposed the existence of Au3+
at the surface of Au
nanoparticles, while the data collected show that it is possible that the activity also
relates with the presence of active sites at the interface Au/C, and therefore below the
detection limit of the characterization methods currently available.
It should also be considered that the final activity could be due to changes in Au3+
concentration, (as well as particles sizes) and it is also known that the activity can be a
complex function of the feed composition and reaction conditions. In fact, it was
previously observed [10] that an excess of HCl in the feed can promote the reaction,
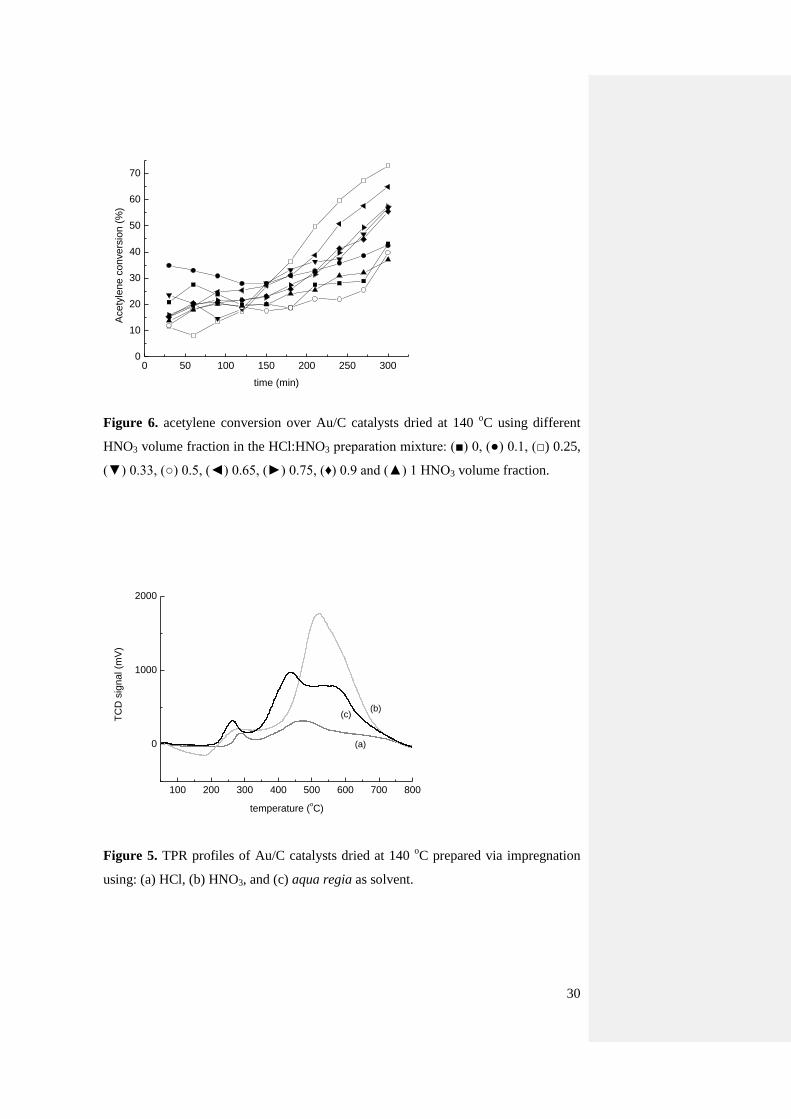
while an excess of C2H2 has a detrimental effect. In view of this, and to systematically
evaluate the effect of HNO3, a set of nine catalysts were prepared with different
HCl:HNO3 ratio with a HNO3 volume fraction spanning from 0 to 1 (Fig. 6 and Fig.
S24) and these were evaluated for acetylene hydrochlorination. It is observed that the
most active catalyst (> 70% conversion) is that prepared using the 0.25 HNO3 volume
fraction, i.e. the aqua regia composition, but also in this case no apparent trend is
present when the HNO3 composition was changed from this optimal value. This led us
to expand our investigation by focusing on changes that the acids can induce on the
carbon support rather than Au nanoparticles only, and the effect that these acids can
have on the interaction metal/support and in turn to the Au/C interface.
Activated carbon is not a matrix constituted by carbon only as element, but it is has a
complex structure characterized by the presence of oxygen in form of carboxylic,
ester, ether and lactone groups [18, 41] as well as heteroatoms e.g. phosphorus
nitrogen or sulphur, present as phosphates, amine and thiols [42]. In order to identify
the variation of the materials prepared using aqua regia, and to ascertain the
importance of Au3+
centres in the catalyst performance, and the effects that these
acids can have on the carbon matrix, the catalysts described so far were evaluated by
means of TPR focusing on the samples prepared at 140 oC, which appears to be the
temperature capable to lead to the most active materials.
A representative example of TPR profiles of catalysts prepared in HCl, HNO3 and
aqua regia dried at 140 °C, as well as carbon support, is shown in Fig. 7. The

13
analysis of this thermogram led to assign the reduction band between 230 and 300 oC
to Au3+
[43], while those from 450 to 800 oC are the consequence of decarboxylation
reactions of oxygenated carbon functional groups at the carbon surface, which release
CO and CO2. Particularly, decarboxylation reactions in the range of 400-650 oC are
ascribed to carboxylic acids and carboxylic anhydrides [44], while above 650 oC these
are likely due to lactones and phenols [45].
It is interesting to note (Fig. 7) how the areas of the reduction peaks observed for the
catalysts in the range 350-650 oC, i.e. for signal originating from carbon oxygenated
groups, follow the trend HNO3 > aqua regia > HCl, and this would be consistent with
the oxidizing effect of these acids. In fact as HNO3 has the greater oxidizing effect it
is also expected to increase the amount of oxygen containing functional groups over
the carbon surface [18, 44] and the different features observed for different acids
could be associated to the generation of new functional groups, either on the carbon
surface or at the carbon/gold interface. This is an aspect that at present has been
ascertained for Pt/C based catalysts, where investigations on the chemistry of the
impregnation of hexachloroplatinic acid on carbon as support, leads to conclude the
presence of Pt in two different oxidation states as the consequence of two different
ligand carbon sites [38]. One type consisting of oxygen-containing functional groups
on the basal plane edges, and the other consisting of -complex structures in the
carbon basal plane [46,47]. It is likely that similar phenomena could occur during gold
impregnation as well. In addition, studies on the effect of acids on carbon, showed
that while HNO3 has an oxidative effect, in the case of HCl, Cl- can bind to sp
2 carbon
sites on the carbon matrix [48]. In our case, this could act as an inhibitor for
nucleation centres for active metals on basal planes, and could explain the lack of
activity of materials prepared containing HCl only, and thus indirectly suggesting the
binding sites of gold to carbon.
Therefore, in order to identify features that could be due to the effect of the acid on
the support, or by the simultaneous presence of Au clusters, the carbon support was
treated in an identical manner to that of the catalyst preparation but without adding of
HAuCl4. When gold was not present (Fig. 8) the thermograms showed, as expected,
features between 350 and 650 oC only, and these should be considered as originated
14
just from the support. However, the thermal profiles are different when compared to
the materials containing gold, because in its absence a lower number of reduction
(decarboxylation) peaks are detected. This is an important aspect, because it would
suggest the presence of an interface Au/C, mediated by oxidized carbon groups, that
affects the carbon surface.
In view of this, TPR analysis was carried out on the samples prepared using all the
HCl:HNO3 mixtures, and the signal integration of the Au3+
species versus HNO3
volume fraction is reported in Fig. 9. A volcano plot with maximum centred between
0.5 and 0.6 HNO3 volume fraction is obtained. However, despite being these the
catalysts with the highest amount of Au3+
, they are not the most active, but the
material prepared aqua regia with a HNO3 fraction of 0.25. This result, would suggest
that the most active catalyst is not necessarily the material with the highest Au3+
content, but possibly the material that has Au3+
at the appropriate catalyst sites. It
should also be noted that the Au3+
(%) amounts obtained by TPR are higher (of ca.
20% relative amount) than those obtained using XPS, thus confirming the presence of
Au atoms/clusters below the carbon surface because of modifications induced by
HNO3. The data collected so far, would suggest the existence of sites at the interface
Au/C and not just at the surface of Au nanoparticles.
A further, important aspect, to consider in this analysis, is the reduction temperature
of the various catalysts under TPR conditions. From Fig. 10 it appears immediately
evident that the aqua regia catalyst, is the one with the lowest Au reduction
temperature (258 oC), thus showing that not only the presence of Au
3+ is important,
but also the reducibility of this species is determining the final activity.
In view of this, we were interested to determine the effect that an acid treatment on
the carbon support, before gold deposition could have had on the final catalytic
performance. Acid pre-treatment is not unprecedented, and so far it found important
applications in the direct synthesis of H2O2 over gold catalysts [49, 50] or CO
oxidation over Pd -based catalysts [18]. In our case, when the support was pre-treated
with HCl, HNO3 or aqua regia, the final catalysts were invariably less active than the
catalysts obtained when the gold precursor was present simultaneously with the acid
during the impregnation step. This shows that although different acids do have a

15
significant effect on the carbon surface, in terms of the functional groups present, it
seems more important how the gold interacts with these functional groups at the
surface of the carbon support at the time of the deposition. This is an area that so far
received limited attention and this is most likely due to the difficulties of investigating
the deposition process of metals on carbon supports, and at present virtually no
studies are available concerning Au deposition. It is generally assumed that functional
groups on the carbon surface can act as anchoring sites for metal complexes. As no
studies are present for HAuCl4, it could worth considering the case of H2PdCl4 as
Pd(II) is isoelectronic with Au(III) and the [PdCl4]2-
anion is square planar as is
[AuCl4]-. In the case of H2PdCl4 the binding process on carbon is considered to
proceed via interaction with olefinic -fragments over the carbon surface by exchange
of Cl ligands [51]. On the other hand, the [PdCl4]2-
anion can bond via ion exchange
over protonated oxygen containing groups [18]. It is considered likely the same
process takes place in case of HAuCl4.
3.5 Base titration of carbon and Au/C catalysts and characterization on the
catalysts after reaction
To further test this assumption, i.e. the dominant role of oxygenated groups at the
interface of Au/C, titrations of the acid pre-treated carbons and Au/C catalysts
impregnated using HCl, HNO3 and aqua regia, were carried out using NaOH as the
titrating agent.
For the pre-treated carbons, it is possible to observe a correlation between the amount
of HNO3 used in the preparation and the number of carboxylic/lactones groups
generated by the treatment. In fact while HCl has an almost negligible effect, aqua
regia increases the number of oxygenated functionalities observed on the carbon
surface, and HNO3 can further increase this with a ratio of ca. 2.5 times (Fig. 11).
Thus showing that HNO3 can modify the carbon support and in turn the catalytic
activity, and we consider this effect is most likely caused by modifying the anchoring
of Au3+
precursor to the support. The titrations carried out on the Au/C catalysts from
acid pre-treated carbons are very similar to those on the final catalysts within
experimental error, thus supporting the hypothesis that if changes between the carbon

16
and the catalyst has to be present at the Au/C interface and the exposed carbon surface
remains basically unmodified in terms of amount and kind of functional groups.
As the carbon surface can affect the Au carbon interface, and in turn the possible
particles agglomeration under reaction conditions, all the catalyst prepared using HCl,
HNO3 and aqua regia prepared at the drying temperatures of 110, 140 and 180 oC
were analysed after reaction via XRPD in order to estimate if any sintering was
present (table 4 and Fig. S25) Sintering was observed for the catalyst prepared using
HCl and HNO3 as a solvent, but not for the catalysts prepared using aqua regia,
independently from the initial drying temperature of the catalyst. A similar effect for a
catalyst prepared in aqua regia was observed for Au/C catalyst as determined by
TEM [10] although using a different kind of carbon.
While the sintering effect could explain the differences in activity trend per time on-
stream for the catalysts prepared using HCl and HNO3, as this does not happen for the
catalysts using aqua regia, the catalyst behaviour could be affected by modification of
species at the Au/C interface. Another factor could be the reduction of Au3+
centres
during the reaction, as ascertained by previous studies [11-13].
3.6 Kissinger equation and compensation plot
Additional information can be extracted from TPR analysis, by varying the ramp rate
of the heating [52]. In this case, assuming an Arrhenius dependence of the rate
constant of the reduction reaction, and knowing the reaction order model, it is possible
to determine the activation energy of a reduction reaction using the Kissinger equation
[53, 54].
ln (/T2
max) = ln (AR/Ea) + ln [n(1-max)n-1
] – Ea/RTmax (eq. 1)
Where Ea is the activation energy, A the pre-exponential factor, the heating rate, n is
the order of the reaction, is the conversion degree, T is the temperature and R is the
gas constant; the index max indicates the maximum of the reaction rate, with Tmax the
temperature at which the maximum of the Au3+
reduction step occurs. The equation

17
originally made use of differential thermal gravimetry, thermal analysis, or
differential scanning calorimetry data and it has found application in the analysis of
crystallization processes [55] or glass transition temperatures [56], because it has the
advantage to rely on non-isothermal data. Reduction of Au3+
in lignite carbon
matrixes, showed that the Au3+
to Au0 reduction occur via a first order kinetic [36].
Assuming in our case, the same kinetics, the equation 1 can be rewritten as:
ln (/T2
max) = ln (AR/Ea) – Ea/RTmax (eq. 2)
It is then possible to determine the activation energy of the reduction process and the
pre-exponential factor, by plotting ln(/T2max) versus 1/T from the slope and the
intercept of the resulting straight line respectively.
TPR profiles were collected using temperature ramps of 5, 10 and 15 oC for the
catalysts prepared in HCl, aqua regia and HNO3 , dried at 110, 140 and 185°C (see
supplementary data, Figs S26 to S34). The values obtained for the activation energies
are shown in table 5. The activation energies, were in a range from 40 kJ mol-1
for the
catalyst prepared using aqua regia to 70 kJ mol-1
for the catalyst obtained using HCl
(both dried at 185 oC). Interestingly, the most active catalyst for the hydrochlorination
reaction of acetylene, i.e. the material obtained using aqua regia impregnated at 140
oC with an intermediate activation energy for the Au
3+ reduction of ca. 50 kJ mol
-1.
Considering the effect of the reducibility of Au3+
so far observed in the activity for the
hydrochlorination reaction, i.e. the more reducible a catalyst the more active it is, the
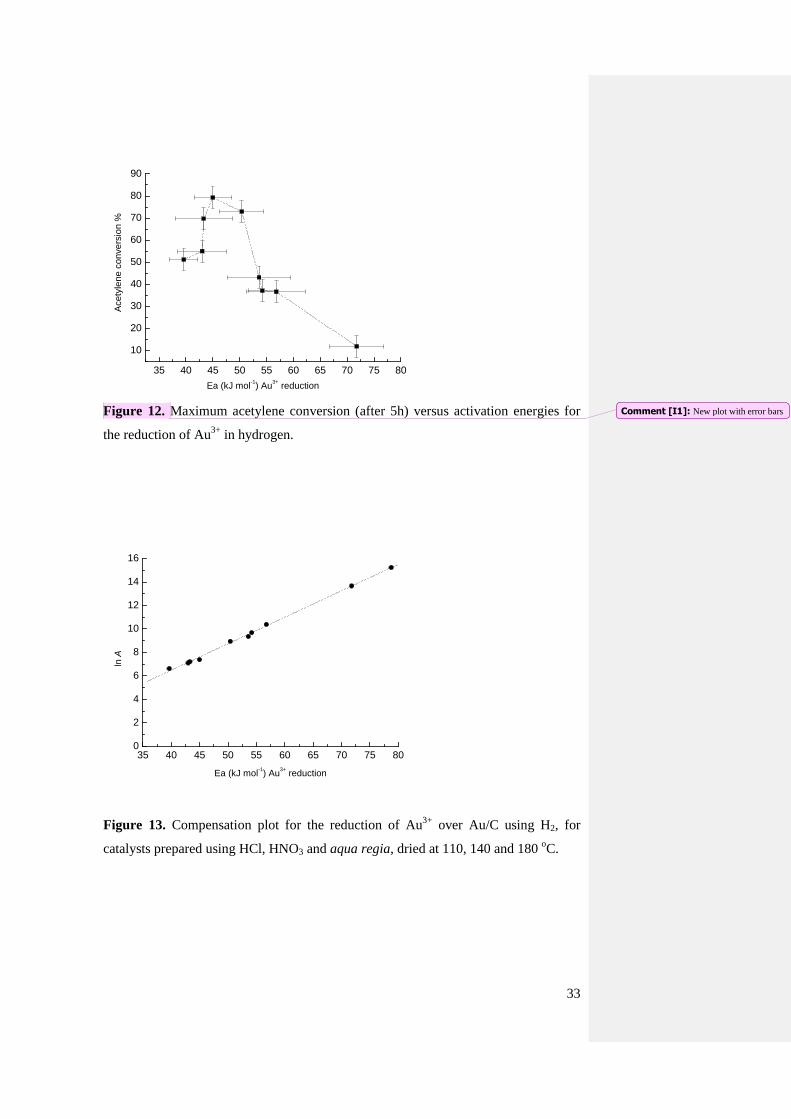
expected trend would have been that: the higher was the Ea for the reduction of Au3+
and the lower to be the conversion for the hydrochlorination reaction. However, when
the conversion of the hydrochlorination reaction was plotted versus the Ea for the
Au3+
reduction, a decrease in activity of the catalysts at lower activation energies is
detected (Fig. 12 and Fig. S35) with a maximum at ca. 50 kJ/mol. This suggests that
there may be a threshold, below which the gold is too reducible to be active, i.e. it will
completely reduce, (and possibly sinter), rather than be involved in a redox cycle,
which is one of the postulated mechanism of action for this material [9-11]. On the
other hand we should also consider that the experimental error associated with the

18
activation energy is relatively high, ranging from ca. 7 to 12%, therefore this
correlation does not pretend to be a strict mathematical model. Though, it can be an
alternative way to evaluate these catalysts, as the role of the reducibility of the metal
centre is a factor so far neglected in many reactions involving gold. By comparison,
literature values for the reduction (i.e. nucleation and growth) of Au3+
over supports
like: SiO2, MgO and TiO2 span from 12 to 6 kJ mol-1
[55-57]. To date, none of the Au
catalysts prepared using supports other than carbon [7-12] has been found to be active
for the hydrochlorination reaction of acetylene, and this confirms that carbon can
stabilize Au3+
species. On the other hand, it is important to underline that we are
attempting to extract information from a reduction process by means of using H2 as a
probe when the hydrochlorination reaction is likely to occur via formation of a
C2H2/Au/HCl complex where a simultaneous approach of the two substrates take
place over Au3+
centres [9, 10], and hence this can induce limitations in our model.
Nevertheless, it is still possible to correlate the lnA to the Ea of the reduction process
in a compensation plot (Fig. 13). Since a straight line is obtained this indicates an
Arrhenius dependence of the rate of the Au3+
reduction on temperature, and that there
is a common factor linking the number of collisions with the activation energy of the
catalyst and this factor is likely to be the amount of Au3+
centres.
4. Conclusions
Aqua regia was found to prepare the most efficient catalysts for the hydrochorination
of acetylene by impregnation of HAuCl4 on carbon. The effect of the aqua regia
constituents, HCl and HNO3, was also evaluated, and despite these acids being able to
affect the carbon support prior deposition, the enhancement effect observed with aqua
regia occurs only in case of simultaneous presence of Au during the impregnation
step of the catalyst preparation. This is considered to be due to a combination of the
oxidising effect of HNO3 on the carbon support and gold, as well as a nucleation
effect of HCl to gold particles over the carbon surface and the two acids are then
capable to act synergistically. Interestingly, it was also noted that when aqua regia
was used as a solvent no detectable sintering was observed after reaction.

19
It has also been shown that TPR is a useful characterisation technique for Au3+
species in Au/C catalysts, since it is able to provide information on the Au species and
the carbon support as well as to the determination of kinetic parameters for the
reduction of Au3+
. Many factors have been found to contribute to the final activity of
these catalysts, like the particles size, modification of the carbon support functional
group, as well as the amount of Au3+
, with effects difficult to predict a priori. On the
other hand this study showed that the efficiency of the catalyst could not only depend
on the amount of Au3+
as previously postulated [9-11], but it could also be due to the
easiness of reducibility of these oxidised gold species. In turn, this is likely to be
related with the location of Au3+
not just at the surface of the catalyst, but also that the
interface Au/C, and this is an important aspect so far neglected for this class of
catalyst for this kind of reaction.
Acknowledgements The authors thank Johnson Matthey Plc and World Gold Council
for financial support.

20
References
[1] K. Weissermel, H.-J. Arpe, Industrial Organic Chemistry (4th
edition), Wiley-
VCH, Weinheim, 2003, p 217.
[2] J.G. Speight, Chemical and Process Design Handbook, McGraw-Hill, New York,
2002, p 2.542.
[3] I.M. Clegg, R. Hardman, US Patent 5763710, 1998.
[4] K. Shinoda, Chem. Lett. 4 (1975) 219-220.
[5] S. Matar, L.F. Hatch, Chemistry of chemical processes (2nd
edition), Butterworth-
Heinemann, Woburn, Massachusetts, 2001, p 202.
[6] United States Environmental Protection Agency, Entry file EPA/600/X-84/178,
Washington D.C., 1988.
[7] G.J. Hutchings, J. Catal. 96 (1985) 292-295.
[8] B. Nkosi, N.J. Coville, G.J. Hutchings, J. Chem. Soc., Chem. Comm. (1988) 71-
72.
[9] G.J. Hutchings, Gold. Bull. 29 (1996) 123-130.
[10] M. Conte, A. F. Carley, C. Heirene, D.J. Willock, P. Johnston, A,A. Herzing,
C.J. Kiely, G.J. Hutchings, J. Catal. 250 (2007) 231-239.
[11] B. Nkosi, N.J. Coville, G.J. Hutchings, M.D. Adams, J. Friedl, F.E. Wagner, J.
Catal. 128 (1991) 366-377.
[12] B. Nkosi, M.D. Adams, N.J. Coville, G.J. Hutchings, J. Catal. 128 (1991) 378-
386.
[13] M. Conte, A.F. Carley, G.J. Hutchings, Catal. Lett. 124 (2008) 165-167.
[14] A.S.K. Hashmi, G.J. Hutchings, Angew. Chem., Int. Ed. 45 (2006) 7896-7936.
[15] A. Arcadi, Chem. Rev. 108 (2008) 3266-3325.
[16] G.J. Hutchings, Chem. Commun. (2008) 1148-1164.
[17] A. Corma, H. Garcia, Chem. Soc. Rev. 37 (2008) 2096-2126.
[18] M. Gurrath, T. Kuretzky, H.P. Boehm, L.B. Okhlopkova, A.S. Lisitsyn, V.A.
Likholobov, Carbon 38 (2000) 1241-1255.
[19] M.A. Fraga, M.J. Mendes, E. Jordão, J. Mol. Catal A: Chem. 179 (2002) 243-
251.
[20] A. Corma, A. Leyva-Pérez, M. J. Sabater, Chem. Rev. 111 (2011) 1657-1712.
[21] A. Villa, G.M. Veith, L. Prati, Angew. Chem., Int. Ed. 49 (2010) 4499-4502.
[22] T. Mallat, A. Baiker, Chem. Rev. 104 (2004) 3037-3058.

21
[23] M.D. Hughes, Y.-J. Xu, P. Jenkins, P. McMorn, P. Landon, D.I. Enache, A.F.
Carley, G.A. Attard, G.J. Hutchings, F. King, E.H. Stitt, P. Johnston, K. Griffin, C.J.
Kiely, Nature 437 (2005) 1132-1135.
[24] T.A. Nijhuis, T. Q. Gardner, B. M. Weckhuysen, J. Catal. 236 (2005) 153-163.
[25] A. Wittstock, V. Zielasek, J. Biener, C. M. Friend, M. Bäumer, Science 327
(2010) 319-322.
[26] B.D. Cullity, S.R. Stock, Elements of X-Ray Diffraction, (3rd
edition), Prentice-
Hall Inc, Upper Saddle River, 2001. p161
[27] J.I. Langford, J. Appl. Cryst. 11 (1978) 10-14.
[28] A. Contescu, C. Contescu, K. Putyera and J.A. Schwarz, Carbon , 35 (1997) 83-
94.
[29] H.P. Boehm, E. Diehl, W. Heck, R. Sappok, Angew. Chemie 76 (1964) 742-751.
[30] R.G. Raptis, J.P. Fackler Jr., Inorg. Chem. 29 (1990) 5003-5006.
[31] M. Calleja, K. Johnson, W.J. Belcher, J.W. Steed, Inorg. Chem. 40 (2001) 4978-
4985.
[32] H.-S. Oh, J.H. Yang, C.K. Costello, Y.M. Wang, S.R. Bare, H.H. Kung, M.C.
Kung, J. Catal. 210 (2002) 375-386.
[33] E.G. Rodrigues, M.F.R. Pereira, X. Chen, J.J. Delgado, J.J.M. Órfão, J. Catal.
281 (2011) 119-127.
[34] H. Tamon, M. Okazaki, Carbon 34 (1996) 741-746.
[35] B.S. Uphade, M. Okumura, S. Tsubota, M. Haurta, Appl. Catal. A: Gen. 190,
(2000) 43-50.
[36] J.-P. Gatellier, J.-R. Disnar, Org. Geochem. 16 (1990) 631-640.
[37] N. Zhang, L.-Y. Wang, H. Liu, Q.-K. Cai, Surf. Interface Anal. 40 (2008) 1190-
1194.
[38] M. Kang, Y.-S. Bae, C.-H. Lee, Carbon, 43 (2005) 1512-1516.
[39] J. Gubicza, J. Szépvölgyi, I. Mohai, L. Zsoldos, T. Ungár, Mat. Sci. Eng. A, 280
(2000) 263-269.
[40] Y.Dieckmann, H.Cölfen, H. Hofmann, A. Petri-Fink, Anal. Chem. 81 (2009)
3889-3895.
[41] C. Moreno-Castilla, M.A. Ferro-Garcia, J.P. Joly, I. Bautista-Toledo, F.
Carrasco-Marin, J. Rivera-Utrilla, Langmuir 11 (1996) 4386-4392.
[42] J.K. Brennan, T.J. Bandosz, K.T. Thomson, K.E. Gubbins, Colloids and Surfaces
A: Physicochem. Eng. Aspects 187-188 (2001) 539-568.

22
[43] C. Baatz, N. Decker, U. Prüße Journal of Catalysis 258 (2008) 165-169.
[44] S.R. de Miguel, O.A. Scelza, M.C. Román-Martínez, C. Salinas-Martínez de
Lecea, D. Cazorla-Amorós, A. Linares-Solano, Appl. Catal. A: Gen. 170 (1998) 93-
103
[45] J.L. Figueiredo, M.F.R. Pereira, M.M.A. Freitas, J.J.M. Órfão, Carbon 37 (1999)
1379-1389.
[46] F. Coloma, A. Sepulveda-Escribano, J.L.G. Fierro, F. Rodriguez-Reinoso,
Langmuir 10 (1994) 750-755.
[47] D.E. van Dam and H. van Bekkum, J. Catal. 131 (1991) 335-349.
[48] E. Papirer, R. Lacroix, J.-B. Donnet, G. Nansé, P. Fioux, Carbon 33 (1995) 63-
72.
[49] E.N. Ntainjua, M. Piccinini, S.J. Freakley, J.C. Pritchard, J.K. Edwards, A.F.
Carley, G.J. Hutchings, Green Chem. 14 (2012) 170-181.
[50] J.K. Edwards, B. Solsona, E.N. Ntainjua, A.F. Carley, A.A.Herzing, C.J. Kiely,
G.J. Hutchings, Science 323 (2009) 1037-1041.
[51] P.A. Simonov, A.V. Romanenko, I.P Prosvirin, E.M. Moroz, A.I. Boronin, A.L.
Chuvilin, V.A. Likholobov, Carbon 35 (1997) 73-82.
[52] G. O. Piloyan, I. D. Ryabchikov, O. S. Novikova, Nature 212 (1966) 1229.
[53] P. Budrugeac, E. Segal, J. Therm. Anal. Cal. 88 (2007) 703-707.
[54] H. E. Kissinger, Anal. Chem. 29 (1957) 1702-1706.
[55] L. Heireche, M. Belhadji, Chalcogenide Lett. 4 (2007) 23-33.
[56] N. Mehta, A. Kumar, J. Optoelectron. Adv. M. 7 (2005) 1473-1478.
Ea for nucleation energies
[57] K. Hojrup-Hansen, S. Ferrero, C.R. Henry, Appl. Surf. Sci. 226 (2004) 167-172.
[58] S.C. Parker, A.W. Grant, V.A. Bondzie, C.T. Campbell, Surf. Sci. 441 (1999)
10-20.

23
Tables, figures and captions
Table 1. Surface relative amount and binding energies of Au3+
and Au0 over Au/C
catalyst prepared using HCl, HNO3 and aqua regia dried at 110, 140 and 180 oC,
determined by XPS.
Catalyst preparation Au oxidation state Binding energy
Acid or
mixture
Drying
temperature
(oC)
Au3+
(%)
Au0
(%)
Au3+
(eV) Au0 (eV)
HCl 110 67.3 32.7 86.8 84.2
HNO3 110 43.6 56.4 86.8 84.8
Aqua regia 110 53.5 46.5 86.8 84.3
HCl 140 18.5 81.5 86.5 84.1
HNO3 140 16.7 83.3 86.6 84.6
Aqua regia 140 22.3 77.7 86.5 84.1
HCl 180 12.4 87.6 86.3 84.2
HNO3 180 18.9 81.1 86.3 84.1
Aqua regia 180 11.4 88.6 86.7 84.7
Table 2. Surface composition of Au/C catalyst prepared using HCl, HNO3 and aqua
regia dried at 110, 140 and 180 oC, determined by XPS.
Catalyst preparation Elemental composition (%)
Acid or
mixture
Drying
temperature
(oC)
Au 4f
(%)
C 1s
(%)
Cl 2p
(%)
Na 1s
(%)
O 1s
(%)
Si 2p
(%)
Au/C
ratio
(%)
HCl 110 0.10 95.63 0.56 0.00 3.29 0.43 0.100
HNO3 110 0.06 87.11 0.23 0.00 12.01 0.59 0.072
Aqua regia 110 0.04 89.79 0.79 0.00 8.44 0.94 0.050
HCl 140 0.18 95.04 0.58 0.09 3.46 0.65 0.190
HNO3 140 0.07 92.90 0.78 0.07 5.62 0.56 0.070
Aqua regia 140 0.03 90.37 0.20 0.00 8.80 0.60 0.033
HCl 180 0.10 95.79 0.30 0.07 3.19 0.55 0.106
HNO3 180 0.08 92.75 0.88 0.00 5.76 0.53 0.081
Aqua regia 180 0.07 88.73 0.13 0.00 9.83 1.24 0.077

24
Table 3. Average composition of Au/C catalyst prepared using HCl, HNO3 and aqua
regia dried at 110, 140 and 180 oC, determined by SEM-EDX.
Catalyst preparation Elemental composition (%)
Acid or
mixture
Drying
temperature
(oC)
C
O
Na
Al
Si
S
Cl K Au
HCl 110 95.59 0.00 0.05 0.03 0.29 0.32 2.86 0.03 0.84
HNO3 110 73.00 25.00 0.21 0.05 0.43 0.22 0.46 0.05 0.60
aqua
regia
110 82.87 12.51 0.14 0.07 0.33 0.27 2.92 0.02 0.89
HCl 140 89.63 6.69 0.13 0.09 0.27 0.15 1.76 0.02 1.29
HNO3 140 76.76 20.80 0.35 0.07 0.54 0.37 0.50 0.05 0.58
aqua
regia
140 85.98 10.49 0.13 0.04 0.24 0.22 2.18 0.02 0.73
HCl 180 89.74 6.13 0.15 0.05 0.61 0.15 1.59 0.00 1.59
HNO3 180 80.27 16.50 0.34 0.08 0.42 0.46 0.71 0.05 1.19
aqua
regia
180 86.42 9.31 0.11 0.02 0.28 0.11 2.73 0.02 1.03
25
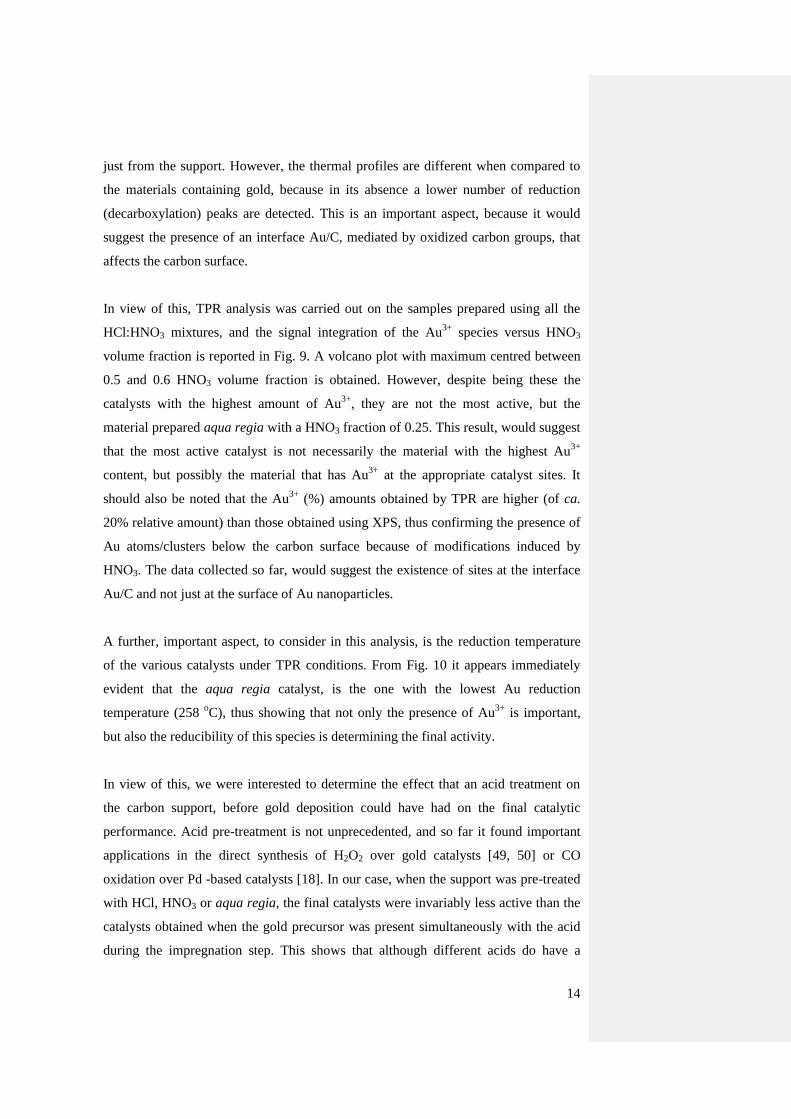
Table 4. Average Au particle size over Au/C catalysts prepared using HCl, HNO3 and
aqua regia dried at 110, 140 and 180 oC, determined by XRPD and TEM
Catalyst preparation Au particle size
Acid or
mixture
Drying
temperature
(oC)
Determination
from XRPD (a).
Fresh catalysts
Determination
from TEM (b).
Fresh catalysts.
Determination
from XRPD (a).
Spent catalysts.
HCl 110 < 4c 3 ± 2 28 ± 3
HNO3 110 < 4c 3 ± 2 31 ± 3
aqua regia 110 < 4c 3 ± 2 < 4
c
HCl 140 40 ± 10 66 ± 23 41 ± 10
HNO3 140 20 ± 3 22 ± 4 20 ± 3
aqua regia 140 20 ± 3 22 ± 3 20 ± 3
HCl 180 40 ± 10 67 ± 23 42 ± 10
HNO3 180 8 ± 1 9 ± 3 15 ± 2
aqua regia 180 < 4c 4 ± 2 < 4
c
(a) Error estimated from XRD peak broadening of 0.06
oat the Au (111) reflection at
38.18 o 2
(b) Error from particles size distribution from sets of 200 particles.
(c) It was not possible to assign any error band below 4 nm, as this size is below the
XRPD method.

26
Table 5. Activation energies for the reduction of Au3+
to Au0 in presence of H2 over
Au/C catalysts.
Acid or mixture Drying temperature
(oC)
Ea (kJ mol-1
) (*)
HCl 110 43.3 ± 5.3
HNO3 110 43.0 ± 4.5
aqua regia 110 56.8 ± 5.5
HCl 140 53.6 ± 5.9
HNO3 140 54.2 ± 2.6
aqua regia 140 50.4 ± 4.1
HCl 180 71.8 ± 5.0
HNO3 180 45.0 ± 3.4
aqua regia 180 39.6 ± 2.6
(*) The experimental error for the activation energy, Ea, was calculated from the least
square regression line of ln(/T2max) versus 1/T.
27
0 50 100 150 200 250 3000
10
20
30
40
50
60
70
80
Acety
lene c
onvers
ion %
time (min)
Fig. 1. Acetylene conversion by using catalysts impregnated in aqua regia, drying the
catalysts at temperatures of: (■) 110, (●) 140 and (▲) 180 oC.
0 50 100 150 200 250 3000
10
20
30
40
50
60
70
80
Ace
tyle
ne
co
nve
rsio
n %
time (min)
Fig. 2. Acetylene conversion by using catalysts impregnated in HNO3, drying the
catalysts at temperatures of: (■) 110, (●) 140 and (▲) 180 oC.
28
0 50 100 150 200 250 3000
10
20
30
40
50
60
70
80
Acety
lene c
onvers
ion %
time (min)
Fig. 3. Acetylene conversion by using catalysts impregnated in HCl drying the
catalysts at different temperatures of: (■) 110, (●) 140 and (▲) 180 oC.
30 40 50 60 70 80
(a)
(b)
(c)
(d)
(e)
(f)
(g)
(h)
(i)
Au
(3
11
)
Au
(2
20
)
Au
(2
00
)
Inte
nsity (
a.u
.)
Scattering angle (2)
Au
(1
11
)
Figure 4. XRD patterns of Au/C carbon prepared accordingly to different solvent and
drying temperature: (a) HCl, (b) HNO3 and (c) aqua regia for catalysts dried at 110
oC; (d) HCl, (e) HNO3 , and (f) aqua regia for catalysts dried at 140
oC; (g) HCl, (h)
HNO3 and (i) aqua regia for catalysts dried at 180 oC.
29
C
B
92 90 88 86 84 82 80 78 76
Inte
nsity (
a.u
.)
Binding energy (eV)
Au0
Au3+
(a)
(b)
(c)
92 90 88 86 84 82 80 78 76
Inte
nsity (
a.u
.)
Binding energy (eV)
(a)
(b)
(c)
Au0
Au3+
92 90 88 86 84 82 80 78 76
Au0
Inte
nsity (
a.u
)
Binding energy (eV)
Au3+
(a)
(b)
(c)
A
Figure 5. XPS spectra of Au/C carbon prepared accordingly to different solvent and
drying temperature: A: (a) HCl, (b) HNO3 and (c) aqua regia for catalysts dried at
110 oC; B: (a) HCl, (b) HNO3 ,and (c) aqua regia for catalysts dried at 140
oC; C: (a)
HCl, (b) HNO3 and (c) aqua regia for catalysts dried at 180 oC.
30
0 50 100 150 200 250 3000
10
20
30
40
50
60
70
Ace
tyle
ne
co
nvers
ion (
%)
time (min)
Figure 6. acetylene conversion over Au/C catalysts dried at 140 oC using different
HNO3 volume fraction in the HCl:HNO3 preparation mixture: (■) 0, (●) 0.1, (□) 0.25,
(▼) 0.33, (○) 0.5, (◄) 0.65, (►) 0.75, (♦) 0.9 and (▲) 1 HNO3 volume fraction.
100 200 300 400 500 600 700 800
0
1000
2000
TC
D s
ign
al (m
V)
temperature (oC)
(a)
(b)(c)
Figure 5. TPR profiles of Au/C catalysts dried at 140 oC prepared via impregnation
using: (a) HCl, (b) HNO3, and (c) aqua regia as solvent.

31
100 200 300 400 500 600 700 800
0
500
1000
1500
2000
TC
D s
ign
al (m
V)
temperature (oC)
(a)
(b)
(c)
Figure 6. TPR profiles of carbon support Norit ROX 0.8 dried at 140 oC prepared via
impregnation using: (a) HCl, (b) HNO3, and (c) aqua regia as solvent.
0.0 0.2 0.4 0.6 0.8 1.00
5
10
15
20
25
30
Au
3+ /
(A
u3
+ +
Au
0)
(%)
HNO3 volume fraction
Figure 9. TPR intensities for the reduction of Au3+
species for Au/C catalysts
prepared using different HNO3 volume fraction in the HCl:HNO3 solvent mixture. All
catalysts were dried at 140 oC.

32
0.0 0.2 0.4 0.6 0.8 1.0250
255
260
265
270
275
280
285
290
Au
3+ r
eduction t
em
pera
ture
(oC
)
HNO3 volume fraction
Figure 10. Au3+
reduction temperature from temperature programmed reduction in
presence of H2 for Au/C catalysts prepared using different HNO3 volume fractions in
the HCl:HNO3 solvent mixture. All catalysts were dried at 140 oC.
0.0 0.2 0.4 0.6 0.8 1.00.0
4.0x10⁻⁵
8.0x10⁻⁵
1.2x10⁻⁴
1.6x10⁻⁴
2.0x10⁻⁴
Ca
rbon
fu
nctio
na
l g
roup
s (
mo
l g
-1)
HNO3 volume fraction
Fig. 11. Oxygenated carbon functional groups (carboxylic/lactones) induced by the
presence of HNO3 in the preparation mixture for HCl, aqua regia, and HNO3, (○) and
(- -) Au/C catalysts, (□) and (··) Au/C catalysts from acid pre-treated carbons.
33
Figure 12. Maximum acetylene conversion (after 5h) versus activation energies for
the reduction of Au3+
in hydrogen.
35 40 45 50 55 60 65 70 75 800
2
4
6
8
10
12
14
16
ln A
Ea (kJ mol-1) Au
3+ reduction
Figure 13. Compensation plot for the reduction of Au3+
over Au/C using H2, for
catalysts prepared using HCl, HNO3 and aqua regia, dried at 110, 140 and 180 oC.
35 40 45 50 55 60 65 70 75 80
10
20
30
40
50
60
70
80
90
Ea (kJ mol-1) Au
3+ reduction
Acety
len
e c
on
ve
rsio
n %
Comment [I1]: New plot with error bars