Embed Size (px)
Citation preview
Argus China PetroleumNews and analysis on oil markets, policy and infrastructure
Contents
High stocks pressure demand 2surplus ends gasoline boom hopes 3technology key to tax crackdown 4export quotas adjust to new policy 5‘non-state’ import quota swells 6Refiners turn to Mideast producers 7expansions drive storage growth 8PdV woes raise Jieyang concerns 9Company restructuring continues 10China turns to LnG amid shortages 11Products 12-16Crude data 17-27Refinery throughputs 28-30Import/export data 31-44
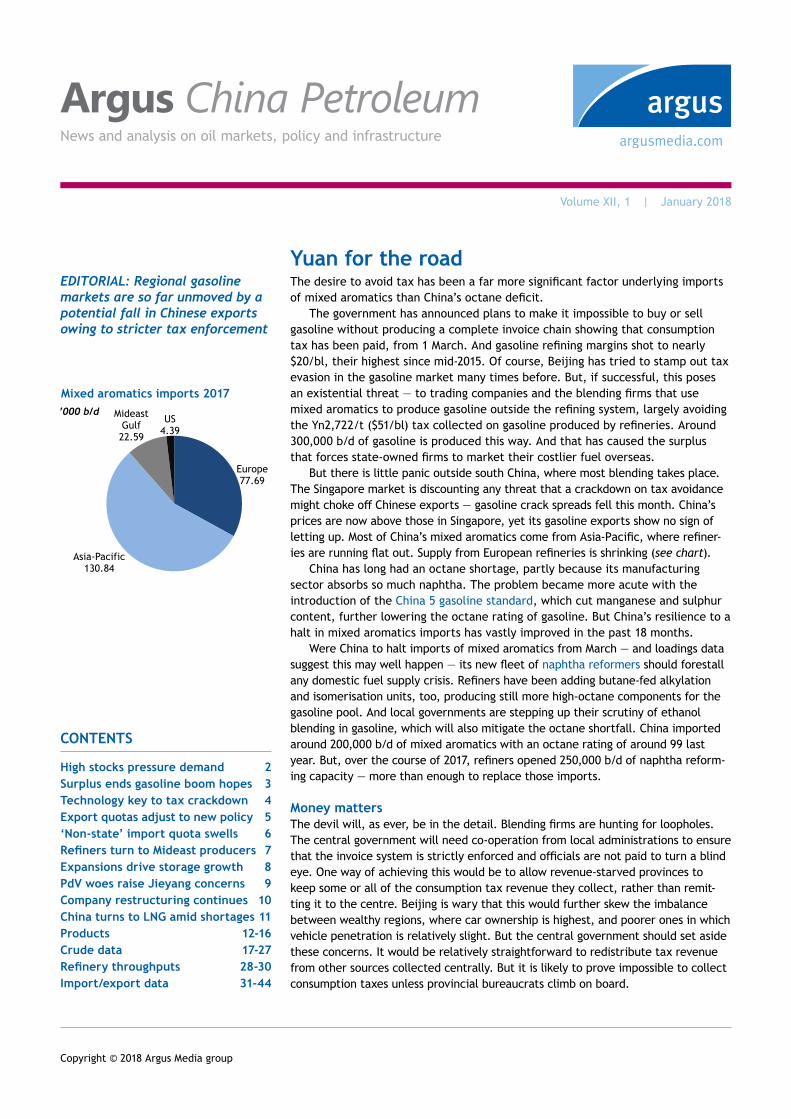
Mixed aromatics imports 2017
Europe77.69
Asia-Pacific130.84
MideastGulf22.59
US4.39
’000 b/d
EDITORIAL: Regional gasoline markets are so far unmoved by a potential fall in Chinese exports owing to stricter tax enforcement
Yuan for the roadThe desire to avoid tax has been a far more significant factor underlying imports of mixed aromatics than China’s octane deficit.
The government has announced plans to make it impossible to buy or sell gasoline without producing a complete invoice chain showing that consumption tax has been paid, from 1 March. And gasoline refining margins shot to nearly $20/bl, their highest since mid-2015. Of course, Beijing has tried to stamp out tax evasion in the gasoline market many times before. But, if successful, this poses an existential threat — to trading companies and the blending firms that use mixed aromatics to produce gasoline outside the refining system, largely avoiding the Yn2,722/t ($51/bl) tax collected on gasoline produced by refineries. Around 300,000 b/d of gasoline is produced this way. And that has caused the surplus that forces state-owned firms to market their costlier fuel overseas.
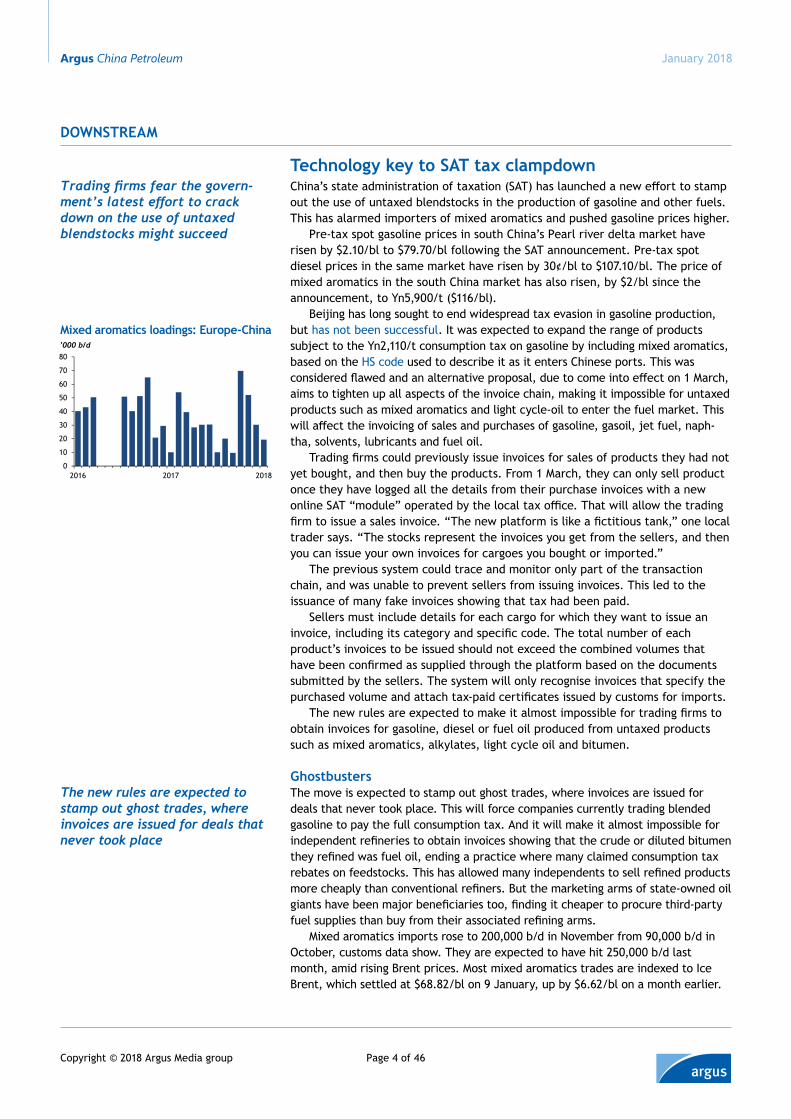
But there is little panic outside south China, where most blending takes place. The Singapore market is discounting any threat that a crackdown on tax avoidance might choke off Chinese exports — gasoline crack spreads fell this month. China’s prices are now above those in Singapore, yet its gasoline exports show no sign of letting up. Most of China’s mixed aromatics come from Asia-Pacific, where refiner-ies are running flat out. Supply from European refineries is shrinking (see chart).
China has long had an octane shortage, partly because its manufacturing sector absorbs so much naphtha. The problem became more acute with the introduction of the China 5 gasoline standard, which cut manganese and sulphur content, further lowering the octane rating of gasoline. But China’s resilience to a halt in mixed aromatics imports has vastly improved in the past 18 months.
Were China to halt imports of mixed aromatics from March — and loadings data suggest this may well happen — its new fleet of naphtha reformers should forestall any domestic fuel supply crisis. Refiners have been adding butane-fed alkylation and isomerisation units, too, producing still more high-octane components for the gasoline pool. And local governments are stepping up their scrutiny of ethanol blending in gasoline, which will also mitigate the octane shortfall. China imported around 200,000 b/d of mixed aromatics with an octane rating of around 99 last year. But, over the course of 2017, refiners opened 250,000 b/d of naphtha reform-ing capacity — more than enough to replace those imports.
Money mattersThe devil will, as ever, be in the detail. Blending firms are hunting for loopholes. The central government will need co-operation from local administrations to ensure that the invoice system is strictly enforced and officials are not paid to turn a blind eye. One way of achieving this would be to allow revenue-starved provinces to keep some or all of the consumption tax revenue they collect, rather than remit-ting it to the centre. Beijing is wary that this would further skew the imbalance between wealthy regions, where car ownership is highest, and poorer ones in which vehicle penetration is relatively slight. But the central government should set aside these concerns. It would be relatively straightforward to redistribute tax revenue from other sources collected centrally. But it is likely to prove impossible to collect consumption taxes unless provincial bureaucrats climb on board.
Copyright © 2018 Argus Media group
Volume XII, 1 | January 2018
Argus China Petroleum
Page 2 of 46Copyright © 2018 Argus Media group
January 2018
High stocks pressure December demandChinese apparent oil demand fell last month as refiners digested high stocks. But demand growth over the whole year was nearly double that of 2016.
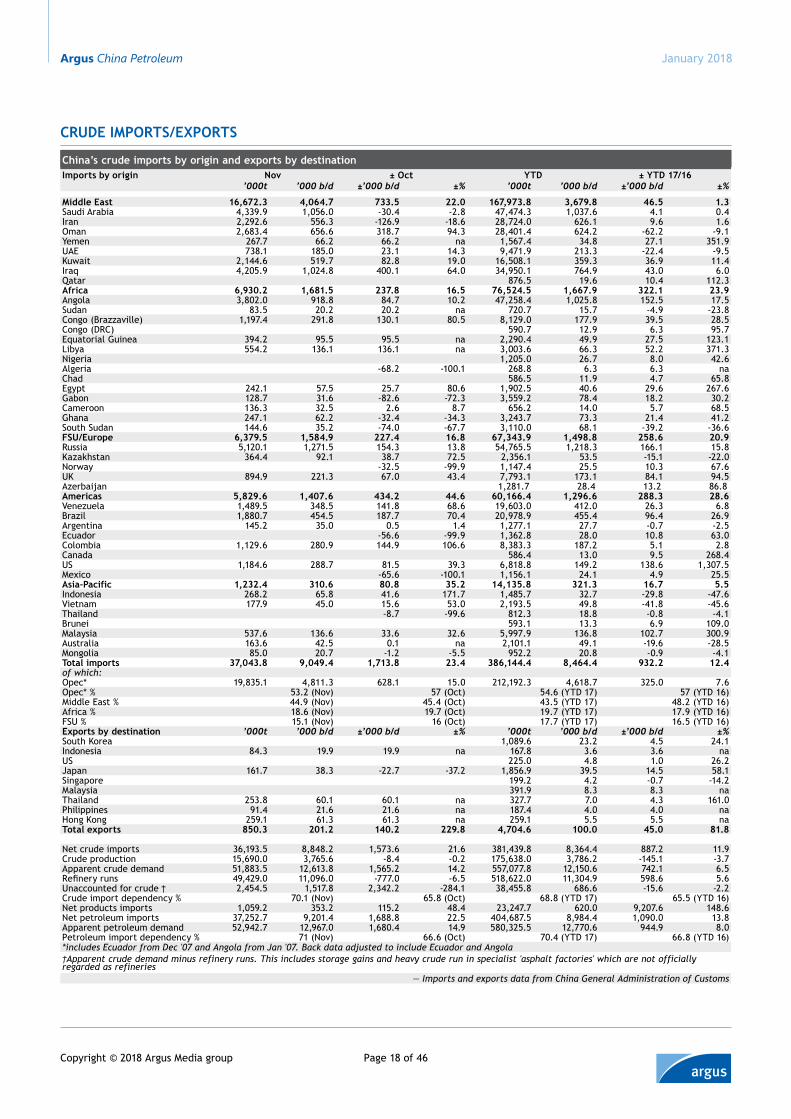
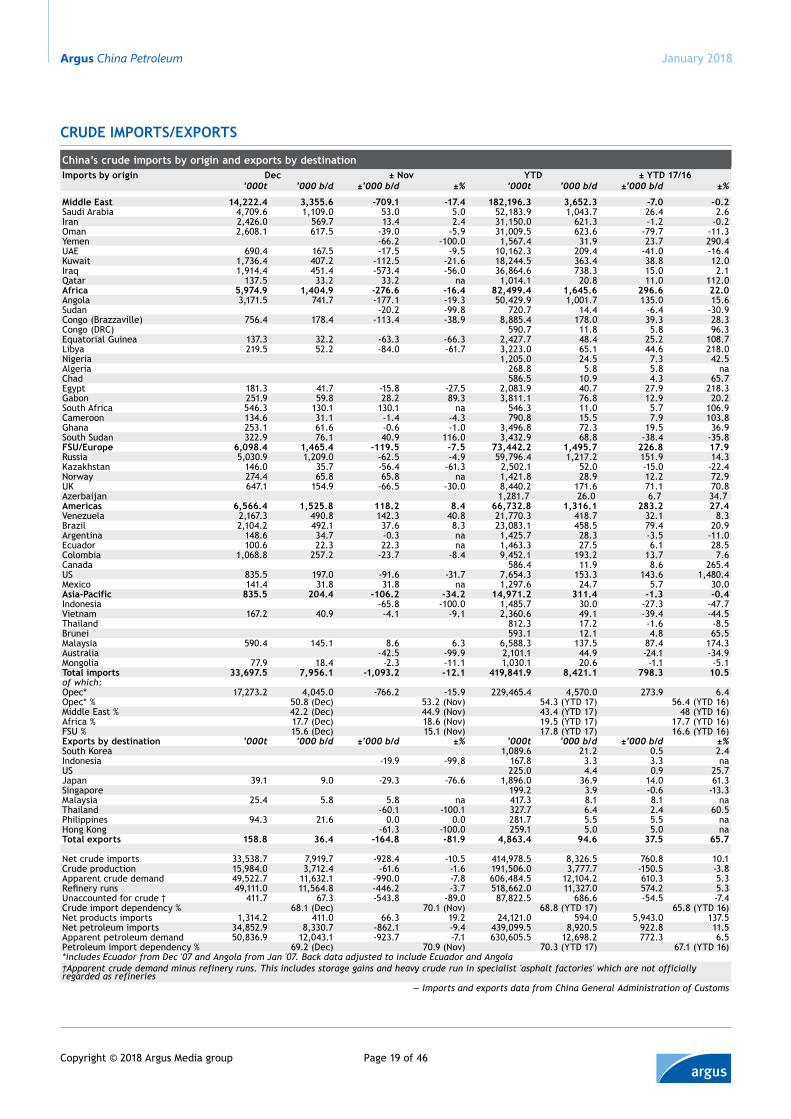
Apparent oil demand, the sum of crude production and net oil imports, fell to 12.04mn b/d in December from nearly 13mn b/d in the previous month, and averaged 12.7mn b/d for the year. Crude output last month fell back to October levels, which were the lowest since the 2009 financial crisis. Dominant upstream firm PetroChina hopes to revive production this year, but it is unclear how realistic this will be. But demand last year grew by 6.3pc from 2016 levels, with rising imports more than offsetting declining crude production (see table).
December crude imports were down by 900,000 b/d — with Shandong prov-ince, centre of the country’s independent refining sector, accounting for 35pc of the decline. Liaoning, where another two large independents, Huajin and Panjin Northern Asphalt, are based, also cut imports in December, mainly from Iraq and Oman. And imports to Fujian on the southeast coast fell by a hefty 230,000 b/d from November levels, as state-owned Sinochem carried out maintenance at its 240,000 b/d Quanzhou refinery. Quanzhou has reopened this month.
Iraq accounted for the most precipitous decline in supply month on month, more than halving to 470,000 b/d. This comparison is skewed by record receipts of more than 1mn b/d in the previous month. Kuwaiti deliveries to south China also fell. Guangdong province, dominated by state-controlled Sinopec’s refineries, cut imports of heavy sweet grades by around 150,000 b/d month on month, with imports from Angola declining by 100,000 b/d, but increased imports of medium sour crude by 230,000 b/d. Deliveries of Venezuelan crude to Guangdong province rose by 90,000 b/d to nearly 500,000 b/d in December, despite Venezuelan production problems.
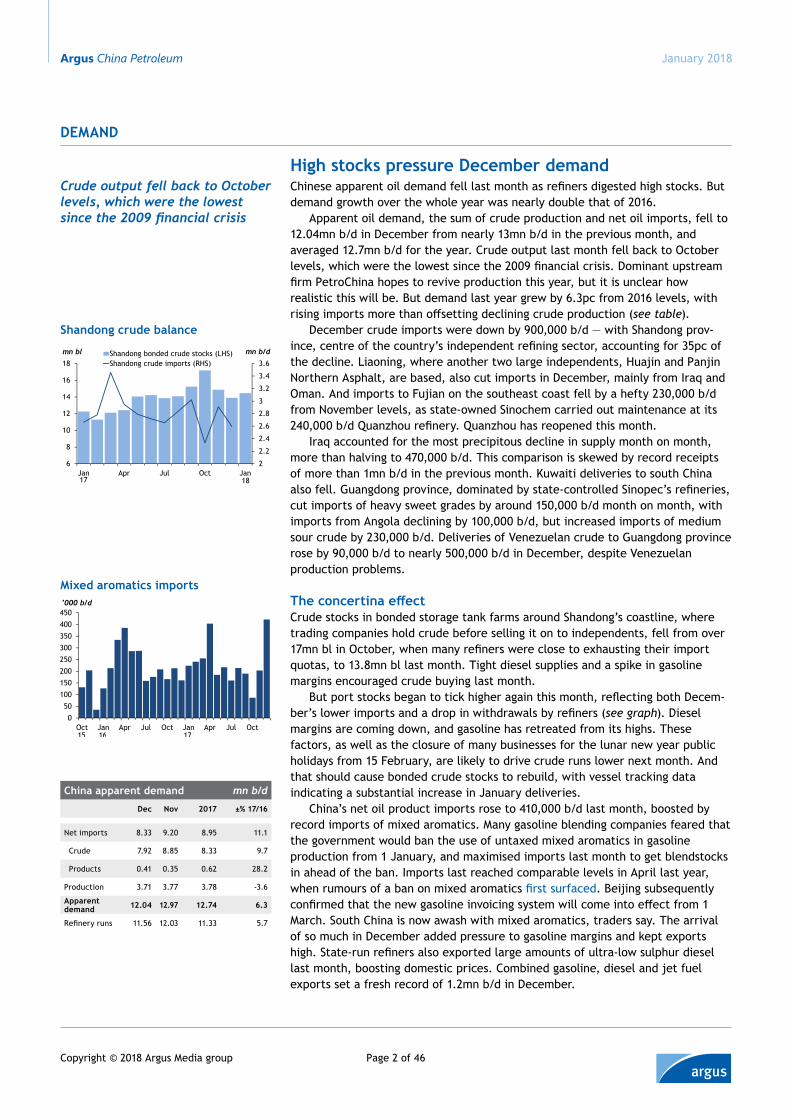
The concertina effectCrude stocks in bonded storage tank farms around Shandong’s coastline, where trading companies hold crude before selling it on to independents, fell from over 17mn bl in October, when many refiners were close to exhausting their import quotas, to 13.8mn bl last month. Tight diesel supplies and a spike in gasoline margins encouraged crude buying last month.
But port stocks began to tick higher again this month, reflecting both Decem-ber’s lower imports and a drop in withdrawals by refiners (see graph). Diesel margins are coming down, and gasoline has retreated from its highs. These factors, as well as the closure of many businesses for the lunar new year public holidays from 15 February, are likely to drive crude runs lower next month. And that should cause bonded crude stocks to rebuild, with vessel tracking data indicating a substantial increase in January deliveries.
China’s net oil product imports rose to 410,000 b/d last month, boosted by record imports of mixed aromatics. Many gasoline blending companies feared that the government would ban the use of untaxed mixed aromatics in gasoline production from 1 January, and maximised imports last month to get blendstocks in ahead of the ban. Imports last reached comparable levels in April last year, when rumours of a ban on mixed aromatics first surfaced. Beijing subsequently confirmed that the new gasoline invoicing system will come into effect from 1 March. South China is now awash with mixed aromatics, traders say. The arrival of so much in December added pressure to gasoline margins and kept exports high. State-run refiners also exported large amounts of ultra-low sulphur diesel last month, boosting domestic prices. Combined gasoline, diesel and jet fuel exports set a fresh record of 1.2mn b/d in December.
Shandong crude balance
2
2.2
2.4
2.6
2.8
3
3.2
3.4
3.6
6
8
10
12
14
16
18
Jan Apr Jul Oct Jan
Shandong bonded crude stocks (LHS)Shandong crude imports (RHS)
mn bl mn b/d
1817
DemanD
Crude output fell back to October levels, which were the lowest since the 2009 financial crisis
mixed aromatics imports
050
100150200250300350400450
Oct Jan Apr Jul Oct Jan Apr Jul Oct
’000 b/d
15 16 17
China apparent demand mn b/d
Dec nov 2017 ±% 17/16
Net imports 8.33 9.20 8.95 11.1
Crude 7.92 8.85 8.33 9.7
Products 0.41 0.35 0.62 28.2
Production 3.71 3.77 3.78 -3.6
apparent demand 12.04 12.97 12.74 6.3
Refinery runs 11.56 12.03 11.33 5.7
Argus China Petroleum
Page 3 of 46Copyright © 2018 Argus Media group
January 2018
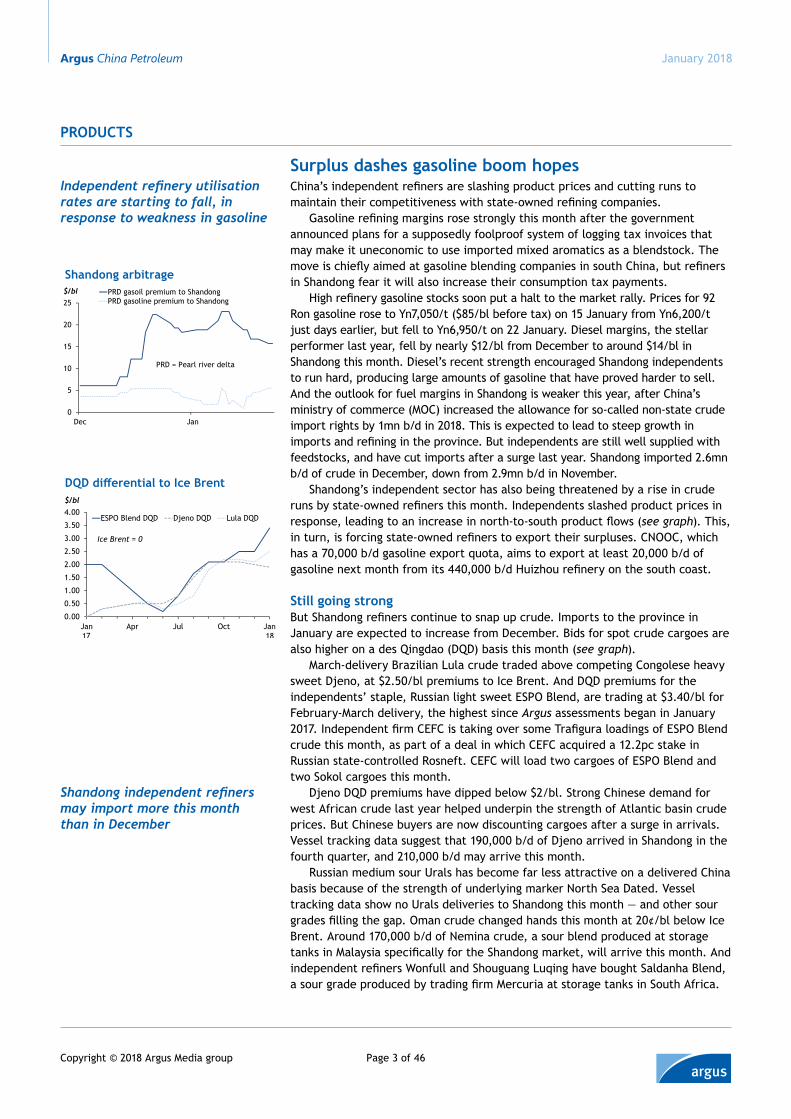
DQD differential to Ice Brent
0.00
0.50
1.00
1.50
2.00
2.50
3.00
3.50
4.00
Jan Apr Jul Oct Jan
ESPO Blend DQD Djeno DQD Lula DQD
$/bl
17 18
Ice Brent = 0
Shandong arbitrage
0
5
10
15
20
25
Dec Jan
PRD gasoil premium to ShandongPRD gasoline premium to Shandong
PRD = Pearl river delta
$/bl
PRODUCTS
Independent refinery utilisation rates are starting to fall, in response to weakness in gasoline
Surplus dashes gasoline boom hopesChina’s independent refiners are slashing product prices and cutting runs to maintain their competitiveness with state-owned refining companies.
Gasoline refining margins rose strongly this month after the government announced plans for a supposedly foolproof system of logging tax invoices that may make it uneconomic to use imported mixed aromatics as a blendstock. The move is chiefly aimed at gasoline blending companies in south China, but refiners in Shandong fear it will also increase their consumption tax payments.
High refinery gasoline stocks soon put a halt to the market rally. Prices for 92 Ron gasoline rose to Yn7,050/t ($85/bl before tax) on 15 January from Yn6,200/t just days earlier, but fell to Yn6,950/t on 22 January. Diesel margins, the stellar performer last year, fell by nearly $12/bl from December to around $14/bl in Shandong this month. Diesel’s recent strength encouraged Shandong independents to run hard, producing large amounts of gasoline that have proved harder to sell. And the outlook for fuel margins in Shandong is weaker this year, after China’s ministry of commerce (MOC) increased the allowance for so-called non-state crude import rights by 1mn b/d in 2018. This is expected to lead to steep growth in imports and refining in the province. But independents are still well supplied with feedstocks, and have cut imports after a surge last year. Shandong imported 2.6mn b/d of crude in December, down from 2.9mn b/d in November.
Shandong’s independent sector has also being threatened by a rise in crude runs by state-owned refiners this month. Independents slashed product prices in response, leading to an increase in north-to-south product flows (see graph). This, in turn, is forcing state-owned refiners to export their surpluses. CNOOC, which has a 70,000 b/d gasoline export quota, aims to export at least 20,000 b/d of gasoline next month from its 440,000 b/d Huizhou refinery on the south coast.
Still going strongBut Shandong refiners continue to snap up crude. Imports to the province in January are expected to increase from December. Bids for spot crude cargoes are also higher on a des Qingdao (DQD) basis this month (see graph).
March-delivery Brazilian Lula crude traded above competing Congolese heavy sweet Djeno, at $2.50/bl premiums to Ice Brent. And DQD premiums for the independents’ staple, Russian light sweet ESPO Blend, are trading at $3.40/bl for February-March delivery, the highest since Argus assessments began in January 2017. Independent firm CEFC is taking over some Trafigura loadings of ESPO Blend crude this month, as part of a deal in which CEFC acquired a 12.2pc stake in Russian state-controlled Rosneft. CEFC will load two cargoes of ESPO Blend and two Sokol cargoes this month.
Djeno DQD premiums have dipped below $2/bl. Strong Chinese demand for west African crude last year helped underpin the strength of Atlantic basin crude prices. But Chinese buyers are now discounting cargoes after a surge in arrivals. Vessel tracking data suggest that 190,000 b/d of Djeno arrived in Shandong in the fourth quarter, and 210,000 b/d may arrive this month.
Russian medium sour Urals has become far less attractive on a delivered China basis because of the strength of underlying marker North Sea Dated. Vessel tracking data show no Urals deliveries to Shandong this month — and other sour grades filling the gap. Oman crude changed hands this month at 20¢/bl below Ice Brent. Around 170,000 b/d of Nemina crude, a sour blend produced at storage tanks in Malaysia specifically for the Shandong market, will arrive this month. And independent refiners Wonfull and Shouguang Luqing have bought Saldanha Blend, a sour grade produced by trading firm Mercuria at storage tanks in South Africa.
Shandong independent refiners may import more this month than in December
Argus China Petroleum
Page 4 of 46Copyright © 2018 Argus Media group
January 2018
DOWNSTREAM
Trading firms fear the govern-ment’s latest effort to crack down on the use of untaxed blendstocks might succeed
Technology key to SAT tax clampdownChina’s state administration of taxation (SAT) has launched a new effort to stamp out the use of untaxed blendstocks in the production of gasoline and other fuels. This has alarmed importers of mixed aromatics and pushed gasoline prices higher.
Pre-tax spot gasoline prices in south China’s Pearl river delta market have risen by $2.10/bl to $79.70/bl following the SAT announcement. Pre-tax spot diesel prices in the same market have risen by 30¢/bl to $107.10/bl. The price of mixed aromatics in the south China market has also risen, by $2/bl since the announcement, to Yn5,900/t ($116/bl).
Beijing has long sought to end widespread tax evasion in gasoline production, but has not been successful. It was expected to expand the range of products subject to the Yn2,110/t consumption tax on gasoline by including mixed aromatics, based on the HS code used to describe it as it enters Chinese ports. This was considered flawed and an alternative proposal, due to come into effect on 1 March, aims to tighten up all aspects of the invoice chain, making it impossible for untaxed products such as mixed aromatics and light cycle-oil to enter the fuel market. This will affect the invoicing of sales and purchases of gasoline, gasoil, jet fuel, naph-tha, solvents, lubricants and fuel oil.
Trading firms could previously issue invoices for sales of products they had not yet bought, and then buy the products. From 1 March, they can only sell product once they have logged all the details from their purchase invoices with a new online SAT “module” operated by the local tax office. That will allow the trading firm to issue a sales invoice. “The new platform is like a fictitious tank,” one local trader says. “The stocks represent the invoices you get from the sellers, and then you can issue your own invoices for cargoes you bought or imported.”
The previous system could trace and monitor only part of the transaction chain, and was unable to prevent sellers from issuing invoices. This led to the issuance of many fake invoices showing that tax had been paid.
Sellers must include details for each cargo for which they want to issue an invoice, including its category and specific code. The total number of each product’s invoices to be issued should not exceed the combined volumes that have been confirmed as supplied through the platform based on the documents submitted by the sellers. The system will only recognise invoices that specify the purchased volume and attach tax-paid certificates issued by customs for imports.
The new rules are expected to make it almost impossible for trading firms to obtain invoices for gasoline, diesel or fuel oil produced from untaxed products such as mixed aromatics, alkylates, light cycle oil and bitumen.
GhostbustersThe move is expected to stamp out ghost trades, where invoices are issued for deals that never took place. This will force companies currently trading blended gasoline to pay the full consumption tax. And it will make it almost impossible for independent refineries to obtain invoices showing that the crude or diluted bitumen they refined was fuel oil, ending a practice where many claimed consumption tax rebates on feedstocks. This has allowed many independents to sell refined products more cheaply than conventional refiners. But the marketing arms of state-owned oil giants have been major beneficiaries too, finding it cheaper to procure third-party fuel supplies than buy from their associated refining arms.
Mixed aromatics imports rose to 200,000 b/d in November from 90,000 b/d in October, customs data show. They are expected to have hit 250,000 b/d last month, amid rising Brent prices. Most mixed aromatics trades are indexed to Ice Brent, which settled at $68.82/bl on 9 January, up by $6.62/bl on a month earlier.
The new rules are expected to stamp out ghost trades, where invoices are issued for deals that never took place
Mixed aromatics loadings: Europe-China
0
10
20
30
40
50
60
70
80
2016 2017 2018
’000 b/d
Argus China Petroleum
Page 5 of 46Copyright © 2018 Argus Media group
January 2018
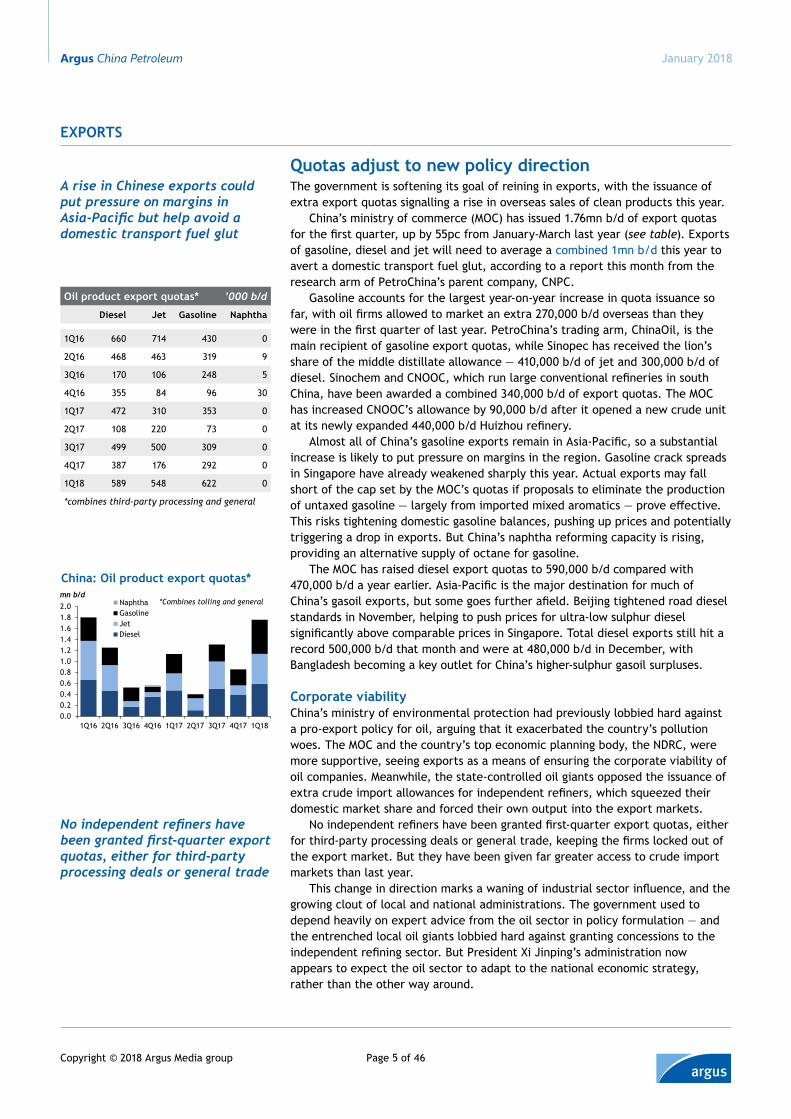
Quotas adjust to new policy directionThe government is softening its goal of reining in exports, with the issuance of extra export quotas signalling a rise in overseas sales of clean products this year.
China’s ministry of commerce (MOC) has issued 1.76mn b/d of export quotas for the first quarter, up by 55pc from January-March last year (see table). Exports of gasoline, diesel and jet will need to average a combined 1mn b/d this year to avert a domestic transport fuel glut, according to a report this month from the research arm of PetroChina’s parent company, CNPC.
Gasoline accounts for the largest year-on-year increase in quota issuance so far, with oil firms allowed to market an extra 270,000 b/d overseas than they were in the first quarter of last year. PetroChina’s trading arm, ChinaOil, is the main recipient of gasoline export quotas, while Sinopec has received the lion’s share of the middle distillate allowance — 410,000 b/d of jet and 300,000 b/d of diesel. Sinochem and CNOOC, which run large conventional refineries in south China, have been awarded a combined 340,000 b/d of export quotas. The MOC has increased CNOOC’s allowance by 90,000 b/d after it opened a new crude unit at its newly expanded 440,000 b/d Huizhou refinery.
Almost all of China’s gasoline exports remain in Asia-Pacific, so a substantial increase is likely to put pressure on margins in the region. Gasoline crack spreads in Singapore have already weakened sharply this year. Actual exports may fall short of the cap set by the MOC’s quotas if proposals to eliminate the production of untaxed gasoline — largely from imported mixed aromatics — prove effective. This risks tightening domestic gasoline balances, pushing up prices and potentially triggering a drop in exports. But China’s naphtha reforming capacity is rising, providing an alternative supply of octane for gasoline.
The MOC has raised diesel export quotas to 590,000 b/d compared with 470,000 b/d a year earlier. Asia-Pacific is the major destination for much of China’s gasoil exports, but some goes further afield. Beijing tightened road diesel standards in November, helping to push prices for ultra-low sulphur diesel significantly above comparable prices in Singapore. Total diesel exports still hit a record 500,000 b/d that month and were at 480,000 b/d in December, with Bangladesh becoming a key outlet for China’s higher-sulphur gasoil surpluses.
Corporate viabilityChina’s ministry of environmental protection had previously lobbied hard against a pro-export policy for oil, arguing that it exacerbated the country’s pollution woes. The MOC and the country’s top economic planning body, the NDRC, were more supportive, seeing exports as a means of ensuring the corporate viability of oil companies. Meanwhile, the state-controlled oil giants opposed the issuance of extra crude import allowances for independent refiners, which squeezed their domestic market share and forced their own output into the export markets.
No independent refiners have been granted first-quarter export quotas, either for third-party processing deals or general trade, keeping the firms locked out of the export market. But they have been given far greater access to crude import markets than last year.
This change in direction marks a waning of industrial sector influence, and the growing clout of local and national administrations. The government used to depend heavily on expert advice from the oil sector in policy formulation — and the entrenched local oil giants lobbied hard against granting concessions to the independent refining sector. But President Xi Jinping’s administration now appears to expect the oil sector to adapt to the national economic strategy, rather than the other way around.
EXPORTS
A rise in Chinese exports could put pressure on margins in Asia-Pacific but help avoid a domestic transport fuel glut
China: Oil product export quotas*
0.00.20.40.60.81.01.21.41.61.82.0
1Q16 2Q16 3Q16 4Q16 1Q17 2Q17 3Q17 4Q17 1Q18
NaphthaGasolineJetDiesel
mn b/d*Combines tolling and general
No independent refiners have been granted first-quarter export quotas, either for third-party processing deals or general trade
Oil product export quotas* ’000 b/d
Diesel Jet Gasoline Naphtha
1Q16 660 714 430 0
2Q16 468 463 319 9
3Q16 170 106 248 5
4Q16 355 84 96 30
1Q17 472 310 353 0
2Q17 108 220 73 0
3Q17 499 500 309 0
4Q17 387 176 292 0
1Q18 589 548 622 0
*combines third-party processing and general
Argus China Petroleum
Page 6 of 46Copyright © 2018 Argus Media group
January 2018
‘Non-state’ import quota swellsChina’s first award of import quotas this year should boost crude imports and refining activity.
The ministry of commerce (MOC) issued 837mn bl of non-state crude import quotas to 34 independent refinery operators in late December. This represents a 77pc increase on the 474mn bl of import quotas it awarded to 21 refiners a year earlier. The MOC based individual quotas on the amount of crude each firm imported in January-October in the previous year. The independent sector’s import allowance stands at 2.29mn b/d for 2018 as a whole, equivalent to 67pc of the recipients’ combined 3.42mn b/d of refining capacity, and 485,000 b/d more than the MOC awarded to the sector in import quotas for 2017.
Only three companies received quotas matching their maximum potential refinery utilisation over the full year. These are private-sector firms Shengxing Chemical, Dongfang Hualong Industry and Trading, and Qingyishan Petrochemical Science and Technology, which operate a combined capacity of 164,000 b/d in Shandong province.
Nine firms with a combined capacity of 862,000 b/d received quotas covering over 90pc of their refining capacity. But the biggest winners, in outright terms, are state-run ChemChina and Norinco Huajin Chemical, and private-sector firms Heze Dongming Petrochemical and Panjin North Asphalt Fuel. These received a combined 744,000 b/d of quotas, representing nearly one-third of the all quotas awarded and equivalent to 80pc of their refining capacity.
Seven companies have been granted quotas covering less than half of their refining capacity, either because their actual crude imports last year were below the amount their quota allowed, or because their quotas to refine imported crude fall short of their capacity. Ningxia Baota, which buys crude from Russia’s state-controlled Rosneft and imports it by rail to Inner Mongolia, has been granted a 21,600 b/d quota, in line with the cut to its refining quota.
The MOC has also granted a total of 49mn bl of crude import quotas to 10 trading companies for 2018, taking the amount of non-state quotas issued so far to 2.43mn b/d, or 85pc of the 2.85mn b/d cap on 2018 issuance. A second batch of quotas is likely to be released later in the year, but that will probably be much smaller — the overall 2.85mn b/d cap suggests it may be 420,000 b/d. The MOC is likely to extend import rights to the handful of independents still waiting for final approval from top economic body the NDRC to refine imported crude. At least four firms operating independent refineries in Shandong received preliminary approval for refining quotas, of 132,000 b/d, in October-December.
Enter the DragonOther refineries are due to open later this year. It is uncertain whether they will be awarded crude import quotas, even if they are likely to be granted quotas to refine imports — although total quota issuance last year exceeded the MOC’s initial guidance by 190,000 b/d.
Private-sector Hengli’s 400,000 b/d Dalian refinery aims to start testing its crude unit in October, and Dragon Aromatics’ 1.6mn t/yr paraxylene plant will require condensate when it resumes operations in the second quarter. Dragon Aromatics was previously a key buyer of Iranian South Pars condensate and had crude import quotas for 92,000 b/d, before it was shut down in 2015. Hengli is likely to be awarded a quota to refine crude imports ahead of its test runs. But it may buy imports through PetroChina and Sinochem initially — both companies have signed agreements with Hengli. State-owned CNPC expects Chinese crude demand this year to be 640,000 b/d higher than last year, at 9mn b/d.
SUPPLY
Only three Chinese companies have received quotas matching their maximum potential refinery utilisation over the full year
Seven companies have been granted quotas covering less than half of their refining capacity
Argus China Petroleum
Page 7 of 46Copyright © 2018 Argus Media group
January 2018
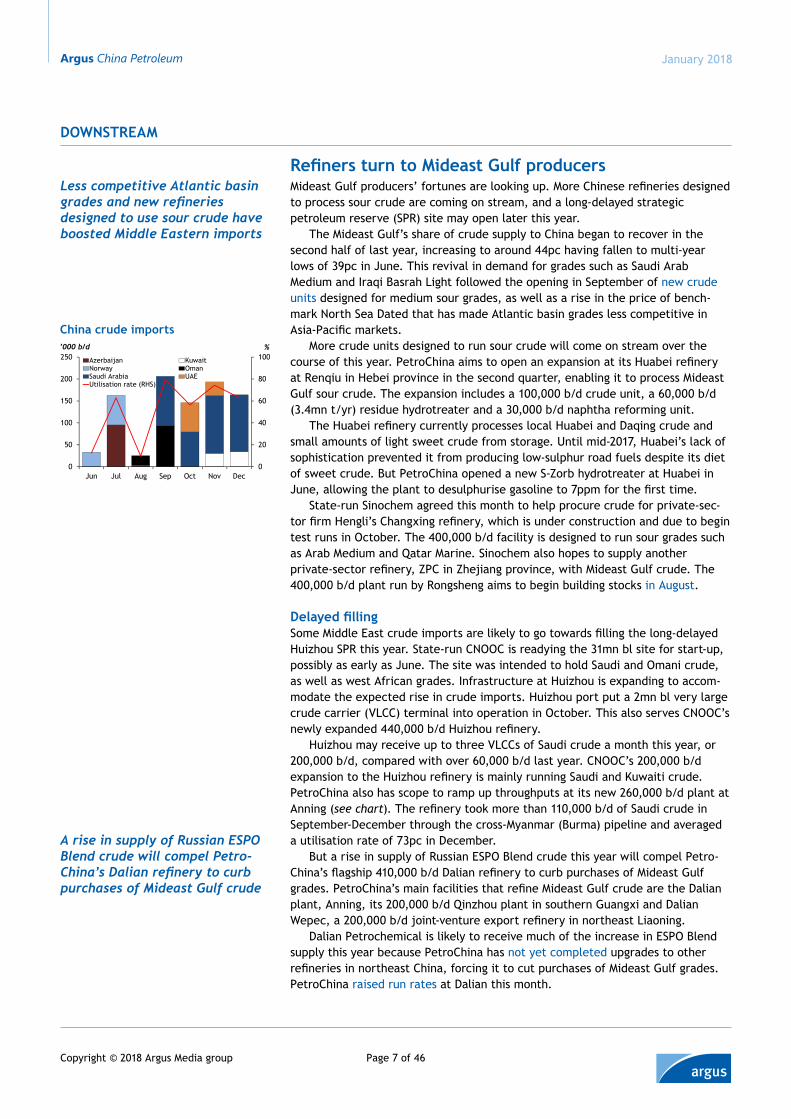
Refiners turn to Mideast Gulf producersMideast Gulf producers’ fortunes are looking up. More Chinese refineries designed to process sour crude are coming on stream, and a long-delayed strategic petroleum reserve (SPR) site may open later this year.
The Mideast Gulf’s share of crude supply to China began to recover in the second half of last year, increasing to around 44pc having fallen to multi-year lows of 39pc in June. This revival in demand for grades such as Saudi Arab Medium and Iraqi Basrah Light followed the opening in September of new crude units designed for medium sour grades, as well as a rise in the price of bench-mark North Sea Dated that has made Atlantic basin grades less competitive in Asia-Pacific markets.
More crude units designed to run sour crude will come on stream over the course of this year. PetroChina aims to open an expansion at its Huabei refinery at Renqiu in Hebei province in the second quarter, enabling it to process Mideast Gulf sour crude. The expansion includes a 100,000 b/d crude unit, a 60,000 b/d (3.4mn t/yr) residue hydrotreater and a 30,000 b/d naphtha reforming unit.
The Huabei refinery currently processes local Huabei and Daqing crude and small amounts of light sweet crude from storage. Until mid-2017, Huabei’s lack of sophistication prevented it from producing low-sulphur road fuels despite its diet of sweet crude. But PetroChina opened a new S-Zorb hydrotreater at Huabei in June, allowing the plant to desulphurise gasoline to 7ppm for the first time.
State-run Sinochem agreed this month to help procure crude for private-sec-tor firm Hengli’s Changxing refinery, which is under construction and due to begin test runs in October. The 400,000 b/d facility is designed to run sour grades such as Arab Medium and Qatar Marine. Sinochem also hopes to supply another private-sector refinery, ZPC in Zhejiang province, with Mideast Gulf crude. The 400,000 b/d plant run by Rongsheng aims to begin building stocks in August.
Delayed fillingSome Middle East crude imports are likely to go towards filling the long-delayed Huizhou SPR this year. State-run CNOOC is readying the 31mn bl site for start-up, possibly as early as June. The site was intended to hold Saudi and Omani crude, as well as west African grades. Infrastructure at Huizhou is expanding to accom-modate the expected rise in crude imports. Huizhou port put a 2mn bl very large crude carrier (VLCC) terminal into operation in October. This also serves CNOOC’s newly expanded 440,000 b/d Huizhou refinery.
Huizhou may receive up to three VLCCs of Saudi crude a month this year, or 200,000 b/d, compared with over 60,000 b/d last year. CNOOC’s 200,000 b/d expansion to the Huizhou refinery is mainly running Saudi and Kuwaiti crude. PetroChina also has scope to ramp up throughputs at its new 260,000 b/d plant at Anning (see chart). The refinery took more than 110,000 b/d of Saudi crude in September-December through the cross-Myanmar (Burma) pipeline and averaged a utilisation rate of 73pc in December.
But a rise in supply of Russian ESPO Blend crude this year will compel Petro-China’s flagship 410,000 b/d Dalian refinery to curb purchases of Mideast Gulf grades. PetroChina’s main facilities that refine Mideast Gulf crude are the Dalian plant, Anning, its 200,000 b/d Qinzhou plant in southern Guangxi and Dalian Wepec, a 200,000 b/d joint-venture export refinery in northeast Liaoning.
Dalian Petrochemical is likely to receive much of the increase in ESPO Blend supply this year because PetroChina has not yet completed upgrades to other refineries in northeast China, forcing it to cut purchases of Mideast Gulf grades. PetroChina raised run rates at Dalian this month.
China crude imports
0
20
40
60
80
100
0
50
100
150
200
250
Jun Jul Aug Sep Oct Nov Dec
’000 b/d
Azerbaijan KuwaitNorway OmanSaudi Arabia UAEUtilisation rate (RHS)
%
DOWNSTREAM
Less competitive Atlantic basin grades and new refineries designed to use sour crude have boosted Middle Eastern imports
A rise in supply of Russian ESPO Blend crude will compel Petro-China’s Dalian refinery to curb purchases of Mideast Gulf crude
Argus China Petroleum
Page 8 of 46Copyright © 2018 Argus Media group
January 2018
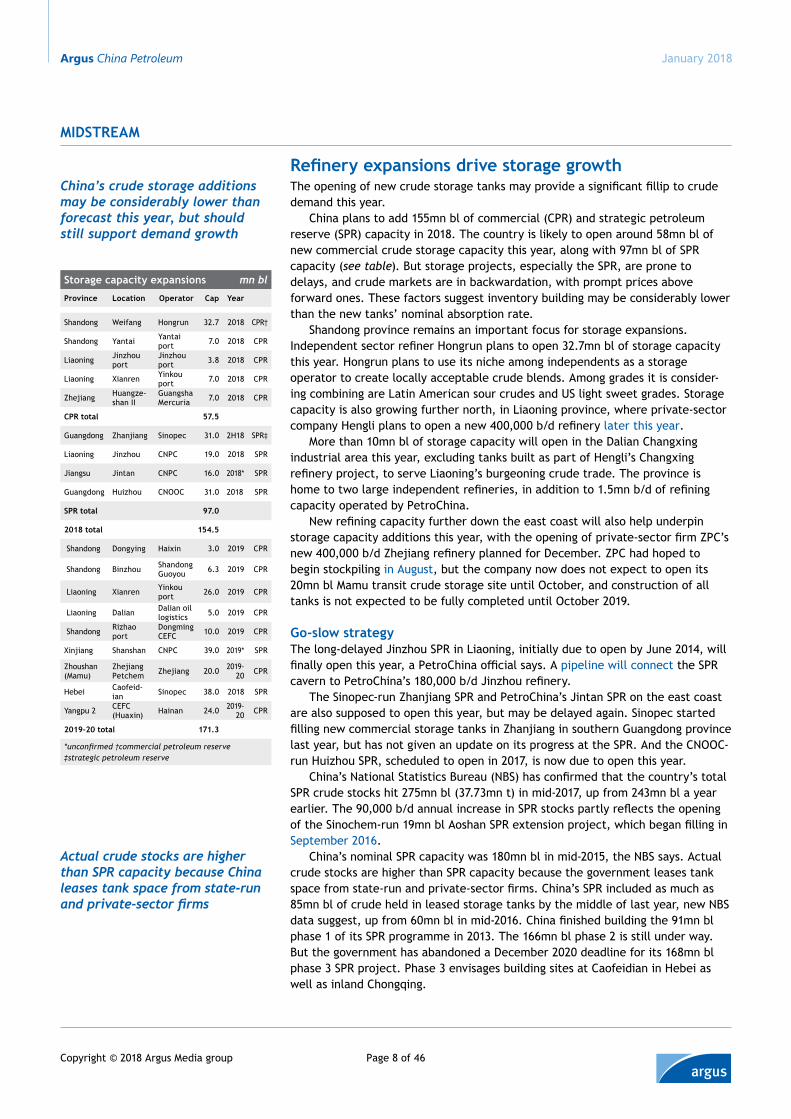
Refinery expansions drive storage growthThe opening of new crude storage tanks may provide a significant fillip to crude demand this year.
China plans to add 155mn bl of commercial (CPR) and strategic petroleum reserve (SPR) capacity in 2018. The country is likely to open around 58mn bl of new commercial crude storage capacity this year, along with 97mn bl of SPR capacity (see table). But storage projects, especially the SPR, are prone to delays, and crude markets are in backwardation, with prompt prices above forward ones. These factors suggest inventory building may be considerably lower than the new tanks’ nominal absorption rate.
Shandong province remains an important focus for storage expansions. Independent sector refiner Hongrun plans to open 32.7mn bl of storage capacity this year. Hongrun plans to use its niche among independents as a storage operator to create locally acceptable crude blends. Among grades it is consider-ing combining are Latin American sour crudes and US light sweet grades. Storage capacity is also growing further north, in Liaoning province, where private-sector company Hengli plans to open a new 400,000 b/d refinery later this year.
More than 10mn bl of storage capacity will open in the Dalian Changxing industrial area this year, excluding tanks built as part of Hengli’s Changxing refinery project, to serve Liaoning’s burgeoning crude trade. The province is home to two large independent refineries, in addition to 1.5mn b/d of refining capacity operated by PetroChina.
New refining capacity further down the east coast will also help underpin storage capacity additions this year, with the opening of private-sector firm ZPC’s new 400,000 b/d Zhejiang refinery planned for December. ZPC had hoped to begin stockpiling in August, but the company now does not expect to open its 20mn bl Mamu transit crude storage site until October, and construction of all tanks is not expected to be fully completed until October 2019.
Go-slow strategyThe long-delayed Jinzhou SPR in Liaoning, initially due to open by June 2014, will finally open this year, a PetroChina official says. A pipeline will connect the SPR cavern to PetroChina’s 180,000 b/d Jinzhou refinery.
The Sinopec-run Zhanjiang SPR and PetroChina’s Jintan SPR on the east coast are also supposed to open this year, but may be delayed again. Sinopec started filling new commercial storage tanks in Zhanjiang in southern Guangdong province last year, but has not given an update on its progress at the SPR. And the CNOOC-run Huizhou SPR, scheduled to open in 2017, is now due to open this year.
China’s National Statistics Bureau (NBS) has confirmed that the country’s total SPR crude stocks hit 275mn bl (37.73mn t) in mid-2017, up from 243mn bl a year earlier. The 90,000 b/d annual increase in SPR stocks partly reflects the opening of the Sinochem-run 19mn bl Aoshan SPR extension project, which began filling in September 2016.
China’s nominal SPR capacity was 180mn bl in mid-2015, the NBS says. Actual crude stocks are higher than SPR capacity because the government leases tank space from state-run and private-sector firms. China’s SPR included as much as 85mn bl of crude held in leased storage tanks by the middle of last year, new NBS data suggest, up from 60mn bl in mid-2016. China finished building the 91mn bl phase 1 of its SPR programme in 2013. The 166mn bl phase 2 is still under way. But the government has abandoned a December 2020 deadline for its 168mn bl phase 3 SPR project. Phase 3 envisages building sites at Caofeidian in Hebei as well as inland Chongqing.
midstream
China’s crude storage additions may be considerably lower than forecast this year, but should still support demand growth
Actual crude stocks are higher than SPR capacity because China leases tank space from state-run and private-sector firms
Storage capacity expansions mn bl
Province Location Operator Cap Year
Shandong Weifang Hongrun 32.7 2018 CPR†
Shandong Yantai Yantai port 7.0 2018 CPR
Liaoning Jinzhou port
Jinzhou port 3.8 2018 CPR
Liaoning Xianren Yinkou port 7.0 2018 CPR
Zhejiang Huangze-shan II
Guangsha Mercuria 7.0 2018 CPR
CPR total 57.5
Guangdong Zhanjiang Sinopec 31.0 2H18 SPR‡
Liaoning Jinzhou CNPC 19.0 2018 SPR
Jiangsu Jintan CNPC 16.0 2018* SPR
Guangdong Huizhou CNOOC 31.0 2018 SPR
SPR total 97.0
2018 total 154.5
Shandong Dongying Haixin 3.0 2019 CPR
Shandong Binzhou Shandong Guoyou 6.3 2019 CPR
Liaoning Xianren Yinkou port 26.0 2019 CPR
Liaoning Dalian Dalian oil logistics 5.0 2019 CPR
Shandong Rizhao port
Dongming CEFC 10.0 2019 CPR
Xinjiang Shanshan CNPC 39.0 2019* SPR
Zhoushan (Mamu)
Zhejiang Petchem Zhejiang 20.0 2019-
20 CPR
Hebei Caofeid-ian Sinopec 38.0 2018 SPR
Yangpu 2 CEFC (Huaxin) Hainan 24.0 2019-
20 CPR
2019-20 total 171.3
*unconfirmed †commercial petroleum reserve‡strategic petroleum reserve
Argus China Petroleum
Page 9 of 46Copyright © 2018 Argus Media group
January 2018
Venezuelan crude receipts
0
100
200
300
400
500
600
Jan Apr Jul Oct
’000 b/d
2016 2017
DOWNSTREAM
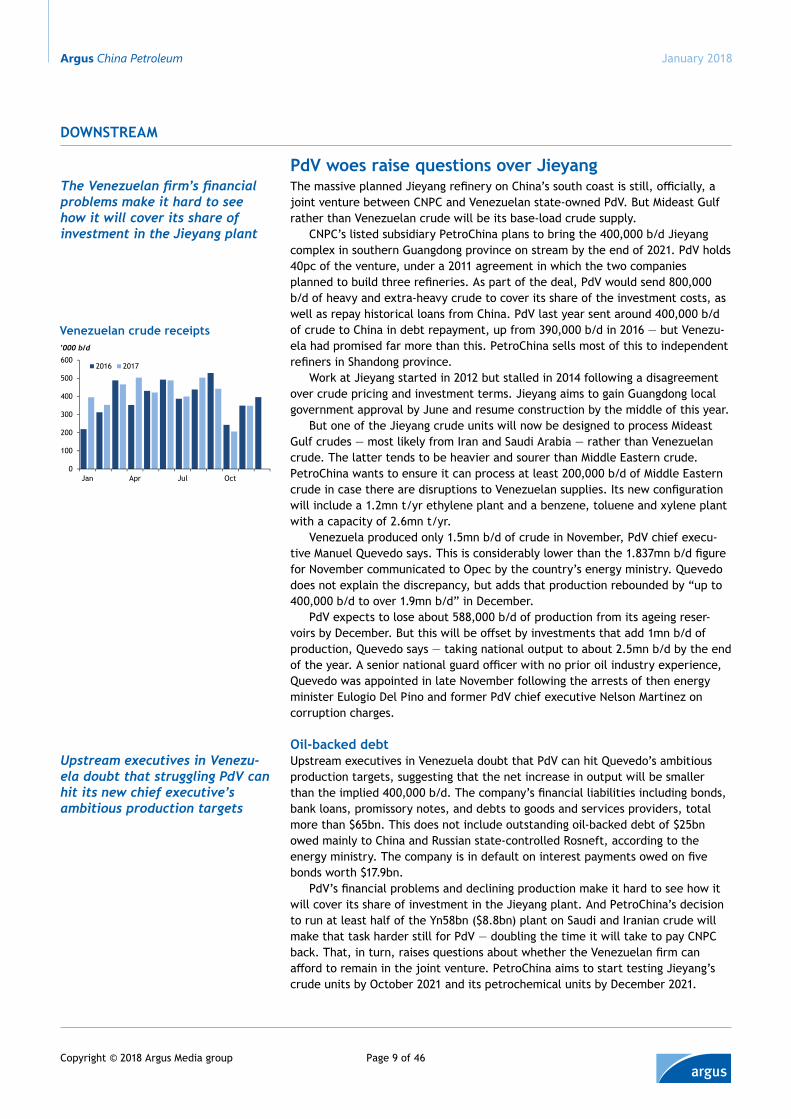
The Venezuelan firm’s financial problems make it hard to see how it will cover its share of investment in the Jieyang plant
PdV woes raise questions over JieyangThe massive planned Jieyang refinery on China’s south coast is still, officially, a joint venture between CNPC and Venezuelan state-owned PdV. But Mideast Gulf rather than Venezuelan crude will be its base-load crude supply.
CNPC’s listed subsidiary PetroChina plans to bring the 400,000 b/d Jieyang complex in southern Guangdong province on stream by the end of 2021. PdV holds 40pc of the venture, under a 2011 agreement in which the two companies planned to build three refineries. As part of the deal, PdV would send 800,000 b/d of heavy and extra-heavy crude to cover its share of the investment costs, as well as repay historical loans from China. PdV last year sent around 400,000 b/d of crude to China in debt repayment, up from 390,000 b/d in 2016 — but Venezu-ela had promised far more than this. PetroChina sells most of this to independent refiners in Shandong province.
Work at Jieyang started in 2012 but stalled in 2014 following a disagreement over crude pricing and investment terms. Jieyang aims to gain Guangdong local government approval by June and resume construction by the middle of this year.
But one of the Jieyang crude units will now be designed to process Mideast Gulf crudes — most likely from Iran and Saudi Arabia — rather than Venezuelan crude. The latter tends to be heavier and sourer than Middle Eastern crude. PetroChina wants to ensure it can process at least 200,000 b/d of Middle Eastern crude in case there are disruptions to Venezuelan supplies. Its new configuration will include a 1.2mn t/yr ethylene plant and a benzene, toluene and xylene plant with a capacity of 2.6mn t/yr.
Venezuela produced only 1.5mn b/d of crude in November, PdV chief execu-tive Manuel Quevedo says. This is considerably lower than the 1.837mn b/d figure for November communicated to Opec by the country’s energy ministry. Quevedo does not explain the discrepancy, but adds that production rebounded by “up to 400,000 b/d to over 1.9mn b/d” in December.
PdV expects to lose about 588,000 b/d of production from its ageing reser-voirs by December. But this will be offset by investments that add 1mn b/d of production, Quevedo says — taking national output to about 2.5mn b/d by the end of the year. A senior national guard officer with no prior oil industry experience, Quevedo was appointed in late November following the arrests of then energy minister Eulogio Del Pino and former PdV chief executive Nelson Martinez on corruption charges.
Oil-backed debtUpstream executives in Venezuela doubt that PdV can hit Quevedo’s ambitious production targets, suggesting that the net increase in output will be smaller than the implied 400,000 b/d. The company’s financial liabilities including bonds, bank loans, promissory notes, and debts to goods and services providers, total more than $65bn. This does not include outstanding oil-backed debt of $25bn owed mainly to China and Russian state-controlled Rosneft, according to the energy ministry. The company is in default on interest payments owed on five bonds worth $17.9bn.
PdV’s financial problems and declining production make it hard to see how it will cover its share of investment in the Jieyang plant. And PetroChina’s decision to run at least half of the Yn58bn ($8.8bn) plant on Saudi and Iranian crude will make that task harder still for PdV — doubling the time it will take to pay CNPC back. That, in turn, raises questions about whether the Venezuelan firm can afford to remain in the joint venture. PetroChina aims to start testing Jieyang’s crude units by October 2021 and its petrochemical units by December 2021.
Upstream executives in Venezu-ela doubt that struggling PdV can hit its new chief executive’s ambitious production targets
Argus China Petroleum
Page 10 of 46Copyright © 2018 Argus Media group
January 2018
CORPORATE
The petrochemical sector could be included in the next round of major restructuring aimed at making companies more efficient
Government heralds outcome of restructuringChina plans to step up the restructuring of state-owned companies this year by introducing further reforms to make the firms more efficient, state-run assets regulator Sasac says.
The government has mooted the idea of including the petrochemical sector in its next round of major restructuring, leading to renewed speculation that state-owned refining and chemicals firm ChemChina and state-owned oil firm Sinochem could be merged or have their petrochemical assets combined. Sino-chem has, in the past, denied the possibility of a merger.
State-owned Baowu Steel Group became far more profitable last year as a result of a merger, the government says. Baowu was previously two separate firms — Baosteel and Wuhan Iron and Steel, the latter being one of the country’s most-indebted steel producers. Baowu made a profit of Yn8.66bn ($1.26bn) in January-June 2017, a 100pc increase from a year earlier.
ChemChina is also heavily indebted. It completed the $43bn acquisition of Swiss agrichemicals group Syngenta in June last year — China’s largest overseas deal to date. ChemChina, which received backing from government investment arm China Reform Holdings for the acquisition, is busy refinancing loans used to complete the deal. This month, it arranged a $5.5bn syndicated term loan facility to refinance part of the $12.7bn it used to fund the acquisition.
Around seven “yangqi” companies — those supervised by Sasac — have merged in the past year, including the country’s biggest coal producer Shenhua and power utility Guodian, which were combined to form China Energy Invest-ment in November. The merged entity is worth Yn1.83 trillion ($278bn). It has 175GW of installed thermal power generation capacity, of which 173GW is coal-fired, and nearly 500mn t/yr of coal production.
The watchdog reduced the number of yangqis it oversees to 98 from 117 last year through restructuring and mergers. Workforce cuts at yangqis have helped to resolve overcapacity in the steel and coal sectors, removing around 5.95mn t/yr of steel and 25.23mn t/yr of coal capacity last year, Sasac says. China has eliminated over 115mn t/yr of blast furnace-based crude steel capacity since 2016 and shut down 140mn t/yr of induction furnace capacity, while the government set a target to remove 150mn t/yr of coal capacity in 2017.
Sasac’s latest comments indicate more mergers could be on the way. The government will push for further restructuring in the coal, power, petrochemical, equipment manufacturing and communications sectors this year, Sasac chairman Xiao Yaqing said at a recent work summit focused on yangqi reforms.
Saving zombiesThere are suggestions the reforms could extend to companies controlled by provincial governments. Beijing also wants to encourage asset management companies to be set up in fields including coal, steel, marine equipment and environmental protection, in order to streamline resources. Debt-to-asset ratios dropped for yangqis last year as they cut interest-bearing loans, while profits at the firms rose by 15pc to Yn1.4 trillion.
Some critics say that Beijing’s restructuring strategy effectively bails out zombie firms by tying them to profitable ones. Its decision to merge Macau-based downstream oil firm Nam Kwong and crude trading firm Zhuhai Zhenrong appears to have led to almost no operational changes. Zhenrong ran into difficulty when its main customer, Dragon Aromatics, closed — it, formerly, supplied South Pars condensate to Dragon. China’s imports of Iranian crude fell to an almost two-year low in December, but supply to Asia-Pacific held steady.
Critics say the government’s restructuring strategy effectively bails out zombie firms by tying them to profitable ones
Argus China Petroleum
Page 11 of 46Copyright © 2018 Argus Media group
January 2018
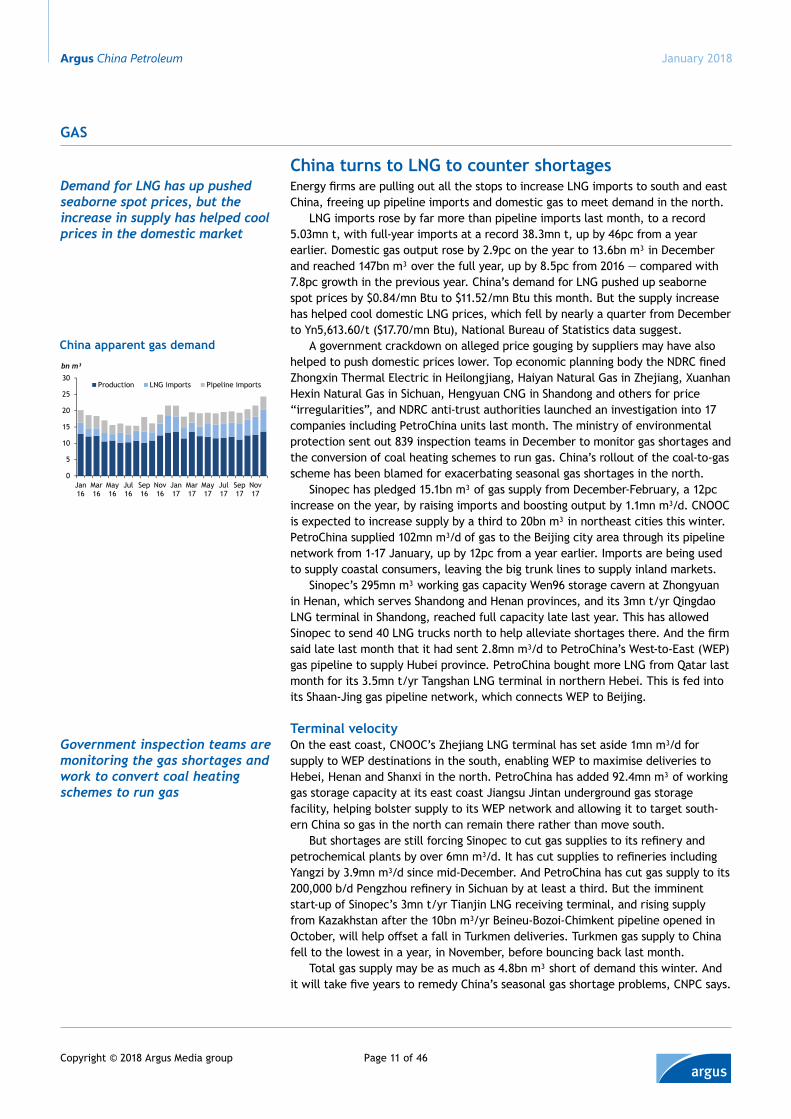
China turns to LNG to counter shortagesEnergy firms are pulling out all the stops to increase LNG imports to south and east China, freeing up pipeline imports and domestic gas to meet demand in the north.
LNG imports rose by far more than pipeline imports last month, to a record 5.03mn t, with full-year imports at a record 38.3mn t, up by 46pc from a year earlier. Domestic gas output rose by 2.9pc on the year to 13.6bn m³ in December and reached 147bn m³ over the full year, up by 8.5pc from 2016 — compared with 7.8pc growth in the previous year. China’s demand for LNG pushed up seaborne spot prices by $0.84/mn Btu to $11.52/mn Btu this month. But the supply increase has helped cool domestic LNG prices, which fell by nearly a quarter from December to Yn5,613.60/t ($17.70/mn Btu), National Bureau of Statistics data suggest.
A government crackdown on alleged price gouging by suppliers may have also helped to push domestic prices lower. Top economic planning body the NDRC fined Zhongxin Thermal Electric in Heilongjiang, Haiyan Natural Gas in Zhejiang, Xuanhan Hexin Natural Gas in Sichuan, Hengyuan CNG in Shandong and others for price “irregularities”, and NDRC anti-trust authorities launched an investigation into 17 companies including PetroChina units last month. The ministry of environmental protection sent out 839 inspection teams in December to monitor gas shortages and the conversion of coal heating schemes to run gas. China’s rollout of the coal-to-gas scheme has been blamed for exacerbating seasonal gas shortages in the north.
Sinopec has pledged 15.1bn m³ of gas supply from December-February, a 12pc increase on the year, by raising imports and boosting output by 1.1mn m³/d. CNOOC is expected to increase supply by a third to 20bn m³ in northeast cities this winter. PetroChina supplied 102mn m³/d of gas to the Beijing city area through its pipeline network from 1-17 January, up by 12pc from a year earlier. Imports are being used to supply coastal consumers, leaving the big trunk lines to supply inland markets.
Sinopec’s 295mn m³ working gas capacity Wen96 storage cavern at Zhongyuan in Henan, which serves Shandong and Henan provinces, and its 3mn t/yr Qingdao LNG terminal in Shandong, reached full capacity late last year. This has allowed Sinopec to send 40 LNG trucks north to help alleviate shortages there. And the firm said late last month that it had sent 2.8mn m³/d to PetroChina’s West-to-East (WEP) gas pipeline to supply Hubei province. PetroChina bought more LNG from Qatar last month for its 3.5mn t/yr Tangshan LNG terminal in northern Hebei. This is fed into its Shaan-Jing gas pipeline network, which connects WEP to Beijing.
Terminal velocityOn the east coast, CNOOC’s Zhejiang LNG terminal has set aside 1mn m³/d for supply to WEP destinations in the south, enabling WEP to maximise deliveries to Hebei, Henan and Shanxi in the north. PetroChina has added 92.4mn m³ of working gas storage capacity at its east coast Jiangsu Jintan underground gas storage facility, helping bolster supply to its WEP network and allowing it to target south-ern China so gas in the north can remain there rather than move south.
But shortages are still forcing Sinopec to cut gas supplies to its refinery and petrochemical plants by over 6mn m³/d. It has cut supplies to refineries including Yangzi by 3.9mn m³/d since mid-December. And PetroChina has cut gas supply to its 200,000 b/d Pengzhou refinery in Sichuan by at least a third. But the imminent start-up of Sinopec’s 3mn t/yr Tianjin LNG receiving terminal, and rising supply from Kazakhstan after the 10bn m³/yr Beineu-Bozoi-Chimkent pipeline opened in October, will help offset a fall in Turkmen deliveries. Turkmen gas supply to China fell to the lowest in a year, in November, before bouncing back last month.
Total gas supply may be as much as 4.8bn m³ short of demand this winter. And it will take five years to remedy China’s seasonal gas shortage problems, CNPC says.
China apparent gas demand
0
5
10
15
20
25
30
Jan16
Mar16
May16
Jul16
Sep16
Nov16
Jan17
Mar17
May17
Jul17
Sep17
Nov17
bn m³
Production LNG imports Pipeline imports
Gas
Demand for LNG has up pushed seaborne spot prices, but the increase in supply has helped cool prices in the domestic market
Government inspection teams are monitoring the gas shortages and work to convert coal heating schemes to run gas
Argus China Petroleum
Page 12 of 46Copyright © 2018 Argus Media group
January 2018
Xiamen
Quanzhou
V I E T N A M
L A O S
T H A I L A N D
M YA N M A R( B U R M A )
N E PA L
K Y R G Y Z S TA N
M O N G O L I A
R U S S I A
K A Z A K H S TA N
C H I N A
TA I W A N
Yang
tze ri
ver
Mekong river
NORTHKOREA
SOUTHKOREA
Yellow river
Karamay
Dushanzi
Ningbo
Xiamen
Changsha
Guiyang
Chongqing
Chengdu
Xianyang
Jingbian
Yalujiang
JiujiangYueyangJingmen
Weigang
Xi’an
Shijiazhuang
Wuhan
ShenzhenHuizhou
Zhenhai
ShanghaiNanjing
Cangzhou
RenqiuTianjin
BeijingDalian
Fushun
Tieling
Dandong
Lanzhou
Guangzhou
Yingkou
Qingdao
Luoyang
Jinzhou
Quanzhou
Hainan
Liaoyang
Zhumadian
Wanzhou
Ramree
ZhangshuFuzhou
— Argus
Ruili
Baoshan Guilin
Yan’an
Suzhou
Wenzhou
Meizhou
Taiyuan
AnyangHandan
Shenyang
TongziZunyi
Ganzhou
ShangraoXiangtanLoudi
Chenzhou
YanchengHuai’an
Rizhao
JilinChangchun
Kaifeng
Dali
Pengzhou
Leshan
Tongren
Rongchanga
Khabarovsk
Kozmino
Pearl river
ZhuhaiZhongshan
QinzhouMaoming
Lijiang
Wenshan
Lincang
Kunming
Chuxiong
Zhaotong
Beihai
Yuxi
Product pipeline
Product pipeline under construction
Planned product pipeline
Oil port
Key refineries
Planned refineries
Rail terminal
Nanchang
Zhuzhou
Zibo
Taizhou
Xinyi
DongmingPuyang
Pingxiang
LinyiHejian
Qinhuangdao
Jinan
Zhengzhou
Quzhou
Fuyang
Anqing
Suzhou
Huai’nanChuzhou
Hefei Ma’anshan
Zhanjiang
LiuzhouBaiseYangwei
Bengbu
NanningGuangxi
JianyangNeijiang
Jiangjin
Urumqi
China downstream infrastructure
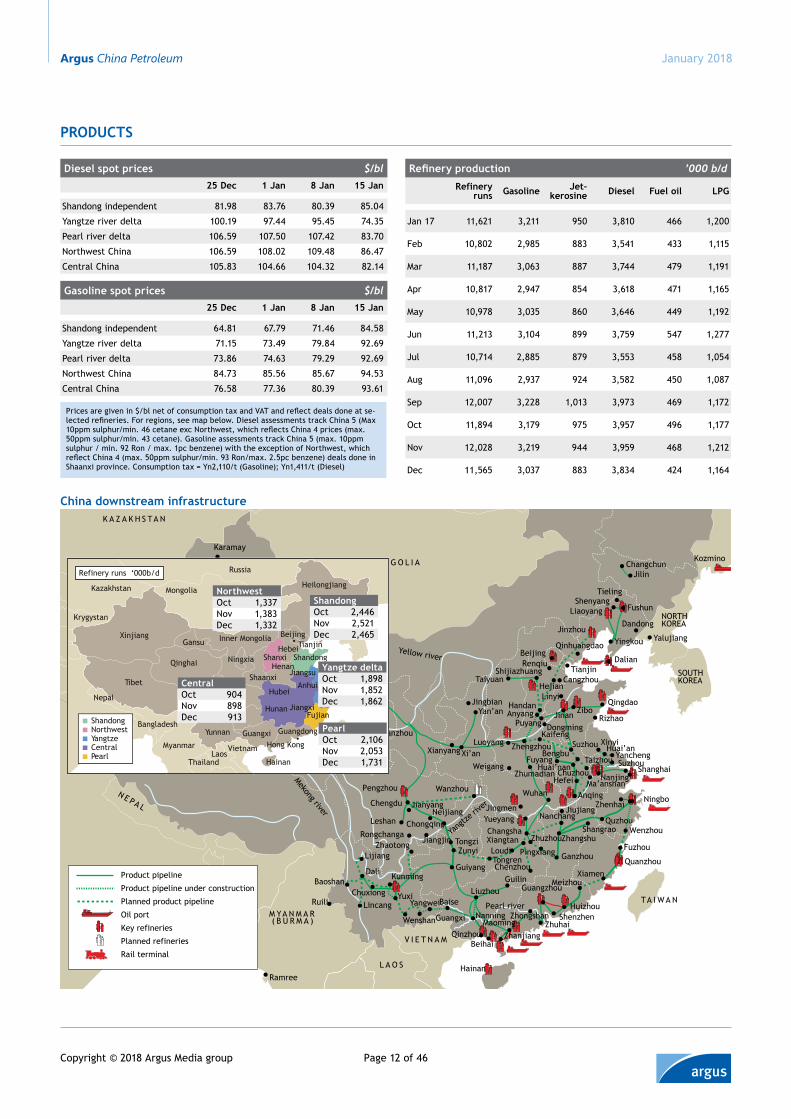
ProduCts
Prices are given in $/bl net of consumption tax and VAT and reflect deals done at se-lected refineries. For regions, see map below. Diesel assessments track China 5 (Max 10ppm sulphur/min. 46 cetane exc Northwest, which reflects China 4 prices (max. 50ppm sulphur/min. 43 cetane). Gasoline assessments track China 5 (max. 10ppm sulphur / min. 92 Ron / max. 1pc benzene) with the exception of Northwest, which reflect China 4 (max. 50ppm sulphur/min. 93 Ron/max. 2.5pc benzene) deals done in Shaanxi province. Consumption tax = Yn2,110/t (Gasoline); Yn1,411/t (Diesel)
Xinjiang
Tibet
Nepal
Kazakhstan
Bangladesh
Myanmar
Gansu
Qinghai
Inner Mongolia
Ningxia
Shaanxi
Hebei
Henan
Hunan
HubeiSichuan
Guangxi
Hainan
Guangdong
Hong Kong
Fujian
Anhui
Shandong
Tianjin
Liaoning
Jilin
Heilongjiang
Beijing
Jiangxi
YunnanIndiaShandongNorthwestYangtzeCentralPearl
Nepal
Shanxi
ThailandLaos
Vietnam
Krygystan
Russia
Mongolia
Refinery runs ‘000b/d
JiangsuCentralOct 904Nov 898Dec 913
NorthwestOct 1,337Nov 1,383Dec 1,332
PearlOct 2,106Nov 2,053Dec 1,731
Yangtze deltaOct 1,898Nov 1,852Dec 1,862
shandongOct 2,446Nov 2,521Dec 2,465
diesel spot prices $/bl25 dec 1 Jan 8 Jan 15 Jan
Shandong independent 81.98 83.76 80.39 85.04
Yangtze river delta 100.19 97.44 95.45 74.35
Pearl river delta 106.59 107.50 107.42 83.70
Northwest China 106.59 108.02 109.48 86.47
Central China 105.83 104.66 104.32 82.14
Gasoline spot prices $/bl25 dec 1 Jan 8 Jan 15 Jan
Shandong independent 64.81 67.79 71.46 84.58
Yangtze river delta 71.15 73.49 79.84 92.69
Pearl river delta 73.86 74.63 79.29 92.69
Northwest China 84.73 85.56 85.67 94.53
Central China 76.58 77.36 80.39 93.61
Refinery production ’000 b/d
Refinery runs Gasoline Jet-
kerosine diesel Fuel oil LPG
Jan 17 11,621 3,211 950 3,810 466 1,200
Feb 10,802 2,985 883 3,541 433 1,115
Mar 11,187 3,063 887 3,744 479 1,191
Apr 10,817 2,947 854 3,618 471 1,165
May 10,978 3,035 860 3,646 449 1,192
Jun 11,213 3,104 899 3,759 547 1,277
Jul 10,714 2,885 879 3,553 458 1,054
Aug 11,096 2,937 924 3,582 450 1,087
Sep 12,007 3,228 1,013 3,973 469 1,172
Oct 11,894 3,179 975 3,957 496 1,177
Nov 12,028 3,219 944 3,959 468 1,212
Dec 11,565 3,037 883 3,834 424 1,164
Argus China Petroleum
Page 13 of 46Copyright © 2018 Argus Media group
January 2018
Product Prices
China and Singapore refining margins
-505
1015202530354045
Jan Apr Jul Oct Jan Apr Jul Oct Jan
Gasoline crack spreadDiesel crack spread321 crack spread
$/bl
16 17 18
Gasoline and diesel marketing margins
-40
-30
-20
-10
0
10
20
30
2013 2014 2015 2016 2017 2018
Gasoline spot price differential to ex refineryDiesel spot price differential to ex refinery
$/bl
Gasoline and diesel retail margins
-70
-60
-50
-40
-30
-20
-10
0
10
2013 2014 2015 2016 2017 2018
Guangdong spot gasoline price differential to retailGuangdong spot diesel price differential to retail
$/bl
China basket price month 1 vs 2
0.0
0.1
0.2
0.3
0.4
0.5
0.6
0.7
30 Oct 30 Nov 31 Dec
$/bl
China basket = reference price used by NDRC to set retail price caps calculated as 40pc Ice Brent, 10pc Nymex WTI and 50pc Dubai plus freight to China
Month 2 = 0
Chinese retail price caps Yn/t90 Ron gasoline^ 10ppm diesel^
22 Jan 22 Dec 22 Jan 22 Dec
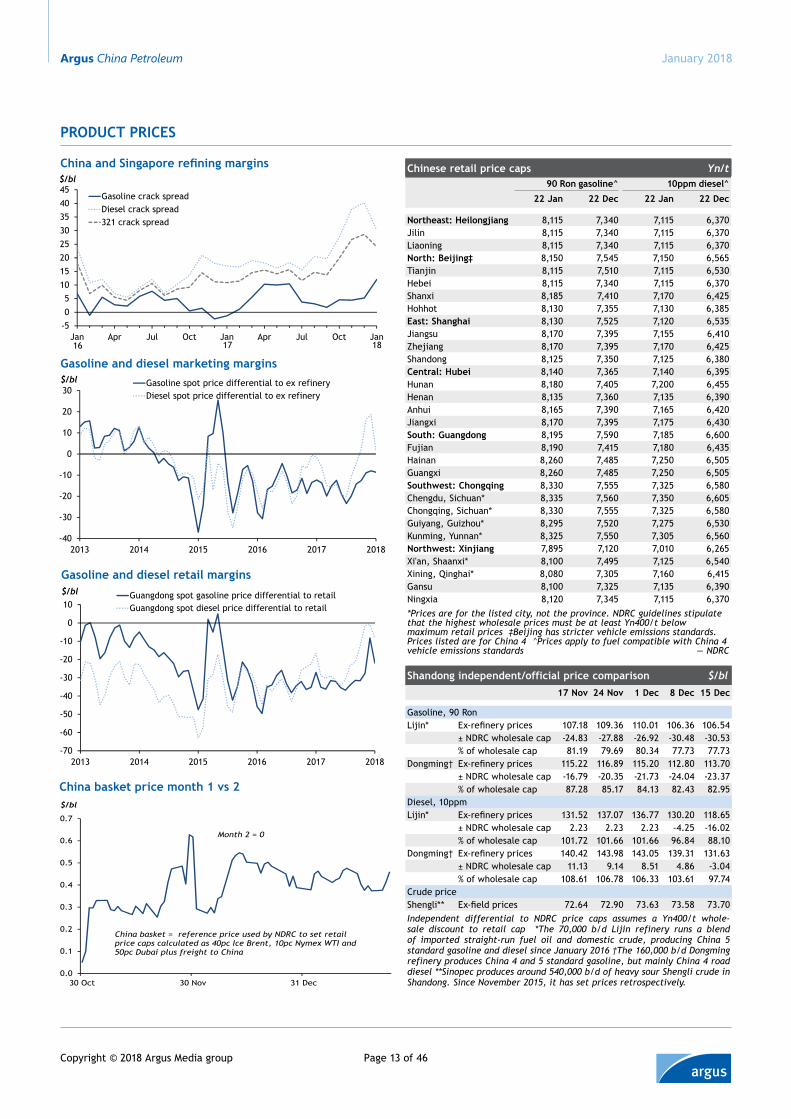
Northeast: Heilongjiang 8,115 7,340 7,115 6,370Jilin 8,115 7,340 7,115 6,370Liaoning 8,115 7,340 7,115 6,370North: Beijing‡ 8,150 7,545 7,150 6,565Tianjin 8,115 7,510 7,115 6,530Hebei 8,115 7,340 7,115 6,370Shanxi 8,185 7,410 7,170 6,425Hohhot 8,130 7,355 7,130 6,385East: Shanghai 8,130 7,525 7,120 6,535Jiangsu 8,170 7,395 7,155 6,410Zhejiang 8,170 7,395 7,170 6,425Shandong 8,125 7,350 7,125 6,380Central: Hubei 8,140 7,365 7,140 6,395Hunan 8,180 7,405 7,200 6,455Henan 8,135 7,360 7,135 6,390Anhui 8,165 7,390 7,165 6,420Jiangxi 8,170 7,395 7,175 6,430South: Guangdong 8,195 7,590 7,185 6,600Fujian 8,190 7,415 7,180 6,435Hainan 8,260 7,485 7,250 6,505Guangxi 8,260 7,485 7,250 6,505Southwest: Chongqing 8,330 7,555 7,325 6,580Chengdu, Sichuan* 8,335 7,560 7,350 6,605Chongqing, Sichuan* 8,330 7,555 7,325 6,580Guiyang, Guizhou* 8,295 7,520 7,275 6,530Kunming, Yunnan* 8,325 7,550 7,305 6,560Northwest: Xinjiang 7,895 7,120 7,010 6,265Xi'an, Shaanxi* 8,100 7,495 7,125 6,540Xining, Qinghai* 8,080 7,305 7,160 6,415Gansu 8,100 7,325 7,135 6,390Ningxia 8,120 7,345 7,115 6,370*Prices are for the listed city, not the province. NDRC guidelines stipulate that the highest wholesale prices must be at least Yn400/t below maximum retail prices ‡Beijing has stricter vehicle emissions standards. Prices listed are for China 4 ^Prices apply to fuel compatible with China 4 vehicle emissions standards — NDRC
Shandong independent/official price comparison $/bl 17 Nov 24 Nov 1 Dec 8 Dec 15 Dec
Gasoline, 90 RonLijin* Ex-refinery prices 107.18 109.36 110.01 106.36 106.54 ± NDRC wholesale cap -24.83 -27.88 -26.92 -30.48 -30.53 % of wholesale cap 81.19 79.69 80.34 77.73 77.73Dongming† Ex-refinery prices 115.22 116.89 115.20 112.80 113.70 ± NDRC wholesale cap -16.79 -20.35 -21.73 -24.04 -23.37 % of wholesale cap 87.28 85.17 84.13 82.43 82.95Diesel, 10ppmLijin* Ex-refinery prices 131.52 137.07 136.77 130.20 118.65 ± NDRC wholesale cap 2.23 2.23 2.23 -4.25 -16.02 % of wholesale cap 101.72 101.66 101.66 96.84 88.10Dongming† Ex-refinery prices 140.42 143.98 143.05 139.31 131.63 ± NDRC wholesale cap 11.13 9.14 8.51 4.86 -3.04 % of wholesale cap 108.61 106.78 106.33 103.61 97.74Crude priceShengli** Ex-field prices 72.64 72.90 73.63 73.58 73.70Independent differential to NDRC price caps assumes a Yn400/t whole-sale discount to retail cap *The 70,000 b/d Lijin refinery runs a blend of imported straight-run fuel oil and domestic crude, producing China 5 standard gasoline and diesel since January 2016 †The 160,000 b/d Dongming refinery produces China 4 and 5 standard gasoline, but mainly China 4 road diesel **Sinopec produces around 540,000 b/d of heavy sour Shengli crude in Shandong. Since November 2015, it has set prices retrospectively.
Argus China Petroleum
Page 14 of 46Copyright © 2018 Argus Media group
January 2018
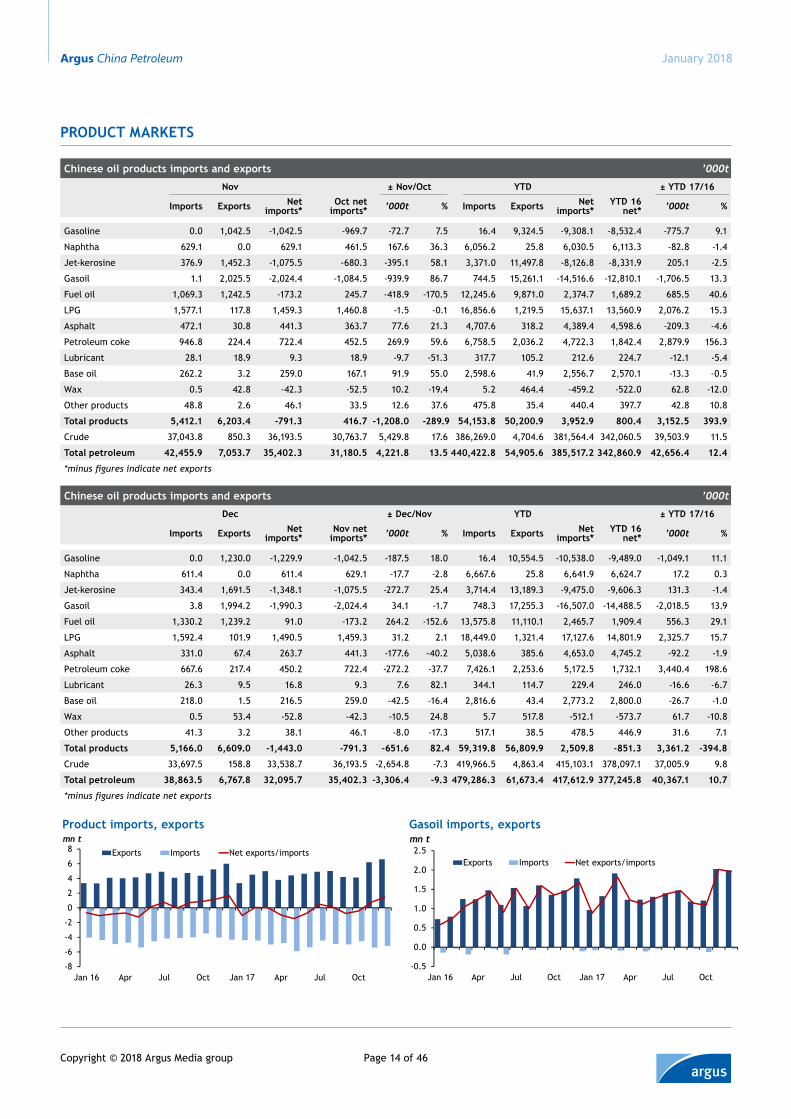
Chinese oil products imports and exports ’000t
Nov ± Nov/Oct YTD ± YTD 17/16
Imports Exports Net imports*
Oct net imports* ’000t % Imports Exports Net
imports*YTD 16
net* ’000t %
Gasoline 0.0 1,042.5 -1,042.5 -969.7 -72.7 7.5 16.4 9,324.5 -9,308.1 -8,532.4 -775.7 9.1
Naphtha 629.1 0.0 629.1 461.5 167.6 36.3 6,056.2 25.8 6,030.5 6,113.3 -82.8 -1.4
Jet-kerosine 376.9 1,452.3 -1,075.5 -680.3 -395.1 58.1 3,371.0 11,497.8 -8,126.8 -8,331.9 205.1 -2.5
Gasoil 1.1 2,025.5 -2,024.4 -1,084.5 -939.9 86.7 744.5 15,261.1 -14,516.6 -12,810.1 -1,706.5 13.3
Fuel oil 1,069.3 1,242.5 -173.2 245.7 -418.9 -170.5 12,245.6 9,871.0 2,374.7 1,689.2 685.5 40.6
LPG 1,577.1 117.8 1,459.3 1,460.8 -1.5 -0.1 16,856.6 1,219.5 15,637.1 13,560.9 2,076.2 15.3
Asphalt 472.1 30.8 441.3 363.7 77.6 21.3 4,707.6 318.2 4,389.4 4,598.6 -209.3 -4.6
Petroleum coke 946.8 224.4 722.4 452.5 269.9 59.6 6,758.5 2,036.2 4,722.3 1,842.4 2,879.9 156.3
Lubricant 28.1 18.9 9.3 18.9 -9.7 -51.3 317.7 105.2 212.6 224.7 -12.1 -5.4
Base oil 262.2 3.2 259.0 167.1 91.9 55.0 2,598.6 41.9 2,556.7 2,570.1 -13.3 -0.5
Wax 0.5 42.8 -42.3 -52.5 10.2 -19.4 5.2 464.4 -459.2 -522.0 62.8 -12.0
Other products 48.8 2.6 46.1 33.5 12.6 37.6 475.8 35.4 440.4 397.7 42.8 10.8
Total products 5,412.1 6,203.4 -791.3 416.7 -1,208.0 -289.9 54,153.8 50,200.9 3,952.9 800.4 3,152.5 393.9
Crude 37,043.8 850.3 36,193.5 30,763.7 5,429.8 17.6 386,269.0 4,704.6 381,564.4 342,060.5 39,503.9 11.5
Total petroleum 42,455.9 7,053.7 35,402.3 31,180.5 4,221.8 13.5 440,422.8 54,905.6 385,517.2 342,860.9 42,656.4 12.4
*minus figures indicate net exports
PrODuCT MArkETs
Product imports, exports
-8
-6
-4
-2
0
2
4
6
8
Jan 16 Apr Jul Oct Jan 17 Apr Jul Oct
Exports Imports Net exports/imports
mn tGasoil imports, exports
-0.5
0.0
0.5
1.0
1.5
2.0
2.5
Jan 16 Apr Jul Oct Jan 17 Apr Jul Oct
Exports Imports Net exports/imports
mn t
Chinese oil products imports and exports ’000t
Dec ± Dec/Nov YTD ± YTD 17/16
Imports Exports Net imports*
Nov net imports* ’000t % Imports Exports Net
imports*YTD 16
net* ’000t %
Gasoline 0.0 1,230.0 -1,229.9 -1,042.5 -187.5 18.0 16.4 10,554.5 -10,538.0 -9,489.0 -1,049.1 11.1
Naphtha 611.4 0.0 611.4 629.1 -17.7 -2.8 6,667.6 25.8 6,641.9 6,624.7 17.2 0.3
Jet-kerosine 343.4 1,691.5 -1,348.1 -1,075.5 -272.7 25.4 3,714.4 13,189.3 -9,475.0 -9,606.3 131.3 -1.4
Gasoil 3.8 1,994.2 -1,990.3 -2,024.4 34.1 -1.7 748.3 17,255.3 -16,507.0 -14,488.5 -2,018.5 13.9
Fuel oil 1,330.2 1,239.2 91.0 -173.2 264.2 -152.6 13,575.8 11,110.1 2,465.7 1,909.4 556.3 29.1
LPG 1,592.4 101.9 1,490.5 1,459.3 31.2 2.1 18,449.0 1,321.4 17,127.6 14,801.9 2,325.7 15.7
Asphalt 331.0 67.4 263.7 441.3 -177.6 -40.2 5,038.6 385.6 4,653.0 4,745.2 -92.2 -1.9
Petroleum coke 667.6 217.4 450.2 722.4 -272.2 -37.7 7,426.1 2,253.6 5,172.5 1,732.1 3,440.4 198.6
Lubricant 26.3 9.5 16.8 9.3 7.6 82.1 344.1 114.7 229.4 246.0 -16.6 -6.7
Base oil 218.0 1.5 216.5 259.0 -42.5 -16.4 2,816.6 43.4 2,773.2 2,800.0 -26.7 -1.0
Wax 0.5 53.4 -52.8 -42.3 -10.5 24.8 5.7 517.8 -512.1 -573.7 61.7 -10.8
Other products 41.3 3.2 38.1 46.1 -8.0 -17.3 517.1 38.5 478.5 446.9 31.6 7.1
Total products 5,166.0 6,609.0 -1,443.0 -791.3 -651.6 82.4 59,319.8 56,809.9 2,509.8 -851.3 3,361.2 -394.8
Crude 33,697.5 158.8 33,538.7 36,193.5 -2,654.8 -7.3 419,966.5 4,863.4 415,103.1 378,097.1 37,005.9 9.8
Total petroleum 38,863.5 6,767.8 32,095.7 35,402.3 -3,306.4 -9.3 479,286.3 61,673.4 417,612.9 377,245.8 40,367.1 10.7
*minus figures indicate net exports
Argus China Petroleum
Page 15 of 46Copyright © 2018 Argus Media group
January 2018
Product markets
diesel exports and margins
Gasoline exports and margins
0
50
100
150
200
250
300
350
-20
-15
-10
-5
0
5
10
15
2015 2016 2017
Gasoline export margins with 1 month lag (LHS)Net gasoline exports (RHS)
’000 b/d$/bl
Singapore refining margins
-15
-10
-5
0
5
10
15
20
25
2014 2015 2016 2017 2018
Gasoline Naphtha Jet Diesel Heating oil Fuel oil$/bl
five-day rolling averages0
50
100
150
200
250
300
350
400
450
500
-30
-25
-20
-15
-10
-5
0
5
10
2015 2016 2017
Diesel export margins with 1 month lag (LHS)
Net diesel exports (RHS)
’000 b/d$/bl
*three-month moving average
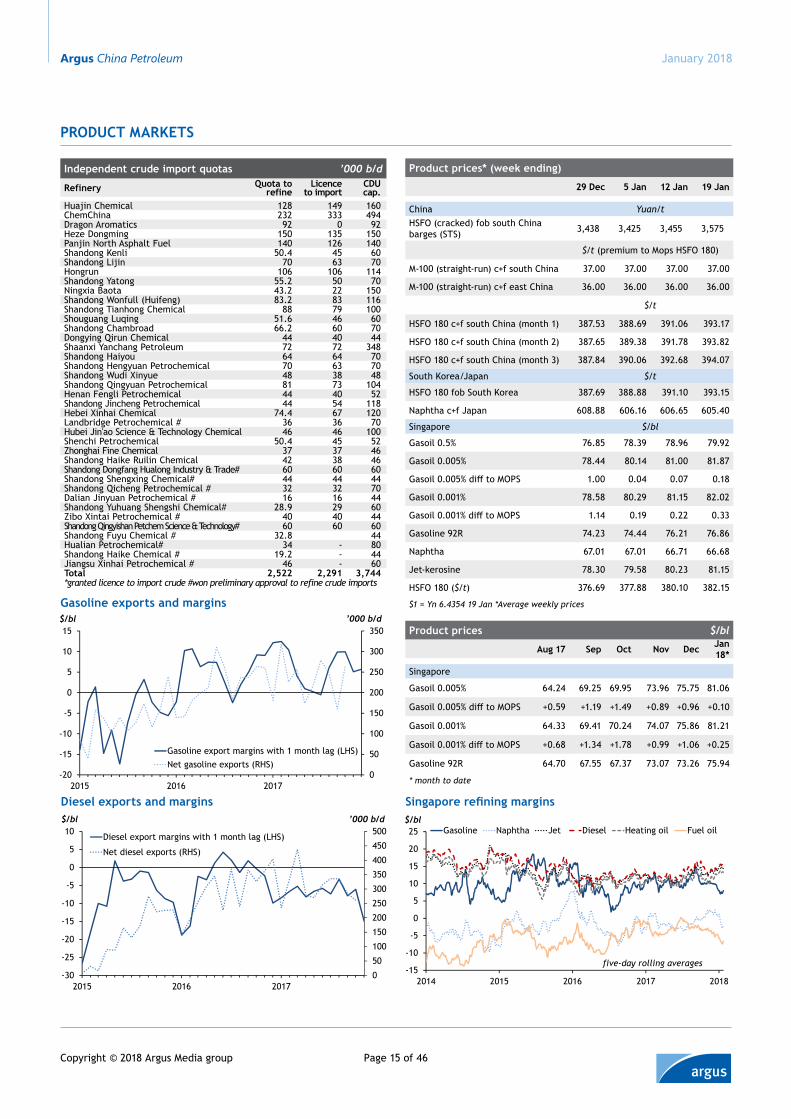
Product prices $/bl
aug 17 sep oct Nov dec Jan 18*
Singapore
Gasoil 0.005% 64.24 69.25 69.95 73.96 75.75 81.06
Gasoil 0.005% diff to MOPS +0.59 +1.19 +1.49 +0.89 +0.96 +0.10
Gasoil 0.001% 64.33 69.41 70.24 74.07 75.86 81.21
Gasoil 0.001% diff to MOPS +0.68 +1.34 +1.78 +0.99 +1.06 +0.25
Gasoline 92R 64.70 67.55 67.37 73.07 73.26 75.94
* month to date
Product prices* (week ending)
29 dec 5 Jan 12 Jan 19 Jan
China Yuan/tHSFO (cracked) fob south China barges (STS) 3,438 3,425 3,455 3,575
$/t (premium to Mops HSFO 180)
M-100 (straight-run) c+f south China 37.00 37.00 37.00 37.00
M-100 (straight-run) c+f east China 36.00 36.00 36.00 36.00
$/t
HSFO 180 c+f south China (month 1) 387.53 388.69 391.06 393.17
HSFO 180 c+f south China (month 2) 387.65 389.38 391.78 393.82
HSFO 180 c+f south China (month 3) 387.84 390.06 392.68 394.07
South Korea/Japan $/t
HSFO 180 fob South Korea 387.69 388.88 391.10 393.15
Naphtha c+f Japan 608.88 606.16 606.65 605.40
Singapore $/bl
Gasoil 0.5% 76.85 78.39 78.96 79.92
Gasoil 0.005% 78.44 80.14 81.00 81.87
Gasoil 0.005% diff to MOPS 1.00 0.04 0.07 0.18
Gasoil 0.001% 78.58 80.29 81.15 82.02
Gasoil 0.001% diff to MOPS 1.14 0.19 0.22 0.33
Gasoline 92R 74.23 74.44 76.21 76.86
Naphtha 67.01 67.01 66.71 66.68
Jet-kerosine 78.30 79.58 80.23 81.15
HSFO 180 ($/t) 376.69 377.88 380.10 382.15
$1 = Yn 6.4354 19 Jan *Average weekly prices
Independent crude import quotas ’000 b/d
refinery Quota to refine
Licence to import
cdu cap.
Huajin Chemical 128 149 160ChemChina 232 333 494Dragon Aromatics 92 0 92Heze Dongming 150 135 150Panjin North Asphalt Fuel 140 126 140Shandong Kenli 50.4 45 60Shandong Lijin 70 63 70Hongrun 106 106 114Shandong Yatong 55.2 50 70Ningxia Baota 43.2 22 150Shandong Wonfull (Huifeng) 83.2 83 116Shandong Tianhong Chemical 88 79 100Shouguang Luqing 51.6 46 60Shandong Chambroad 66.2 60 70Dongying Qirun Chemical 44 40 44Shaanxi Yanchang Petroleum 72 72 348Shandong Haiyou 64 64 70Shandong Hengyuan Petrochemical 70 63 70Shandong Wudi Xinyue 48 38 48Shandong Qingyuan Petrochemical 81 73 104Henan Fengli Petrochemical 44 40 52Shandong Jincheng Petrochemical 44 54 118Hebei Xinhai Chemical 74.4 67 120Landbridge Petrochemical # 36 36 70Hubei Jin'ao Science & Technology Chemical 46 46 100Shenchi Petrochemical 50.4 45 52Zhonghai Fine Chemical 37 37 46Shandong Haike Ruilin Chemical 42 38 46Shandong Dongfang Hualong Industry & Trade# 60 60 60Shandong Shengxing Chemical# 44 44 44Shandong Qicheng Petrochemical # 32 32 70Dalian Jinyuan Petrochemical # 16 16 44Shandong Yuhuang Shengshi Chemical# 28.9 29 60Zibo Xintai Petrochemical # 40 40 44Shandong Qingyishan Petchem Science & Technology# 60 60 60Shandong Fuyu Chemical # 32.8 44Hualian Petrochemical# 34 - 80Shandong Haike Chemical # 19.2 - 44Jiangsu Xinhai Petrochemical # 46 - 60total 2,522 2,291 3,744*granted licence to import crude #won preliminary approval to refine crude imports
Argus China Petroleum
Page 16 of 46Copyright © 2018 Argus Media group
January 2018
Products
crude
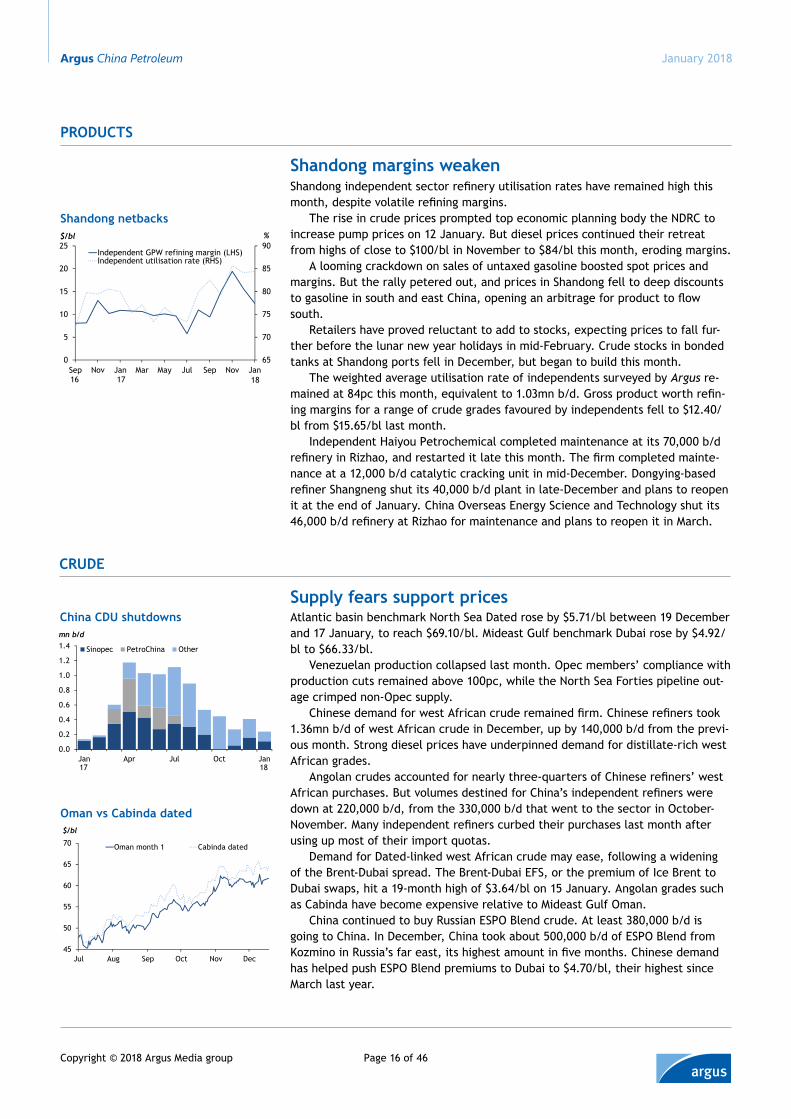
supply fears support pricesAtlantic basin benchmark North Sea Dated rose by $5.71/bl between 19 December and 17 January, to reach $69.10/bl. Mideast Gulf benchmark Dubai rose by $4.92/bl to $66.33/bl.
Venezuelan production collapsed last month. Opec members’ compliance with production cuts remained above 100pc, while the North Sea Forties pipeline out-age crimped non-Opec supply.
Chinese demand for west African crude remained firm. Chinese refiners took 1.36mn b/d of west African crude in December, up by 140,000 b/d from the previ-ous month. Strong diesel prices have underpinned demand for distillate-rich west African grades.
Angolan crudes accounted for nearly three-quarters of Chinese refiners’ west African purchases. But volumes destined for China’s independent refiners were down at 220,000 b/d, from the 330,000 b/d that went to the sector in October-November. Many independent refiners curbed their purchases last month after using up most of their import quotas.
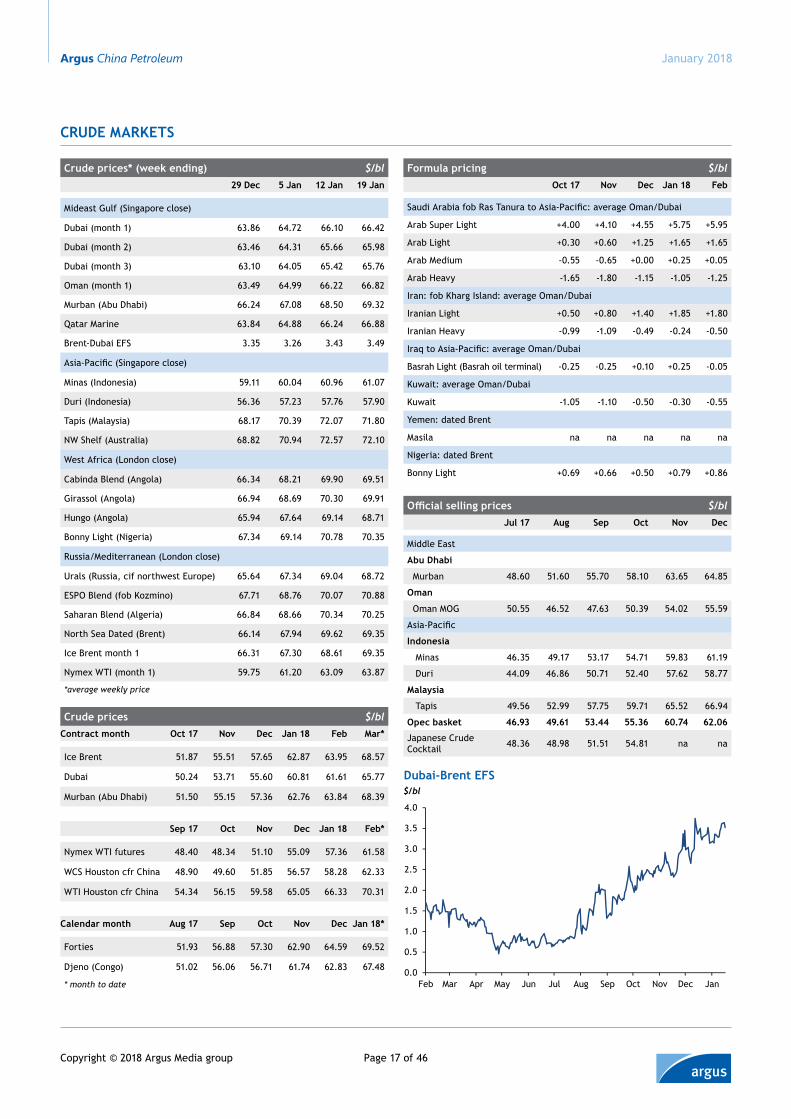
Demand for Dated-linked west African crude may ease, following a widening of the Brent-Dubai spread. The Brent-Dubai EFS, or the premium of Ice Brent to Dubai swaps, hit a 19-month high of $3.64/bl on 15 January. Angolan grades such as Cabinda have become expensive relative to Mideast Gulf Oman.
China continued to buy Russian ESPO Blend crude. At least 380,000 b/d is going to China. In December, China took about 500,000 b/d of ESPO Blend from Kozmino in Russia’s far east, its highest amount in five months. Chinese demand has helped push ESPO Blend premiums to Dubai to $4.70/bl, their highest since March last year.
shandong margins weakenShandong independent sector refinery utilisation rates have remained high this month, despite volatile refining margins.
The rise in crude prices prompted top economic planning body the NDRC to increase pump prices on 12 January. But diesel prices continued their retreat from highs of close to $100/bl in November to $84/bl this month, eroding margins.
A looming crackdown on sales of untaxed gasoline boosted spot prices and margins. But the rally petered out, and prices in Shandong fell to deep discounts to gasoline in south and east China, opening an arbitrage for product to flow south.
Retailers have proved reluctant to add to stocks, expecting prices to fall fur-ther before the lunar new year holidays in mid-February. Crude stocks in bonded tanks at Shandong ports fell in December, but began to build this month.
The weighted average utilisation rate of independents surveyed by Argus re-mained at 84pc this month, equivalent to 1.03mn b/d. Gross product worth refin-ing margins for a range of crude grades favoured by independents fell to $12.40/bl from $15.65/bl last month.
Independent Haiyou Petrochemical completed maintenance at its 70,000 b/d refinery in Rizhao, and restarted it late this month. The firm completed mainte-nance at a 12,000 b/d catalytic cracking unit in mid-December. Dongying-based refiner Shangneng shut its 40,000 b/d plant in late-December and plans to reopen it at the end of January. China Overseas Energy Science and Technology shut its 46,000 b/d refinery at Rizhao for maintenance and plans to reopen it in March.
china cdu shutdowns
0.0
0.2
0.4
0.6
0.8
1.0
1.2
1.4
Jan Apr Jul Oct Jan
Sinopec PetroChina Other
mn b/d
17 18
shandong netbacks
65
70
75
80
85
90
0
5
10
15
20
25
Sep Nov Jan Mar May Jul Sep Nov Jan16
Independent GPW refining margin (LHS)Independent utilisation rate (RHS)
$/bl
17
%
18
45
50
55
60
65
70
Jul Aug Sep Oct Nov Dec
Oman month 1 Cabinda dated
$/bl
oman vs cabinda dated
Argus China Petroleum
Page 17 of 46Copyright © 2018 Argus Media group
January 2018
Crude markets
dubai-Brent eFs
0.0
0.5
1.0
1.5
2.0
2.5
3.0
3.5
4.0
Feb Mar Apr May Jun Jul Aug Sep Oct Nov Dec Jan
$/bl
Crude prices* (week ending) $/bl29 dec 5 Jan 12 Jan 19 Jan
Mideast Gulf (Singapore close)
Dubai (month 1) 63.86 64.72 66.10 66.42
Dubai (month 2) 63.46 64.31 65.66 65.98
Dubai (month 3) 63.10 64.05 65.42 65.76
Oman (month 1) 63.49 64.99 66.22 66.82
Murban (Abu Dhabi) 66.24 67.08 68.50 69.32
Qatar Marine 63.84 64.88 66.24 66.88
Brent-Dubai EFS 3.35 3.26 3.43 3.49
Asia-Pacific (Singapore close)
Minas (Indonesia) 59.11 60.04 60.96 61.07
Duri (Indonesia) 56.36 57.23 57.76 57.90
Tapis (Malaysia) 68.17 70.39 72.07 71.80
NW Shelf (Australia) 68.82 70.94 72.57 72.10
West Africa (London close)
Cabinda Blend (Angola) 66.34 68.21 69.90 69.51
Girassol (Angola) 66.94 68.69 70.30 69.91
Hungo (Angola) 65.94 67.64 69.14 68.71
Bonny Light (Nigeria) 67.34 69.14 70.78 70.35
Russia/Mediterranean (London close)
Urals (Russia, cif northwest Europe) 65.64 67.34 69.04 68.72
ESPO Blend (fob Kozmino) 67.71 68.76 70.07 70.88
Saharan Blend (Algeria) 66.84 68.66 70.34 70.25
North Sea Dated (Brent) 66.14 67.94 69.62 69.35
Ice Brent month 1 66.31 67.30 68.61 69.35
Nymex WTI (month 1) 59.75 61.20 63.09 63.87
*average weekly price
Formula pricing $/bl Oct 17 Nov dec Jan 18 Feb
Saudi Arabia fob Ras Tanura to Asia-Pacific: average Oman/Dubai
Arab Super Light +4.00 +4.10 +4.55 +5.75 +5.95
Arab Light +0.30 +0.60 +1.25 +1.65 +1.65
Arab Medium -0.55 -0.65 +0.00 +0.25 +0.05
Arab Heavy -1.65 -1.80 -1.15 -1.05 -1.25
Iran: fob Kharg Island: average Oman/Dubai
Iranian Light +0.50 +0.80 +1.40 +1.85 +1.80
Iranian Heavy -0.99 -1.09 -0.49 -0.24 -0.50
Iraq to Asia-Pacific: average Oman/Dubai
Basrah Light (Basrah oil terminal) -0.25 -0.25 +0.10 +0.25 -0.05
Kuwait: average Oman/Dubai
Kuwait -1.05 -1.10 -0.50 -0.30 -0.55
Yemen: dated Brent
Masila na na na na na
Nigeria: dated Brent
Bonny Light +0.69 +0.66 +0.50 +0.79 +0.86
Official selling prices $/blJul 17 aug sep Oct Nov dec
Middle East
abu dhabi
Murban 48.60 51.60 55.70 58.10 63.65 64.85
Oman
Oman MOG 50.55 46.52 47.63 50.39 54.02 55.59
Asia-Pacific
Indonesia
Minas 46.35 49.17 53.17 54.71 59.83 61.19
Duri 44.09 46.86 50.71 52.40 57.62 58.77
malaysia
Tapis 49.56 52.99 57.75 59.71 65.52 66.94
Opec basket 46.93 49.61 53.44 55.36 60.74 62.06
Japanese Crude Cocktail 48.36 48.98 51.51 54.81 na na
Crude prices $/blContract month Oct 17 Nov dec Jan 18 Feb mar*
Ice Brent 51.87 55.51 57.65 62.87 63.95 68.57
Dubai 50.24 53.71 55.60 60.81 61.61 65.77
Murban (Abu Dhabi) 51.50 55.15 57.36 62.76 63.84 68.39
sep 17 Oct Nov dec Jan 18 Feb*
Nymex WTI futures 48.40 48.34 51.10 55.09 57.36 61.58
WCS Houston cfr China 48.90 49.60 51.85 56.57 58.28 62.33
WTI Houston cfr China 54.34 56.15 59.58 65.05 66.33 70.31
Calendar month aug 17 sep Oct Nov dec Jan 18*
Forties 51.93 56.88 57.30 62.90 64.59 69.52
Djeno (Congo) 51.02 56.06 56.71 61.74 62.83 67.48
* month to date
Argus China Petroleum
Page 18 of 46Copyright © 2018 Argus Media group
January 2018
Crude imports/exports
China’s crude imports by origin and exports by destinationimports by origin Nov ± oct Ytd ± Ytd 17/16
’000t ’000 b/d ±’000 b/d ±% ’000t ’000 b/d ±’000 b/d ±%
middle east 16,672.3 4,064.7 733.5 22.0 167,973.8 3,679.8 46.5 1.3Saudi Arabia 4,339.9 1,056.0 -30.4 -2.8 47,474.3 1,037.6 4.1 0.4Iran 2,292.6 556.3 -126.9 -18.6 28,724.0 626.1 9.6 1.6Oman 2,683.4 656.6 318.7 94.3 28,401.4 624.2 -62.2 -9.1Yemen 267.7 66.2 66.2 na 1,567.4 34.8 27.1 351.9UAE 738.1 185.0 23.1 14.3 9,471.9 213.3 -22.4 -9.5Kuwait 2,144.6 519.7 82.8 19.0 16,508.1 359.3 36.9 11.4Iraq 4,205.9 1,024.8 400.1 64.0 34,950.1 764.9 43.0 6.0Qatar 876.5 19.6 10.4 112.3Africa 6,930.2 1,681.5 237.8 16.5 76,524.5 1,667.9 322.1 23.9Angola 3,802.0 918.8 84.7 10.2 47,258.4 1,025.8 152.5 17.5Sudan 83.5 20.2 20.2 na 720.7 15.7 -4.9 -23.8Congo (Brazzaville) 1,197.4 291.8 130.1 80.5 8,129.0 177.9 39.5 28.5Congo (DRC) 590.7 12.9 6.3 95.7Equatorial Guinea 394.2 95.5 95.5 na 2,290.4 49.9 27.5 123.1Libya 554.2 136.1 136.1 na 3,003.6 66.3 52.2 371.3Nigeria 1,205.0 26.7 8.0 42.6Algeria -68.2 -100.1 268.8 6.3 6.3 naChad 586.5 11.9 4.7 65.8Egypt 242.1 57.5 25.7 80.6 1,902.5 40.6 29.6 267.6Gabon 128.7 31.6 -82.6 -72.3 3,559.2 78.4 18.2 30.2Cameroon 136.3 32.5 2.6 8.7 656.2 14.0 5.7 68.5Ghana 247.1 62.2 -32.4 -34.3 3,243.7 73.3 21.4 41.2South Sudan 144.6 35.2 -74.0 -67.7 3,110.0 68.1 -39.2 -36.6Fsu/europe 6,379.5 1,584.9 227.4 16.8 67,343.9 1,498.8 258.6 20.9Russia 5,120.1 1,271.5 154.3 13.8 54,765.5 1,218.3 166.1 15.8Kazakhstan 364.4 92.1 38.7 72.5 2,356.1 53.5 -15.1 -22.0Norway -32.5 -99.9 1,147.4 25.5 10.3 67.6UK 894.9 221.3 67.0 43.4 7,793.1 173.1 84.1 94.5Azerbaijan 1,281.7 28.4 13.2 86.8Americas 5,829.6 1,407.6 434.2 44.6 60,166.4 1,296.6 288.3 28.6Venezuela 1,489.5 348.5 141.8 68.6 19,603.0 412.0 26.3 6.8Brazil 1,880.7 454.5 187.7 70.4 20,978.9 455.4 96.4 26.9Argentina 145.2 35.0 0.5 1.4 1,277.1 27.7 -0.7 -2.5Ecuador -56.6 -99.9 1,362.8 28.0 10.8 63.0Colombia 1,129.6 280.9 144.9 106.6 8,383.3 187.2 5.1 2.8Canada 586.4 13.0 9.5 268.4US 1,184.6 288.7 81.5 39.3 6,818.8 149.2 138.6 1,307.5Mexico -65.6 -100.1 1,156.1 24.1 4.9 25.5Asia-pacific 1,232.4 310.6 80.8 35.2 14,135.8 321.3 16.7 5.5Indonesia 268.2 65.8 41.6 171.7 1,485.7 32.7 -29.8 -47.6Vietnam 177.9 45.0 15.6 53.0 2,193.5 49.8 -41.8 -45.6Thailand -8.7 -99.6 812.3 18.8 -0.8 -4.1Brunei 593.1 13.3 6.9 109.0Malaysia 537.6 136.6 33.6 32.6 5,997.9 136.8 102.7 300.9Australia 163.6 42.5 0.1 na 2,101.1 49.1 -19.6 -28.5Mongolia 85.0 20.7 -1.2 -5.5 952.2 20.8 -0.9 -4.1total imports 37,043.8 9,049.4 1,713.8 23.4 386,144.4 8,464.4 932.2 12.4of which:Opec* 19,835.1 4,811.3 628.1 15.0 212,192.3 4,618.7 325.0 7.6Opec* % 53.2 (Nov) 57 (Oct) 54.6 (YTD 17) 57 (YTD 16)Middle East % 44.9 (Nov) 45.4 (Oct) 43.5 (YTD 17) 48.2 (YTD 16)Africa % 18.6 (Nov) 19.7 (Oct) 19.7 (YTD 17) 17.9 (YTD 16)FSU % 15.1 (Nov) 16 (Oct) 17.7 (YTD 17) 16.5 (YTD 16)exports by destination ’000t ’000 b/d ±’000 b/d ±% ’000t ’000 b/d ±’000 b/d ±%South Korea 1,089.6 23.2 4.5 24.1Indonesia 84.3 19.9 19.9 na 167.8 3.6 3.6 naUS 225.0 4.8 1.0 26.2Japan 161.7 38.3 -22.7 -37.2 1,856.9 39.5 14.5 58.1Singapore 199.2 4.2 -0.7 -14.2Malaysia 391.9 8.3 8.3 naThailand 253.8 60.1 60.1 na 327.7 7.0 4.3 161.0Philippines 91.4 21.6 21.6 na 187.4 4.0 4.0 naHong Kong 259.1 61.3 61.3 na 259.1 5.5 5.5 natotal exports 850.3 201.2 140.2 229.8 4,704.6 100.0 45.0 81.8
Net crude imports 36,193.5 8,848.2 1,573.6 21.6 381,439.8 8,364.4 887.2 11.9Crude production 15,690.0 3,765.6 -8.4 -0.2 175,638.0 3,786.2 -145.1 -3.7Apparent crude demand 51,883.5 12,613.8 1,565.2 14.2 557,077.8 12,150.6 742.1 6.5Refinery runs 49,429.0 11,096.0 -777.0 -6.5 518,622.0 11,304.9 598.6 5.6Unaccounted for crude † 2,454.5 1,517.8 2,342.2 -284.1 38,455.8 686.6 -15.6 -2.2Crude import dependency % 70.1 (Nov) 65.8 (Oct) 68.8 (YTD 17) 65.5 (YTD 16)Net products imports 1,059.2 353.2 115.2 48.4 23,247.7 620.0 9,207.6 148.6Net petroleum imports 37,252.7 9,201.4 1,688.8 22.5 404,687.5 8,984.4 1,090.0 13.8Apparent petroleum demand 52,942.7 12,967.0 1,680.4 14.9 580,325.5 12,770.6 944.9 8.0Petroleum import dependency % 71 (Nov) 66.6 (Oct) 70.4 (YTD 17) 66.8 (YTD 16)*includes Ecuador from Dec '07 and Angola from Jan '07. Back data adjusted to include Ecuador and Angola †Apparent crude demand minus refinery runs. This includes storage gains and heavy crude run in specialist 'asphalt factories' which are not officially regarded as refineries
— Imports and exports data from China General Administration of Customs
Argus China Petroleum
Page 19 of 46Copyright © 2018 Argus Media group
January 2018
Crude imports/exports
China’s crude imports by origin and exports by destinationimports by origin dec ± Nov Ytd ± Ytd 17/16
’000t ’000 b/d ±’000 b/d ±% ’000t ’000 b/d ±’000 b/d ±%
middle east 14,222.4 3,355.6 -709.1 -17.4 182,196.3 3,652.3 -7.0 -0.2Saudi Arabia 4,709.6 1,109.0 53.0 5.0 52,183.9 1,043.7 26.4 2.6Iran 2,426.0 569.7 13.4 2.4 31,150.0 621.3 -1.2 -0.2Oman 2,608.1 617.5 -39.0 -5.9 31,009.5 623.6 -79.7 -11.3Yemen -66.2 -100.0 1,567.4 31.9 23.7 290.4UAE 690.4 167.5 -17.5 -9.5 10,162.3 209.4 -41.0 -16.4Kuwait 1,736.4 407.2 -112.5 -21.6 18,244.5 363.4 38.8 12.0Iraq 1,914.4 451.4 -573.4 -56.0 36,864.6 738.3 15.0 2.1Qatar 137.5 33.2 33.2 na 1,014.1 20.8 11.0 112.0Africa 5,974.9 1,404.9 -276.6 -16.4 82,499.4 1,645.6 296.6 22.0Angola 3,171.5 741.7 -177.1 -19.3 50,429.9 1,001.7 135.0 15.6Sudan -20.2 -99.8 720.7 14.4 -6.4 -30.9Congo (Brazzaville) 756.4 178.4 -113.4 -38.9 8,885.4 178.0 39.3 28.3Congo (DRC) 590.7 11.8 5.8 96.3Equatorial Guinea 137.3 32.2 -63.3 -66.3 2,427.7 48.4 25.2 108.7Libya 219.5 52.2 -84.0 -61.7 3,223.0 65.1 44.6 218.0Nigeria 1,205.0 24.5 7.3 42.5Algeria 268.8 5.8 5.8 naChad 586.5 10.9 4.3 65.7Egypt 181.3 41.7 -15.8 -27.5 2,083.9 40.7 27.9 218.3Gabon 251.9 59.8 28.2 89.3 3,811.1 76.8 12.9 20.2South Africa 546.3 130.1 130.1 na 546.3 11.0 5.7 106.9Cameroon 134.6 31.1 -1.4 -4.3 790.8 15.5 7.9 103.8Ghana 253.1 61.6 -0.6 -1.0 3,496.8 72.3 19.5 36.9South Sudan 322.9 76.1 40.9 116.0 3,432.9 68.8 -38.4 -35.8Fsu/europe 6,098.4 1,465.4 -119.5 -7.5 73,442.2 1,495.7 226.8 17.9Russia 5,030.9 1,209.0 -62.5 -4.9 59,796.4 1,217.2 151.9 14.3Kazakhstan 146.0 35.7 -56.4 -61.3 2,502.1 52.0 -15.0 -22.4Norway 274.4 65.8 65.8 na 1,421.8 28.9 12.2 72.9UK 647.1 154.9 -66.5 -30.0 8,440.2 171.6 71.1 70.8Azerbaijan 1,281.7 26.0 6.7 34.7Americas 6,566.4 1,525.8 118.2 8.4 66,732.8 1,316.1 283.2 27.4Venezuela 2,167.3 490.8 142.3 40.8 21,770.3 418.7 32.1 8.3Brazil 2,104.2 492.1 37.6 8.3 23,083.1 458.5 79.4 20.9Argentina 148.6 34.7 -0.3 na 1,425.7 28.3 -3.5 -11.0Ecuador 100.6 22.3 22.3 na 1,463.3 27.5 6.1 28.5Colombia 1,068.8 257.2 -23.7 -8.4 9,452.1 193.2 13.7 7.6Canada 586.4 11.9 8.6 265.4US 835.5 197.0 -91.6 -31.7 7,654.3 153.3 143.6 1,480.4Mexico 141.4 31.8 31.8 na 1,297.6 24.7 5.7 30.0Asia-pacific 835.5 204.4 -106.2 -34.2 14,971.2 311.4 -1.3 -0.4Indonesia -65.8 -100.0 1,485.7 30.0 -27.3 -47.7Vietnam 167.2 40.9 -4.1 -9.1 2,360.6 49.1 -39.4 -44.5Thailand 812.3 17.2 -1.6 -8.5Brunei 593.1 12.1 4.8 65.5Malaysia 590.4 145.1 8.6 6.3 6,588.3 137.5 87.4 174.3Australia -42.5 -99.9 2,101.1 44.9 -24.1 -34.9Mongolia 77.9 18.4 -2.3 -11.1 1,030.1 20.6 -1.1 -5.1total imports 33,697.5 7,956.1 -1,093.2 -12.1 419,841.9 8,421.1 798.3 10.5of which:Opec* 17,273.2 4,045.0 -766.2 -15.9 229,465.4 4,570.0 273.9 6.4Opec* % 50.8 (Dec) 53.2 (Nov) 54.3 (YTD 17) 56.4 (YTD 16)Middle East % 42.2 (Dec) 44.9 (Nov) 43.4 (YTD 17) 48 (YTD 16)Africa % 17.7 (Dec) 18.6 (Nov) 19.5 (YTD 17) 17.7 (YTD 16)FSU % 15.6 (Dec) 15.1 (Nov) 17.8 (YTD 17) 16.6 (YTD 16)exports by destination ’000t ’000 b/d ±’000 b/d ±% ’000t ’000 b/d ±’000 b/d ±%South Korea 1,089.6 21.2 0.5 2.4Indonesia -19.9 -99.8 167.8 3.3 3.3 naUS 225.0 4.4 0.9 25.7Japan 39.1 9.0 -29.3 -76.6 1,896.0 36.9 14.0 61.3Singapore 199.2 3.9 -0.6 -13.3Malaysia 25.4 5.8 5.8 na 417.3 8.1 8.1 naThailand -60.1 -100.1 327.7 6.4 2.4 60.5Philippines 94.3 21.6 0.0 0.0 281.7 5.5 5.5 naHong Kong -61.3 -100.0 259.1 5.0 5.0 natotal exports 158.8 36.4 -164.8 -81.9 4,863.4 94.6 37.5 65.7
Net crude imports 33,538.7 7,919.7 -928.4 -10.5 414,978.5 8,326.5 760.8 10.1Crude production 15,984.0 3,712.4 -61.6 -1.6 191,506.0 3,777.7 -150.5 -3.8Apparent crude demand 49,522.7 11,632.1 -990.0 -7.8 606,484.5 12,104.2 610.3 5.3Refinery runs 49,111.0 11,564.8 -446.2 -3.7 518,662.0 11,327.0 574.2 5.3Unaccounted for crude † 411.7 67.3 -543.8 -89.0 87,822.5 686.6 -54.5 -7.4Crude import dependency % 68.1 (Dec) 70.1 (Nov) 68.8 (YTD 17) 65.8 (YTD 16)Net products imports 1,314.2 411.0 66.3 19.2 24,121.0 594.0 5,943.0 137.5Net petroleum imports 34,852.9 8,330.7 -862.1 -9.4 439,099.5 8,920.5 922.8 11.5Apparent petroleum demand 50,836.9 12,043.1 -923.7 -7.1 630,605.5 12,698.2 772.3 6.5Petroleum import dependency % 69.2 (Dec) 70.9 (Nov) 70.3 (YTD 17) 67.1 (YTD 16)*includes Ecuador from Dec '07 and Angola from Jan '07. Back data adjusted to include Ecuador and Angola †Apparent crude demand minus refinery runs. This includes storage gains and heavy crude run in specialist 'asphalt factories' which are not officially regarded as refineries
— Imports and exports data from China General Administration of Customs
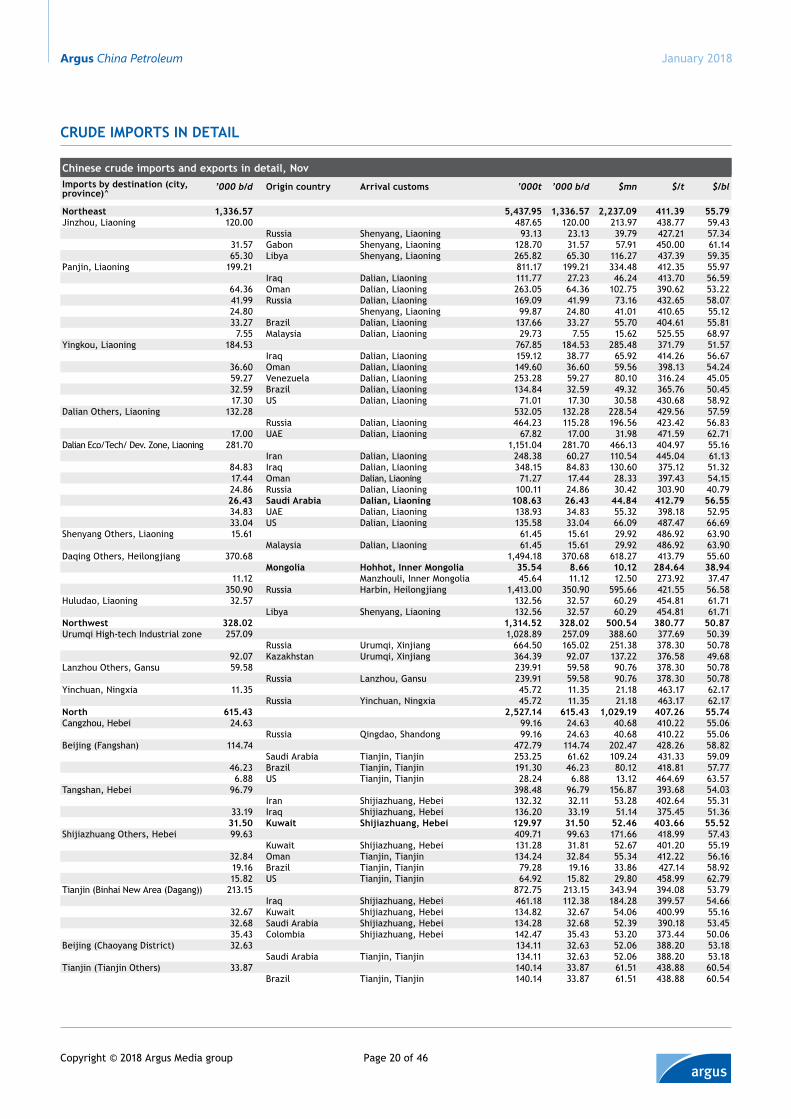
Argus China Petroleum
Page 20 of 46Copyright © 2018 Argus Media group
January 2018
Crude imports in detail
Chinese crude imports and exports in detail, novimports by destination (city, province)^
’000 b/d origin country arrival customs ’000t ’000 b/d $mn $/t $/bl
northeast 1,336.57 5,437.95 1,336.57 2,237.09 411.39 55.79Jinzhou, Liaoning 120.00 487.65 120.00 213.97 438.77 59.43
Russia Shenyang, Liaoning 93.13 23.13 39.79 427.21 57.3431.57 Gabon Shenyang, Liaoning 128.70 31.57 57.91 450.00 61.1465.30 Libya Shenyang, Liaoning 265.82 65.30 116.27 437.39 59.35
Panjin, Liaoning 199.21 811.17 199.21 334.48 412.35 55.97Iraq Dalian, Liaoning 111.77 27.23 46.24 413.70 56.59
64.36 Oman Dalian, Liaoning 263.05 64.36 102.75 390.62 53.2241.99 Russia Dalian, Liaoning 169.09 41.99 73.16 432.65 58.0724.80 Shenyang, Liaoning 99.87 24.80 41.01 410.65 55.1233.27 Brazil Dalian, Liaoning 137.66 33.27 55.70 404.61 55.81
7.55 Malaysia Dalian, Liaoning 29.73 7.55 15.62 525.55 68.97Yingkou, Liaoning 184.53 767.85 184.53 285.48 371.79 51.57
Iraq Dalian, Liaoning 159.12 38.77 65.92 414.26 56.6736.60 Oman Dalian, Liaoning 149.60 36.60 59.56 398.13 54.2459.27 Venezuela Dalian, Liaoning 253.28 59.27 80.10 316.24 45.0532.59 Brazil Dalian, Liaoning 134.84 32.59 49.32 365.76 50.4517.30 US Dalian, Liaoning 71.01 17.30 30.58 430.68 58.92
Dalian Others, Liaoning 132.28 532.05 132.28 228.54 429.56 57.59Russia Dalian, Liaoning 464.23 115.28 196.56 423.42 56.83
17.00 UAE Dalian, Liaoning 67.82 17.00 31.98 471.59 62.71Dalian Eco/Tech/ Dev. Zone, Liaoning 281.70 1,151.04 281.70 466.13 404.97 55.16
Iran Dalian, Liaoning 248.38 60.27 110.54 445.04 61.1384.83 Iraq Dalian, Liaoning 348.15 84.83 130.60 375.12 51.3217.44 Oman Dalian, Liaoning 71.27 17.44 28.33 397.43 54.1524.86 Russia Dalian, Liaoning 100.11 24.86 30.42 303.90 40.7926.43 saudi arabia dalian, liaoning 108.63 26.43 44.84 412.79 56.5534.83 UAE Dalian, Liaoning 138.93 34.83 55.32 398.18 52.9533.04 US Dalian, Liaoning 135.58 33.04 66.09 487.47 66.69
Shenyang Others, Liaoning 15.61 61.45 15.61 29.92 486.92 63.90Malaysia Dalian, Liaoning 61.45 15.61 29.92 486.92 63.90
Daqing Others, Heilongjiang 370.68 1,494.18 370.68 618.27 413.79 55.60mongolia Hohhot, inner mongolia 35.54 8.66 10.12 284.64 38.94
11.12 Manzhouli, Inner Mongolia 45.64 11.12 12.50 273.92 37.47350.90 Russia Harbin, Heilongjiang 1,413.00 350.90 595.66 421.55 56.58
Huludao, Liaoning 32.57 132.56 32.57 60.29 454.81 61.71Libya Shenyang, Liaoning 132.56 32.57 60.29 454.81 61.71
northwest 328.02 1,314.52 328.02 500.54 380.77 50.87Urumqi High-tech Industrial zone 257.09 1,028.89 257.09 388.60 377.69 50.39
Russia Urumqi, Xinjiang 664.50 165.02 251.38 378.30 50.7892.07 Kazakhstan Urumqi, Xinjiang 364.39 92.07 137.22 376.58 49.68
Lanzhou Others, Gansu 59.58 239.91 59.58 90.76 378.30 50.78Russia Lanzhou, Gansu 239.91 59.58 90.76 378.30 50.78
Yinchuan, Ningxia 11.35 45.72 11.35 21.18 463.17 62.17Russia Yinchuan, Ningxia 45.72 11.35 21.18 463.17 62.17
north 615.43 2,527.14 615.43 1,029.19 407.26 55.74Cangzhou, Hebei 24.63 99.16 24.63 40.68 410.22 55.06
Russia Qingdao, Shandong 99.16 24.63 40.68 410.22 55.06Beijing (Fangshan) 114.74 472.79 114.74 202.47 428.26 58.82
Saudi Arabia Tianjin, Tianjin 253.25 61.62 109.24 431.33 59.0946.23 Brazil Tianjin, Tianjin 191.30 46.23 80.12 418.81 57.776.88 US Tianjin, Tianjin 28.24 6.88 13.12 464.69 63.57
Tangshan, Hebei 96.79 398.48 96.79 156.87 393.68 54.03Iran Shijiazhuang, Hebei 132.32 32.11 53.28 402.64 55.31
33.19 Iraq Shijiazhuang, Hebei 136.20 33.19 51.14 375.45 51.3631.50 Kuwait shijiazhuang, Hebei 129.97 31.50 52.46 403.66 55.52
Shijiazhuang Others, Hebei 99.63 409.71 99.63 171.66 418.99 57.43Kuwait Shijiazhuang, Hebei 131.28 31.81 52.67 401.20 55.19
32.84 Oman Tianjin, Tianjin 134.24 32.84 55.34 412.22 56.1619.16 Brazil Tianjin, Tianjin 79.28 19.16 33.86 427.14 58.9215.82 US Tianjin, Tianjin 64.92 15.82 29.80 458.99 62.79
Tianjin (Binhai New Area (Dagang)) 213.15 872.75 213.15 343.94 394.08 53.79Iraq Shijiazhuang, Hebei 461.18 112.38 184.28 399.57 54.66
32.67 Kuwait Shijiazhuang, Hebei 134.82 32.67 54.06 400.99 55.1632.68 Saudi Arabia Shijiazhuang, Hebei 134.28 32.68 52.39 390.18 53.4535.43 Colombia Shijiazhuang, Hebei 142.47 35.43 53.20 373.44 50.06
Beijing (Chaoyang District) 32.63 134.11 32.63 52.06 388.20 53.18Saudi Arabia Tianjin, Tianjin 134.11 32.63 52.06 388.20 53.18
Tianjin (Tianjin Others) 33.87 140.14 33.87 61.51 438.88 60.54Brazil Tianjin, Tianjin 140.14 33.87 61.51 438.88 60.54
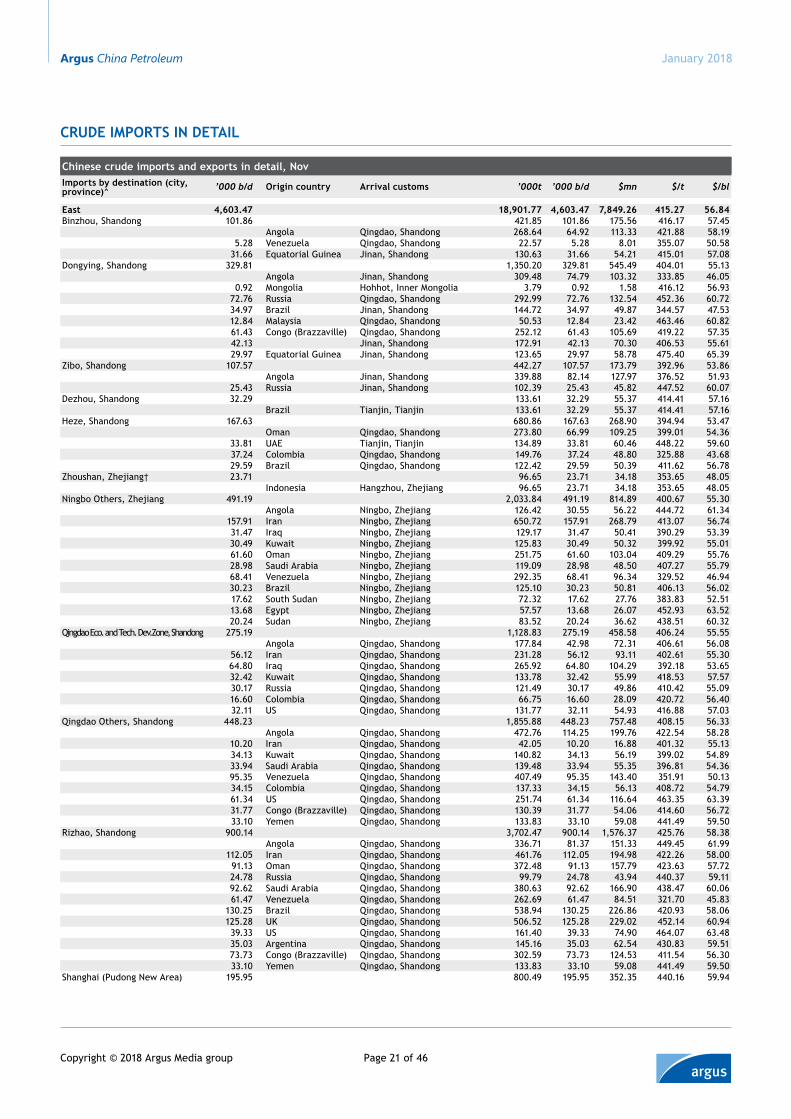
Argus China Petroleum
Page 21 of 46Copyright © 2018 Argus Media group
January 2018
Crude imports in detail
Chinese crude imports and exports in detail, novimports by destination (city, province)^ ’000 b/d origin country arrival customs ’000t ’000 b/d $mn $/t $/bl
east 4,603.47 18,901.77 4,603.47 7,849.26 415.27 56.84Binzhou, Shandong 101.86 421.85 101.86 175.56 416.17 57.45
Angola Qingdao, Shandong 268.64 64.92 113.33 421.88 58.195.28 Venezuela Qingdao, Shandong 22.57 5.28 8.01 355.07 50.58
31.66 Equatorial Guinea Jinan, Shandong 130.63 31.66 54.21 415.01 57.08Dongying, Shandong 329.81 1,350.20 329.81 545.49 404.01 55.13
Angola Jinan, Shandong 309.48 74.79 103.32 333.85 46.050.92 Mongolia Hohhot, Inner Mongolia 3.79 0.92 1.58 416.12 56.93
72.76 Russia Qingdao, Shandong 292.99 72.76 132.54 452.36 60.7234.97 Brazil Jinan, Shandong 144.72 34.97 49.87 344.57 47.5312.84 Malaysia Qingdao, Shandong 50.53 12.84 23.42 463.46 60.8261.43 Congo (Brazzaville) Qingdao, Shandong 252.12 61.43 105.69 419.22 57.3542.13 Jinan, Shandong 172.91 42.13 70.30 406.53 55.6129.97 Equatorial Guinea Jinan, Shandong 123.65 29.97 58.78 475.40 65.39
Zibo, Shandong 107.57 442.27 107.57 173.79 392.96 53.86Angola Jinan, Shandong 339.88 82.14 127.97 376.52 51.93
25.43 Russia Jinan, Shandong 102.39 25.43 45.82 447.52 60.07Dezhou, Shandong 32.29 133.61 32.29 55.37 414.41 57.16
Brazil Tianjin, Tianjin 133.61 32.29 55.37 414.41 57.16Heze, Shandong 167.63 680.86 167.63 268.90 394.94 53.47
Oman Qingdao, Shandong 273.80 66.99 109.25 399.01 54.3633.81 UAE Tianjin, Tianjin 134.89 33.81 60.46 448.22 59.6037.24 Colombia Qingdao, Shandong 149.76 37.24 48.80 325.88 43.6829.59 Brazil Qingdao, Shandong 122.42 29.59 50.39 411.62 56.78
Zhoushan, Zhejiang† 23.71 96.65 23.71 34.18 353.65 48.05Indonesia Hangzhou, Zhejiang 96.65 23.71 34.18 353.65 48.05
Ningbo Others, Zhejiang 491.19 2,033.84 491.19 814.89 400.67 55.30Angola Ningbo, Zhejiang 126.42 30.55 56.22 444.72 61.34
157.91 Iran Ningbo, Zhejiang 650.72 157.91 268.79 413.07 56.7431.47 Iraq Ningbo, Zhejiang 129.17 31.47 50.41 390.29 53.3930.49 Kuwait Ningbo, Zhejiang 125.83 30.49 50.32 399.92 55.0161.60 Oman Ningbo, Zhejiang 251.75 61.60 103.04 409.29 55.7628.98 Saudi Arabia Ningbo, Zhejiang 119.09 28.98 48.50 407.27 55.7968.41 Venezuela Ningbo, Zhejiang 292.35 68.41 96.34 329.52 46.9430.23 Brazil Ningbo, Zhejiang 125.10 30.23 50.81 406.13 56.0217.62 South Sudan Ningbo, Zhejiang 72.32 17.62 27.76 383.83 52.5113.68 Egypt Ningbo, Zhejiang 57.57 13.68 26.07 452.93 63.5220.24 Sudan Ningbo, Zhejiang 83.52 20.24 36.62 438.51 60.32
Qingdao Eco. and Tech. Dev.Zone, Shandong 275.19 1,128.83 275.19 458.58 406.24 55.55Angola Qingdao, Shandong 177.84 42.98 72.31 406.61 56.08
56.12 Iran Qingdao, Shandong 231.28 56.12 93.11 402.61 55.3064.80 Iraq Qingdao, Shandong 265.92 64.80 104.29 392.18 53.6532.42 Kuwait Qingdao, Shandong 133.78 32.42 55.99 418.53 57.5730.17 Russia Qingdao, Shandong 121.49 30.17 49.86 410.42 55.0916.60 Colombia Qingdao, Shandong 66.75 16.60 28.09 420.72 56.4032.11 US Qingdao, Shandong 131.77 32.11 54.93 416.88 57.03
Qingdao Others, Shandong 448.23 1,855.88 448.23 757.48 408.15 56.33Angola Qingdao, Shandong 472.76 114.25 199.76 422.54 58.28
10.20 Iran Qingdao, Shandong 42.05 10.20 16.88 401.32 55.1334.13 Kuwait Qingdao, Shandong 140.82 34.13 56.19 399.02 54.8933.94 Saudi Arabia Qingdao, Shandong 139.48 33.94 55.35 396.81 54.3695.35 Venezuela Qingdao, Shandong 407.49 95.35 143.40 351.91 50.1334.15 Colombia Qingdao, Shandong 137.33 34.15 56.13 408.72 54.7961.34 US Qingdao, Shandong 251.74 61.34 116.64 463.35 63.3931.77 Congo (Brazzaville) Qingdao, Shandong 130.39 31.77 54.06 414.60 56.7233.10 Yemen Qingdao, Shandong 133.83 33.10 59.08 441.49 59.50
Rizhao, Shandong 900.14 3,702.47 900.14 1,576.37 425.76 58.38Angola Qingdao, Shandong 336.71 81.37 151.33 449.45 61.99
112.05 Iran Qingdao, Shandong 461.76 112.05 194.98 422.26 58.0091.13 Oman Qingdao, Shandong 372.48 91.13 157.79 423.63 57.7224.78 Russia Qingdao, Shandong 99.79 24.78 43.94 440.37 59.1192.62 Saudi Arabia Qingdao, Shandong 380.63 92.62 166.90 438.47 60.0661.47 Venezuela Qingdao, Shandong 262.69 61.47 84.51 321.70 45.83
130.25 Brazil Qingdao, Shandong 538.94 130.25 226.86 420.93 58.06125.28 UK Qingdao, Shandong 506.52 125.28 229.02 452.14 60.9439.33 US Qingdao, Shandong 161.40 39.33 74.90 464.07 63.4835.03 Argentina Qingdao, Shandong 145.16 35.03 62.54 430.83 59.5173.73 Congo (Brazzaville) Qingdao, Shandong 302.59 73.73 124.53 411.54 56.3033.10 Yemen Qingdao, Shandong 133.83 33.10 59.08 441.49 59.50
Shanghai (Pudong New Area) 195.95 800.49 195.95 352.35 440.16 59.94
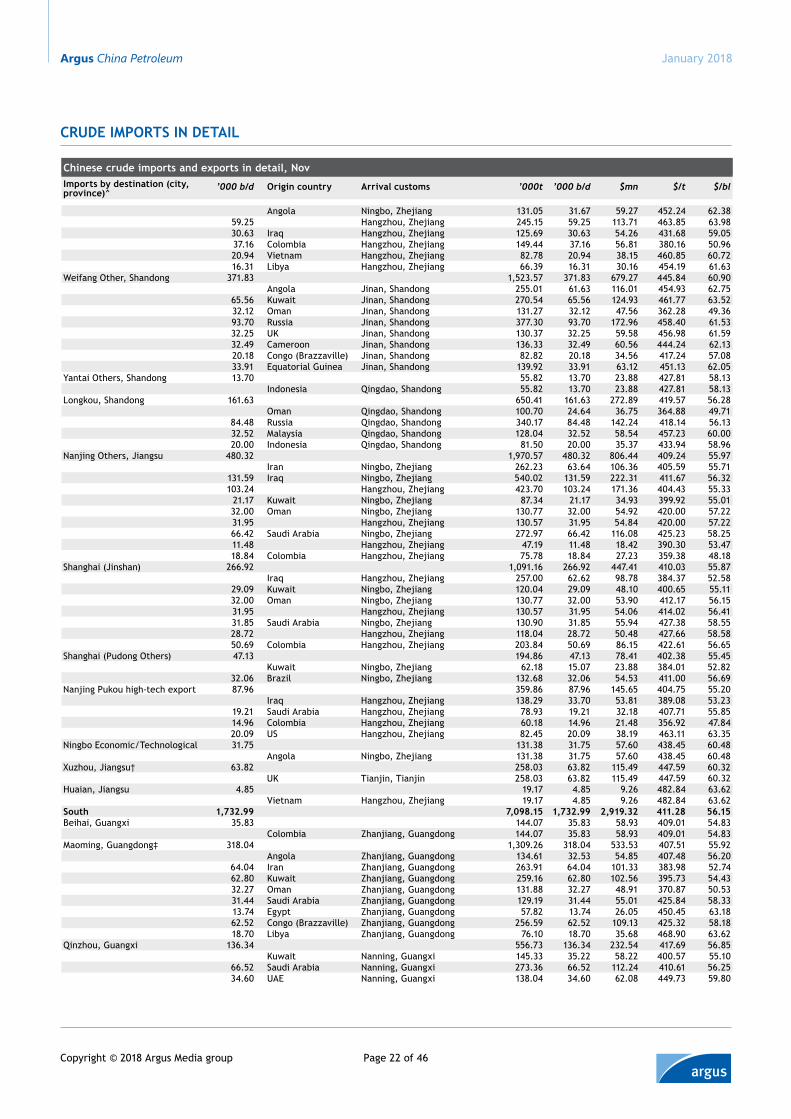
Argus China Petroleum
Page 22 of 46Copyright © 2018 Argus Media group
January 2018
Crude imports in detail
Chinese crude imports and exports in detail, novimports by destination (city, province)^
’000 b/d origin country arrival customs ’000t ’000 b/d $mn $/t $/bl
Angola Ningbo, Zhejiang 131.05 31.67 59.27 452.24 62.3859.25 Hangzhou, Zhejiang 245.15 59.25 113.71 463.85 63.9830.63 Iraq Hangzhou, Zhejiang 125.69 30.63 54.26 431.68 59.0537.16 Colombia Hangzhou, Zhejiang 149.44 37.16 56.81 380.16 50.9620.94 Vietnam Hangzhou, Zhejiang 82.78 20.94 38.15 460.85 60.7216.31 Libya Hangzhou, Zhejiang 66.39 16.31 30.16 454.19 61.63
Weifang Other, Shandong 371.83 1,523.57 371.83 679.27 445.84 60.90Angola Jinan, Shandong 255.01 61.63 116.01 454.93 62.75
65.56 Kuwait Jinan, Shandong 270.54 65.56 124.93 461.77 63.5232.12 Oman Jinan, Shandong 131.27 32.12 47.56 362.28 49.3693.70 Russia Jinan, Shandong 377.30 93.70 172.96 458.40 61.5332.25 UK Jinan, Shandong 130.37 32.25 59.58 456.98 61.5932.49 Cameroon Jinan, Shandong 136.33 32.49 60.56 444.24 62.1320.18 Congo (Brazzaville) Jinan, Shandong 82.82 20.18 34.56 417.24 57.0833.91 Equatorial Guinea Jinan, Shandong 139.92 33.91 63.12 451.13 62.05
Yantai Others, Shandong 13.70 55.82 13.70 23.88 427.81 58.13Indonesia Qingdao, Shandong 55.82 13.70 23.88 427.81 58.13
Longkou, Shandong 161.63 650.41 161.63 272.89 419.57 56.28Oman Qingdao, Shandong 100.70 24.64 36.75 364.88 49.71
84.48 Russia Qingdao, Shandong 340.17 84.48 142.24 418.14 56.1332.52 Malaysia Qingdao, Shandong 128.04 32.52 58.54 457.23 60.0020.00 Indonesia Qingdao, Shandong 81.50 20.00 35.37 433.94 58.96
Nanjing Others, Jiangsu 480.32 1,970.57 480.32 806.44 409.24 55.97Iran Ningbo, Zhejiang 262.23 63.64 106.36 405.59 55.71
131.59 Iraq Ningbo, Zhejiang 540.02 131.59 222.31 411.67 56.32103.24 Hangzhou, Zhejiang 423.70 103.24 171.36 404.43 55.33
21.17 Kuwait Ningbo, Zhejiang 87.34 21.17 34.93 399.92 55.0132.00 Oman Ningbo, Zhejiang 130.77 32.00 54.92 420.00 57.2231.95 Hangzhou, Zhejiang 130.57 31.95 54.84 420.00 57.2266.42 Saudi Arabia Ningbo, Zhejiang 272.97 66.42 116.08 425.23 58.2511.48 Hangzhou, Zhejiang 47.19 11.48 18.42 390.30 53.4718.84 Colombia Hangzhou, Zhejiang 75.78 18.84 27.23 359.38 48.18
Shanghai (Jinshan) 266.92 1,091.16 266.92 447.41 410.03 55.87Iraq Hangzhou, Zhejiang 257.00 62.62 98.78 384.37 52.58
29.09 Kuwait Ningbo, Zhejiang 120.04 29.09 48.10 400.65 55.1132.00 Oman Ningbo, Zhejiang 130.77 32.00 53.90 412.17 56.1531.95 Hangzhou, Zhejiang 130.57 31.95 54.06 414.02 56.4131.85 Saudi Arabia Ningbo, Zhejiang 130.90 31.85 55.94 427.38 58.5528.72 Hangzhou, Zhejiang 118.04 28.72 50.48 427.66 58.5850.69 Colombia Hangzhou, Zhejiang 203.84 50.69 86.15 422.61 56.65
Shanghai (Pudong Others) 47.13 194.86 47.13 78.41 402.38 55.45Kuwait Ningbo, Zhejiang 62.18 15.07 23.88 384.01 52.82
32.06 Brazil Ningbo, Zhejiang 132.68 32.06 54.53 411.00 56.69Nanjing Pukou high-tech export 87.96 359.86 87.96 145.65 404.75 55.20
Iraq Hangzhou, Zhejiang 138.29 33.70 53.81 389.08 53.2319.21 Saudi Arabia Hangzhou, Zhejiang 78.93 19.21 32.18 407.71 55.8514.96 Colombia Hangzhou, Zhejiang 60.18 14.96 21.48 356.92 47.8420.09 US Hangzhou, Zhejiang 82.45 20.09 38.19 463.11 63.35
Ningbo Economic/Technological 31.75 131.38 31.75 57.60 438.45 60.48Angola Ningbo, Zhejiang 131.38 31.75 57.60 438.45 60.48
Xuzhou, Jiangsu† 63.82 258.03 63.82 115.49 447.59 60.32UK Tianjin, Tianjin 258.03 63.82 115.49 447.59 60.32
Huaian, Jiangsu 4.85 19.17 4.85 9.26 482.84 63.62Vietnam Hangzhou, Zhejiang 19.17 4.85 9.26 482.84 63.62
south 1,732.99 7,098.15 1,732.99 2,919.32 411.28 56.15Beihai, Guangxi 35.83 144.07 35.83 58.93 409.01 54.83
Colombia Zhanjiang, Guangdong 144.07 35.83 58.93 409.01 54.83Maoming, Guangdong‡ 318.04 1,309.26 318.04 533.53 407.51 55.92
Angola Zhanjiang, Guangdong 134.61 32.53 54.85 407.48 56.2064.04 Iran Zhanjiang, Guangdong 263.91 64.04 101.33 383.98 52.7462.80 Kuwait Zhanjiang, Guangdong 259.16 62.80 102.56 395.73 54.4332.27 Oman Zhanjiang, Guangdong 131.88 32.27 48.91 370.87 50.5331.44 Saudi Arabia Zhanjiang, Guangdong 129.19 31.44 55.01 425.84 58.3313.74 Egypt Zhanjiang, Guangdong 57.82 13.74 26.05 450.45 63.1862.52 Congo (Brazzaville) Zhanjiang, Guangdong 256.59 62.52 109.13 425.32 58.1818.70 Libya Zhanjiang, Guangdong 76.10 18.70 35.68 468.90 63.62
Qinzhou, Guangxi 136.34 556.73 136.34 232.54 417.69 56.85Kuwait Nanning, Guangxi 145.33 35.22 58.22 400.57 55.10
66.52 Saudi Arabia Nanning, Guangxi 273.36 66.52 112.24 410.61 56.2534.60 UAE Nanning, Guangxi 138.04 34.60 62.08 449.73 59.80
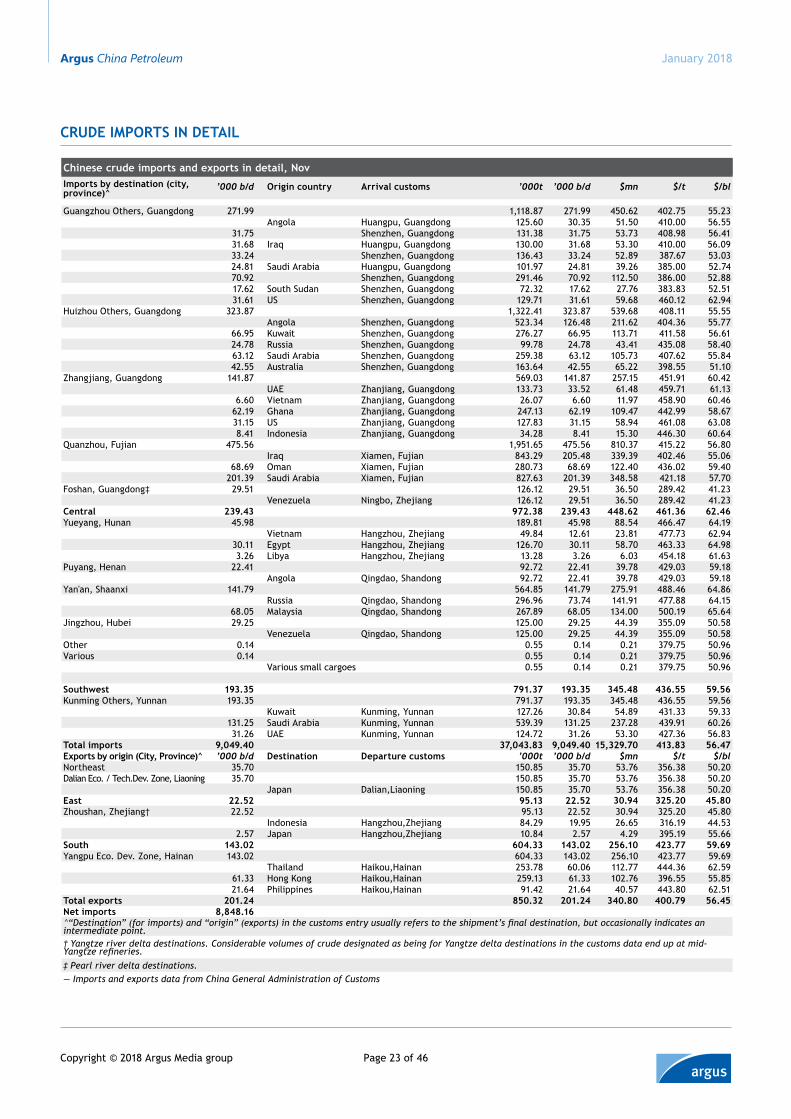
Argus China Petroleum
Page 23 of 46Copyright © 2018 Argus Media group
January 2018
Crude imports in detail
Chinese crude imports and exports in detail, novimports by destination (city, province)^
’000 b/d origin country arrival customs ’000t ’000 b/d $mn $/t $/bl
Guangzhou Others, Guangdong 271.99 1,118.87 271.99 450.62 402.75 55.23Angola Huangpu, Guangdong 125.60 30.35 51.50 410.00 56.55
31.75 Shenzhen, Guangdong 131.38 31.75 53.73 408.98 56.4131.68 Iraq Huangpu, Guangdong 130.00 31.68 53.30 410.00 56.0933.24 Shenzhen, Guangdong 136.43 33.24 52.89 387.67 53.0324.81 Saudi Arabia Huangpu, Guangdong 101.97 24.81 39.26 385.00 52.7470.92 Shenzhen, Guangdong 291.46 70.92 112.50 386.00 52.8817.62 South Sudan Shenzhen, Guangdong 72.32 17.62 27.76 383.83 52.5131.61 US Shenzhen, Guangdong 129.71 31.61 59.68 460.12 62.94
Huizhou Others, Guangdong 323.87 1,322.41 323.87 539.68 408.11 55.55Angola Shenzhen, Guangdong 523.34 126.48 211.62 404.36 55.77
66.95 Kuwait Shenzhen, Guangdong 276.27 66.95 113.71 411.58 56.6124.78 Russia Shenzhen, Guangdong 99.78 24.78 43.41 435.08 58.4063.12 Saudi Arabia Shenzhen, Guangdong 259.38 63.12 105.73 407.62 55.8442.55 Australia Shenzhen, Guangdong 163.64 42.55 65.22 398.55 51.10
Zhangjiang, Guangdong 141.87 569.03 141.87 257.15 451.91 60.42UAE Zhanjiang, Guangdong 133.73 33.52 61.48 459.71 61.13
6.60 Vietnam Zhanjiang, Guangdong 26.07 6.60 11.97 458.90 60.4662.19 Ghana Zhanjiang, Guangdong 247.13 62.19 109.47 442.99 58.6731.15 US Zhanjiang, Guangdong 127.83 31.15 58.94 461.08 63.088.41 Indonesia Zhanjiang, Guangdong 34.28 8.41 15.30 446.30 60.64
Quanzhou, Fujian 475.56 1,951.65 475.56 810.37 415.22 56.80Iraq Xiamen, Fujian 843.29 205.48 339.39 402.46 55.06
68.69 Oman Xiamen, Fujian 280.73 68.69 122.40 436.02 59.40201.39 Saudi Arabia Xiamen, Fujian 827.63 201.39 348.58 421.18 57.70
Foshan, Guangdong‡ 29.51 126.12 29.51 36.50 289.42 41.23Venezuela Ningbo, Zhejiang 126.12 29.51 36.50 289.42 41.23
Central 239.43 972.38 239.43 448.62 461.36 62.46Yueyang, Hunan 45.98 189.81 45.98 88.54 466.47 64.19
Vietnam Hangzhou, Zhejiang 49.84 12.61 23.81 477.73 62.9430.11 Egypt Hangzhou, Zhejiang 126.70 30.11 58.70 463.33 64.983.26 Libya Hangzhou, Zhejiang 13.28 3.26 6.03 454.18 61.63
Puyang, Henan 22.41 92.72 22.41 39.78 429.03 59.18Angola Qingdao, Shandong 92.72 22.41 39.78 429.03 59.18
Yan'an, Shaanxi 141.79 564.85 141.79 275.91 488.46 64.86Russia Qingdao, Shandong 296.96 73.74 141.91 477.88 64.15
68.05 Malaysia Qingdao, Shandong 267.89 68.05 134.00 500.19 65.64Jingzhou, Hubei 29.25 125.00 29.25 44.39 355.09 50.58
Venezuela Qingdao, Shandong 125.00 29.25 44.39 355.09 50.58Other 0.14 0.55 0.14 0.21 379.75 50.96Various 0.14 0.55 0.14 0.21 379.75 50.96
Various small cargoes 0.55 0.14 0.21 379.75 50.96
southwest 193.35 791.37 193.35 345.48 436.55 59.56Kunming Others, Yunnan 193.35 791.37 193.35 345.48 436.55 59.56
Kuwait Kunming, Yunnan 127.26 30.84 54.89 431.33 59.33131.25 Saudi Arabia Kunming, Yunnan 539.39 131.25 237.28 439.91 60.2631.26 UAE Kunming, Yunnan 124.72 31.26 53.30 427.36 56.83
total imports 9,049.40 37,043.83 9,049.40 15,329.70 413.83 56.47exports by origin (City, province)̂ ’000 b/d destination departure customs ’000t ’000 b/d $mn $/t $/blNortheast 35.70 150.85 35.70 53.76 356.38 50.20Dalian Eco. / Tech.Dev. Zone, Liaoning 35.70 150.85 35.70 53.76 356.38 50.20
Japan Dalian,Liaoning 150.85 35.70 53.76 356.38 50.20east 22.52 95.13 22.52 30.94 325.20 45.80Zhoushan, Zhejiang† 22.52 95.13 22.52 30.94 325.20 45.80
Indonesia Hangzhou,Zhejiang 84.29 19.95 26.65 316.19 44.532.57 Japan Hangzhou,Zhejiang 10.84 2.57 4.29 395.19 55.66
south 143.02 604.33 143.02 256.10 423.77 59.69Yangpu Eco. Dev. Zone, Hainan 143.02 604.33 143.02 256.10 423.77 59.69
Thailand Haikou,Hainan 253.78 60.06 112.77 444.36 62.5961.33 Hong Kong Haikou,Hainan 259.13 61.33 102.76 396.55 55.8521.64 Philippines Haikou,Hainan 91.42 21.64 40.57 443.80 62.51
total exports 201.24 850.32 201.24 340.80 400.79 56.45net imports 8,848.16^“Destination” (for imports) and “origin” (exports) in the customs entry usually refers to the shipment’s final destination, but occasionally indicates an intermediate point.† Yangtze river delta destinations. Considerable volumes of crude designated as being for Yangtze delta destinations in the customs data end up at mid-Yangtze refineries.‡ Pearl river delta destinations.— Imports and exports data from China General Administration of Customs
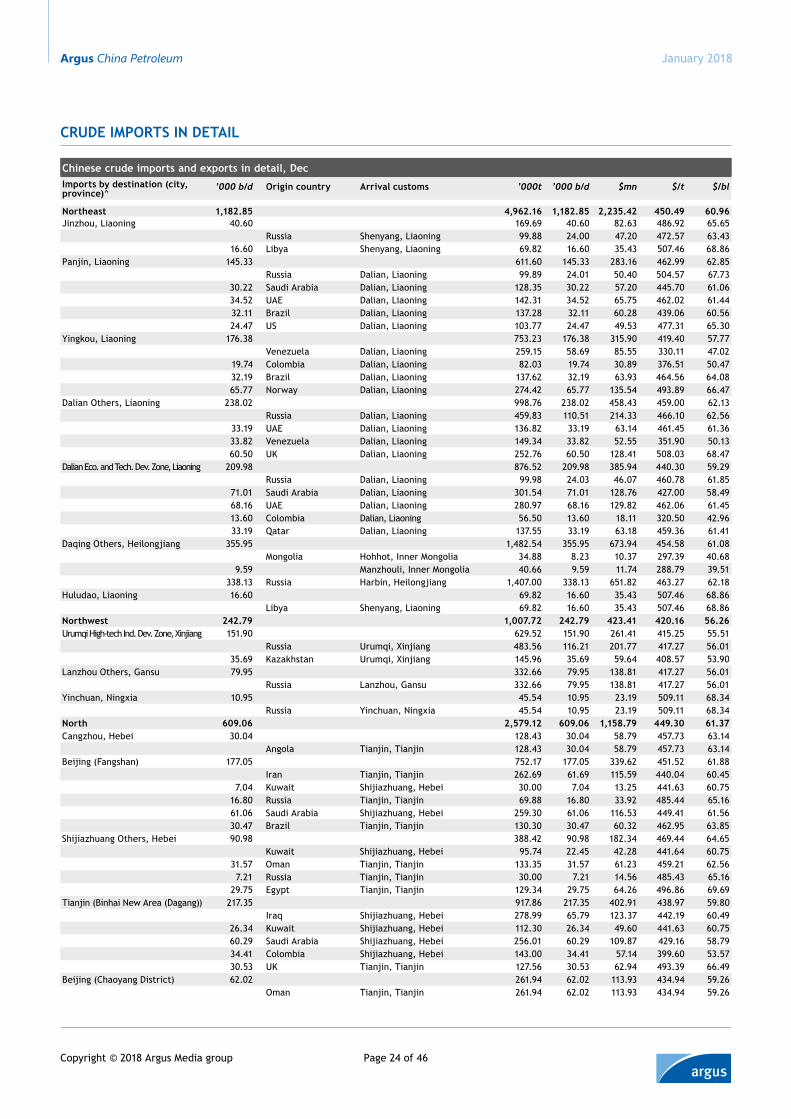
Argus China Petroleum
Page 24 of 46Copyright © 2018 Argus Media group
January 2018
Crude imports in detail
Chinese crude imports and exports in detail, decimports by destination (city, province)^
’000 b/d origin country arrival customs ’000t ’000 b/d $mn $/t $/bl
northeast 1,182.85 4,962.16 1,182.85 2,235.42 450.49 60.96Jinzhou, Liaoning 40.60 169.69 40.60 82.63 486.92 65.65
Russia Shenyang, Liaoning 99.88 24.00 47.20 472.57 63.4316.60 Libya Shenyang, Liaoning 69.82 16.60 35.43 507.46 68.86
Panjin, Liaoning 145.33 611.60 145.33 283.16 462.99 62.85Russia Dalian, Liaoning 99.89 24.01 50.40 504.57 67.73
30.22 Saudi Arabia Dalian, Liaoning 128.35 30.22 57.20 445.70 61.0634.52 UAE Dalian, Liaoning 142.31 34.52 65.75 462.02 61.4432.11 Brazil Dalian, Liaoning 137.28 32.11 60.28 439.06 60.5624.47 US Dalian, Liaoning 103.77 24.47 49.53 477.31 65.30
Yingkou, Liaoning 176.38 753.23 176.38 315.90 419.40 57.77Venezuela Dalian, Liaoning 259.15 58.69 85.55 330.11 47.02
19.74 Colombia Dalian, Liaoning 82.03 19.74 30.89 376.51 50.4732.19 Brazil Dalian, Liaoning 137.62 32.19 63.93 464.56 64.0865.77 Norway Dalian, Liaoning 274.42 65.77 135.54 493.89 66.47
Dalian Others, Liaoning 238.02 998.76 238.02 458.43 459.00 62.13Russia Dalian, Liaoning 459.83 110.51 214.33 466.10 62.56
33.19 UAE Dalian, Liaoning 136.82 33.19 63.14 461.45 61.3633.82 Venezuela Dalian, Liaoning 149.34 33.82 52.55 351.90 50.1360.50 UK Dalian, Liaoning 252.76 60.50 128.41 508.03 68.47
Dalian Eco. and Tech. Dev. Zone, Liaoning 209.98 876.52 209.98 385.94 440.30 59.29Russia Dalian, Liaoning 99.98 24.03 46.07 460.78 61.85
71.01 Saudi Arabia Dalian, Liaoning 301.54 71.01 128.76 427.00 58.4968.16 UAE Dalian, Liaoning 280.97 68.16 129.82 462.06 61.4513.60 Colombia Dalian, Liaoning 56.50 13.60 18.11 320.50 42.9633.19 Qatar Dalian, Liaoning 137.55 33.19 63.18 459.36 61.41
Daqing Others, Heilongjiang 355.95 1,482.54 355.95 673.94 454.58 61.08Mongolia Hohhot, Inner Mongolia 34.88 8.23 10.37 297.39 40.68
9.59 Manzhouli, Inner Mongolia 40.66 9.59 11.74 288.79 39.51338.13 Russia Harbin, Heilongjiang 1,407.00 338.13 651.82 463.27 62.18
Huludao, Liaoning 16.60 69.82 16.60 35.43 507.46 68.86Libya Shenyang, Liaoning 69.82 16.60 35.43 507.46 68.86
northwest 242.79 1,007.72 242.79 423.41 420.16 56.26Urumqi High-tech Ind. Dev. Zone, Xinjiang 151.90 629.52 151.90 261.41 415.25 55.51
Russia Urumqi, Xinjiang 483.56 116.21 201.77 417.27 56.0135.69 Kazakhstan Urumqi, Xinjiang 145.96 35.69 59.64 408.57 53.90
Lanzhou Others, Gansu 79.95 332.66 79.95 138.81 417.27 56.01Russia Lanzhou, Gansu 332.66 79.95 138.81 417.27 56.01
Yinchuan, Ningxia 10.95 45.54 10.95 23.19 509.11 68.34Russia Yinchuan, Ningxia 45.54 10.95 23.19 509.11 68.34
north 609.06 2,579.12 609.06 1,158.79 449.30 61.37Cangzhou, Hebei 30.04 128.43 30.04 58.79 457.73 63.14
Angola Tianjin, Tianjin 128.43 30.04 58.79 457.73 63.14Beijing (Fangshan) 177.05 752.17 177.05 339.62 451.52 61.88
Iran Tianjin, Tianjin 262.69 61.69 115.59 440.04 60.457.04 Kuwait Shijiazhuang, Hebei 30.00 7.04 13.25 441.63 60.75
16.80 Russia Tianjin, Tianjin 69.88 16.80 33.92 485.44 65.1661.06 Saudi Arabia Shijiazhuang, Hebei 259.30 61.06 116.53 449.41 61.5630.47 Brazil Tianjin, Tianjin 130.30 30.47 60.32 462.95 63.85
Shijiazhuang Others, Hebei 90.98 388.42 90.98 182.34 469.44 64.65Kuwait Shijiazhuang, Hebei 95.74 22.45 42.28 441.64 60.75
31.57 Oman Tianjin, Tianjin 133.35 31.57 61.23 459.21 62.567.21 Russia Tianjin, Tianjin 30.00 7.21 14.56 485.43 65.16
29.75 Egypt Tianjin, Tianjin 129.34 29.75 64.26 496.86 69.69Tianjin (Binhai New Area (Dagang)) 217.35 917.86 217.35 402.91 438.97 59.80
Iraq Shijiazhuang, Hebei 278.99 65.79 123.37 442.19 60.4926.34 Kuwait Shijiazhuang, Hebei 112.30 26.34 49.60 441.63 60.7560.29 Saudi Arabia Shijiazhuang, Hebei 256.01 60.29 109.87 429.16 58.7934.41 Colombia Shijiazhuang, Hebei 143.00 34.41 57.14 399.60 53.5730.53 UK Tianjin, Tianjin 127.56 30.53 62.94 493.39 66.49
Beijing (Chaoyang District) 62.02 261.94 62.02 113.93 434.94 59.26Oman Tianjin, Tianjin 261.94 62.02 113.93 434.94 59.26
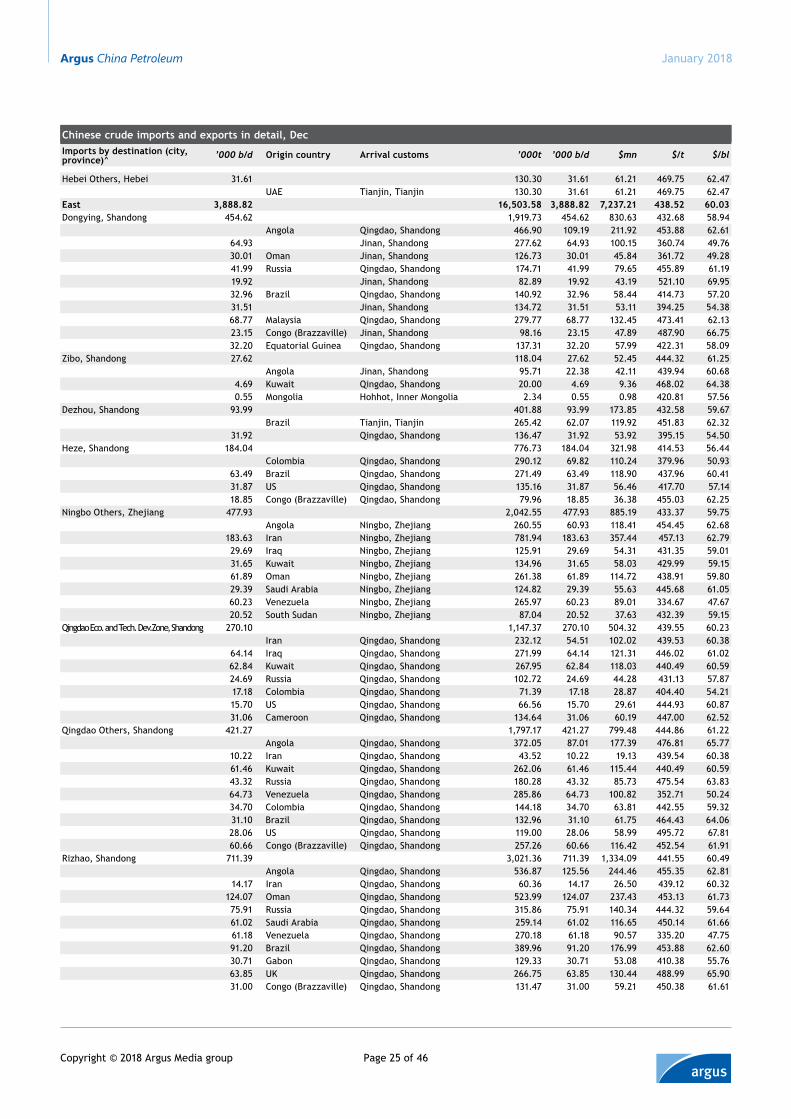
Argus China Petroleum
Page 25 of 46Copyright © 2018 Argus Media group
January 2018
Chinese crude imports and exports in detail, DecImports by destination (city, province)^ ’000 b/d Origin country Arrival customs ’000t ’000 b/d $mn $/t $/bl
Hebei Others, Hebei 31.61 130.30 31.61 61.21 469.75 62.47UAE Tianjin, Tianjin 130.30 31.61 61.21 469.75 62.47
East 3,888.82 16,503.58 3,888.82 7,237.21 438.52 60.03Dongying, Shandong 454.62 1,919.73 454.62 830.63 432.68 58.94
Angola Qingdao, Shandong 466.90 109.19 211.92 453.88 62.6164.93 Jinan, Shandong 277.62 64.93 100.15 360.74 49.7630.01 Oman Jinan, Shandong 126.73 30.01 45.84 361.72 49.2841.99 Russia Qingdao, Shandong 174.71 41.99 79.65 455.89 61.1919.92 Jinan, Shandong 82.89 19.92 43.19 521.10 69.9532.96 Brazil Qingdao, Shandong 140.92 32.96 58.44 414.73 57.2031.51 Jinan, Shandong 134.72 31.51 53.11 394.25 54.3868.77 Malaysia Qingdao, Shandong 279.77 68.77 132.45 473.41 62.1323.15 Congo (Brazzaville) Jinan, Shandong 98.16 23.15 47.89 487.90 66.7532.20 Equatorial Guinea Qingdao, Shandong 137.31 32.20 57.99 422.31 58.09
Zibo, Shandong 27.62 118.04 27.62 52.45 444.32 61.25Angola Jinan, Shandong 95.71 22.38 42.11 439.94 60.68
4.69 Kuwait Qingdao, Shandong 20.00 4.69 9.36 468.02 64.380.55 Mongolia Hohhot, Inner Mongolia 2.34 0.55 0.98 420.81 57.56
Dezhou, Shandong 93.99 401.88 93.99 173.85 432.58 59.67Brazil Tianjin, Tianjin 265.42 62.07 119.92 451.83 62.32
31.92 Qingdao, Shandong 136.47 31.92 53.92 395.15 54.50Heze, Shandong 184.04 776.73 184.04 321.98 414.53 56.44
Colombia Qingdao, Shandong 290.12 69.82 110.24 379.96 50.9363.49 Brazil Qingdao, Shandong 271.49 63.49 118.90 437.96 60.4131.87 US Qingdao, Shandong 135.16 31.87 56.46 417.70 57.1418.85 Congo (Brazzaville) Qingdao, Shandong 79.96 18.85 36.38 455.03 62.25
Ningbo Others, Zhejiang 477.93 2,042.55 477.93 885.19 433.37 59.75Angola Ningbo, Zhejiang 260.55 60.93 118.41 454.45 62.68
183.63 Iran Ningbo, Zhejiang 781.94 183.63 357.44 457.13 62.7929.69 Iraq Ningbo, Zhejiang 125.91 29.69 54.31 431.35 59.0131.65 Kuwait Ningbo, Zhejiang 134.96 31.65 58.03 429.99 59.1561.89 Oman Ningbo, Zhejiang 261.38 61.89 114.72 438.91 59.8029.39 Saudi Arabia Ningbo, Zhejiang 124.82 29.39 55.63 445.68 61.0560.23 Venezuela Ningbo, Zhejiang 265.97 60.23 89.01 334.67 47.6720.52 South Sudan Ningbo, Zhejiang 87.04 20.52 37.63 432.39 59.15
Qingdao Eco. and Tech. Dev.Zone, Shandong 270.10 1,147.37 270.10 504.32 439.55 60.23Iran Qingdao, Shandong 232.12 54.51 102.02 439.53 60.38
64.14 Iraq Qingdao, Shandong 271.99 64.14 121.31 446.02 61.0262.84 Kuwait Qingdao, Shandong 267.95 62.84 118.03 440.49 60.5924.69 Russia Qingdao, Shandong 102.72 24.69 44.28 431.13 57.8717.18 Colombia Qingdao, Shandong 71.39 17.18 28.87 404.40 54.2115.70 US Qingdao, Shandong 66.56 15.70 29.61 444.93 60.8731.06 Cameroon Qingdao, Shandong 134.64 31.06 60.19 447.00 62.52
Qingdao Others, Shandong 421.27 1,797.17 421.27 799.48 444.86 61.22Angola Qingdao, Shandong 372.05 87.01 177.39 476.81 65.77
10.22 Iran Qingdao, Shandong 43.52 10.22 19.13 439.54 60.3861.46 Kuwait Qingdao, Shandong 262.06 61.46 115.44 440.49 60.5943.32 Russia Qingdao, Shandong 180.28 43.32 85.73 475.54 63.8364.73 Venezuela Qingdao, Shandong 285.86 64.73 100.82 352.71 50.2434.70 Colombia Qingdao, Shandong 144.18 34.70 63.81 442.55 59.3231.10 Brazil Qingdao, Shandong 132.96 31.10 61.75 464.43 64.0628.06 US Qingdao, Shandong 119.00 28.06 58.99 495.72 67.8160.66 Congo (Brazzaville) Qingdao, Shandong 257.26 60.66 116.42 452.54 61.91
Rizhao, Shandong 711.39 3,021.36 711.39 1,334.09 441.55 60.49Angola Qingdao, Shandong 536.87 125.56 244.46 455.35 62.81
14.17 Iran Qingdao, Shandong 60.36 14.17 26.50 439.12 60.32124.07 Oman Qingdao, Shandong 523.99 124.07 237.43 453.13 61.7375.91 Russia Qingdao, Shandong 315.86 75.91 140.34 444.32 59.6461.02 Saudi Arabia Qingdao, Shandong 259.14 61.02 116.65 450.14 61.6661.18 Venezuela Qingdao, Shandong 270.18 61.18 90.57 335.20 47.7591.20 Brazil Qingdao, Shandong 389.96 91.20 176.99 453.88 62.6030.71 Gabon Qingdao, Shandong 129.33 30.71 53.08 410.38 55.7663.85 UK Qingdao, Shandong 266.75 63.85 130.44 488.99 65.9031.00 Congo (Brazzaville) Qingdao, Shandong 131.47 31.00 59.21 450.38 61.61
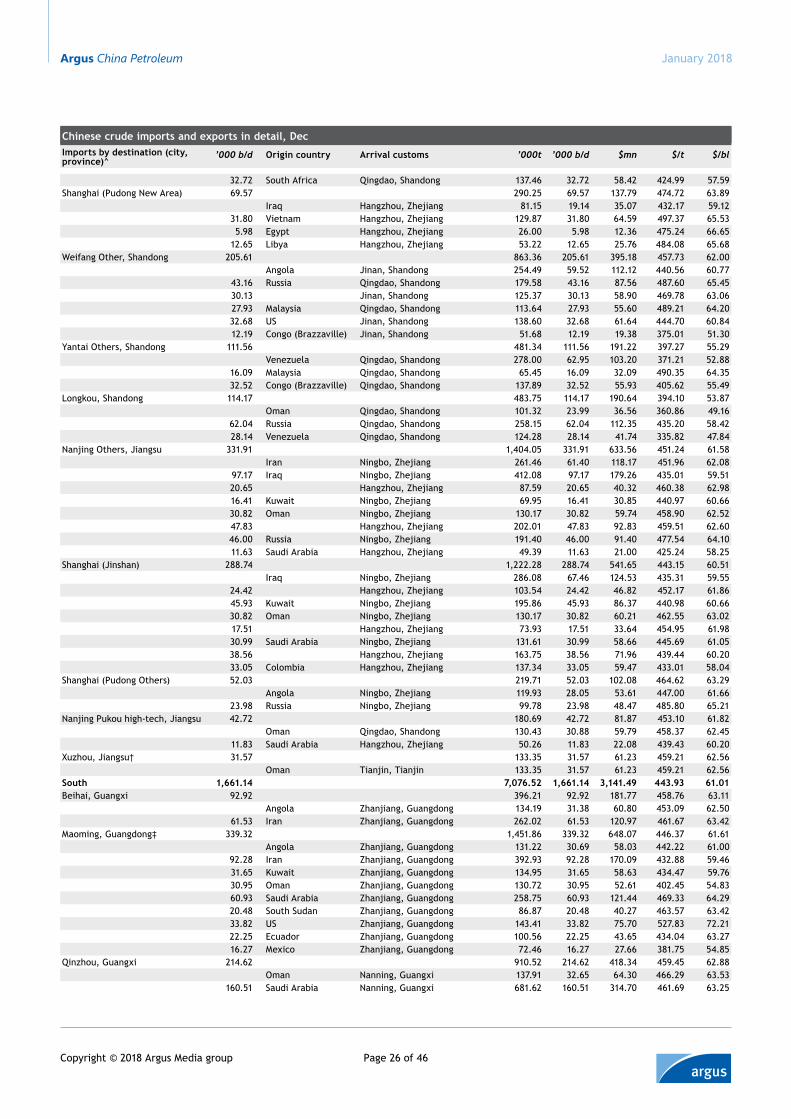
Argus China Petroleum
Page 26 of 46Copyright © 2018 Argus Media group
January 2018
Chinese crude imports and exports in detail, DecImports by destination (city, province)^
’000 b/d Origin country Arrival customs ’000t ’000 b/d $mn $/t $/bl
32.72 South Africa Qingdao, Shandong 137.46 32.72 58.42 424.99 57.59Shanghai (Pudong New Area) 69.57 290.25 69.57 137.79 474.72 63.89
Iraq Hangzhou, Zhejiang 81.15 19.14 35.07 432.17 59.1231.80 Vietnam Hangzhou, Zhejiang 129.87 31.80 64.59 497.37 65.535.98 Egypt Hangzhou, Zhejiang 26.00 5.98 12.36 475.24 66.65
12.65 Libya Hangzhou, Zhejiang 53.22 12.65 25.76 484.08 65.68Weifang Other, Shandong 205.61 863.36 205.61 395.18 457.73 62.00
Angola Jinan, Shandong 254.49 59.52 112.12 440.56 60.7743.16 Russia Qingdao, Shandong 179.58 43.16 87.56 487.60 65.4530.13 Jinan, Shandong 125.37 30.13 58.90 469.78 63.0627.93 Malaysia Qingdao, Shandong 113.64 27.93 55.60 489.21 64.2032.68 US Jinan, Shandong 138.60 32.68 61.64 444.70 60.8412.19 Congo (Brazzaville) Jinan, Shandong 51.68 12.19 19.38 375.01 51.30
Yantai Others, Shandong 111.56 481.34 111.56 191.22 397.27 55.29Venezuela Qingdao, Shandong 278.00 62.95 103.20 371.21 52.88
16.09 Malaysia Qingdao, Shandong 65.45 16.09 32.09 490.35 64.3532.52 Congo (Brazzaville) Qingdao, Shandong 137.89 32.52 55.93 405.62 55.49
Longkou, Shandong 114.17 483.75 114.17 190.64 394.10 53.87Oman Qingdao, Shandong 101.32 23.99 36.56 360.86 49.16
62.04 Russia Qingdao, Shandong 258.15 62.04 112.35 435.20 58.4228.14 Venezuela Qingdao, Shandong 124.28 28.14 41.74 335.82 47.84
Nanjing Others, Jiangsu 331.91 1,404.05 331.91 633.56 451.24 61.58Iran Ningbo, Zhejiang 261.46 61.40 118.17 451.96 62.08
97.17 Iraq Ningbo, Zhejiang 412.08 97.17 179.26 435.01 59.5120.65 Hangzhou, Zhejiang 87.59 20.65 40.32 460.38 62.9816.41 Kuwait Ningbo, Zhejiang 69.95 16.41 30.85 440.97 60.6630.82 Oman Ningbo, Zhejiang 130.17 30.82 59.74 458.90 62.5247.83 Hangzhou, Zhejiang 202.01 47.83 92.83 459.51 62.6046.00 Russia Ningbo, Zhejiang 191.40 46.00 91.40 477.54 64.1011.63 Saudi Arabia Hangzhou, Zhejiang 49.39 11.63 21.00 425.24 58.25
Shanghai (Jinshan) 288.74 1,222.28 288.74 541.65 443.15 60.51Iraq Ningbo, Zhejiang 286.08 67.46 124.53 435.31 59.55
24.42 Hangzhou, Zhejiang 103.54 24.42 46.82 452.17 61.8645.93 Kuwait Ningbo, Zhejiang 195.86 45.93 86.37 440.98 60.6630.82 Oman Ningbo, Zhejiang 130.17 30.82 60.21 462.55 63.0217.51 Hangzhou, Zhejiang 73.93 17.51 33.64 454.95 61.9830.99 Saudi Arabia Ningbo, Zhejiang 131.61 30.99 58.66 445.69 61.0538.56 Hangzhou, Zhejiang 163.75 38.56 71.96 439.44 60.2033.05 Colombia Hangzhou, Zhejiang 137.34 33.05 59.47 433.01 58.04
Shanghai (Pudong Others) 52.03 219.71 52.03 102.08 464.62 63.29Angola Ningbo, Zhejiang 119.93 28.05 53.61 447.00 61.66
23.98 Russia Ningbo, Zhejiang 99.78 23.98 48.47 485.80 65.21Nanjing Pukou high-tech, Jiangsu 42.72 180.69 42.72 81.87 453.10 61.82
Oman Qingdao, Shandong 130.43 30.88 59.79 458.37 62.4511.83 Saudi Arabia Hangzhou, Zhejiang 50.26 11.83 22.08 439.43 60.20
Xuzhou, Jiangsu† 31.57 133.35 31.57 61.23 459.21 62.56Oman Tianjin, Tianjin 133.35 31.57 61.23 459.21 62.56
South 1,661.14 7,076.52 1,661.14 3,141.49 443.93 61.01Beihai, Guangxi 92.92 396.21 92.92 181.77 458.76 63.11
Angola Zhanjiang, Guangdong 134.19 31.38 60.80 453.09 62.5061.53 Iran Zhanjiang, Guangdong 262.02 61.53 120.97 461.67 63.42
Maoming, Guangdong‡ 339.32 1,451.86 339.32 648.07 446.37 61.61Angola Zhanjiang, Guangdong 131.22 30.69 58.03 442.22 61.00
92.28 Iran Zhanjiang, Guangdong 392.93 92.28 170.09 432.88 59.4631.65 Kuwait Zhanjiang, Guangdong 134.95 31.65 58.63 434.47 59.7630.95 Oman Zhanjiang, Guangdong 130.72 30.95 52.61 402.45 54.8360.93 Saudi Arabia Zhanjiang, Guangdong 258.75 60.93 121.44 469.33 64.2920.48 South Sudan Zhanjiang, Guangdong 86.87 20.48 40.27 463.57 63.4233.82 US Zhanjiang, Guangdong 143.41 33.82 75.70 527.83 72.2122.25 Ecuador Zhanjiang, Guangdong 100.56 22.25 43.65 434.04 63.2716.27 Mexico Zhanjiang, Guangdong 72.46 16.27 27.66 381.75 54.85
Qinzhou, Guangxi 214.62 910.52 214.62 418.34 459.45 62.88Oman Nanning, Guangxi 137.91 32.65 64.30 466.29 63.53
160.51 Saudi Arabia Nanning, Guangxi 681.62 160.51 314.70 461.69 63.25
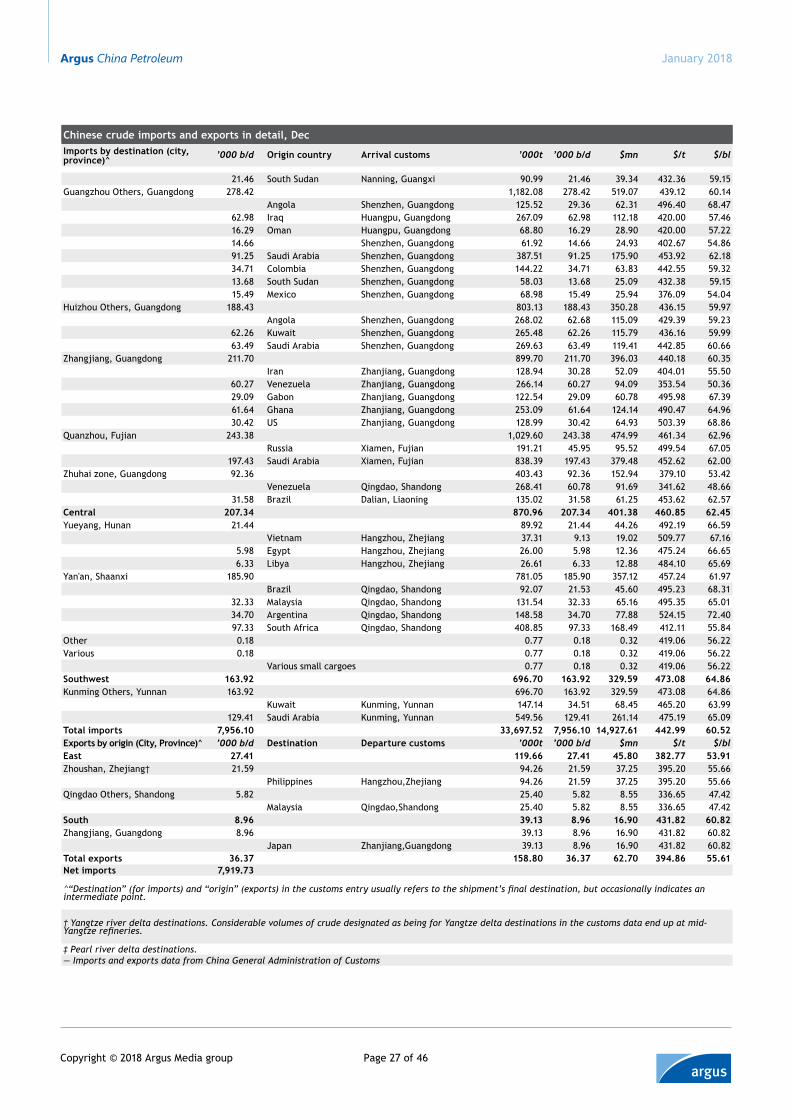
Argus China Petroleum
Page 27 of 46Copyright © 2018 Argus Media group
January 2018
Chinese crude imports and exports in detail, DecImports by destination (city, province)^ ’000 b/d Origin country Arrival customs ’000t ’000 b/d $mn $/t $/bl
21.46 South Sudan Nanning, Guangxi 90.99 21.46 39.34 432.36 59.15Guangzhou Others, Guangdong 278.42 1,182.08 278.42 519.07 439.12 60.14
Angola Shenzhen, Guangdong 125.52 29.36 62.31 496.40 68.4762.98 Iraq Huangpu, Guangdong 267.09 62.98 112.18 420.00 57.4616.29 Oman Huangpu, Guangdong 68.80 16.29 28.90 420.00 57.2214.66 Shenzhen, Guangdong 61.92 14.66 24.93 402.67 54.8691.25 Saudi Arabia Shenzhen, Guangdong 387.51 91.25 175.90 453.92 62.1834.71 Colombia Shenzhen, Guangdong 144.22 34.71 63.83 442.55 59.3213.68 South Sudan Shenzhen, Guangdong 58.03 13.68 25.09 432.38 59.1515.49 Mexico Shenzhen, Guangdong 68.98 15.49 25.94 376.09 54.04
Huizhou Others, Guangdong 188.43 803.13 188.43 350.28 436.15 59.97Angola Shenzhen, Guangdong 268.02 62.68 115.09 429.39 59.23
62.26 Kuwait Shenzhen, Guangdong 265.48 62.26 115.79 436.16 59.9963.49 Saudi Arabia Shenzhen, Guangdong 269.63 63.49 119.41 442.85 60.66
Zhangjiang, Guangdong 211.70 899.70 211.70 396.03 440.18 60.35Iran Zhanjiang, Guangdong 128.94 30.28 52.09 404.01 55.50
60.27 Venezuela Zhanjiang, Guangdong 266.14 60.27 94.09 353.54 50.3629.09 Gabon Zhanjiang, Guangdong 122.54 29.09 60.78 495.98 67.3961.64 Ghana Zhanjiang, Guangdong 253.09 61.64 124.14 490.47 64.9630.42 US Zhanjiang, Guangdong 128.99 30.42 64.93 503.39 68.86
Quanzhou, Fujian 243.38 1,029.60 243.38 474.99 461.34 62.96Russia Xiamen, Fujian 191.21 45.95 95.52 499.54 67.05
197.43 Saudi Arabia Xiamen, Fujian 838.39 197.43 379.48 452.62 62.00Zhuhai zone, Guangdong 92.36 403.43 92.36 152.94 379.10 53.42
Venezuela Qingdao, Shandong 268.41 60.78 91.69 341.62 48.6631.58 Brazil Dalian, Liaoning 135.02 31.58 61.25 453.62 62.57
Central 207.34 870.96 207.34 401.38 460.85 62.45Yueyang, Hunan 21.44 89.92 21.44 44.26 492.19 66.59
Vietnam Hangzhou, Zhejiang 37.31 9.13 19.02 509.77 67.165.98 Egypt Hangzhou, Zhejiang 26.00 5.98 12.36 475.24 66.656.33 Libya Hangzhou, Zhejiang 26.61 6.33 12.88 484.10 65.69
Yan'an, Shaanxi 185.90 781.05 185.90 357.12 457.24 61.97Brazil Qingdao, Shandong 92.07 21.53 45.60 495.23 68.31
32.33 Malaysia Qingdao, Shandong 131.54 32.33 65.16 495.35 65.0134.70 Argentina Qingdao, Shandong 148.58 34.70 77.88 524.15 72.4097.33 South Africa Qingdao, Shandong 408.85 97.33 168.49 412.11 55.84
Other 0.18 0.77 0.18 0.32 419.06 56.22Various 0.18 0.77 0.18 0.32 419.06 56.22
Various small cargoes 0.77 0.18 0.32 419.06 56.22Southwest 163.92 696.70 163.92 329.59 473.08 64.86Kunming Others, Yunnan 163.92 696.70 163.92 329.59 473.08 64.86
Kuwait Kunming, Yunnan 147.14 34.51 68.45 465.20 63.99129.41 Saudi Arabia Kunming, Yunnan 549.56 129.41 261.14 475.19 65.09
Total imports 7,956.10 33,697.52 7,956.10 14,927.61 442.99 60.52Exports by origin (City, Province)̂ ’000 b/d Destination Departure customs ’000t ’000 b/d $mn $/t $/blEast 27.41 119.66 27.41 45.80 382.77 53.91Zhoushan, Zhejiang† 21.59 94.26 21.59 37.25 395.20 55.66
Philippines Hangzhou,Zhejiang 94.26 21.59 37.25 395.20 55.66Qingdao Others, Shandong 5.82 25.40 5.82 8.55 336.65 47.42
Malaysia Qingdao,Shandong 25.40 5.82 8.55 336.65 47.42South 8.96 39.13 8.96 16.90 431.82 60.82Zhangjiang, Guangdong 8.96 39.13 8.96 16.90 431.82 60.82
Japan Zhanjiang,Guangdong 39.13 8.96 16.90 431.82 60.82Total exports 36.37 158.80 36.37 62.70 394.86 55.61Net imports 7,919.73
^“Destination” (for imports) and “origin” (exports) in the customs entry usually refers to the shipment’s final destination, but occasionally indicates an intermediate point.
† Yangtze river delta destinations. Considerable volumes of crude designated as being for Yangtze delta destinations in the customs data end up at mid-Yangtze refineries.
‡ Pearl river delta destinations.— Imports and exports data from China General Administration of Customs
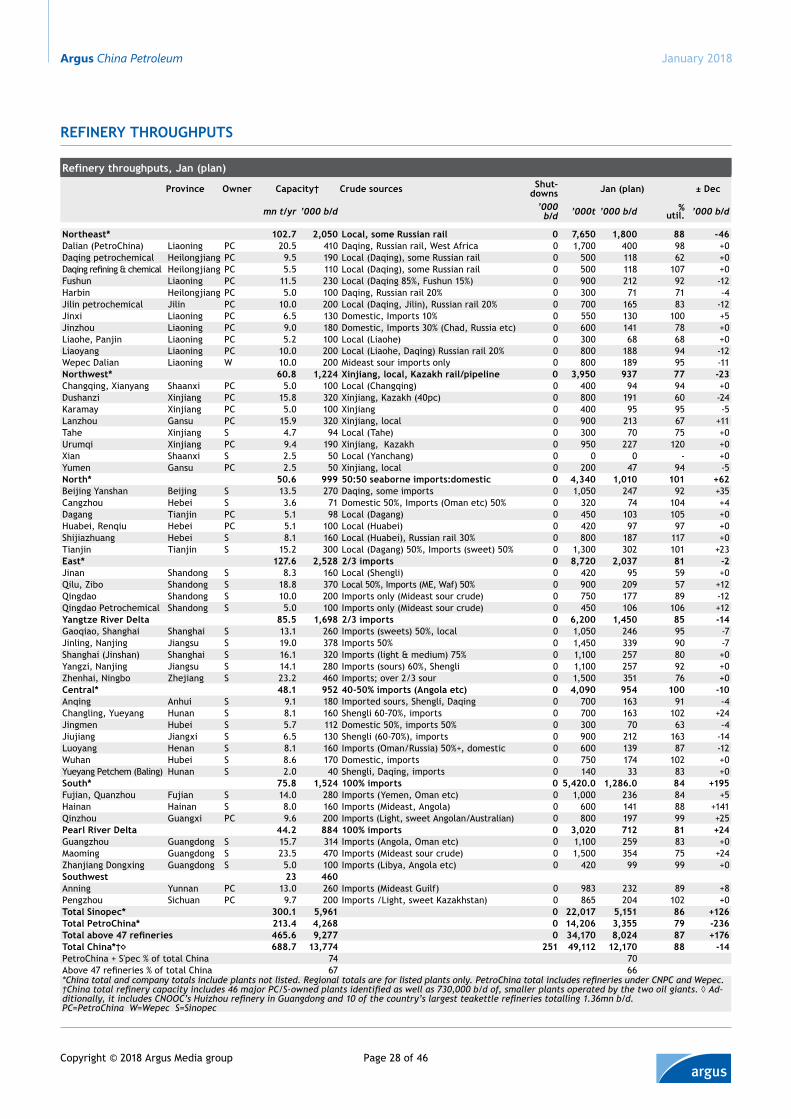
Argus China Petroleum
Page 28 of 46Copyright © 2018 Argus Media group
January 2018
refinery throughputs
refinery throughputs, Jan (plan)
province owner Capacity† Crude sources shut-downs Jan (plan) ± Dec
mn t/yr ’000 b/d ’000 b/d ’000t ’000 b/d %
util. ’000 b/d
northeast* 102.7 2,050 Local, some russian rail 0 7,650 1,800 88 -46Dalian (PetroChina) Liaoning PC 20.5 410 Daqing, Russian rail, West Africa 0 1,700 400 98 +0Daqing petrochemical Heilongjiang PC 9.5 190 Local (Daqing), some Russian rail 0 500 118 62 +0Daqing refining & chemical Heilongjiang PC 5.5 110 Local (Daqing), some Russian rail 0 500 118 107 +0Fushun Liaoning PC 11.5 230 Local (Daqing 85%, Fushun 15%) 0 900 212 92 -12Harbin Heilongjiang PC 5.0 100 Daqing, Russian rail 20% 0 300 71 71 -4Jilin petrochemical Jilin PC 10.0 200 Local (Daqing, Jilin), Russian rail 20% 0 700 165 83 -12Jinxi Liaoning PC 6.5 130 Domestic, Imports 10% 0 550 130 100 +5Jinzhou Liaoning PC 9.0 180 Domestic, Imports 30% (Chad, Russia etc) 0 600 141 78 +0Liaohe, Panjin Liaoning PC 5.2 100 Local (Liaohe) 0 300 68 68 +0Liaoyang Liaoning PC 10.0 200 Local (Liaohe, Daqing) Russian rail 20% 0 800 188 94 -12Wepec Dalian Liaoning W 10.0 200 Mideast sour imports only 0 800 189 95 -11northwest* 60.8 1,224 Xinjiang, local, Kazakh rail/pipeline 0 3,950 937 77 -23Changqing, Xianyang Shaanxi PC 5.0 100 Local (Changqing) 0 400 94 94 +0Dushanzi Xinjiang PC 15.8 320 Xinjiang, Kazakh (40pc) 0 800 191 60 -24Karamay Xinjiang PC 5.0 100 Xinjiang 0 400 95 95 -5Lanzhou Gansu PC 15.9 320 Xinjiang, local 0 900 213 67 +11Tahe Xinjiang S 4.7 94 Local (Tahe) 0 300 70 75 +0Urumqi Xinjiang PC 9.4 190 Xinjiang, Kazakh 0 950 227 120 +0Xian Shaanxi S 2.5 50 Local (Yanchang) 0 0 0 - +0Yumen Gansu PC 2.5 50 Xinjiang, local 0 200 47 94 -5north* 50.6 999 50:50 seaborne imports:domestic 0 4,340 1,010 101 +62Beijing Yanshan Beijing S 13.5 270 Daqing, some imports 0 1,050 247 92 +35Cangzhou Hebei S 3.6 71 Domestic 50%, Imports (Oman etc) 50% 0 320 74 104 +4Dagang Tianjin PC 5.1 98 Local (Dagang) 0 450 103 105 +0Huabei, Renqiu Hebei PC 5.1 100 Local (Huabei) 0 420 97 97 +0Shijiazhuang Hebei S 8.1 160 Local (Huabei), Russian rail 30% 0 800 187 117 +0Tianjin Tianjin S 15.2 300 Local (Dagang) 50%, Imports (sweet) 50% 0 1,300 302 101 +23east* 127.6 2,528 2/3 imports 0 8,720 2,037 81 -2Jinan Shandong S 8.3 160 Local (Shengli) 0 420 95 59 +0Qilu, Zibo Shandong S 18.8 370 Local 50%, Imports (ME, Waf) 50% 0 900 209 57 +12Qingdao Shandong S 10.0 200 Imports only (Mideast sour crude) 0 750 177 89 -12Qingdao Petrochemical Shandong S 5.0 100 Imports only (Mideast sour crude) 0 450 106 106 +12yangtze river Delta 85.5 1,698 2/3 imports 0 6,200 1,450 85 -14Gaoqiao, Shanghai Shanghai S 13.1 260 Imports (sweets) 50%, local 0 1,050 246 95 -7Jinling, Nanjing Jiangsu S 19.0 378 Imports 50% 0 1,450 339 90 -7Shanghai (Jinshan) Shanghai S 16.1 320 Imports (light & medium) 75% 0 1,100 257 80 +0Yangzi, Nanjing Jiangsu S 14.1 280 Imports (sours) 60%, Shengli 0 1,100 257 92 +0Zhenhai, Ningbo Zhejiang S 23.2 460 Imports; over 2/3 sour 0 1,500 351 76 +0Central* 48.1 952 40-50% imports (Angola etc) 0 4,090 954 100 -10Anqing Anhui S 9.1 180 Imported sours, Shengli, Daqing 0 700 163 91 -4Changling, Yueyang Hunan S 8.1 160 Shengli 60-70%, imports 0 700 163 102 +24Jingmen Hubei S 5.7 112 Domestic 50%, imports 50% 0 300 70 63 -4Jiujiang Jiangxi S 6.5 130 Shengli (60-70%), imports 0 900 212 163 -14Luoyang Henan S 8.1 160 Imports (Oman/Russia) 50%+, domestic 0 600 139 87 -12Wuhan Hubei S 8.6 170 Domestic, imports 0 750 174 102 +0Yueyang Petchem (Baling) Hunan S 2.0 40 Shengli, Daqing, imports 0 140 33 83 +0south* 75.8 1,524 100% imports 0 5,420.0 1,286.0 84 +195Fujian, Quanzhou Fujian S 14.0 280 Imports (Yemen, Oman etc) 0 1,000 236 84 +5Hainan Hainan S 8.0 160 Imports (Mideast, Angola) 0 600 141 88 +141Qinzhou Guangxi PC 9.6 200 Imports (Light, sweet Angolan/Australian) 0 800 197 99 +25pearl river Delta 44.2 884 100% imports 0 3,020 712 81 +24Guangzhou Guangdong S 15.7 314 Imports (Angola, Oman etc) 0 1,100 259 83 +0Maoming Guangdong S 23.5 470 Imports (Mideast sour crude) 0 1,500 354 75 +24Zhanjiang Dongxing Guangdong S 5.0 100 Imports (Libya, Angola etc) 0 420 99 99 +0southwest 23 460Anning Yunnan PC 13.0 260 Imports (Mideast Guilf) 0 983 232 89 +8Pengzhou Sichuan PC 9.7 200 Imports /Light, sweet Kazakhstan) 0 865 204 102 +0total sinopec* 300.1 5,961 0 22,017 5,151 86 +126total petroChina* 213.4 4,268 0 14,206 3,355 79 -236Total above 47 refineries 465.6 9,277 0 34,170 8,024 87 +176Total China*†◊ 688.7 13,774 251 49,112 12,170 88 -14PetroChina + S'pec % of total China 74 70Above 47 refineries % of total China 67 66*China total and company totals include plants not listed. Regional totals are for listed plants only. PetroChina total includes refineries under CNPC and Wepec. †China total refinery capacity includes 46 major PC/S-owned plants identified as well as 730,000 b/d of, smaller plants operated by the two oil giants. ◊ Ad-ditionally, it includes CNOOC’s Huizhou refinery in Guangdong and 10 of the country’s largest teakettle refineries totalling 1.36mn b/d.PC=PetroChina W=Wepec S=Sinopec
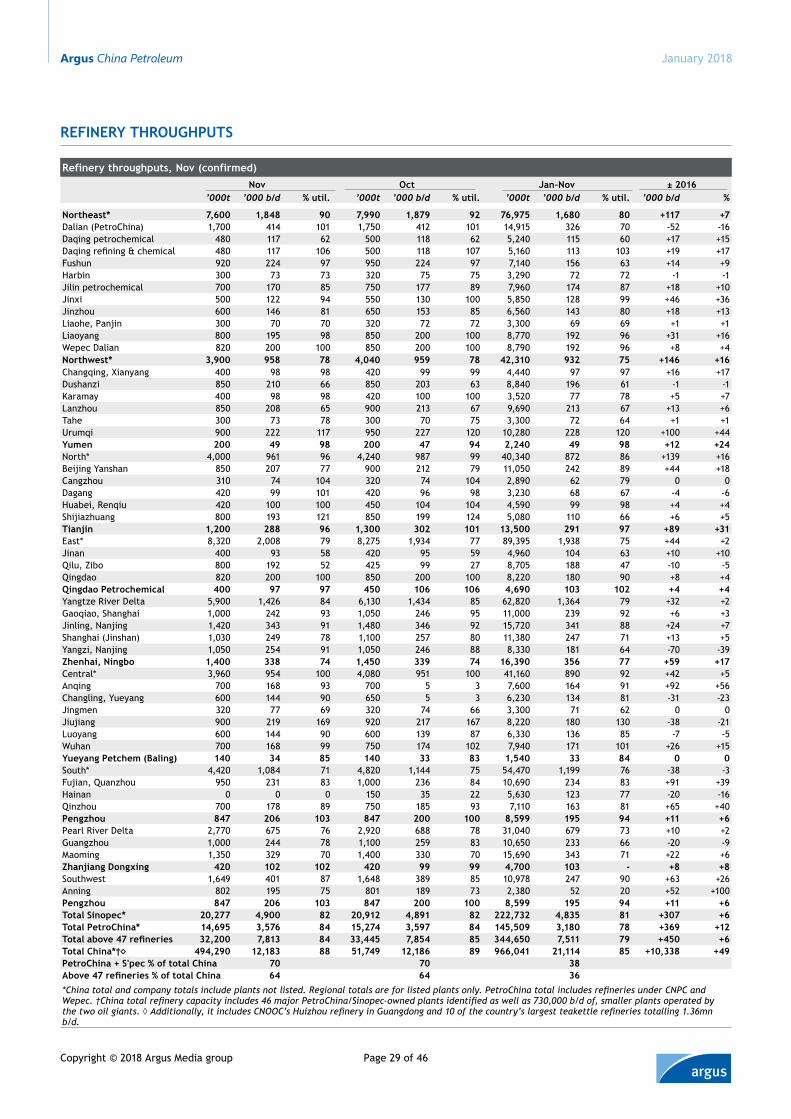
Argus China Petroleum
Page 29 of 46Copyright © 2018 Argus Media group
January 2018
refinery throughputs
refinery throughputs, nov (confirmed)nov oct Jan-nov ± 2016
’000t ’000 b/d % util. ’000t ’000 b/d % util. ’000t ’000 b/d % util. ’000 b/d %
northeast* 7,600 1,848 90 7,990 1,879 92 76,975 1,680 80 +117 +7Dalian (PetroChina) 1,700 414 101 1,750 412 101 14,915 326 70 -52 -16Daqing petrochemical 480 117 62 500 118 62 5,240 115 60 +17 +15Daqing refining & chemical 480 117 106 500 118 107 5,160 113 103 +19 +17Fushun 920 224 97 950 224 97 7,140 156 63 +14 +9Harbin 300 73 73 320 75 75 3,290 72 72 -1 -1Jilin petrochemical 700 170 85 750 177 89 7,960 174 87 +18 +10Jinxi 500 122 94 550 130 100 5,850 128 99 +46 +36Jinzhou 600 146 81 650 153 85 6,560 143 80 +18 +13Liaohe, Panjin 300 70 70 320 72 72 3,300 69 69 +1 +1Liaoyang 800 195 98 850 200 100 8,770 192 96 +31 +16Wepec Dalian 820 200 100 850 200 100 8,790 192 96 +8 +4northwest* 3,900 958 78 4,040 959 78 42,310 932 75 +146 +16Changqing, Xianyang 400 98 98 420 99 99 4,440 97 97 +16 +17Dushanzi 850 210 66 850 203 63 8,840 196 61 -1 -1Karamay 400 98 98 420 100 100 3,520 77 78 +5 +7Lanzhou 850 208 65 900 213 67 9,690 213 67 +13 +6Tahe 300 73 78 300 70 75 3,300 72 64 +1 +1Urumqi 900 222 117 950 227 120 10,280 228 120 +100 +44yumen 200 49 98 200 47 94 2,240 49 98 +12 +24North* 4,000 961 96 4,240 987 99 40,340 872 86 +139 +16Beijing Yanshan 850 207 77 900 212 79 11,050 242 89 +44 +18Cangzhou 310 74 104 320 74 104 2,890 62 79 0 0Dagang 420 99 101 420 96 98 3,230 68 67 -4 -6Huabei, Renqiu 420 100 100 450 104 104 4,590 99 98 +4 +4Shijiazhuang 800 193 121 850 199 124 5,080 110 66 +6 +5tianjin 1,200 288 96 1,300 302 101 13,500 291 97 +89 +31East* 8,320 2,008 79 8,275 1,934 77 89,395 1,938 75 +44 +2Jinan 400 93 58 420 95 59 4,960 104 63 +10 +10Qilu, Zibo 800 192 52 425 99 27 8,705 188 47 -10 -5Qingdao 820 200 100 850 200 100 8,220 180 90 +8 +4Qingdao petrochemical 400 97 97 450 106 106 4,690 103 102 +4 +4Yangtze River Delta 5,900 1,426 84 6,130 1,434 85 62,820 1,364 79 +32 +2Gaoqiao, Shanghai 1,000 242 93 1,050 246 95 11,000 239 92 +6 +3Jinling, Nanjing 1,420 343 91 1,480 346 92 15,720 341 88 +24 +7Shanghai (Jinshan) 1,030 249 78 1,100 257 80 11,380 247 71 +13 +5Yangzi, Nanjing 1,050 254 91 1,050 246 88 8,330 181 64 -70 -39Zhenhai, ningbo 1,400 338 74 1,450 339 74 16,390 356 77 +59 +17Central* 3,960 954 100 4,080 951 100 41,160 890 92 +42 +5Anqing 700 168 93 700 5 3 7,600 164 91 +92 +56Changling, Yueyang 600 144 90 650 5 3 6,230 134 81 -31 -23Jingmen 320 77 69 320 74 66 3,300 71 62 0 0Jiujiang 900 219 169 920 217 167 8,220 180 130 -38 -21Luoyang 600 144 90 600 139 87 6,330 136 85 -7 -5Wuhan 700 168 99 750 174 102 7,940 171 101 +26 +15yueyang petchem (Baling) 140 34 85 140 33 83 1,540 33 84 0 0South* 4,420 1,084 71 4,820 1,144 75 54,470 1,199 76 -38 -3Fujian, Quanzhou 950 231 83 1,000 236 84 10,690 234 83 +91 +39Hainan 0 0 0 150 35 22 5,630 123 77 -20 -16Qinzhou 700 178 89 750 185 93 7,110 163 81 +65 +40pengzhou 847 206 103 847 200 100 8,599 195 94 +11 +6Pearl River Delta 2,770 675 76 2,920 688 78 31,040 679 73 +10 +2Guangzhou 1,000 244 78 1,100 259 83 10,650 233 66 -20 -9Maoming 1,350 329 70 1,400 330 70 15,690 343 71 +22 +6Zhanjiang Dongxing 420 102 102 420 99 99 4,700 103 - +8 +8Southwest 1,649 401 87 1,648 389 85 10,978 247 90 +63 +26Anning 802 195 75 801 189 73 2,380 52 20 +52 +100pengzhou 847 206 103 847 200 100 8,599 195 94 +11 +6total sinopec* 20,277 4,900 82 20,912 4,891 82 222,732 4,835 81 +307 +6total petroChina* 14,695 3,576 84 15,274 3,597 84 145,509 3,180 78 +369 +12Total above 47 refineries 32,200 7,813 84 33,445 7,854 85 344,650 7,511 79 +450 +6Total China*†◊ 494,290 12,183 88 51,749 12,186 89 966,041 21,114 85 +10,338 +49petroChina + s'pec % of total China 70 70 38Above 47 refineries % of total China 64 64 36
*China total and company totals include plants not listed. Regional totals are for listed plants only. PetroChina total includes refineries under CNPC and Wepec. †China total refinery capacity includes 46 major PetroChina/Sinopec-owned plants identified as well as 730,000 b/d of, smaller plants operated by the two oil giants. ◊ Additionally, it includes CNOOC’s Huizhou refinery in Guangdong and 10 of the country’s largest teakettle refineries totalling 1.36mn b/d.
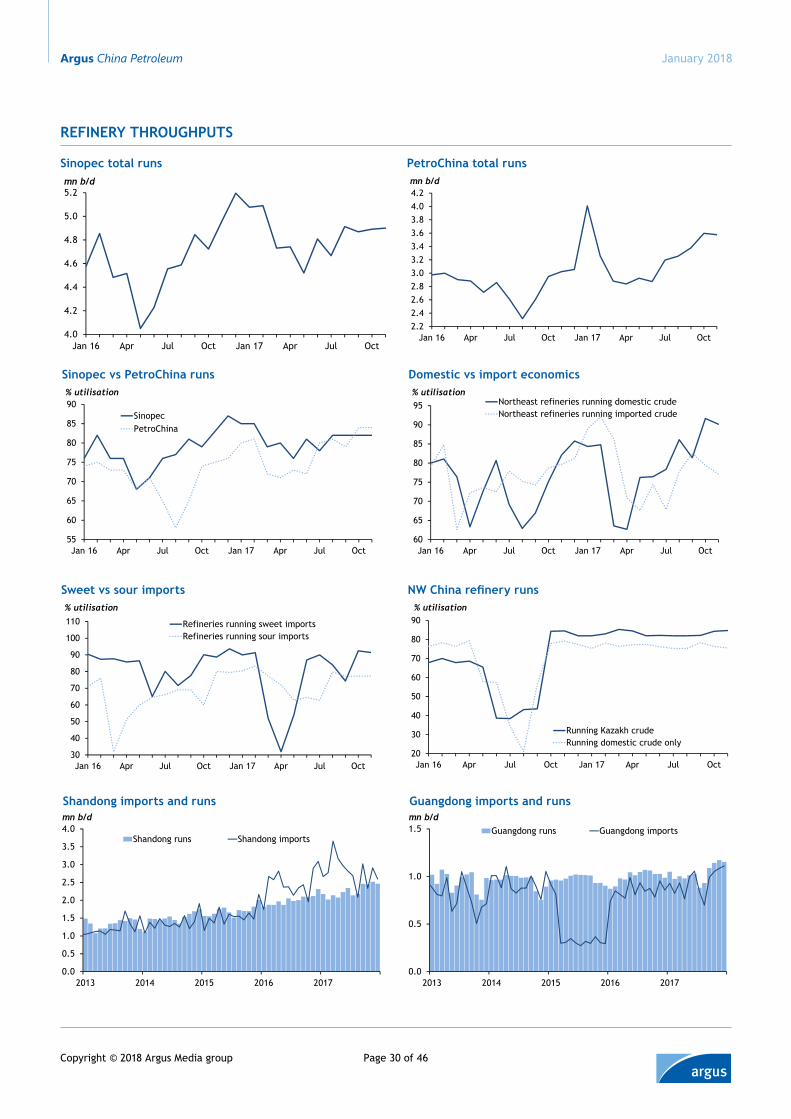
Argus China Petroleum
Page 30 of 46Copyright © 2018 Argus Media group
January 2018
refinery throughputs
sinopec total runs
4.0
4.2
4.4
4.6
4.8
5.0
5.2
Jan 16 Apr Jul Oct Jan 17 Apr Jul Oct
mn b/d
sinopec vs petroChina runs
55
60
65
70
75
80
85
90
Jan 16 Apr Jul Oct Jan 17 Apr Jul Oct
SinopecPetroChina
% utilisation
sweet vs sour imports
30
40
50
60
70
80
90
100
110
Jan 16 Apr Jul Oct Jan 17 Apr Jul Oct
Refineries running sweet importsRefineries running sour imports
% utilisation
shandong imports and runs
0.0
0.5
1.0
1.5
2.0
2.5
3.0
3.5
4.0
2013 2014 2015 2016 2017
Shandong runs Shandong imports
mn b/d
petroChina total runs
2.22.42.62.83.03.23.43.63.84.04.2
Jan 16 Apr Jul Oct Jan 17 Apr Jul Oct
mn b/d
Domestic vs import economics
60
65
70
75
80
85
90
95
Jan 16 Apr Jul Oct Jan 17 Apr Jul Oct
Northeast refineries running domestic crudeNortheast refineries running imported crude
% utilisation
NW China refinery runs
20
30
40
50
60
70
80
90
Jan 16 Apr Jul Oct Jan 17 Apr Jul Oct
Running Kazakh crudeRunning domestic crude only
% utilisation
guangdong imports and runs
0.0
0.5
1.0
1.5
2013 2014 2015 2016 2017
Guangdong runs Guangdong importsmn b/d
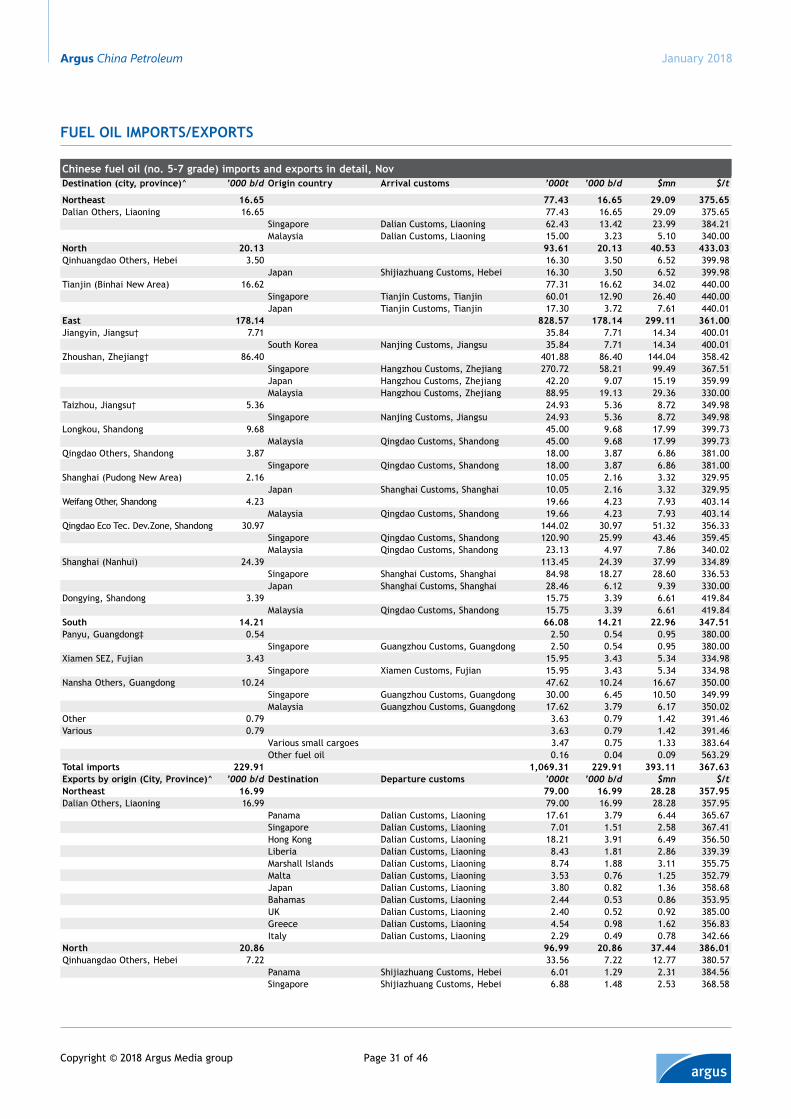
Argus China Petroleum
Page 31 of 46Copyright © 2018 Argus Media group
January 2018
Fuel oil imports/exports
Chinese fuel oil (no. 5-7 grade) imports and exports in detail, NovDestination (city, province)^ ’000 b/d origin country Arrival customs ’000t ’000 b/d $mn $/t
Northeast 16.65 77.43 16.65 29.09 375.65Dalian Others, Liaoning 16.65 77.43 16.65 29.09 375.65
Singapore Dalian Customs, Liaoning 62.43 13.42 23.99 384.21Malaysia Dalian Customs, Liaoning 15.00 3.23 5.10 340.00
North 20.13 93.61 20.13 40.53 433.03Qinhuangdao Others, Hebei 3.50 16.30 3.50 6.52 399.98
Japan Shijiazhuang Customs, Hebei 16.30 3.50 6.52 399.98Tianjin (Binhai New Area) 16.62 77.31 16.62 34.02 440.00
Singapore Tianjin Customs, Tianjin 60.01 12.90 26.40 440.00Japan Tianjin Customs, Tianjin 17.30 3.72 7.61 440.01
east 178.14 828.57 178.14 299.11 361.00Jiangyin, Jiangsu† 7.71 35.84 7.71 14.34 400.01
South Korea Nanjing Customs, Jiangsu 35.84 7.71 14.34 400.01Zhoushan, Zhejiang† 86.40 401.88 86.40 144.04 358.42
Singapore Hangzhou Customs, Zhejiang 270.72 58.21 99.49 367.51Japan Hangzhou Customs, Zhejiang 42.20 9.07 15.19 359.99Malaysia Hangzhou Customs, Zhejiang 88.95 19.13 29.36 330.00
Taizhou, Jiangsu† 5.36 24.93 5.36 8.72 349.98Singapore Nanjing Customs, Jiangsu 24.93 5.36 8.72 349.98
Longkou, Shandong 9.68 45.00 9.68 17.99 399.73Malaysia Qingdao Customs, Shandong 45.00 9.68 17.99 399.73
Qingdao Others, Shandong 3.87 18.00 3.87 6.86 381.00Singapore Qingdao Customs, Shandong 18.00 3.87 6.86 381.00
Shanghai (Pudong New Area) 2.16 10.05 2.16 3.32 329.95Japan Shanghai Customs, Shanghai 10.05 2.16 3.32 329.95
Weifang Other, Shandong 4.23 19.66 4.23 7.93 403.14Malaysia Qingdao Customs, Shandong 19.66 4.23 7.93 403.14
Qingdao Eco Tec. Dev.Zone, Shandong 30.97 144.02 30.97 51.32 356.33Singapore Qingdao Customs, Shandong 120.90 25.99 43.46 359.45Malaysia Qingdao Customs, Shandong 23.13 4.97 7.86 340.02
Shanghai (Nanhui) 24.39 113.45 24.39 37.99 334.89Singapore Shanghai Customs, Shanghai 84.98 18.27 28.60 336.53Japan Shanghai Customs, Shanghai 28.46 6.12 9.39 330.00
Dongying, Shandong 3.39 15.75 3.39 6.61 419.84Malaysia Qingdao Customs, Shandong 15.75 3.39 6.61 419.84
south 14.21 66.08 14.21 22.96 347.51Panyu, Guangdong‡ 0.54 2.50 0.54 0.95 380.00
Singapore Guangzhou Customs, Guangdong 2.50 0.54 0.95 380.00Xiamen SEZ, Fujian 3.43 15.95 3.43 5.34 334.98
Singapore Xiamen Customs, Fujian 15.95 3.43 5.34 334.98Nansha Others, Guangdong 10.24 47.62 10.24 16.67 350.00
Singapore Guangzhou Customs, Guangdong 30.00 6.45 10.50 349.99Malaysia Guangzhou Customs, Guangdong 17.62 3.79 6.17 350.02
Other 0.79 3.63 0.79 1.42 391.46Various 0.79 3.63 0.79 1.42 391.46
Various small cargoes 3.47 0.75 1.33 383.64Other fuel oil 0.16 0.04 0.09 563.29
total imports 229.91 1,069.31 229.91 393.11 367.63exports by origin (City, province)^ ’000 b/d Destination Departure customs ’000t ’000 b/d $mn $/tNortheast 16.99 79.00 16.99 28.28 357.95Dalian Others, Liaoning 16.99 79.00 16.99 28.28 357.95
Panama Dalian Customs, Liaoning 17.61 3.79 6.44 365.67Singapore Dalian Customs, Liaoning 7.01 1.51 2.58 367.41Hong Kong Dalian Customs, Liaoning 18.21 3.91 6.49 356.50Liberia Dalian Customs, Liaoning 8.43 1.81 2.86 339.39Marshall Islands Dalian Customs, Liaoning 8.74 1.88 3.11 355.75Malta Dalian Customs, Liaoning 3.53 0.76 1.25 352.79Japan Dalian Customs, Liaoning 3.80 0.82 1.36 358.68Bahamas Dalian Customs, Liaoning 2.44 0.53 0.86 353.95UK Dalian Customs, Liaoning 2.40 0.52 0.92 385.00Greece Dalian Customs, Liaoning 4.54 0.98 1.62 356.83Italy Dalian Customs, Liaoning 2.29 0.49 0.78 342.66
North 20.86 96.99 20.86 37.44 386.01Qinhuangdao Others, Hebei 7.22 33.56 7.22 12.77 380.57
Panama Shijiazhuang Customs, Hebei 6.01 1.29 2.31 384.56Singapore Shijiazhuang Customs, Hebei 6.88 1.48 2.53 368.58
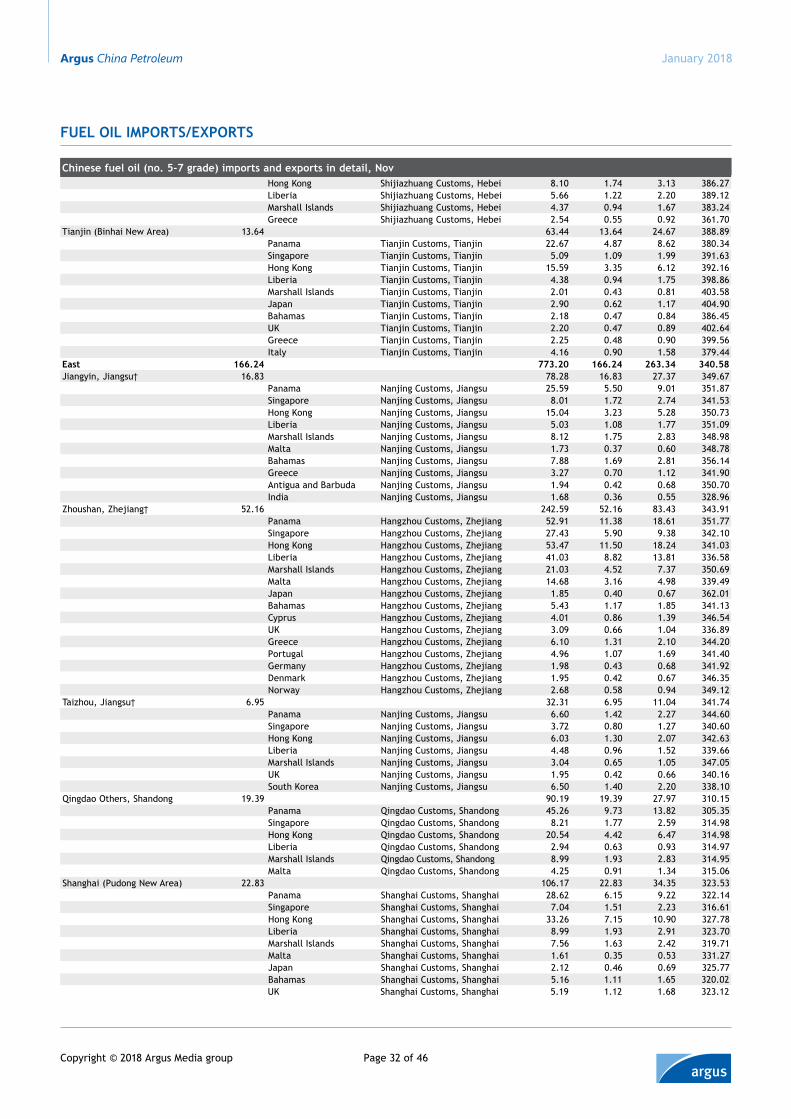
Argus China Petroleum
Page 32 of 46Copyright © 2018 Argus Media group
January 2018
Fuel oil imports/exports
Chinese fuel oil (no. 5-7 grade) imports and exports in detail, NovHong Kong Shijiazhuang Customs, Hebei 8.10 1.74 3.13 386.27Liberia Shijiazhuang Customs, Hebei 5.66 1.22 2.20 389.12Marshall Islands Shijiazhuang Customs, Hebei 4.37 0.94 1.67 383.24Greece Shijiazhuang Customs, Hebei 2.54 0.55 0.92 361.70
Tianjin (Binhai New Area) 13.64 63.44 13.64 24.67 388.89Panama Tianjin Customs, Tianjin 22.67 4.87 8.62 380.34Singapore Tianjin Customs, Tianjin 5.09 1.09 1.99 391.63Hong Kong Tianjin Customs, Tianjin 15.59 3.35 6.12 392.16Liberia Tianjin Customs, Tianjin 4.38 0.94 1.75 398.86Marshall Islands Tianjin Customs, Tianjin 2.01 0.43 0.81 403.58Japan Tianjin Customs, Tianjin 2.90 0.62 1.17 404.90Bahamas Tianjin Customs, Tianjin 2.18 0.47 0.84 386.45UK Tianjin Customs, Tianjin 2.20 0.47 0.89 402.64Greece Tianjin Customs, Tianjin 2.25 0.48 0.90 399.56Italy Tianjin Customs, Tianjin 4.16 0.90 1.58 379.44
east 166.24 773.20 166.24 263.34 340.58Jiangyin, Jiangsu† 16.83 78.28 16.83 27.37 349.67
Panama Nanjing Customs, Jiangsu 25.59 5.50 9.01 351.87Singapore Nanjing Customs, Jiangsu 8.01 1.72 2.74 341.53Hong Kong Nanjing Customs, Jiangsu 15.04 3.23 5.28 350.73Liberia Nanjing Customs, Jiangsu 5.03 1.08 1.77 351.09Marshall Islands Nanjing Customs, Jiangsu 8.12 1.75 2.83 348.98Malta Nanjing Customs, Jiangsu 1.73 0.37 0.60 348.78Bahamas Nanjing Customs, Jiangsu 7.88 1.69 2.81 356.14Greece Nanjing Customs, Jiangsu 3.27 0.70 1.12 341.90Antigua and Barbuda Nanjing Customs, Jiangsu 1.94 0.42 0.68 350.70India Nanjing Customs, Jiangsu 1.68 0.36 0.55 328.96
Zhoushan, Zhejiang† 52.16 242.59 52.16 83.43 343.91Panama Hangzhou Customs, Zhejiang 52.91 11.38 18.61 351.77Singapore Hangzhou Customs, Zhejiang 27.43 5.90 9.38 342.10Hong Kong Hangzhou Customs, Zhejiang 53.47 11.50 18.24 341.03Liberia Hangzhou Customs, Zhejiang 41.03 8.82 13.81 336.58Marshall Islands Hangzhou Customs, Zhejiang 21.03 4.52 7.37 350.69Malta Hangzhou Customs, Zhejiang 14.68 3.16 4.98 339.49Japan Hangzhou Customs, Zhejiang 1.85 0.40 0.67 362.01Bahamas Hangzhou Customs, Zhejiang 5.43 1.17 1.85 341.13Cyprus Hangzhou Customs, Zhejiang 4.01 0.86 1.39 346.54UK Hangzhou Customs, Zhejiang 3.09 0.66 1.04 336.89Greece Hangzhou Customs, Zhejiang 6.10 1.31 2.10 344.20Portugal Hangzhou Customs, Zhejiang 4.96 1.07 1.69 341.40Germany Hangzhou Customs, Zhejiang 1.98 0.43 0.68 341.92Denmark Hangzhou Customs, Zhejiang 1.95 0.42 0.67 346.35Norway Hangzhou Customs, Zhejiang 2.68 0.58 0.94 349.12
Taizhou, Jiangsu† 6.95 32.31 6.95 11.04 341.74Panama Nanjing Customs, Jiangsu 6.60 1.42 2.27 344.60Singapore Nanjing Customs, Jiangsu 3.72 0.80 1.27 340.60Hong Kong Nanjing Customs, Jiangsu 6.03 1.30 2.07 342.63Liberia Nanjing Customs, Jiangsu 4.48 0.96 1.52 339.66Marshall Islands Nanjing Customs, Jiangsu 3.04 0.65 1.05 347.05UK Nanjing Customs, Jiangsu 1.95 0.42 0.66 340.16South Korea Nanjing Customs, Jiangsu 6.50 1.40 2.20 338.10
Qingdao Others, Shandong 19.39 90.19 19.39 27.97 310.15Panama Qingdao Customs, Shandong 45.26 9.73 13.82 305.35Singapore Qingdao Customs, Shandong 8.21 1.77 2.59 314.98Hong Kong Qingdao Customs, Shandong 20.54 4.42 6.47 314.98Liberia Qingdao Customs, Shandong 2.94 0.63 0.93 314.97Marshall Islands Qingdao Customs, Shandong 8.99 1.93 2.83 314.95Malta Qingdao Customs, Shandong 4.25 0.91 1.34 315.06
Shanghai (Pudong New Area) 22.83 106.17 22.83 34.35 323.53Panama Shanghai Customs, Shanghai 28.62 6.15 9.22 322.14Singapore Shanghai Customs, Shanghai 7.04 1.51 2.23 316.61Hong Kong Shanghai Customs, Shanghai 33.26 7.15 10.90 327.78Liberia Shanghai Customs, Shanghai 8.99 1.93 2.91 323.70Marshall Islands Shanghai Customs, Shanghai 7.56 1.63 2.42 319.71Malta Shanghai Customs, Shanghai 1.61 0.35 0.53 331.27Japan Shanghai Customs, Shanghai 2.12 0.46 0.69 325.77Bahamas Shanghai Customs, Shanghai 5.16 1.11 1.65 320.02UK Shanghai Customs, Shanghai 5.19 1.12 1.68 323.12
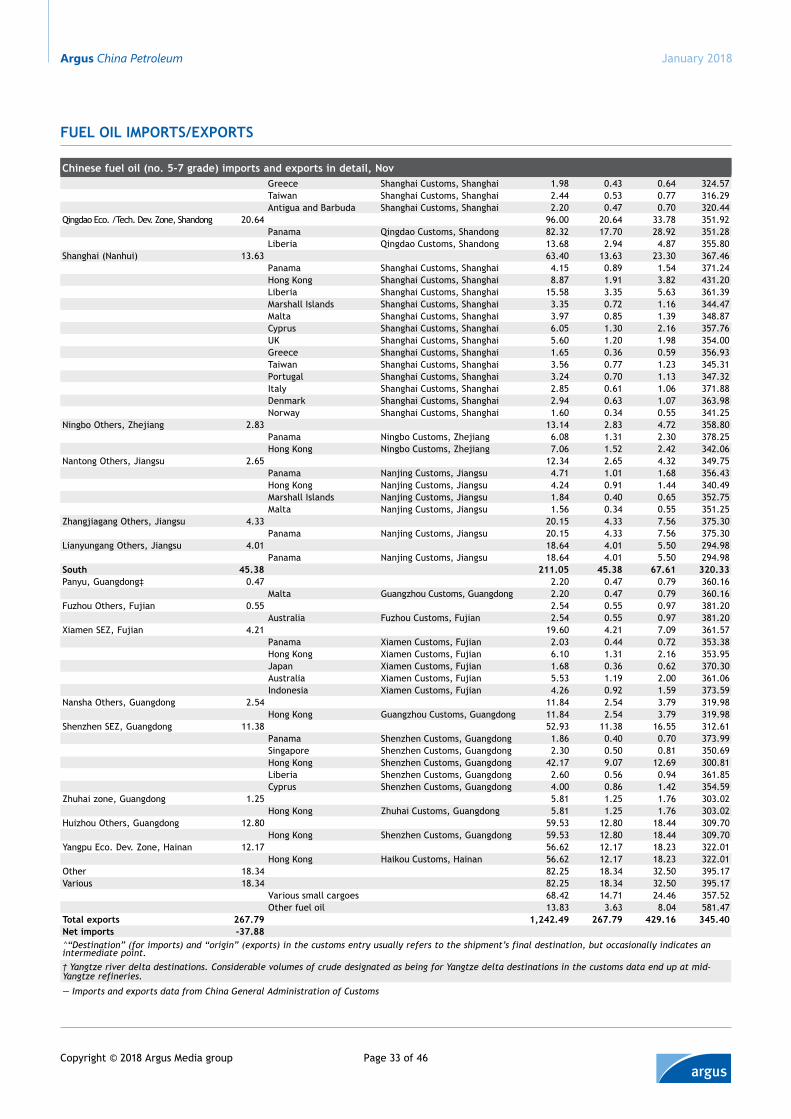
Argus China Petroleum
Page 33 of 46Copyright © 2018 Argus Media group
January 2018
Chinese fuel oil (no. 5-7 grade) imports and exports in detail, NovGreece Shanghai Customs, Shanghai 1.98 0.43 0.64 324.57Taiwan Shanghai Customs, Shanghai 2.44 0.53 0.77 316.29Antigua and Barbuda Shanghai Customs, Shanghai 2.20 0.47 0.70 320.44
Qingdao Eco. /Tech. Dev. Zone, Shandong 20.64 96.00 20.64 33.78 351.92Panama Qingdao Customs, Shandong 82.32 17.70 28.92 351.28Liberia Qingdao Customs, Shandong 13.68 2.94 4.87 355.80
Shanghai (Nanhui) 13.63 63.40 13.63 23.30 367.46Panama Shanghai Customs, Shanghai 4.15 0.89 1.54 371.24Hong Kong Shanghai Customs, Shanghai 8.87 1.91 3.82 431.20Liberia Shanghai Customs, Shanghai 15.58 3.35 5.63 361.39Marshall Islands Shanghai Customs, Shanghai 3.35 0.72 1.16 344.47Malta Shanghai Customs, Shanghai 3.97 0.85 1.39 348.87Cyprus Shanghai Customs, Shanghai 6.05 1.30 2.16 357.76UK Shanghai Customs, Shanghai 5.60 1.20 1.98 354.00Greece Shanghai Customs, Shanghai 1.65 0.36 0.59 356.93Taiwan Shanghai Customs, Shanghai 3.56 0.77 1.23 345.31Portugal Shanghai Customs, Shanghai 3.24 0.70 1.13 347.32Italy Shanghai Customs, Shanghai 2.85 0.61 1.06 371.88Denmark Shanghai Customs, Shanghai 2.94 0.63 1.07 363.98Norway Shanghai Customs, Shanghai 1.60 0.34 0.55 341.25
Ningbo Others, Zhejiang 2.83 13.14 2.83 4.72 358.80Panama Ningbo Customs, Zhejiang 6.08 1.31 2.30 378.25Hong Kong Ningbo Customs, Zhejiang 7.06 1.52 2.42 342.06
Nantong Others, Jiangsu 2.65 12.34 2.65 4.32 349.75Panama Nanjing Customs, Jiangsu 4.71 1.01 1.68 356.43Hong Kong Nanjing Customs, Jiangsu 4.24 0.91 1.44 340.49Marshall Islands Nanjing Customs, Jiangsu 1.84 0.40 0.65 352.75Malta Nanjing Customs, Jiangsu 1.56 0.34 0.55 351.25
Zhangjiagang Others, Jiangsu 4.33 20.15 4.33 7.56 375.30Panama Nanjing Customs, Jiangsu 20.15 4.33 7.56 375.30
Lianyungang Others, Jiangsu 4.01 18.64 4.01 5.50 294.98Panama Nanjing Customs, Jiangsu 18.64 4.01 5.50 294.98
South 45.38 211.05 45.38 67.61 320.33Panyu, Guangdong‡ 0.47 2.20 0.47 0.79 360.16
Malta Guangzhou Customs, Guangdong 2.20 0.47 0.79 360.16Fuzhou Others, Fujian 0.55 2.54 0.55 0.97 381.20
Australia Fuzhou Customs, Fujian 2.54 0.55 0.97 381.20Xiamen SEZ, Fujian 4.21 19.60 4.21 7.09 361.57
Panama Xiamen Customs, Fujian 2.03 0.44 0.72 353.38Hong Kong Xiamen Customs, Fujian 6.10 1.31 2.16 353.95Japan Xiamen Customs, Fujian 1.68 0.36 0.62 370.30Australia Xiamen Customs, Fujian 5.53 1.19 2.00 361.06Indonesia Xiamen Customs, Fujian 4.26 0.92 1.59 373.59
Nansha Others, Guangdong 2.54 11.84 2.54 3.79 319.98Hong Kong Guangzhou Customs, Guangdong 11.84 2.54 3.79 319.98
Shenzhen SEZ, Guangdong 11.38 52.93 11.38 16.55 312.61Panama Shenzhen Customs, Guangdong 1.86 0.40 0.70 373.99Singapore Shenzhen Customs, Guangdong 2.30 0.50 0.81 350.69Hong Kong Shenzhen Customs, Guangdong 42.17 9.07 12.69 300.81Liberia Shenzhen Customs, Guangdong 2.60 0.56 0.94 361.85Cyprus Shenzhen Customs, Guangdong 4.00 0.86 1.42 354.59
Zhuhai zone, Guangdong 1.25 5.81 1.25 1.76 303.02Hong Kong Zhuhai Customs, Guangdong 5.81 1.25 1.76 303.02
Huizhou Others, Guangdong 12.80 59.53 12.80 18.44 309.70Hong Kong Shenzhen Customs, Guangdong 59.53 12.80 18.44 309.70
Yangpu Eco. Dev. Zone, Hainan 12.17 56.62 12.17 18.23 322.01Hong Kong Haikou Customs, Hainan 56.62 12.17 18.23 322.01
Other 18.34 82.25 18.34 32.50 395.17Various 18.34 82.25 18.34 32.50 395.17
Various small cargoes 68.42 14.71 24.46 357.52Other fuel oil 13.83 3.63 8.04 581.47
Total exports 267.79 1,242.49 267.79 429.16 345.40Net imports -37.88^“Destination” (for imports) and “origin” (exports) in the customs entry usually refers to the shipment’s final destination, but occasionally indicates an intermediate point.† Yangtze river delta destinations. Considerable volumes of crude designated as being for Yangtze delta destinations in the customs data end up at mid-Yangtze refineries.
— Imports and exports data from China General Administration of Customs
Fuel oil imporTS/exporTS
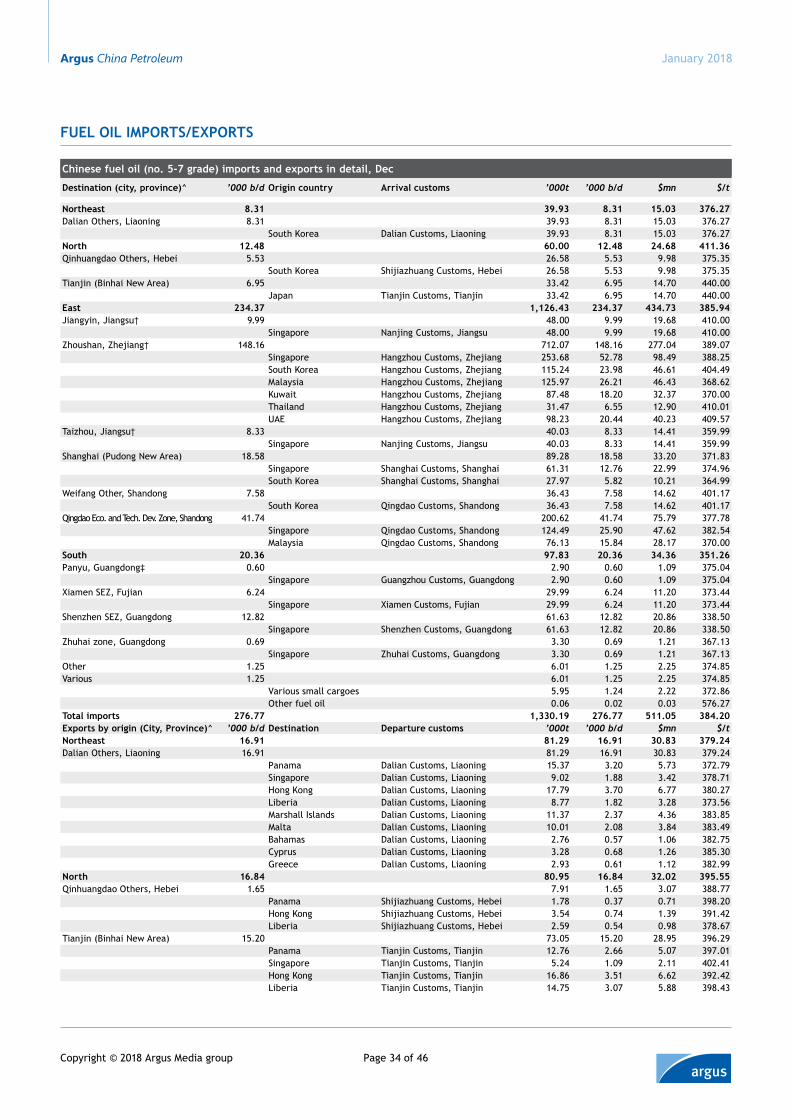
Argus China Petroleum
Page 34 of 46Copyright © 2018 Argus Media group
January 2018
Fuel oil imports/exports
Chinese fuel oil (no. 5-7 grade) imports and exports in detail, Dec
Destination (city, province)^ ’000 b/d origin country Arrival customs ’000t ’000 b/d $mn $/t
Northeast 8.31 39.93 8.31 15.03 376.27Dalian Others, Liaoning 8.31 39.93 8.31 15.03 376.27
South Korea Dalian Customs, Liaoning 39.93 8.31 15.03 376.27North 12.48 60.00 12.48 24.68 411.36Qinhuangdao Others, Hebei 5.53 26.58 5.53 9.98 375.35
South Korea Shijiazhuang Customs, Hebei 26.58 5.53 9.98 375.35Tianjin (Binhai New Area) 6.95 33.42 6.95 14.70 440.00
Japan Tianjin Customs, Tianjin 33.42 6.95 14.70 440.00east 234.37 1,126.43 234.37 434.73 385.94Jiangyin, Jiangsu† 9.99 48.00 9.99 19.68 410.00
Singapore Nanjing Customs, Jiangsu 48.00 9.99 19.68 410.00Zhoushan, Zhejiang† 148.16 712.07 148.16 277.04 389.07
Singapore Hangzhou Customs, Zhejiang 253.68 52.78 98.49 388.25South Korea Hangzhou Customs, Zhejiang 115.24 23.98 46.61 404.49Malaysia Hangzhou Customs, Zhejiang 125.97 26.21 46.43 368.62Kuwait Hangzhou Customs, Zhejiang 87.48 18.20 32.37 370.00Thailand Hangzhou Customs, Zhejiang 31.47 6.55 12.90 410.01UAE Hangzhou Customs, Zhejiang 98.23 20.44 40.23 409.57
Taizhou, Jiangsu† 8.33 40.03 8.33 14.41 359.99Singapore Nanjing Customs, Jiangsu 40.03 8.33 14.41 359.99
Shanghai (Pudong New Area) 18.58 89.28 18.58 33.20 371.83Singapore Shanghai Customs, Shanghai 61.31 12.76 22.99 374.96South Korea Shanghai Customs, Shanghai 27.97 5.82 10.21 364.99
Weifang Other, Shandong 7.58 36.43 7.58 14.62 401.17South Korea Qingdao Customs, Shandong 36.43 7.58 14.62 401.17
Qingdao Eco. and Tech. Dev. Zone, Shandong 41.74 200.62 41.74 75.79 377.78Singapore Qingdao Customs, Shandong 124.49 25.90 47.62 382.54Malaysia Qingdao Customs, Shandong 76.13 15.84 28.17 370.00
south 20.36 97.83 20.36 34.36 351.26Panyu, Guangdong‡ 0.60 2.90 0.60 1.09 375.04
Singapore Guangzhou Customs, Guangdong 2.90 0.60 1.09 375.04Xiamen SEZ, Fujian 6.24 29.99 6.24 11.20 373.44
Singapore Xiamen Customs, Fujian 29.99 6.24 11.20 373.44Shenzhen SEZ, Guangdong 12.82 61.63 12.82 20.86 338.50
Singapore Shenzhen Customs, Guangdong 61.63 12.82 20.86 338.50Zhuhai zone, Guangdong 0.69 3.30 0.69 1.21 367.13
Singapore Zhuhai Customs, Guangdong 3.30 0.69 1.21 367.13Other 1.25 6.01 1.25 2.25 374.85Various 1.25 6.01 1.25 2.25 374.85
Various small cargoes 5.95 1.24 2.22 372.86Other fuel oil 0.06 0.02 0.03 576.27
total imports 276.77 1,330.19 276.77 511.05 384.20exports by origin (City, province)^ ’000 b/d Destination Departure customs ’000t ’000 b/d $mn $/tNortheast 16.91 81.29 16.91 30.83 379.24Dalian Others, Liaoning 16.91 81.29 16.91 30.83 379.24
Panama Dalian Customs, Liaoning 15.37 3.20 5.73 372.79Singapore Dalian Customs, Liaoning 9.02 1.88 3.42 378.71Hong Kong Dalian Customs, Liaoning 17.79 3.70 6.77 380.27Liberia Dalian Customs, Liaoning 8.77 1.82 3.28 373.56Marshall Islands Dalian Customs, Liaoning 11.37 2.37 4.36 383.85Malta Dalian Customs, Liaoning 10.01 2.08 3.84 383.49Bahamas Dalian Customs, Liaoning 2.76 0.57 1.06 382.75Cyprus Dalian Customs, Liaoning 3.28 0.68 1.26 385.30Greece Dalian Customs, Liaoning 2.93 0.61 1.12 382.99
North 16.84 80.95 16.84 32.02 395.55Qinhuangdao Others, Hebei 1.65 7.91 1.65 3.07 388.77
Panama Shijiazhuang Customs, Hebei 1.78 0.37 0.71 398.20Hong Kong Shijiazhuang Customs, Hebei 3.54 0.74 1.39 391.42Liberia Shijiazhuang Customs, Hebei 2.59 0.54 0.98 378.67
Tianjin (Binhai New Area) 15.20 73.05 15.20 28.95 396.29Panama Tianjin Customs, Tianjin 12.76 2.66 5.07 397.01Singapore Tianjin Customs, Tianjin 5.24 1.09 2.11 402.41Hong Kong Tianjin Customs, Tianjin 16.86 3.51 6.62 392.42Liberia Tianjin Customs, Tianjin 14.75 3.07 5.88 398.43
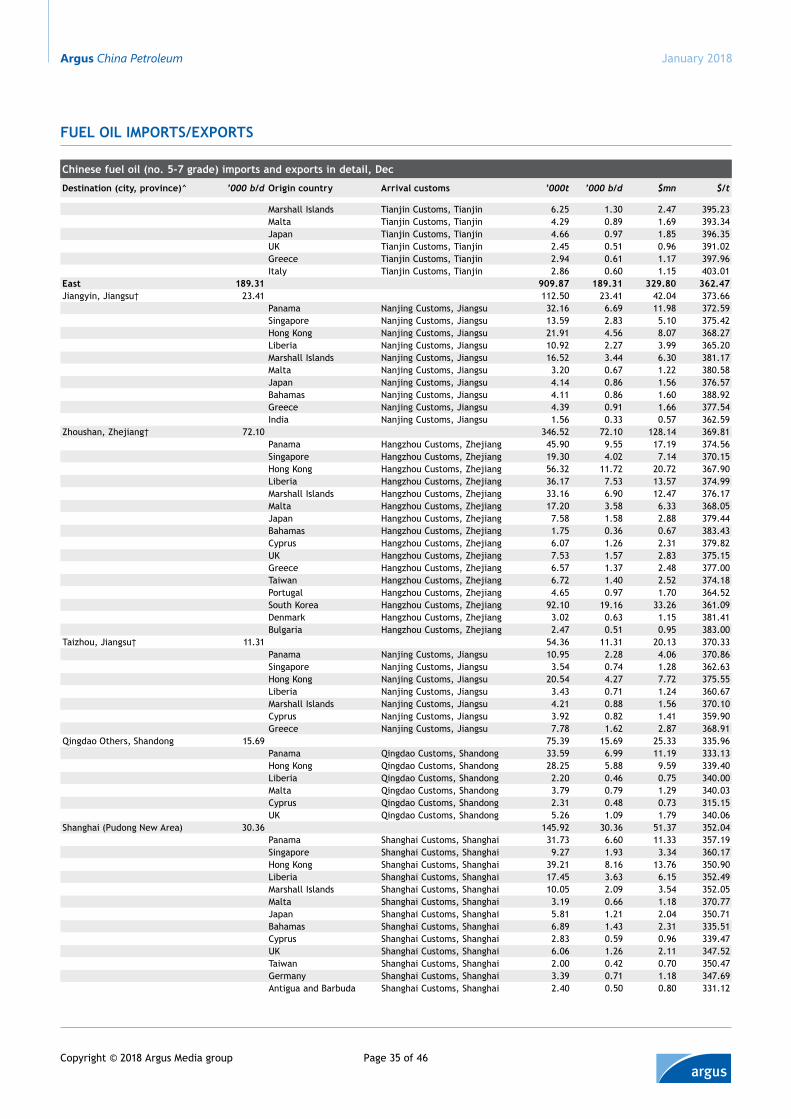
Argus China Petroleum
Page 35 of 46Copyright © 2018 Argus Media group
January 2018
Fuel oil imports/exports
Chinese fuel oil (no. 5-7 grade) imports and exports in detail, Dec
Destination (city, province)^ ’000 b/d origin country Arrival customs ’000t ’000 b/d $mn $/t
Marshall Islands Tianjin Customs, Tianjin 6.25 1.30 2.47 395.23Malta Tianjin Customs, Tianjin 4.29 0.89 1.69 393.34Japan Tianjin Customs, Tianjin 4.66 0.97 1.85 396.35UK Tianjin Customs, Tianjin 2.45 0.51 0.96 391.02Greece Tianjin Customs, Tianjin 2.94 0.61 1.17 397.96Italy Tianjin Customs, Tianjin 2.86 0.60 1.15 403.01
east 189.31 909.87 189.31 329.80 362.47Jiangyin, Jiangsu† 23.41 112.50 23.41 42.04 373.66
Panama Nanjing Customs, Jiangsu 32.16 6.69 11.98 372.59Singapore Nanjing Customs, Jiangsu 13.59 2.83 5.10 375.42Hong Kong Nanjing Customs, Jiangsu 21.91 4.56 8.07 368.27Liberia Nanjing Customs, Jiangsu 10.92 2.27 3.99 365.20Marshall Islands Nanjing Customs, Jiangsu 16.52 3.44 6.30 381.17Malta Nanjing Customs, Jiangsu 3.20 0.67 1.22 380.58Japan Nanjing Customs, Jiangsu 4.14 0.86 1.56 376.57Bahamas Nanjing Customs, Jiangsu 4.11 0.86 1.60 388.92Greece Nanjing Customs, Jiangsu 4.39 0.91 1.66 377.54India Nanjing Customs, Jiangsu 1.56 0.33 0.57 362.59
Zhoushan, Zhejiang† 72.10 346.52 72.10 128.14 369.81Panama Hangzhou Customs, Zhejiang 45.90 9.55 17.19 374.56Singapore Hangzhou Customs, Zhejiang 19.30 4.02 7.14 370.15Hong Kong Hangzhou Customs, Zhejiang 56.32 11.72 20.72 367.90Liberia Hangzhou Customs, Zhejiang 36.17 7.53 13.57 374.99Marshall Islands Hangzhou Customs, Zhejiang 33.16 6.90 12.47 376.17Malta Hangzhou Customs, Zhejiang 17.20 3.58 6.33 368.05Japan Hangzhou Customs, Zhejiang 7.58 1.58 2.88 379.44Bahamas Hangzhou Customs, Zhejiang 1.75 0.36 0.67 383.43Cyprus Hangzhou Customs, Zhejiang 6.07 1.26 2.31 379.82UK Hangzhou Customs, Zhejiang 7.53 1.57 2.83 375.15Greece Hangzhou Customs, Zhejiang 6.57 1.37 2.48 377.00Taiwan Hangzhou Customs, Zhejiang 6.72 1.40 2.52 374.18Portugal Hangzhou Customs, Zhejiang 4.65 0.97 1.70 364.52South Korea Hangzhou Customs, Zhejiang 92.10 19.16 33.26 361.09Denmark Hangzhou Customs, Zhejiang 3.02 0.63 1.15 381.41Bulgaria Hangzhou Customs, Zhejiang 2.47 0.51 0.95 383.00
Taizhou, Jiangsu† 11.31 54.36 11.31 20.13 370.33Panama Nanjing Customs, Jiangsu 10.95 2.28 4.06 370.86Singapore Nanjing Customs, Jiangsu 3.54 0.74 1.28 362.63Hong Kong Nanjing Customs, Jiangsu 20.54 4.27 7.72 375.55Liberia Nanjing Customs, Jiangsu 3.43 0.71 1.24 360.67Marshall Islands Nanjing Customs, Jiangsu 4.21 0.88 1.56 370.10Cyprus Nanjing Customs, Jiangsu 3.92 0.82 1.41 359.90Greece Nanjing Customs, Jiangsu 7.78 1.62 2.87 368.91
Qingdao Others, Shandong 15.69 75.39 15.69 25.33 335.96Panama Qingdao Customs, Shandong 33.59 6.99 11.19 333.13Hong Kong Qingdao Customs, Shandong 28.25 5.88 9.59 339.40Liberia Qingdao Customs, Shandong 2.20 0.46 0.75 340.00Malta Qingdao Customs, Shandong 3.79 0.79 1.29 340.03Cyprus Qingdao Customs, Shandong 2.31 0.48 0.73 315.15UK Qingdao Customs, Shandong 5.26 1.09 1.79 340.06
Shanghai (Pudong New Area) 30.36 145.92 30.36 51.37 352.04Panama Shanghai Customs, Shanghai 31.73 6.60 11.33 357.19Singapore Shanghai Customs, Shanghai 9.27 1.93 3.34 360.17Hong Kong Shanghai Customs, Shanghai 39.21 8.16 13.76 350.90Liberia Shanghai Customs, Shanghai 17.45 3.63 6.15 352.49Marshall Islands Shanghai Customs, Shanghai 10.05 2.09 3.54 352.05Malta Shanghai Customs, Shanghai 3.19 0.66 1.18 370.77Japan Shanghai Customs, Shanghai 5.81 1.21 2.04 350.71Bahamas Shanghai Customs, Shanghai 6.89 1.43 2.31 335.51Cyprus Shanghai Customs, Shanghai 2.83 0.59 0.96 339.47UK Shanghai Customs, Shanghai 6.06 1.26 2.11 347.52Taiwan Shanghai Customs, Shanghai 2.00 0.42 0.70 350.47Germany Shanghai Customs, Shanghai 3.39 0.71 1.18 347.69Antigua and Barbuda Shanghai Customs, Shanghai 2.40 0.50 0.80 331.12
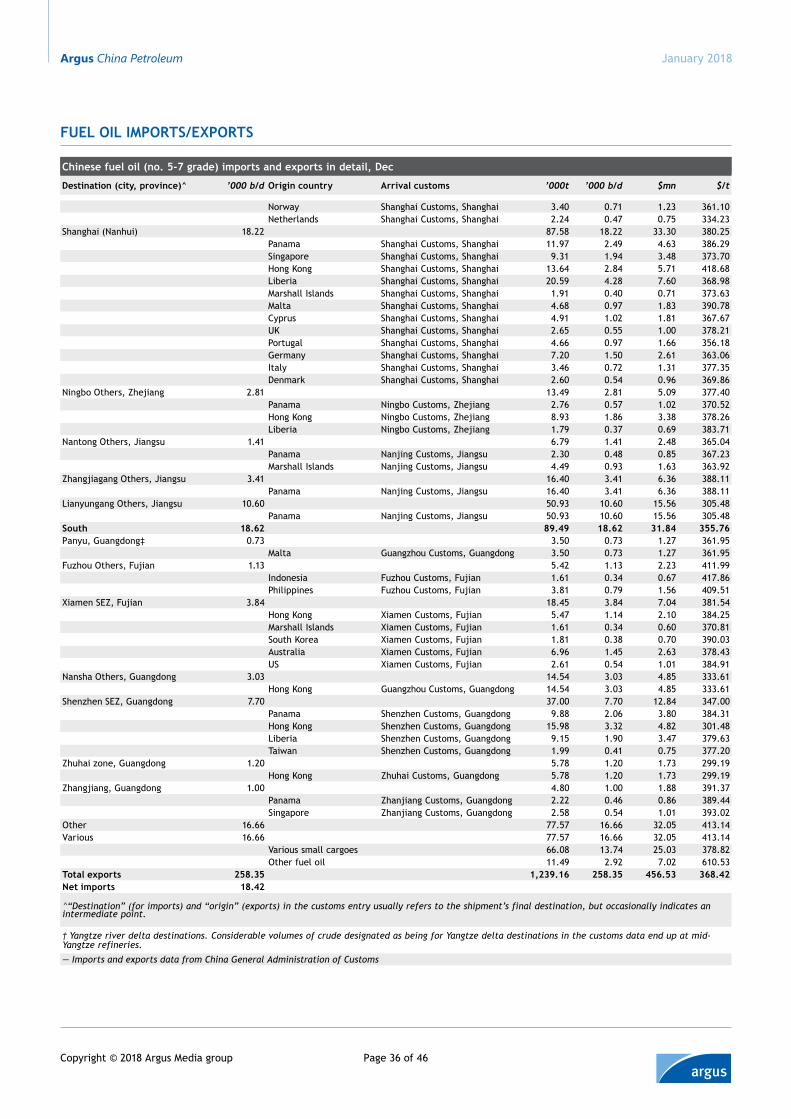
Argus China Petroleum
Page 36 of 46Copyright © 2018 Argus Media group
January 2018
Fuel oil imports/exports
Chinese fuel oil (no. 5-7 grade) imports and exports in detail, Dec
Destination (city, province)^ ’000 b/d origin country Arrival customs ’000t ’000 b/d $mn $/t
Norway Shanghai Customs, Shanghai 3.40 0.71 1.23 361.10Netherlands Shanghai Customs, Shanghai 2.24 0.47 0.75 334.23
Shanghai (Nanhui) 18.22 87.58 18.22 33.30 380.25Panama Shanghai Customs, Shanghai 11.97 2.49 4.63 386.29Singapore Shanghai Customs, Shanghai 9.31 1.94 3.48 373.70Hong Kong Shanghai Customs, Shanghai 13.64 2.84 5.71 418.68Liberia Shanghai Customs, Shanghai 20.59 4.28 7.60 368.98Marshall Islands Shanghai Customs, Shanghai 1.91 0.40 0.71 373.63Malta Shanghai Customs, Shanghai 4.68 0.97 1.83 390.78Cyprus Shanghai Customs, Shanghai 4.91 1.02 1.81 367.67UK Shanghai Customs, Shanghai 2.65 0.55 1.00 378.21Portugal Shanghai Customs, Shanghai 4.66 0.97 1.66 356.18Germany Shanghai Customs, Shanghai 7.20 1.50 2.61 363.06Italy Shanghai Customs, Shanghai 3.46 0.72 1.31 377.35Denmark Shanghai Customs, Shanghai 2.60 0.54 0.96 369.86
Ningbo Others, Zhejiang 2.81 13.49 2.81 5.09 377.40Panama Ningbo Customs, Zhejiang 2.76 0.57 1.02 370.52Hong Kong Ningbo Customs, Zhejiang 8.93 1.86 3.38 378.26Liberia Ningbo Customs, Zhejiang 1.79 0.37 0.69 383.71
Nantong Others, Jiangsu 1.41 6.79 1.41 2.48 365.04Panama Nanjing Customs, Jiangsu 2.30 0.48 0.85 367.23Marshall Islands Nanjing Customs, Jiangsu 4.49 0.93 1.63 363.92
Zhangjiagang Others, Jiangsu 3.41 16.40 3.41 6.36 388.11Panama Nanjing Customs, Jiangsu 16.40 3.41 6.36 388.11
Lianyungang Others, Jiangsu 10.60 50.93 10.60 15.56 305.48Panama Nanjing Customs, Jiangsu 50.93 10.60 15.56 305.48
south 18.62 89.49 18.62 31.84 355.76Panyu, Guangdong‡ 0.73 3.50 0.73 1.27 361.95
Malta Guangzhou Customs, Guangdong 3.50 0.73 1.27 361.95Fuzhou Others, Fujian 1.13 5.42 1.13 2.23 411.99
Indonesia Fuzhou Customs, Fujian 1.61 0.34 0.67 417.86Philippines Fuzhou Customs, Fujian 3.81 0.79 1.56 409.51
Xiamen SEZ, Fujian 3.84 18.45 3.84 7.04 381.54Hong Kong Xiamen Customs, Fujian 5.47 1.14 2.10 384.25Marshall Islands Xiamen Customs, Fujian 1.61 0.34 0.60 370.81South Korea Xiamen Customs, Fujian 1.81 0.38 0.70 390.03Australia Xiamen Customs, Fujian 6.96 1.45 2.63 378.43US Xiamen Customs, Fujian 2.61 0.54 1.01 384.91
Nansha Others, Guangdong 3.03 14.54 3.03 4.85 333.61Hong Kong Guangzhou Customs, Guangdong 14.54 3.03 4.85 333.61
Shenzhen SEZ, Guangdong 7.70 37.00 7.70 12.84 347.00Panama Shenzhen Customs, Guangdong 9.88 2.06 3.80 384.31Hong Kong Shenzhen Customs, Guangdong 15.98 3.32 4.82 301.48Liberia Shenzhen Customs, Guangdong 9.15 1.90 3.47 379.63Taiwan Shenzhen Customs, Guangdong 1.99 0.41 0.75 377.20
Zhuhai zone, Guangdong 1.20 5.78 1.20 1.73 299.19Hong Kong Zhuhai Customs, Guangdong 5.78 1.20 1.73 299.19
Zhangjiang, Guangdong 1.00 4.80 1.00 1.88 391.37Panama Zhanjiang Customs, Guangdong 2.22 0.46 0.86 389.44Singapore Zhanjiang Customs, Guangdong 2.58 0.54 1.01 393.02
Other 16.66 77.57 16.66 32.05 413.14Various 16.66 77.57 16.66 32.05 413.14
Various small cargoes 66.08 13.74 25.03 378.82Other fuel oil 11.49 2.92 7.02 610.53
total exports 258.35 1,239.16 258.35 456.53 368.42Net imports 18.42
^“Destination” (for imports) and “origin” (exports) in the customs entry usually refers to the shipment’s final destination, but occasionally indicates an intermediate point.
† Yangtze river delta destinations. Considerable volumes of crude designated as being for Yangtze delta destinations in the customs data end up at mid-Yangtze refineries.
— Imports and exports data from China General Administration of Customs
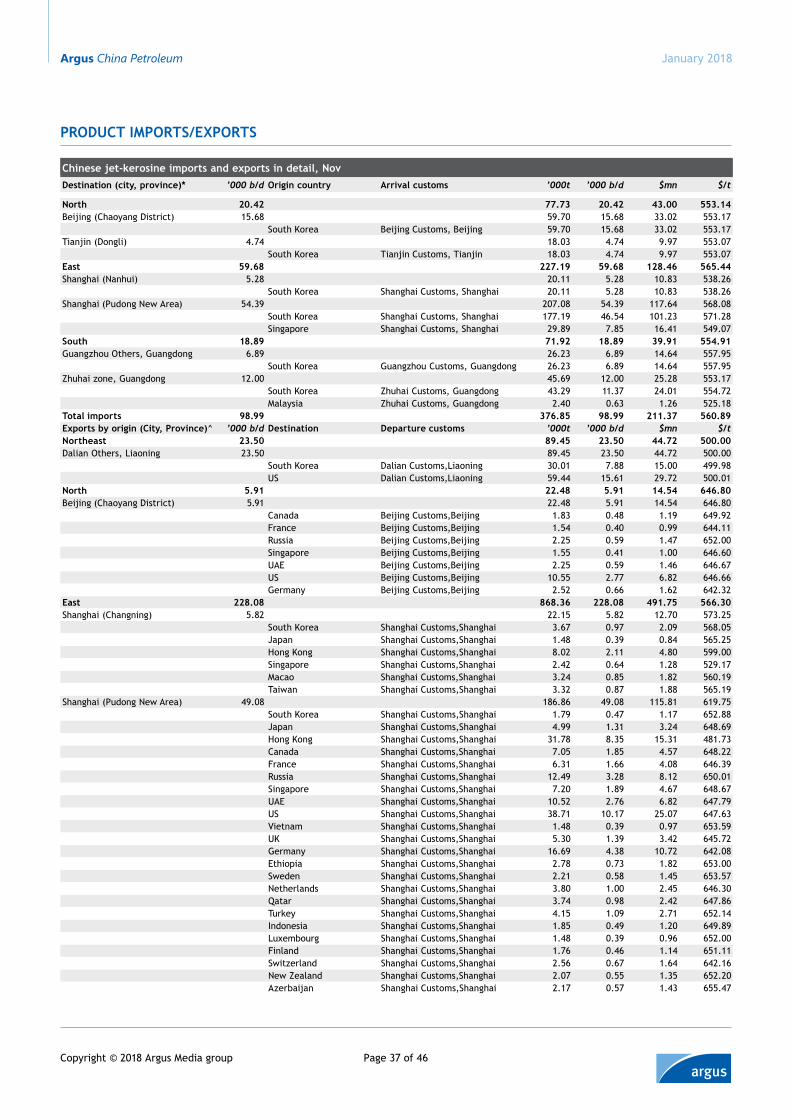
Argus China Petroleum
Page 37 of 46Copyright © 2018 Argus Media group
January 2018
Product imPorts/exPorts
chinese jet-kerosine imports and exports in detail, Novdestination (city, province)* ’000 b/d origin country Arrival customs ’000t ’000 b/d $mn $/t
North 20.42 77.73 20.42 43.00 553.14Beijing (Chaoyang District) 15.68 59.70 15.68 33.02 553.17
South Korea Beijing Customs, Beijing 59.70 15.68 33.02 553.17Tianjin (Dongli) 4.74 18.03 4.74 9.97 553.07
South Korea Tianjin Customs, Tianjin 18.03 4.74 9.97 553.07east 59.68 227.19 59.68 128.46 565.44Shanghai (Nanhui) 5.28 20.11 5.28 10.83 538.26
South Korea Shanghai Customs, Shanghai 20.11 5.28 10.83 538.26Shanghai (Pudong New Area) 54.39 207.08 54.39 117.64 568.08
South Korea Shanghai Customs, Shanghai 177.19 46.54 101.23 571.28Singapore Shanghai Customs, Shanghai 29.89 7.85 16.41 549.07
south 18.89 71.92 18.89 39.91 554.91Guangzhou Others, Guangdong 6.89 26.23 6.89 14.64 557.95
South Korea Guangzhou Customs, Guangdong 26.23 6.89 14.64 557.95Zhuhai zone, Guangdong 12.00 45.69 12.00 25.28 553.17
South Korea Zhuhai Customs, Guangdong 43.29 11.37 24.01 554.72Malaysia Zhuhai Customs, Guangdong 2.40 0.63 1.26 525.18
total imports 98.99 376.85 98.99 211.37 560.89exports by origin (city, Province)^ ’000 b/d destination departure customs ’000t ’000 b/d $mn $/tNortheast 23.50 89.45 23.50 44.72 500.00Dalian Others, Liaoning 23.50 89.45 23.50 44.72 500.00
South Korea Dalian Customs,Liaoning 30.01 7.88 15.00 499.98US Dalian Customs,Liaoning 59.44 15.61 29.72 500.01
North 5.91 22.48 5.91 14.54 646.80Beijing (Chaoyang District) 5.91 22.48 5.91 14.54 646.80
Canada Beijing Customs,Beijing 1.83 0.48 1.19 649.92France Beijing Customs,Beijing 1.54 0.40 0.99 644.11Russia Beijing Customs,Beijing 2.25 0.59 1.47 652.00Singapore Beijing Customs,Beijing 1.55 0.41 1.00 646.60UAE Beijing Customs,Beijing 2.25 0.59 1.46 646.67US Beijing Customs,Beijing 10.55 2.77 6.82 646.66Germany Beijing Customs,Beijing 2.52 0.66 1.62 642.32
east 228.08 868.36 228.08 491.75 566.30Shanghai (Changning) 5.82 22.15 5.82 12.70 573.25
South Korea Shanghai Customs,Shanghai 3.67 0.97 2.09 568.05Japan Shanghai Customs,Shanghai 1.48 0.39 0.84 565.25Hong Kong Shanghai Customs,Shanghai 8.02 2.11 4.80 599.00Singapore Shanghai Customs,Shanghai 2.42 0.64 1.28 529.17Macao Shanghai Customs,Shanghai 3.24 0.85 1.82 560.19Taiwan Shanghai Customs,Shanghai 3.32 0.87 1.88 565.19
Shanghai (Pudong New Area) 49.08 186.86 49.08 115.81 619.75South Korea Shanghai Customs,Shanghai 1.79 0.47 1.17 652.88Japan Shanghai Customs,Shanghai 4.99 1.31 3.24 648.69Hong Kong Shanghai Customs,Shanghai 31.78 8.35 15.31 481.73Canada Shanghai Customs,Shanghai 7.05 1.85 4.57 648.22France Shanghai Customs,Shanghai 6.31 1.66 4.08 646.39Russia Shanghai Customs,Shanghai 12.49 3.28 8.12 650.01Singapore Shanghai Customs,Shanghai 7.20 1.89 4.67 648.67UAE Shanghai Customs,Shanghai 10.52 2.76 6.82 647.79US Shanghai Customs,Shanghai 38.71 10.17 25.07 647.63Vietnam Shanghai Customs,Shanghai 1.48 0.39 0.97 653.59UK Shanghai Customs,Shanghai 5.30 1.39 3.42 645.72Germany Shanghai Customs,Shanghai 16.69 4.38 10.72 642.08Ethiopia Shanghai Customs,Shanghai 2.78 0.73 1.82 653.00Sweden Shanghai Customs,Shanghai 2.21 0.58 1.45 653.57Netherlands Shanghai Customs,Shanghai 3.80 1.00 2.45 646.30Qatar Shanghai Customs,Shanghai 3.74 0.98 2.42 647.86Turkey Shanghai Customs,Shanghai 4.15 1.09 2.71 652.14Indonesia Shanghai Customs,Shanghai 1.85 0.49 1.20 649.89Luxembourg Shanghai Customs,Shanghai 1.48 0.39 0.96 652.00Finland Shanghai Customs,Shanghai 1.76 0.46 1.14 651.11Switzerland Shanghai Customs,Shanghai 2.56 0.67 1.64 642.16New Zealand Shanghai Customs,Shanghai 2.07 0.55 1.35 652.20Azerbaijan Shanghai Customs,Shanghai 2.17 0.57 1.43 655.47
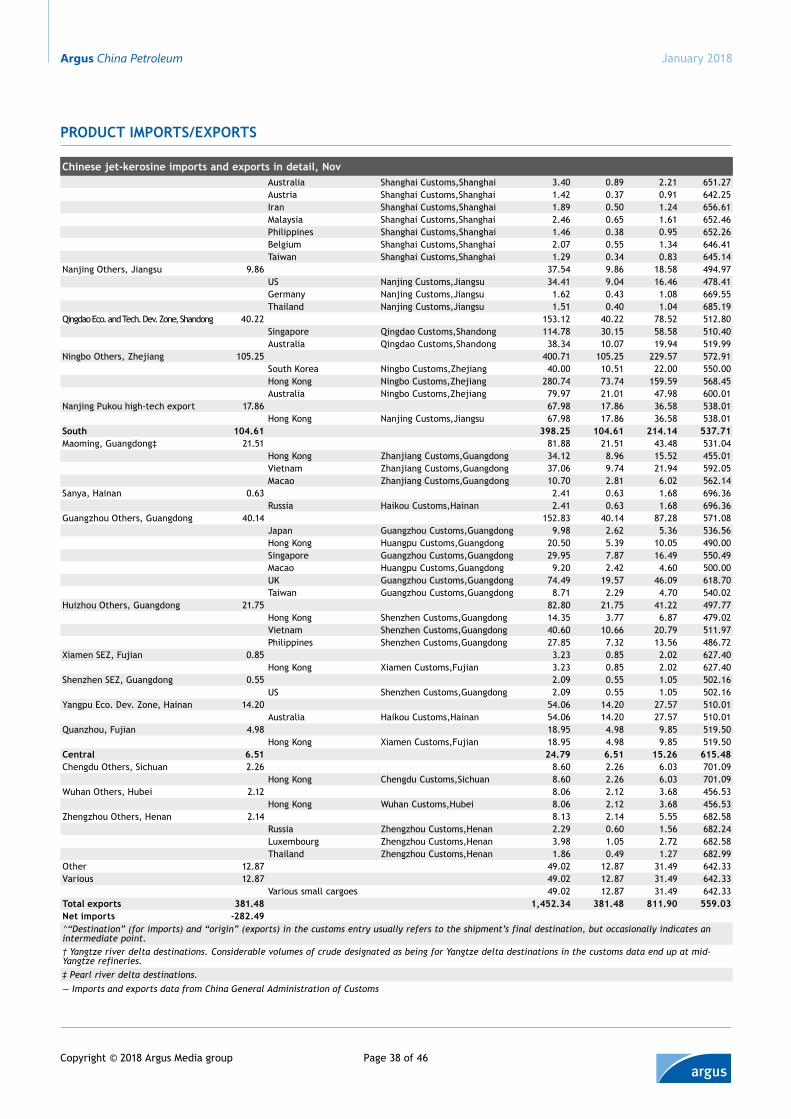
Argus China Petroleum
Page 38 of 46Copyright © 2018 Argus Media group
January 2018
Product imPorts/exPorts
chinese jet-kerosine imports and exports in detail, NovAustralia Shanghai Customs,Shanghai 3.40 0.89 2.21 651.27Austria Shanghai Customs,Shanghai 1.42 0.37 0.91 642.25Iran Shanghai Customs,Shanghai 1.89 0.50 1.24 656.61Malaysia Shanghai Customs,Shanghai 2.46 0.65 1.61 652.46Philippines Shanghai Customs,Shanghai 1.46 0.38 0.95 652.26Belgium Shanghai Customs,Shanghai 2.07 0.55 1.34 646.41Taiwan Shanghai Customs,Shanghai 1.29 0.34 0.83 645.14
Nanjing Others, Jiangsu 9.86 37.54 9.86 18.58 494.97US Nanjing Customs,Jiangsu 34.41 9.04 16.46 478.41Germany Nanjing Customs,Jiangsu 1.62 0.43 1.08 669.55Thailand Nanjing Customs,Jiangsu 1.51 0.40 1.04 685.19
Qingdao Eco. and Tech. Dev. Zone, Shandong 40.22 153.12 40.22 78.52 512.80Singapore Qingdao Customs,Shandong 114.78 30.15 58.58 510.40Australia Qingdao Customs,Shandong 38.34 10.07 19.94 519.99
Ningbo Others, Zhejiang 105.25 400.71 105.25 229.57 572.91South Korea Ningbo Customs,Zhejiang 40.00 10.51 22.00 550.00Hong Kong Ningbo Customs,Zhejiang 280.74 73.74 159.59 568.45Australia Ningbo Customs,Zhejiang 79.97 21.01 47.98 600.01
Nanjing Pukou high-tech export 17.86 67.98 17.86 36.58 538.01Hong Kong Nanjing Customs,Jiangsu 67.98 17.86 36.58 538.01
south 104.61 398.25 104.61 214.14 537.71Maoming, Guangdong‡ 21.51 81.88 21.51 43.48 531.04
Hong Kong Zhanjiang Customs,Guangdong 34.12 8.96 15.52 455.01Vietnam Zhanjiang Customs,Guangdong 37.06 9.74 21.94 592.05Macao Zhanjiang Customs,Guangdong 10.70 2.81 6.02 562.14
Sanya, Hainan 0.63 2.41 0.63 1.68 696.36Russia Haikou Customs,Hainan 2.41 0.63 1.68 696.36
Guangzhou Others, Guangdong 40.14 152.83 40.14 87.28 571.08Japan Guangzhou Customs,Guangdong 9.98 2.62 5.36 536.56Hong Kong Huangpu Customs,Guangdong 20.50 5.39 10.05 490.00Singapore Guangzhou Customs,Guangdong 29.95 7.87 16.49 550.49Macao Huangpu Customs,Guangdong 9.20 2.42 4.60 500.00UK Guangzhou Customs,Guangdong 74.49 19.57 46.09 618.70Taiwan Guangzhou Customs,Guangdong 8.71 2.29 4.70 540.02
Huizhou Others, Guangdong 21.75 82.80 21.75 41.22 497.77Hong Kong Shenzhen Customs,Guangdong 14.35 3.77 6.87 479.02Vietnam Shenzhen Customs,Guangdong 40.60 10.66 20.79 511.97Philippines Shenzhen Customs,Guangdong 27.85 7.32 13.56 486.72
Xiamen SEZ, Fujian 0.85 3.23 0.85 2.02 627.40Hong Kong Xiamen Customs,Fujian 3.23 0.85 2.02 627.40
Shenzhen SEZ, Guangdong 0.55 2.09 0.55 1.05 502.16US Shenzhen Customs,Guangdong 2.09 0.55 1.05 502.16
Yangpu Eco. Dev. Zone, Hainan 14.20 54.06 14.20 27.57 510.01Australia Haikou Customs,Hainan 54.06 14.20 27.57 510.01
Quanzhou, Fujian 4.98 18.95 4.98 9.85 519.50Hong Kong Xiamen Customs,Fujian 18.95 4.98 9.85 519.50
central 6.51 24.79 6.51 15.26 615.48Chengdu Others, Sichuan 2.26 8.60 2.26 6.03 701.09
Hong Kong Chengdu Customs,Sichuan 8.60 2.26 6.03 701.09Wuhan Others, Hubei 2.12 8.06 2.12 3.68 456.53
Hong Kong Wuhan Customs,Hubei 8.06 2.12 3.68 456.53Zhengzhou Others, Henan 2.14 8.13 2.14 5.55 682.58
Russia Zhengzhou Customs,Henan 2.29 0.60 1.56 682.24Luxembourg Zhengzhou Customs,Henan 3.98 1.05 2.72 682.58Thailand Zhengzhou Customs,Henan 1.86 0.49 1.27 682.99
Other 12.87 49.02 12.87 31.49 642.33Various 12.87 49.02 12.87 31.49 642.33
Various small cargoes 49.02 12.87 31.49 642.33total exports 381.48 1,452.34 381.48 811.90 559.03Net imports -282.49^“Destination” (for imports) and “origin” (exports) in the customs entry usually refers to the shipment’s final destination, but occasionally indicates an intermediate point.† Yangtze river delta destinations. Considerable volumes of crude designated as being for Yangtze delta destinations in the customs data end up at mid-Yangtze refineries.‡ Pearl river delta destinations.— Imports and exports data from China General Administration of Customs
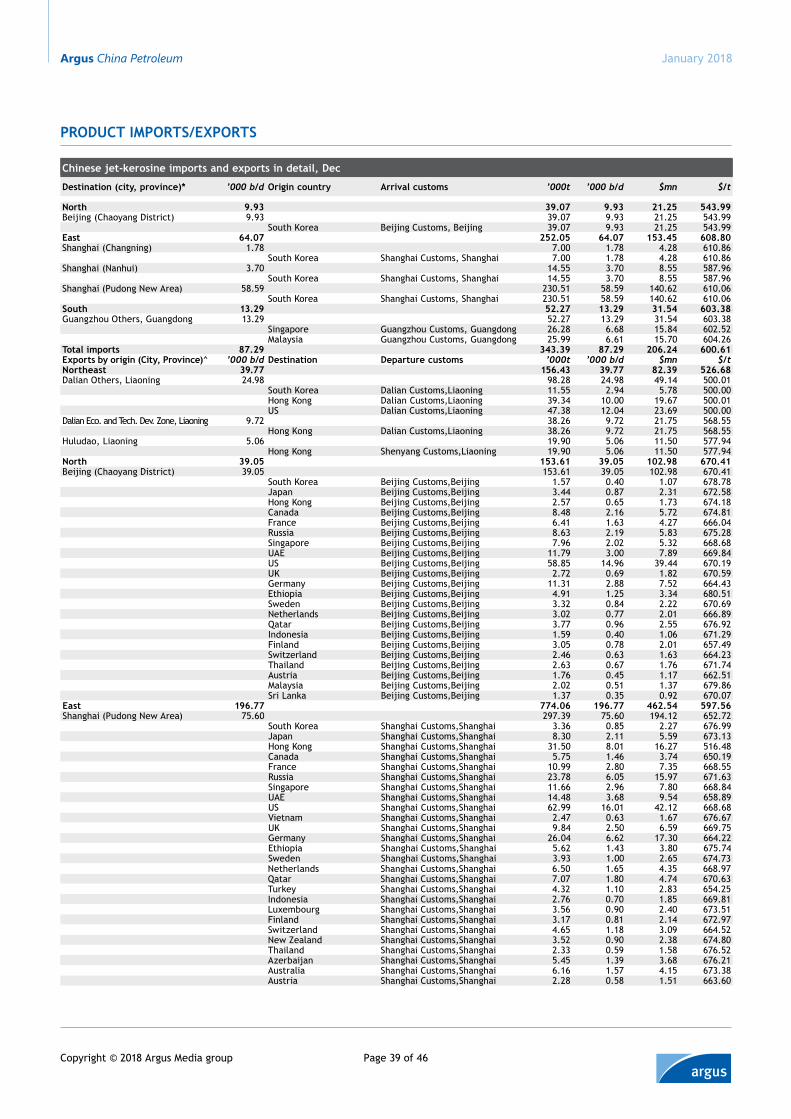
Argus China Petroleum
Page 39 of 46Copyright © 2018 Argus Media group
January 2018
Product imPorts/exPorts
chinese jet-kerosine imports and exports in detail, dec
destination (city, province)* ’000 b/d origin country Arrival customs ’000t ’000 b/d $mn $/t
North 9.93 39.07 9.93 21.25 543.99Beijing (Chaoyang District) 9.93 39.07 9.93 21.25 543.99
South Korea Beijing Customs, Beijing 39.07 9.93 21.25 543.99east 64.07 252.05 64.07 153.45 608.80Shanghai (Changning) 1.78 7.00 1.78 4.28 610.86
South Korea Shanghai Customs, Shanghai 7.00 1.78 4.28 610.86Shanghai (Nanhui) 3.70 14.55 3.70 8.55 587.96
South Korea Shanghai Customs, Shanghai 14.55 3.70 8.55 587.96Shanghai (Pudong New Area) 58.59 230.51 58.59 140.62 610.06
South Korea Shanghai Customs, Shanghai 230.51 58.59 140.62 610.06south 13.29 52.27 13.29 31.54 603.38Guangzhou Others, Guangdong 13.29 52.27 13.29 31.54 603.38
Singapore Guangzhou Customs, Guangdong 26.28 6.68 15.84 602.52Malaysia Guangzhou Customs, Guangdong 25.99 6.61 15.70 604.26
total imports 87.29 343.39 87.29 206.24 600.61exports by origin (city, Province)^ ’000 b/d destination departure customs ’000t ’000 b/d $mn $/tNortheast 39.77 156.43 39.77 82.39 526.68Dalian Others, Liaoning 24.98 98.28 24.98 49.14 500.01
South Korea Dalian Customs,Liaoning 11.55 2.94 5.78 500.00Hong Kong Dalian Customs,Liaoning 39.34 10.00 19.67 500.01US Dalian Customs,Liaoning 47.38 12.04 23.69 500.00
Dalian Eco. and Tech. Dev. Zone, Liaoning 9.72 38.26 9.72 21.75 568.55Hong Kong Dalian Customs,Liaoning 38.26 9.72 21.75 568.55
Huludao, Liaoning 5.06 19.90 5.06 11.50 577.94Hong Kong Shenyang Customs,Liaoning 19.90 5.06 11.50 577.94
North 39.05 153.61 39.05 102.98 670.41Beijing (Chaoyang District) 39.05 153.61 39.05 102.98 670.41
South Korea Beijing Customs,Beijing 1.57 0.40 1.07 678.78Japan Beijing Customs,Beijing 3.44 0.87 2.31 672.58Hong Kong Beijing Customs,Beijing 2.57 0.65 1.73 674.18Canada Beijing Customs,Beijing 8.48 2.16 5.72 674.81France Beijing Customs,Beijing 6.41 1.63 4.27 666.04Russia Beijing Customs,Beijing 8.63 2.19 5.83 675.28Singapore Beijing Customs,Beijing 7.96 2.02 5.32 668.68UAE Beijing Customs,Beijing 11.79 3.00 7.89 669.84US Beijing Customs,Beijing 58.85 14.96 39.44 670.19UK Beijing Customs,Beijing 2.72 0.69 1.82 670.59Germany Beijing Customs,Beijing 11.31 2.88 7.52 664.43Ethiopia Beijing Customs,Beijing 4.91 1.25 3.34 680.51Sweden Beijing Customs,Beijing 3.32 0.84 2.22 670.69Netherlands Beijing Customs,Beijing 3.02 0.77 2.01 666.89Qatar Beijing Customs,Beijing 3.77 0.96 2.55 676.92Indonesia Beijing Customs,Beijing 1.59 0.40 1.06 671.29Finland Beijing Customs,Beijing 3.05 0.78 2.01 657.49Switzerland Beijing Customs,Beijing 2.46 0.63 1.63 664.23Thailand Beijing Customs,Beijing 2.63 0.67 1.76 671.74Austria Beijing Customs,Beijing 1.76 0.45 1.17 662.51Malaysia Beijing Customs,Beijing 2.02 0.51 1.37 679.86Sri Lanka Beijing Customs,Beijing 1.37 0.35 0.92 670.07
east 196.77 774.06 196.77 462.54 597.56Shanghai (Pudong New Area) 75.60 297.39 75.60 194.12 652.72
South Korea Shanghai Customs,Shanghai 3.36 0.85 2.27 676.99Japan Shanghai Customs,Shanghai 8.30 2.11 5.59 673.13Hong Kong Shanghai Customs,Shanghai 31.50 8.01 16.27 516.48Canada Shanghai Customs,Shanghai 5.75 1.46 3.74 650.19France Shanghai Customs,Shanghai 10.99 2.80 7.35 668.55Russia Shanghai Customs,Shanghai 23.78 6.05 15.97 671.63Singapore Shanghai Customs,Shanghai 11.66 2.96 7.80 668.84UAE Shanghai Customs,Shanghai 14.48 3.68 9.54 658.89US Shanghai Customs,Shanghai 62.99 16.01 42.12 668.68Vietnam Shanghai Customs,Shanghai 2.47 0.63 1.67 676.67UK Shanghai Customs,Shanghai 9.84 2.50 6.59 669.75Germany Shanghai Customs,Shanghai 26.04 6.62 17.30 664.22Ethiopia Shanghai Customs,Shanghai 5.62 1.43 3.80 675.74Sweden Shanghai Customs,Shanghai 3.93 1.00 2.65 674.73Netherlands Shanghai Customs,Shanghai 6.50 1.65 4.35 668.97Qatar Shanghai Customs,Shanghai 7.07 1.80 4.74 670.63Turkey Shanghai Customs,Shanghai 4.32 1.10 2.83 654.25Indonesia Shanghai Customs,Shanghai 2.76 0.70 1.85 669.81Luxembourg Shanghai Customs,Shanghai 3.56 0.90 2.40 673.51Finland Shanghai Customs,Shanghai 3.17 0.81 2.14 672.97Switzerland Shanghai Customs,Shanghai 4.65 1.18 3.09 664.52New Zealand Shanghai Customs,Shanghai 3.52 0.90 2.38 674.80Thailand Shanghai Customs,Shanghai 2.33 0.59 1.58 676.52Azerbaijan Shanghai Customs,Shanghai 5.45 1.39 3.68 676.21Australia Shanghai Customs,Shanghai 6.16 1.57 4.15 673.38Austria Shanghai Customs,Shanghai 2.28 0.58 1.51 663.60
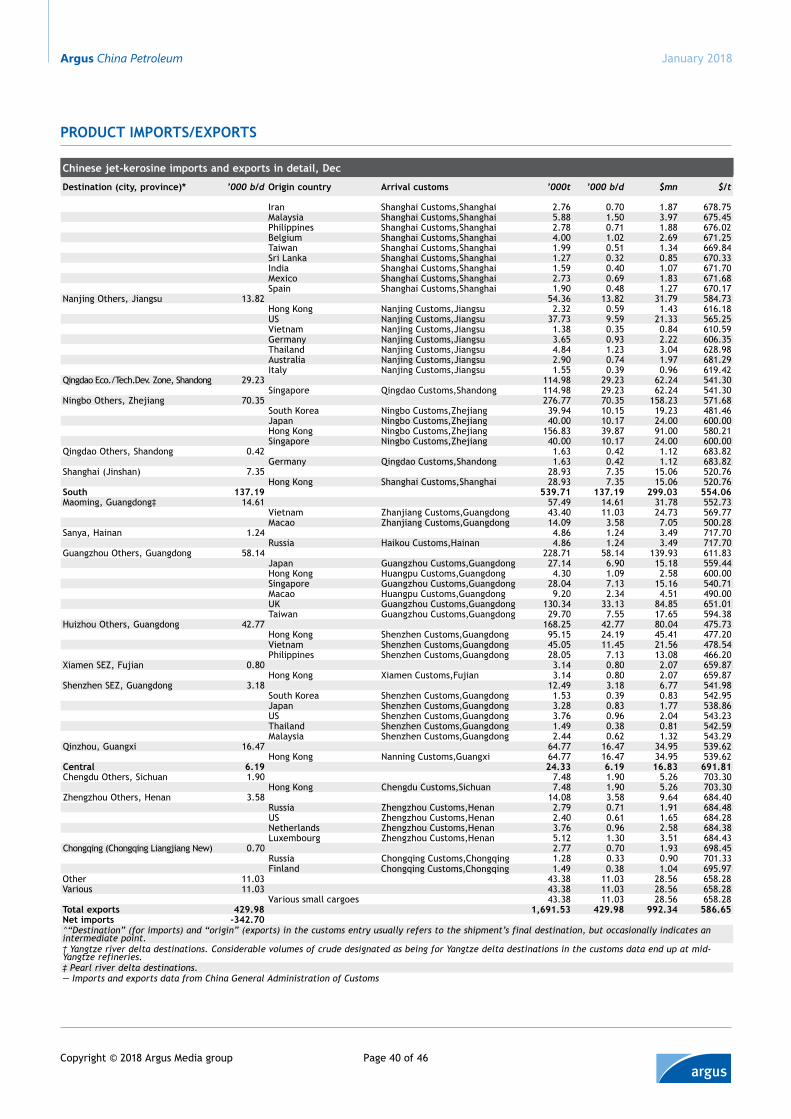
Argus China Petroleum
Page 40 of 46Copyright © 2018 Argus Media group
January 2018
Product imPorts/exPorts
chinese jet-kerosine imports and exports in detail, dec
destination (city, province)* ’000 b/d origin country Arrival customs ’000t ’000 b/d $mn $/t
Iran Shanghai Customs,Shanghai 2.76 0.70 1.87 678.75Malaysia Shanghai Customs,Shanghai 5.88 1.50 3.97 675.45Philippines Shanghai Customs,Shanghai 2.78 0.71 1.88 676.02Belgium Shanghai Customs,Shanghai 4.00 1.02 2.69 671.25Taiwan Shanghai Customs,Shanghai 1.99 0.51 1.34 669.84Sri Lanka Shanghai Customs,Shanghai 1.27 0.32 0.85 670.33India Shanghai Customs,Shanghai 1.59 0.40 1.07 671.70Mexico Shanghai Customs,Shanghai 2.73 0.69 1.83 671.68Spain Shanghai Customs,Shanghai 1.90 0.48 1.27 670.17
Nanjing Others, Jiangsu 13.82 54.36 13.82 31.79 584.73Hong Kong Nanjing Customs,Jiangsu 2.32 0.59 1.43 616.18US Nanjing Customs,Jiangsu 37.73 9.59 21.33 565.25Vietnam Nanjing Customs,Jiangsu 1.38 0.35 0.84 610.59Germany Nanjing Customs,Jiangsu 3.65 0.93 2.22 606.35Thailand Nanjing Customs,Jiangsu 4.84 1.23 3.04 628.98Australia Nanjing Customs,Jiangsu 2.90 0.74 1.97 681.29Italy Nanjing Customs,Jiangsu 1.55 0.39 0.96 619.42
Qingdao Eco./Tech.Dev. Zone, Shandong 29.23 114.98 29.23 62.24 541.30Singapore Qingdao Customs,Shandong 114.98 29.23 62.24 541.30
Ningbo Others, Zhejiang 70.35 276.77 70.35 158.23 571.68South Korea Ningbo Customs,Zhejiang 39.94 10.15 19.23 481.46Japan Ningbo Customs,Zhejiang 40.00 10.17 24.00 600.00Hong Kong Ningbo Customs,Zhejiang 156.83 39.87 91.00 580.21Singapore Ningbo Customs,Zhejiang 40.00 10.17 24.00 600.00
Qingdao Others, Shandong 0.42 1.63 0.42 1.12 683.82Germany Qingdao Customs,Shandong 1.63 0.42 1.12 683.82
Shanghai (Jinshan) 7.35 28.93 7.35 15.06 520.76Hong Kong Shanghai Customs,Shanghai 28.93 7.35 15.06 520.76
south 137.19 539.71 137.19 299.03 554.06Maoming, Guangdong‡ 14.61 57.49 14.61 31.78 552.73
Vietnam Zhanjiang Customs,Guangdong 43.40 11.03 24.73 569.77Macao Zhanjiang Customs,Guangdong 14.09 3.58 7.05 500.28
Sanya, Hainan 1.24 4.86 1.24 3.49 717.70Russia Haikou Customs,Hainan 4.86 1.24 3.49 717.70
Guangzhou Others, Guangdong 58.14 228.71 58.14 139.93 611.83Japan Guangzhou Customs,Guangdong 27.14 6.90 15.18 559.44Hong Kong Huangpu Customs,Guangdong 4.30 1.09 2.58 600.00Singapore Guangzhou Customs,Guangdong 28.04 7.13 15.16 540.71Macao Huangpu Customs,Guangdong 9.20 2.34 4.51 490.00UK Guangzhou Customs,Guangdong 130.34 33.13 84.85 651.01Taiwan Guangzhou Customs,Guangdong 29.70 7.55 17.65 594.38
Huizhou Others, Guangdong 42.77 168.25 42.77 80.04 475.73Hong Kong Shenzhen Customs,Guangdong 95.15 24.19 45.41 477.20Vietnam Shenzhen Customs,Guangdong 45.05 11.45 21.56 478.54Philippines Shenzhen Customs,Guangdong 28.05 7.13 13.08 466.20
Xiamen SEZ, Fujian 0.80 3.14 0.80 2.07 659.87Hong Kong Xiamen Customs,Fujian 3.14 0.80 2.07 659.87
Shenzhen SEZ, Guangdong 3.18 12.49 3.18 6.77 541.98South Korea Shenzhen Customs,Guangdong 1.53 0.39 0.83 542.95Japan Shenzhen Customs,Guangdong 3.28 0.83 1.77 538.86US Shenzhen Customs,Guangdong 3.76 0.96 2.04 543.23Thailand Shenzhen Customs,Guangdong 1.49 0.38 0.81 542.59Malaysia Shenzhen Customs,Guangdong 2.44 0.62 1.32 543.29
Qinzhou, Guangxi 16.47 64.77 16.47 34.95 539.62Hong Kong Nanning Customs,Guangxi 64.77 16.47 34.95 539.62
central 6.19 24.33 6.19 16.83 691.81Chengdu Others, Sichuan 1.90 7.48 1.90 5.26 703.30
Hong Kong Chengdu Customs,Sichuan 7.48 1.90 5.26 703.30Zhengzhou Others, Henan 3.58 14.08 3.58 9.64 684.40
Russia Zhengzhou Customs,Henan 2.79 0.71 1.91 684.48US Zhengzhou Customs,Henan 2.40 0.61 1.65 684.28Netherlands Zhengzhou Customs,Henan 3.76 0.96 2.58 684.38Luxembourg Zhengzhou Customs,Henan 5.12 1.30 3.51 684.43
Chongqing (Chongqing Liangjiang New) 0.70 2.77 0.70 1.93 698.45Russia Chongqing Customs,Chongqing 1.28 0.33 0.90 701.33Finland Chongqing Customs,Chongqing 1.49 0.38 1.04 695.97
Other 11.03 43.38 11.03 28.56 658.28Various 11.03 43.38 11.03 28.56 658.28
Various small cargoes 43.38 11.03 28.56 658.28total exports 429.98 1,691.53 429.98 992.34 586.65Net imports -342.70^“Destination” (for imports) and “origin” (exports) in the customs entry usually refers to the shipment’s final destination, but occasionally indicates an intermediate point.† Yangtze river delta destinations. Considerable volumes of crude designated as being for Yangtze delta destinations in the customs data end up at mid-Yangtze refineries.‡ Pearl river delta destinations.— Imports and exports data from China General Administration of Customs
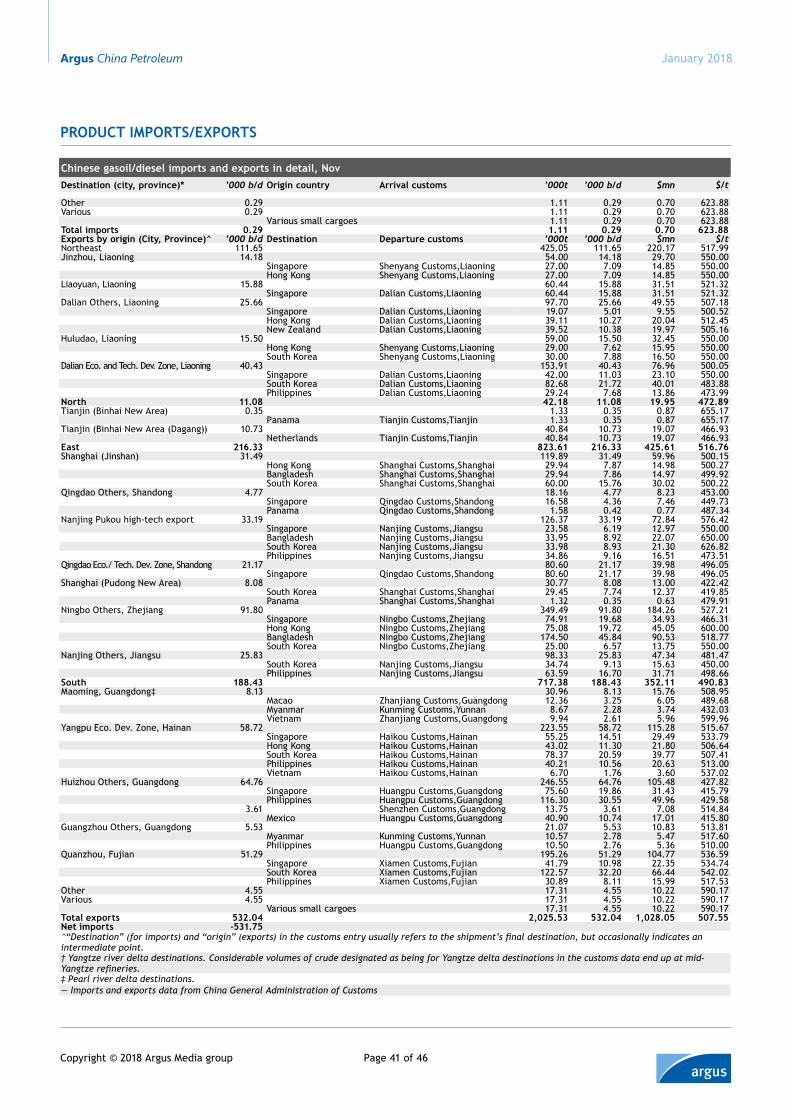
Argus China Petroleum
Page 41 of 46Copyright © 2018 Argus Media group
January 2018
Product imPorts/exPorts
chinese gasoil/diesel imports and exports in detail, Novdestination (city, province)* ’000 b/d origin country Arrival customs ’000t ’000 b/d $mn $/t
Other 0.29 1.11 0.29 0.70 623.88Various 0.29 1.11 0.29 0.70 623.88
Various small cargoes 1.11 0.29 0.70 623.88total imports 0.29 1.11 0.29 0.70 623.88exports by origin (city, Province)^ ’000 b/d destination departure customs ’000t ’000 b/d $mn $/tNortheast 111.65 425.05 111.65 220.17 517.99Jinzhou, Liaoning 14.18 54.00 14.18 29.70 550.00
Singapore Shenyang Customs,Liaoning 27.00 7.09 14.85 550.00Hong Kong Shenyang Customs,Liaoning 27.00 7.09 14.85 550.00
Liaoyuan, Liaoning 15.88 60.44 15.88 31.51 521.32Singapore Dalian Customs,Liaoning 60.44 15.88 31.51 521.32
Dalian Others, Liaoning 25.66 97.70 25.66 49.55 507.18Singapore Dalian Customs,Liaoning 19.07 5.01 9.55 500.52Hong Kong Dalian Customs,Liaoning 39.11 10.27 20.04 512.45New Zealand Dalian Customs,Liaoning 39.52 10.38 19.97 505.16
Huludao, Liaoning 15.50 59.00 15.50 32.45 550.00Hong Kong Shenyang Customs,Liaoning 29.00 7.62 15.95 550.00South Korea Shenyang Customs,Liaoning 30.00 7.88 16.50 550.00
Dalian Eco. and Tech. Dev. Zone, Liaoning 40.43 153.91 40.43 76.96 500.05Singapore Dalian Customs,Liaoning 42.00 11.03 23.10 550.00South Korea Dalian Customs,Liaoning 82.68 21.72 40.01 483.88Philippines Dalian Customs,Liaoning 29.24 7.68 13.86 473.99
North 11.08 42.18 11.08 19.95 472.89Tianjin (Binhai New Area) 0.35 1.33 0.35 0.87 655.17
Panama Tianjin Customs,Tianjin 1.33 0.35 0.87 655.17Tianjin (Binhai New Area (Dagang)) 10.73 40.84 10.73 19.07 466.93
Netherlands Tianjin Customs,Tianjin 40.84 10.73 19.07 466.93east 216.33 823.61 216.33 425.61 516.76Shanghai (Jinshan) 31.49 119.89 31.49 59.96 500.15
Hong Kong Shanghai Customs,Shanghai 29.94 7.87 14.98 500.27Bangladesh Shanghai Customs,Shanghai 29.94 7.86 14.97 499.92South Korea Shanghai Customs,Shanghai 60.00 15.76 30.02 500.22
Qingdao Others, Shandong 4.77 18.16 4.77 8.23 453.00Singapore Qingdao Customs,Shandong 16.58 4.36 7.46 449.73Panama Qingdao Customs,Shandong 1.58 0.42 0.77 487.34
Nanjing Pukou high-tech export 33.19 126.37 33.19 72.84 576.42Singapore Nanjing Customs,Jiangsu 23.58 6.19 12.97 550.00Bangladesh Nanjing Customs,Jiangsu 33.95 8.92 22.07 650.00South Korea Nanjing Customs,Jiangsu 33.98 8.93 21.30 626.82Philippines Nanjing Customs,Jiangsu 34.86 9.16 16.51 473.51
Qingdao Eco./ Tech. Dev. Zone, Shandong 21.17 80.60 21.17 39.98 496.05Singapore Qingdao Customs,Shandong 80.60 21.17 39.98 496.05
Shanghai (Pudong New Area) 8.08 30.77 8.08 13.00 422.42South Korea Shanghai Customs,Shanghai 29.45 7.74 12.37 419.85Panama Shanghai Customs,Shanghai 1.32 0.35 0.63 479.91
Ningbo Others, Zhejiang 91.80 349.49 91.80 184.26 527.21Singapore Ningbo Customs,Zhejiang 74.91 19.68 34.93 466.31Hong Kong Ningbo Customs,Zhejiang 75.08 19.72 45.05 600.00Bangladesh Ningbo Customs,Zhejiang 174.50 45.84 90.53 518.77South Korea Ningbo Customs,Zhejiang 25.00 6.57 13.75 550.00
Nanjing Others, Jiangsu 25.83 98.33 25.83 47.34 481.47South Korea Nanjing Customs,Jiangsu 34.74 9.13 15.63 450.00Philippines Nanjing Customs,Jiangsu 63.59 16.70 31.71 498.66
south 188.43 717.38 188.43 352.11 490.83Maoming, Guangdong‡ 8.13 30.96 8.13 15.76 508.95
Macao Zhanjiang Customs,Guangdong 12.36 3.25 6.05 489.68Myanmar Kunming Customs,Yunnan 8.67 2.28 3.74 432.03Vietnam Zhanjiang Customs,Guangdong 9.94 2.61 5.96 599.96
Yangpu Eco. Dev. Zone, Hainan 58.72 223.55 58.72 115.28 515.67Singapore Haikou Customs,Hainan 55.25 14.51 29.49 533.79Hong Kong Haikou Customs,Hainan 43.02 11.30 21.80 506.64South Korea Haikou Customs,Hainan 78.37 20.59 39.77 507.41Philippines Haikou Customs,Hainan 40.21 10.56 20.63 513.00Vietnam Haikou Customs,Hainan 6.70 1.76 3.60 537.02
Huizhou Others, Guangdong 64.76 246.55 64.76 105.48 427.82Singapore Huangpu Customs,Guangdong 75.60 19.86 31.43 415.79Philippines Huangpu Customs,Guangdong 116.30 30.55 49.96 429.58
3.61 Shenzhen Customs,Guangdong 13.75 3.61 7.08 514.84Mexico Huangpu Customs,Guangdong 40.90 10.74 17.01 415.80
Guangzhou Others, Guangdong 5.53 21.07 5.53 10.83 513.81Myanmar Kunming Customs,Yunnan 10.57 2.78 5.47 517.60Philippines Huangpu Customs,Guangdong 10.50 2.76 5.36 510.00
Quanzhou, Fujian 51.29 195.26 51.29 104.77 536.59Singapore Xiamen Customs,Fujian 41.79 10.98 22.35 534.74South Korea Xiamen Customs,Fujian 122.57 32.20 66.44 542.02Philippines Xiamen Customs,Fujian 30.89 8.11 15.99 517.53
Other 4.55 17.31 4.55 10.22 590.17Various 4.55 17.31 4.55 10.22 590.17
Various small cargoes 17.31 4.55 10.22 590.17total exports 532.04 2,025.53 532.04 1,028.05 507.55Net imports -531.75^“Destination” (for imports) and “origin” (exports) in the customs entry usually refers to the shipment’s final destination, but occasionally indicates an intermediate point.† Yangtze river delta destinations. Considerable volumes of crude designated as being for Yangtze delta destinations in the customs data end up at mid-Yangtze refineries.‡ Pearl river delta destinations.— Imports and exports data from China General Administration of Customs
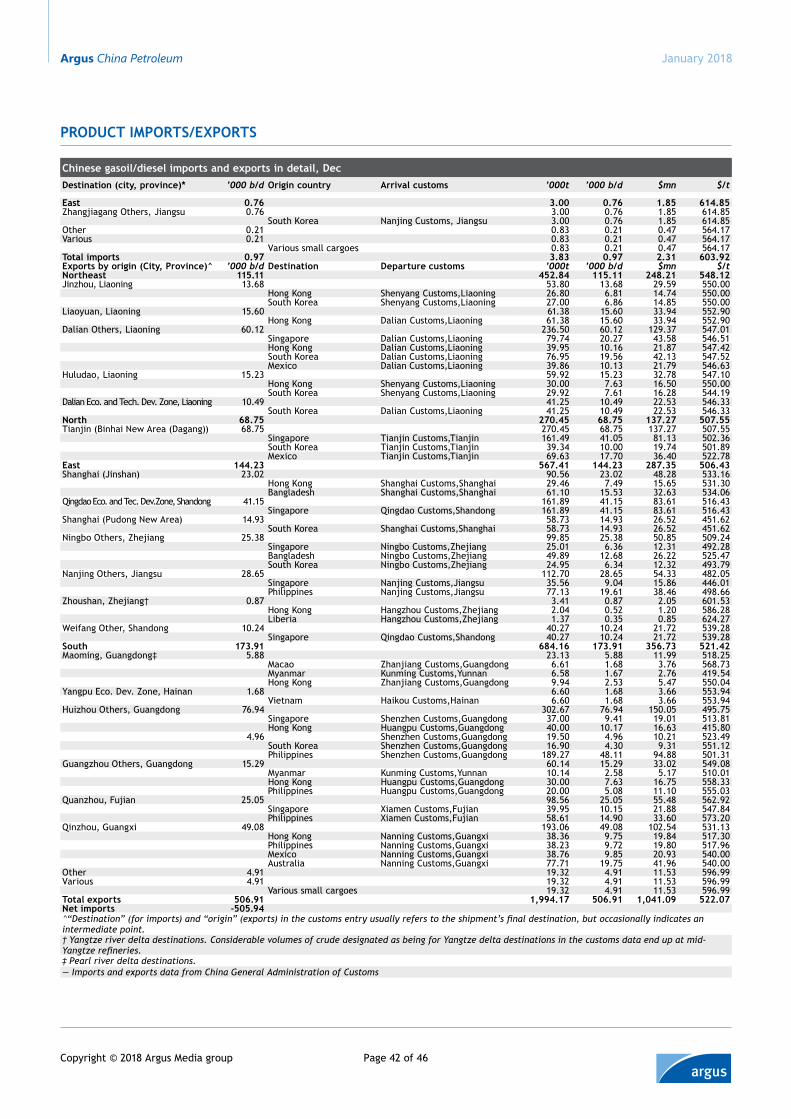
Argus China Petroleum
Page 42 of 46Copyright © 2018 Argus Media group
January 2018
Product imPorts/exPorts
chinese gasoil/diesel imports and exports in detail, decdestination (city, province)* ’000 b/d origin country Arrival customs ’000t ’000 b/d $mn $/t
east 0.76 3.00 0.76 1.85 614.85Zhangjiagang Others, Jiangsu 0.76 3.00 0.76 1.85 614.85
South Korea Nanjing Customs, Jiangsu 3.00 0.76 1.85 614.85Other 0.21 0.83 0.21 0.47 564.17Various 0.21 0.83 0.21 0.47 564.17
Various small cargoes 0.83 0.21 0.47 564.17total imports 0.97 3.83 0.97 2.31 603.92exports by origin (city, Province)^ ’000 b/d destination departure customs ’000t ’000 b/d $mn $/tNortheast 115.11 452.84 115.11 248.21 548.12Jinzhou, Liaoning 13.68 53.80 13.68 29.59 550.00
Hong Kong Shenyang Customs,Liaoning 26.80 6.81 14.74 550.00South Korea Shenyang Customs,Liaoning 27.00 6.86 14.85 550.00
Liaoyuan, Liaoning 15.60 61.38 15.60 33.94 552.90Hong Kong Dalian Customs,Liaoning 61.38 15.60 33.94 552.90
Dalian Others, Liaoning 60.12 236.50 60.12 129.37 547.01Singapore Dalian Customs,Liaoning 79.74 20.27 43.58 546.51Hong Kong Dalian Customs,Liaoning 39.95 10.16 21.87 547.42South Korea Dalian Customs,Liaoning 76.95 19.56 42.13 547.52Mexico Dalian Customs,Liaoning 39.86 10.13 21.79 546.63
Huludao, Liaoning 15.23 59.92 15.23 32.78 547.10Hong Kong Shenyang Customs,Liaoning 30.00 7.63 16.50 550.00South Korea Shenyang Customs,Liaoning 29.92 7.61 16.28 544.19
Dalian Eco. and Tech. Dev. Zone, Liaoning 10.49 41.25 10.49 22.53 546.33South Korea Dalian Customs,Liaoning 41.25 10.49 22.53 546.33
North 68.75 270.45 68.75 137.27 507.55Tianjin (Binhai New Area (Dagang)) 68.75 270.45 68.75 137.27 507.55
Singapore Tianjin Customs,Tianjin 161.49 41.05 81.13 502.36South Korea Tianjin Customs,Tianjin 39.34 10.00 19.74 501.89Mexico Tianjin Customs,Tianjin 69.63 17.70 36.40 522.78
east 144.23 567.41 144.23 287.35 506.43Shanghai (Jinshan) 23.02 90.56 23.02 48.28 533.16
Hong Kong Shanghai Customs,Shanghai 29.46 7.49 15.65 531.30Bangladesh Shanghai Customs,Shanghai 61.10 15.53 32.63 534.06
Qingdao Eco. and Tec. Dev.Zone, Shandong 41.15 161.89 41.15 83.61 516.43Singapore Qingdao Customs,Shandong 161.89 41.15 83.61 516.43
Shanghai (Pudong New Area) 14.93 58.73 14.93 26.52 451.62South Korea Shanghai Customs,Shanghai 58.73 14.93 26.52 451.62
Ningbo Others, Zhejiang 25.38 99.85 25.38 50.85 509.24Singapore Ningbo Customs,Zhejiang 25.01 6.36 12.31 492.28Bangladesh Ningbo Customs,Zhejiang 49.89 12.68 26.22 525.47South Korea Ningbo Customs,Zhejiang 24.95 6.34 12.32 493.79
Nanjing Others, Jiangsu 28.65 112.70 28.65 54.33 482.05Singapore Nanjing Customs,Jiangsu 35.56 9.04 15.86 446.01Philippines Nanjing Customs,Jiangsu 77.13 19.61 38.46 498.66
Zhoushan, Zhejiang† 0.87 3.41 0.87 2.05 601.53Hong Kong Hangzhou Customs,Zhejiang 2.04 0.52 1.20 586.28Liberia Hangzhou Customs,Zhejiang 1.37 0.35 0.85 624.27
Weifang Other, Shandong 10.24 40.27 10.24 21.72 539.28Singapore Qingdao Customs,Shandong 40.27 10.24 21.72 539.28
south 173.91 684.16 173.91 356.73 521.42Maoming, Guangdong‡ 5.88 23.13 5.88 11.99 518.25
Macao Zhanjiang Customs,Guangdong 6.61 1.68 3.76 568.73Myanmar Kunming Customs,Yunnan 6.58 1.67 2.76 419.54Hong Kong Zhanjiang Customs,Guangdong 9.94 2.53 5.47 550.04
Yangpu Eco. Dev. Zone, Hainan 1.68 6.60 1.68 3.66 553.94Vietnam Haikou Customs,Hainan 6.60 1.68 3.66 553.94
Huizhou Others, Guangdong 76.94 302.67 76.94 150.05 495.75Singapore Shenzhen Customs,Guangdong 37.00 9.41 19.01 513.81Hong Kong Huangpu Customs,Guangdong 40.00 10.17 16.63 415.80
4.96 Shenzhen Customs,Guangdong 19.50 4.96 10.21 523.49South Korea Shenzhen Customs,Guangdong 16.90 4.30 9.31 551.12Philippines Shenzhen Customs,Guangdong 189.27 48.11 94.88 501.31
Guangzhou Others, Guangdong 15.29 60.14 15.29 33.02 549.08Myanmar Kunming Customs,Yunnan 10.14 2.58 5.17 510.01Hong Kong Huangpu Customs,Guangdong 30.00 7.63 16.75 558.33Philippines Huangpu Customs,Guangdong 20.00 5.08 11.10 555.03
Quanzhou, Fujian 25.05 98.56 25.05 55.48 562.92Singapore Xiamen Customs,Fujian 39.95 10.15 21.88 547.84Philippines Xiamen Customs,Fujian 58.61 14.90 33.60 573.20
Qinzhou, Guangxi 49.08 193.06 49.08 102.54 531.13Hong Kong Nanning Customs,Guangxi 38.36 9.75 19.84 517.30Philippines Nanning Customs,Guangxi 38.23 9.72 19.80 517.96Mexico Nanning Customs,Guangxi 38.76 9.85 20.93 540.00Australia Nanning Customs,Guangxi 77.71 19.75 41.96 540.00
Other 4.91 19.32 4.91 11.53 596.99Various 4.91 19.32 4.91 11.53 596.99
Various small cargoes 19.32 4.91 11.53 596.99total exports 506.91 1,994.17 506.91 1,041.09 522.07Net imports -505.94^“Destination” (for imports) and “origin” (exports) in the customs entry usually refers to the shipment’s final destination, but occasionally indicates an intermediate point.† Yangtze river delta destinations. Considerable volumes of crude designated as being for Yangtze delta destinations in the customs data end up at mid-Yangtze refineries.‡ Pearl river delta destinations.— Imports and exports data from China General Administration of Customs
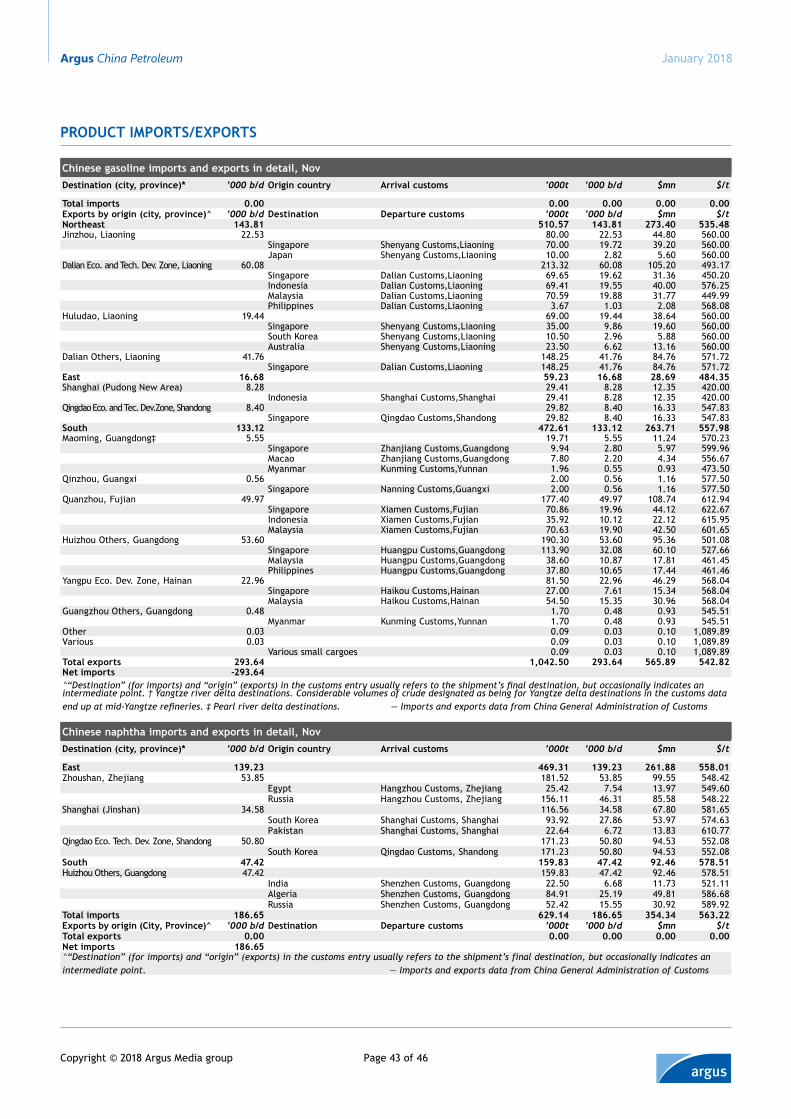
Argus China Petroleum
Page 43 of 46Copyright © 2018 Argus Media group
January 2018
Product imPorts/exPorts
chinese gasoline imports and exports in detail, Novdestination (city, province)* ’000 b/d origin country Arrival customs ’000t ’000 b/d $mn $/t
total imports 0.00 0.00 0.00 0.00 0.00exports by origin (city, province)^ ’000 b/d destination departure customs ’000t ’000 b/d $mn $/tNortheast 143.81 510.57 143.81 273.40 535.48Jinzhou, Liaoning 22.53 80.00 22.53 44.80 560.00
Singapore Shenyang Customs,Liaoning 70.00 19.72 39.20 560.00Japan Shenyang Customs,Liaoning 10.00 2.82 5.60 560.00
Dalian Eco. and Tech. Dev. Zone, Liaoning 60.08 213.32 60.08 105.20 493.17Singapore Dalian Customs,Liaoning 69.65 19.62 31.36 450.20Indonesia Dalian Customs,Liaoning 69.41 19.55 40.00 576.25Malaysia Dalian Customs,Liaoning 70.59 19.88 31.77 449.99Philippines Dalian Customs,Liaoning 3.67 1.03 2.08 568.08
Huludao, Liaoning 19.44 69.00 19.44 38.64 560.00Singapore Shenyang Customs,Liaoning 35.00 9.86 19.60 560.00South Korea Shenyang Customs,Liaoning 10.50 2.96 5.88 560.00Australia Shenyang Customs,Liaoning 23.50 6.62 13.16 560.00
Dalian Others, Liaoning 41.76 148.25 41.76 84.76 571.72Singapore Dalian Customs,Liaoning 148.25 41.76 84.76 571.72
east 16.68 59.23 16.68 28.69 484.35Shanghai (Pudong New Area) 8.28 29.41 8.28 12.35 420.00
Indonesia Shanghai Customs,Shanghai 29.41 8.28 12.35 420.00Qingdao Eco. and Tec. Dev.Zone, Shandong 8.40 29.82 8.40 16.33 547.83
Singapore Qingdao Customs,Shandong 29.82 8.40 16.33 547.83south 133.12 472.61 133.12 263.71 557.98Maoming, Guangdong‡ 5.55 19.71 5.55 11.24 570.23
Singapore Zhanjiang Customs,Guangdong 9.94 2.80 5.97 599.96Macao Zhanjiang Customs,Guangdong 7.80 2.20 4.34 556.67Myanmar Kunming Customs,Yunnan 1.96 0.55 0.93 473.50
Qinzhou, Guangxi 0.56 2.00 0.56 1.16 577.50Singapore Nanning Customs,Guangxi 2.00 0.56 1.16 577.50
Quanzhou, Fujian 49.97 177.40 49.97 108.74 612.94Singapore Xiamen Customs,Fujian 70.86 19.96 44.12 622.67Indonesia Xiamen Customs,Fujian 35.92 10.12 22.12 615.95Malaysia Xiamen Customs,Fujian 70.63 19.90 42.50 601.65
Huizhou Others, Guangdong 53.60 190.30 53.60 95.36 501.08Singapore Huangpu Customs,Guangdong 113.90 32.08 60.10 527.66Malaysia Huangpu Customs,Guangdong 38.60 10.87 17.81 461.45Philippines Huangpu Customs,Guangdong 37.80 10.65 17.44 461.46
Yangpu Eco. Dev. Zone, Hainan 22.96 81.50 22.96 46.29 568.04Singapore Haikou Customs,Hainan 27.00 7.61 15.34 568.04Malaysia Haikou Customs,Hainan 54.50 15.35 30.96 568.04
Guangzhou Others, Guangdong 0.48 1.70 0.48 0.93 545.51Myanmar Kunming Customs,Yunnan 1.70 0.48 0.93 545.51
Other 0.03 0.09 0.03 0.10 1,089.89Various 0.03 0.09 0.03 0.10 1,089.89
Various small cargoes 0.09 0.03 0.10 1,089.89total exports 293.64 1,042.50 293.64 565.89 542.82Net imports -293.64^“Destination” (for imports) and “origin” (exports) in the customs entry usually refers to the shipment’s final destination, but occasionally indicates an intermediate point. † Yangtze river delta destinations. Considerable volumes of crude designated as being for Yangtze delta destinations in the customs data end up at mid-Yangtze refineries. ‡ Pearl river delta destinations. — Imports and exports data from China General Administration of Customs
chinese naphtha imports and exports in detail, Novdestination (city, province)* ’000 b/d origin country Arrival customs ’000t ’000 b/d $mn $/t
east 139.23 469.31 139.23 261.88 558.01Zhoushan, Zhejiang 53.85 181.52 53.85 99.55 548.42
Egypt Hangzhou Customs, Zhejiang 25.42 7.54 13.97 549.60Russia Hangzhou Customs, Zhejiang 156.11 46.31 85.58 548.22
Shanghai (Jinshan) 34.58 116.56 34.58 67.80 581.65South Korea Shanghai Customs, Shanghai 93.92 27.86 53.97 574.63Pakistan Shanghai Customs, Shanghai 22.64 6.72 13.83 610.77
Qingdao Eco. Tech. Dev. Zone, Shandong 50.80 171.23 50.80 94.53 552.08South Korea Qingdao Customs, Shandong 171.23 50.80 94.53 552.08
south 47.42 159.83 47.42 92.46 578.51Huizhou Others, Guangdong 47.42 159.83 47.42 92.46 578.51
India Shenzhen Customs, Guangdong 22.50 6.68 11.73 521.11Algeria Shenzhen Customs, Guangdong 84.91 25.19 49.81 586.68Russia Shenzhen Customs, Guangdong 52.42 15.55 30.92 589.92
total imports 186.65 629.14 186.65 354.34 563.22exports by origin (city, Province)^ ’000 b/d destination departure customs ’000t ’000 b/d $mn $/ttotal exports 0.00 0.00 0.00 0.00 0.00Net imports 186.65^“Destination” (for imports) and “origin” (exports) in the customs entry usually refers to the shipment’s final destination, but occasionally indicates an intermediate point. — Imports and exports data from China General Administration of Customs
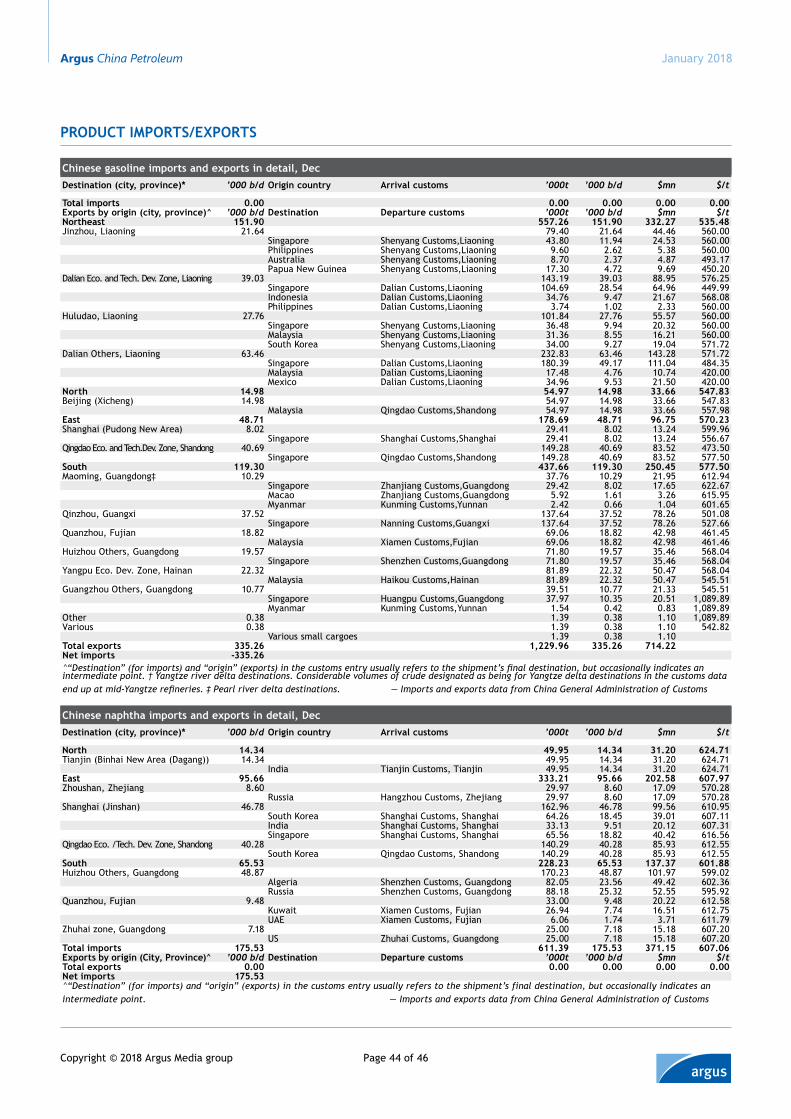
Argus China Petroleum
Page 44 of 46Copyright © 2018 Argus Media group
January 2018
Product imPorts/exPorts
chinese gasoline imports and exports in detail, decdestination (city, province)* ’000 b/d origin country Arrival customs ’000t ’000 b/d $mn $/t
total imports 0.00 0.00 0.00 0.00 0.00exports by origin (city, province)^ ’000 b/d destination departure customs ’000t ’000 b/d $mn $/tNortheast 151.90 557.26 151.90 332.27 535.48Jinzhou, Liaoning 21.64 79.40 21.64 44.46 560.00
Singapore Shenyang Customs,Liaoning 43.80 11.94 24.53 560.00Philippines Shenyang Customs,Liaoning 9.60 2.62 5.38 560.00Australia Shenyang Customs,Liaoning 8.70 2.37 4.87 493.17Papua New Guinea Shenyang Customs,Liaoning 17.30 4.72 9.69 450.20
Dalian Eco. and Tech. Dev. Zone, Liaoning 39.03 143.19 39.03 88.95 576.25Singapore Dalian Customs,Liaoning 104.69 28.54 64.96 449.99Indonesia Dalian Customs,Liaoning 34.76 9.47 21.67 568.08Philippines Dalian Customs,Liaoning 3.74 1.02 2.33 560.00
Huludao, Liaoning 27.76 101.84 27.76 55.57 560.00Singapore Shenyang Customs,Liaoning 36.48 9.94 20.32 560.00Malaysia Shenyang Customs,Liaoning 31.36 8.55 16.21 560.00South Korea Shenyang Customs,Liaoning 34.00 9.27 19.04 571.72
Dalian Others, Liaoning 63.46 232.83 63.46 143.28 571.72Singapore Dalian Customs,Liaoning 180.39 49.17 111.04 484.35Malaysia Dalian Customs,Liaoning 17.48 4.76 10.74 420.00Mexico Dalian Customs,Liaoning 34.96 9.53 21.50 420.00
North 14.98 54.97 14.98 33.66 547.83Beijing (Xicheng) 14.98 54.97 14.98 33.66 547.83
Malaysia Qingdao Customs,Shandong 54.97 14.98 33.66 557.98east 48.71 178.69 48.71 96.75 570.23Shanghai (Pudong New Area) 8.02 29.41 8.02 13.24 599.96
Singapore Shanghai Customs,Shanghai 29.41 8.02 13.24 556.67Qingdao Eco. and Tech.Dev. Zone, Shandong 40.69 149.28 40.69 83.52 473.50
Singapore Qingdao Customs,Shandong 149.28 40.69 83.52 577.50south 119.30 437.66 119.30 250.45 577.50Maoming, Guangdong‡ 10.29 37.76 10.29 21.95 612.94
Singapore Zhanjiang Customs,Guangdong 29.42 8.02 17.65 622.67Macao Zhanjiang Customs,Guangdong 5.92 1.61 3.26 615.95Myanmar Kunming Customs,Yunnan 2.42 0.66 1.04 601.65
Qinzhou, Guangxi 37.52 137.64 37.52 78.26 501.08Singapore Nanning Customs,Guangxi 137.64 37.52 78.26 527.66
Quanzhou, Fujian 18.82 69.06 18.82 42.98 461.45Malaysia Xiamen Customs,Fujian 69.06 18.82 42.98 461.46
Huizhou Others, Guangdong 19.57 71.80 19.57 35.46 568.04Singapore Shenzhen Customs,Guangdong 71.80 19.57 35.46 568.04
Yangpu Eco. Dev. Zone, Hainan 22.32 81.89 22.32 50.47 568.04Malaysia Haikou Customs,Hainan 81.89 22.32 50.47 545.51
Guangzhou Others, Guangdong 10.77 39.51 10.77 21.33 545.51Singapore Huangpu Customs,Guangdong 37.97 10.35 20.51 1,089.89Myanmar Kunming Customs,Yunnan 1.54 0.42 0.83 1,089.89
Other 0.38 1.39 0.38 1.10 1,089.89Various 0.38 1.39 0.38 1.10 542.82
Various small cargoes 1.39 0.38 1.10total exports 335.26 1,229.96 335.26 714.22Net imports -335.26^“Destination” (for imports) and “origin” (exports) in the customs entry usually refers to the shipment’s final destination, but occasionally indicates an intermediate point. † Yangtze river delta destinations. Considerable volumes of crude designated as being for Yangtze delta destinations in the customs data end up at mid-Yangtze refineries. ‡ Pearl river delta destinations. — Imports and exports data from China General Administration of Customs
chinese naphtha imports and exports in detail, decdestination (city, province)* ’000 b/d origin country Arrival customs ’000t ’000 b/d $mn $/t
North 14.34 49.95 14.34 31.20 624.71Tianjin (Binhai New Area (Dagang)) 14.34 49.95 14.34 31.20 624.71
India Tianjin Customs, Tianjin 49.95 14.34 31.20 624.71east 95.66 333.21 95.66 202.58 607.97Zhoushan, Zhejiang 8.60 29.97 8.60 17.09 570.28
Russia Hangzhou Customs, Zhejiang 29.97 8.60 17.09 570.28Shanghai (Jinshan) 46.78 162.96 46.78 99.56 610.95
South Korea Shanghai Customs, Shanghai 64.26 18.45 39.01 607.11India Shanghai Customs, Shanghai 33.13 9.51 20.12 607.31Singapore Shanghai Customs, Shanghai 65.56 18.82 40.42 616.56
Qingdao Eco. /Tech. Dev. Zone, Shandong 40.28 140.29 40.28 85.93 612.55South Korea Qingdao Customs, Shandong 140.29 40.28 85.93 612.55
south 65.53 228.23 65.53 137.37 601.88Huizhou Others, Guangdong 48.87 170.23 48.87 101.97 599.02
Algeria Shenzhen Customs, Guangdong 82.05 23.56 49.42 602.36Russia Shenzhen Customs, Guangdong 88.18 25.32 52.55 595.92
Quanzhou, Fujian 9.48 33.00 9.48 20.22 612.58Kuwait Xiamen Customs, Fujian 26.94 7.74 16.51 612.75UAE Xiamen Customs, Fujian 6.06 1.74 3.71 611.79
Zhuhai zone, Guangdong 7.18 25.00 7.18 15.18 607.20US Zhuhai Customs, Guangdong 25.00 7.18 15.18 607.20
total imports 175.53 611.39 175.53 371.15 607.06exports by origin (city, Province)^ ’000 b/d destination departure customs ’000t ’000 b/d $mn $/ttotal exports 0.00 0.00 0.00 0.00 0.00Net imports 175.53^“Destination” (for imports) and “origin” (exports) in the customs entry usually refers to the shipment’s final destination, but occasionally indicates an intermediate point. — Imports and exports data from China General Administration of Customs
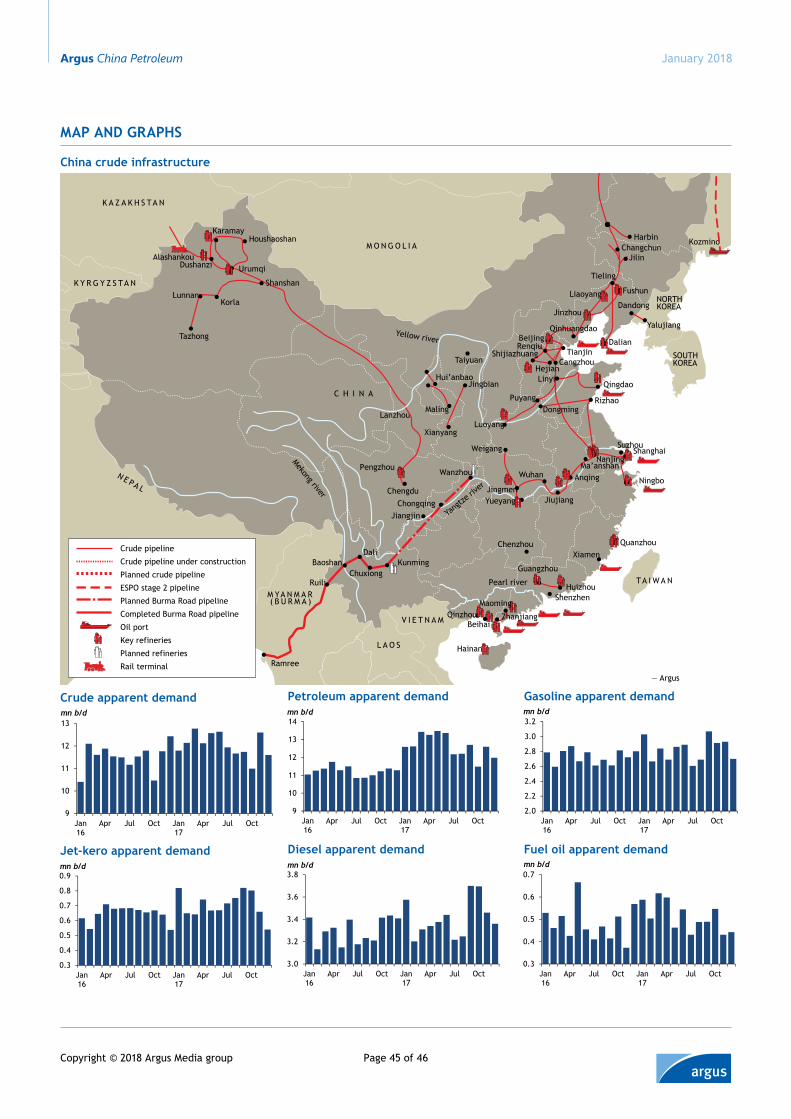
Argus China Petroleum
Page 45 of 46Copyright © 2018 Argus Media group
January 2018
Map and graphs
Crude apparent demand
9
10
11
12
13
Jan16
Apr Jul Oct Jan17
Apr Jul Oct
mn b/d
Jet-kero apparent demand
0.3
0.4
0.5
0.6
0.7
0.8
0.9
Jan16
Apr Jul Oct Jan17
Apr Jul Oct
mn b/d
petroleum apparent demand
9
10
11
12
13
14
Jan16
Apr Jul Oct Jan17
Apr Jul Oct
mn b/d
diesel apparent demand
3.0
3.2
3.4
3.6
3.8
Jan16
Apr Jul Oct Jan17
Apr Jul Oct
mn b/d
gasoline apparent demand
2.0
2.2
2.4
2.6
2.8
3.0
3.2
Jan16
Apr Jul Oct Jan17
Apr Jul Oct
mn b/d
Fuel oil apparent demand
0.3
0.4
0.5
0.6
0.7
Jan16
Apr Jul Oct Jan17
Apr Jul Oct
mn b/d
Xiamen
Quanzhou
V I E T N A M
L A O S
T H A I L A N D
M YA N M A R( B U R M A )
N E PA L
K Y R G Y Z S TA N
M O N G O L I A
R U S S I A
K A Z A K H S TA N
C H I N A
TA I W A N
Yang
tze ri
ver
Mekong river
NORTHKOREA
SOUTHKOREA
Ningbo
Xiamen
Chengdu
Xianyang
Jingbian
Yalujiang
JiujiangYueyangJingmen
Weigang
Shijiazhuang
Maling
Wuhan
ShenzhenHuizhou
ShanghaiNanjing
Cangzhou
RenqiuTianjin
Beijing Dalian
Fushun
Tieling
Dandong
Harbin
Lanzhou
Guangzhou
Qingdao
Luoyang
Jinzhou
Quanzhou
Hainan
Liaoyang
Wanzhou
Ramree
— Argus
Ruili
Baoshan
Mohe
Hui’anbao
Suzhou
Taiyuan
Yellow river
Chenzhou
Rizhao
JilinChangchun
Dali
Pengzhou
Khabarovsk
Kozmino
Pearl river
QinzhouMaoming
KunmingChuxiong
Beihai
Crude pipeline
Crude pipeline under construction
Planned crude pipeline
ESPO stage 2 pipeline
Planned Burma Road pipeline
Completed Burma Road pipeline
Oil port
Key refineries
Planned refineries
Rail terminal
DongmingPuyang
LinyiHejian
Qinhuangdao
AnqingMa’anshan
Zhanjiang
JiangjinChongqing
Tazhong
LunnanKorla
UrumqiDushanzi
HoushaoshanKaramay
Alashankou
Shanshan
China crude infrastructure
Argus China Petroleum January 2018
Argus China Petroleum is published by Argus Media group
illuminating the markets
Registered officeLacon House, 84 Theobald’s Road, London, WC1X 8NLTel: +44 20 7780 4200 email: [email protected]
ISSN: 1753-6286
Copyright noticeCopyright © 2018 Argus Media group All rights reservedAll intellectual property rights in this publication and the information published herein are the exclusive prop-erty of Argus and/or its licensors (including exchanges) and may only be used under licence from Argus. Without limiting the foregoing, by accessing this publication you agree that you will not copy or reproduce or use any part of its contents (including, but not limited to, single prices or any other individual items of data) in any form or for any purpose whatsoever except under valid licence from Argus. Further, your access to and use of data from exchanges may be subject to additional fees and/or execution of a separate agreement, whether directly with the exchanges or through Argus.
Trademark noticeARGUS, the ARGUS logo, ARGUS MEDIA, ARGUS CHINA PETRoLEUM , other ARGUS publication titles and ARGUS index names are trademarks of Argus Media Limited. Visit www.argusmedia.com/Ft/trademarks for more information.
DisclaimerThe data and other information published herein (the “Data”) are provided on an “as is” basis. Argus and its licensors (including exchanges) make no warranties, express or implied, as to the accuracy, adequacy, timeliness, or completeness of the Data or fitness for any particular purpose. Argus and its licensors (including exchanges) shall not be liable for any loss, claims or dam-age arising from any party’s reliance on the Data and disclaim any and all liability related to or arising out of use of the Data to the full extent permissible by law.
PublisherAdrian Binks
Chief operating officerMatthew Burkley
Global compliance officerJeffrey Amos
Commercial managerJo Loudiadis
Managing editorJim Nicholson
EditorTom ReedTel: +44 20 7780 [email protected]
Customer support and sales:Technical [email protected] other [email protected]
London, UKTel: +44 20 7780 4200
Astana, KazakhstanTel: +7 7172 72 92 94
Beijing, China Tel: +86 10 8535 7688
Dubai Tel: +971 4434 5112
Moscow, Russia Tel: +7 495 933 7571
Rio de Janeiro, BrazilTel: +55 21 2548 0817
Singapore Tel: +65 6496 9966
Tokyo, Japan Tel: +81 3 3561 1805
Argus Media Inc, Houston, USTel: +1 713 968 0000
Argus Media Inc, New York, USTel: +1 646 376 6130
Argus Ethanol China 201827-28 March | Beijing, China
www.argusmedia.com/ethanol-China
Join us for two days of intensive market discussions and networking in China.
Bioenergy
EventsConsulting
Market Reporting
Argus Biodiesel China 2018Economic implications of UCO’s rapid progress28-29 March | Beijing, China
illuminating the markets
Market ReportingConsulting
Events
Visit www.argusmedia.com/Biodiesel -China to register
Bioenergy
28 March Exhibition and networking cocktail
▸ ▸ 29 MarchConference day