Embed Size (px)
Citation preview
Please refer to page 11 for important disclosures and analyst certification, or on our website
www.macquarie.com/research/disclosures.
AUSTRALIA
ALL AU Underperform
Price (at 06:10, 26 May 2015 GMT) A$7.87
Valuation A$ 7.23 - DCF (WACC 9.0%, beta 1.3, ERP 5.0%, RFR 3.8%, TGR 2.0%)
12-month target A$ 7.20
12-month TSR % -6.0
Volatility Index Low
GICS sector Consumer Services
Market cap A$m 4,988
30-day avg turnover A$m 27.4
Number shares on issue m 633.8
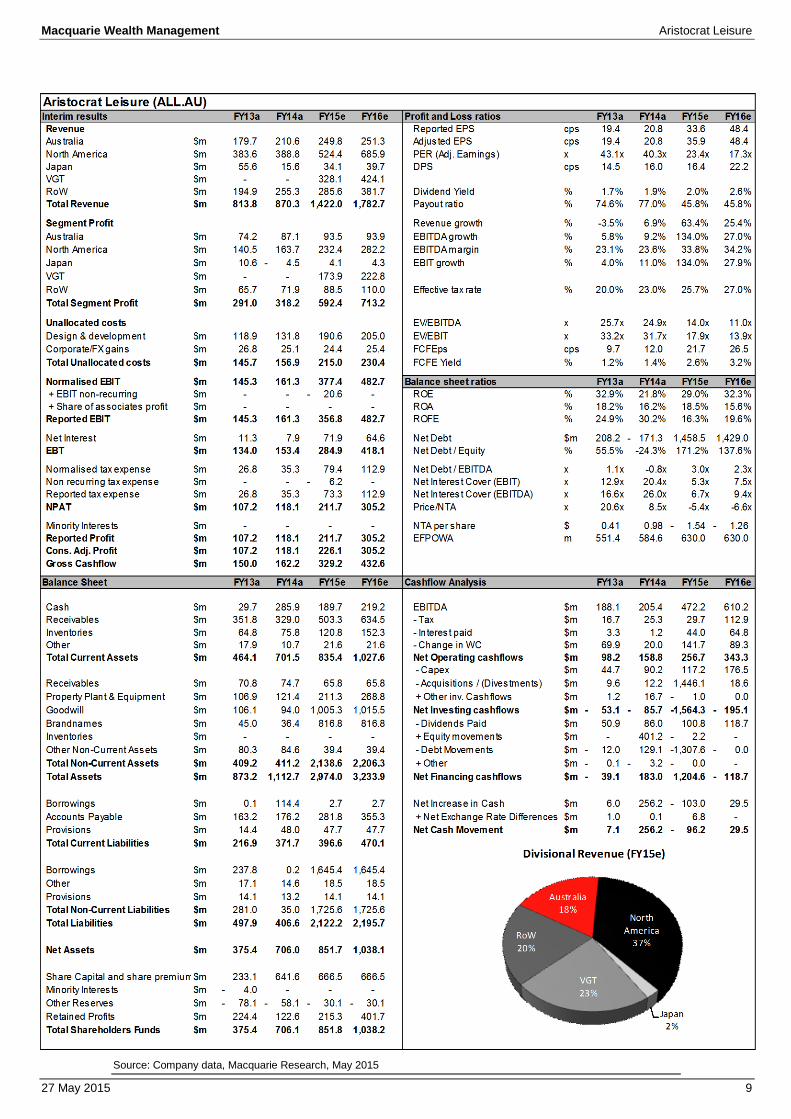
Investment fundamentals Year end 30 Sep 2014A 2015E 2016E 2017E
Revenue m 870.3 1,434.0 1,782.8 1,792.0 EBIT m 161.3 377.4 482.8 470.2 Reported profit m 118.1 211.6 305.1 292.8
Adjusted profit m 118.1 226.1 305.1 292.8 Gross cashflow m 162.1 320.8 432.5 418.9 CFPS ¢ 28.6 50.9 68.7 66.5 CFPS growth % 5.0 78.3 34.8 -3.1 PGCFPS x 27.5 15.5 11.5 11.8 PGCFPS rel x 2.95 1.53 1.29 1.43 EPS adj ¢ 20.8 35.9 48.4 46.5 EPS adj growth % 6.9 72.6 35.0 -4.0
PER adj x 37.9 21.9 16.3 16.9 PER rel x 2.33 1.29 1.04 1.19 Total DPS ¢ 16.0 16.4 22.2 21.3 Total div yield % 2.0 2.1 2.8 2.7 Franking % 0 0 0 0
ROA % 16.2 18.5 15.6 14.2 ROE % 21.8 29.0 32.3 26.3 EV/EBITDA x 31.3 13.6 10.5 10.8 Net debt/equity % -24.3 171.2 137.6 114.4 P/BV x 7.0 5.8 4.8 4.2
ALL AU vs ASX 100, & rec history
Note: Recommendation timeline - if not a continuous line, then there was no Macquarie coverage at the time or there was an embargo period.
Source: FactSet, Macquarie Research, May 2015
(all figures in AUD unless noted)
27 May 2015 Macquarie Securities (Australia) Limited
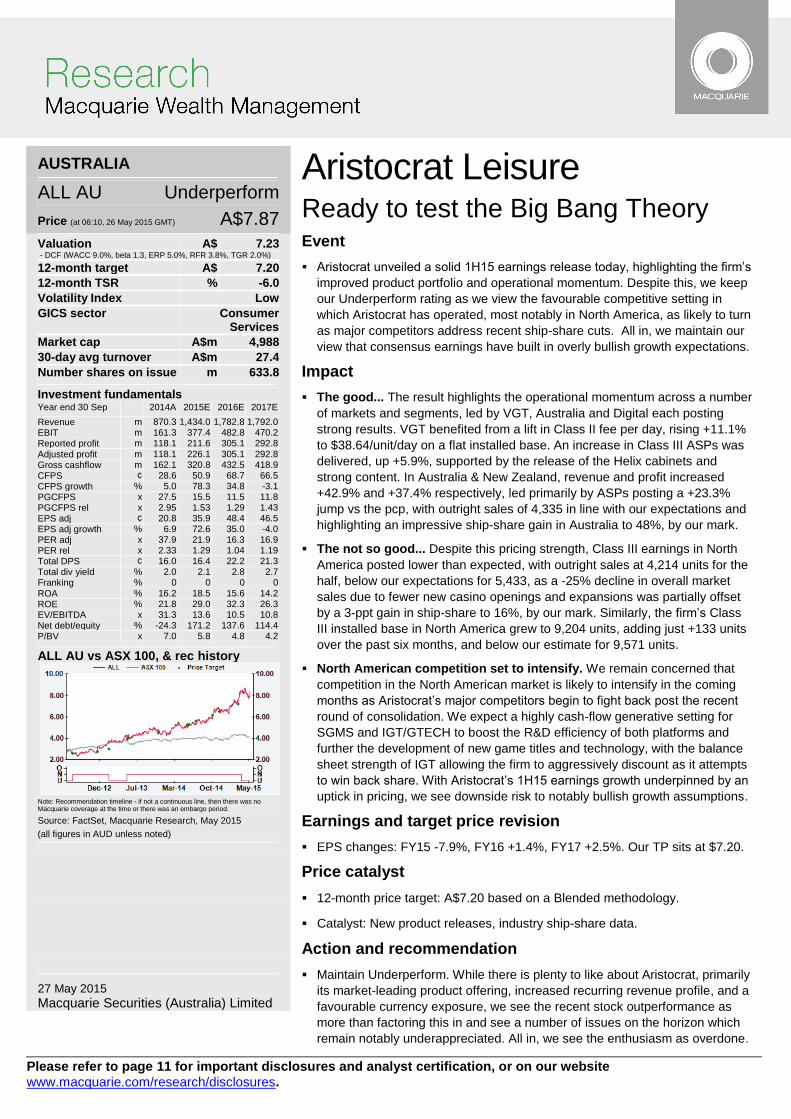
Aristocrat Leisure Ready to test the Big Bang Theory Event
Aristocrat unveiled a solid 1H15 earnings release today, highlighting the firm’s
improved product portfolio and operational momentum. Despite this, we keep
our Underperform rating as we view the favourable competitive setting in
which Aristocrat has operated, most notably in North America, as likely to turn
as major competitors address recent ship-share cuts. All in, we maintain our
view that consensus earnings have built in overly bullish growth expectations.
Impact
The good... The result highlights the operational momentum across a number
of markets and segments, led by VGT, Australia and Digital each posting
strong results. VGT benefited from a lift in Class II fee per day, rising +11.1%
to $38.64/unit/day on a flat installed base. An increase in Class III ASPs was
delivered, up +5.9%, supported by the release of the Helix cabinets and
strong content. In Australia & New Zealand, revenue and profit increased
+42.9% and +37.4% respectively, led primarily by ASPs posting a +23.3%
jump vs the pcp, with outright sales of 4,335 in line with our expectations and
highlighting an impressive ship-share gain in Australia to 48%, by our mark.
The not so good... Despite this pricing strength, Class III earnings in North
America posted lower than expected, with outright sales at 4,214 units for the
half, below our expectations for 5,433, as a -25% decline in overall market
sales due to fewer new casino openings and expansions was partially offset
by a 3-ppt gain in ship-share to 16%, by our mark. Similarly, the firm’s Class
III installed base in North America grew to 9,204 units, adding just +133 units
over the past six months, and below our estimate for 9,571 units.
North American competition set to intensify. We remain concerned that
competition in the North American market is likely to intensify in the coming
months as Aristocrat’s major competitors begin to fight back post the recent
round of consolidation. We expect a highly cash-flow generative setting for
SGMS and IGT/GTECH to boost the R&D efficiency of both platforms and
further the development of new game titles and technology, with the balance
sheet strength of IGT allowing the firm to aggressively discount as it attempts
to win back share. With Aristocrat’s 1H15 earnings growth underpinned by an
uptick in pricing, we see downside risk to notably bullish growth assumptions.
Earnings and target price revision
EPS changes: FY15 -7.9%, FY16 +1.4%, FY17 +2.5%. Our TP sits at $7.20.
Price catalyst
12-month price target: A$7.20 based on a Blended methodology.
Catalyst: New product releases, industry ship-share data.
Action and recommendation
Maintain Underperform. While there is plenty to like about Aristocrat, primarily
its market-leading product offering, increased recurring revenue profile, and a
favourable currency exposure, we see the recent stock outperformance as
more than factoring this in and see a number of issues on the horizon which
remain notably underappreciated. All in, we see the enthusiasm as overdone.
Macquarie Wealth Management Aristocrat Leisure
27 May 2015 2
Solid 1H15 earnings result driven by operational momentum
Aristocrat management outlined guidance for "2H15 to be broadly in line with the first half".
Annualizing the 1H15 result implies full-year sales and EBITDA of $1,370m and $486.8m,
respectively, versus consensus expectations of $1,389m and $467.9m prior to today's result.
With this in mind, we have lowered our FY15 earnings outlook. We have lowered our FY15 and
FY16 North American Class III earnings outlook, with the recent price hikes not enough to offset
our lower volume targets.
We have also applied the latest Macquarie FX outlook which has created a further earnings
headwind for Aristocrat. We now model a FY15 AUD/USD average rate of $0.751, vs our prior
expectations of $0.70.
Partially offsetting this weakness is continued strong momentum in Digital earnings, combined
with greater than expected VGT earnings, driven by an uptick in FPD.
Fig 1 ALL 1H15 result summary
A$ 1H15a % ch vs pcp
2H15e % ch vs pcp
FY15e % ch vs pcp
Segment revenue Australia A$m 125.8 49.4% 124.0 -1.9% 249.8 18.6% North America A$m 252.4 32.7% 271.9 37.0% 524.4 34.9% Japan A$m 16.8 22.2% 17.3 836.9% 34.1 118.7% VGT A$m 158.0 nmf 170.1 nmf 328.1 nmf RoW A$m 146.2 17.6% 139.4 6.4% 285.6 11.9% Total revenue A$m 699.2 69.5% 722.8 57.9% 1422.0 63.4% Revenue profit (ex-Japan) 682.4 71.1% 705.5 54.7% 1387.9 62.4%
Segment profit Australia A$m 45.5 41.3% 48.0 -12.5% 93.5 7.4% North America A$m 115.8 45.2% 116.6 38.9% 232.4 42.0% Japan A$m 2.0 101.1% 2.1 -138.5% 4.1 -190.2% VGT A$m 82.6 nmf 91.3 nmf 173.9 nmf RoW A$m 46.7 25.3% 41.8 20.6% 88.5 23.1% Total segment profit A$m 292.6 94.8% 299.8 78.5% 592.4 86.2% Segment profit (ex-Japan) 290.6 94.7% 297.7 71.6% 588.3 82.3%
Unallocated costs Design & development A$m 92.1 47.1% 98.5 42.3% 190.6 44.6% D&D as % of revenue 13.2% 13.6% 13.4%
Corporate A$m 12.1 80.6% 12.3 8.2% 24.4 35.0% Other A$m -4.3 -189.6% 4.3 95.5% 0.0 -100.0% Total unallocated costs A$m 99.9 34.8% 115.1 39.0% 215.0 37.0%
EBIT A$m 192.7 153.2% 185.2 117.3% 377.4 134.0%
Net Interest A$m 41.7 858.7% 30.2 750.3% 71.9 810.0% Tax A$m 40.4 181.6% 39.0 86.3% 79.4 125.0% Minority interests A$m 0.0 nmf 0.0 nmf 0.0 nmf
Adjusted NPAT A$m 110.1 92.6% 115.5 90.4% 226.1 91.4% Adjusted EPS cps 17.5 67.9% 18.4 77.3% 35.9 72.6%
Dividends cps 8.0 0.0% 8.4 5.3% 16.4 2.7%
Source: Company data, Macquarie Research, May 2015
Fig 2 Segment profit margins (% of revenue)
1H14a 1H15a chg vs the pcp
Australia & New Zealand 37.0% 35.6% -1.4% Americas 37.7% 46.6% +8.9% International Class III 46.2% 39.5% -6.7% Digital 33.7% 30.7% -3.0% Overall segment profit margin 38.7% 42.5% +3.8%
Group D&D Expense 14.2% 12.3% -1.9% EBITA 21.9% 29.1% +7.2% NPATA 16.7% 16.1% -0.6%
Source: Company data, Macquarie Research, May 2015
Macquarie Wealth Management Aristocrat Leisure
27 May 2015 3
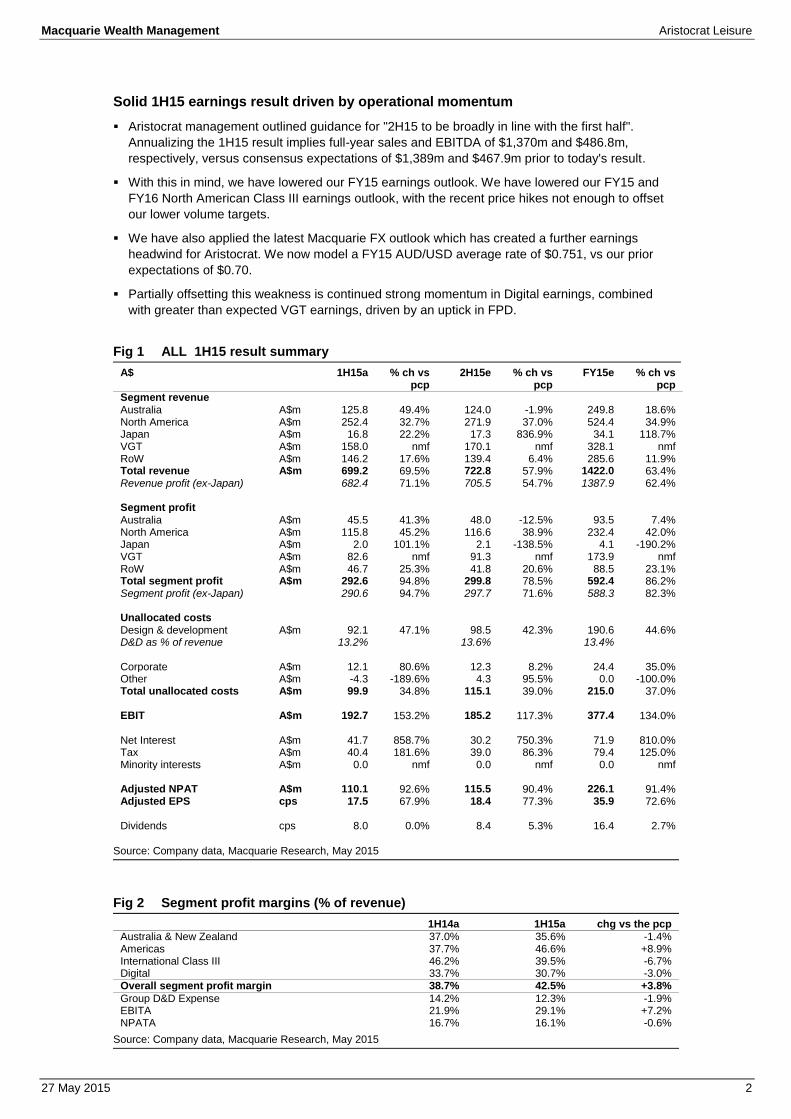
Fig 3 North American gaming-ops and VGT the major drivers of 1H15 earnings growth
Source: Company data, Macquarie Research, May 2015
North America Class III pricing up, volume down
Aristocrat continues to pick up share in North America, benefitting from a combination of market
leading games and a period of consolidation among Aristocrat’s major competitors. As such,
Aristocrat has enjoyed somewhat of a ‘free-kick’ in the North American market during the past six
months, as competitors remain more focused on boosting synergies via lower R&D, marketing,
operational expenses – a setting which has paved the way for Aristocrat to pick up share while
also experiencing a healthy price increase.
Aristocrat performance during this period has been strong, pumping out industry leading titles
such as The Walking Dead, which was named casino product of the year in 2014 at the Global
Gaming Awards. In addition, pending titles such as Game of Thrones, Sons of Anarchy, Ted, and
the Big Bang Theory are likely to drive further share gains in the market.
Offsetting this improved traction and compelling product portfolio, is a weak North American
outright sales market and tepid regional GGR is likely to deliver absolute unit sales and installed
base metrics short of notably bullish expectations. During the March-half, outright unit sales
across the industry declined approximately -25% due to fewer new casino openings and
expansions. Within this, Aristocrat’s platform sales declined -15.4%, implying a +3 percentage
point share gain to approximately 16%, by our mark.
Fig 4 North America segment summary
US$ 1H15a % ch vs
pcp 2H15e
% ch vs pcp
FY15e % ch vs
pcp
Revenue 204.9 7.7% 210.7 6.2% 415.7 6.9% Segment profit 94.0 29.8% 90.3 16.6% 184.3 23.0% Segment profit margin 45.9% 42.9% 44.3% KPIs Platform sales 4,214 -15.4% 4,641 4.5% 8,855 -6.0% Conversion sales 1,948 -28.7% 1,957 -31.0% 3,905 -29.9% Total unit sales 6,162 -20.1% 6,598 -9.3% 12,760 -14.9% Average US$ price/unit $16,462 5.9% $15,974 6.5% $16,206 6.0% Gaming ops installed base 9,204 12.1% 10,071 11.0% 10,071 11.0% Gaming ops US$ fee/day $ 50.15 15.9% $ 50.13 2.2% $ 50.14 9.0%
Source: Company data, Macquarie Research, May 2015
Australia revenue growth of +49%
Australian revenue and profit increased +49.4% and +41.3% respectively, led primarily by but
ASPs posting a +23.8% jump vs the pcp, with outright sales of 4,164 up +58.5%, albeit slightly
below our expectations, but highlighting an impressive ship-share gain to 48% by our mark. The
gains were realised across the key markets of NSW, Queensland, and Victoria, and sits on top of
wider market growth of approximately +12%, per management feedback. Segment margins
declined from 38.2% in 1H14 to 36.2% in 1H15, due to the weaker AUD (products sourced in
USD), one time launch costs, and lower conversion sales.
110.1
66.013.3
36.0
82.69.4
29.5
3.7
63.4
0
50
100
150
200
250
1H14a Aust Nth Am - ops VGT RoW D&D Corporate Int/Tax 1H15a
A$m
Macquarie Wealth Management Aristocrat Leisure
27 May 2015 4
Fig 5 Australia segment summary
A$
1H15a % ch vs
pcp 2H15e
% ch vs pcp
FY15e % ch vs
pcp
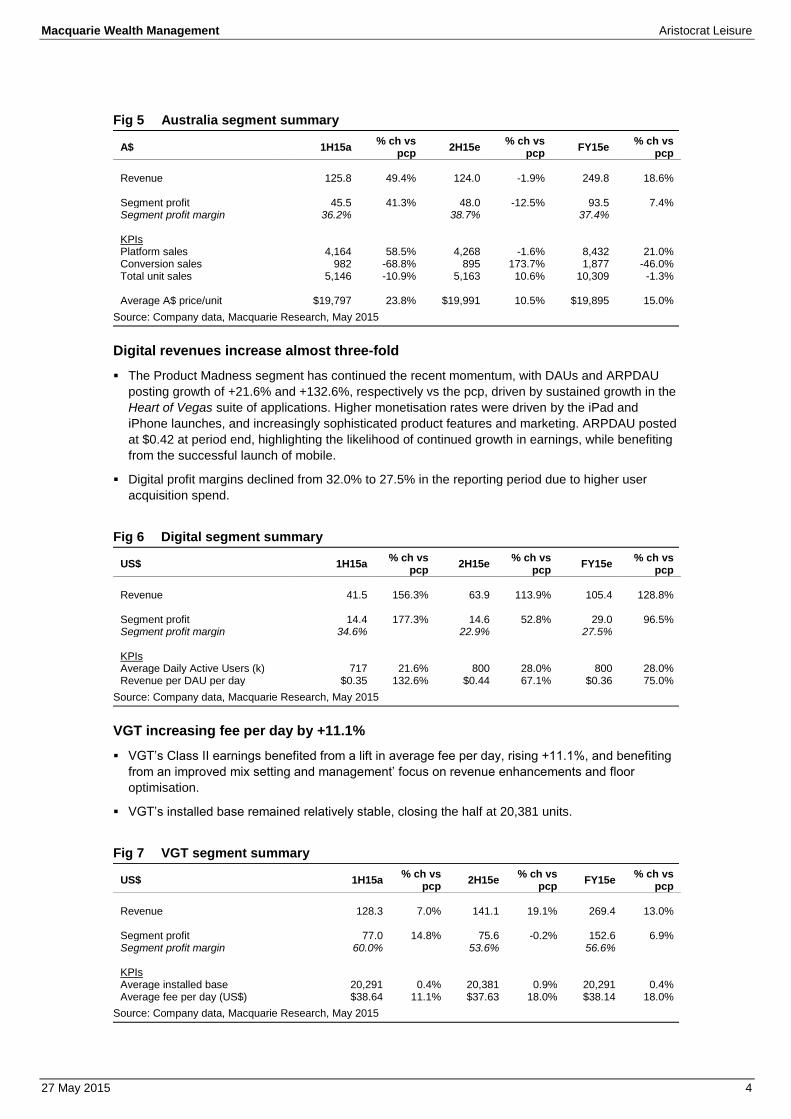
Revenue 125.8 49.4% 124.0 -1.9% 249.8 18.6% Segment profit 45.5 41.3% 48.0 -12.5% 93.5 7.4% Segment profit margin 36.2% 38.7% 37.4% KPIs Platform sales 4,164 58.5% 4,268 -1.6% 8,432 21.0% Conversion sales 982 -68.8% 895 173.7% 1,877 -46.0% Total unit sales 5,146 -10.9% 5,163 10.6% 10,309 -1.3% Average A$ price/unit $19,797 23.8% $19,991 10.5% $19,895 15.0%
Source: Company data, Macquarie Research, May 2015
Digital revenues increase almost three-fold
The Product Madness segment has continued the recent momentum, with DAUs and ARPDAU
posting growth of +21.6% and +132.6%, respectively vs the pcp, driven by sustained growth in the
Heart of Vegas suite of applications. Higher monetisation rates were driven by the iPad and
iPhone launches, and increasingly sophisticated product features and marketing. ARPDAU posted
at $0.42 at period end, highlighting the likelihood of continued growth in earnings, while benefiting
from the successful launch of mobile.
Digital profit margins declined from 32.0% to 27.5% in the reporting period due to higher user
acquisition spend.
Fig 6 Digital segment summary
US$ 1H15a % ch vs
pcp 2H15e
% ch vs pcp
FY15e % ch vs
pcp
Revenue 41.5 156.3% 63.9 113.9% 105.4 128.8% Segment profit 14.4 177.3% 14.6 52.8% 29.0 96.5% Segment profit margin 34.6% 22.9% 27.5% KPIs Average Daily Active Users (k) 717 21.6% 800 28.0% 800 28.0% Revenue per DAU per day $0.35 132.6% $0.44 67.1% $0.36 75.0%
Source: Company data, Macquarie Research, May 2015
VGT increasing fee per day by +11.1%
VGT’s Class II earnings benefited from a lift in average fee per day, rising +11.1%, and benefiting
from an improved mix setting and management’ focus on revenue enhancements and floor
optimisation.
VGT’s installed base remained relatively stable, closing the half at 20,381 units.
Fig 7 VGT segment summary
US$ 1H15a % ch vs
pcp 2H15e
% ch vs pcp
FY15e % ch vs
pcp
Revenue 128.3 7.0% 141.1 19.1% 269.4 13.0% Segment profit 77.0 14.8% 75.6 -0.2% 152.6 6.9% Segment profit margin 60.0% 53.6% 56.6% KPIs Average installed base 20,291 0.4% 20,381 0.9% 20,291 0.4% Average fee per day (US$) $38.64 11.1% $37.63 18.0% $38.14 18.0%
Source: Company data, Macquarie Research, May 2015
Macquarie Wealth Management Aristocrat Leisure
27 May 2015 5
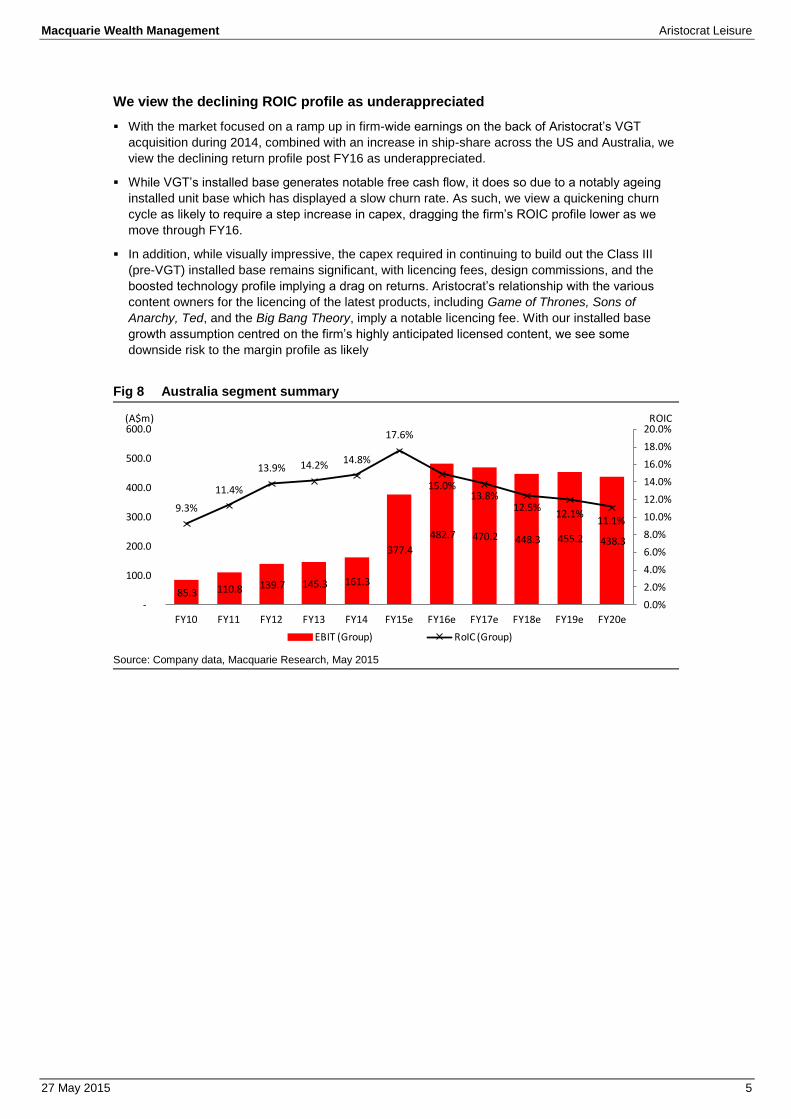
We view the declining ROIC profile as underappreciated
With the market focused on a ramp up in firm-wide earnings on the back of Aristocrat’s VGT
acquisition during 2014, combined with an increase in ship-share across the US and Australia, we
view the declining return profile post FY16 as underappreciated.
While VGT’s installed base generates notable free cash flow, it does so due to a notably ageing
installed unit base which has displayed a slow churn rate. As such, we view a quickening churn
cycle as likely to require a step increase in capex, dragging the firm’s ROIC profile lower as we
move through FY16.
In addition, while visually impressive, the capex required in continuing to build out the Class III
(pre-VGT) installed base remains significant, with licencing fees, design commissions, and the
boosted technology profile implying a drag on returns. Aristocrat’s relationship with the various
content owners for the licencing of the latest products, including Game of Thrones, Sons of
Anarchy, Ted, and the Big Bang Theory, imply a notable licencing fee. With our installed base
growth assumption centred on the firm’s highly anticipated licensed content, we see some
downside risk to the margin profile as likely
Fig 8 Australia segment summary
Source: Company data, Macquarie Research, May 2015
85.3 110.8 139.7 145.3 161.3
377.4
482.7 470.2 448.3 455.2 438.3
9.3%
11.4%
13.9% 14.2% 14.8%
17.6%
15.0%13.8%
12.5%12.1%
11.1%
0.0%
2.0%
4.0%
6.0%
8.0%
10.0%
12.0%
14.0%
16.0%
18.0%
20.0%
-
100.0
200.0
300.0
400.0
500.0
600.0
FY10 FY11 FY12 FY13 FY14 FY15e FY16e FY17e FY18e FY19e FY20e
EBIT (Group) RoIC (Group)
(A$m) ROIC
Macquarie Wealth Management Aristocrat Leisure
27 May 2015 6
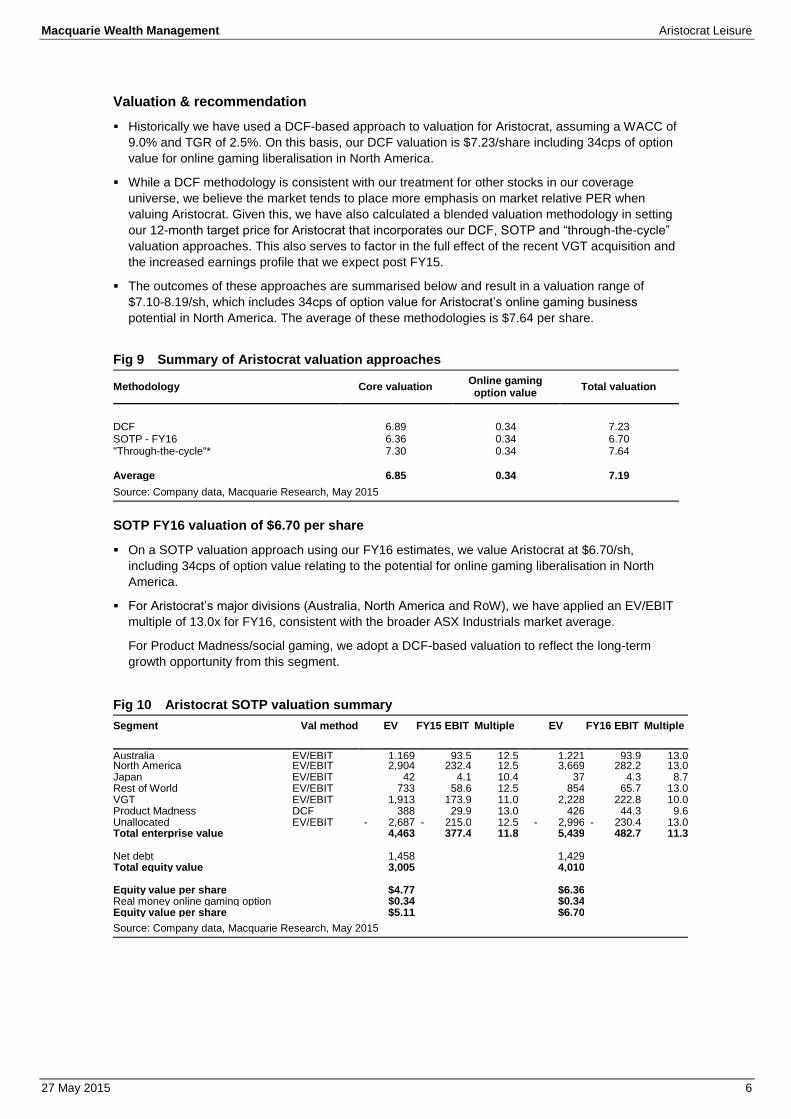
Valuation & recommendation
Historically we have used a DCF-based approach to valuation for Aristocrat, assuming a WACC of
9.0% and TGR of 2.5%. On this basis, our DCF valuation is $7.23/share including 34cps of option
value for online gaming liberalisation in North America.
While a DCF methodology is consistent with our treatment for other stocks in our coverage
universe, we believe the market tends to place more emphasis on market relative PER when
valuing Aristocrat. Given this, we have also calculated a blended valuation methodology in setting
our 12-month target price for Aristocrat that incorporates our DCF, SOTP and “through-the-cycle”
valuation approaches. This also serves to factor in the full effect of the recent VGT acquisition and
the increased earnings profile that we expect post FY15.
The outcomes of these approaches are summarised below and result in a valuation range of
$7.10-8.19/sh, which includes 34cps of option value for Aristocrat’s online gaming business
potential in North America. The average of these methodologies is $7.64 per share.
Fig 9 Summary of Aristocrat valuation approaches
Methodology Core valuation Online gaming option value
Total valuation
DCF 6.89 0.34 7.23 SOTP - FY16 6.36 0.34 6.70 "Through-the-cycle"* 7.30 0.34 7.64 Average 6.85 0.34 7.19
Source: Company data, Macquarie Research, May 2015
SOTP FY16 valuation of $6.70 per share
On a SOTP valuation approach using our FY16 estimates, we value Aristocrat at $6.70/sh,
including 34cps of option value relating to the potential for online gaming liberalisation in North
America.
For Aristocrat’s major divisions (Australia, North America and RoW), we have applied an EV/EBIT
multiple of 13.0x for FY16, consistent with the broader ASX Industrials market average.
For Product Madness/social gaming, we adopt a DCF-based valuation to reflect the long-term
growth opportunity from this segment.
Fig 10 Aristocrat SOTP valuation summary
Segment Val method EV FY15 EBIT Multiple EV FY16 EBIT Multiple
Australia EV/EBIT 1,169 93.5 12.5 1,221 93.9 13.0 North America EV/EBIT 2,904 232.4 12.5 3,669 282.2 13.0 Japan EV/EBIT 42 4.1 10.4 37 4.3 8.7 Rest of World EV/EBIT 733 58.6 12.5 854 65.7 13.0 VGT EV/EBIT 1,913 173.9 11.0 2,228 222.8 10.0 Product Madness DCF 388 29.9 13.0 426 44.3 9.6 Unallocated EV/EBIT - 2,687 - 215.0 12.5 - 2,996 - 230.4 13.0 Total enterprise value 4,463 377.4 11.8 5,439 482.7 11.3 Net debt 1,458 1,429 Total equity value 3,005 4,010 Equity value per share $4.77 $6.36 Real money online gaming option $0.34 $0.34 Equity value per share $5.11 $6.70
Source: Company data, Macquarie Research, May 2015
Macquarie Wealth Management Aristocrat Leisure
27 May 2015 7
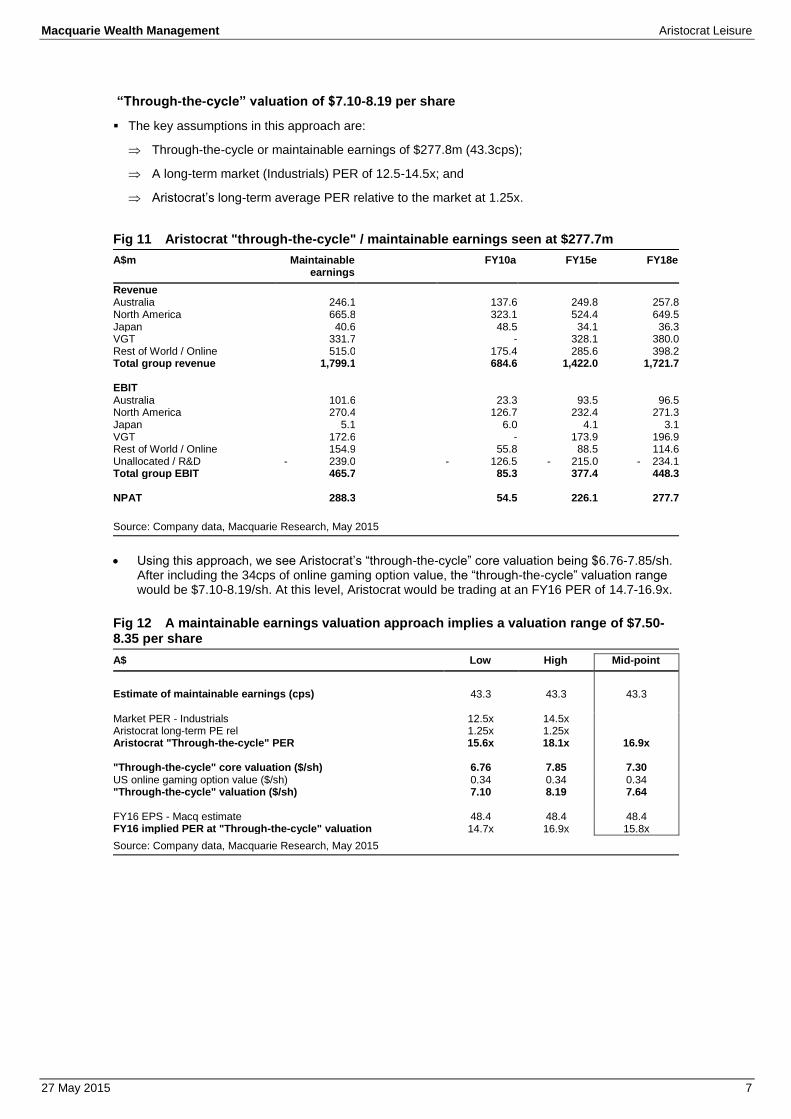
“Through-the-cycle” valuation of $7.10-8.19 per share
The key assumptions in this approach are:
Through-the-cycle or maintainable earnings of $277.8m (43.3cps);
A long-term market (Industrials) PER of 12.5-14.5x; and
Aristocrat’s long-term average PER relative to the market at 1.25x.
Fig 11 Aristocrat "through-the-cycle" / maintainable earnings seen at $277.7m
A$m Maintainable earnings
FY10a FY15e FY18e
Revenue Australia 246.1 137.6 249.8 257.8 North America 665.8 323.1 524.4 649.5 Japan 40.6 48.5 34.1 36.3 VGT 331.7 - 328.1 380.0 Rest of World / Online 515.0 175.4 285.6 398.2 Total group revenue 1,799.1 684.6 1,422.0 1,721.7 EBIT Australia 101.6 23.3 93.5 96.5 North America 270.4 126.7 232.4 271.3 Japan 5.1 6.0 4.1 3.1 VGT 172.6 - 173.9 196.9 Rest of World / Online 154.9 55.8 88.5 114.6 Unallocated / R&D - 239.0 - 126.5 - 215.0 - 234.1 Total group EBIT 465.7 85.3 377.4 448.3 NPAT 288.3 54.5 226.1 277.7
Source: Company data, Macquarie Research, May 2015
Using this approach, we see Aristocrat’s “through-the-cycle” core valuation being $6.76-7.85/sh. After including the 34cps of online gaming option value, the “through-the-cycle” valuation range would be $7.10-8.19/sh. At this level, Aristocrat would be trading at an FY16 PER of 14.7-16.9x.
Fig 12 A maintainable earnings valuation approach implies a valuation range of $7.50-8.35 per share
A$ Low High Mid-point
Estimate of maintainable earnings (cps) 43.3 43.3 43.3 Market PER - Industrials 12.5x 14.5x Aristocrat long-term PE rel 1.25x 1.25x Aristocrat "Through-the-cycle" PER 15.6x 18.1x 16.9x "Through-the-cycle" core valuation ($/sh) 6.76 7.85 7.30 US online gaming option value ($/sh) 0.34 0.34 0.34 "Through-the-cycle" valuation ($/sh) 7.10 8.19 7.64 FY16 EPS - Macq estimate 48.4 48.4 48.4 FY16 implied PER at "Through-the-cycle" valuation 14.7x 16.9x 15.8x
Source: Company data, Macquarie Research, May 2015
Macquarie Wealth Management Aristocrat Leisure
27 May 2015 8
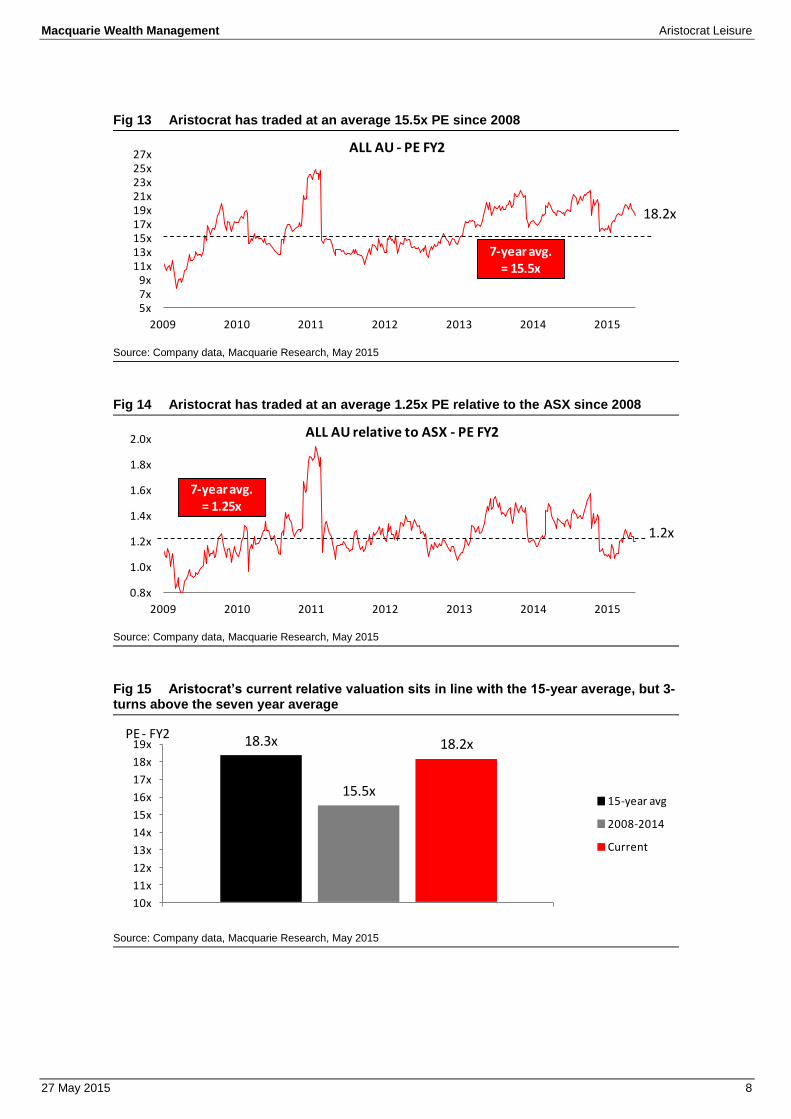
Fig 13 Aristocrat has traded at an average 15.5x PE since 2008
Source: Company data, Macquarie Research, May 2015
Fig 14 Aristocrat has traded at an average 1.25x PE relative to the ASX since 2008
Source: Company data, Macquarie Research, May 2015
Fig 15 Aristocrat’s current relative valuation sits in line with the 15-year average, but 3-turns above the seven year average
Source: Company data, Macquarie Research, May 2015
18.2x
5x7x9x
11x13x15x17x19x21x23x25x27x
2009 2010 2011 2012 2013 2014 2015
ALL AU - PE FY2
7-year avg. = 15.5x
1.2x
0.8x
1.0x
1.2x
1.4x
1.6x
1.8x
2.0x
2009 2010 2011 2012 2013 2014 2015
ALL AU relative to ASX - PE FY2
7-year avg. = 1.25x
18.3x
15.5x
18.2x
10x
11x
12x
13x
14x
15x
16x
17x
18x
19x
ALL
15-year avg
2008-2014
Current
PE - FY2
Macquarie Wealth Management Aristocrat Leisure
27 May 2015 9
Source: Company data, Macquarie Research, May 2015
Macquarie Wealth Management Aristocrat Leisure
27 May 2015 10
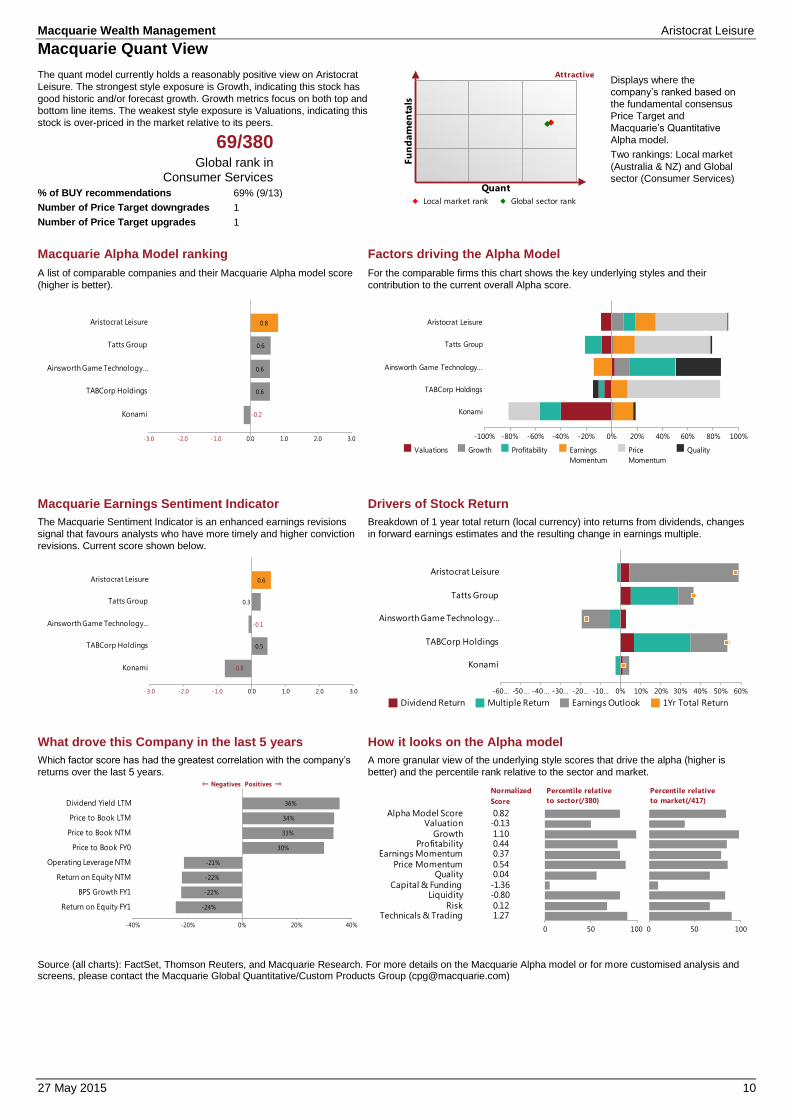
Macquarie Quant View
The quant model currently holds a reasonably positive view on Aristocrat
Leisure. The strongest style exposure is Growth, indicating this stock has
good historic and/or forecast growth. Growth metrics focus on both top and
bottom line items. The weakest style exposure is Valuations, indicating this
stock is over-priced in the market relative to its peers.
Displays where the
company’s ranked based on
the fundamental consensus
Price Target and
Macquarie’s Quantitative
Alpha model.
Two rankings: Local market
(Australia & NZ) and Global
sector (Consumer Services)
69/380 Global rank in
Consumer Services
% of BUY recommendations 69% (9/13)
Number of Price Target downgrades 1
Number of Price Target upgrades 1
Macquarie Alpha Model ranking Factors driving the Alpha Model
A list of comparable companies and their Macquarie Alpha model score
(higher is better).
For the comparable firms this chart shows the key underlying styles and their
contribution to the current overall Alpha score.
Macquarie Earnings Sentiment Indicator Drivers of Stock Return
The Macquarie Sentiment Indicator is an enhanced earnings revisions
signal that favours analysts who have more timely and higher conviction
revisions. Current score shown below.
Breakdown of 1 year total return (local currency) into returns from dividends, changes
in forward earnings estimates and the resulting change in earnings multiple.
What drove this Company in the last 5 years How it looks on the Alpha model
Which factor score has had the greatest correlation with the company’s
returns over the last 5 years.
A more granular view of the underlying style scores that drive the alpha (higher is
better) and the percentile rank relative to the sector and market.
Source (all charts): FactSet, Thomson Reuters, and Macquarie Research. For more details on the Macquarie Alpha model or for more customised analysis and screens, please contact the Macquarie Global Quantitative/Custom Products Group ([email protected])
Fu
nd
am
en
tals
Quant
Local market rank Global sector rank
Attractive
-0.2
0.6
0.6
0.6
0.8
-3.0 -2.0 -1.0 0.0 1.0 2.0 3.0
Konami
TABCorp Holdings
Ainsworth Game Technology…
Tatts Group
Aristocrat Leisure
-100% -80% -60% -40% -20% 0% 20% 40% 60% 80% 100%
Konami
TABCorp Holdings
Ainsworth Game Technology…
Tatts Group
Aristocrat Leisure
Valuations Growth Profitability Earnings
Momentum
Price
Momentum
Quality
-0.8
0.5
-0.1
0.3
0.6
-3.0 -2.0 -1.0 0.0 1.0 2.0 3.0
Konami
TABCorp Holdings
Ainsworth Game Technology…
Tatts Group
Aristocrat Leisure
-60… -50… -40… -30… -20… -10… 0% 10% 20% 30% 40% 50% 60%
Konami
TABCorp Holdings
Ainsworth Game Technology…
Tatts Group
Aristocrat Leisure
Dividend Return Multiple Return Earnings Outlook 1Yr Total Return
-24%
-22%
-22%
-21%
30%
33%
34%
36%
-40% -20% 0% 20% 40%
⇐ Negatives Positives ⇒
Return on Equity FY1
BPS Growth FY1
Return on Equity NTM
Operating Leverage NTM
Price to Book FY0
Price to Book NTM
Price to Book LTM
Dividend Yield LTM
0 1
Technicals & TradingRisk
LiquidityCapital & Funding
QualityPrice Momentum
Earnings MomentumProfitability
Growth
ValuationAlpha Model Score
1.27 0.12
-0.80-1.36
0.04 0.54
0.37 0.44 1.10
-0.13 0.82
0 1
Normalized
Score
0 50 100
Percentile relative
to sector(/380)
0 50 100
Percentile relative
to market(/417)
Macquarie Wealth Management Aristocrat Leisure
27 May 2015 11
Important disclosures:
Recommendation definitions
Macquarie - Australia/New Zealand Outperform – return >3% in excess of benchmark return Neutral – return within 3% of benchmark return Underperform – return >3% below benchmark return Benchmark return is determined by long term nominal GDP growth plus 12 month forward market dividend yield
Macquarie – Asia/Europe Outperform – expected return >+10% Neutral – expected return from -10% to +10% Underperform – expected return <-10%
Macquarie First South - South Africa Outperform – expected return >+10% Neutral – expected return from -10% to +10% Underperform – expected return <-10%
Macquarie - Canada Outperform – return >5% in excess of benchmark return Neutral – return within 5% of benchmark return Underperform – return >5% below benchmark return
Macquarie - USA Outperform (Buy) – return >5% in excess of Russell 3000 index return Neutral (Hold) – return within 5% of Russell 3000 index return Underperform (Sell)– return >5% below Russell 3000 index return
Volatility index definition*
This is calculated from the volatility of historical price movements. Very high–highest risk – Stock should be expected to move up or down 60–100% in a year – investors should be aware this stock is highly speculative. High – stock should be expected to move up or down at least 40–60% in a year – investors should be aware this stock could be speculative. Medium – stock should be expected to move up or down at least 30–40% in a year. Low–medium – stock should be expected to move up or down at least 25–30% in a year. Low – stock should be expected to move up or down at least 15–25% in a year. * Applicable to Asia/Australian/NZ/Canada stocks only
Recommendations – 12 months Note: Quant recommendations may differ from Fundamental Analyst recommendations
Financial definitions
All "Adjusted" data items have had the following adjustments made: Added back: goodwill amortisation, provision for catastrophe reserves, IFRS derivatives & hedging, IFRS impairments & IFRS interest expense Excluded: non recurring items, asset revals, property revals, appraisal value uplift, preference dividends & minority interests EPS = adjusted net profit / efpowa* ROA = adjusted ebit / average total assets ROA Banks/Insurance = adjusted net profit /average total assets ROE = adjusted net profit / average shareholders funds Gross cashflow = adjusted net profit + depreciation *equivalent fully paid ordinary weighted average number of shares All Reported numbers for Australian/NZ listed stocks are modelled under IFRS (International Financial Reporting Standards).
Recommendation proportions – For quarter ending 31 March 2015
AU/NZ Asia RSA USA CA EUR
Outperform 48.99% 59.51% 49.30% 43.79% 59.59% 52.20% (for US coverage by MCUSA, 7.42% of stocks followed are investment banking clients)
Neutral 34.12% 26.62% 35.21% 50.29% 34.93% 31.32% (for US coverage by MCUSA, 5.68% of stocks followed are investment banking clients)
Underperform 16.89% 13.87% 15.49% 5.93% 5.48% 16.48% (for US coverage by MCUSA, 0.87% of stocks followed are investment banking clients)
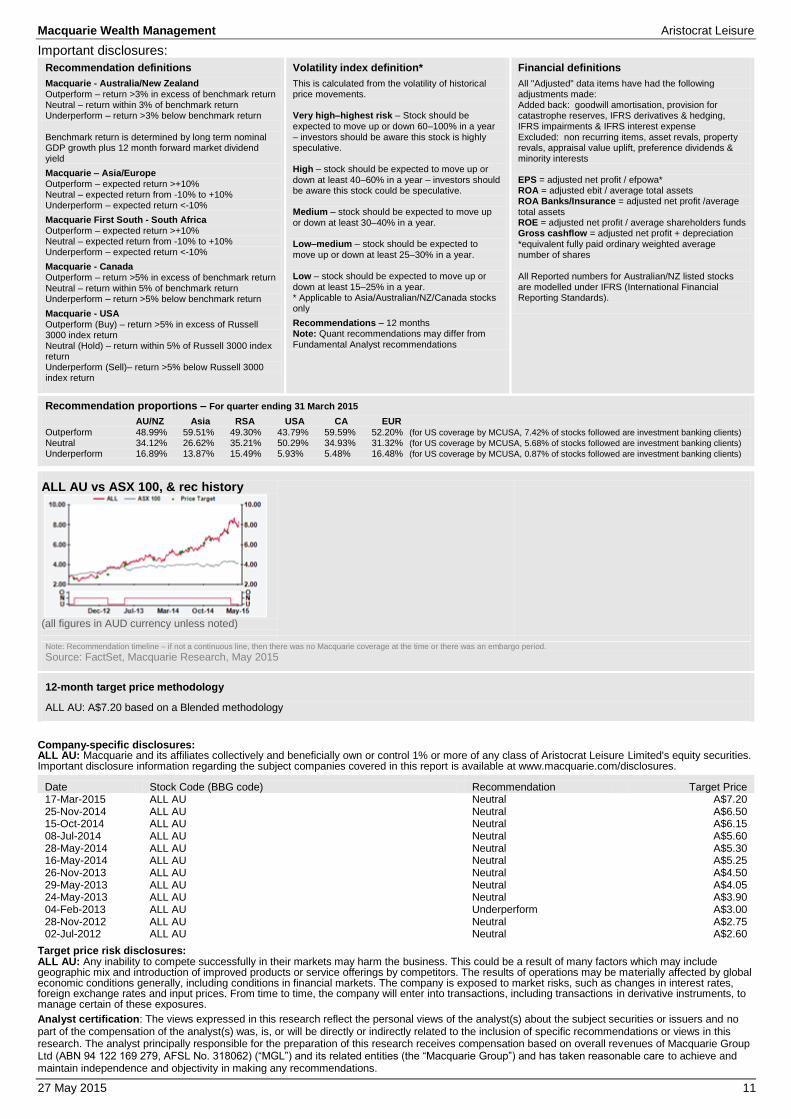
ALL AU vs ASX 100, & rec history
(all figures in AUD currency unless noted)
Note: Recommendation timeline – if not a continuous line, then there was no Macquarie coverage at the time or there was an embargo period.
Source: FactSet, Macquarie Research, May 2015
12-month target price methodology
ALL AU: A$7.20 based on a Blended methodology
Company-specific disclosures: ALL AU: Macquarie and its affiliates collectively and beneficially own or control 1% or more of any class of Aristocrat Leisure Limited's equity securities. Important disclosure information regarding the subject companies covered in this report is available at www.macquarie.com/disclosures.
Date Stock Code (BBG code) Recommendation Target Price 17-Mar-2015 ALL AU Neutral A$7.20 25-Nov-2014 ALL AU Neutral A$6.50 15-Oct-2014 ALL AU Neutral A$6.15 08-Jul-2014 ALL AU Neutral A$5.60 28-May-2014 ALL AU Neutral A$5.30 16-May-2014 ALL AU Neutral A$5.25 26-Nov-2013 ALL AU Neutral A$4.50 29-May-2013 ALL AU Neutral A$4.05 24-May-2013 ALL AU Neutral A$3.90 04-Feb-2013 ALL AU Underperform A$3.00 28-Nov-2012 ALL AU Neutral A$2.75 02-Jul-2012 ALL AU Neutral A$2.60
Target price risk disclosures: ALL AU: Any inability to compete successfully in their markets may harm the business. This could be a result of many factors which may include geographic mix and introduction of improved products or service offerings by competitors. The results of operations may be materially affected by global economic conditions generally, including conditions in financial markets. The company is exposed to market risks, such as changes in interest rates, foreign exchange rates and input prices. From time to time, the company will enter into transactions, including transactions in derivative instruments, to manage certain of these exposures.
Analyst certification: The views expressed in this research reflect the personal views of the analyst(s) about the subject securities or issuers and no part of the compensation of the analyst(s) was, is, or will be directly or indirectly related to the inclusion of specific recommendations or views in this research. The analyst principally responsible for the preparation of this research receives compensation based on overall revenues of Macquarie Group Ltd (ABN 94 122 169 279, AFSL No. 318062) (“MGL”) and its related entities (the “Macquarie Group”) and has taken reasonable care to achieve and maintain independence and objectivity in making any recommendations.
Macquarie Wealth Management Aristocrat Leisure
27 May 2015 12
General disclosure: This research has been issued by Macquarie Securities (Australia) Limited (ABN 58 002 832 126, AFSL No. 238947) a Participant of the Australian Securities Exchange (ASX) and Chi-X Australia Pty Limited. This research is distributed in Australia by Macquarie Equities Limited (ABN 41 002 574 923, AFSL No. 237504) ("MEL"), a Participant of the ASX, and in New Zealand by Macquarie Equities New Zealand Limited (“MENZ”) an NZX Firm. Macquarie Private Wealth’s services in New Zealand are provided by MENZ. Macquarie Bank Limited (ABN 46 008 583 542, AFSL No. 237502) (“MBL”) is a company incorporated in Australia and authorised under the Banking Act 1959 (Australia) to conduct banking business in Australia. None of MBL, MGL or MENZ is registered as a bank in New Zealand by the Reserve Bank of New Zealand under the Reserve Bank of New Zealand Act 1989. Any MGL subsidiary noted in this research, apart from MBL, is not an authorised deposit-taking institution for the purposes of the Banking Act 1959 (Australia) and that subsidiary’s obligations do not represent deposits or other liabilities of MBL. MBL does not guarantee or otherwise provide assurance in respect of the obligations of that subsidiary, unless noted otherwise. This research is general advice and does not take account of your objectives, financial situation or needs. Before acting on this general advice, you should consider the appropriateness of the advice having regard to your situation. We recommend you obtain financial, legal and taxation advice before making any financial investment decision. This research has been prepared for the use of the clients of the Macquarie Group and must not be copied, either in whole or in part, or distributed to any other person. If you are not the intended recipient, you must not use or disclose this research in any way. If you received it in error, please tell us immediately by return e-mail and delete the document. We do not guarantee the integrity of any e-mails or attached files and are not responsible for any changes made to them by any other person. Nothing in this research shall be construed as a solicitation to buy or sell any security or product, or to engage in or refrain from engaging in any transaction. This research is based on information obtained from sources believed to be reliable, but the Macquarie Group does not make any representation or warranty that it is accurate, complete or up to date. We accept no obligation to correct or update the information or opinions in it. Opinions expressed are subject to change without notice. The Macquarie Group accepts no liability whatsoever for any direct, indirect, consequential or other loss arising from any use of this research and/or further communication in relation to this research. The Macquarie Group produces a variety of research products, recommendations contained in one type of research product may differ from recommendations contained in other types of research. The Macquarie Group has established and implemented a conflicts policy at group level, which may be revised and updated from time to time, pursuant to regulatory requirements; which sets out how we must seek to identify and manage all material conflicts of interest. The Macquarie Group, its officers and employees may have conflicting roles in the financial products referred to in this research and, as such, may effect transactions which are not consistent with the recommendations (if any) in this research. The Macquarie Group may receive fees, brokerage or commissions for acting in those capacities and the reader should assume that this is the case. The Macquarie Group‘s employees or officers may provide oral or written opinions to its clients which are contrary to the opinions expressed in this research. Important disclosure information regarding the subject companies covered in this report is available at www.macquarie.com/disclosures.