Embed Size (px)
Citation preview
ARKEMA
Nomura Global Chemical Industry Leaders Conference
Venice – 21st March, 2013
Thierry LemonnierCFO
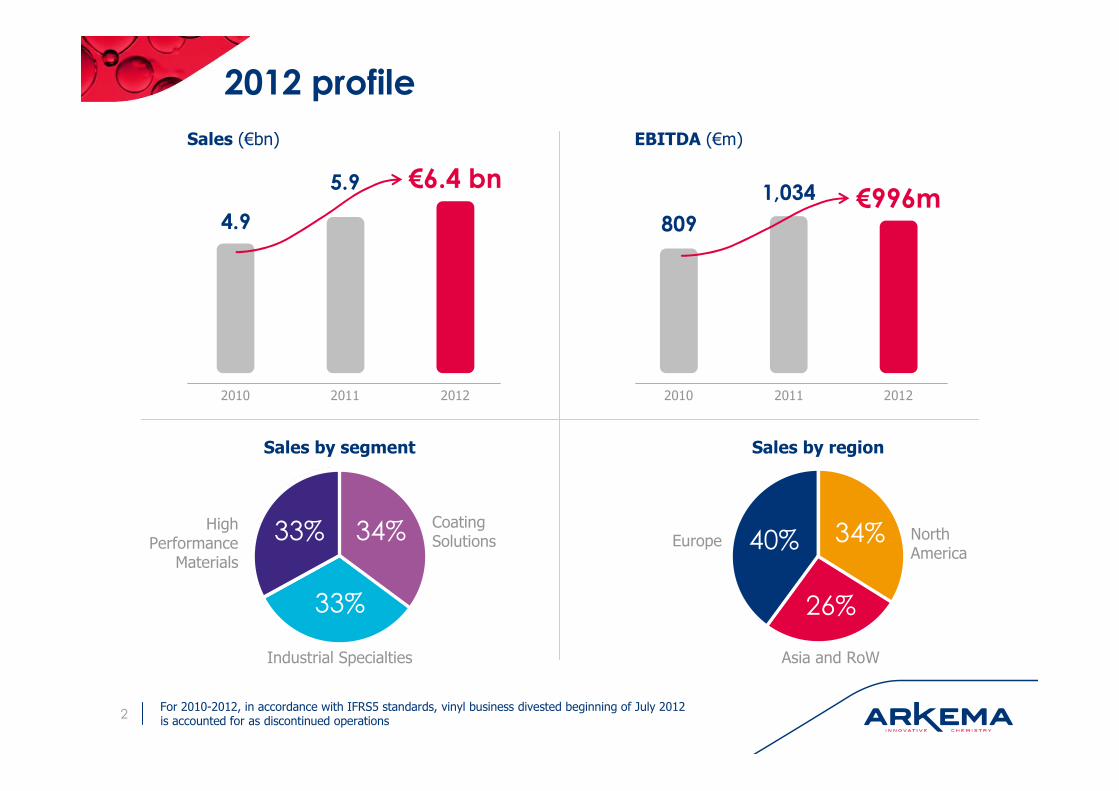
2012 profile
2
5.9 €6.4 bn
2011 2012
4.9
2010
Sales (€bn)
1,034 €996m
2011 2012
809
2010
EBITDA (€m)
33% 34% Coating Solutions
High Performance
Materials
Sales by segment
Industrial Specialties
33%
40% 34%
Sales by region
26%
Europe
Asia and RoW
North America
For 2010-2012, in accordance with IFRS5 standards, vinyl business divested beginning of July 2012 is accounted for as discontinued operations

284
Performance by new reporting segment
3
Sales (€m)
EBITDA margin (%)
Industrial SpecialtiesHigh Performance Materials
17.2
Coating Solutions
1,814
20112010 2012
1,216
2,1752,114
20112010 2012
1,9552,096
1,952
20112010 2012
1,680
2,101
279
20112010 2012
213
20.9
20112010 2012
355399
337
20112010 2012
257
361441
19.018.2 15.7 12.817.517.315.3
EBITDA (€m)
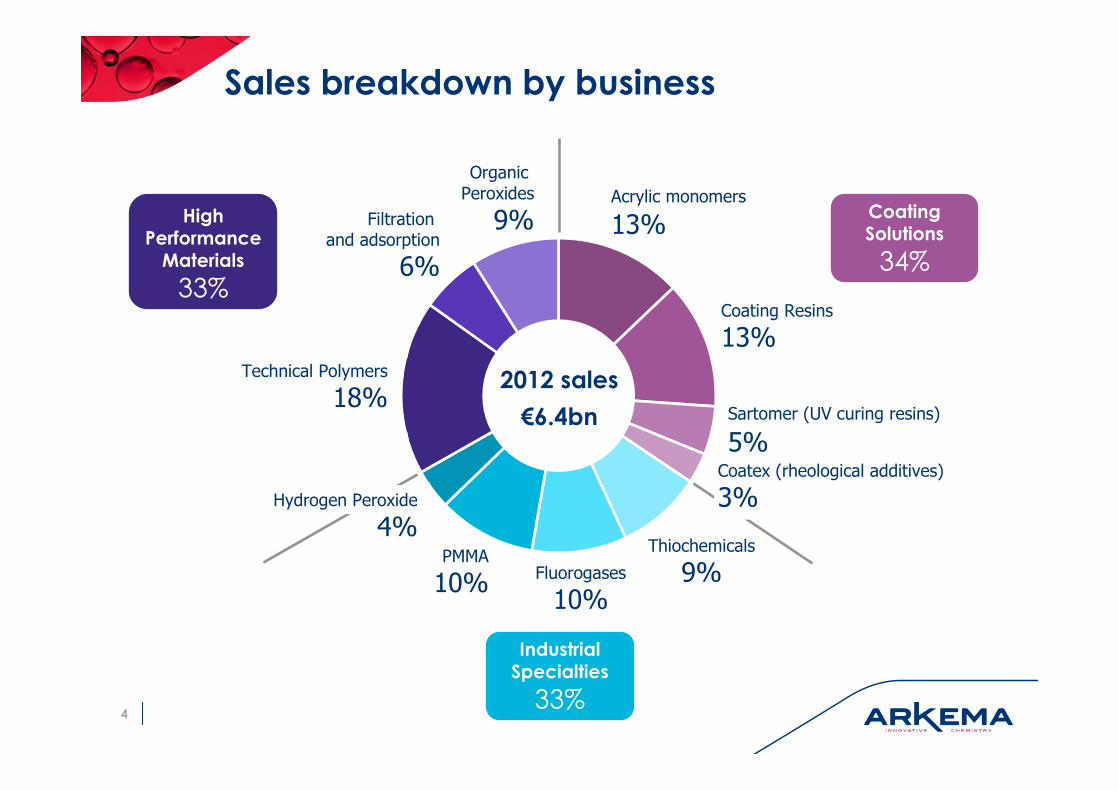
Sales breakdown by business
44
Organic Peroxides
9%
Fluorogases
10%
PMMA
10%
Technical Polymers
18%
Filtration and adsorption
6%
Acrylic monomers
13%
Sartomer (UV curing resins)
5%
Coating Resins
13%
2012 sales
€6.4bn
Coating Solutions
34%
Industrial Specialties
33%
High Performance Materials
33%
Thiochemicals
9%
Coatex (rheological additives)
3%Hydrogen Peroxide
4%

Among top players on 90% of our sales
POSITION MARKET SIZE (mT) MAIN PLAYERS % GROUP SALES
Specialty polyamides
0.2
• Evonik
• Ems14%
PVDF • Solvay
Organic peroxides 0.2• Akzo Nobel
• United Initiators4%
Thiochemicals 0.7 • Chevron Phillips 9%
Fluorogases 1.6• Dupont
• Honeywell10%
PMMA 1.6 • Evonik
• Mitsubishi Chemical10%
Hydrogen peroxide 3.2 • Solvay
• Evonik3%
Acrylic monomers 4.2• BASF
• Dow
• Nippon Shokubai
13%
Coatings 4.0• BASF
• Dow21%
#3
#1
#1
#2
#1
#1/2
#2
#4
#3
Coating SolutionsIndustrial SpecialtiesHigh Performance Materials
As a comparison, a market like PVC is 40mt
5

Diversified end markets
66
Others 8%
6%Energy
6%Construction
Nutrition 4%
Electronics 3%Water 3%
16%Chemicals, plastics
22%Consumer goodsHealth, hygiene and beauty, Wellness, Sports and leisure, Packaging, Textile, etc.
13%Industrial coatings
12%Decorative paints6% in North America5% in Europe1% in Asia & RoW
7%Transportation2% in Europe3% in North America2% in Asia & RoW
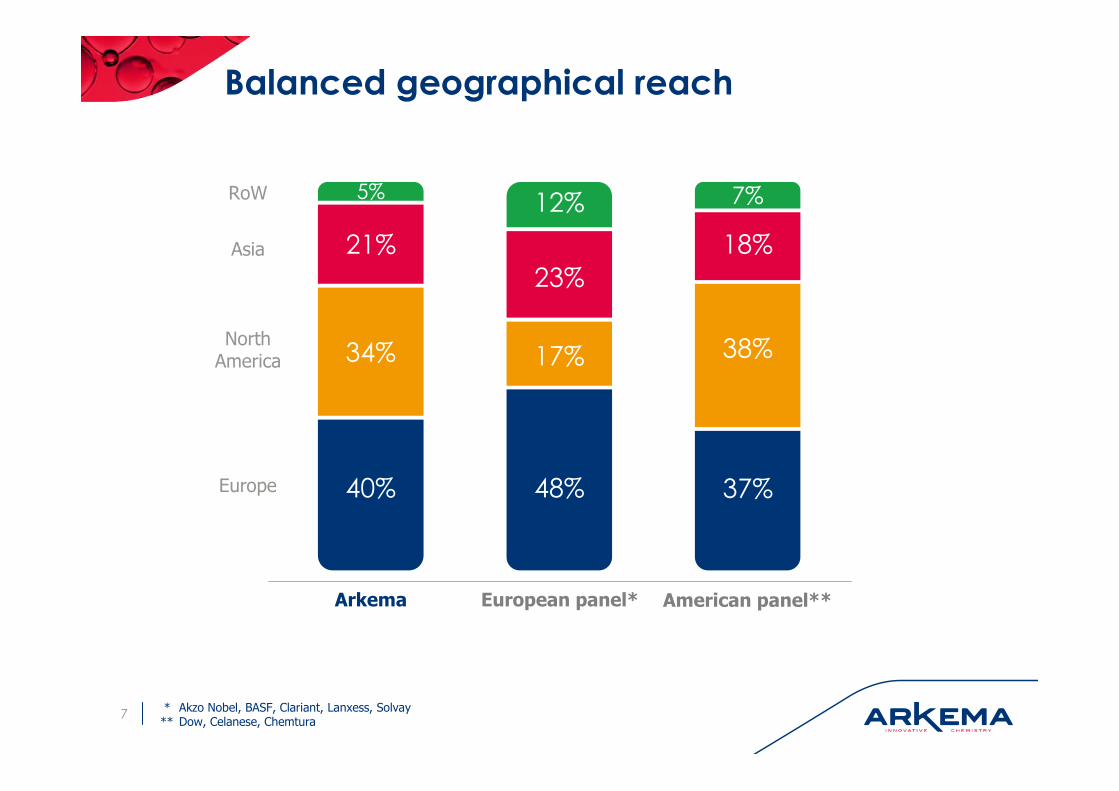
Balanced geographical reach
7
40%
34%
21%
5%
48%
17%
23%
12%
Europe
Asia
North America
RoW
Arkema European panel*
* Akzo Nobel, BASF, Clariant, Lanxess, Solvay** Dow, Celanese, Chemtura
37%
38%
18%
7%
American panel**

Solid balance sheet and financing
€900m net debt at 31 December 2012
● 39% gearing
● 0.9x net debt/EBITDA
€480m bond issued in 2012 with maturity in April 2020
● First tranche of €230m with 3.85% interest rate
● Second tranche of €250m with an annual yield slightly below 3%
8
2014
700
500
Average maturity > 4 years (€m)
120
480
€1.9bn financing resources (€m)
2015 2016 2017 2018 2019 2020
Credit linesBonds980
700
Others 100120 Securitization
Full year 2012results
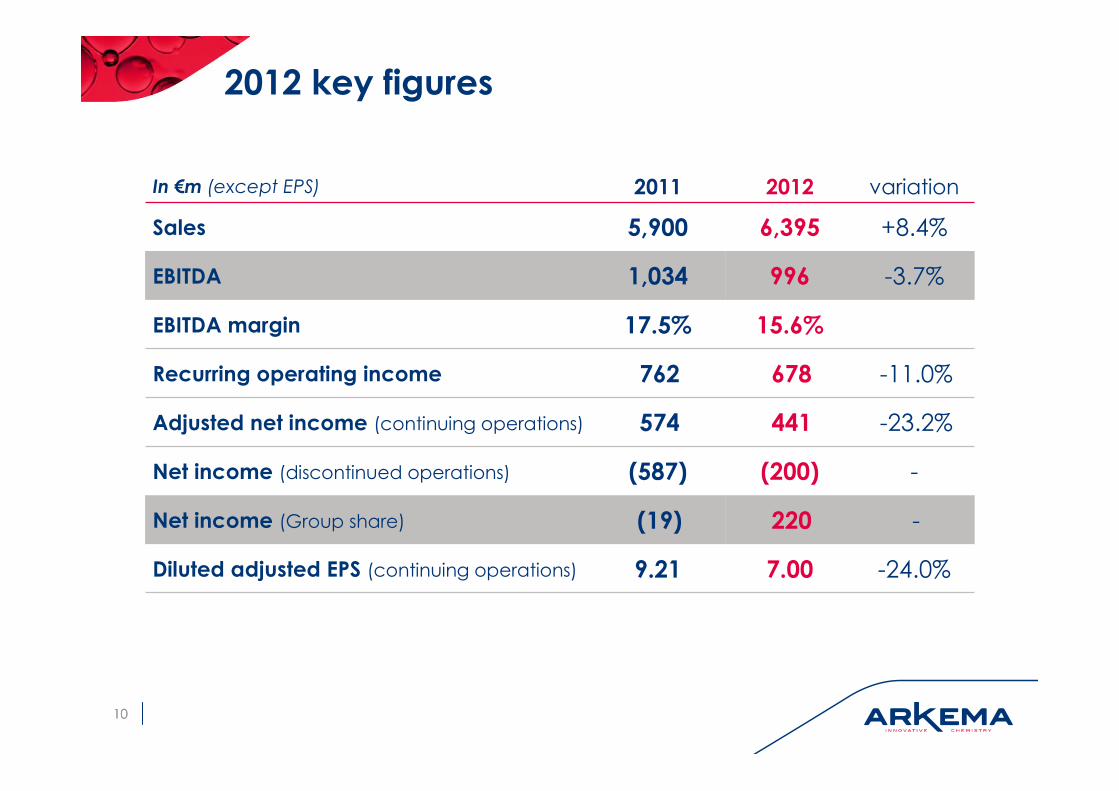
2012 key figures
1010
In €m (except EPS) 2011 2012 variation
Sales 5,900 6,395 +8.4%
EBITDA 1,034 996 -3.7%
EBITDA margin 17.5% 15.6%
Recurring operating income 762 678 -11.0%
Adjusted net income (continuing operations) 574 441 -23.2%
Net income (discontinued operations) (587) (200) -
Net income (Group share) (19) 220 -
Diluted adjusted EPS (continuing operations) 9.21 7.00 -24.0%
Key drivers of FY’12 performance
More challenging market conditions than in 2011
● Solid economic environment in North America supported by cheap energy cost
● Difficult macro in Europe
● Lower growth in Asia than expected
● Volatile and high raw material costs
● Positive impact of foreign exchange rate (€/US dollar)
Well positioned on resilient niche markets
● Increasing demand for sustainability (lightweight materials, bio-based products, water treatment, etc.)
● Growing niches benefiting from population growth and increasing standard of living (superabsorbent for diapers, graphic arts, animal nutrition, etc.)
Benefits from strong position built in North America (34% of sales)
Gradual contribution from acquisitions in High Performance Materials with progressive implementation of synergies
● Hipro and Casda in China in bio-based specialty polyamide 10
● Alkoxylates (Filtration and adsorption)
11
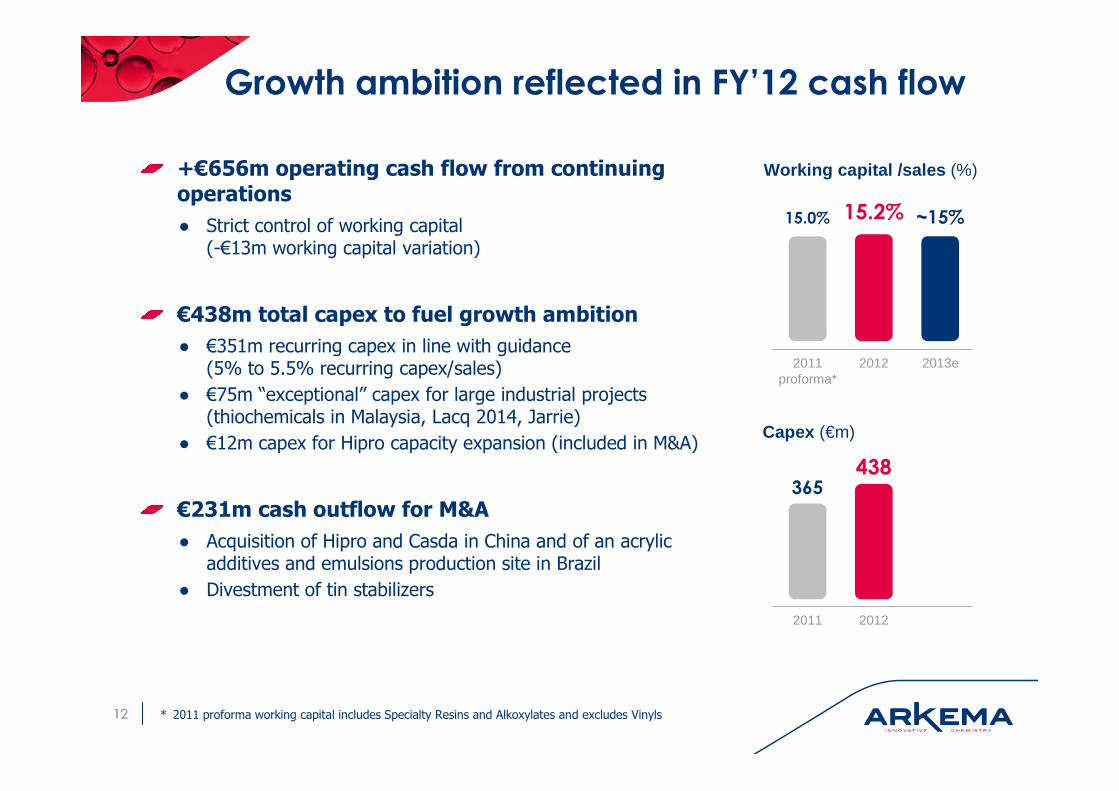
Growth ambition reflected in FY’12 cash flow
+€656m operating cash flow from continuing operations
● Strict control of working capital (-€13m working capital variation)
€438m total capex to fuel growth ambition
● €351m recurring capex in line with guidance (5% to 5.5% recurring capex/sales)
● €75m “exceptional” capex for large industrial projects (thiochemicals in Malaysia, Lacq 2014, Jarrie)
● €12m capex for Hipro capacity expansion (included in M&A)
€231m cash outflow for M&A
● Acquisition of Hipro and Casda in China and of an acrylic additives and emulsions production site in Brazil
● Divestment of tin stabilizers
1212
15.0% 15.2%
2011 proforma*
2012
Working capital /sales (%)
~15%
2013e
* 2011 proforma working capital includes Specialty Resins and Alkoxylates and excludes Vinyls
365438
2011 2012
Capex (€m)
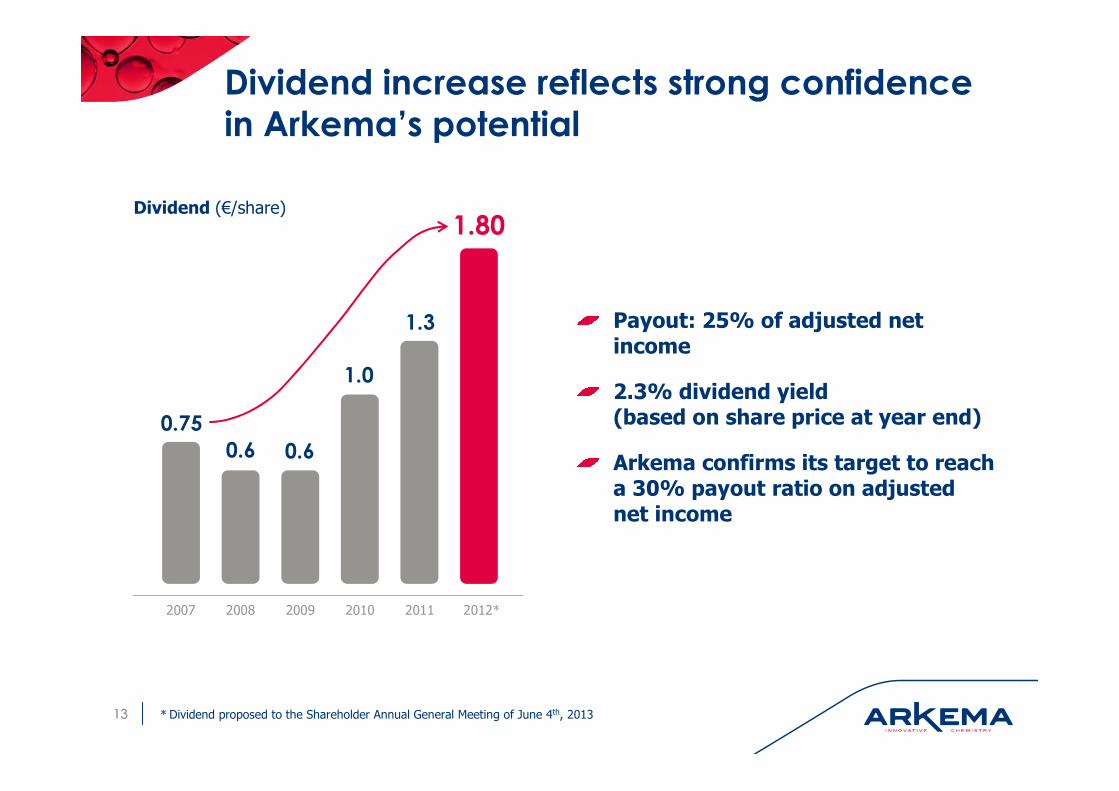
0.6
0.75
0.6
1.0
1.3
Dividend increase reflects strong confidence
in Arkema’s potential
Payout: 25% of adjusted net income
2.3% dividend yield (based on share price at year end)
Arkema confirms its target to reach a 30% payout ratio on adjusted net income
1313 * Dividend proposed to the Shareholder Annual General Meeting of June 4th, 2013
Dividend (€/share)1.80
2009 2012*2007 2008 2010 2011
2013 assumptions
Market conditions expected to remain contrasted
● Solid environment in North America supported by improved GDP and low energy costs
● Europe to remain challenging with continuing cautiousness of customers
● Growth should gradually improve in Asia with early signs of recovery in China
● Expected weak demand in photovoltaic in 1H’13 and in automotive in Europe and delays in some oil and gas projects
● Signs of improvement in decorative paints in the USA
Mid-cycle conditions in acrylic monomers
Strong focus on pricing to follow high raw materials
Volatile exchange rates
2013 should be another strong year with a slower start of the year in the High Performance Materials segment
1414

Hipro-Casda
2013 priorities
Finalize $110m investment plan in acrylics in the US
● Start-up of 30kt acrylic acid expansion (mid 2013)
● Start-up of 45kt methyl acrylate unit (2H’13)
Maintain pace of development in China
● Start-up of Hipro capacity expansion (x3) end 1Q’13
● New emulsion units in Changshu (4Q’13)
Further synergies in coating resins
Execute on the construction of the Thiochemicals platform in Malaysia
Implement project to secure sulfur supply over next 30 years for Thiochemicals in Lacq
● Turnaround expected in 4Q’13
Finalize investment in Jarrie in the next generation of electrolysis (membrane technology)
€ 500 million capex in 2013e to support targeted growth ambition
● In line with the mid-term capex guidance of € 1.7 bn capexover 4 years (2013-2016)
1515
Acrylic monomers in US
Thiochemicals in Malaysia

On track to2016 targets

Confident to deliver our long-term targets
€ 8bn sales and 16% EBITDA margin in 2016
Gearing to be maintained below 40%
Portfolio increasingly focused on specialties
Very balanced geographic presence
17
38% 32%Coating Solutions
High Performance
Materials
Industrial Specialties
30%
35% 35%
30%
Europe
Asia and RoW
North America
Sales by segment (2016e) Sales by region (2016e)
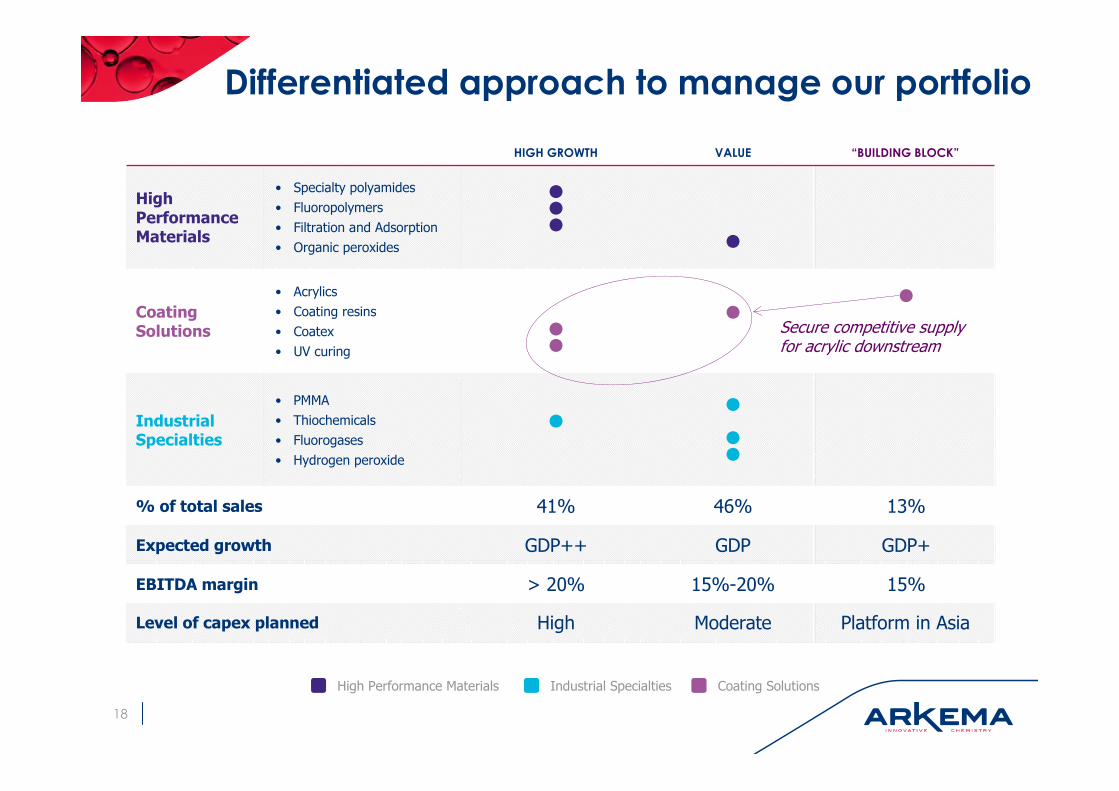
HIGH GROWTH VALUE “BUILDING BLOCK”
High Performance Materials
• Specialty polyamides
• Fluoropolymers
• Filtration and Adsorption
• Organic peroxides
●●●
●
Coating Solutions
• Acrylics
• Coating resins
• Coatex
• UV curing
●●
●●
Industrial Specialties
• PMMA
• Thiochemicals
• Fluorogases
• Hydrogen peroxide
●●
●●
% of total sales 41% 46% 13%
Expected growth GDP++ GDP GDP+
EBITDA margin > 20% 15%-20% 15%
Level of capex planned High Moderate Platform in Asia
Differentiated approach to manage our portfolio
Secure competitive supply for acrylic downstream
Coating SolutionsIndustrial SpecialtiesHigh Performance Materials
18

+140
Organic growth
+144
19
Organic growth and acquisitions to support
EBITDA growth
EBITDA (€m)
1,280
996● Small to mid-size
acquisitions
● High Performance Materials and acrylic downstream
● Small divestments
Acquisitions and disposals
● Innovation
● Geographical expansion
Growthprojects
Cost savings
Inflation onfixed costs
Others
2016e2012

Contribution of organic growth projects to
EBITDA
20
2012 2013 2014 20162015
PVDF expansion(+50% - China)
Hipro expansion (x3 - China)
HFC125 expansion(+30% - China)
Coating resins(new - China)
Thiochemicals(new platform -
Malaysia)
2EHA
Acrylic US AA expansion
MA
Cumulated contribution to EBITDA

Cash allocation over 2013 - 2016
Cumulative cash flow
from operating activities
€3.6 bncash resources available
Borrowing capacity
Capex
€1.7 bn
M&A, dividendsand others
€1.9 bn
M&A
Dividends
M&A
Dividends
M&A
Dividends
M&A
Dividends
Others
21

Strong FY’12 performance in a volatile and challenging macro-environment
High quality portfolio of profitable niche chemical businesses
Dividend increase to reflect confidence in our mid-term outlook
High density of organic growth projects supporting targeted growth strategy
Confident for 2013 while remaining cautious about the macro-environment
Clear roadmap to achieve 2016 ambition
Conclusion
22
Appendices
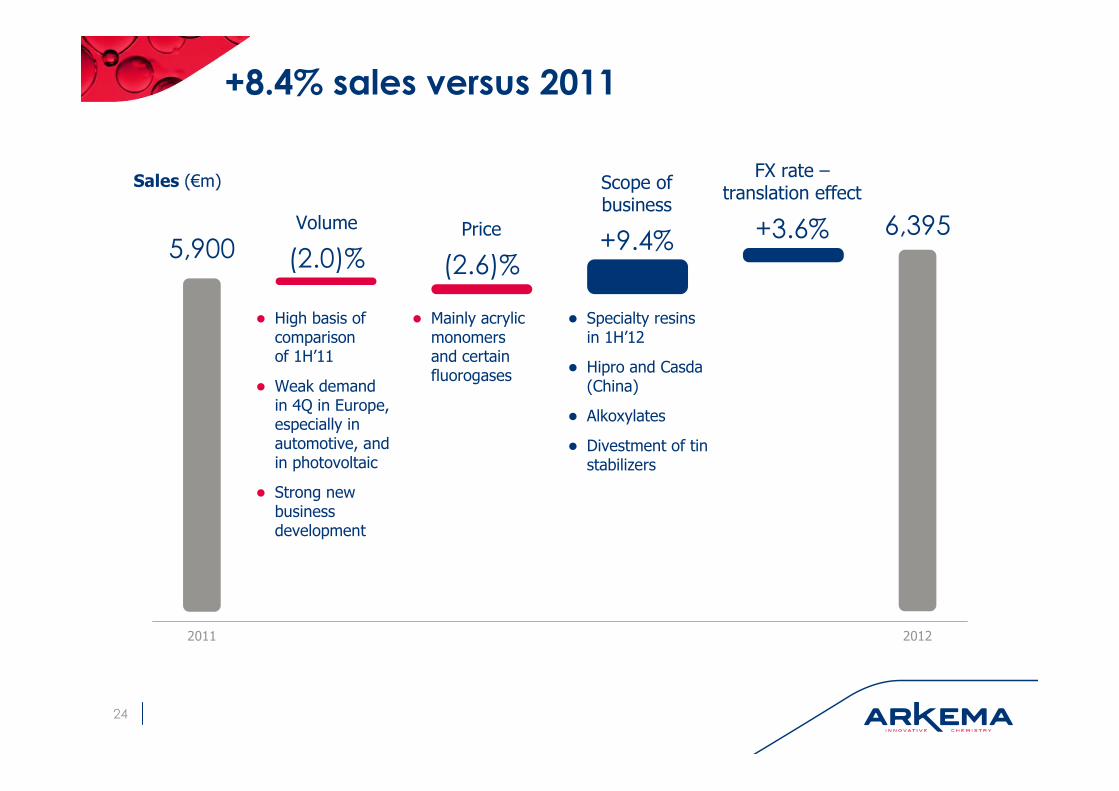
+8.4% sales versus 2011
24
Sales (€m)
Volume
2012
5,900
2011
FX rate –translation effect
Price
● High basis of comparison of 1H’11
● Weak demand in 4Q in Europe, especially in automotive, and in photovoltaic
● Strong new business development
● Mainly acrylic monomersand certain fluorogases
Scope of business
● Specialty resins in 1H’12
● Hipro and Casda(China)
● Alkoxylates
● Divestment of tin stabilizers
(2.0)% (2.6)%+9.4% +3.6% 6,395

Performance Products (High Performance Materials)
17.2% EBITDA margin, maintained at historical high
+7.6% sales at €2,101m● Benefits from acquisitions (+7%) in bio-based polyamide 10 in China and alkoxylates
and from positive FX rate (+3%)● -3% volumes impacted by weak demand in Europe and, in 4th quarter, by destocking in automotive
and photovoltaic and delays in new oil and gas projects
Improved product mix
Strong performance of Technical Polymers despite slowdown in 4Q specifically in Europe ● Solid positions in niche markets (bio-based polymers, oil and gas, lightweight materials)● Benefits of having full Specialty Polyamides product range (PA 10, 11 and 12)● Force majeure declared on polyamide 12 following accident at Evonik’s CDT plant in Marl (Germany)
Further improvement in Organic Peroxides● Portfolio optimization with divestment of tin stabilizers business beginning of October
Benefit from alkoxylates acquisition in Filtration and Adsorption
2525
In €m 2011 2012 variation
Sales 1,952 2,101 +7.6%
EBITDA 337 361 +7.1%
EBITDA margin 17.3% 17.2%
Recurring operating income 238 252 +5.9%

Industrial Chemicals (Industrial Specialties and Coating Solutions)
+8.7% sales at €4,271m supported by acquisitions of Specialty Resins (+11%) and strengthening of US dollar versus euro (+4%)
Industrial Specialties: €399m EBITDA, 19.0% EBITDA margin
● Solid performance of all businesses in North America (PMMA for automotive, Fluorogases for air conditioning and refrigeration, Thiochemicals for animal nutrition, Hydrogen Peroxide)
● Decrease, as expected, of the margin of certain fluorogases (especially HFC-125) after very strong 2011● Lower demand in electronics for PMMA
Coating Solutions: €279m EBITDA, 12.8% EBITDA margin
● In line with our assumption of acrylics back to mid cycle conditions versus peak conditions in 2011● Dilutive impact on EBITDA margin of Specialty Resins acquired from Total but increase of margin
in this business by 2 points versus 2011● Low demand in decorative paints in Europe and North America but gradual improvement expected
in North America in 2013● Good performance of Coatex and Sartomer on innovation and geographic expansion
2626
In €m 2011 2012 variation
Sales 3,928 4,271 +8.7%
EBITDA 725 678 -6.5%
EBITDA margin 18.5% 15.9%
Recurring operating income 553 477 -13.7%

Strong balance sheet maintained
39% gearing in line with guidance
● Includes the impact of the acquisition of Hipro and Casda in China and of the divestment of Vinyls
0.9x net debt / EBITDA
Net provisions include:
● € 324 m pensions (€261m in 2011) on lower discount rates
● € 50 m restructuring (€72m in 2011)
● € 123 m environment (stable YoY)
€600m unrecognized deferred tax assets end 2012
2727
In €m31 Dec
2011
31 Dec
2012
Net debt 603 900
Shareholders’ equity 2,217 2,311
Net provisions* 686 774
Non current assets 2,693 3,068
Net working capital 960 971
Capital employed 3,653 4,039
35% 34%Coating Solutions
High Performance
Materials
Capital employed by segment
Industrial Specialties
31%
* Provisions net of non-current assets
55%
26%
19%
Europe
Asia and RoW
North America
Capital employed by region
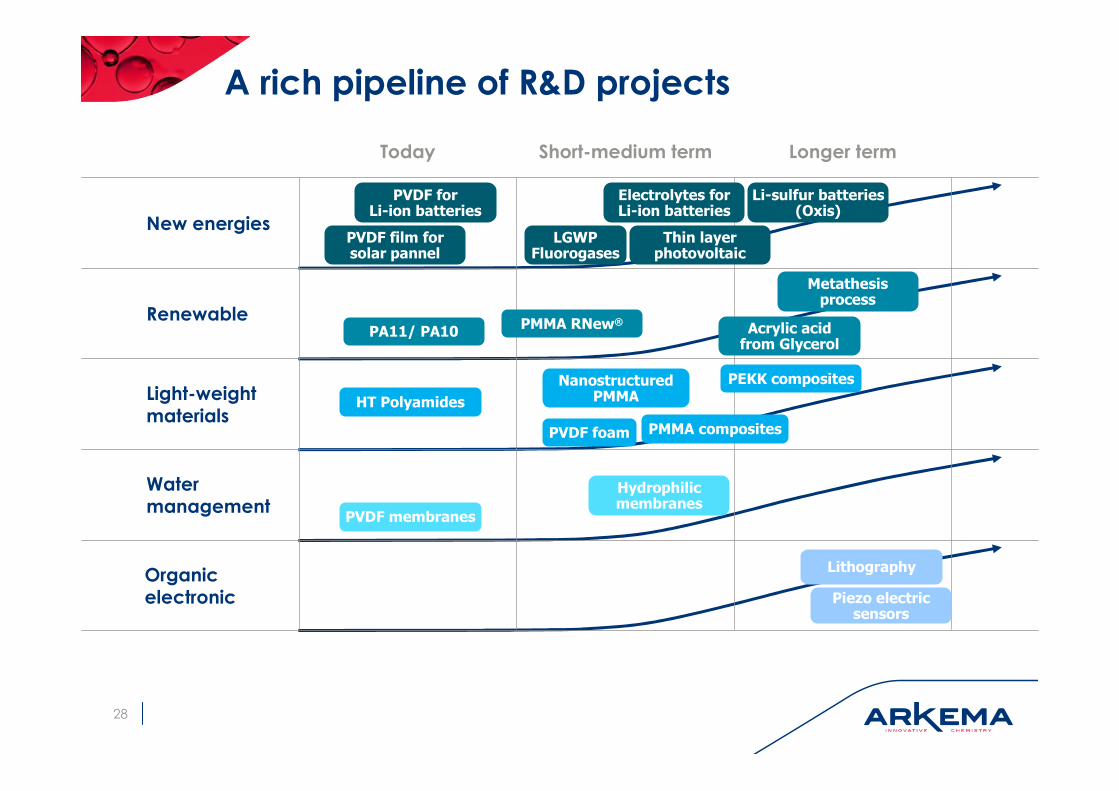
A rich pipeline of R&D projects
Water management
New energies
Renewable
Light-weightmaterials
PVDF film for solar pannel
PVDF for Li-ion batteries
PA11/ PA10PMMA RNew®
Acrylic acid from Glycerol
PMMA composites
PVDF membranes
28
Today Short-medium term Longer term
Metathesis process
PEKK composites
Hydrophilic membranes
Li-sulfur batteries(Oxis)
Thin layer photovoltaic
Electrolytes for Li-ion batteries
HT Polyamides
LGWP Fluorogases
NanostructuredPMMA
PVDF foam
Organicelectronic Piezo electric
sensors
Lithography

High Performance Materials roadmap to 2016
2016 ambition
● 38% of Group sales
● 18% EBITDA margin
Strategic drivers
● Leverage megatrends through innovation in lightweight materials, new energies and renewable raw materials
● Reinforce portfolio of specialty polymers through bolt-on acquisitions and breakthrough technological projects
● Execute on Hipro-Casda business development
● Strengthen leadership position in PVDF through geographic expansions and extend range of fluoropolymers
● Expand in high growth countries (Middle-East, India, Brazil, etc.)
Major current projects
● Capacity expansion at Hipro (x3)
● PVDF expansion in China
● High-temperature polyamides
● New capacity in molecular sieves
29
World of high value and
innovative solutions
● Specialty polyamides
● Fluoropolymers
● Filtration and adsorption
● Organic peroxides

Industrial Specialties roadmap to 2016
2016 ambition
● 30% of Group sales
● 17% EBITDA margin
Strategic drivers
● Reinforce global industrial footprint
● Secure strategic supplies
● Expand in higher growth countries
● Develop new applications through innovation (Paladin® for soil fumigation, new generation of fluorogases, lightweight materials)
Major current projects
● Thiochemicals platform in Malaysia
● Investments to secure sulfur supply in Lacq for next 30 years (project Lacq 2014)
● Investment to move Jarrie site to next generation of electrolysis (membrane technology)
30
Global and integrated
industrial niches
● Thiochemicals
● Fluorogases
● PMMA
● Hydrogen peroxide

Coating Solutions roadmap to 2016
2016 ambition
● 32% of Group sales
● 15% EBITDA margin
Strategic drivers
● Increase downstream integration
● Further acquisition synergies in coating resins
● Expand in Asia and Latin America
● Bolt-on acquisition of new specialties
● Benefit from US decorative paints recovery
Major current projects
● US$ 110 m investment plan in acrylics in US (Clear Lake and Bayport expansions)
● New emulsion unit in China
● Leverage Brazilian acquisition in coating resins and rheological additives
31
Solutions for decorative paints,
industrial coatings and
high-growth acrylic applications
● Acrylic monomers
● Coating resins
● UV-curing (Sartomer)
● Coatex
Down-stream

Disclaimer
The information disclosed in this document may contain forward-looking statements with respect to the financial condition, results of operations, business and strategy of Arkema. Such statements are based on management’s current views and assumptions that could ultimately prove inaccurate and are subject to risk factors such as among others, changes in raw material prices, currency fluctuations, implementation pace of cost-reduction projects and changes in general economic and business conditions. Arkema does not assume any liability to update such forward-looking statements whether as a result of any new information or any unexpected event or otherwise. Further information on factors which could affect Arkema’s financial results is provided in the documents filed with the French Autorité des MarchésFinanciers.
Financial information for 2012, 2011, 2010, 2009, 2008, 2007, 2006 and 2005 is extracted from the consolidated financial statements of Arkema. Quarterly financial information is not audited.
The business segment information is presented in accordance with Arkema’s internal reporting system used by the management.
The definition of the main performance indicators used can be found in the reference document filed with the French Autorité des Marchés Financiers and available on www.finance.arkema.com
32

ARKEMA
Nomura - Global Chemical Industry Leaders ConferenceVenice – 21 st March, 2013