Embed Size (px)
Citation preview
TARGETSAspirational
Target Grade:
________
Research Methods AS Psychology – PSYA1
Name: ______________________
0
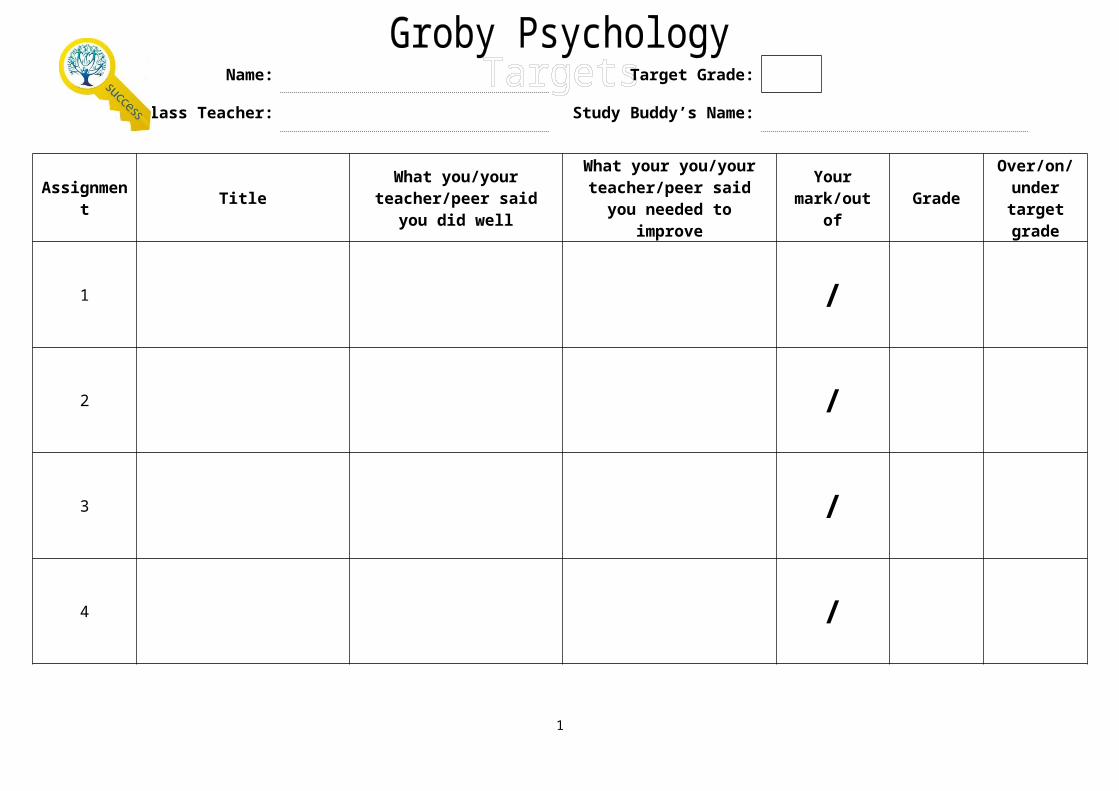
Name: Target Grade:
Class Teacher: Study Buddy’s Name:
Assignment Title
What you/your teacher/peer said you
did well
What your you/your teacher/peer said you
needed to improve
Your mark/out
ofGrade
Over/on/ under target grade
1 /
2 /
3 /
4 /
1
Introduction
We will be working through this booklet in lesson time, it can also be used as a revision aid nearer to the exam. Inside this booklet are resources that have been designed to help you to understand and revise research methods.
The booklet contains activities to complete that will assess your knowledge and understanding. The booklet also contains a list of the specification requirements which you can use as a checklist to monitor your progress. Past exam questions have also been included so you know what to expect, some of these will be completed during lesson time.
These are useful sites which may help you with your revision, some of them have been used within the booklet.
3 http://www.simplypsychology.org/research-methods.html 4 http://www.s-cool.co.uk/a-level/psychology/research-methods 5 http://filestore.aqa.org.uk/subjects/specifications/alevel/AQA-
2180-W-SP-14.PDF 6 http://www.gerardkeegan.co.uk/links.htm 4 http://www.psychlotron.org.uk/newResources/
researchMethods.html
The following textbooks have been used: Cardwell, M. & Flanagan, C. (2012) Psychology AS: The Complete
Companion. (3rd Edition) Oxford University Press. Eysenck, M. W. (2005) Psychology for AS Level. 3rd edition. Hove,
Sussex: Psychology Press. Johnston, J. (2004) AS Psychology Research Methods Workbook. Marshall, M. (2005) AQA (A) AS Psychology student workbook.
Lawrence and Co Ltd.
PSYA1 Assessment
Unit 1
1½ hour exam in May 50% of the total AS marks 25 % of the total A Level marks
You will answer structured compulsory questions based on Cognitive Psychology, Developmental Psychology and Research Methods.
Questions include short answer, stimulus material and one 12 mark question requiring extended writing in which QWC will be assessed.
2
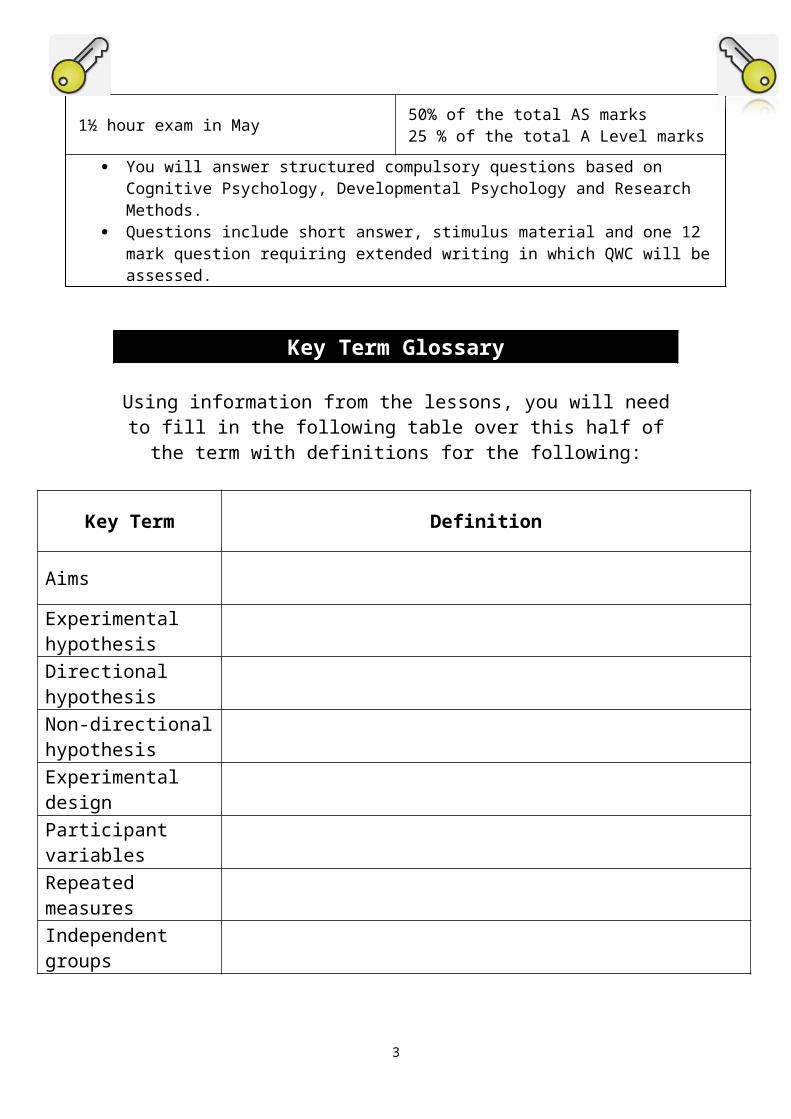
Key Term Glossary
Using information from the lessons, you will need to fill in the following table over this half of the term with
definitions for the following:
Key Term Definition
Aims
Experimental hypothesisDirectional hypothesisNon-directional hypothesisExperimental designParticipant variablesRepeated measuresIndependent groups
Matched pairs
OperationalisationIndependent variableDependant variableExtraneous variable
3
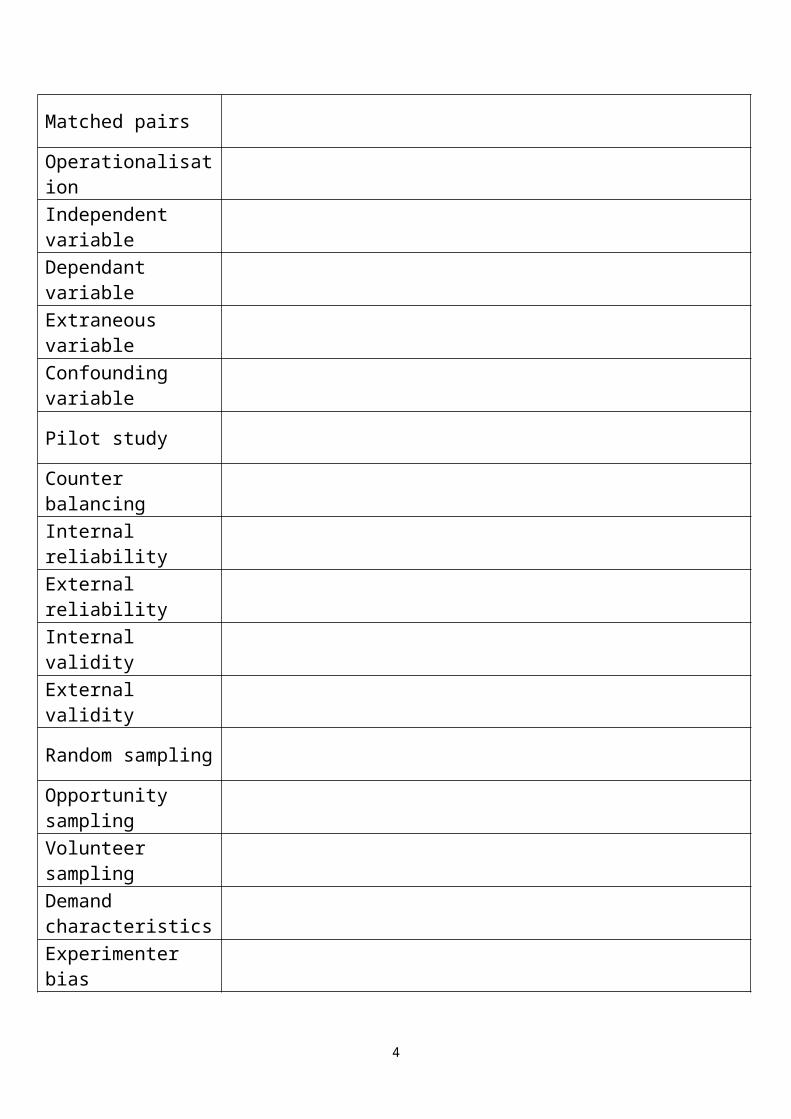
Confounding variable
Pilot study
Counter balancing
Internal reliability
External reliability
Internal validity
External validity
Random sampling
Opportunity samplingVolunteer samplingDemand characteristicsExperimenter bias
Interviewer bias
Quantitative data
Qualitative data
Measures of central tendency
Mean
4
Mode
Median
Measures of dispersion
Range
Standard deviationPositive/Negative correlationCorrelation coefficient
Line graph
Bar chart
Self report study
Scattergram
Lab experiment
Questionnaire
Field experiment
Natural experiment
Observation
Interview
5
Assessment ObjectivesKnowledge and understanding of science and of how science worksCandidates should be able to:• recognise, recall and show understanding of scientific knowledge• select, organise and communicate relevant information in a variety of forms.Application of knowledge and understanding of science and of how science worksCandidates should be able to:• analyse and evaluate scientific knowledge and processes• apply scientific knowledge and processes to unfamiliar situations including those related to
issues assess the validity, reliability and credibility of scientific information.How science worksCandidates should be able to:• demonstrate and describe ethical, safe and skilful practical techniques and processes,
selecting appropriate qualitative and quantitative methods• make, record and communicate reliable and valid observations and measurements with
appropriate precision and accuracy• analyse, interpret, explain and evaluate the methodology, results and impact of their own
and others’ experimental and investigative activities in a variety of ways.
This is why you need that C in GCSE maths…
Candidates should be able to:
Arithmetic and numerical computation
recognise and use expressions in decimal and standard form use ratios, fractions and percentages make estimates of the results of calculations (without using a
calculator)
Handling data
• use an appropriate number of significant figures• find arithmetic means• construct and interpret frequency tables and diagrams, bar
charts and histograms• have sufficient understanding of probability, e.g. to
understand how genetic ratios arise• understand the principles of sampling as applied to scientific
data• understand the importance of chance when interpreting data• understand the terms mean, median and mode• use a scatter diagram to identify a correlation between two
variables• use a simple statistical test• make order of magnitude calculations
6
Algebra
• understand and use the symbols:=, <, <<, >>, >, ∝, ~• substitute numerical values into algebraic equations using
appropriate units for physical quantities
Graphs• translate information between graphical,
numerical and algebraic forms• plot two variables from experimental or
other dataAims and Hypotheses
All research studies have to start with an aim. An aim is a general statement of why the study is being carried out. The aim of the study then leads onto the hypothesis.
A hypothesis is a: Clear statement A prediction Testable Formulated at the beginning of research
Psychologists start off with a theory which is a general idea about behaviour and then develop a hypothesis so they can test those ideas. For example in the psychology taster session we staged an experiment. Hypothesis: The participant’s level of fear (measured on a scale of 1-5) will increase the closer the crazy old woman approaches with the rolling pin.
With the person next to you try writing a hypothesis using the following key words.
Students, revision, music
Alcohol, reaction time, driving
Drivers, responses, lights
7
Exam results, Xbox, students
Tennis, time, Wimbledon
8
Directional and Non-Directional Hypotheses
A hypothesis can be directional or non-directional depending on the direction we think the outcome of the research will be. • A non-directional hypothesis (otherwise known as a ‘two-
tailed’ test) proposes that there will be a difference in the relationship but it doesn’t state the direction. E.g. There will be a difference between the number of times the target word is repeated by the participant in condition 1 (positive reinforcement) and condition 2 (negative reinforcement). Just think – a cat with two tails is non-directional.
• A directional hypothesis states what the difference will be. E.g. Participants will repeat the target word more in condition one (positive reinforcing) than in condition 2 (negative reinforcement).
Decide whether the hypotheses are directional or non-directional:
1. Students studying AS Psychology are happier than those studying AS Chemistry.
2. There will be a significant difference between the number of times male and female drivers fail to stop at a pedestrian crossing.
3. People who take vitamin B supplements are more intelligent than people who don’t take vitamin B.
4. Participants will react slower when playing Pac Man after consuming alcohol.
5. Smokers will cough more times when asked to sit in silence, than non-smokers
OperationaliseIn order to make a hypothesis testable we need to operationalise the DV
and the IV, this means to make them measurable. For example in statement 3 - People who take vitamin B supplements are
more intelligent than people who don’t take vitamin B, what do we
9

mean by more intelligent? We need to specify this behaviour further in order to measure it.
Using an IQ test would help us to quantify intelligence thus making it measurable.
10
Dependent and Independent Variables
• Independent variable = The deliberate difference between two groups. E.g. In an operant conditioning task the participant in the first condition will be rewarded, in the second condition they will be punished. The IV is manipulated (changed) by the researcher.
• Dependent variable = The thing that is counted or measured at the end of an experiment. E.g. the number of times the target word is read out. The DV is measured by the researcher.
TASK: Identify the IV and DV in the following...
Children that go to nursery before the age of 1 speak earlier than children that don’t. IV = DV =
Children who watch violent cartoons will get into more fights at school. IV= DV=
Adolescents are more likely to take part in risky behaviour when in a group than when they are alone. IV= DV=
New drivers have more accidents than people that have been driving for more than two years. IV= DV=
People that care for elderly relatives are more likely to have a low immune system. IV= DV=
Students that are rewarded for positive behaviour behave better than those that are not rewarded. IV= DV=
11

Experimental Design
Design Description When should
it be used? Advantages Disadvantages Controls
Repe
ated
mea
sure
s de
sign
When there is only a small number of
participants, so you use all
of the participants in
both conditions.
Order effects can be controlled through
counterbalancing (all conditions are
experienced first and second – ABBA).
Single blind techniques can be used to overcome
demand characteristics.
Inde
pend
ent g
roup
s des
ign If a small
sample is used then there is the risk that
any differences
between the conditions are
due to individual
differences of the
participants.
Participants are randomly allocated
to the different conditions.
Mat
ched
pai
rs
desig
n
When you have a lot of time, money
and participants as they need to be carefully matched.
Identical (monozygotic) twins
are useful for researchers when
matching participant variables.
Task: For the following: Identify the IV and the DV Identify the two or more conditions in the experiment, highlighting which
condition is the control (if there is one) Identify whether they are independent groups, matched pairs, or repeated
measures design.a) A scientist has developed a drug which he believes will increase IQ. He has
two groups of participants; one group he gives the drug to, and the other he gives a placebo to. After two weeks, he tests their IQ. To try and avoid any participant variables, he ensures that he has an equal number of men and women in each group, and that the participants are of similar ages, intelligence and social background.
b) A psychologist is investigating the effect of music on concentration. A group of participants are given a series of crossword puzzles to solve, first in a silent room, then when classical music is played, and then when rock music is played. The time taken to solve each puzzle is recorded.
12

c) A researcher is interested in whether alcohol has an effect on memory. One group of participants are given a list of words to learn and then given an alcoholic drink. The other group is given the same list of words, and a glass of water. The number of words they can remember is recorded.
13

Experimental and non experimental researchExperimental methods allows you to study cause and effect. It involves the manipulation of one variable.
Lab experiment Field experiment Natural experiments
Non-experimental methods there is no independent variable involved. As a result no cause-effect conclusions can be drawn when using a non-experimental method of research.
Observational techniques Self report Correlational analysis Case studies
Laboratory Experiments
What is a lab experiment?
Use these key words: IV DV Controlled Cause and Effect Validity Mundane Realism
You will recreate a lab experiment by Loftus and Palmer (1974). Summarise the experiment below:
Procedure:
Findings:
Conclusions:
Field Experiment
14
Strengths of lab experiments Weaknesses of lab experiments

A field experiment is where the experiment is conducted in a more natural setting than a laboratory, e.g. the work place, school, the street etc. Basically the same rules apply:
An independent variable is manipulated to see how it affects a dependent variable.
Confounding variables can still get in the way, and cause and effect can still be determined.
However, the setting is more natural. Participants are not necessarily randomly allocated to conditions.
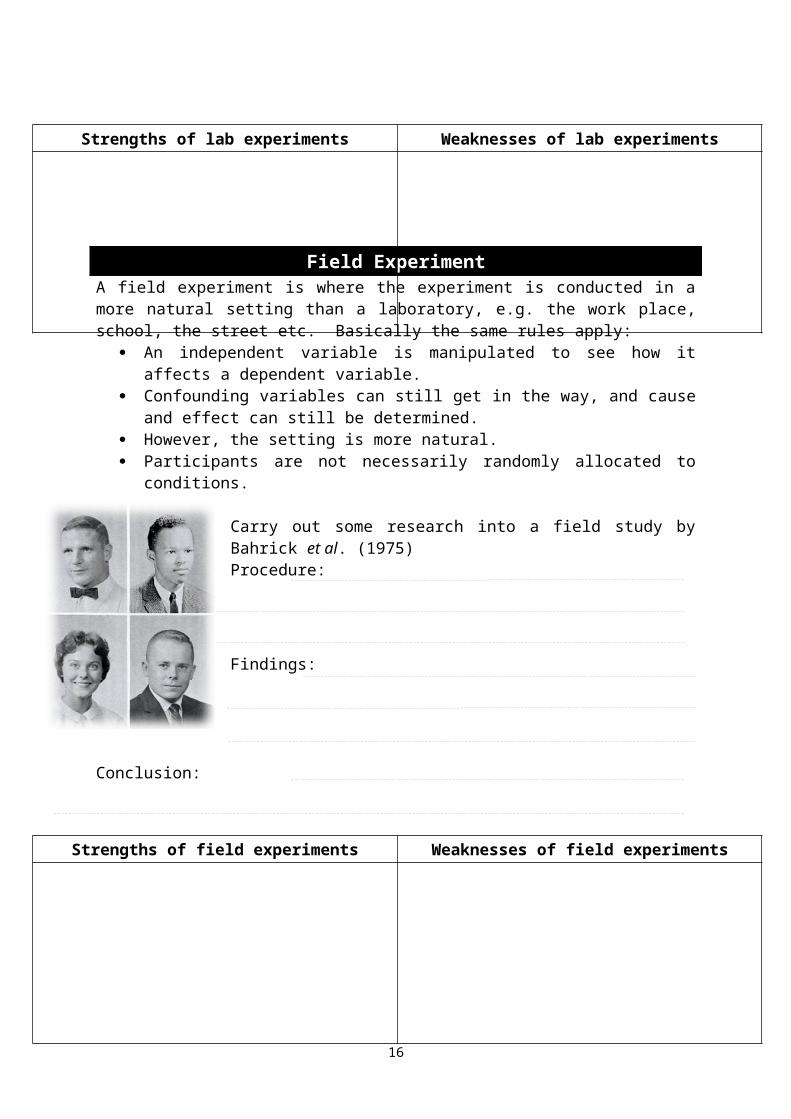
Carry out some research into a field study by Bahrick et al. (1975)Procedure:
Findings:
Conclusion:
Example exam question: Dave, a middle-aged male researcher, approached an adult in a busy street. He asked the adult for directions to the train station. He repeated this with 29 other adults. Each of the 30 adults was then approached by a second researcher, called Sam, who showed each of them 10 photographs of different middle-aged men, including a photograph of Dave. Sam asked the 30 adults to choose the photograph of the person who had asked them for directions to the train station. Sam estimated the age of each of the 30 adults and recorded whether each one had correctly chosen the photograph of Dave.
A. Identify one aim of this experiment.B. Suggest one reason why the researchers decided to use a field experiment
rather than a laboratory experiment. (2)
15
Strengths of field experiments Weaknesses of field experiments
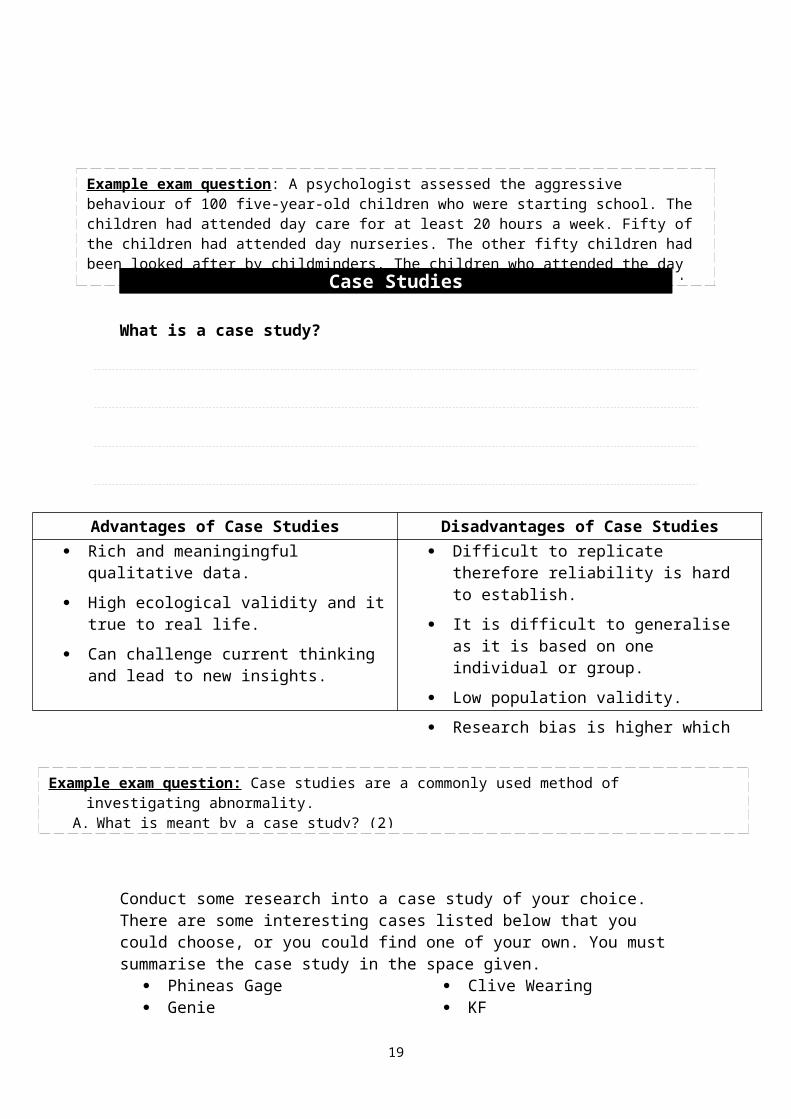
Example exam question: A psychologist assessed the aggressive behaviour of 100 five-year-old children who were starting school. The children had attended day care for at least 20 hours a week. Fifty of the children had attended day nurseries. The other fifty children had been looked after by childminders. The children who attended the day nurseries were more aggressive than the children who had been looked after by childminders.
A. Explain why this is an example of a natural experiment. (2)
Natural ExperimentWhat is a natural experiment?Use these key words:
IV DV Controlled Cause and Effect Validity Causal Extraneous Variables
Hodges and Tizard carried out a natural experiment into privation (failing to form attachment as a child to a caregiver). Outline the research below:Aim:
Procedure:
Findings:
Conclusions:
16
Strengths of natural experiments Weaknesses of natural experiments
Case Studies
What is a case study?
Conduct some research into a case study of your choice. There are some interesting cases listed below that you could choose, or you could find one of your own. You must summarise the case study in the space given.
Phineas Gage Genie Clive Wearing
KF HM
17
Advantages of Case Studies Disadvantages of Case Studies Rich and meaningingful qualitative
data. High ecological validity and it true to
real life. Can challenge current thinking and
lead to new insights.
Difficult to replicate therefore reliability is hard to establish.
It is difficult to generalise as it is based on one individual or group.
Low population validity. Research bias is higher which
questions its scientific credibility.
Example exam question: Case studies are a commonly used method of investigating abnormality.
A. What is meant by a case study? (2)B. Outline one weakness of using a case study as a method of investigation. (2)
Observational techniques
What is an observational study?An observational study collects data from participants by watching them and recording their behaviour.
Complete the table below about the types of observation:Controlled observation Naturalistic observation
Observational techniques include: Participant vs. non-participant observation
o Participant = the researcher joins the group being studied.o Non-participant = observations are made outside of the group.
Disclosed and undisclosed observationo Disclosed = participants are aware they are being watched
(overt).o Undisclosed = participants are not aware they are being
watched (covert). Structured and unstructured observation
o Structured = the researcher knows what behaviours to look for and uses a checklist to record the frequency of behaviour.
o Unstructured = the researcher watches the behaviour, with no system, possibly due to unpredictable behaviour.
Briefly outline the method of an observation study using a ‘bobo doll’
below:
18
Designing behavioural observations
Scenario: You are interested in studying the relationship between aggression and amount of time spent in day care.
Design 3 simple methods to record the ratings of aggression in two types of day care (e.g. nursery, childminders, nannies etc).
Behavioural checklists
Coding systems
Rating systems
19
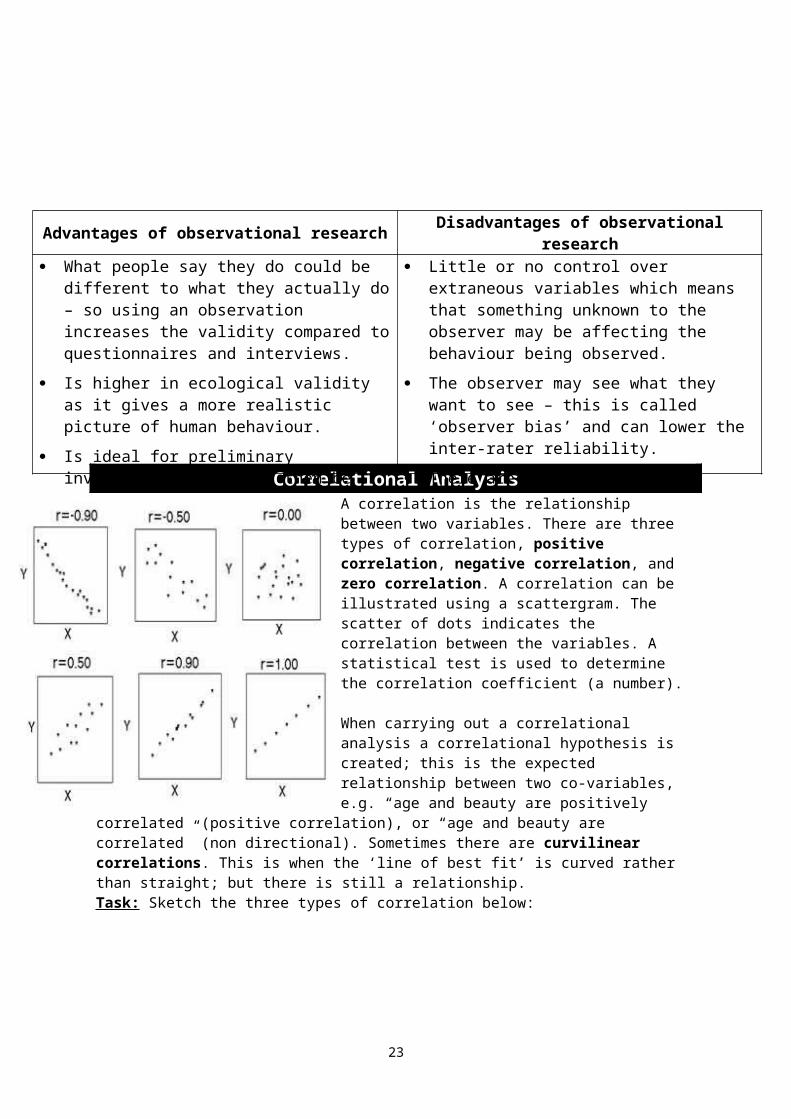
Advantages of observational research Disadvantages of observational research
What people say they do could be different to what they actually do – so using an observation increases the validity compared to questionnaires and interviews.
Is higher in ecological validity as it gives a more realistic picture of human behaviour.
Is ideal for preliminary investigation that can then be investigated further.
Little or no control over extraneous variables which means that something unknown to the observer may be affecting the behaviour being observed.
The observer may see what they want to see – this is called ‘observer bias’ and can lower the inter-rater reliability.
There are ethical issues if participants do not know that they are being watched. But if they do know they might change their behaviour.

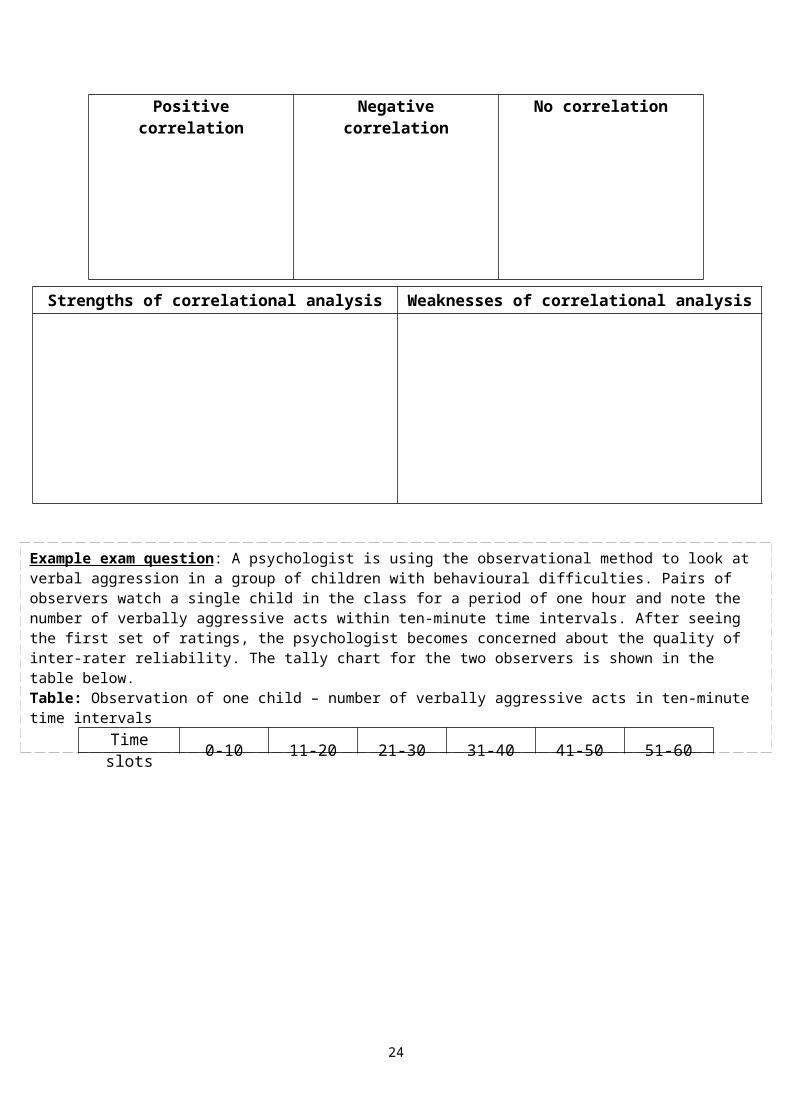
Correlational AnalysisA correlation is the relationship between two variables. There are three types of correlation, positive correlation, negative correlation, and zero correlation. A correlation can be illustrated using a scattergram. The scatter of dots indicates the correlation between the variables. A statistical test is used to determine the correlation coefficient (a number).
When carrying out a correlational analysis a correlational hypothesis is created; this is the expected relationship between two co-variables, e.g. “age and beauty are positively correlated” (positive correlation), or “age and beauty are correlated” (non directional). Sometimes there are curvilinear correlations. This is when the ‘line of best fit’ is curved rather than straight; but there is still a relationship.
Task: Sketch the three types of correlation below:Positive correlation Negative correlation No correlation
20
Strengths of correlational analysis Weaknesses of correlational analysis
Example exam question: A psychologist is using the observational method to look at verbal aggression in a group of children with behavioural difficulties. Pairs of observers watch a single child in the class for a period of one hour and note the number of verbally aggressive acts within ten-minute time intervals. After seeing the first set of ratings, the psychologist becomes concerned about the quality of inter-rater reliability. The tally chart for the two observers is shown in the table below.Table: Observation of one child – number of verbally aggressive acts in ten-minute time intervals
Time slots 0-10 11-20 21-30 31-40 41-50 51-60Observer
A 2 5 0 6 4 3Observer
B 4 3 2 1 6 5
Self-report methods
QuestionnairesWhat is a questionnaire?
How do you design a good questionnaire?
InterviewsWhat is an interview? What is a structured interview? What is an unstructured interview?
How do you design/plan a good interview?
21
Strengths of Questionnaires Weaknesses of Questionnaire Can question a large number of people quickly. Used to collect large amounts of data about
what people think, as well as do. Does not need the researcher to be present. Reduces investigator effects.
Social desirability bias – you want to present yourself in the most favourable way and so change your responses. This threatens the validity.
People may give untruthful responses with sensitive issues, e.g. smoking.
Postal surveys may give low response rates. Questions may be misinterpreted.
Strengths of Interviews Weaknesses of Interviews Detailed qualitative data can be collected. The interviewer can clarify the meaning and
significance of the information provided. Allows the participants to express themselves
freely. Unstructured interviews may lead to honest
answers and new lines of enquiry.
Statistical analysis is difficult if unstructured interviews are used and qualitative data is collected.
It is more time consuming than a questionnaire. Greater chance of interpersonal variables
affecting the responses (i.e. increased investigator effects)
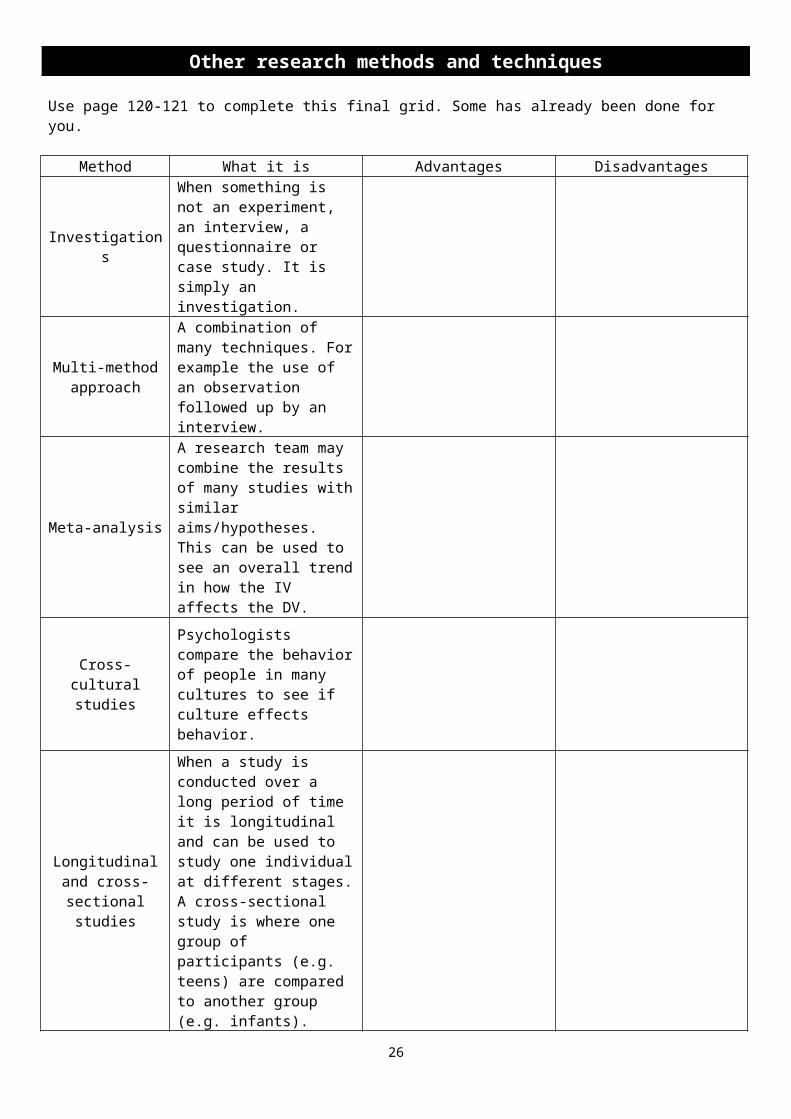
Other research methods and techniquesUse page 120-121 to complete this final grid. Some has already been done for you.
Method What it is Advantages Disadvantages
Investigations
When something is not an experiment, an interview, a questionnaire or case study. It is simply an investigation.
Multi-method approach
A combination of many techniques. For example the use of an observation followed up by an interview.
Meta-analysis
A research team may combine the results of many studies with similar aims/hypotheses. This can be used to see an overall trend in how the IV affects the DV.
Cross-cultural studies
Psychologists compare the behavior of people in many cultures to see if culture effects behavior.
Longitudinal and cross-sectional studies
When a study is conducted over a long period of time it is longitudinal and can be used to study one individual at different stages.A cross-sectional study is where one group of participants (e.g. teens) are compared to another group (e.g. infants).
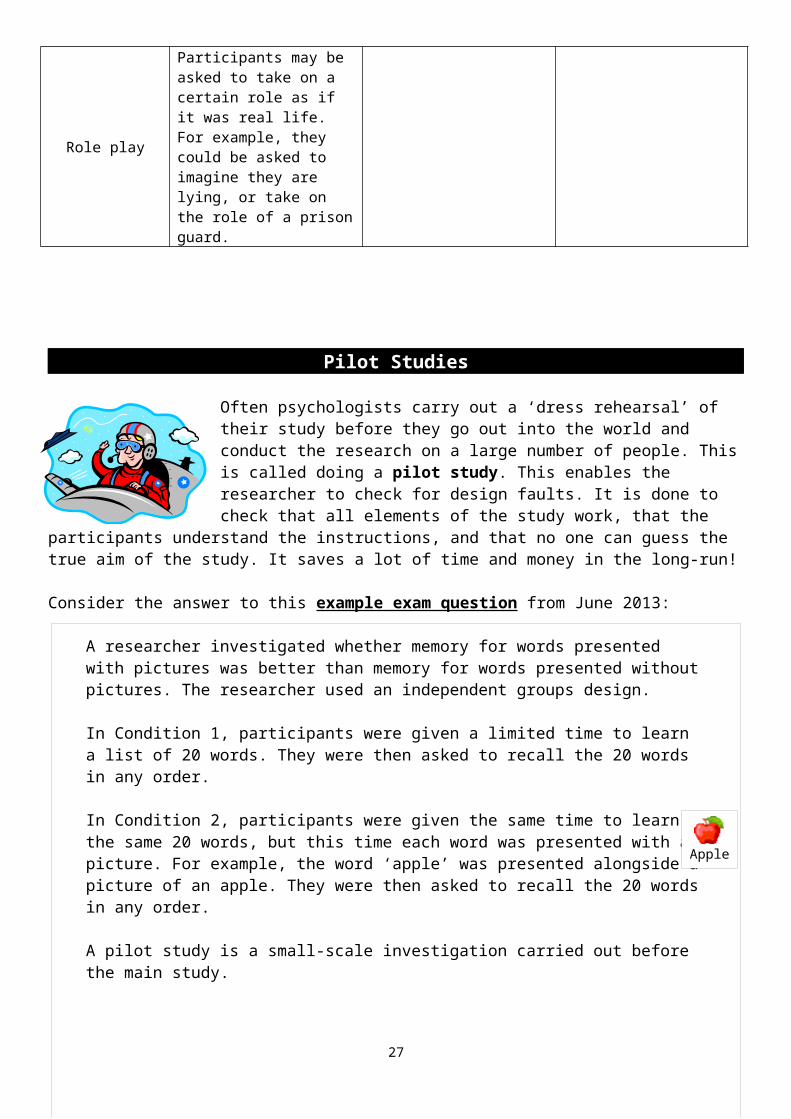
Role play
Participants may be asked to take on a certain role as if it was real life. For example, they could be asked to imagine they are lying, or take on the role of a prison guard.
22
Pilot Studies
Often psychologists carry out a ‘dress rehearsal’ of their study before they go out into the world and conduct the research on a large number of people. This is called doing a pilot study. This enables the researcher to check for design faults. It is done to check that all elements of the study work, that the participants understand the instructions, and that no one can guess the true aim of the study. It saves a lot of time and money in the long-
run!
Consider the answer to this example exam question from June 2013:
A researcher investigated whether memory for words presented with pictures was better than memory for words presented without pictures. The researcher used an independent groups design.
In Condition 1, participants were given a limited time to learn a list of 20 words. They were then asked to recall the 20 words in any order.
In Condition 2, participants were given the same time to learn the same 20 words, but this time each word was presented with a picture. For example, the word ‘apple’ was presented alongside a picture of an apple. They were then asked to recall the 20 words in any order.
A pilot study is a small-scale investigation carried out before the main study.Explain why it would be appropriate for this researcher to use a pilot study. In your answer you must refer to details of the experiment given above. (4 marks)
Total marks out of 4: _______
Peer feedback:
23
Apple
Reliability
It is very important for psychologists to be sure that their research is producing reliable results. Reliability refers to the consistency of results – in science this might mean how accurate is a ruler at measuring or how good is a calculator at adding up? In psychology it means would a test marked by two different people, be scored in an identical way? Or, if a study is replicated would the findings should be similar?An IQ test may be unreliable if a person sits the test on Monday and
scores 140, and then sits the same test on Friday and scores 90. Even though it can be replicated, it shows low consistency and therefore is an unreliable test.
Some research methods (such as laboratory studies) have high reliability as they can be replicated and the results checked for consistency. Other research methods however (such as case studies and interviews) have lower reliability as they are difficult or impossible to replicate. As they cannot be replicated, we cannot check how consistent the results are.
Forms of reliability
Internal reliability – whether a test is consistent within itself, e.g. a set of scales measures a bag of flour at half the weight of two bags of flour.
External reliability – whether the test is consistent over time, e.g. an individual scores roughly the same IQ every time he/she takes the test.
When conducting an observation it is important that two observers produce a similar record. How often the two observers agree is called inter-observer reliability. There is a simple equation for checking the level of agreements:
1. How can psychologists improve reliability in observational research?
2. How can psychologists improve reliability in questionnaires and interviews?
3. Mr Coles asks you to make tea for all the staff at Parents’ Evening. How do you ensure you are reliable?!
24

Validity
Reliability, on its own, is not enough. Studies should be measuring what they are intended to measure. If a researcher wanted to measure IQ would he do it with a ruler? Validity refers to whether or not a test measures what it was designed to measure.
For example, do IQ tests really measure ‘intelligence’ or do they measure performance on the test?
Internal validity - The extent to which study is free of design faults, which may affect results. Internal validity also looks at whether the IV really caused the changes to the DV or whether the results were due to extraneous variables. To have high internal validity you must make sure that you are testing what you intended to test.
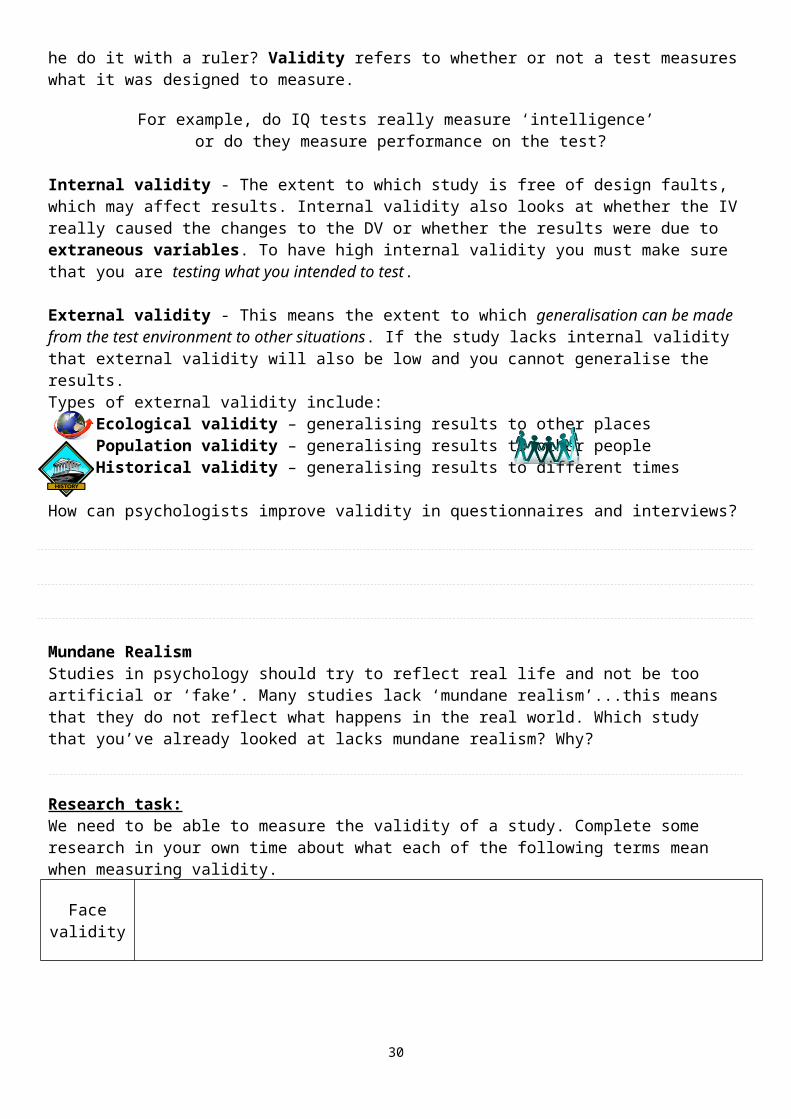
External validity - This means the extent to which generalisation can be made from the test environment to other situations. If the study lacks internal validity that external validity will also be low and you cannot generalise the results. Types of external validity include:
Ecological validity – generalising results to other placesPopulation validity – generalising results to other peopleHistorical validity – generalising results to different times
How can psychologists improve validity in questionnaires and interviews?
Mundane RealismStudies in psychology should try to reflect real life and not be too artificial or ‘fake’. Many studies lack ‘mundane realism’...this means that they do not reflect what happens in the real world. Which study that you’ve already looked at lacks mundane realism? Why?
Research task:We need to be able to measure the validity of a study. Complete some research in your own time about what each of the following terms mean when measuring validity.
Face validity
Concurrent
validity
25
Predictive validity
Extraneous variables
When psychologists carry out an experiment they must control all other factors apart from the IV. This is so that they know that the changes in the IV cause the changes in the DV.
However, sometimes there are extraneous variables (page 94-95). These are variables out of the control of the psychologist. These don’t cause problems, unless they are not controlled. If these variables cause a change in the DV, they are known as ‘confounding variables’.
Outline in the table below how participant variables can affect the DV.
Age, intelligence, motivation, experience Gender Irrelevant participant
variables
Participant
Variables
Outline in the table below how situational variables can affect the DV.
Order effects Time of day Temperature Noise
26
Situational
Variables
Extraneous variable How does it affect validity? How can it be overcome?
Situational variables (anything to do with the environment of the experiment): time of day, temperature, noise levels etc
Something about the situation of the experiment could act as an EV if it has an effect on the DV. For example, poor lighting could affect participants performance on a memory test
Situational variables can be overcome by the use of standardised procedures which ensure that all participants are tested under the same conditions.
Participants variables (anything to do with differences in the participants): age, gender, intelligence, skill, past experience, motivation, education etc.
It may be that the differences between the participants cause the change in the DV. For example, one group may perform better on a memory test than another because they are younger, or more motivated.
Participant variables can be completely removed by using a repeated measures design (the same participants are used in each condition). Matched pairs (participants in each group are matched) could also be used.
Investigator effects: this refers to how the behaviour and language of the experimenter may influence the behaviour of the participants. The way in which an experimenter asks a question might act as a cue for the participant. Also known as experimenter bias
Leading questions from the experimenter may consciously or unconsciously alter how the participant responds. For example, the experimenter may provide verbal or non verbal encouragement when the participant behaves in a way which supports the hypothesis.
Investigator effects can be overcome by using a double blind technique. This is when the person who carries out the research is not the person who designed it.
Demand characteristics: participants are often searching for cues as to how to behave in an
The structure of the experiment could lead the participant to guess the aim of the study. For example, participants may
When designing a study, it is important to try and create a situation where the
27
experiment. There could be something about the experimental situation or the behaviour of the experimenter (see investigator effects) which communicates to the participant what is “demanded” of them.
perform a memory test, be made to exercise, and then given another memory test. This may lead the participants to guess that the study is about the effect of exercise on memory, which may cause them to change their behaviour
participants will not be able to guess what the aim of the study is. This is called a single blind technique.
Participant effects: participants are aware that they are in an experiment, and so may behave unnaturally.
They may be overly helpful and want to please the experimenter. This leads to artificial behaviour. Alternatively, they may decide to go against the experimenter’s aims and deliberately act in a way which spoils the experiment. This is the “screw you” effect.
Again, by designing a study so that the participants cannot guess the aims, participant effects can be reduced.
This table will help you summarise what the main ethical issues are, problems researchers can have with them, and how they can be dealt with. Complete this table either during the presentation to help you concentrate, or after the presentation from memory. Some of the table is completed for you.
Ethical issue Explanation/definition
Problems for researchers
Ways of dealingwith this issue
Informed consent
The information given might help the
participants guess the aim of the study
and therefore change their behaviour.
Presumptive consent. Ask a group of similar people whether they would be OK with the
deception.
If certain people want to leave the study, this may bias the sample and the
results.
28

This should be for both psychological effects and physical
effects.
They should avoid these risks and stop
the study if necessary.
Confidentiality
Each person has the right to decide who
knows and who doesn’t know personal
information about them.
Sampling
Sampling refers to the process by which research psychologists attempt to select a representative group from the population. We can’t study the entire popular it would take forever, so instead a smaller group of participants must act as a representative sample. In an attempt to select a representative sample and avoid sampling bias (e.g. over representing one category of participants in a sample such as students), psychologists use different sampling techniques.
What is a target population?
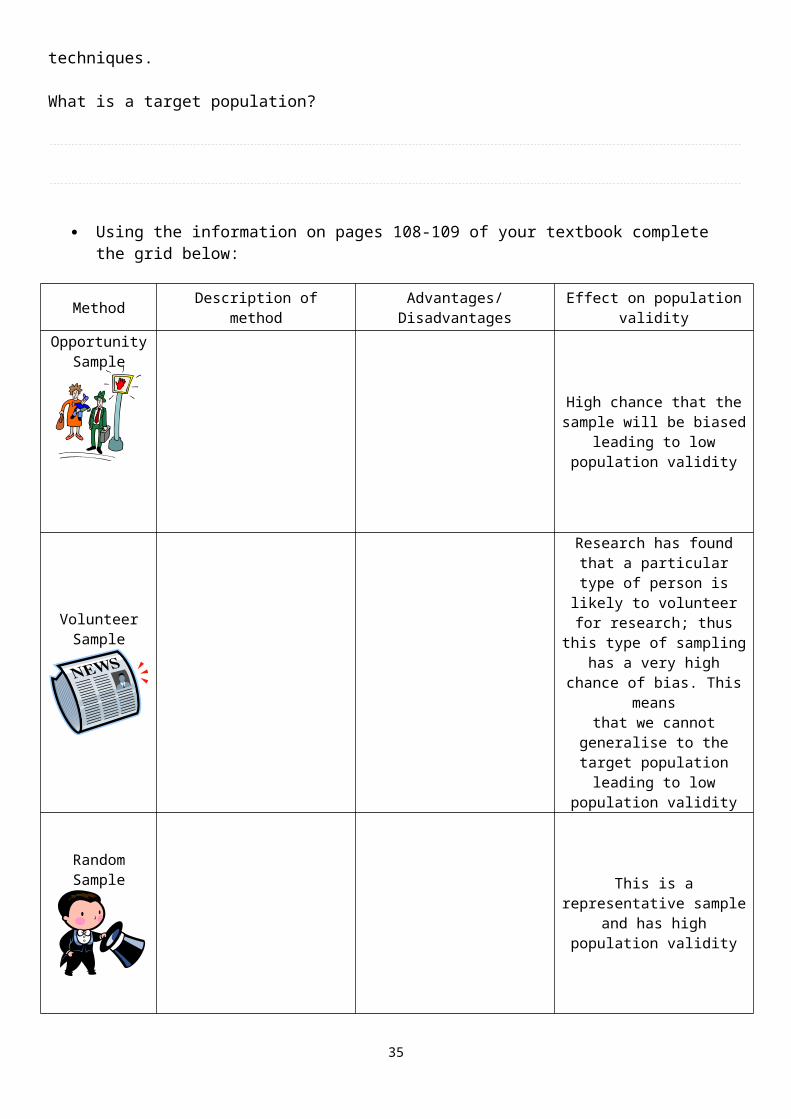
Using the information on pages 108-109 of your textbook complete the grid below:
Method Description of method Advantages/Disadvantages
Effect on population validity
29
Opportunity Sample
High chance that the sample will be biased
leading to lowpopulation validity
Volunteer Sample
Research has found that a particular type of person is likely to
volunteer for research; thus this type of
sampling has a very high chance of bias. This
meansthat we cannot
generalise to the target population leading to
low population validity
Random Sample
This is a representative sample and has high population validity
Quantitative data analysisData is the results from research. Numerical data is described as quantitative data. Data which is not numerical e.g. opinions and beliefs is qualitative. Depending on what type of data it is, the analysis will be different.
Complete the table below using page 96.
What is it? Strength of method Weakness of method
Mea
sure
s of c
entra
l
Mean
The mean is the most sensitive measure of central tendency, taking all scores into account.
Mode Similar to the median, the mode is unaffected by extreme scores.
30

tend
ency
Median
Unlike the mean the median only takes one or two scores into account – the middle value(s).
Mea
sure
s of d
isper
sion
Range Easy to calculate
Standard Deviation
A small standard deviation indicates that the results are reliable.It uses all of the scores.
Complete research method questions box 3.8 on page 96 in your textbook
Example exam question: A researcher carried out an experiment to investigate how many numbers could be held in short-term memory. The participants were 15 children and 15 adults. Participants were asked to repeat lists of random numbers, in the correct order, as soon as they were read out by the researcher. For example, when the researcher said, “3, 4, 2, 8” the participant immediately repeated “3, 4, 2, 8”. When the researcher then said,“7, 5, 9, 6, 4” the participant immediately repeated “7, 5, 9, 6, 4”. One number was added to the list each time until participants were unable to recall the list correctly. Each participant’s maximum digit span was recorded. Write the mode for each group in the
table below:Age group Mode
Children Adults
Graphs
You will sometimes be asked to sketch a graph or interpret a set of data in the exam. Make sure you are familiar with each of the graphs below.
Histograms
31

Themes are grouped into categories and conclusions are drawnStatements are compared to see if there are similarities, these are grouped together (called themes)Information is compressed into brief statements (called codes) Any similar information is grouped together
Used to represent data on a ‘continuous’ scale
Columns touch because each one forms a single score (interval) on a related scale, e.g., time - number of hours of homework students do each week
Scores (intervals) are placed on the x-axis
The height of the column shows the frequency of values, e.g., number of students in each interval – this goes on the y-axis
Bar Charts
Used to represent ‘discrete data’ where the data is in categories, which are placed on the x-axis
The mean or frequency is on the y-axis
Columns do not touch and have equal width and spacing
Examples:o Differences in males/females
on a spatial tasko Score on a depression scale
before and after treatment
Scattergrams
Used for measuring the relationship between two variables
Data from one variable is presented on the x-axis, while the other is presented on the y-axis
We plot an ‘x’ on the graph where the two variables meet
The pattern of plotted points reveals different types of correlation, e.g., positive, negative or no relationship.
Content Analysis
There are four steps to content analysis…
32
0 1 2 3 4 5 6 7 8 9 1005
1015202530
Histogram showing number of hours spent doing homework in a survey of
students
Homework (hours per week)
Num
ber o
f stu
dent
s (fr
eque
ncy)
Without Caffeine Group
With Caffeine Group
0.1
1
10
A bar chart showing the difference in reaction times between groups given a caffeine drink
or notM
ean
reac
tion
time
( sec
s)
0 20 40 60 80 100 120 140 160 180 2000
10203040506070
Scattergram showing correlation between stress and absenteeism from work
Stress score
Days
off
wor
k pe
r yea
r
What is an advantage of content analysis?
What is a weakness of content analysis?
Content analysis of the media’s reporting of crimeYou will be conducting a content analysis of two newspapers. You will be investigating whether the two types of newspapers report crime differently. InstructionsStep 1: What crimes do you think would be reported in newspapers?Step 2: What characteristics of the crime would be reported (e.g. age/sex of victim etc)?Step 3: Pick two newspapers that you will analyse (e.g. one national and regional paper, tabloid and broadsheet, red top and broadsheet). You will need to bring these papers in with you next lesson. Step 4: Design your content analysis sheet on A3 paper. It will look a bit like
the one belowType of Crime
Crime CharacteristicsMurder Sexual assault
Age of VictimSex of Victim
Age of OffenderSex of Offender
Step 5: Conduct the content analysis using the papers. Step 6: Write a report on what you have found. The report should cover the following points:
Are there any similarities between the two papers? Are there any differences between the two papers? Can you explain why these differences might be? Are there any implications from your findings? Are there any issues with the content analysis as a method? What are its strengths and weaknesses?
Qualitative DataQuantitative research uses methods that measure amounts of behaviour usually assigning a value to what is being measured. Qualitative research uses smaller samples than quantitative research but usually involves the collection of large amounts of data. Audio, written and visual data can be collected.
It is important to summarise the enormous amount of data collected.
Step 1: Categorise the dataPre-existing categories – the researcher decides on the categories before the research.
33

Emergent categories – categories emerge when examining the data.
Step 2: Behavioural categories are used to summarise the dataThe categories or themes are listed.Examples of each type of behavior are represented with a quotation.Frequencies of each category may be counted and this turns qualitative into quantitative data.
Step 3: Conclusions are drawn
Use pg. 119 to record the advantages and disadvantages of qualitative and quantitative data.
Type of data Advantages Disadvantages
Quan
titat
ive
Qual
itativ
e
PSYA1 – Research Methods ChecklistUse this checklist to ensure that you have covered all the areas needed for success in your exams. The following topics will be covered in class. However, it will be your responsibility to catch up with any topics you miss and to actively revise the different areas.
Topic Area Covered in Class
Revised
Methods and Techniques34
Experimental method, including laboratory, field and natural experiments
Studies using a correlational analysis
Observational techniques
Self-report techniques including questionnaire and interview
Case studies
Investigation Design
Aims
Hypotheses, including directional and non-directional
Experimental design (independent groups, repeated measures and matched pairs)Design of naturalistic observations, including the development and use of behavioural categoriesDesign of questionnaires and interviews
Operationalisation of variables, including independent and dependent variables
Pilot studies
Control of extraneous variables
Reliability and validity
Awareness of the British Psychological Society (BPS) Code of Ethics
Ethical issues and ways in which psychologists deal with themSelection of participants and sampling techniques, including random, opportunity and volunteer samplingDemand characteristics and investigator effects
Data Analysis and InvestigationPresentation and interpretation of quantitative data including graphs, scattergrams and tablesAnalysis and interpretation of quantitative data. Measures of central tendency including median, mean, mode. Measures of dispersion including ranges and standard deviationAnalysis and interpretation of correlational data. Positive and negative correlations and the interpretation of correlation coefficientsPresentation of qualitative data
Processes involved in content analysis
35