Embed Size (px)
Citation preview

Singapore , 26-27 July 2012
ASEAN MEDIA FORUM
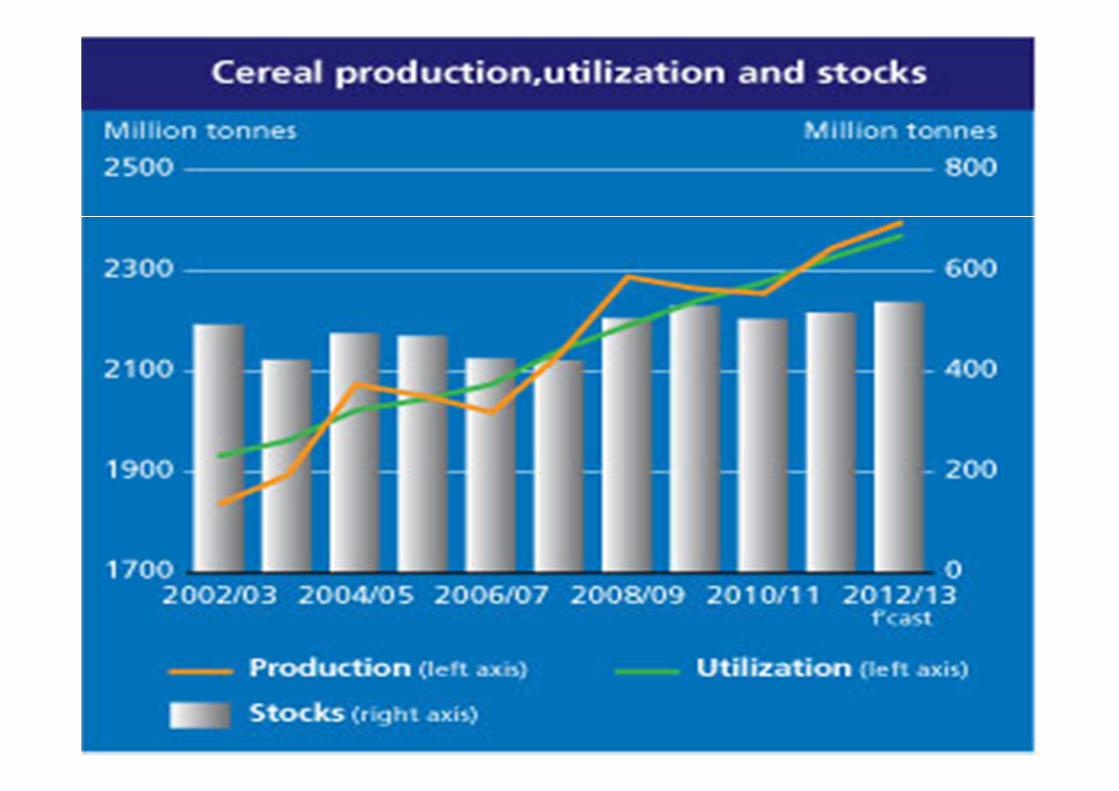
Review of Global and Regional Food
Security Situation and Future Outlook
Hiroyuki Konuma
FAO Assistant Director- General and Regional
Representative for Asia and the Pacific
2
3
4
5
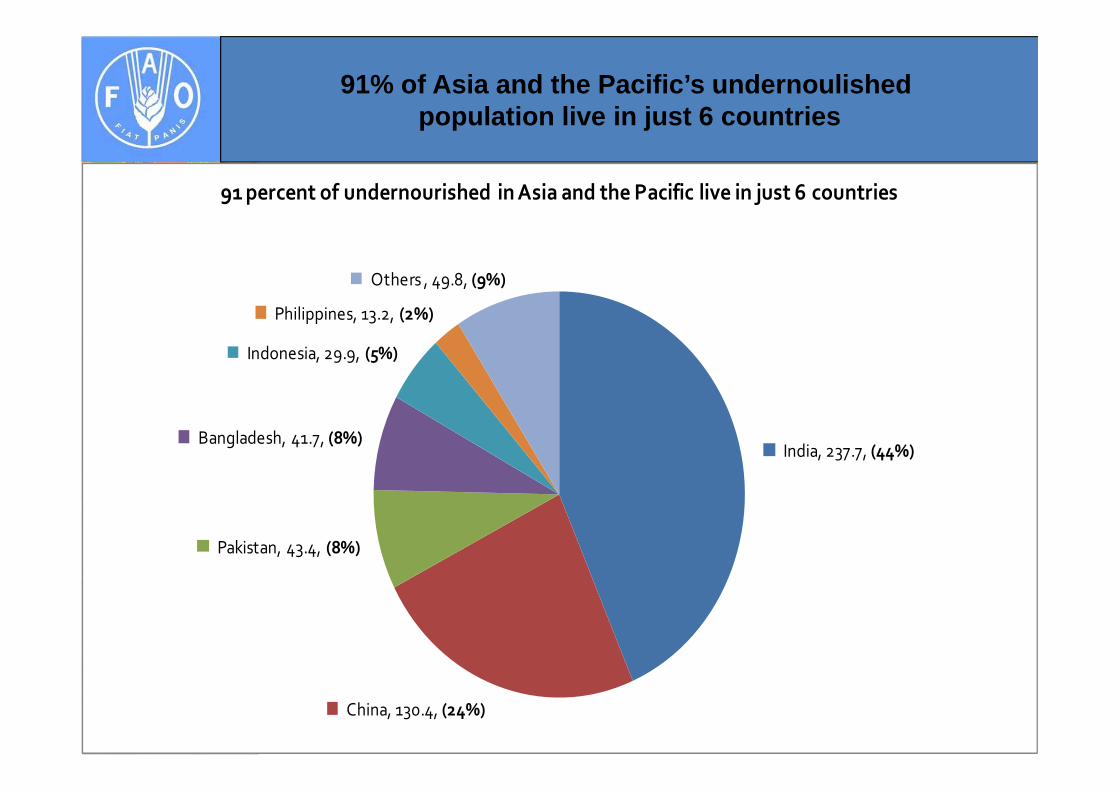
India, 237.7, (44%)
China, 130.4, (24%)
Pakistan, 43.4, (8%)
Bangladesh, 41.7, (8%)
Indonesia, 29.9, (5%)
Philippines, 13.2, (2%)
Others , 49.8, (9%)
91 percent of undernourished in Asia and the Pacific live in just 6 countries
91% of Asia and the Pacific’s undernoulished population live in just 6 countries
6
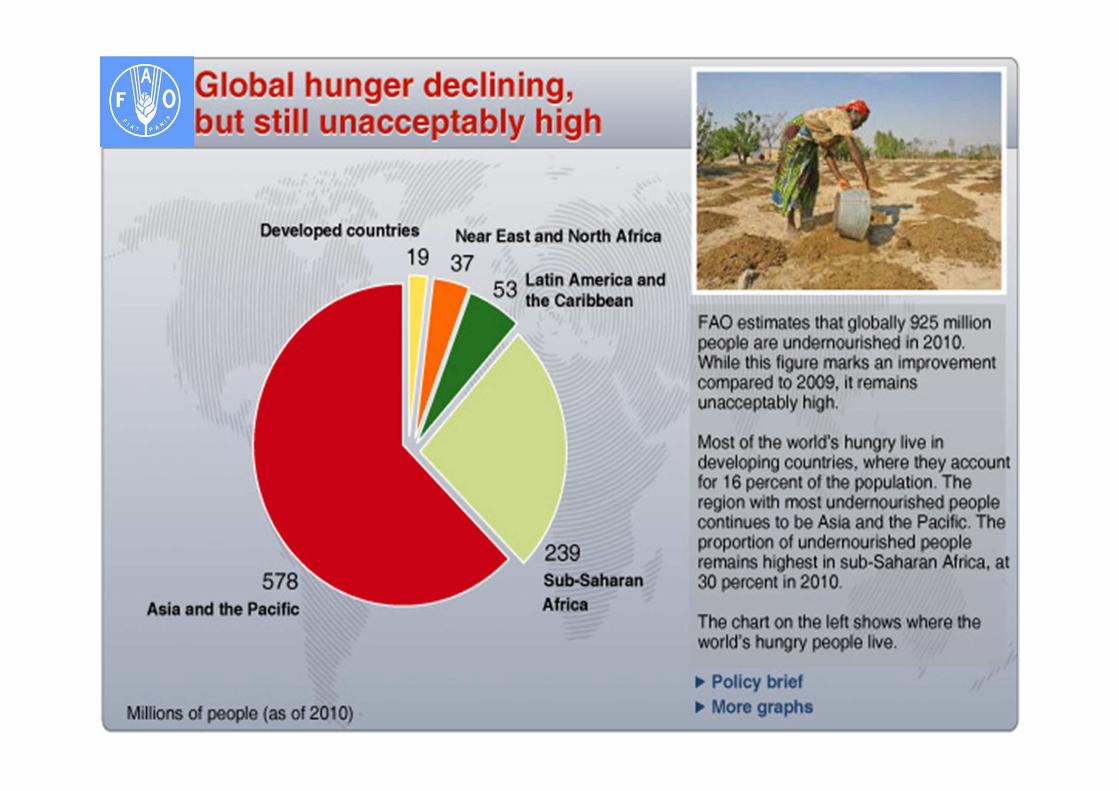
Asia and the Pacific is the home of 62 percent (2/3)of world hungry population,
despite remarkable
economic growth
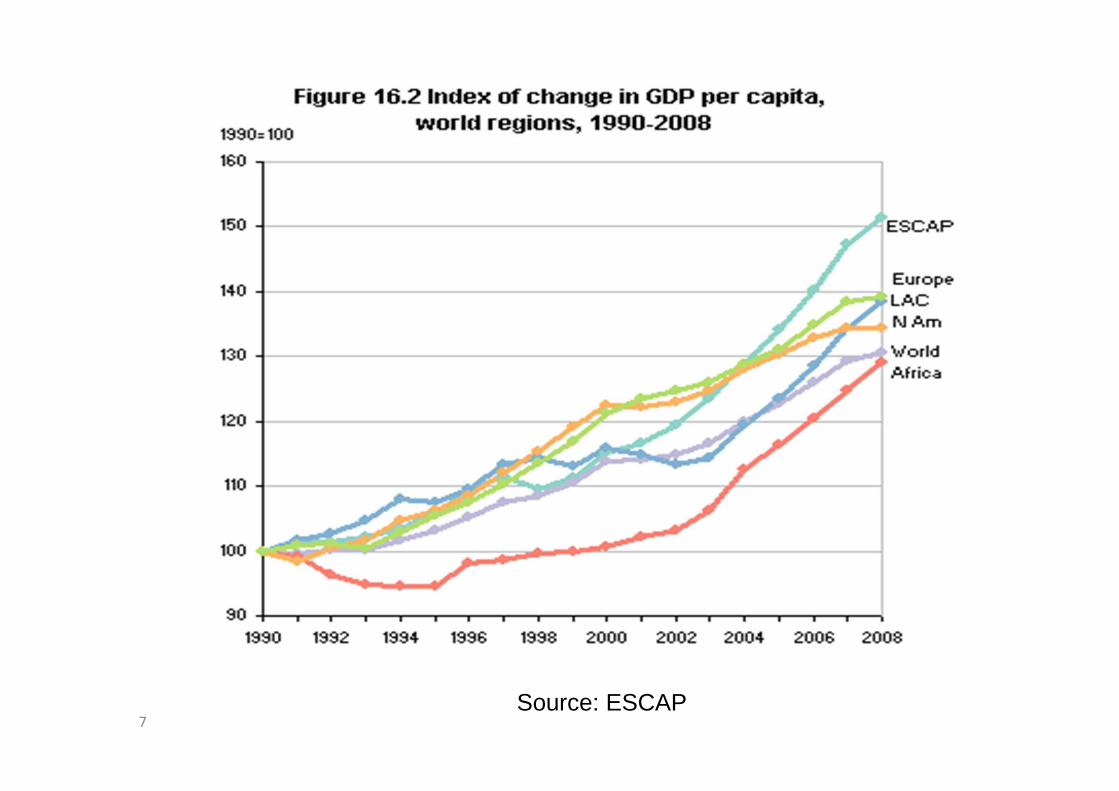
7Source: ESCAP
8
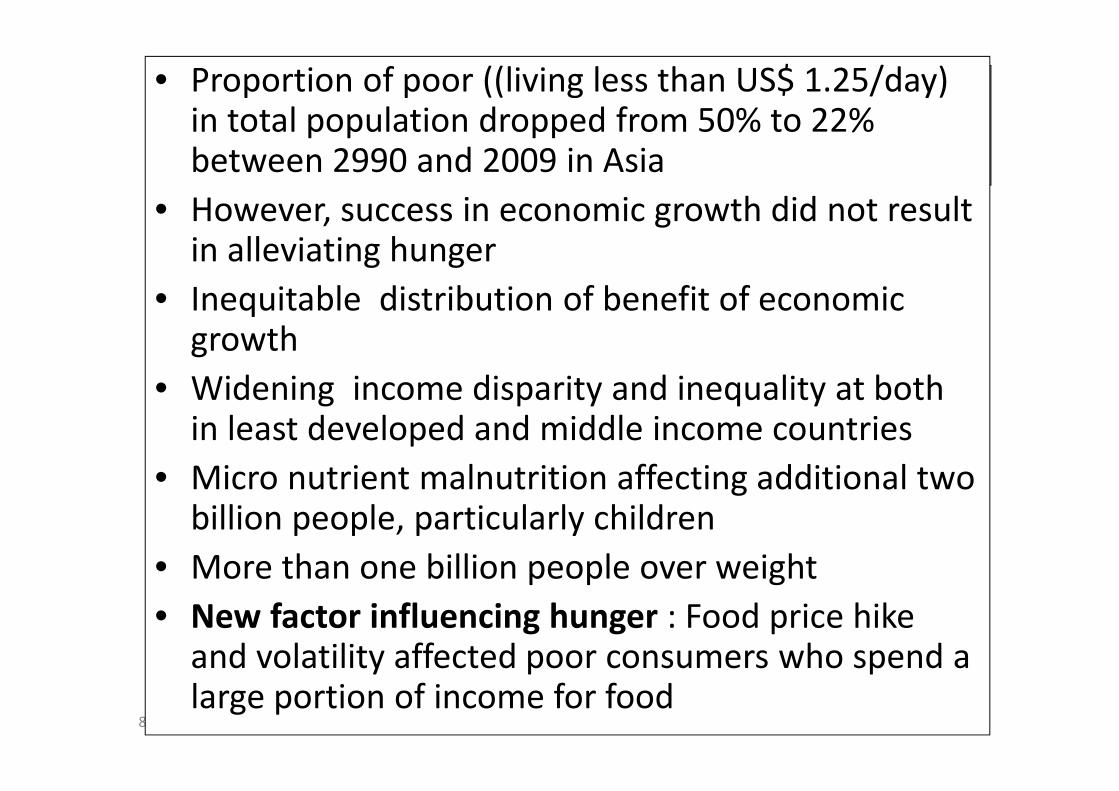
Poor consumers• Proportion of poor ((living less than US$ 1.25/day)
in total population dropped from 50% to 22% between 2990 and 2009 in Asia
• However, success in economic growth did not result in alleviating hunger
• Inequitable distribution of benefit of economic growth
• Widening income disparity and inequality at both in least developed and middle income countries
• Micro nutrient malnutrition affecting additional two billion people, particularly children
• More than one billion people over weight
• New factor influencing hunger : Food price hike and volatility affected poor consumers who spend a large portion of income for food
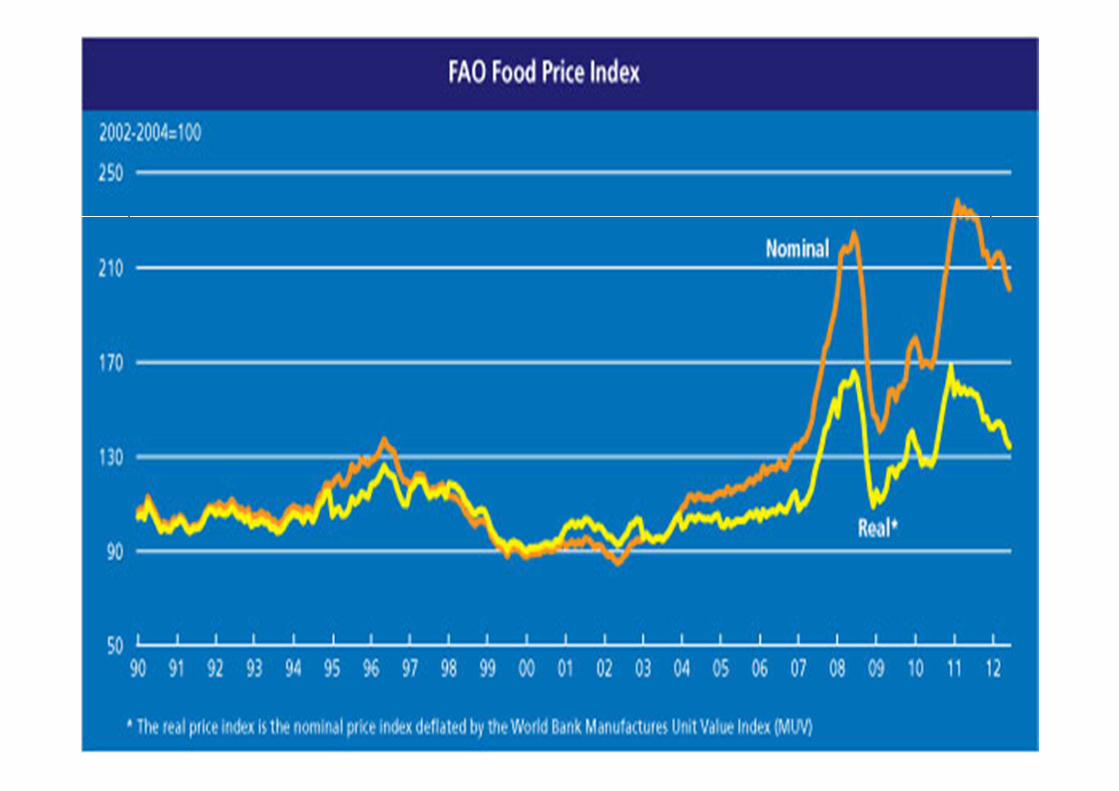
Food prices are high and volatile
Food prices are high and volatile(still remains 2 times high from 10 years ago)
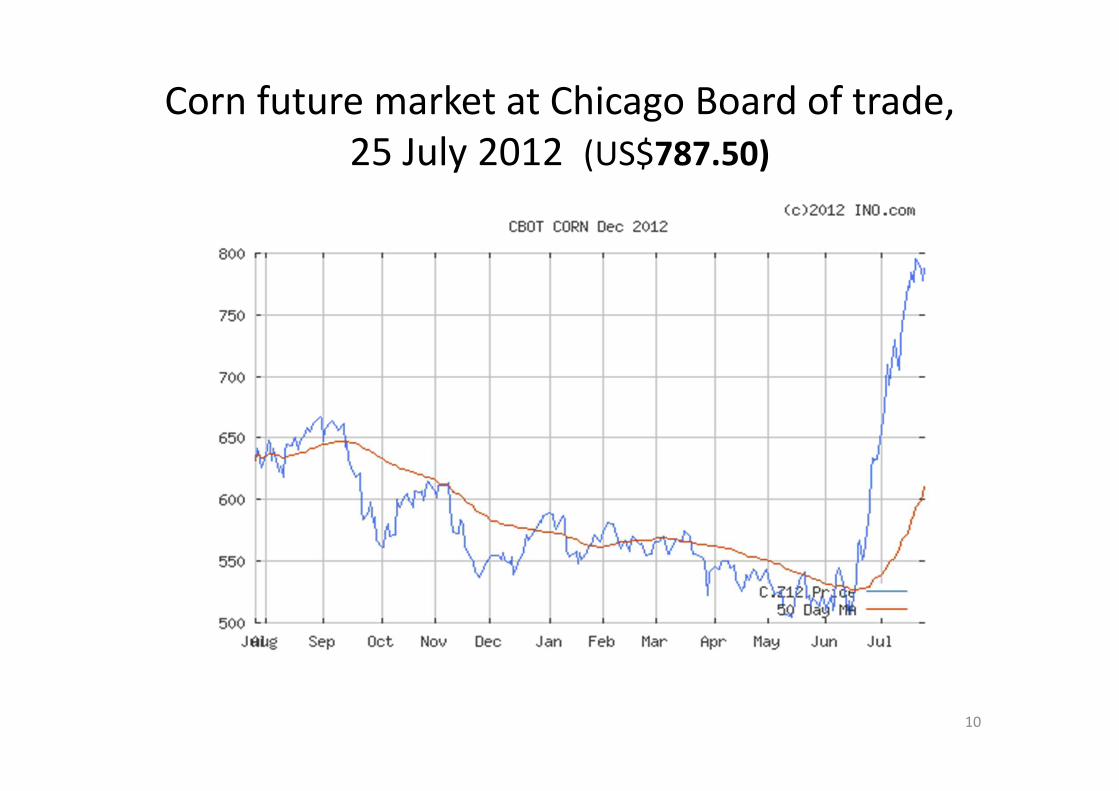
Corn future market at Chicago Board of trade,
25 July 2012 (US$787.50)
10
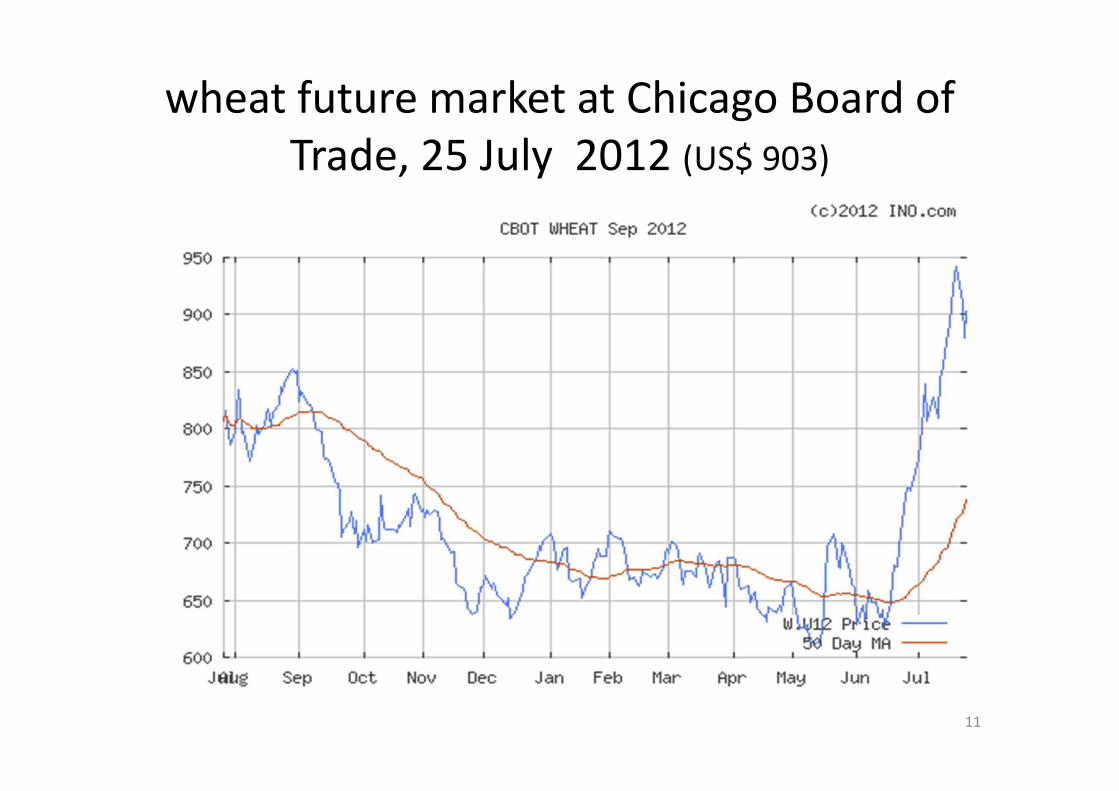
wheat future market at Chicago Board of
Trade, 25 July 2012 (US$ 903)
11
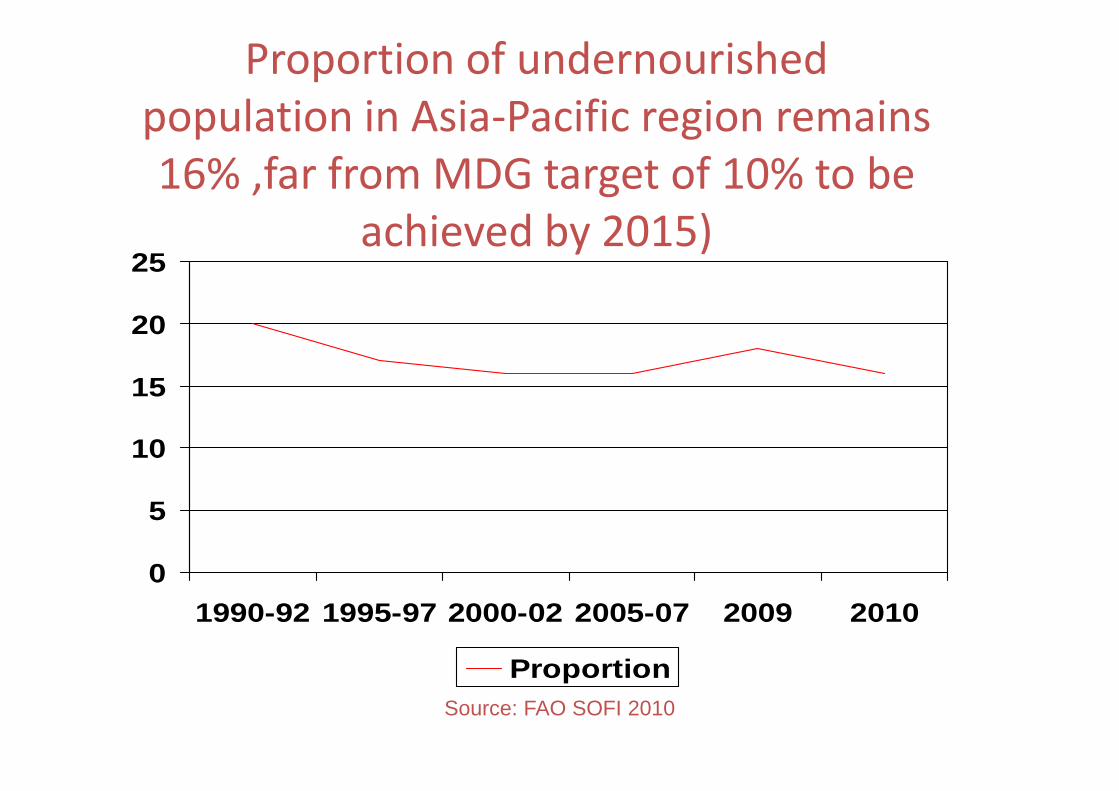
Proportion of undernourished
population in Asia-Pacific region remains
16% ,far from MDG target of 10% to be
achieved by 2015)
0
5
10
15
20
25
1990-92 1995-97 2000-02 2005-07 2009 2010
ProportionSource: FAO SOFI 2010
Can we produce sufficient
food to meet the demand
of growing future
population?
13
14
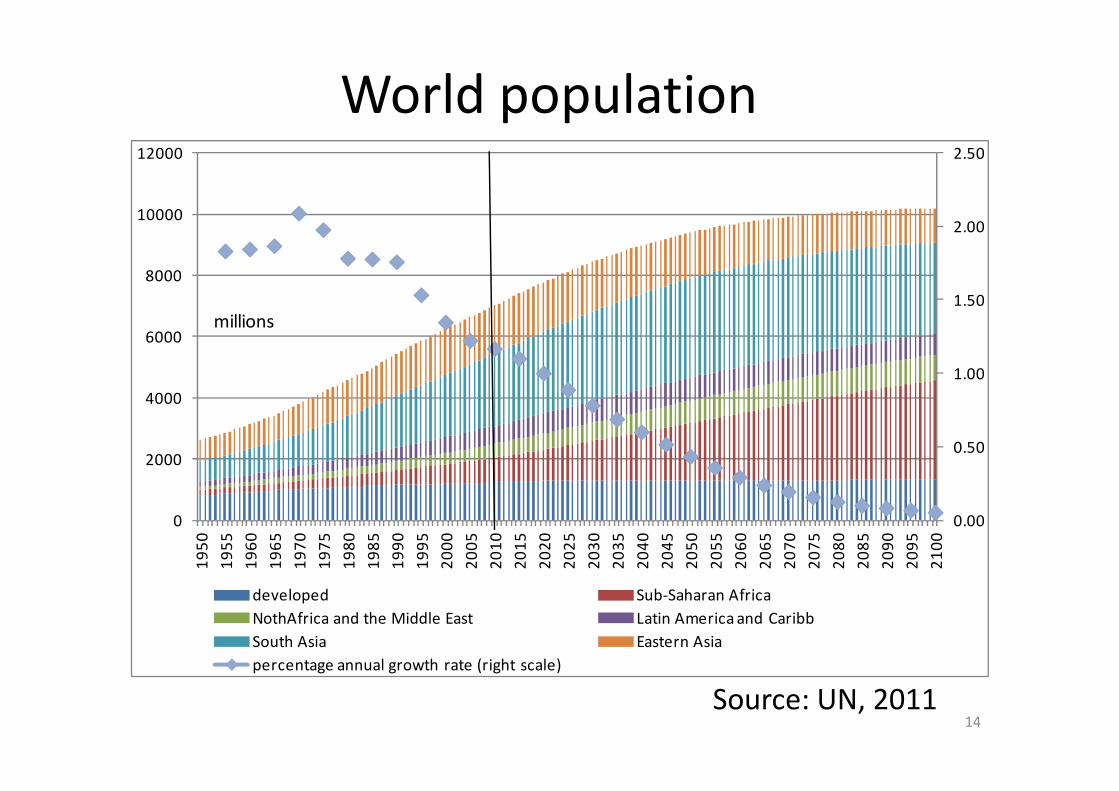
World population
Source: UN, 2011
0.00
0.50
1.00
1.50
2.00
2.50
0
2000
4000
6000
8000
10000
12000
19
50
19
55
19
60
19
65
19
70
19
75
19
80
19
85
19
90
19
95
20
00
20
05
20
10
20
15
20
20
20
25
20
30
20
35
20
40
20
45
20
50
20
55
20
60
20
65
20
70
20
75
20
80
20
85
20
90
20
95
21
00
developed Sub-Saharan Africa
NothAfrica and the Middle East Latin America and Caribb
South Asia Eastern Asia
percentage annual growth rate (right scale)
millions
15
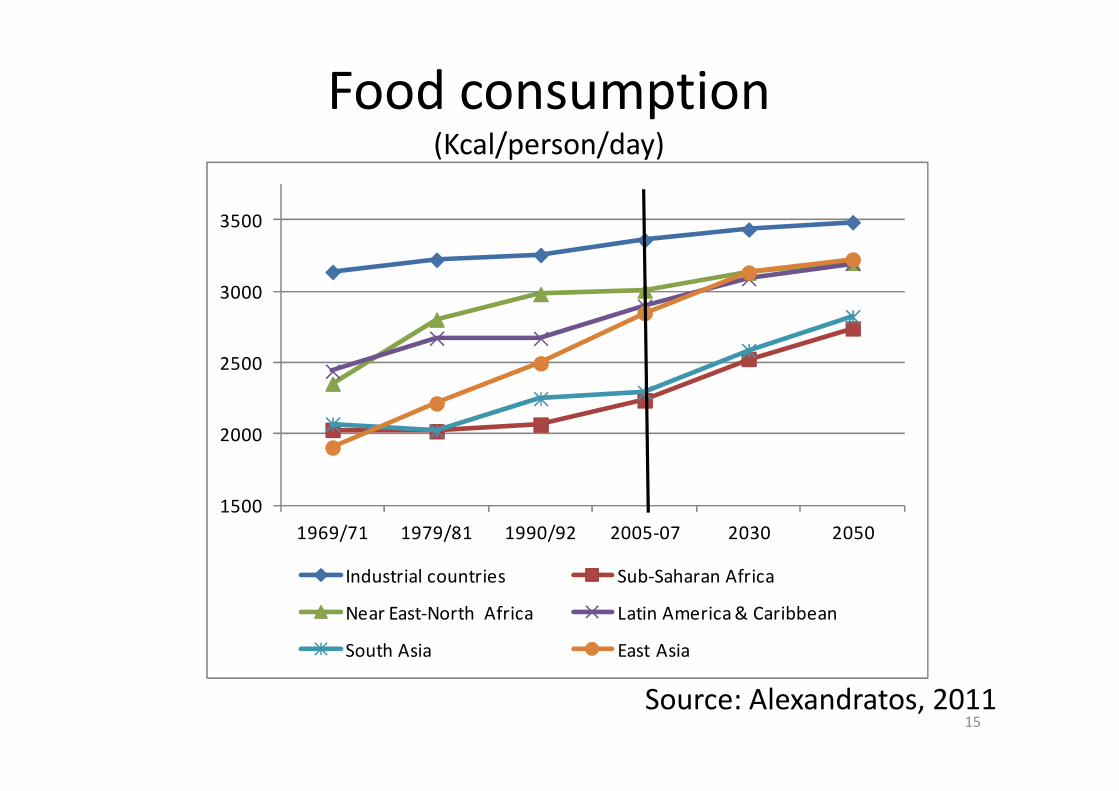
Food consumption(Kcal/person/day)
Source: Alexandratos, 2011
1500
2000
2500
3000
3500
1969/71 1979/81 1990/92 2005-07 2030 2050
Industrial countries Sub-Saharan Africa
Near East-North Africa Latin America & Caribbean
South Asia East Asia
16
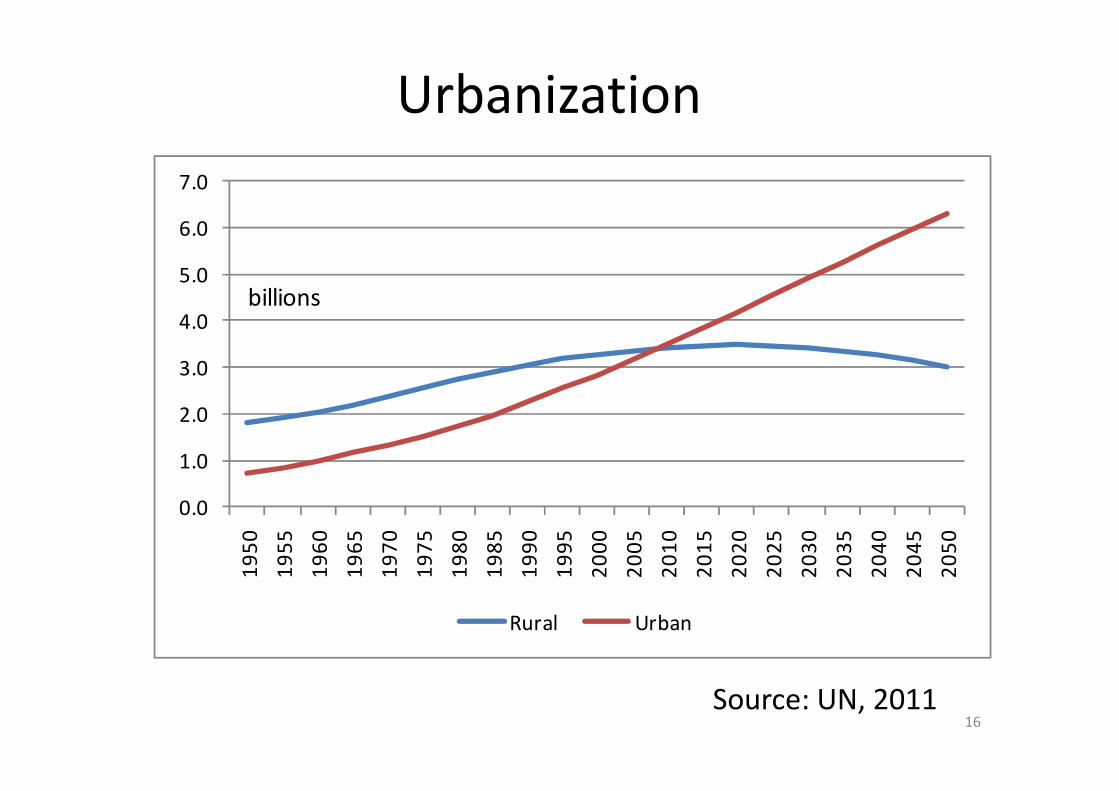
Urbanization
Source: UN, 2011
0.0
1.0
2.0
3.0
4.0
5.0
6.0
7.0
19
50
19
55
19
60
19
65
19
70
19
75
19
80
19
85
19
90
19
95
20
00
20
05
20
10
20
15
20
20
20
25
20
30
20
35
20
40
20
45
20
50
Rural Urban
billions
17
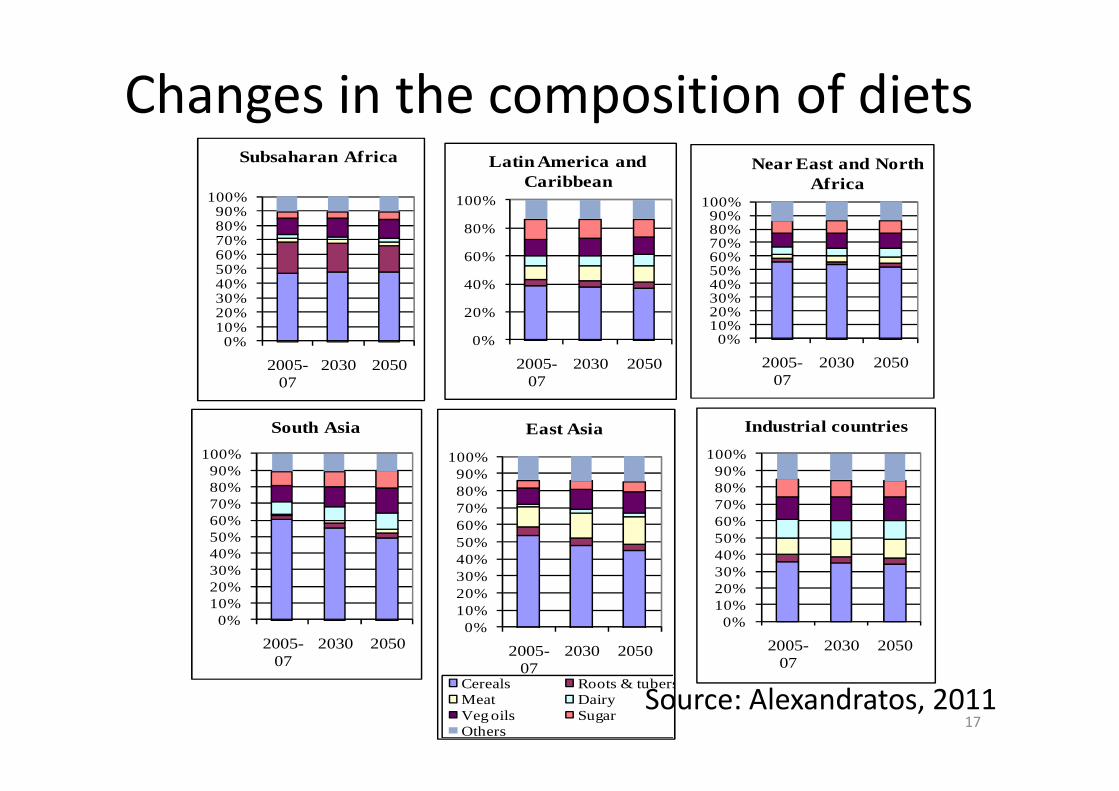
Changes in the composition of diets
0%10%20%30%40%50%60%70%80%90%
100%
2005-07
2030 2050
Near East and North Africa
0%
20%
40%
60%
80%
100%
2005-07
2030 2050
Latin America and Caribbean
0%10%20%30%40%50%60%70%80%90%
100%
2005-07
2030 2050
South Asia
0%10%20%30%40%50%60%70%80%90%
100%
2005-07
2030 2050
East Asia
Cereals Roots & tubersMeat Dairy Veg oils SugarOthers
0%10%20%30%40%50%60%70%80%90%
100%
2005-07
2030 2050
Industrial countries
0%10%20%30%40%50%60%70%80%90%
100%
2005-07
2030 2050
Subsaharan Africa
Source: Alexandratos, 2011
18
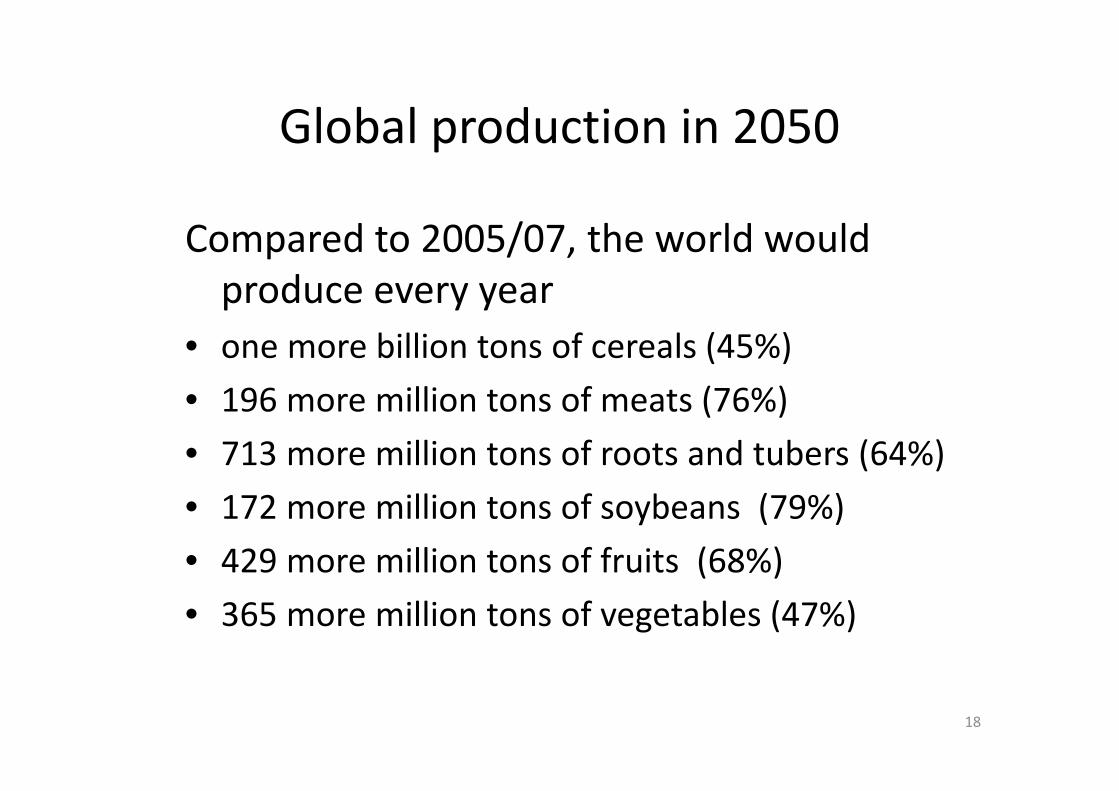
Global production in 2050
Compared to 2005/07, the world would
produce every year
• one more billion tons of cereals (45%)
• 196 more million tons of meats (76%)
• 713 more million tons of roots and tubers (64%)
• 172 more million tons of soybeans (79%)
• 429 more million tons of fruits (68%)
• 365 more million tons of vegetables (47%)
19
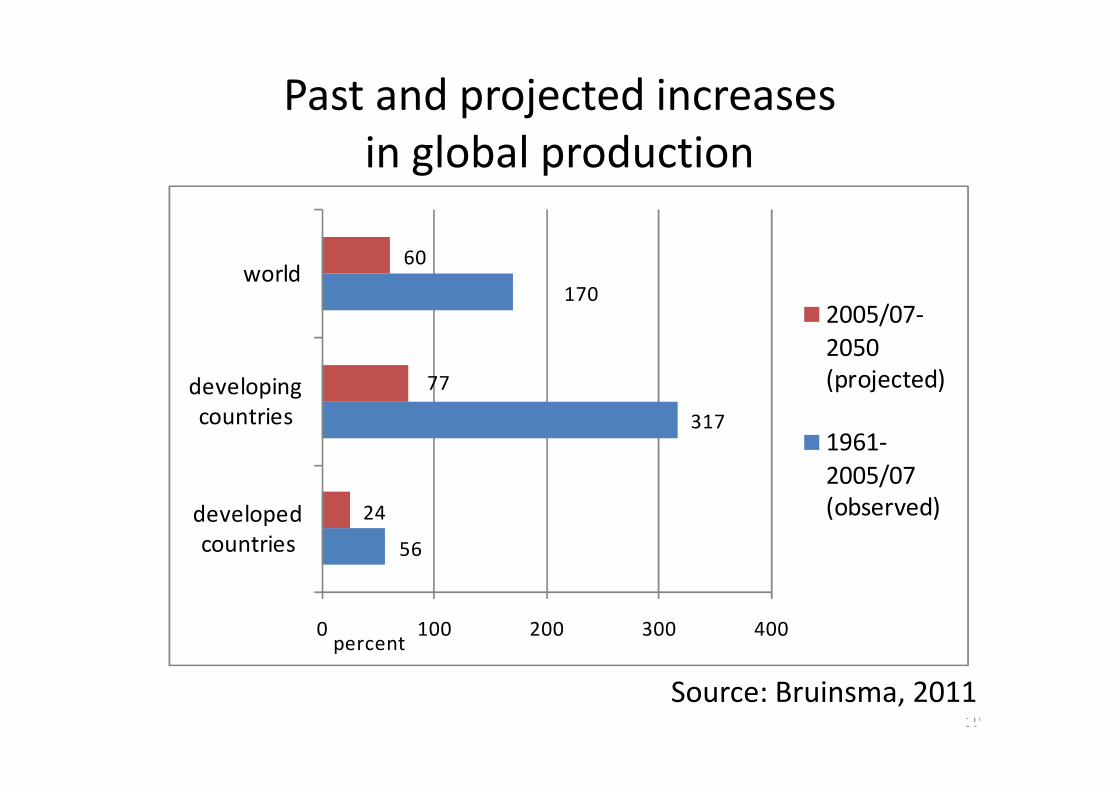
Past and projected increases
in global production
56
317
170
24
77
60
0 100 200 300 400
developed
countries
developing
countries
world
percent
2005/07-
2050
(projected)
1961-
2005/07
(observed)
Source: Bruinsma, 2011
20
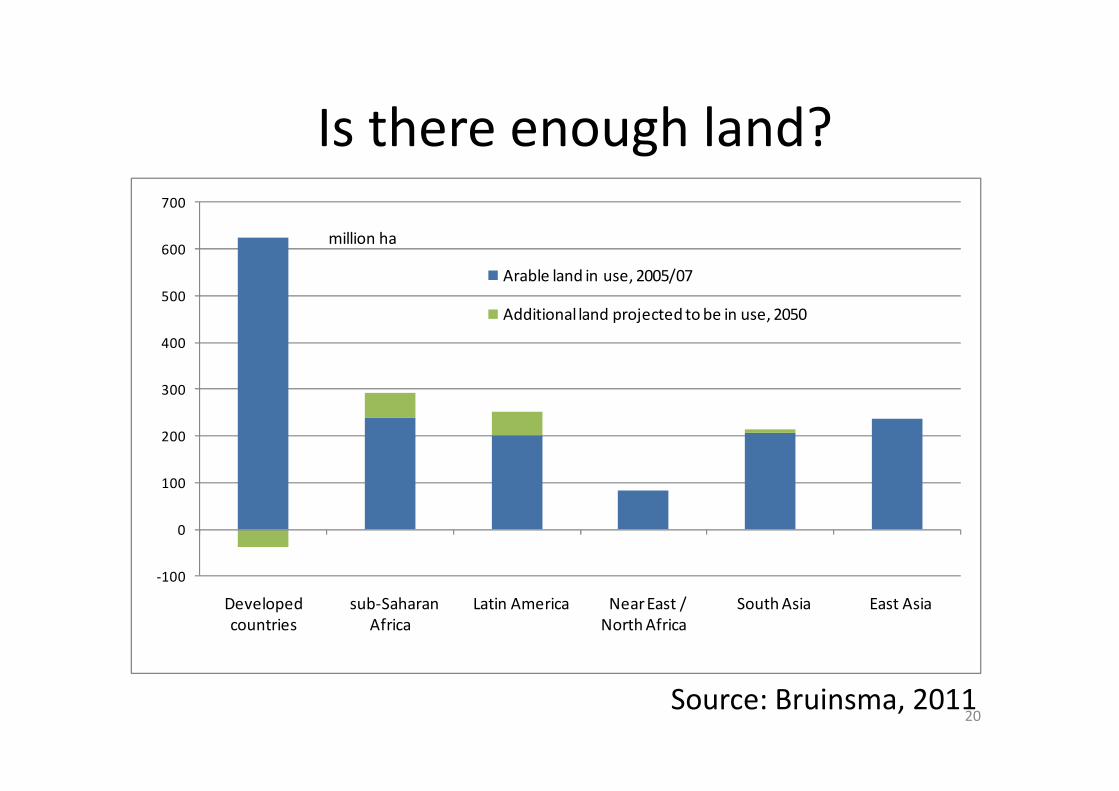
Is there enough land?
-100
0
100
200
300
400
500
600
700
Developed
countries
sub-Saharan
Africa
Latin America Near East /
North Africa
South Asia East Asia
Arable land in use, 2005/07
Additional land projected to be in use, 2050
million ha
Source: Bruinsma, 2011
21
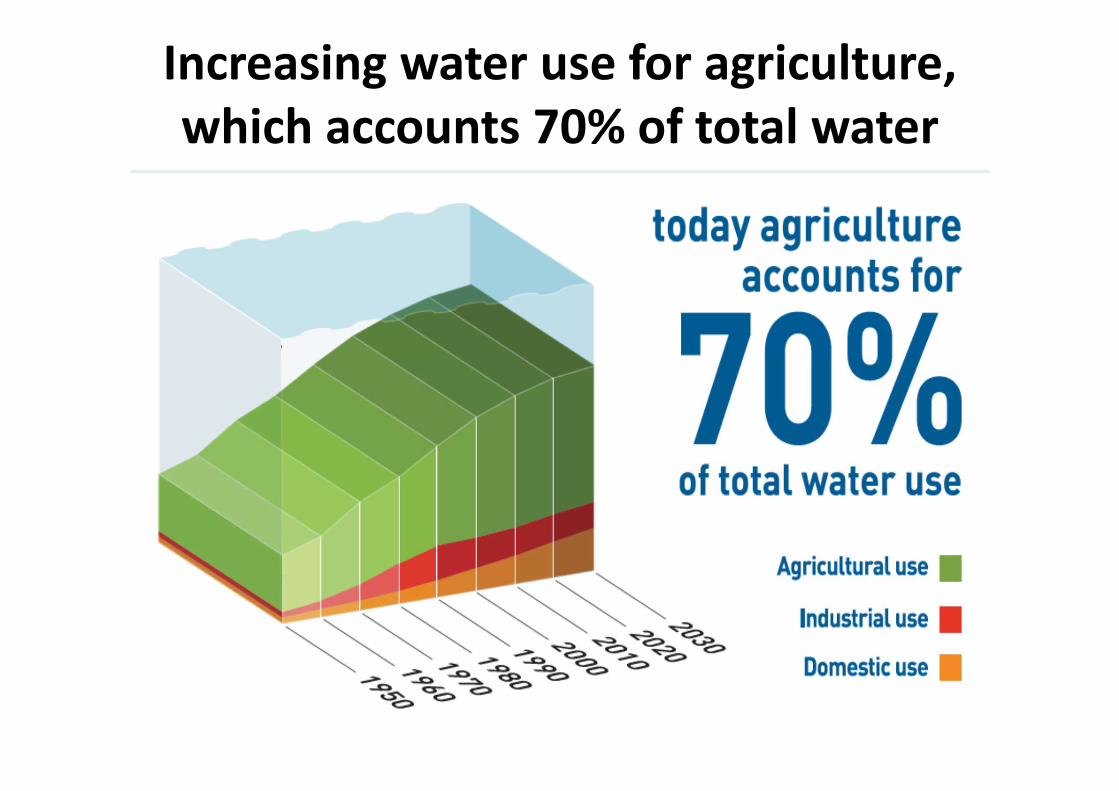
Increasing water use for agriculture,
which accounts 70% of total water
use
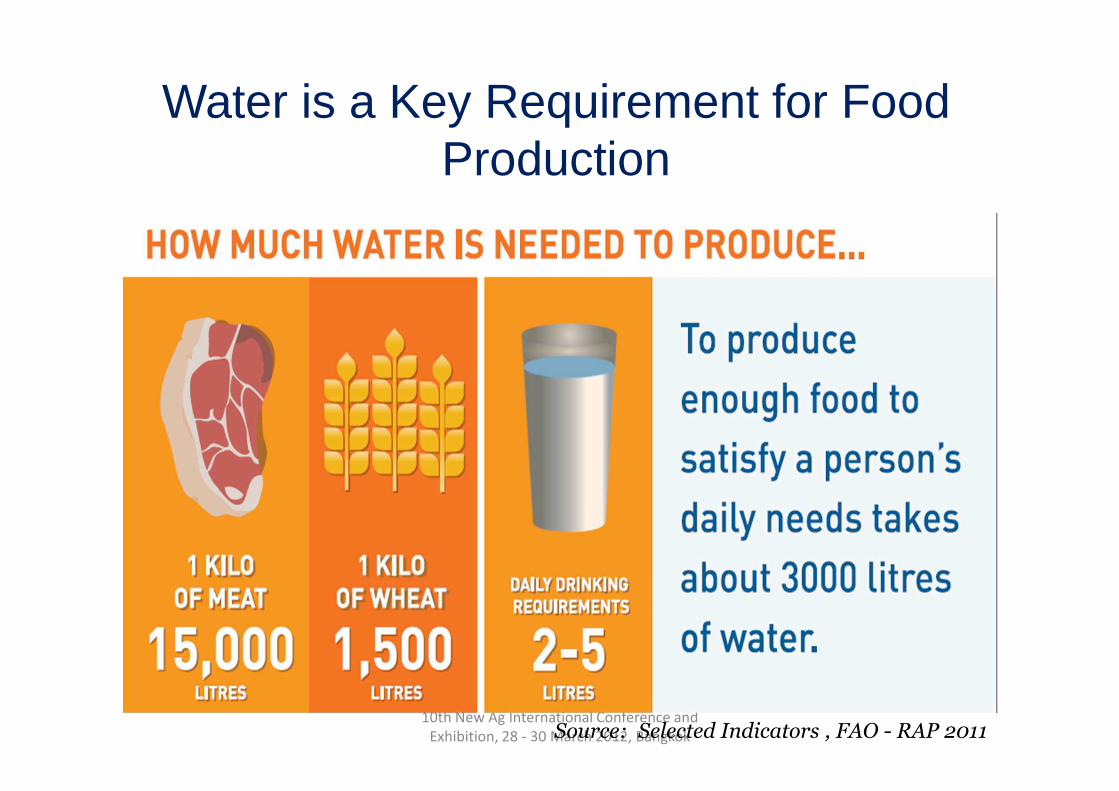
10th New Ag International Conference and
Exhibition, 28 - 30 March 2012, BangkokSource: Selected Indicators , FAO - RAP 2011
Water is a Key Requirement for Food Production
23
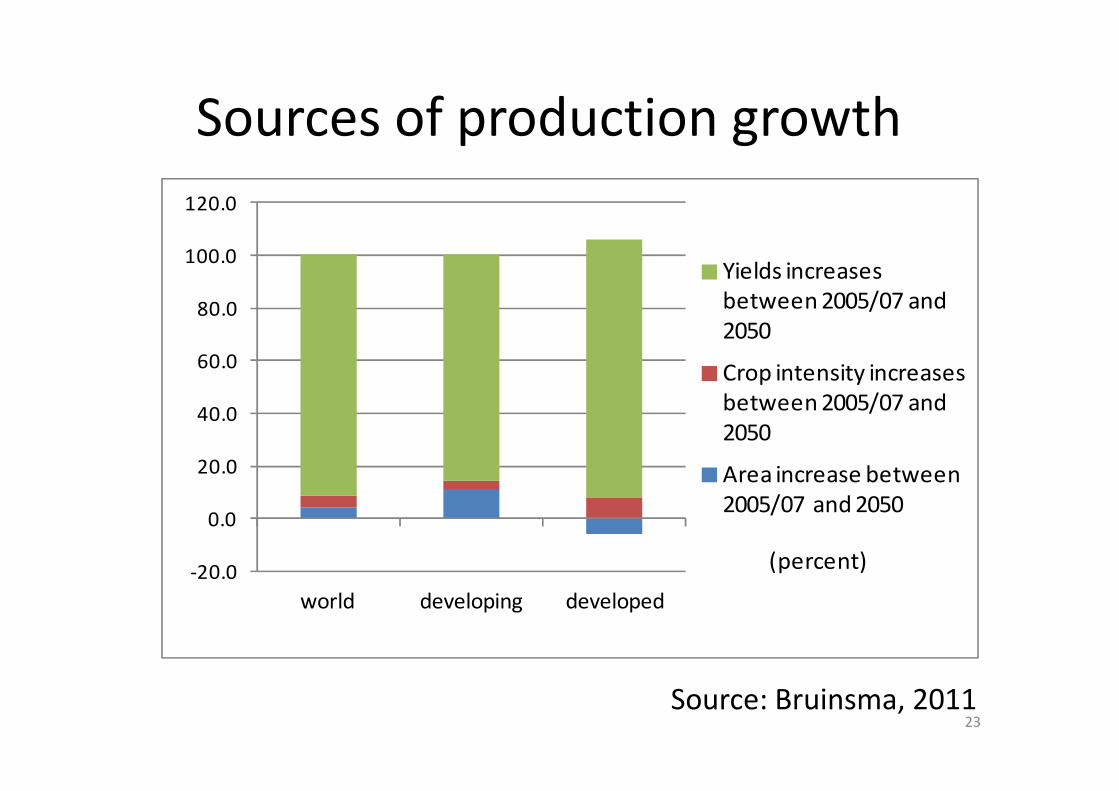
Sources of production growth
Source: Bruinsma, 2011
-20.0
0.0
20.0
40.0
60.0
80.0
100.0
120.0
world developing developed
(percent)
Yields increases
between 2005/07 and
2050
Crop intensity increases
between 2005/07 and
2050
Area increase between
2005/07 and 2050
24
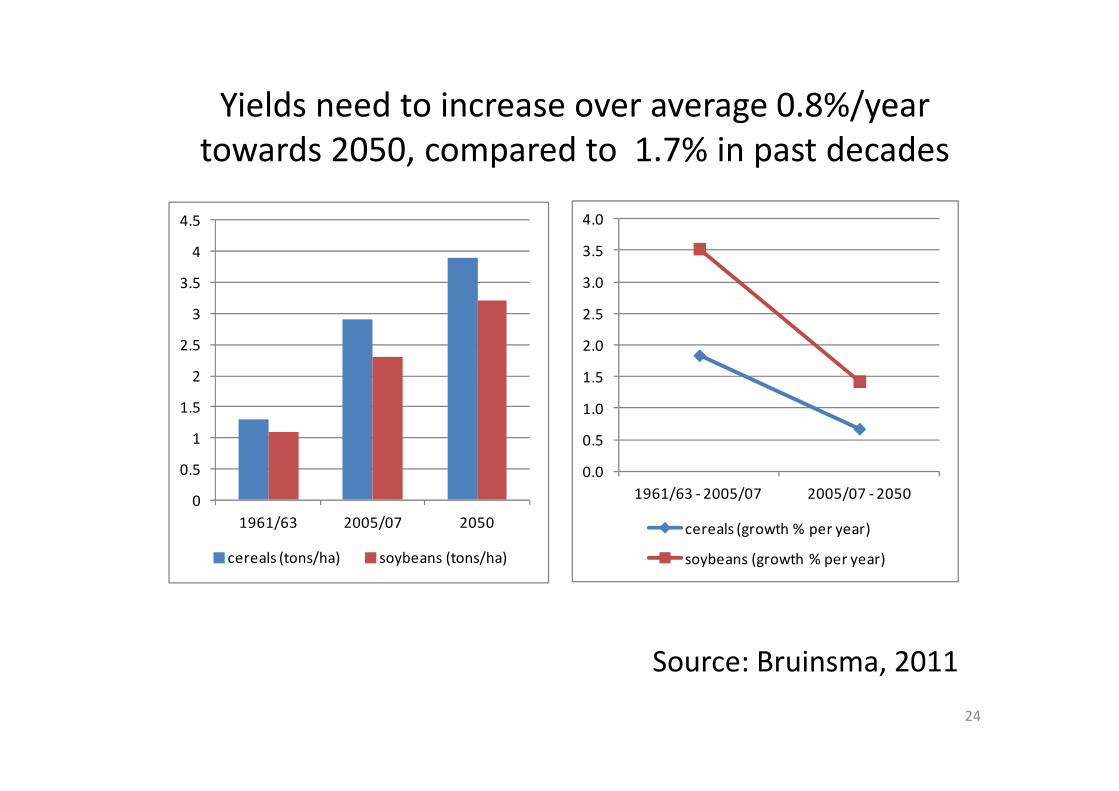
Yields need to increase over average 0.8%/year
towards 2050, compared to 1.7% in past decades
0
0.5
1
1.5
2
2.5
3
3.5
4
4.5
1961/63 2005/07 2050
cereals (tons/ha) soybeans (tons/ha)
0.0
0.5
1.0
1.5
2.0
2.5
3.0
3.5
4.0
1961/63 - 2005/07 2005/07 - 2050
cereals (growth % per year)
soybeans (growth % per year)
Source: Bruinsma, 2011
Uncertainties( uncertain factors influencing future food security)
• Crude oil prices hike
• Food price volatility
• Impact of climate changes
• Bio-fuel development
• etc…….25
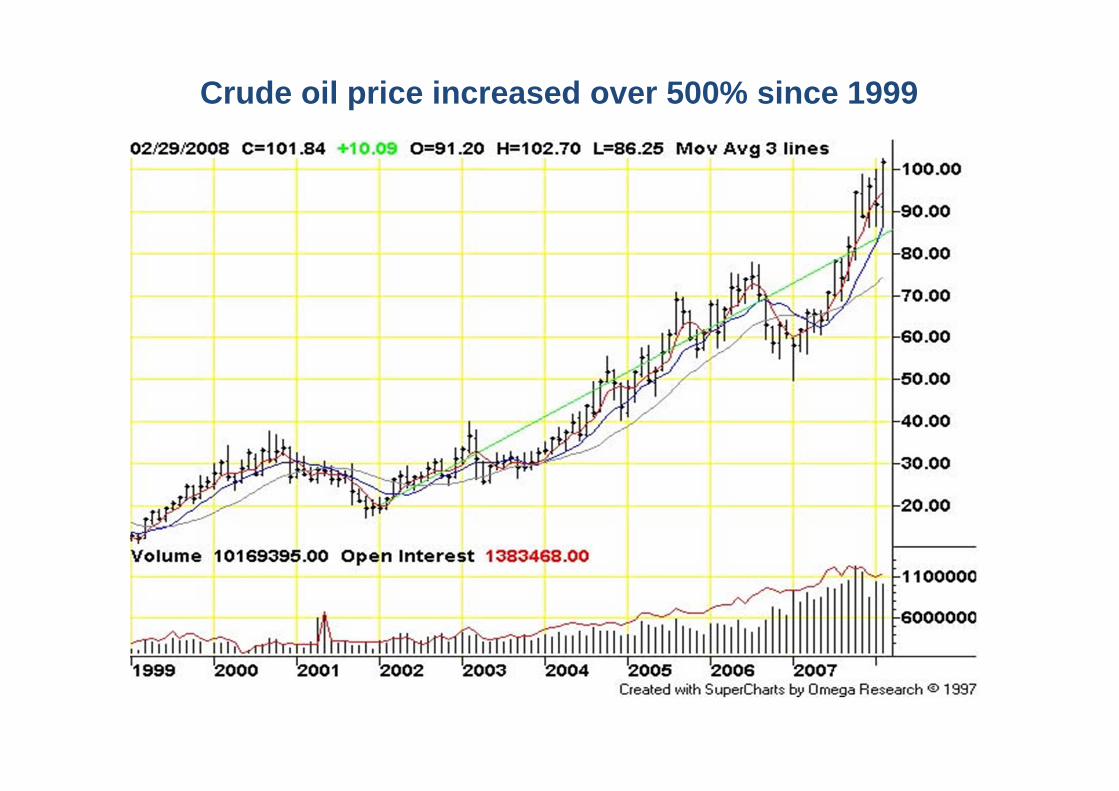
Crude oil price increased over 500% since 1999
27
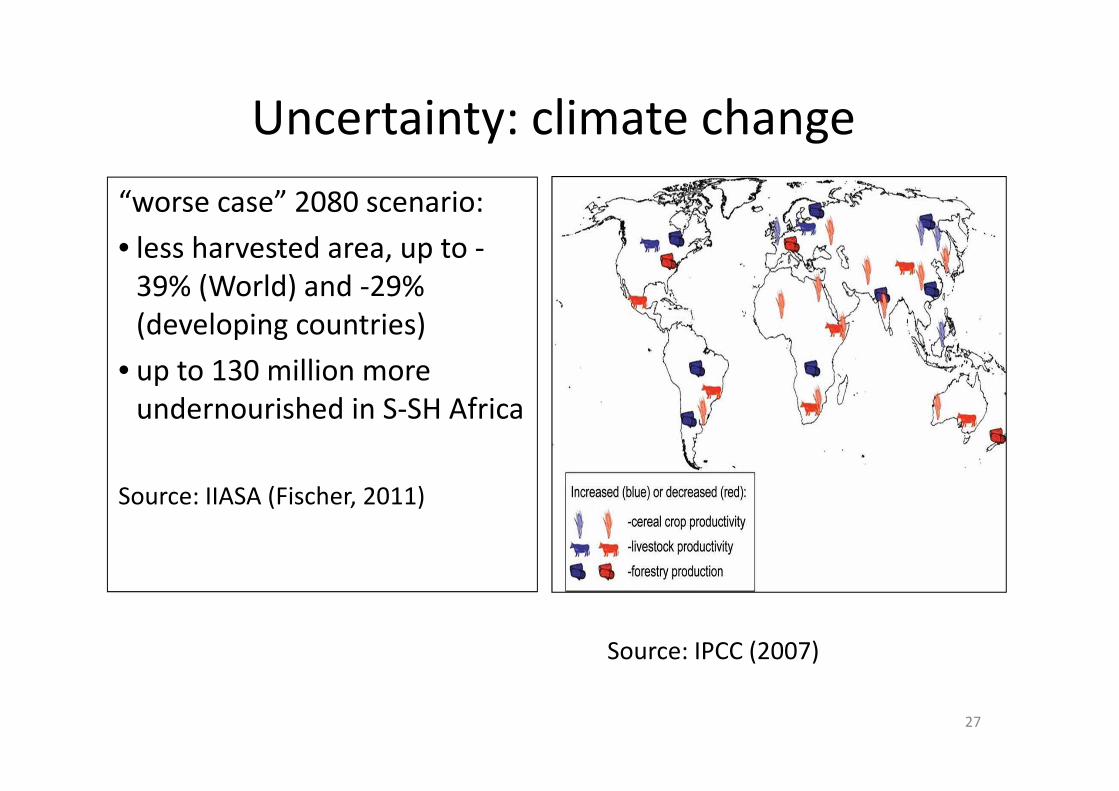
“worse case” 2080 scenario:
• less harvested area, up to -
39% (World) and -29%
(developing countries)
• up to 130 million more
undernourished in S-SH Africa
Source: IIASA (Fischer, 2011)
Source: IPCC (2007)
Uncertainty: climate change
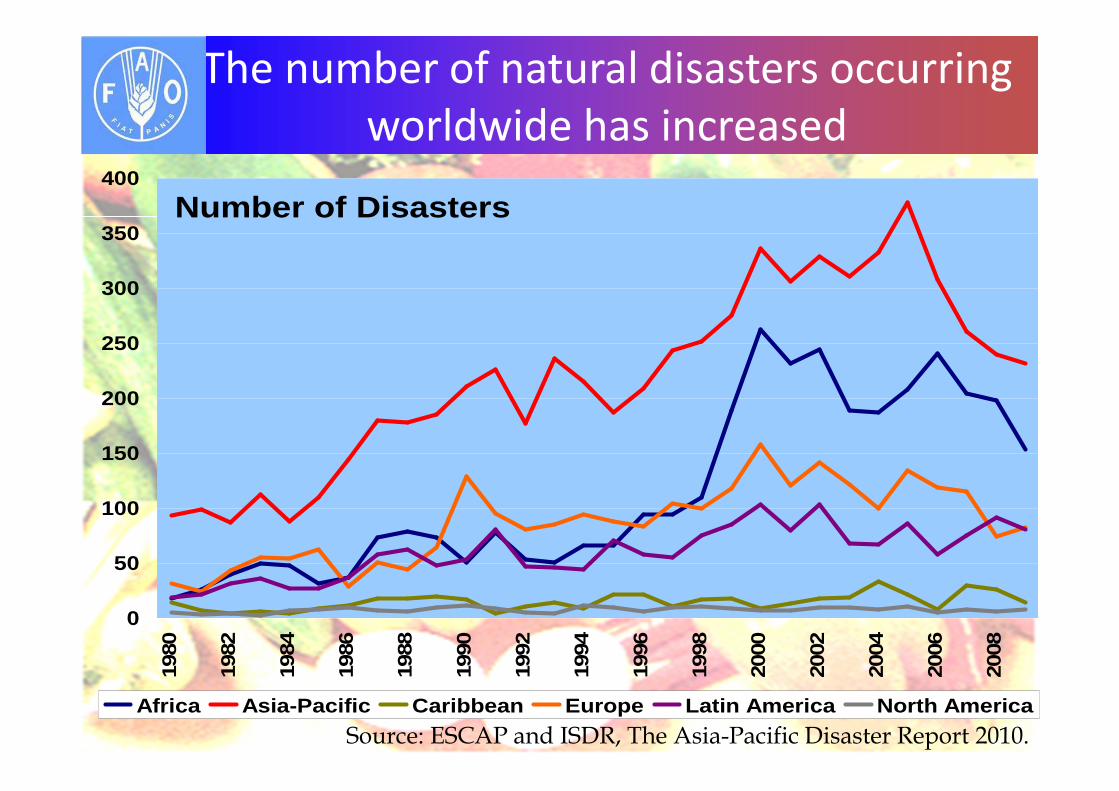
The number of natural disasters occurring
worldwide has increased
0
50
100
150
200
250
300
350
40019
80
1982
1984
1986
1988
1990
1992
1994
1996
1998
2000
2002
2004
2006
2008
Africa Asia-Pacific Caribbean Europe Latin America North America
Number of Disasters
Source: ESCAP and ISDR, The Asia-Pacific Disaster Report 2010.
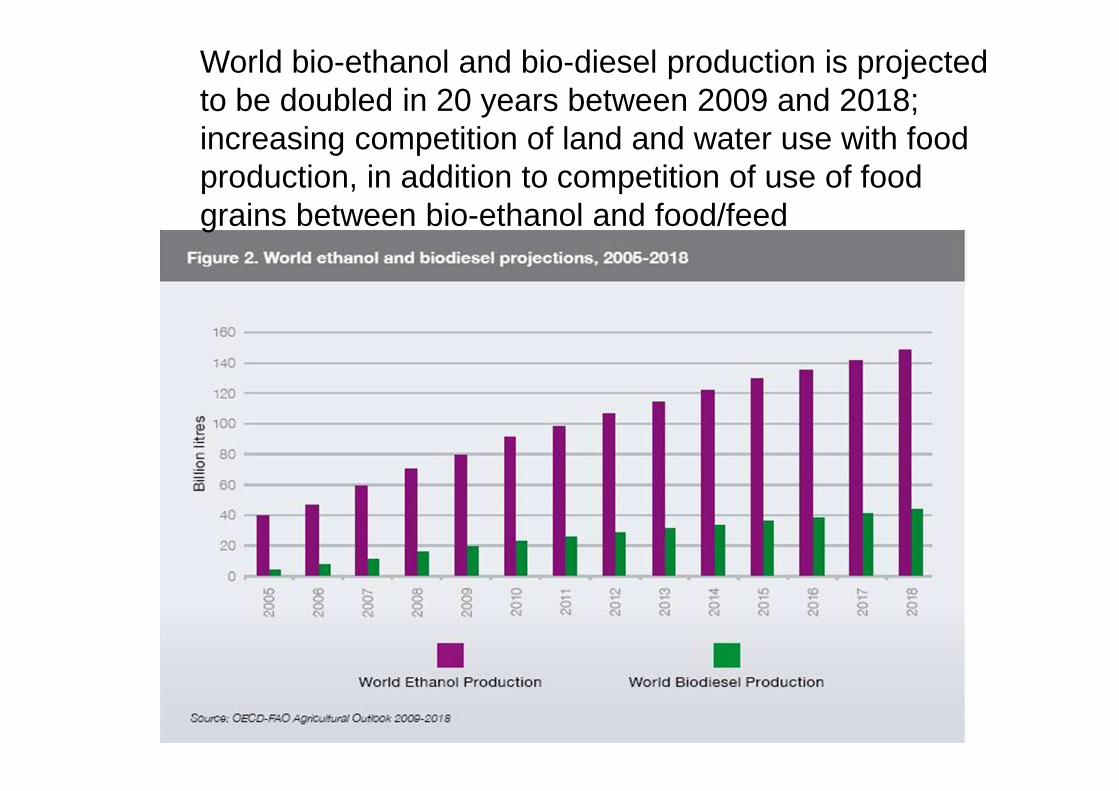
World bio-ethanol and bio-diesel production is projected to be doubled in 20 years between 2009 and 2018; increasing competition of land and water use with food production, in addition to competition of use of food grains between bio-ethanol and food/feed
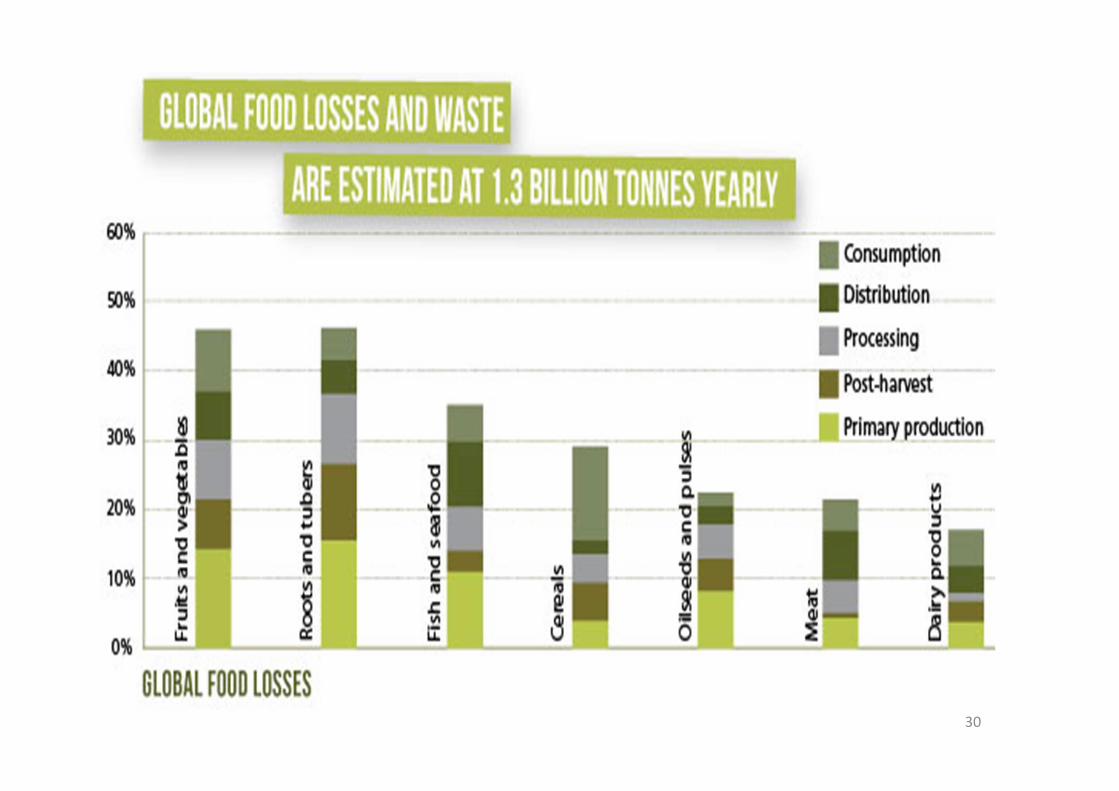
30
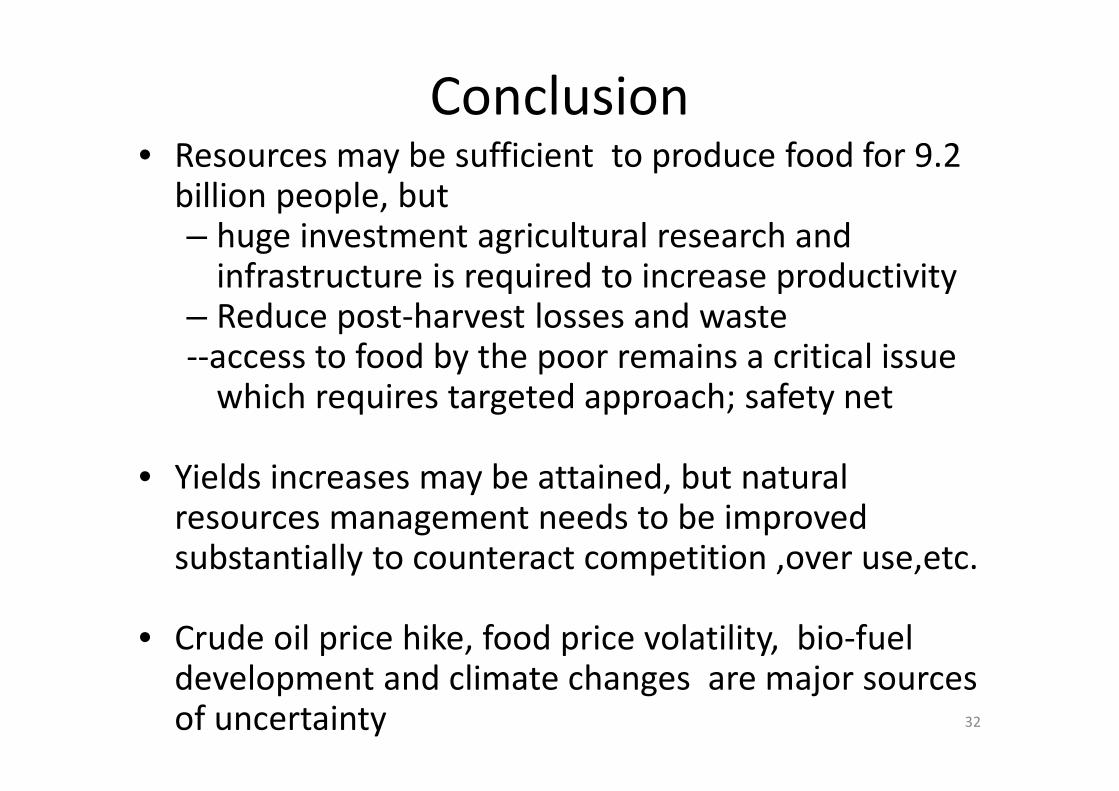
Conclusion• Resources may be sufficient to produce food for 9.2
billion people, but – huge investment agricultural research and
infrastructure is required to increase productivity – Reduce post-harvest losses and waste--access to food by the poor remains a critical issue
which requires targeted approach; safety net
• Yields increases may be attained, but natural resources management needs to be improved substantially to counteract competition ,over use,etc.
• Crude oil price hike, food price volatility, bio-fuel development and climate changes are major sources of uncertainty 32
• Everyone has a right to access to food
• Food is essential for our survival, stability,
peace and world security
• Building awareness, sense of strong
solidarity, help each other
• Sustainable consumption, reduce waste
• Public and private sector partnership and
working together
Thank you33