Embed Size (px)
Citation preview
IFPRI Discussion Paper 00747
January 2008
Asian-driven Resource Booms in Africa: Rethinking the Impacts on Development
Clemens Breisinger and
James Thurlow
Development Strategy and Governance Division
INTERNATIONAL FOOD POLICY RESEARCH INSTITUTE
The International Food Policy Research Institute (IFPRI) was established in 1975. IFPRI is one of 15 agricultural research centers that receive principal funding from governments, private foundations, and international and regional organizations, most of which are members of the Consultative Group on International Agricultural Research (CGIAR).
FINANCIAL CONTRIBUTORS AND PARTNERS IFPRI’s research, capacity strengthening, and communications work is made possible by its financial contributors and partners. IFPRI gratefully acknowledges generous unrestricted funding from Australia, Canada, China, Denmark, Finland, France, Germany, India, Ireland, Italy, Japan, the Netherlands, Norway, the Philippines, Sweden, Switzerland, the United Kingdom, the United States, and the World Bank.

IFPRI Discussion Paper 00747
January 2008
Asian-driven Resource Booms in Africa: Rethinking the Impacts on Development
Clemens Breisinger and
James Thurlow
Development Strategy and Governance Division

Published by
INTERNATIONAL FOOD POLICY RESEARCH INSTITUTE 2033 K Street, NW Washington, DC 20006-1002 USA Tel.: +1-202-862-5600 Fax: +1-202-467-4439 Email: [email protected]
www.ifpri.org
Notices 1 Effective January 2007, the Discussion Paper series within each division and the Director General’s Office of IFPRI were merged into one IFPRI–wide Discussion Paper series. The new series begins with number 00689, reflecting the prior publication of 688 discussion papers within the dispersed series. The earlier series are available on IFPRI’s website at www.ifpri.org/pubs/otherpubs.htm#dp. 2 IFPRI Discussion Papers contain preliminary material and research results. They have not been subject to formal external reviews managed by IFPRI’s Publications Review Committee but have been reviewed by at least one internal and/or external reviewer. They are circulated in order to stimulate discussion and critical comment.
Copyright 2008 International Food Policy Research Institute. All rights reserved. Sections of this material may be reproduced for personal and not-for-profit use without the express written permission of but with acknowledgment to IFPRI. To reproduce the material contained herein for profit or commercial use requires express written permission. To obtain permission, contact the Communications Division at [email protected].

iii
Contents
Acknowledgements v
Abstract vi
1. Introduction 1
2. The Current Resource Boom and Mining-led Growth in Africa 3
3. Assessing the Impacts of the Resource Boom: A Zambian Case Study 10
4. Conclusions 19
Appendix: Model Equations 20
References 22

iv
List of Tables
1. Foreign direct investment (FDI) into low-income Sub-Saharan Africa 6
2. The structure of the Zambian economy, 2002 11
3. Changes in macroeconomic indicators under model scenarios 13
4. Changes in production under model scenarios 14
5. Changes in household consumption under model scenarios 15
List of Figures
1. Real global commodity prices, 1970-2006 4
2. Mineral exports and real exchange rates in African countries 5

v
ACKNOWLEDGEMENTS
We are grateful to Steve Haggblade (Michigan State University), Sam Morley (IFPRI), Jos Verbeek
(World Bank) and two anonymous referees for their contributions and comments.
vi
ABSTRACT
Today’s resource boom in Africa, driven by Asian economic growth, offers new opportunities for resource-rich African countries. Contrary to the experience of previous booms, however, most mining profits now accrue to foreign companies, leaving little room for governments to use revenues for pro-poor investments or to mitigate adverse distributional impacts. Taking Zambia as a case study, this paper shows that despite privatization, Dutch disease remains a valid concern and may hamper economic diversification, worsen income distribution, and undermine poverty reduction strategies. Mining royalties must, therefore, be increased and used to finance growth-inducing investments that encourage pro-poor economic diversification, else many African countries will remain caught in a resource trap.
Keywords: Dutch disease, resource booms, privatization, income distribution, Africa, Zambia
1
1. INTRODUCTION
Asian growth and the rise of China and India have led to significant changes in the structure of global
trade and capital markets. Primary commodity prices have reached new highs, labor-intensive
manufacturing is increasingly competitive, and Asia is a more important source of foreign direct
investment. These changes in the world economy are occurring at a time when the deadline for the
Millennium Development Goals is rapidly approaching and developing countries have been responding
with national strategies drafted to achieve poverty-reducing growth. These economic changes are
particularly important for Sub-Saharan Africa, which remains the world’s poorest region, characterized by
long-term divergence from economic trends in other developing regions. Many African countries rely on
primary exports, yet their terms-of-trade have worsened over the last three decades (UNCTAD 2005a).
By reversing the decline in commodity prices, Asia’s expansion could signal new opportunities for
economic growth in Africa. Indeed, resource-rich African countries have benefited from high commodity
prices and accelerated economic growth from new mining investments (Goldstein et al. 2006; World
Bank 2006a). What is uncertain, however, is whether the current resource boom will encourage
sustainable and poverty-reducing growth in Africa.
Debate continues over the economic benefits of mineral and oil resources.1 Traditional arguments
suggest that resource booms limit structural diversification and technology accumulation, and generate
rent-seeking and corruption that undermine effective spending of windfall gains (Gelb et al. 1988; Auty
1990). This is the well-known “Dutch disease” that has occurred in countries like Nigeria and Zambia,
which have so far failed to translate resource abundance into equitable and sustainable growth. From this
perspective, the current boom will be a curse for development as it will keep African countries locked in a
resource-based development trap. An opposing view sees mining-led growth as one of the few
opportunities that low-income African countries have to catch up with countries in other regions (Collier
2006; Page 2006; Goldstein et al. 2006). Historical evidence supports this counterclaim as well. Countries
like Chile and Indonesia have demonstrated that mining-led growth can lead to more diversified economic
growth if governments maintain macroeconomic stability and use the returns from natural resources to
make appropriate investments (Temple 2003). From this more optimistic perspective, the current resource
boom could help finance the investments needed to push Africa out of its development trap.
Many of the arguments surrounding resource booms and mining-led growth were informed by
pre-structural adjustment conditions in Africa, when mines were state-owned and their profits (or losses)
greatly influenced government revenues. However, privatization and the subsequent foreign ownership of
1 While Sachs and Warner (1999, 2001) find that countries with high resource-exports-to-GDP ratios experience lower
growth rates, other research shows that resource abundance has a neutral or even positive effect on growth (Davis 1995; Lederman and Maloney 2003; Ding and Field 2005).
2
African mining could reduce some of the negative consequences of resource booms. Because mining
profits are now remitted abroad, their negative exchange rate effects are offset. Conversely, difficulties in
taxing foreign mining companies may prevent governments from turning natural resources into public
investments that can offset the negative consequences of Dutch disease.
In this paper we consider the impact of resource booms on Africa, paying particular attention to
how privatization may have altered the transmission channels determining the economic outcomes from
resource booms. We first review the effects of the current boom and examine how the relationship
between the mining and public sectors has been altered by privatization. We then use Zambia as a case
study and develop a simple economywide model to examine the impact of the resource boom on
economic structure and income distribution. We find that while privatization has significantly altered the
effects of the resource boom on household incomes and government revenues, the boom still exacerbates
resource competition and worsens diversification and income inequality. Thus, despite a positive growth-
effect, the threat of Dutch disease remains, although its effects are less severe than they were before
privatization. We also find that raising mining taxes from current low levels will provide African
countries much needed revenues, but may exacerbate the negative effects of Dutch disease. African
governments therefore find themselves caught in an increasingly challenging situation: to turn the current
resource boom into an opportunity for accelerated economic development they must raise taxes to finance
public spending, but in doing so they risk worsening its negative consequences.
3
2. THE CURRENT RESOURCE BOOM AND MINING-LED GROWTH IN AFRICA
Economic growth has recently accelerated in Africa. Sub-Saharan Africa grew at 2.4 percent during 1990-
2002, but this rate doubled to 4.8 percent during 2002-05 (World Bank 2007). Half of this additional
growth has been generated by mining and construction, whose annual growth rate increased from 1.8
percent to 8.1 percent. New mining growth has been driven by both a rise in world commodity prices and
an expansion of foreign investment in the mining sector. In this section we examine both dimensions of
the current resource boom and suggest that they may signal the beginning of a prolonged period of
mining-led growth in Africa. We then consider how the fiscal implications of resource booms have been
changed by the privatization of state-owned mines. These changes put into question whether concerns
over Dutch disease and traditional policy prescriptions still apply to Africa today.
Rising Commodity Prices and Appreciating Exchange Rates
The resource boom that started in Africa in 2002 has been both rapid and pronounced. Commodity prices
surged during 2002-06 due to strong global economic growth (see Figure 1). Much of the upward
pressure on prices has been driven by Asia, with China alone accounting for half of the increase in world
demand for aluminum, copper, and steel (IMF 2006a). This is a new peak period for metals and oil prices,
both of which have doubled since 2000. Copper prices have risen particularly fast, tripling in less than
five years from their lowest to their highest levels since the early 1970s. However, while metal and oil
prices have risen sharply, agricultural and food prices have stagnated or only risen modestly. Most
African countries still depend on primary exports and about 45 percent of Africa’s population lives in
mineral-based economies (Diao et al. 2007). As a result, the effects of the mineral price boom have been
concentrated in Africa, where terms-of-trade improved by 30 percent during 1999-2004 compared with 8
percent for Latin America (UNCTAD 2005a). These regional differences arise not only due to higher
primary commodity prices, but also due to a decline in manufacturing prices (caused primarily by rising
Chinese manufacturing exports). Accordingly, resource-poor exporters of manufactured goods in East and
South Asia have seen an 11 percent decline in their terms-of-trade over the same period.

4
Figure 1. Real global commodity prices, 1970-2006
0
50
100
150
200
250
300
350
400
1970 73 76 79 82 85 88 91 94 97 2000 03 06
Rea
l pric
e in
dex
(200
0=10
0)
CopperCrude oilFood
Source: Authors’ calculations using World Bank (2007) and IMF (2007a). Notes: Dollar-denominated commodity prices deflated by United States producer price index. The composite metals price index mirrors that of copper, while the raw agriculture index has remained constant since the 1980s.
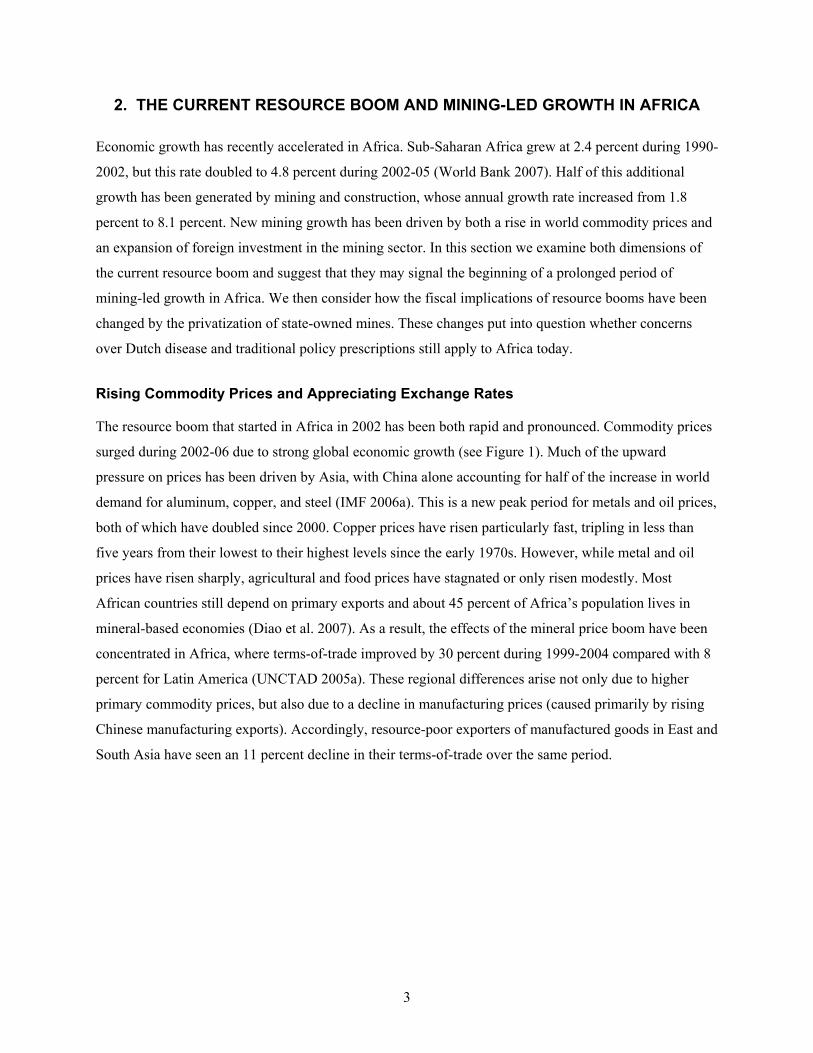
Rising mineral prices raise concerns about “Dutch disease,” which refers to booming mining
exports driving down non-mining exports, thus reducing export diversity and, possibly, long-run
economic growth. This structural change arises because an appreciation of the real exchange rate resulting
from higher prices for mining exports lowers the competitiveness of agricultural and manufacturing
exports and draws resources away from non-mining export sectors towards non-traded goods and
services. We can see this effect taking place after the recent resource boom. Mining exports from Sub-
Saharan Africa have responded positively to improved mineral prices, more than doubling in real terms
during 2000-03 (World Bank 2006a). These mining exports have in turn affected exchange rates. There is
a strong correlation between recent changes in real exchange rates and the export orientation of African
countries (see Figure 2). The real exchange rates of mineral and oil exporting countries appreciated during
2000-05, with Equatorial Guinea and Zambia appreciating the most. Conversely, countries with greater
dependence on agricultural exports - such as Malawi, Rwanda, and Tanzania - experienced depreciations
of their real exchange rates. This is consistent with the slower growth of world agricultural prices.
Exporters of both mining and agricultural goods, such as Ghana and Côte d’Ivoire, have seen slight
appreciations. These exchange rate movements suggest that mining exports could threaten non-mining
production in mineral- and oil-based African economies. Furthermore, assuming non-mining traded goods
have stronger “learning-by-doing” effects, mining growth might also result in economywide productivity
losses that further reduce growth (Torvik 2001).
5
Figure 2. Mineral exports and real exchange rates in African countries
-60
-40
-20
0
20
40
60
0 10 20 30 40 50 60 70 80 90 100
Share of oil and mineral exports in merchandise exports, 2000 (%)
Cha
nge
in re
al e
xcha
nge
rate
, 200
0-05
(%)
Cameroon
SudanZambia
Equatorial Guinea
Tanzania
Senegal GhanaTogo
Côte d’Ivoire
Rwanda
Niger
Ethiopia UgandaMalawi
NigeriaAngola
Gabon
Mozambique
The Gambia
Burundi
Source: Authors’ calculations using World Bank (2007) and IMF (2007a). Notes: Mineral- and oil-based countries shown in bold as classified by UNIDO (2004). Remaining low-income African countries excluded due to lack of data on real exchange rate movements.
Commodity prices are expected to fall from their current peaks. Resource booms during the early
1970s and late 1980s were followed by increased mining production and decelerations in world demand,
with resulting declines in world prices (see Figure 1). Therefore, while metal and oil prices have reached
new highs, supply-side adjustments, such as the catch-up of delayed investments and the easing of
technical and energy constraints, should cause prices to fall (World Bank 2006b). However, historical
evidence also suggests that the income elasticity for metals is high, and that demand for metals typically
grows in parallel with average per capita incomes until the latter reach about $15,000-$20,000 (adjusted
for purchasing power) (IMF 2006a). This is significantly higher than current per capita incomes in China
and India. Thus, while price volatility will probably remain (Goldstein et al. 2006), it is reasonable to
expect mining demand to increase further over the medium term. The current resource boom may
therefore signal the beginning of a longer period of mining-led growth in many African countries,
especially if high prices and demand continue to attract new foreign investments in the mining sector.
Expanding Foreign Investment in African Mining
Foreign direct investment (FDI) inflows to Africa have also risen rapidly since 2002. FDI doubled during
2004-05 alone, reaching the historic high of US$31 billion. This is equivalent to 15 percent of the
region’s total export earnings (UNCTAD 2006). The composition of FDI has also changed dramatically.
Until 2000, Britain, France, Germany and the United States accounted for more than 70 percent of total
6
inflows. Recently, China, India, and South Africa have played a more important role, significantly
contributing to the recent spike in FDI (UNCTAD 2005b). The sectoral composition of FDI has also
become more concentrated in the mining sector. Foreign investment in Africa still focuses on primary
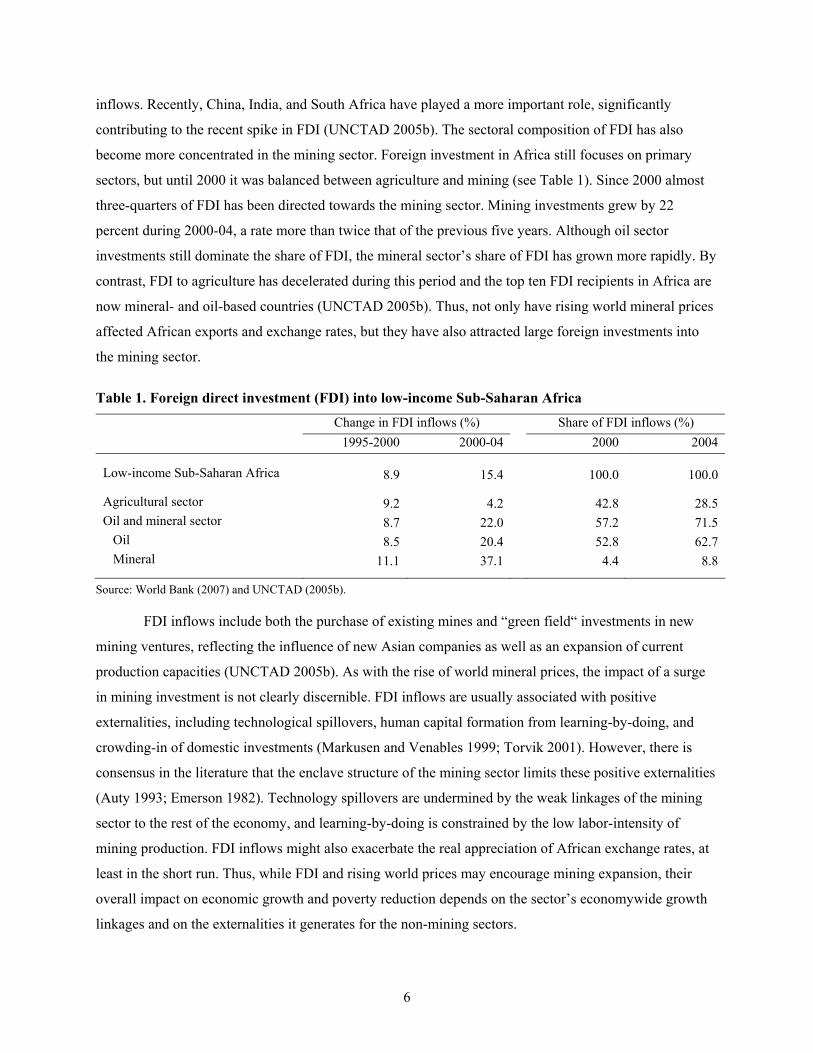
sectors, but until 2000 it was balanced between agriculture and mining (see Table 1). Since 2000 almost
three-quarters of FDI has been directed towards the mining sector. Mining investments grew by 22
percent during 2000-04, a rate more than twice that of the previous five years. Although oil sector
investments still dominate the share of FDI, the mineral sector’s share of FDI has grown more rapidly. By
contrast, FDI to agriculture has decelerated during this period and the top ten FDI recipients in Africa are
now mineral- and oil-based countries (UNCTAD 2005b). Thus, not only have rising world mineral prices
affected African exports and exchange rates, but they have also attracted large foreign investments into
the mining sector.
Table 1. Foreign direct investment (FDI) into low-income Sub-Saharan Africa
Change in FDI inflows (%) Share of FDI inflows (%) 1995-2000 2000-04 2000 2004
Low-income Sub-Saharan Africa 8.9 15.4 100.0 100.0
Agricultural sector 9.2 4.2 42.8 28.5 Oil and mineral sector 8.7 22.0 57.2 71.5 Oil 8.5 20.4 52.8 62.7 Mineral 11.1 37.1 4.4 8.8
Source: World Bank (2007) and UNCTAD (2005b).
FDI inflows include both the purchase of existing mines and “green field“ investments in new
mining ventures, reflecting the influence of new Asian companies as well as an expansion of current
production capacities (UNCTAD 2005b). As with the rise of world mineral prices, the impact of a surge
in mining investment is not clearly discernible. FDI inflows are usually associated with positive
externalities, including technological spillovers, human capital formation from learning-by-doing, and
crowding-in of domestic investments (Markusen and Venables 1999; Torvik 2001). However, there is
consensus in the literature that the enclave structure of the mining sector limits these positive externalities
(Auty 1993; Emerson 1982). Technology spillovers are undermined by the weak linkages of the mining
sector to the rest of the economy, and learning-by-doing is constrained by the low labor-intensity of
mining production. FDI inflows might also exacerbate the real appreciation of African exchange rates, at
least in the short run. Thus, while FDI and rising world prices may encourage mining expansion, their
overall impact on economic growth and poverty reduction depends on the sector’s economywide growth
linkages and on the externalities it generates for the non-mining sectors.
7
Remitted Mining Profits and Low Mining Taxes
Evidence from outside Africa shows how government revenues from mining royalties and taxes can
finance the investments needed to translate mining booms into broad-based growth. Chile successfully
transformed itself from a low-income copper-dependent economy into a middle-income country by using
mining revenues to support structural diversification. Windfall revenues from resource booms during the
1970s were invested in agricultural export sectors and in upstream resource-based processing. This
diversification strategy targeted investments in sectors with comparative advantage, and these sectors
served as drivers of broader-based growth. Investments in education enabled people to participate in an
increasingly diversified and skill-intensive growth process. Indonesia also used oil windfalls during the
resource booms of the 1970s and 1980s to pursue a strategy of agriculture-led growth. Oil revenues
financed investments in rural infrastructure, such as irrigation and roads, as well as in input subsidies for
fertilizer and pesticides. Together, these investments improved the productivity of traditional crops and
supported the country’s Green Revolution (Gelb et al. 1988; Auty 1990; Rodrik 2003).2
The importance of sound governance and fiscal management in determining the success of
mining-driven development is also evident from past failures. Nigeria demonstrates how inconsistent
strategies in combination with Dutch disease and bad governance can lead to a resource curse. The
government first used oil revenues to finance investments in non-traded sectors, such as transport and
education, which undermined export diversification and entrenched oil dependence. The government then
invested in heavy industries, such as steel and petrochemicals, in which Nigeria had little comparative
advantage (Auty 1990). At the same time it reduced spending on agriculture and targeted it towards large-
scale capital-intensive state farms (Gelb 1988). To date, poor governance and inappropriate strategies in
Nigeria have undermined broad-based growth and the translation of oil revenues into positive social
outcomes.3
The recommendations emerging from these often-cited case studies is that African governments
can harness the benefits of the current resource boom if they are able to use mining revenues to invest in
non-mining tradable sectors and avoid corruption and macroeconomic instability. However, these
prescriptions reflect pre-privatization conditions. They assume that a resource boom will lead to Dutch
2 Apart from well-directed public investments, Chile and Indonesia maintained macroeconomic stability through exchange
rate management (to prevent Dutch disease), capital flow controls (Chile), and protectionist trade policies (Indonesia). External factors also contributed to Indonesia’s success, such as the timely occurrence of the Asian Green Revolution and a close geographic proximity to the emerging Asian tigers (Auty 1990; Gelb et al. 1988).
3 A large body of evidence confirms the importance of governance during resource booms: (1) resource-deficient countries may use resources more efficiently (Auty 1997); (2) booms encourage rent-seeking that reduces allocative efficiency (Robinson et al. 2006); (3) governments may fail to accumulate foreign savings that can smooth price fluctuations during downswings (Auty 1991); (4) the public sector may be stretched during a boom leading to a preference for large-scale capital-intensive investments (Auty 1991); (5) windfall revenues often must be spent quickly and are thus determined by pre-shock priorities (Gelb et al. 1988); and (6) high temporary or permanent windfalls from resource booms can distract governments from investing in human capital (Gylafson 2001).
8
disease unless combined with countervailing public investments, and that booms generate additional
revenues to finance these investments. Such conditions may not be as applicable to Africa today.
First, many state-owned mines in Africa have been sold to foreign companies. This means that
much of the proceeds from mining exports will remain outside of the country in which the mining takes
place. This remittance of profits reduces the demand for local currency, thus diminishing the threat of
Dutch disease. This threat is further diminished by the low labor intensity of mining production and high
import intensity of its intermediate and capital inputs. In the extreme case, where the full value of mining
revenues remains outside the country and where there are no linkages to domestic non-mining sectors,
there might be no effect on the exchange rate at all. Thus the privatization of state mines and their sale to
foreign companies make mining even more of an enclave sector, and may significantly reduce the threat
of Dutch disease.
Second, in order to attract foreign investment in their privatized mining sectors, African
governments have often introduced investor-friendly tax systems. Consequently, mining tax rates are low
in many African countries and the share of mining revenues in government income has declined, despite
constant or increased production. In Guinea, for example, the contribution of mining revenues to total
government income decreased from 73.7 percent in 1986 to 18.3 percent in 2004 (IMF 2006b). In Ghana,
royalty rates declined from 6 to 3 percent of mining revenues during 1975-2006. Royalty rates in mineral-
rich African countries today range between zero and 12 percent, with the lowest rates in Tanzania (0-5
percent) and Zambia (2 percent) (Otto et al. 2006). In addition, direct taxes on the mining sector (i.e.,
corporate taxes) have been reduced and other taxes, such as mineral duties, import duties, and foreign
exchange taxes, have been abolished in many countries. At the same time, allowances to enable investors
to recoup their capital expenditure have increased. Thus, even where mining tax systems are in place, tax
collection has been limited by waived duties and tax exemptions. The current resource boom may,
therefore, generate little additional revenue for African governments, thus undermining their ability to
mitigate its potentially negative effects. As a consequence of low taxes and the current resource boom,
many African governments are starting to reexamine their mining tax policies (Campell 2006).
The evidence presented in this section suggests that the current resource boom is indeed
pronounced and, although world prices may decline, it is likely that growing Asian demand and new
foreign investments in African mining will sustain high growth rates in the mining sector. There is
already evidence of real exchange rate appreciation in mineral-rich African economies, justifying
concerns over Dutch disease. However, experiences from outside the continent suggest that the negative
impacts of resource booms can be avoided if African governments invest mining revenues appropriately.
However, privatization has significantly altered the linkages between mining and public sectors. Foreign
ownership of previously state-owned mines and the remittance of mining profits abroad may eliminate

9
any adverse appreciation of the exchange rate. Concerns over Dutch disease, therefore, may be
exaggerated in post-privatization Africa. The privatization process in many African countries has also led
to low mining taxes, which in turn limit the revenues that governments earn during resource booms. Thus,
if the threat of Dutch disease does prove valid, African governments may not be able to finance the
countervailing investments recommended by successful countries like Chile and Indonesia.
10
3. ASSESSING THE IMPACTS OF THE RESOURCE BOOM: A ZAMBIAN CASE STUDY
In this section we take Zambia as a case study in which to examine the impact of the current resource
boom on economic structure and income distribution. We first describe the country’s basic economic
structure. We then develop a simple general equilibrium model, which is described briefly below and
whose equations are provided in the Appendix. We use this model to (1) contrast the impact of rising
world metal prices under pre- and post-privatization conditions; (2) examine the effects of new foreign
investments in the mining sectors; and (3) assess the effects of the government raising mining taxes in
response to the boom.
Zambia as a Case Study for Mineral-Rich African Countries
Zambia reflects the conditions and experiences of many mineral-rich African countries. First, Zambia has
substantial mineral resources and its main export, copper, generates half its export earnings (see Table 2).
Since 2002, copper has experienced strong price increases, rapid export growth, and high levels of FDI. It
is expected that, even if copper prices were to fall, new investments would ensure continued export
growth. Second, after several decades of state-ownership and economic decline, Zambia has privatized its
copper mines. However, this occurred only after the government offered generous tax incentives to
foreign companies, such that royalties are only 2 percent of copper revenues (IMF 2007b). Third, during
the 1990s, when mining production and prices fell to their lowest levels in three decades, Zambia
demonstrated its potential to diversify into non-mining sectors, especially into agricultural exports
(Thurlow and Wobst 2006). However, agriculture still accounts for only 12.6 percent of export earnings,
despite generating 20 percent of GDP. Fourth, two-thirds of Zambia’s population lives in rural areas and
depends on the agricultural sector for its income. Poverty is also widespread in urban areas. Finally,
investment and private consumption are more dependent on imported manufactured goods in urban than
in rural areas, although in both urban and rural areas significant shares of income are spent on food and
agricultural goods.
11
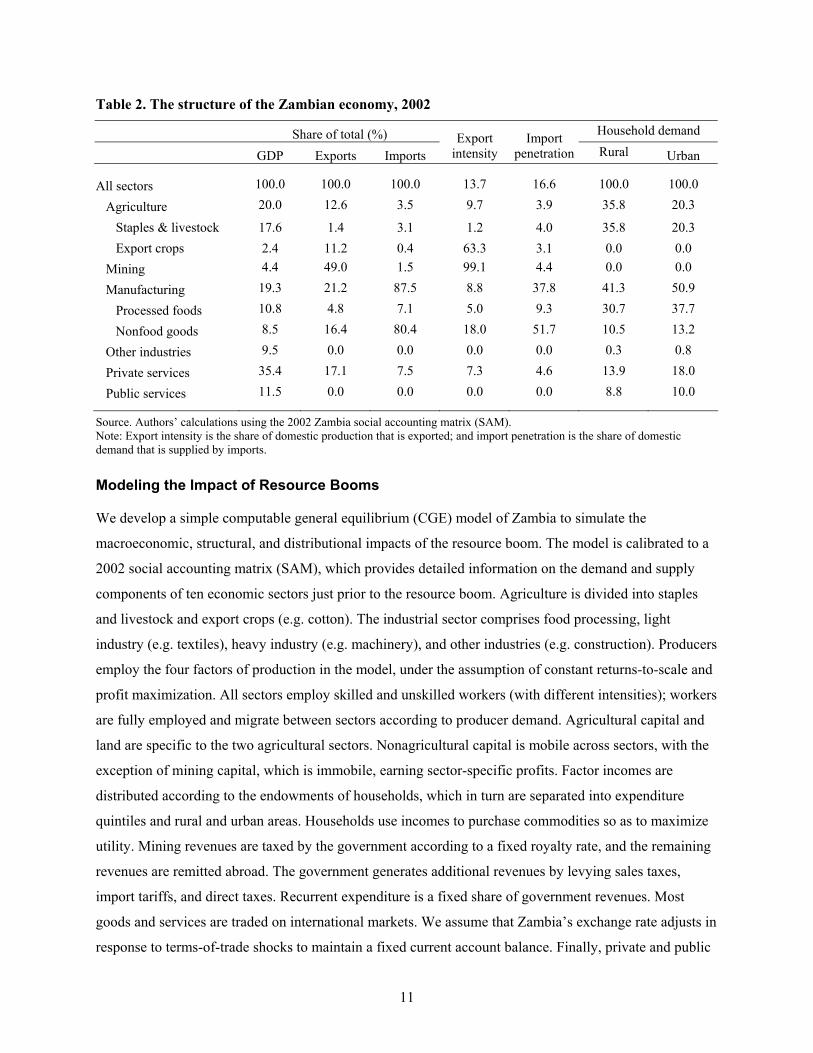
Table 2. The structure of the Zambian economy, 2002
Share of total (%) Household demand
GDP Exports Imports Export
intensity Import
penetration Rural Urban
All sectors 100.0 100.0 100.0 13.7 16.6 100.0 100.0
Agriculture 20.0 12.6 3.5 9.7 3.9 35.8 20.3
Staples & livestock 17.6 1.4 3.1 1.2 4.0 35.8 20.3 Export crops 2.4 11.2 0.4 63.3 3.1 0.0 0.0 Mining 4.4 49.0 1.5 99.1 4.4 0.0 0.0
Manufacturing 19.3 21.2 87.5 8.8 37.8 41.3 50.9
Processed foods 10.8 4.8 7.1 5.0 9.3 30.7 37.7
Nonfood goods 8.5 16.4 80.4 18.0 51.7 10.5 13.2
Other industries 9.5 0.0 0.0 0.0 0.0 0.3 0.8
Private services 35.4 17.1 7.5 7.3 4.6 13.9 18.0
Public services 11.5 0.0 0.0 0.0 0.0 8.8 10.0
Source. Authors’ calculations using the 2002 Zambia social accounting matrix (SAM). Note: Export intensity is the share of domestic production that is exported; and import penetration is the share of domestic demand that is supplied by imports.
Modeling the Impact of Resource Booms
We develop a simple computable general equilibrium (CGE) model of Zambia to simulate the
macroeconomic, structural, and distributional impacts of the resource boom. The model is calibrated to a
2002 social accounting matrix (SAM), which provides detailed information on the demand and supply
components of ten economic sectors just prior to the resource boom. Agriculture is divided into staples
and livestock and export crops (e.g. cotton). The industrial sector comprises food processing, light
industry (e.g. textiles), heavy industry (e.g. machinery), and other industries (e.g. construction). Producers
employ the four factors of production in the model, under the assumption of constant returns-to-scale and
profit maximization. All sectors employ skilled and unskilled workers (with different intensities); workers
are fully employed and migrate between sectors according to producer demand. Agricultural capital and
land are specific to the two agricultural sectors. Nonagricultural capital is mobile across sectors, with the
exception of mining capital, which is immobile, earning sector-specific profits. Factor incomes are
distributed according to the endowments of households, which in turn are separated into expenditure
quintiles and rural and urban areas. Households use incomes to purchase commodities so as to maximize
utility. Mining revenues are taxed by the government according to a fixed royalty rate, and the remaining
revenues are remitted abroad. The government generates additional revenues by levying sales taxes,
import tariffs, and direct taxes. Recurrent expenditure is a fixed share of government revenues. Most
goods and services are traded on international markets. We assume that Zambia’s exchange rate adjusts in
response to terms-of-trade shocks to maintain a fixed current account balance. Finally, private and public
12
savings rates are fixed and combined with foreign inflows to determine the level of investment.4 This
static model is used to examine a number of exogenous shocks, including changes in world copper prices,
foreign mining investment, and government mining tax rates. Changes in the model’s variables after
imposing these shocks are compared to initial or base values to determine the size and direction of
impacts.
Increases in World Commodity Prices Pre- and Post-Privatization
As discussed in Section 2, the privatization of African mines may have changed the channels through
which mining-driven terms-of-trade shocks affect government revenues and the rest of the economy. In
this section we run two scenarios to examine the impact of rising world copper prices on the Zambian
economy. In the first scenario we assume that all additional mining profits resulting from the increase in
copper prices accrues to the government (Scenario 1). In the second scenario, the government maintains
its low mining tax rate of 2 percent, such that almost all mining profits are remitted abroad (Scenario 2).
Thus, these two scenarios broadly capture pre- and post-privatization conditions. The shock is the same in
both scenarios: a 150 percent increase in world copper prices. This is similar to the price increase
observed during 2003-2006 (see Figure 1).
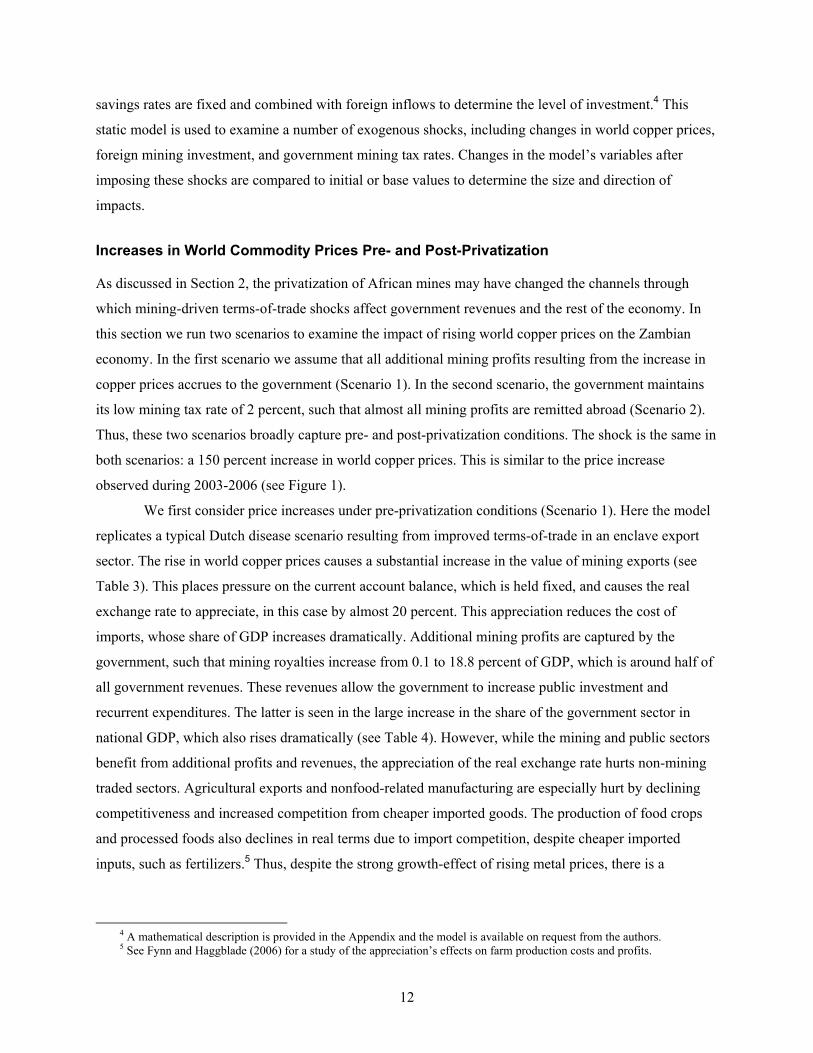
We first consider price increases under pre-privatization conditions (Scenario 1). Here the model
replicates a typical Dutch disease scenario resulting from improved terms-of-trade in an enclave export
sector. The rise in world copper prices causes a substantial increase in the value of mining exports (see
Table 3). This places pressure on the current account balance, which is held fixed, and causes the real
exchange rate to appreciate, in this case by almost 20 percent. This appreciation reduces the cost of
imports, whose share of GDP increases dramatically. Additional mining profits are captured by the
government, such that mining royalties increase from 0.1 to 18.8 percent of GDP, which is around half of
all government revenues. These revenues allow the government to increase public investment and
recurrent expenditures. The latter is seen in the large increase in the share of the government sector in
national GDP, which also rises dramatically (see Table 4). However, while the mining and public sectors
benefit from additional profits and revenues, the appreciation of the real exchange rate hurts non-mining
traded sectors. Agricultural exports and nonfood-related manufacturing are especially hurt by declining
competitiveness and increased competition from cheaper imported goods. The production of food crops
and processed foods also declines in real terms due to import competition, despite cheaper imported
inputs, such as fertilizers.5 Thus, despite the strong growth-effect of rising metal prices, there is a
4 A mathematical description is provided in the Appendix and the model is available on request from the authors. 5 See Fynn and Haggblade (2006) for a study of the appreciation’s effects on farm production costs and profits.
13
narrowing of the economy into mining, public services, and other less-traded sectors - a typical outcome
of a Dutch disease scenario.
Table 3. Changes in macroeconomic indicators under model scenarios
Value after imposing shock
Pre-
privatization price shock
Post-privatization price shock
Increased foreign
investment
Increased mining taxes
Base value
in 2002
(Scenario 1) (Scenario 2) (Scenario 3) (Scenario 4)
Per capita GDP (US$) 329 396 336 357 374
World copper price (index) 1.00 2.50 2.50 2.50 2.50 Real exchange rate (index) 1.00 0.81 0.96 0.91 0.87 Consumer prices (index) 1.00 0.98 0.99 0.98 0.97
Government revenue /GDP (%) 20.0 39.9 20.7 21.3 26.2 Mining royalties 0.1 18.8 0.5 0.6 5.4 Other taxes 20.0 21.1 20.3 20.7 20.8
Investment/GDP (%) 24.4 27.1 24.8 26.9 27.4 Private savings 1.8 1.1 1.7 1.3 1.1 Foreign savings 19.7 20.2 20.1 22.5 22.5 Public savings 2.9 5.9 3.0 3.1 3.9
Exports/GDP (%) 31.3 53.0 60.0 79.4 77.5 Mining 15.4 44.7 45.5 67.2 66.8 Non-mining 16.0 8.3 14.5 12.2 10.6
Imports/GDP (%) 47.6 69.7 51.3 60.3 64.9 Food 4.9 11.6 5.7 7.1 8.5 Nonfood 42.8 58.1 45.7 53.3 56.4
Source: Results from the Zambia CGE model.
The positive terms-of-trade shock raises real incomes and private consumption (see Table 5). Per
capita GDP increases substantially from US$329 to US$396, driven mostly by private consumption,
which increases by 9 percent. However, this aggregate consumption measure hides changes in the
distribution of incomes. Since urban workers can more readily migrate to new sectors of employment, it is
urban households that benefit more from new jobs in the mining and public sectors. They also benefit
from rising wages for skilled labor, which the mining and public sectors use more intensively. Thus, per
capita expenditures rise for urban households, especially for those in the middle of the income
distribution, because they have more skilled labor. By contrast, the decline in agriculture, especially in
exports, hurts rural households because agriculture is an important income source for them. Rural
households are less able to adapt to structural changes since land is their major asset and it cannot be used
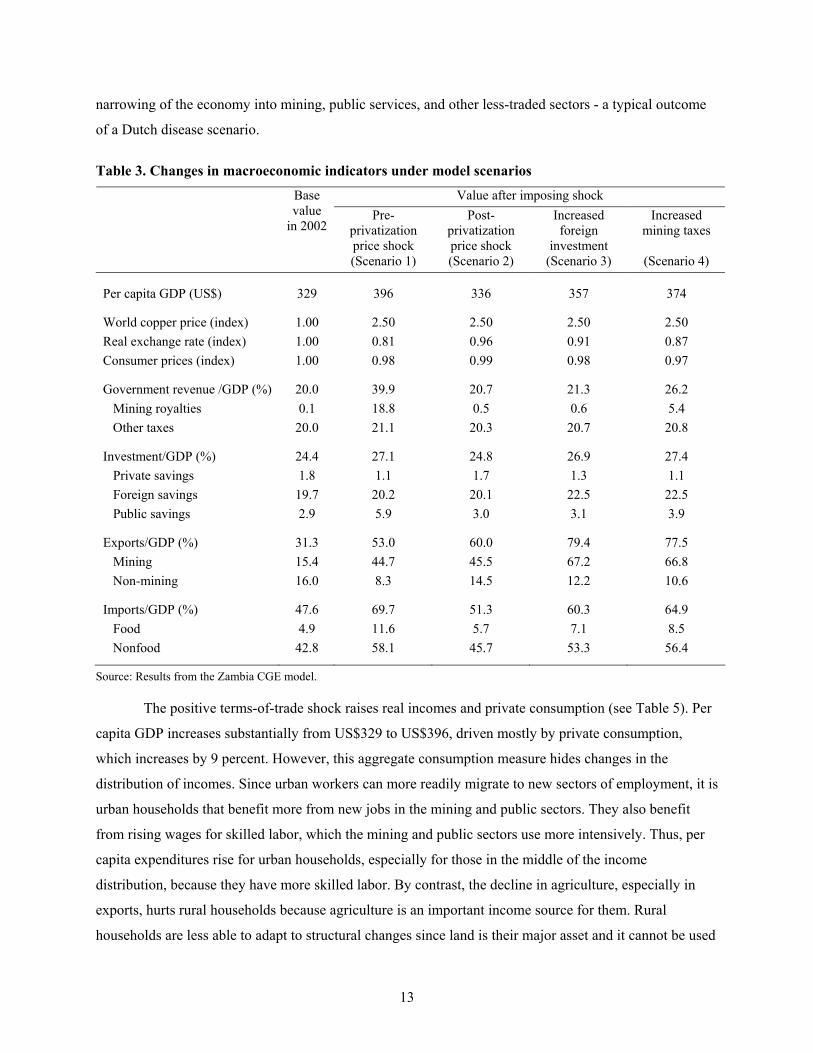
14
to take advantage of nonagricultural employment opportunities. As such, falling import prices drive down
agricultural prices, which effectively lowers the returns to both land and lower-skilled labor. Because
urban households are net consumers of food, they benefit more from cheaper imports and domestic goods.
Ultimately, rising copper prices undermine structural diversification and increase income inequality,
especially between rural and urban areas.
Table 4. Changes in production under model scenarios
GDP shares after imposing shock (%)
Pre-
privatization price shock
Post-privatization price shock
Increased foreign
investment
Increased mining taxes
Base GDP share
in 2002 (%)
(Scenario 1) (Scenario 2) (Scenario 3) (Scenario 4)
All sectors 100.0 100.0 100.0 100.0 100.0 Agriculture 20.0 19.0 20.0 19.4 19.1 Staples & livestock 17.6 18.0 17.9 17.7 17.7 Export crops 2.4 1.0 2.1 1.7 1.4 Mining 4.4 5.1 5.1 7.6 7.6 Manufacturing 19.3 14.3 18.6 16.9 15.8 Processed foods 10.8 10.2 10.9 10.5 10.4 Nonfood goods 8.5 4.0 7.7 6.4 5.5 Other industries 9.5 11.3 9.5 9.5 10.0 Private services 35.4 31.1 35.2 35.0 33.9 Public services 11.5 19.2 11.5 11.6 13.6
Source: Results from the Zambia CGE model.
In the second scenario we again consider the impact of increasing world copper prices, although
we now assume that almost all additional mining profits are remitted abroad. Accordingly, while mining
royalties increase, they remain substantially below the levels achieved in the previous scenario (see Table
3). Since the additional foreign inflows generated by higher export revenues are offset by increased
outflows of mining profits, the increase in copper prices no longer generates a substantial appreciation of
the real exchange rate. However, the exchange rate effect is not entirely neutralized since remittances
include only the returns generated on mining profits. While the mining sector is highly capital intensive,
around 22 percent of the cost of production covers intermediate inputs and labor wages. The former is
more import intensive and so some of these costs add to the outflows generated by the mining sector.
However, all labor incomes, comprising around 6 percent of production costs, are likely to remain within
the country. Thus, even if all mining profits were remitted and intermediate demand was for imports only,
a small share of mining export earnings would still remain within Zambia and cause a modest
appreciation of the real exchange rate.
15
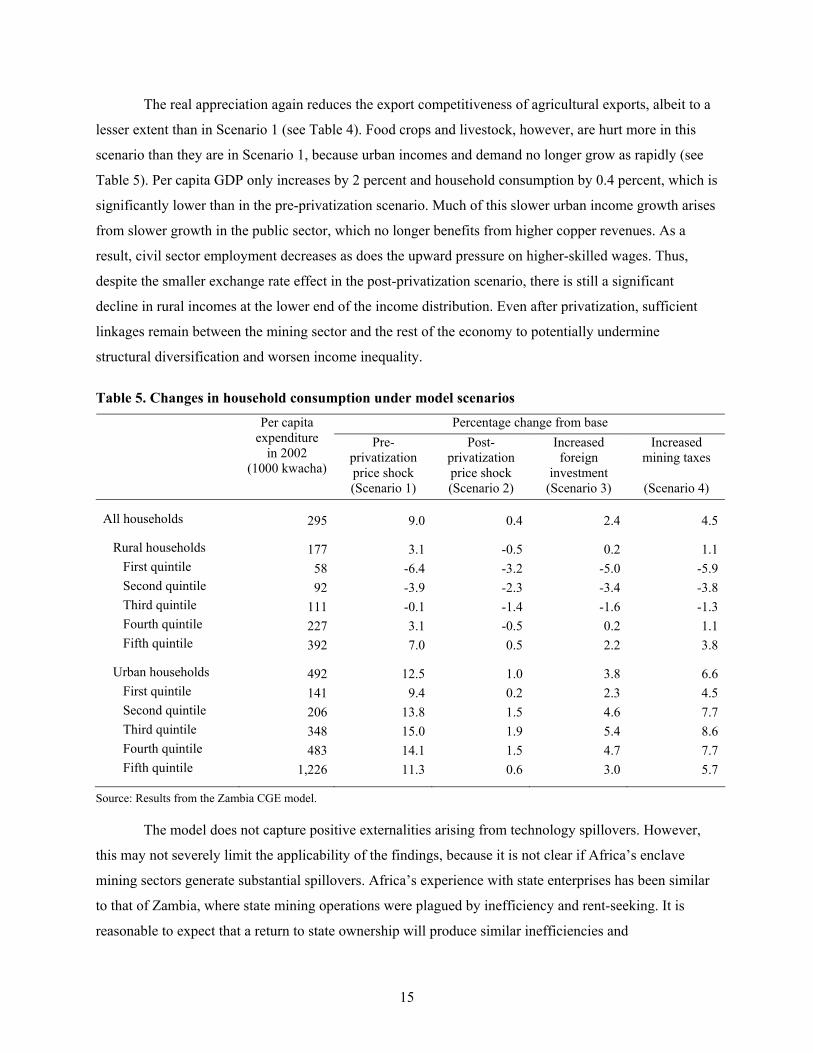
The real appreciation again reduces the export competitiveness of agricultural exports, albeit to a
lesser extent than in Scenario 1 (see Table 4). Food crops and livestock, however, are hurt more in this
scenario than they are in Scenario 1, because urban incomes and demand no longer grow as rapidly (see
Table 5). Per capita GDP only increases by 2 percent and household consumption by 0.4 percent, which is
significantly lower than in the pre-privatization scenario. Much of this slower urban income growth arises
from slower growth in the public sector, which no longer benefits from higher copper revenues. As a
result, civil sector employment decreases as does the upward pressure on higher-skilled wages. Thus,
despite the smaller exchange rate effect in the post-privatization scenario, there is still a significant
decline in rural incomes at the lower end of the income distribution. Even after privatization, sufficient
linkages remain between the mining sector and the rest of the economy to potentially undermine
structural diversification and worsen income inequality.
Table 5. Changes in household consumption under model scenarios
Percentage change from base
Pre-
privatization price shock
Post-privatization price shock
Increased foreign
investment
Increased mining taxes
Per capita expenditure
in 2002 (1000 kwacha)
(Scenario 1) (Scenario 2) (Scenario 3) (Scenario 4)
All households 295 9.0 0.4 2.4 4.5
Rural households 177 3.1 -0.5 0.2 1.1 First quintile 58 -6.4 -3.2 -5.0 -5.9 Second quintile 92 -3.9 -2.3 -3.4 -3.8 Third quintile 111 -0.1 -1.4 -1.6 -1.3 Fourth quintile 227 3.1 -0.5 0.2 1.1 Fifth quintile 392 7.0 0.5 2.2 3.8
Urban households 492 12.5 1.0 3.8 6.6 First quintile 141 9.4 0.2 2.3 4.5 Second quintile 206 13.8 1.5 4.6 7.7 Third quintile 348 15.0 1.9 5.4 8.6 Fourth quintile 483 14.1 1.5 4.7 7.7 Fifth quintile 1,226 11.3 0.6 3.0 5.7
Source: Results from the Zambia CGE model.
The model does not capture positive externalities arising from technology spillovers. However,
this may not severely limit the applicability of the findings, because it is not clear if Africa’s enclave
mining sectors generate substantial spillovers. Africa’s experience with state enterprises has been similar
to that of Zambia, where state mining operations were plagued by inefficiency and rent-seeking. It is
reasonable to expect that a return to state ownership will produce similar inefficiencies and
16
macroeconomic instability, which will limit positive externalities. Based on this assumption, the results
suggest that even under the post-privatization conditions of privatized and foreign-owned mines, the
threat of Dutch disease remains. Moreover, the current resource boom may not lead to the expansion of
the urban economy, which in the past has bolstered demand for rural agricultural goods. Consequently,
rural households are likely to find themselves facing negative consequences similar to those they have
faced during earlier resource booms.
Increasing Foreign Mining Investments
In Scenarios 1 and 2 we only considered an increase in world copper prices. But foreign investments in
both existing and new mines have increased substantially as well. While the rehabilitation of previously
state-owned mines will improve the profitability of current mining, investments in new mines should
generate additional jobs that may offset the negative outcomes of purely price-driven growth. In a third
scenario we return to post-privatization conditions and impose on the model both the increase in world
copper prices and an expansion of FDI in Zambia’s mining sector. To capture the effects of new
investments in the model, we assume that mining capital increases by 50 percent. This is similar to the
increase in mining FDI for Zambia during 2003-2006.
Most of the new mining investment in Zambia will generate demand for imported rather than
domestic goods. This implies that new FDI inflows will broadly be matched by capital outflows from
imports. Thus, while increasing FDI in the model causes the share of foreign investment in GDP to rise,
imported capital goods offset this capital inflow (see Table 3). FDI inflows therefore do not directly cause
real exchange rate appreciation.6 However, new capital does cause mining production and exports to
increase substantially, more than it does in Scenario 2.7 This again places pressure on the current account,
causing a significant appreciation of the real exchange rate, which undermines the competitiveness of
non-mining exports and encourages import competition in domestic markets.
Agriculture and manufacture are hurt by falling competitiveness, especially in the more export-
intensive sectors, where demand for lower-skilled workers declines as a result (see Table 4). The high
capital intensity of mining production means that it does not generate new jobs sufficient to offset those
being lost in other sectors. Rising mining production does, however, generate demand for higher-skilled
workers and average GDP per capita grows by 9 percent, which is substantially higher than in scenarios
without additional FDI inflows. But urban households again benefit more than rural households (see
6 In the short-run there may be a real exchange rate appreciation if financial inflows precede imported capital goods.
However, in the long-run these flows offset each other and all effects arise through changes in production and exports. 7 Scenario 3 is equivalent to Scenario 2 but with the additional impact of increased foreign mining investment. To gauge the
impact of mining FDI in isolation from price effects, we therefore compare the outcomes of Scenario 3 with those of Scenario 2 rather than with base values.
17
Table 5). Additional mining growth bolsters urban incomes and consumption, which grow more rapidly
than in Scenario 2. Average rural incomes also rise, but this hides worsening inequality within rural areas.
Rural households in the higher income quintiles benefit more from cheaper imported goods and from
rising high-skilled wages, especially in the rural public sector.
The results from the model indicate that, despite encouraging economic growth and raising
average incomes, higher world prices for metals undermine structural diversification and worsen income
inequality. Privatization has reduced the severity of Dutch disease by limiting the exchange rate effect.
However, this does not mitigate the negative consequences for lower-income rural households. Thus,
resource booms in post-privatization Africa generate the same adverse effects on poor rural households,
but lead to a more limited expansion of the public sector and thus smaller increases in urban incomes.
Furthermore, while mining tax revenues do increase as a result of increased FDI, African governments are
constrained in their ability to offset adverse distributional outcomes because they no longer capture a
significant share of mining profits. It is not surprising that many African governments have begun
negotiating increases in mining taxes.
Increasing Mining Taxes
There is mounting pressure on African governments to raise mining taxes. The previous scenario showed
how households in Zambia will not benefit as greatly from the current resource boom as they have done
in the past. This raises political pressure from an influential urban constituency that is only partly offset
by cheaper imports for urban consumers. Urban constituents may advocate mining taxes as a means of
financing public-sector wages and employment. In rural areas, agricultural exporters are also adversely
affected by the resource boom. In Zambia, as elsewhere, agricultural exporters are often foreign
companies that have taken advantage of improved post-privatization conditions. These large-scale
producers can also place considerable pressure on the government, especially since poverty reduction in
Zambia over the last two decades has been driven mostly by export agriculture. Rural constituents may
favor mining taxes as a means of generating public investments in rural areas or subsidizing agricultural
inputs. Finally, many development experts are recommending royalty and mining taxes as a means of
harnessing some of the windfall gains in order to generate poverty-reducing growth (IMF 2006a). In a
fourth scenario we extend Scenario 3 by including the additional impact of increasing mining royalty
rates from 2 percent to 15 percent.8 This is an ad hoc adjustment, broadly similar to mining royalties in
Asia but higher than in Latin America (Otto et al. 2006).
8 Scenario 4 is same as Scenario 3 except that mining taxes are now increased to 10 percent. To gauge the impact of tax
increases alone, we compare the results from Scenario 4 with those of Scenario 3 rather than with base values.
18
Raising mining taxes generates model results closer to the pre-privatization scenario. Additional
mining revenues permit higher public investment and recurrent expenditures (see Table 3). Per capita
GDP grows by 14 percent, which is only 6 percentage points below the growth generated under pre-
privatization conditions. However, since a larger share of mining profits remains within Zambia, there is
greater pressure on the real exchange rate, which appreciates further. This reduces the price of imports
and the competitiveness of both non-mining and mining exports, which decline as a share of GDP. Again,
export agriculture and manufacturing suffer under a more appreciated real exchange rate (see Table 4).
There is also greater resource competition, especially for higher-skilled workers in the expanded public
sector. This drives up skilled wages, thus raising urban incomes and consumption (see Table 5). Higher-
income rural households benefit from higher skilled wages and cheaper imports, while low-income rural
households consume less because of greater import competition for agricultural goods and falling low-
skilled employment rates and wages.
The results show that increasing mining taxes raises average incomes, but may worsen income
inequality. Although we assume in the model that the government uses mining taxes to finance recurrent
expenditure and public investment, we do not fully capture the positive effects of this investment. While it
is beyond the scope of this paper to determine the specific policies needed for Zambia to replicate the
successful growth strategies of countries such as Chile or Indonesia, we do estimate the funds required to
compensate rural households for the losses they incur as a result of the boom. This depends both on the
level of available resources and the efficiency of their use. Here the model can provide a rough estimate
of the required efficiency. First, we calculate the resources needed to compensate households whose
incomes decline after the resource boom (i.e., the first three rural quintiles, see Table 5). The ratio of the
value of transfers required to additional mining revenues collected is 0.047. This means that US$47 out of
every US$1000 of mining royalties collected would have to be transferred to lower-income rural
households to ensure Pareto neutrality. While this transfer efficiency seems relatively low, it does not
prevent income inequality from rising. To ensure both Pareto and distributional neutrality, the
government would require a transfer-to-royalty ratio of 0.695. This high level of efficiency demanded of
the government reflects the difficulty of ensuring that the current resource boom benefits all sections of
the population.
19
4. CONCLUSIONS
In reviewing the current resource boom we find that much of the rise in world mineral prices and foreign
investments in Africa have been driven by Asian growth. This has caused real exchange rates to
appreciate in mineral-rich African countries, raising concerns about Dutch disease. However,
privatization has left many of Africa’s previously state-owned mines in the hands of foreign companies,
implying that mining profits are now more likely to be remitted abroad than added to government
revenues. In this paper we have examined the impact of the resource boom on a typical resource-rich
African country. We have asked whether the generous tax incentives offered to foreign mining companies
have reduced the growth opportunities arising from resource booms, and conversely, whether
privatization has reduced the negative consequences typically associated with resource booms in Sub-
Saharan Africa.
We developed a simple CGE model of Zambia to contrast the growth and distributional impacts
of rising world minerals prices before and after privatization. We find that most of the profits from rising
copper prices now accrue to foreign companies. As such, per capita incomes grow by 2 percent, which is
significantly below the 20 percent increase that would have been achieved prior to privatization. This is
largely because urban households no longer benefit from high public-sector employment, which had
previously been financed by mining tax revenues. By contrast, there is little change in expected outcomes
for rural households, whose incomes are still undermined by falling agricultural export competitiveness
and cheaper imported foods, and now also by lower urban demand for domestic agricultural goods.
New mining FDI raises per capita GDP, but it also reduces structural diversification and income
equality, without generating substantial additional government revenues. The government has many
incentives to increase mining taxes. We find, however, that although higher taxes on mining profits raises
GDP significantly, it further undermines sectoral diversification and income distribution. Thus, while
African governments should seek additional tax revenues from mining companies, these revenues must be
directed towards investments that enhance productivity and the competitiveness of non-mineral sectors.
Tax revenues can also be used to compensate poorer rural households, whose incomes are undermined by
the resource boom. In the case of Zambia we estimate that 5 percent of mining royalties need to be
transferred to prevent rural incomes from falling, while larger transfers are needed to mitigate rising
income inequality.
The results suggest that privatization has indeed altered the context of resource booms and that it
raises new challenges for African governments. While private ownership will undoubtedly bolster the
previously-failing competitiveness of African mining, it will also transfer many of the benefits of resource
booms into foreign hands. African governments must raise taxes to finance the investments needed to
mitigate the adverse effects of the resource boom and direct their countries along a path of sustained and
poverty-reducing growth.
20
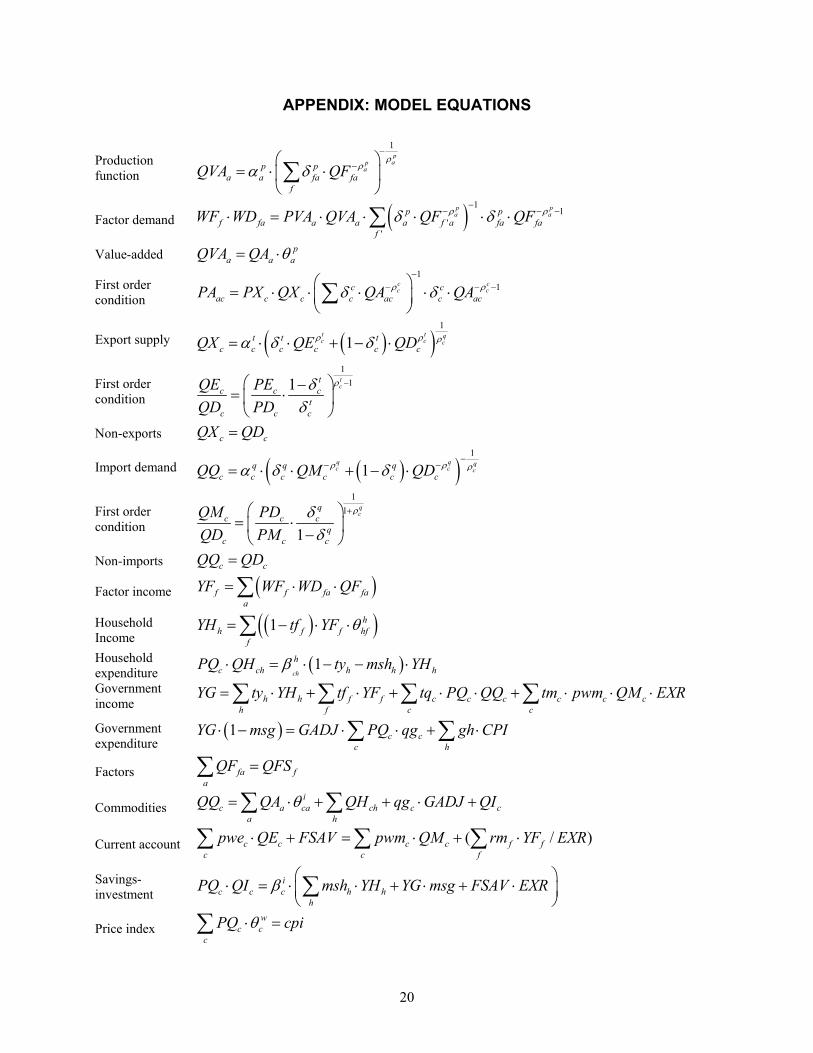
APPENDIX: MODEL EQUATIONS
Production function
1pap
ap pa a fa fa
f
QVA QFρ
ρα δ−
−⎛ ⎞= ⋅ ⋅⎜ ⎟
⎝ ⎠∑
Factor demand ( ) 11
''
p pa ap p
f fa a a a f a fa faf
WF WD PVA QVA QF QFρ ρδ δ−
− − −⋅ = ⋅ ⋅ ⋅ ⋅ ⋅∑
Value-added pa a aQVA QA θ= ⋅
First order condition
11c c
c cc cac c c c ac c acPA PX QX QA QAρ ρδ δ
−− − −⎛ ⎞= ⋅ ⋅ ⋅ ⋅ ⋅⎜ ⎟
⎝ ⎠∑
Export supply ( )( )1
1t t qc c ct t t
c c c c c cQX QE QDρ ρ ρα δ δ= ⋅ ⋅ + − ⋅
First order condition
111 t
ct
c c ct
c c c
QE PEQD PD
ρδδ
−⎛ ⎞−= ⋅⎜ ⎟⎝ ⎠
Non-exports c cQX QD=
Import demand ( )( )1
1q q qc c cq q q
c c c c c cQQ QM QDρ ρ ρα δ δ−
− −= ⋅ ⋅ + − ⋅
First order condition
11
1
qc
qc c c
qc c c
QM PDQD PM
ρδδ
+⎛ ⎞= ⋅⎜ ⎟−⎝ ⎠
Non-imports c cQQ QD=
Factor income ( )f f fa faa
YF WF WD QF= ⋅ ⋅∑
Household Income
( )( )1 hh f f hf
f
YH tf YF θ= − ⋅ ⋅∑
Household expenditure ( )1
ch
hc ch h h hPQ QH ty msh YHβ⋅ = ⋅ − − ⋅
Government income h h f f c c c c c c
h f c c
YG ty YH tf YF tq PQ QQ tm pwm QM EXR= ⋅ + ⋅ + ⋅ ⋅ + ⋅ ⋅ ⋅∑ ∑ ∑ ∑
Government expenditure
( )1 c cc h
YG msg GADJ PQ qg gh CPI⋅ − = ⋅ ⋅ + ⋅∑ ∑
Factors fa fa
QF QFS=∑
Commodities i
c a ca ch c ca h
QQ QA QH qg GADJ QIθ= ⋅ + + ⋅ +∑ ∑
Current account ( / )c c c c f fc c f
pwe QE FSAV pwm QM rm YF EXR⋅ + = ⋅ + ⋅∑ ∑ ∑
Savings-investment
ic c c h h
hPQ QI msh YH YG msg FSAV EXRβ ⎛ ⎞⋅ = ⋅ ⋅ + ⋅ + ⋅⎜ ⎟
⎝ ⎠∑
Price index w
c cc
PQ cpiθ⋅ =∑
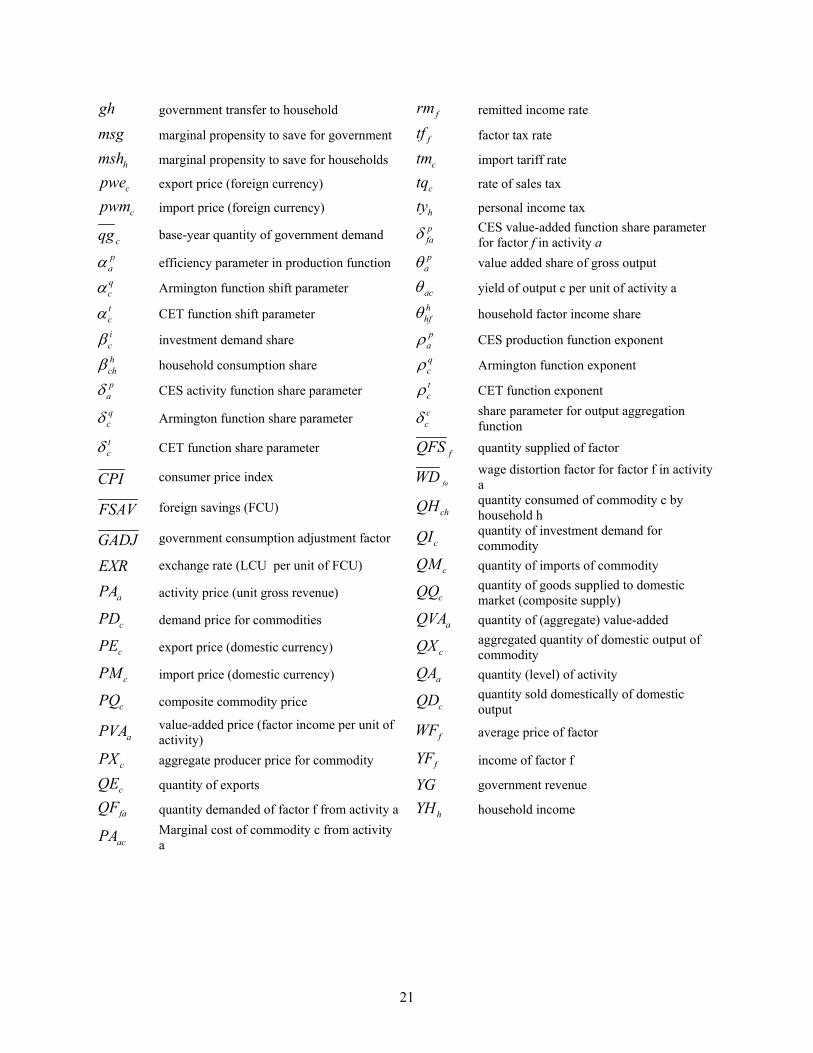
21
gh government transfer to household frm remitted income rate
msg marginal propensity to save for government ftf factor tax rate
hmsh marginal propensity to save for households ctm import tariff rate
cpwe export price (foreign currency) ctq rate of sales tax
cpwm import price (foreign currency) hty personal income tax
cqg base-year quantity of government demand pfaδ CES value-added function share parameter
for factor f in activity a p
aα efficiency parameter in production function paθ value added share of gross output
qcα Armington function shift parameter acθ yield of output c per unit of activity a tcα CET function shift parameter h
hfθ household factor income share icβ investment demand share p
aρ CES production function exponent hchβ household consumption share q
cρ Armington function exponent p
aδ CES activity function share parameter tcρ CET function exponent
qcδ Armington function share parameter c
cδ share parameter for output aggregation function
tcδ CET function share parameter fQFS quantity supplied of factor
CPI consumer price index faWD wage distortion factor for factor f in activity a
FSAV foreign savings (FCU) chQH quantity consumed of commodity c by household h
GADJ government consumption adjustment factor cQI quantity of investment demand for commodity
EXR exchange rate (LCU per unit of FCU) cQM quantity of imports of commodity
aPA activity price (unit gross revenue) cQQ quantity of goods supplied to domestic market (composite supply)
cPD demand price for commodities aQVA quantity of (aggregate) value-added
cPE export price (domestic currency) cQX aggregated quantity of domestic output of commodity
cPM import price (domestic currency) aQA quantity (level) of activity
cPQ composite commodity price cQD quantity sold domestically of domestic output
aPVA value-added price (factor income per unit of activity) fWF average price of factor
cPX aggregate producer price for commodity fYF income of factor f
cQE quantity of exports YG government revenue
faQF quantity demanded of factor f from activity a hYH household income
acPA Marginal cost of commodity c from activity a
22
REFERENCES
Auty, R.M. 1990. Resource-based industrialization: Sowing the oil in eight developing countries. Oxford: Clarendon Press.
_______. 1991. Third World response to global processes: The mineral economies. Professional Geographer 43(1): 68-76.
_______. 1993. Sustaining development in mineral economies: The resource curse. London: Routledge.
_______. 1997. Natural resource endowment, the state and development strategy. Journal of International Development 9(4): 651-663.
Campell, B. 2006. Better resource governance in Africa – On what development Agenda? Paper presented at UNCTAD Expert Meeting on FDI in Natural Resources. Geneva.
Collier., P. 2006. African growth: Why a big push? Journal of African Economies (AERC Supplement 2): 188-211.
Davis, G. A. 1995. Learning to love the Dutch disease: Evidence from the mineral economies, World Development 23(10):1765-1779.
Diao, X., P. Hazell, D. Resnick, and J. Thurlow. 2007. The role of agriculture in development: Implications for Sub-Sahara Africa. Research Report 153. Washington, DC: IFPRI.
Ding, N., and B. Field. 2005. Natural resource abundance and economic growth. Land Economics 81(4): 496-502.
Emerson, C. 1982. Mining enclaves and taxation. World Development 10(7): 561-571.
Fynn, J., and S. Haggblade. 2006. Potential impact of the Kwacha appreciation and proposed tax provisions of the 2006 budget act on Zambian agriculture, Food Security Research Project, Working Paper 16. East Lansing, MI, USA: Michigan State University.
Gelb, A.H., and associates. 1988. Windfall gains: blessing or curse? New York: Oxford University Press.
Goldstein, A., N. Pinaud, H. Reisen, and X. Chen. 2006. The rise of China and India. What’s in it for Africa? OECD Development Centre Studies. Paris: OECD.
Gylafson, T. 2001. Natural resources, education, and economic development, European Economic Review 45: 847-859.
IMF (International Monetary Fund). 2006a. The boom in nonfuel commodity prices: Can it last? In World economic outlook: Globalization and inflation. Chapter 5. Washington, DC.
_______. 2006b. Guinea: Selected issues and statistical appendix. Washington, DC.
________. 2007a. International finance statistics. Washington, D.C.
________, 2007b. Zambia IMF country report no. 07/20. Washington, D.C.
Lederman, D., and W. Maloney. 2003. Trade structure and growth. World Bank Policy Research Working Paper 3025. Washington, DC: World Bank.
Markusen, J.R., and A. Venables. 1999. Foreign direct investment as a catalyst for industrial development, European Economic Review 43(2): 335-356.
Otto, J., C. Andrews, F. Cawood, M. Doggett, P. Guj, F. Stermole, J. Stermole, and J. Tilton. 2006. Mining royalties. A global study of their impact on investors, government, and civil society. Directions in Development, Energy and Mining. Washington, DC: World Bank.
Page, J., 2006. Strategies for pro-poor growth: Pro-poor, pro-Growth or both? Journal of African Economies 15(4): 510-542.
Robinson, J.A., R. Torvik, and T. Verdier. 2006. Political foundations of the resource curse. Journal of Development Economics 79: 447– 468.

23
Rodrik D., ed. 2003. In search of prosperity: Analytic narratives on economic growth. Princeton, NJ, USA: Princeton University Press.
Sachs, J.D., and A. Warner. 1999. The big push, Natural resource booms and growth. Journal of Development Economics 59:43-76.
Sachs, J.D., and A. Warner. 2001. The curse of natural resources. European Economic
Review 45:827-838.
Temple, J. 2003. Growing into trouble: Indonesia after 1966. In search of prosperity - Analytical narratives on economic growth, ed. D. Rodrik. Princeton, NJ, USA: Princeton University Press.
Thurlow, J., and P. Wobst. 2006. Not all growth is equally good for the poor: The case of Zambia, Journal of African Economies 15(4): 603-625.
Torvik, R. 2001. Learning by doing and the Dutch disease, European Economic Review 45: 285-306.
UNCTAD. 2005a. Trade and development report: New features of global interdependence. New York and Geneva.
_________. 2005b. Economic development in Africa – Rethinking the role of foreign direct investments. New York and Geneva.
_________. 2006. FDI from transition and developing economies: Implications for development. World Investment Report. New York and Geneva.
UNIDO. 2004. “Industrialization, Environment and the Millennium Development Goals in Sub-Saharan Africa: The New Frontier in the Fight Against Poverty.” Industrial Development Report 2004, United Nations Industrial Development Organization, Vienna.
World Bank. 2006a. Global development finance: The development potential of surging capital flows. I: Review, analysis and outlook. Washington, DC.
_________. 2006b. The outlook for metals markets. Background paper prepared for G20 Deputies Meeting, Sydney. Washington, DC.
_________. 2007. World development indicators. Washington, D.C.


RECENT IFPRI DISCUSSION PAPERS
For earlier discussion papers, please go to www.ifpri.org/pubs/pubs.htm#dp. All discussion papers can be downloaded for free.
746. Trading millet and sorghum genetic resources: Women vendors in the village fairs of San and Douentza, Mali. Melinda Smale, Brahima Dembélé, Issa Seni Traoré, Oumar Guindo, Bouréma Konta, 2008.
745. Determinants of smallholder commercialization of food crops: Theory and evidence from Ethiopia. John Pender and Dawit Alemu, 2007.
744. Benefit-cost analysis of Uganda’s clonal coffee replanting program: An ex-ante analysis. Samuel Benin and Liangzhi You, 2007.
743. The impact of CAFTA on poverty, distribution, and growth in El Salvador. Samuel Morley, Eduardo Nakasone and Valeria Piñeiro, 2007.
742. Impact of contract farming on income: Linking small farmers, packers, and supermarkets in China. Sachiko Miyata, Nicholas Minot, and Dinghuan Hu, 2007.
741. Spatial coordination in public good allocation: Nonparametric evidence from decentralized Indonesia. Futoshi Yamauchi, Shyamal Chowdhury, and Reno Dewina, 2007.
740. Genetically modified food and international trade: The case of India, Bangladesh, Indonesia, and the Philippines. Guillaume Gruère, Antoine Bouët, and Simon Mevel, 2007.
739. Income growth and gender bias in childhood mortality in developing countries. Mike Ueyama, 2007.
738. Seed provision and dryland crops in the semiarid regions of eastern Kenya. Latha Nagarajan, Patrick Audi, Richard Jones, and Melinda Smale, 2007.
737. Food safety requirements in African green bean exports and their impact on small farmers, Julius Juma Okello. Clare Narrod, and Devesh Roy, 2007.
736. Strengthening agricultural education and training in Sub-Saharan Africa from an innovation systems perspective: Case studies of Ethiopia and Mozambique. Kristin Davis, Javier Ekboir, Wendmsyamregne Mekasha, Cosmas M.O. Ochieng, David J. Spielman, and Elias Zerfu, 2007.
735. Gobernabilidad de los sistemas de innovación en Bolivia: Lecciones para las políticas de innovación agrícola. Frank Hartwich, Anastasia Alexaki, and René Baptista, 2007.
734. A typology for vulnerability and agriculture in Sub-Saharan Africa. Xiaobo Zhang, Marc Rockmore, and Jordan Chamberlin, 2007.
733. Impact of soil conservation on crop production in the Northern Ethiopian Highlands. Menale Kassie, John Pender, Mahmud Yesuf, Gunnar Kohlin, Randy Bluffstone, and Elias Mulugeta, 2007.
732. Innovation systems governance in Bolivia: Lessons for agricultural innovation policies. Frank Hartwich, Anastasia Alexaki, and René Baptista, 2007.
731. The human right to food as a U.S. nutrition concern, 1976-2006. Ellen Messer and Marc Cohen, 2007.
730. Measuring and accounting for community capabilities in Kordofan, Sudan. Khalid El Harizi and Heather Klemick, 2007.
729. How to make agricultural extension demand-driven?: The case of India’s agricultural extension policy. Regina Birner and Jock Anderson, 2007.
728. Urbanization, educational expansion, and expenditures inequality in Indonesia in 1996, 1999, and 2002. Takahiro Akita and Sachiko Miyata, 2007.
727. Diversification in Indian agriculture towards high-value crops: The role of smallholders. P. S. Birthal, P. K. Joshi, Devesh Roy, and Amit Thorat
726. Farmer preferences for milpa diversity and genetically modified maize in Mexico: A latent class approach. Ekin Birol, Eric Rayn Villalba, Melinda Smale, 2007.
725. Generating plausible crop distribution and performance maps for Sub-Saharan Africa using a spatially disaggregated data fusion and optimization approach. Liangzhi You, Stanley Wood, and Ulrike Wood-Sichra, 2007.
INTERNATIONAL FOOD POLICY RESEARCH INSTITUTE
www.ifpri.org
IFPRI HEADQUARTERS
2033 K Street, NW Washington, DC 20006-1002 USA Tel.: +1-202-862-5600 Fax: +1-202-467-4439 Email: [email protected]
IFPRI ADDIS ABABA
P. O. Box 5689 Addis Ababa, Ethiopia Tel.: +251 11 6463215 Fax: +251 11 6462927 Email: [email protected]
IFPRI NEW DELHI
CG Block, NASC Complex, PUSA New Delhi 110-012 India Tel.: 91 11 2584-6565 Fax: 91 11 2584-8008 / 2584-6572 Email: [email protected]


![Reversing and Malware Analysis Training Articles [2012] . cracking/Reversing... · Reversing and Malware Analysis Training Articles ... Step 1: Start with what you ... Reversing and](https://img.pdfslide.net/doc/110x75/5ab905fd7f8b9ac10d8db0ab/reversing-and-malware-analysis-training-articles-2012-crackingreversingreversing.jpg)