Embed Size (px)
Citation preview

ASIAN DEVELOPMENT BANK
ASIAN ECONOMICINTEGRATIONREPORT 2017THE ERA OF FINANCIAL INTERCONNECTEDNESS How Can Asia Strengthen Financial Resilience?


ASIAN DEVELOPMENT BANK
ASIAN ECONOMICINTEGRATIONREPORT 2017THE ERA OF FINANCIAL INTERCONNECTEDNESS How Can Asia Strengthen Financial Resilience?

Creative Commons Attribution 3.0 IGO license (CC BY 3.0 IGO)
© 2017 Asian Development Bank6 ADB Avenue, Mandaluyong City, 1550 Metro Manila, PhilippinesTel +63 2 632 4444; Fax +63 2 636 2444www.adb.org; openaccess.adb.org
Some rights reserved. Published in 2017.
ISBN 978-92-9257-977-7 (Print), 978-92-9257-978-4 (Electronic)Publication Stock No. TCS179038-2DOI: http://dx.doi.org/10.22617/TCS179038-2
The views expressed in this publication are those of the authors and do not necessarily reflect the views and policiesof the Asian Development Bank (ADB) or its Board of Governors or the governments they represent.
ADB does not guarantee the accuracy of the data included in this publication and accepts no responsibility for anyconsequence of their use. The mention of specific companies or products of manufacturers does not imply that theyare endorsed or recommended by ADB in preference to others of a similar nature that are not mentioned.
By making any designation of or reference to a particular territory or geographic area, or by using the term “country”in this document, ADB does not intend to make any judgments as to the legal or other status of any territory or area.
This work is available under the Creative Commons Attribution 3.0 IGO license (CC BY 3.0 IGO)https://creativecommons.org/licenses/by/3.0/igo/. By using the content of this publication, you agree to be boundby the terms of this license. For attribution, translations, adaptations, and permissions, please read the provisionsand terms of use at https://www.adb.org/terms-use#openaccess
This CC license does not apply to non-ADB copyright materials in this publication. If the material is attributedto another source, please contact the copyright owner or publisher of that source for permission to reproduce it.ADB cannot be held liable for any claims that arise as a result of your use of the material.
Please contact [email protected] if you have questions or comments with respect to content, or if you wishto obtain copyright permission for your intended use that does not fall within these terms, or for permission to usethe ADB logo.
Notes:In this publication, “$” refers to US dollars.Corrigenda to ADB publications may be found at http://www.adb.org/publications/corrigendaADB recognizes “China” as the People’s Republic of China; “Hong Kong” as Hong Kong, China; and “Korea” as the Republicof Korea.
CONTENTSForeword . . . . . . . . . . . . . . . . . . . . . . . . . . . . . . . . . . . . . . . . . . . . . . . . . . . . . . . viAcknowledgments . . . . . . . . . . . . . . . . . . . . . . . . . . . . . . . . . . . . . . . . . . . . . . viiDefinitions . . . . . . . . . . . . . . . . . . . . . . . . . . . . . . . . . . . . . . . . . . . . . . . . . . . . . . viiiAbbreviations . . . . . . . . . . . . . . . . . . . . . . . . . . . . . . . . . . . . . . . . . . . . . . . . . . . ixHighlights . . . . . . . . . . . . . . . . . . . . . . . . . . . . . . . . . . . . . . . . . . . . . . . . . . . . . . . xi
1. REGIONAL OUTLOOK, LINKAGES, AND VULNERABILITIES . . . . . . . . . . . . . . . . . . . . . . . . . . . . . . 1 Regional Outlook, Integration, and Challenges . . . . . . . . . . . . . . . . 2 Transmission Mechanism . . . . . . . . . . . . . . . . . . . . . . . . . . . . . . . . . . . . 4 Emerging Vulnerabilities . . . . . . . . . . . . . . . . . . . . . . . . . . . . . . . . . . . . . . 6 Coping Mechanisms . . . . . . . . . . . . . . . . . . . . . . . . . . . . . . . . . . . . . . . . . 8 Concluding Remarks . . . . . . . . . . . . . . . . . . . . . . . . . . . . . . . . . . . . . . . . . 11 References . . . . . . . . . . . . . . . . . . . . . . . . . . . . . . . . . . . . . . . . . . . . . . . . . . . 11
Box 1.1: Trade Volume Outlook For Asia . . . . . . . . . . . . . . . . . . . . . . . . . . . 5
2. TRADE AND THE GLOBAL VALUE CHAIN . . . . . . . . . . . . . 13 Recent Trends in Asia’s Trade . . . . . . . . . . . . . . . . . . . . . . . . . . . . . . . . . 14 Asia’s Intraregional Trade . . . . . . . . . . . . . . . . . . . . . . . . . . . . . . . . . . . . . . 16 Progress of Global and Regional Value Chains . . . . . . . . . . . . . . . . . 18 Updates on Regional Trade Policy . . . . . . . . . . . . . . . . . . . . . . . . . . . . . 19 References . . . . . . . . . . . . . . . . . . . . . . . . . . . . . . . . . . . . . . . . . . . . . . . . . . . . 23
Box 2.1: Gravity Model Estimation of Bilateral Exports . . . . . . . . . . . . . . 17
3. CROSS-BORDER INVESTMENT . . . . . . . . . . . . . . . . . . . . . . . 25 Trends and Patterns of FDI in Asia . . . . . . . . . . . . . . . . . . . . . . . . . . . . 26 Outward FDI . . . . . . . . . . . . . . . . . . . . . . . . . . . . . . . . . . . . . . . . . . . . . . . . . 30 References . . . . . . . . . . . . . . . . . . . . . . . . . . . . . . . . . . . . . . . . . . . . . . . . . . . . 36 Box 3.1: Outward Investments from Selected Asian Economies . . . . . 33
iii

Asian Economic Integration Report 2017iv Subregional Cooperation Initiatives viv
4. FINANCIAL INTEGRATION . . . . . . . . . . . . . . . . . . . . . . . . . . . 37 Progress in Cross-border Financial Transactions . . . . . . . . . . . . . . . 38 Analysis using Price Indicators . . . . . . . . . . . . . . . . . . . . . . . . . . . . . . . . . 49 Financial Spillovers . . . . . . . . . . . . . . . . . . . . . . . . . . . . . . . . . . . . . . . . . . . . 52 References . . . . . . . . . . . . . . . . . . . . . . . . . . . . . . . . . . . . . . . . . . . . . . . . . . . . 55
Box 4.1: Asia’s Cross-border Collateral Agreements . . . . . . . . . . . . . . . . . 47
5. REMITTANCES AND TOURISM RECEIPTS . . . . . . . . . . . . . 57 Remittance Flows to Asia . . . . . . . . . . . . . . . . . . . . . . . . . . . . . . . . . . . . . 58 Tourism Receipts . . . . . . . . . . . . . . . . . . . . . . . . . . . . . . . . . . . . . . . . . . . . . 62 References . . . . . . . . . . . . . . . . . . . . . . . . . . . . . . . . . . . . . . . . . . . . . . . . . . . . 64
Box 5.1: Understanding the Sources of Fluctuations in Remittance Inflows . . . . . . . . . . . . . . . . . . . . . . . . . . . . . . . . . . . . . 61
6. SUBREGIONAL COOPERATION INITIATIVES . . . . . . . . . 65 Central and West Asia: Central Asia Regional Economic
Cooperation Program . . . . . . . . . . . . . . . . . . . . . . . . . . . . . . . . . . . . . . . . . 66 Southeast Asia: Greater Mekong Subregion Program . . . . . . . . . . . 69 East Asia: Support to CAREC and GMS Programs . . . . . . . . . . . . . . 73 South Asia: South Asia Subregional Economic Cooperation . . . . 75 The Pacific: Regional Approach to Renewable Energy Investments . . . . . . . . . . . . . . . . . . . . . . . . . . . . . . . . . . . . . . . . . . . . . . . 79 Toward Regional Connectivity . . . . . . . . . . . . . . . . . . . . . . . . . . . . . . . . . 81 References . . . . . . . . . . . . . . . . . . . . . . . . . . . . . . . . . . . . . . . . . . . . . . . . . . . . 83
7. ASIA-PACIFIC REGIONAL COOPERATION AND INTEGRATION INDEX . . . . . . . . . . . . . . . . . . . . . . . . . . . 85
References . . . . . . . . . . . . . . . . . . . . . . . . . . . . . . . . . . . . . . . . . . . . . . . . . . . . 91 Annex . . . . . . . . . . . . . . . . . . . . . . . . . . . . . . . . . . . . . . . . . . . . . . . . . . . . . . . . 92
Box 7.1: Constructing the Asia-Pacific Regional Cooperation and Integration Index . . . . . . . . . . . . . . . . . . . . . . . . . . . . . . . . . . . . . . 87

Asian Economic Integration Report 2017iv Subregional Cooperation Initiatives vv
8. THEME CHAPTER THE ERA OF FINANCIAL INTERCONNECTEDNESS:
HOW CAN ASIA STRENGTHEN FINANCIAL RESILIENCE? . . . . . . . . . . . . . . . . . . . . . . . . . . . . . . . . . . . . . . . . . 95 Introduction . . . . . . . . . . . . . . . . . . . . . . . . . . . . . . . . . . . . . . . . . . . . . . . . . . 96 Experiences and Lessons from Past Crises . . . . . . . . . . . . . . . . . . . . . 97 Financial Conditions, Vulnerabilities, and Cycles in Asia . . . . . . . . 101 New Global Financial Conditions and Vulnerabilities . . . . . . . . . . 108 Asia’s Financial Interconnectedness, Transmission, and Spillovers of Shocks and Risks . . . . . . . . . . . . . . . . . . . . . . . . . . . . . . 110 Conclusions and Policy Considerations . . . . . . . . . . . . . . . . . . . . . . . . 125 Background Papers. . . . . . . . . . . . . . . . . . . . . . . . . . . . . . . . . . . . . . . . . . . . 130 References . . . . . . . . . . . . . . . . . . . . . . . . . . . . . . . . . . . . . . . . . . . . . . . . . . . . 131 Annex . . . . . . . . . . . . . . . . . . . . . . . . . . . . . . . . . . . . . . . . . . . . . . . . . . . . . . . . 134
Boxes 8.1: The Influence of US Dollar Funding Conditions on Asia’s Financial Markets . . . . . . . . . . . . . . . . . . . . . . . . . . . . . . . . . . . 106 8.2: Deriving Asia’s Financial Sector Network: Data, Methodology, and Model . . . . . . . . . . . . . . . . . . . . . . . . . . . . . . . . . 111 8.3: Assessing Interbank Contagion During the Global Financial Crisis: Data, Methodology, and Model . . . . . . . . . . . . 117 8.4: Estimating Macrofinancial Implications of Nonperforming Loans: Data, Methodology, and Model . . . . 122 9. STATISTICAL APPENDIX . . . . . . . . . . . . . . . . . . . . . . . . . . . . . 137

Asian Economic Integration Report 2017vi Subregional Cooperation Initiatives vii
FOREWORDThis year’s Asian Economic Integration Report (AEIR) continues to chronicle progress in regional cooperation and integration (RCI) in Asia and the Pacific. Despite an improved global economic outlook, elevated uncertainty in the international policy environment continues to weigh on global trade. Although world trade is expected to recover this year, its growth remains weaker than income growth following further deceleration in 2016. Foreign direct investment (FDI) worldwide also dropped 2% last year. Yet, the trend of RCI in Asia and the Pacific is gaining momentum, providing a buffer against the fallout from increasingly inward-looking policies around the world. Asia’s intraregional trade share—measured by value—rose to 57.3% in 2016 from 56.9% in 2015, up from an average 55.9% during 2010–2015. Intraregional FDI share also grew to 55.3% in 2016 from 47.6% in 2015. Asia’s cross-border bank claims increased to $4.4 trillion from $4.1 trillion. Asia’s international tourism receipts are increasingly sourced from other Asian economies, with more than 70% of Asia’s outbound tourists traveling within the region.
To better monitor this progress, AEIR 2017 introduces the Asia-Pacific Regional Cooperation and Integration Index (ARCII), a newly created composite index that allows comparative analysis of six RCI dimensions across subregional groups and economies. Its six component indexes cover: (i) trade and investment, (ii) money and finance, (iii) regional value chains, (iv) infrastructure and connectivity, (v) movement of people, and (vi) institutional and social integration. RCI in Asia and the Pacific, while significantly behind the European Union, ranks above both Africa and Latin America. Within the region, ARCII shows RCI is most advanced in East Asia and Southeast Asia, drawing on the expansion of regional trade and FDI networks linked to global supply chains.
AEIR 2017 includes a Theme Chapter on how best to enhance regional financial resilience as global financial systems become more interconnected. “The Era of Financial Interconnectedness: How Can Asia Strengthen Financial Resilience?” examines the structural weaknesses of the region’s financial systems, existing and emerging vulnerabilities, and the implications of increasingly more pronounced and procyclical financial cycles and financial interconnectedness. It investigates the evolution of financial networks and various channels through which financial shocks can be transmitted. And it specifically cites the region’s overreliance on external funding (largely denominated in US dollars) as one of many sources of potential vulnerability should the global financial cycle reverse and dollar liquidity tighten.
However, the Theme Chapter also shows that—20 years after the 1997/98 Asian financial crisis—wide-ranging reforms helped build national and regional financial resilience and safety net systems against the impact of external shocks—as seen by Asia’s relative resilience to and rapid recovery from the 2008/09 global financial crisis. The chapter reviews crisis lessons and remaining policy gaps for further structural reforms needed to further strengthen financial resilience. The region’s policy makers need to continue reforms that ensure good macroeconomic fundamentals, build strong regulatory and supervisory frameworks, deepen alternative sources of market financing such as local currency bond market transactions, and further strengthen financial safety nets. Finally, the region’s continued cooperation to ensure financial stability will allow authorities in Asia and the Pacific to respond promptly, decisively, and collectively should global risks and financial volatility pose risks to the region’s continued robust economic development.
Yasuyuki SawadaChief Economist and Director GeneralEconomic Research and Regional Cooperation DepartmentAsian Development Bank
Asian Economic Integration Report 2017vi Subregional Cooperation Initiatives vii
ACKNOWLEDGMENTSThe Asian Economic Integration Report (AEIR) 2017 was prepared by the Regional Cooperation and Integration Division (ERCI) of the Economic Research and Regional Cooperation Department (ERCD) of the Asian Development Bank (ADB), under the overall supervision of ERCI Director Cyn-Young Park. Jong Woo Kang coordinated overall production assisted by Mara Claire Tayag. ERCI consultants under Technical Assistance 9121: Asian Economic Integration—Building Knowledge for Policy Dialogue contributed data compilation, research, and analysis.
Contributing authors include James Villafuerte and with data support from Joy Blesilda Sinay and Pilar Dayag (Regional Outlook, Linkages, and Vulnerabilities); Jong Woo Kang, Mara Claire Tayag, Suzette Dagli, Dorothea Ramizo, and Paul Mariano (Trade and the Global Value Chain); Fahad Khan, Ma. Concepcion Latoja, Suzette Dagli, and Cindy Jane Justo (Cross-border Investment); Junkyu Lee, Kijin Kim, Satoru Yamadera, Ana Kristel Molina, and Racquel Claveria with data support from Clemence Fatima Cruz (Financial Integration); and Aiko Kikkawa Takenaka with data support from Grendell Vie Magoncia and Ma. Concepcion Latoja (Remittances and Tourism Receipts). The chapter “Subregional Cooperation Initiatives” was consolidated by Paulo Rodelio Halili based on contributions by regional departments of ADB: Shaista Hussain, Guoliang Wu, and Ronaldo Oblepias (Central and West Asia); Greater Mekong Subregion Secretariat (Southeast Asia); Ying Qian and Yuebin Zhang (East Asia); Rose McKenzie and Jesusito Tranquilino (South Asia); and Paul Curry and Rommel Rabanal (Pacific). The chapter on Asia-Pacific Regional Cooperation and Integration Index was written by Cyn-Young Park—based on a background paper by Cyn-Young Park and Hyeon-Seung Huh—with data support from Racquel Claveria. Junkyu Lee and Peter Rosenkranz coordinated and contributed to the production of the theme chapter, “The Era of Financial Interconnectedness: How Can Asia Strengthen Financial Resilience?” Background papers were provided by Ross Buckley, Stijn Claessens, Mardi Dungey, Junkyu Lee, Cyn-Young Park, Peter Rosenkranz, Kwanho Shin, and James Villafuerte. Monica Melchor, Jesson Pagaduan, Hoang Pham, and Alyssa Villanueva provided research support.
Guy Sacerdoti edited the report. Ariel Paelmo typeset and produced the layout. Erickson Mercado created the cover design and assisted in typesetting. Paulo Rodelio Halili and Aleli Rosario helped in proofreading. Support for AEIR 2017 printing and publishing was provided by the Printing Services Unit of ADB’s Office of Administrative Services and by the Publishing and Dissemination Unit of the Department of External Relations. Carol Ongchangco, Pia Asuncion Tenchavez, Maria Criselda Aherrera, and Marilyn Parra provided administrative and secretarial support, and helped organize the AEIR workshops, launch events, and other AEIR-related seminars. Harumi Kodama and Erik Churchill of the Department of External Relations coordinated dissemination of AEIR 2017.

Asian Economic Integration Report 2017viii Abbreviations ix
DEFINITIONSThe economies covered in the Asian Economic Integration Report 2017 are grouped by major analytic or geographic group.
● Asia refers to the 48 Asia and the Pacific members of the Asian Development Bank (ADB), which includes Japan and Oceania (Australia and New Zealand) in addition to the 45 developing Asian economies.
● Subregional economic groupings are listed below:
— Central Asia comprises Armenia, Azerbaijan, Georgia, Kazakhstan, the Kyrgyz Republic, Tajikistan, Turkmenistan, and Uzbekistan.
— East Asia comprises the People’s Republic of China; Hong Kong, China; Japan; the Republic of Korea; Mongolia; and Taipei,China.
— South Asia comprises Afghanistan, Bangladesh, Bhutan, India, Maldives, Nepal, Pakistan, and Sri Lanka.
— Southeast Asia comprises Brunei Darussalam, Cambodia, Indonesia, the Lao People’s Democratic Republic, Malaysia, Myanmar, the Philippines, Singapore, Thailand, and Viet Nam.
— The Pacific comprises the Cook Islands, Fiji, Kiribati, the Marshall Islands, the Federated States of Micronesia, Nauru, Papua New Guinea, Palau, Samoa, Solomon Islands, Timor-Leste, Tonga, Tuvalu, and Vanuatu.
— Oceania includes Australia and New Zealand.
Unless otherwise specified, the symbol “$” and the word “dollar” refer to US dollars, and percent changes are year-on-year.
Asian Economic Integration Report 2017viii Abbreviations ix
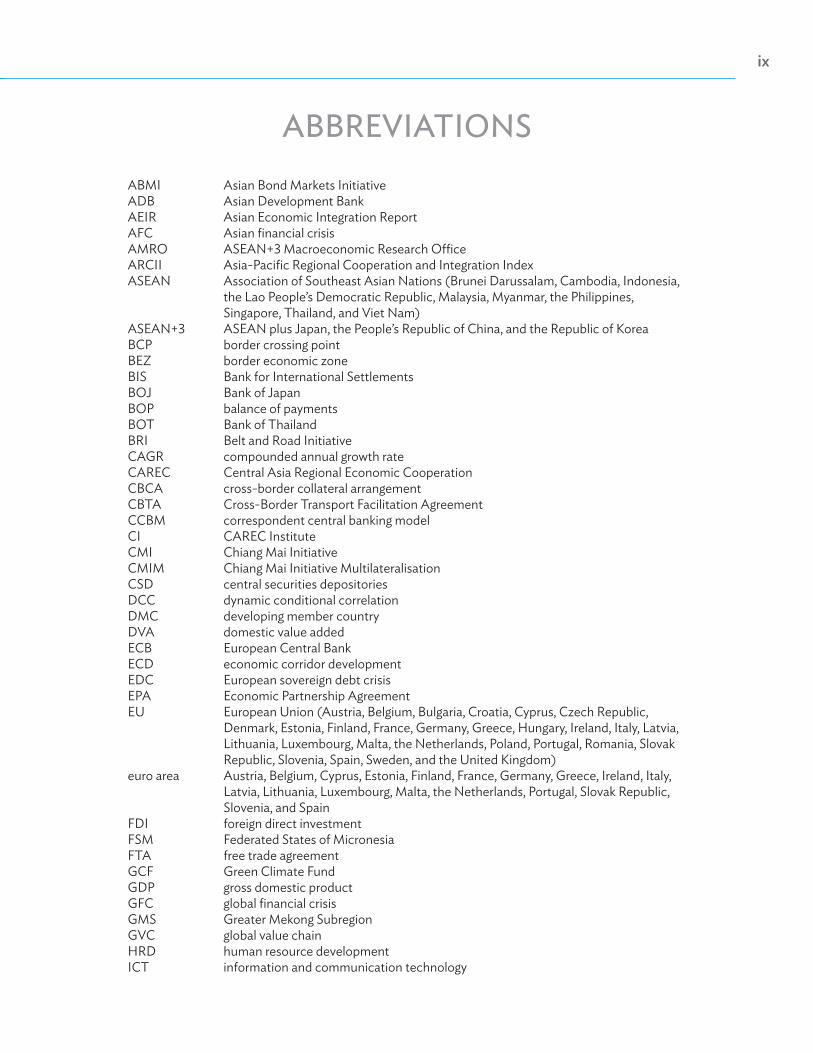
ABBREVIATIONSABMI Asian Bond Markets InitiativeADB Asian Development BankAEIR Asian Economic Integration ReportAFC Asian financial crisisAMRO ASEAN+3 Macroeconomic Research OfficeARCII Asia-Pacific Regional Cooperation and Integration IndexASEAN Association of Southeast Asian Nations (Brunei Darussalam, Cambodia, Indonesia,
the Lao People’s Democratic Republic, Malaysia, Myanmar, the Philippines, Singapore, Thailand, and Viet Nam)
ASEAN+3 ASEAN plus Japan, the People’s Republic of China, and the Republic of KoreaBCP border crossing pointBEZ border economic zone BIS Bank for International SettlementsBOJ Bank of JapanBOP balance of paymentsBOT Bank of ThailandBRI Belt and Road InitiativeCAGR compounded annual growth rateCAREC Central Asia Regional Economic CooperationCBCA cross-border collateral arrangementCBTA Cross-Border Transport Facilitation AgreementCCBM correspondent central banking modelCI CAREC InstituteCMI Chiang Mai InitiativeCMIM Chiang Mai Initiative MultilateralisationCSD central securities depositoriesDCC dynamic conditional correlationDMC developing member countryDVA domestic value addedECB European Central BankECD economic corridor developmentEDC European sovereign debt crisisEPA Economic Partnership AgreementEU European Union (Austria, Belgium, Bulgaria, Croatia, Cyprus, Czech Republic,
Denmark, Estonia, Finland, France, Germany, Greece, Hungary, Ireland, Italy, Latvia, Lithuania, Luxembourg, Malta, the Netherlands, Poland, Portugal, Romania, Slovak Republic, Slovenia, Spain, Sweden, and the United Kingdom)
euro area Austria, Belgium, Cyprus, Estonia, Finland, France, Germany, Greece, Ireland, Italy, Latvia, Lithuania, Luxembourg, Malta, the Netherlands, Portugal, Slovak Republic, Slovenia, and Spain
FDI foreign direct investmentFSM Federated States of MicronesiaFTA free trade agreementGCF Green Climate FundGDP gross domestic productGFC global financial crisisGMS Greater Mekong SubregionGVC global value chainHRD human resource developmentICT information and communication technology

Asian Economic Integration Report 2017x Highlights xi
IMF International Monetary FundM&A merger and acquisitionMW megawattNPL nonperforming loanOECD Organisation for Economic Co-operation and DevelopmentOFDI outward foreign direct investmentPCA principal components analysisPIREIP Pacific Islands Renewable Energy Investment ProgramPRC People’s Republic of ChinaPVAR panel vector autoregressionQE quantitative easingRCEP Regional Comprehensive Economic PartnershipRCI regional cooperation and integrationROW rest of the worldRTGS real-time gross settlementSASEC South Asia Subregional Economic CooperationSASEC OP SASEC Operational PlanSEZ special economic zoneSIFI systemically important financial institutionSME small and medium-sized enterpriseSPS sanitary and phytosanitarySSM Single Supervisory MechanismTFA Trade Facilitation AgreementTPP Trans-Pacific PartnershipTTF transport and trade facilitationTTFS Transport and Trade Facilitation StrategyTUTAP Turkmenistan–Uzbekistan–Tajikistan–Afghanistan–PakistanUK United KingdomUS United StatesVAR vector autoregressionVCIC Visakhapatnam–Chennai Industrial CorridorWTO World Trade Organization

Asian Economic Integration Report 2017x Highlights xi
Trade and Investment● Asia and the Pacific is leading a recovery in world trade amid the continued uncertainty surrounding
the global trade policy environment. In 2016, Asia’s trade (by volume) grew faster than global trade, but remained below its economic growth.1 Asia’s trade growth picked up to 1.7% in 2016 from 1.4% in 2015, while the world trade growth decelerated to 1.3% from 2.6%. Ongoing global economic recovery lifted demand for the region’s exports, particularly from Japan; Taipei,China; Hong Kong, China; and Viet Nam. The region’s import growth has also accelerated recently due to robust demand from the People’s Republic of China (PRC) and India, among others. Asia’s trade growth accelerated further to 7.4% during the first half of 2017 and will likely continue to gain momentum as global economic recovery gathers pace. However, potential bilateral trade friction and policy uncertainties among the world’s major trading partners remain downside risks.
● Asia’s intraregional trade continued to strengthen in 2016. Asia’s intraregional trade share—measured by value—rose to 57.3% in 2016 from 56.9% in 2015, up from an average 55.9% during 2010–2015. Strong intraregional trade offers a buffer against potential headwinds from global trade and policy uncertainties. Subregionally, trade integration—measured by the share of intra-subregional trade to total trade—is strongest in East Asia, followed by Southeast Asia and Central Asia.
● Amid a slowdown in total inward foreign direct investment to Asia, intraregional investment flows continue to rise. Global foreign direct investment (FDI) into the region (measured by gross inward FDI) fell 6% in 2016—to $492 billion from $525 billion in 2015. The region’s share of global inward FDI dropped to 28% from 30%. Nonetheless, intraregional FDI rose in both absolute value (to $272 billion in 2016 from $250 billion in 2015) and its share in total (to 55% from 48%). Intra-Asian FDI is geared more toward global and regional value chains, mainly going to greenfield investments in manufacturing. This should help strengthen the region’s trade globally as well as regionally.
● Asia’s outward foreign direct investment rose 11% in 2016—to $482 billion from $434 billion in 2015. The region’s outward FDI accounted for 33% of global FDI, up from 27% in 2015. In 2016, the PRC; Japan; and Hong Kong, China were among the world’s top 10 global investors. Combined, their outward FDI reached $391 billion, or 81% of total outward FDI from Asia. Emerging Asian investors such as India, the Republic of Korea, Malaysia, Singapore, and Thailand are also expanding their global presence in such areas as renewable energy, semiconductors, natural resources, information technology, and food, among others.
1 In this report, Asia refers to the 48 Asia and the Pacific members of the Asian Development Bank (ADB), including the region’s three advanced economies —Australia, Japan, and New Zealand, while developing Asia refers to ADB’s 45 developing member economies.
Highlights

Asian Economic Integration Report 2017xii Highlights xiii
Financial Integration● Asia’s portfolio investors continue to invest more outside the region. Outward debt investment from
Asian economies stood at $4.0 trillion in 2016, up from $3.6 trillion in 2015, driven largely by the region’s higher investments in the European Union (EU) (up $110 billion) and the United States (US) (up $224 billion). Outward equity investment outstanding also rose to $3.5 trillion from $3.2 trillion. Asia’s continued portfolio investment bias toward outside the region has led to a lower intraregional outward debt (equity) investment share—at 15.3% (19.0%) in 2016 from 16.7% (20.0%) in 2015.
● Cross-border banking activity in Asia is steadily increasing. Asia’s cross-border bank claims stood at $4.4 trillion in 2016, up from $4.1 trillion in 2015. Japan accounted for 88.7% of the increase due to its increased overseas lending especially to the US and the EU. Japan’s cross-border bank claims outstanding rose from $3.2 trillion to $3.4 trillion (driven by an increase of $19.8 billion to the region, $59.2 billion to the EU, and $131.3 billion to the US). The intraregional share of Asia’s cross-border bank claims also increased from 17.8% in 2011 to 21.4% in 2016.
● The volatility of Asian equity market returns is explained more by variations in global than regional equity market returns. Asian equity market return volatility is more prone to global impact, with the trend strengthening further since 2015. This suggests Asia’s equity markets remain more globally than regionally integrated. On the other hand, after the 2008/09 global financial crisis (GFC), a greater portion of volatility in Asian local currency bond returns is explained by variation in regional bond market returns, partly reflecting the growing participation of Asian investors in local currency bond markets. The impact of global shocks on local currency bond return volatility picked up, however, since the US Federal Reserve began to normalize monetary policy in 2015.
Movement of People● Remittances to the region dropped to $259 billion in 2016 from $269 billion in 2015—the largest drop
since 2009. Central Asian countries saw inflows decline for the third consecutive year, mainly due to weak economic recovery in the Russian Federation, the subregion’s top migrant destination. Low global oil prices also affected remittances to countries (like India and Pakistan) with a large number of workers in the Middle East. Around 45% of global remittances flow into Asia, the world’s largest source of international migrants. Empirical analyses suggest that remittance inflows are more stable when there is a higher proportion of female migrants. Quality institutions such as the rule of law and creditor protection in a migrant’s home country can also help stabilize remittance inflows, likely due to more reliable and efficient money transfer systems.
● Tourism is growing rapidly in the region, with an increasing number of tourists traveling within the region. Asia is the second largest beneficiary of tourism receipts after Europe. Tourism receipts reached $398.6 billion in 2015 after growing an average 10.1% yearly since 2012. More than 70% of Asia’s outbound tourists traveled within the region. The number of tourists from the PRC rose 11.8% in 2015, with 61.0% staying within the region. The PRC; Thailand; and Hong Kong, China earned most from tourism. However, as a proportion of gross domestic product (GDP), Maldives tops the list with 83.5% of GDP coming from tourism. The Pacific developing member countries earn an average 18.5% of GDP from tourism.

Asian Economic Integration Report 2017xii Highlights xiii
Asia-Pacific Regional Cooperation and Integration Index● This year’s Asian Economic Integration Report introduces a new composite index to gauge the progress
of regional cooperation and integration in Asia and the Pacific. Regional cooperation and integration (RCI) plays an important role in supporting economic growth and poverty reduction, and has been high on the development agenda for many Asian economies in recent years. Supporting RCI is one of ADB’s key strategic priorities for development assistance in the region. An index that calibrates the status of RCI can be a useful policy tool for assessing the progress of RCI efforts especially by various subregional initiatives.
● The Asia-Pacific Regional Cooperation and Integration Index is constructed from 26 socioeconomic indicators grouped into six dimensions to capture the diversity of regional cooperation and integration. The six dimensions cover: (i) trade and investment, (ii) money and finance, (iii) regional value chains, (iv) infrastructure and connectivity, (v) movement of people, and (vi) institutional and social integration (based on indicators for trade agreements, diplomatic ties, and cultural relations).
● The indicators are expressed as a ratio of a country’s intraregional sum (or average) to total sum (or average) of cross-border economic activities and are aggregated into a single composite index following a two-step procedure. The first step involves minimum-maximum scaling to normalize indicators with different measurement units to a uniform range between 0 and 1, with higher values denoting greater regional integration. The second step is to perform principal component analysis to estimate the weights used in aggregating individual indicators into a composite index: (i) first for each of the six dimensions and (ii) then again to combine the six composite indexes into the overall Asia-Pacific Regional Cooperation and Integration Index (ARCII).
● The ARCII allows Asian economies to keep track of the progress in their regional integration. The index allows comparative analysis of RCI by measuring the degree of RCI in the six dimensions as well as their collective contributions to overall regional integration across subregional groups or countries. The six dimensional indexes are designed to reflect the core socioeconomic components of the regional integration process. The ARCII allows each subregional group or economy to identify their strengths and weaknesses across the six RCI dimensions.
● The ARCII, by the nature of its construction, measures an Asian economy’s integration with the other regional economies relative to its integration with the world. As such, a low score in an economy’s ARCII does not necessarily mean the economy is not regionally integrated defined in some absolute terms, but it would simply reflect the economy’s higher interregional rather than intraregional integration. For example, Singapore, one of the region’s top performers in ARCII, scores high across all six dimensions, but its regional money and finance integration is weaker relative to other dimensions. This stems largely from the fact that Singapore is a global financial center and more globally integrated than regionally. Both Japan and Hong Kong, China are equally regarded as global financial centers and also have relatively low scores for regional money and finance integration.
● The EU has the highest regional integration score on all but one dimensional indexes; but Asia outranks both Africa and Latin America. The EU broadly outperforms Asia across all dimensions—Asia’s trade and investment integration index is the only one comparable in magnitude. Asia’s institutional and social integration is particularly weak. Asia’s composite ARCII index is 0.448, below the EU’s 0.617. Latin America follows close behind at 0.423, with Africa at 0.395. Regional value chain and movement of people are Asia’s most regionally integrated components, while institutional and social integration is least.

Asian Economic Integration Report 2017xiv Highlights xv
THEME CHAPTER
The Era of Financial Interconnectedness: How Can Asia Strengthen Financial Resilience?
● Twenty years after the Asian financial crisis, Asia stands strong—with more flexible exchange rates, higher foreign reserves, healthier financial systems, stronger regulations, deeper capital markets, and better regional financial cooperation mechanisms. Nonetheless, the region’s economic growth and financial stability were briefly disrupted by the GFC. Significant challenges remain, along with unresolved financial market and system weaknesses. Remaining regulatory policy gaps also leave room for a buildup of financial vulnerability through excessive leverage and risk-taking. Asia’s policy makers must remain vigilant and be ready to act when necessary, while continuing to deepen financial reforms.
● Structural weaknesses continue to permeate Asian financial markets and systems. In particular, when combined with increased procyclicality of financial cycles and growing regional and global financial interconnectedness, these weaknesses present new challenges. They include how: (i) increased financial interconnectedness helps speed international transmission of financial risks; (ii) foreign currency-(especially US dollar-)denominated debt continues to rise, reflecting limited domestic capital market-based financing solutions; (iii) rising private-sector debt and leverage—combined with the rapid growth of shadow banking (including wealth management products issued in some Asian economies)—increase financial fragility; and how (iv) deteriorating bank asset quality and its potential macrofinancial feedback effects pose risks to Asia’s economic and financial stability.
● Over the past 20 years, Asian financial markets have become more interconnected—both globally and intraregionally. Empirical analysis of 42 equity markets (15 within Asia) from 1996 to 2016 shows a deepening and growing complexity in Asian financial market interconnectedness. The results also reveal that interconnectedness increased during financial crises and decreased during recoveries.
● Growing financial interconnectedness can increase vulnerabilities to external shocks, financial contagion, or liquidity risks stemming from cross-border bank lending. Analyzing bilateral data on cross-border bank liabilities suggests that an economy’s banking exposure to crisis-affected economies can affect the size of capital outflows from the economy during a crisis. The analysis highlights how cross-border bank borrowing can become a global transmission channel when liquidity tightens.
● Continued high reliance on US dollar-denominated funding has significant implications for the transmission of global financial conditions to domestic financial and macroeconomic conditions. In the first quarter of 2017, 79% of total outstanding international debt securities for Asia’s major emerging economies were denominated in US dollars, with shares recently rising. The concentration of foreign borrowing in a single currency leaves the region’s financial systems vulnerable to external shocks through unexpected changes in foreign currency liquidity conditions and related capital flow reversals. Empirical evidence shows that a change in bilateral US dollar exchange rates has a significant impact on sovereign credit risk premiums (widening sovereign bond market spreads), which can affect financial conditions in some emerging Asian economies.
Asian Economic Integration Report 2017xiv Highlights xv
● The recent rise in nonperforming loans in several emerging Asian economies is a concern due to potential macrofinancial feedback effects. Nonperforming loans (NPLs) have increased in the PRC, India, Bangladesh, Indonesia, and Mongolia, among others. Empirical findings show that while macroeconomic conditions and bank-specific factors—such as rapid credit growth and excessive bank lending—contribute to the buildup of NPLs, a sustained increase can likewise lead to a reduction in credit supply and slowdown in overall economic activity.
Policy Considerations for Enhancing Financial Resilience
● A key lesson drawn from recent crises is the urgent need to strengthen macroprudential regulation and supervision in the region. Authorities should consider establishing and implementing an effective macroprudential policy framework to address two dimensions of system-wide risk: (i) a buildup of systemic risk over time (the “time dimension”), and (ii) a spillover and contagion of risk across different financial sectors and systems (the “cross-sectional dimension”). Macroprudential policy tools—such as countercyclical provisions, capital and liquidity buffers, and other balance sheet instruments—can be useful in mitigating financial system procyclicality.
● Further developing local currency bond markets across the region is key to enhancing financial resilience and mobilizing stable long-term finance. While local currency bonds outstanding in Association of Southeast Asian Nations plus the PRC, Japan, and the Republic of Korea (ASEAN+3) tripled from $6.6 trillion in 2002 to $19.8 trillion at end-2016, challenges remain. To meet the region’s financing needs, local currency bond markets must improve market efficiency, broaden their investor base, deepen secondary markets, and integrate more regionally.
● Growing cross-border banking activities and systemic importance of some large regional financial institutions underscore the need to discuss regional regulatory cooperation, including resolution mechanisms for interconnected regional banks. Supervisory colleges for regionally active foreign banks can be an effective regional cooperation tool to strengthen cross-border supervision in Asia. Regional cooperation to develop effective resolution mechanisms for distressed assets of cross-border financial institutions can also complement national efforts to address NPLs efficiently and sustainably.
● The region should consider reviewing and strengthening existing financial safety nets against potential contagion and spillover effects. Asia’s financial markets are increasingly open, interconnected, and vulnerable to external shocks. Strengthening the Chiang Mai Initiative Multilateralisation and its regional macroeconomic surveillance unit, the ASEAN+3 Macroeconomic Research Office, can help monitor potential liquidity risks and slow the spread of shocks across the region’s economies.


ASIAN ECONOMIC INTEGRATION REPORT 2017The Era of Financial Interconnectedness—How Can Asia Strengthen Financial Resilience?
The Asian Economic Integration Report 2017 is the annual report on Asia’s progress in regional cooperation and integration (RCI) of the Asian Development Bank (ADB). It covers ADB’s 48 regional members and analyzes regional and global economic linkages. This year’s special theme chapter, “The Era of Financial Interconnectedness: How Can Asia Strengthen Financial Resilience?” examines the region’s ability to absorb financial shocks and avoid instability. The report introduces an RCI composite index to help monitor and evaluate RCI progress in the region. The Asia-Pacific Regional Cooperation and Integration Index combines six RCI components: trade and investment, money and finance, regional value chains, infrastructure connectivity, movement of people, and institutional and social integration.
About the Asian Development Bank
ADB’s vision is an Asia and Pacific region free of poverty. Its mission is to help its developing member countries reduce poverty and improve the quality of life of their people. Despite the region’s many successes, it remains home to a large share of the world’s poor. ADB is committed to reducing poverty through inclusive economic growth, environmentally sustainable growth, and regional integration.
Based in Manila, ADB is owned by 67 members, including 48 from the region. Its main instruments for helping its developing member countries are policy dialogue, loans, equity investments, guarantees, grants, and technical assistance.
ASIAN DEVELOPMENT BANK6 ADB Avenue, Mandaluyong City1550 Metro Manila, Philippineswww.adb.org