Embed Size (px)
Citation preview

Assessment of Flows in a Glaciated Region-Shigar River Basin, Pakistan
S. A. Khan1, M. Ashiq2, H. F. Gabriel3
1,2Civil Engineering Department, University of Engineering & Technology, Lahore-54890, Pakistan [email protected], [email protected]
3NICE, SCEE, National University of Sciences & Technology (NUST) Islamabad-44000, ICT, Pakistan [email protected]
Abstract-Glaciers are the product of nature and 68% of global fresh water is in the form of glaciers. The glacier melting rate has increased due to global warming and it has been estimated by the scientists that more than three quarters of the present day glaciers will disappear within the next fifty years. In the present study an attempt has been made to investigate the change in temperatures and its impact on flows of Shigar River which is located in the northern areas of Pakistan. An analysis of time series of temperature, precipitation and discharge data showed upward trend. A well known rainfall runoff, snow and glacier melt University of British Columbia Watershed Model (UBCWM) was used to simulate the flows at Shigar River. The inputs of UBCWM are the daily maximum/minimum temperature, precipitation and physiographic characteristics of the watershed. The glacier cover over the watershed was retrieved using MODIS Moderate-Resolution Imaging Spectro Radiometer (MODIS) and found to be 2400 (km2). The well calibrated and validated UBC watershed model (1998, 2001 and 2002 respectively) was used for future flows prediction. The calibration and validation results were 94 and 91 percent for year 1998 and 2002 respectively. The mean annual maximum and minimum temperature trends were used to project next ten years. The projected results were then put in the model to determine the flows after ten years. The simulation showed 4 % increase in flows with respect to the validating year 2002 flows due to projected increase in temperatures and predicted flows of year 2012. Keywords-Climate change, UBC Watershed Model, Shigar River Basin, river flows, Pakistan
I. INTRODUCTION
Pakistan is an agricultural country and its economy is dependent on the significant Indus irrigation system [1]. A country of five rivers is facing water issues related to extreme water shortage and heavy floods. Pakistan has disputes over the unequal distribution of water resources among its own Provinces [2]. The availability of water resources are affected by the impact of climate change and its variability which influences the
agriculture and power generation capacity. Therefore, for proper planning and better management of water resources, it is important to estimate their availability in future. [3] states that the changing climate has strong impact on river flows in Pakistan. This will result in higher rate of snow and glaciers melting for few years with major increase in river flows and then there will be permanent loss in flows from the Upper Indus Basin (UIB) glaciers. The Indus plains of Pakistan are most fertile zones and are irrigated by the Indus River and its tributaries. The glacier melt contribute more than 50% to the total flows of the Upper Indus Basin [4]. It is vital to monitor and forecast runoff from snow and glacier melt in the Upper Indus Basin. [3] shows that the changing climate impact is clearly indicated by the glacier and snow melting as glaciers are retreating due to global warming. In the present study an attempt has been made to investigate the change in temperatures and its impact on flows of Shigar River located in the northern areas of Pakistan. To achieve this, time series of maximum and minimum temperature trends were determined and projected for next ten years. These projected daily maximum and minimum temperatures were used as basic input to University of British Columbia Watershed Model (UBCWM) to estimate the river flows for present and future.
II. DESCRIPTION OF STUDY AREA
Shigar River is a small right bank tributary of the Indus River and meets the Indus at Gol (Skardu valley) which is about 30 km downward from Skardu. The Shigar Basin lies within the Latitude range of 35.2°N to 37°N and Longitude range of 74.5°E to 76.5°E respectively as shown in Fig. 1. The Shigar River Basin is located between the Karakoram Mountains and Masherbrum Range Baltistan i.e. situated in Northern areas of Pakistan. The Shigar Basin has border with China and Shyok River Basin in the East, Hunza River in the North and Indus River Basin in the South and West. Shigar River’s flows are contributed from glacier melt of Baltoro, Biafo and Chugolugma glaciers. Thus the Shigar River Basin drains the glacier melt of most important glaciers of the Karakoram Range. Its entire catchment river inflows have been influenced by the
38
Technical Journal, University of Engineering and Technology Taxila, Vol. 19 No. I - 2014

action of glaciers [4]. The valley is deep in its upper reaches but widens near its mouth [4]. The drainage area of Shigar River Basin is 7382 km2. The daily runoff data at Shigar River is available for 18 years 1984-2002 from discharge measuring station at Shigar River (35°20’- 75°45’). The mean annual flow at Shigar River gauging station is about 194 m3/sec (cumecs) and the unit runoff is about 29 cumecs/1000 km2 [5]. The stream flows in Shigar River is mainly fed by glacier melt and has strong influence by extreme seasonal variability. The other contributions to the River flows are due to snow melting which increases in summer due to rise in temperatures. The Watershed has an elevation range of 2200 to 8611 m.a.s.l. The mean elevation of the Watershed is 5405 m.a.s.l. and the highest peak is K2. The Shigar Basin has total glacier area of 2240 km2 [4] which is 30 % of the total watershed. The Baltoro, Biafo & Chugolugma are the main glaciers.
Fig. 1. Location of Shigar Basin III. CHARACTERISTICS OF STUDY AREA
The Shigar basin laid completely in Pakistan, in the HinduKash Karakoram Himalyan (HKH) region. The 2nd highest mountain peak K2 in HKH region has an altitude of 8611, m.a.s.l and the lowest altitude is at Shigar Bridge is 2204 m.a.s.l. According to the Koppen-Geiger climate classification, the Shigar falls in a cold desert region, that receives little precipitation with dry climate with and variability in daily temperature range. The massive glacier mountains form a barrier to the movement of Monsoon stroms, which impose little storms effect in HKH region. In Shigar basin the main glacier Baltoro has area more than 700 km2. The hydrological regime
is less affected by monsoon and major contribution in stream flows is due to snowmelt and glaciers melt [6]. The winter precipitation due to western patterns provides excessive snowfall for the nourishment of glaciers of HKH region [7]. The precipitation behavior is not uniform at high altitudes of KHK region. The winter snow and then the glaciers start melting from April and continue till July. The mean temperatures showed a uniform pattern in the UIB catchment. [8] have assessed both precipitation and temperature over the past 100 years. Considering the long term data at Gilgit, Skardu and Srinagar, there is considerable increase in precipitation and winter temperatures while the summer temperatures showed a cooling pattern [8]. These varying climate change have direct impact on the availability of water resources. The mountain height reduces the interruption of the monsoon whose effect weakens towards the North West. Over the UIB, maximum annual precipitation falls in winter and spring and originates from the west. Monsoonal storming brings rear rain to trans-Himalayan areas and contribute reasonable during summer months, but all the precipitation is not originate from monsoon storms [9]. Climatic variables are strongly influenced by altitude.
The HKH stores a very relevant amount of water in its extensive glacier cover at higher altitudes (about 16 300 km2), but the lower reaches are very dry. Especially in the Central and Northern Karakoram, the lower elevations receive only occasional rainfall during summer and winter. The state of the glaciers also plays an important role in future planning, shrinking glaciers may initially provide more melt water, but later this amount will be reduced. On the other hand, growing glaciers store precipitation, reduce summer runoff, and can generate local hazards. These differences could be caused by increases in precipitation since the 1960s [8] and a simultaneous trend toward higher winter temperatures and lower summer temperatures [8].
IV. MODEL DESCRIPTION
The Shigar River Basin was modeled using the University of British Columbia Watershed Model (UBCWM), developed and used by Dr. M. C. Quick and A. Pipes in 1972 on Fraser River system in British Columbia at UBC Civil Engineering Mountain Hydrology Group [10]. The earlier UBCWM was in DOS version [11], [12] and it has been customized into the latest Windows version by Quick and his co-workers with the combined funding from the BC Disaster Relief Fund, the BC Science Council, and BC Hydro [13]. The UBCWM uses the hourly or daily point value data of precipitation and maximum and minimum temperature as input to calculate the stream flow. The precipitation is taken
Technical Journal, University of Engineering and Technology Taxila, Vol. 19 No. I - 2014
39

in millimeters and temperature in degree Celsius. The model uses the historic flows, observed physically by gauging station at the outlet of the watershed to compare the model simulation. The daily or hourly flow data is measured in cubic meter per second. The UBCWM was designed for mountainous areas where meteorological data is sparse and mostly available at valley stations. The model uses the area-elevation band theory to deal with the orographic gradient of precipitation and temperature. The model also provide the information about the characteristics of watershed like snow cover area, snow water equivalent, energy available for snowmelt, evapotranspiration and interception losses, soil moisture, groundwater storage and surface and sub-surface components of runoff for each elevation band and also mean value over the watershed
The physical description of watershed is done under a set of variable parameters for each assigned elevation bands such as mean band area, mean band elevation, glacier area, north south orientation, forested area, forest density impe rmeable fraction of soil. The schematic flow structure of UBCWM is illustrated in Fig. 2.
Fig. 2. Schematic Flow Structure of
UBCWM [12] The UBCWM comprises of three sub model. The
first model is related to metrological data and it distributes the point data of precipitation and temperature over the mid-elevation points of each elevation band in the watershed. The precipitation is
controlled by critical temperature and falls either in the form of snow or rainfall. The melting of snow cover area and glacier extent is also controlled by this model. The second model deals with the soil moisture and indicates the behavior of watershed. It divides the watershed inflows into four types: fast as surface, medium as interflow, slow as upper groundwater and very slow as deep groundwater. The third model is related to routing and it generates the distribution of runoff components. It is based on linear storage reservoir theory. It assures the conservation of mass and water equilibrium. The UBCWM is conceptual and continuous hydrological model. It is a semi-distributed model. The UBCWM has been successfully applied for real time forecasting and research studies in different climatic regions of the world. The model has also been performing well in the Himalayas and Karakoram ranges in India and Pakistan.
V. HYDROLOGICAL STUDIES USING THE UBCWM
The UBCWM has been successfully applied for real time forecasting and research studies over dams and various watersheds over the world. Some of major studies are listed below: North Saskatchewan River: Forecasting model development, Prairie Provinces Water Board, 1972-74.
Fraser River Forecasting System: Continuing
development and use since 1972 to present, for BC Ministry of the Environment.
Columbia River: Design flood estimation for the Revelstoke Project: PMF and Diversion Floods, BC Hydro, 1974
Columbia River: Mica Dam. Development of Operational Procedure. (with A. Pipes and with W. Goines and D. Druce of BC Hydro.), 1976
Peace River: Design Flood studies for possible downstream developments, BC Hydro, 1973 and 1975.
Columbia River: Murphy Creek Design Flood Study, BC Hydro, 1976-81.
Upper Indus River: Development of forecasting system, World Meteorological Organisation, 1987, and IDRC , with BC Hydro, 1988 to 1996, and ongoing
Campbell River: Hourly Rainflood Forecasting System, for BC Hydro, 1992-93, and ongoing.
Sutluj River, India: Development of Forecasting System, for Indian Institute of Hydrology, United Nations Development Program, 1993.
Kootenay River. Consultant to Acres International. Derivation of PMF for the Brilliant Dam, 1998
Technical Journal, University of Engineering and Technology Taxila, Vol. 19 No. I - 2014
40

The UBCWM has been selected to achieve the objectives of this research study. The reasons to choose this model over the other hydrological models are: 1) the model has been applied successfully over the numerous worldwide hydrological projects, 2) the UBCWM runs with minimum daily or hourly temperature and precipitation data at point and 3) the model has been used by at many projects to forecast daily inflows.
VI. UBCWM DESIGN CONSTRAINTS
The UBCWM is preferably designed to estimate and forecast watershed response in mountainous areas. The UBCWM is conceptual and continuous hydrological model. It is a semi-distributed model. The hydrological response of mountainous watershed is dependent on the elevation and it is the most important variable in the description of mountain runoff [11] therefore the model uses area-elevation zones concept. The model is divided into area-elevation bands. The watershed can be divided up to twelve bands, however from operation manual, it is suggested four to eight are enough to describe a watershed. The physical characteristics of watershed are defined separately for each elevation band under the set of variable parameters. The UBCWM is designed to run from minimum climate data as data is sparse in high elevation mountains and most of the data is available from Valley Station. Due to this constraint, model is provided with the ability to interpret the point meteorological data to mid elevation of each zone therefore data is distributed to each specified elevation bands. This data distribution is based on the assumption that temperature and precipitation are described by elevation and area therefore Elevation relationship to temperature and precipitation are defined in the model.
The snow cover data is not available at most of the stations. Therefore daily precipitation data is used to develop snow accumulation map by the model and distribute the rainfall by elevation over the watershed. A. Datasets Used
The temporal data included climate and discharge data. Climatic data are being observed by Pakistan Meteorological Department (PMD) since 1955. The rivers of Pakistan have been gauged by Water and Power Development Authority (WAPDA) since 1960. Daily maximum & minimum temperatures and precipitation data from the Skardu Meteorological Station, located at an elevation of 2230 m near Shigar catchment, was obtained from PMD for the period 1961-2002. The daily stream flows data of gauging station, located at an elevation of 2204 m at Shigar Bridge from 1985-2002 was collected from WAPDA. The stations with their measuring variables are listed in Table I.
TABLE I WEATHER& DISCHARGE STATION WITH
MEASURED VARIABLES
Station
Long. (E)
Lat. (N)
Elev. (m.a.s.l)
Var. Resol.
Avail. since (years)
Skardu
75°-31'-35"
35°-19'-47"
2230
Max/Min Temp., Ppt.
Daily 1961-2002
Shigar
75-25-00
35-20-00
2204 Disch. Daily 1985-
2002
The spatial data consisted of terrain elevation
and snow cover/glacier extent. To describe the characteristics of the Shigar Basin the Digital Elevation Model (DEM) available from ASTER was downloaded from the website http://srtm.csi.cgiar.org. The Shuttle Radar Thematic Mapper (SRTM) data with 3 arc-second resolution (= 90 meter) was acquired due to its precision and accuracy. Fig. 3 is representing the location of Shigar Basin in 2 two SRTM tiles of Aster DEM.
Fig. 3. Extents of STRM Tiles for Shigar Basin
The downloaded STRM tiles were first mosaic
and then clipped to reduce the size for the Shigar Basin. The data processing of clipped terrain model was done using the Arc Hydro extension of ArcGIS. The watershed was delineated using the batch command under the watershed processing tool shown in Fig. 4. The initial resolution of DEM raster was of 3 arc seconds (approximately 90 m in North-South direction) and in Degree, geodetic datum WGS84 (geographic coordinate system). The area lying under the mask of watershed was extracted for further division of DEM into elevation bands.
The initial geographic coordinate system of clipped DEM raster was projected into UTM43 North, geodetic datum WGS84 having raster cell size of 500 meter. The extracted DEM of Shigar Catchment was divided into elevation bands as per the requirement of UBC watershed model. To get the areal characteristics of the Shigar Basin under each
Technical Journal, University of Engineering and Technology Taxila, Vol. 19 No. I - 2014
41

elevation class, the DEM was reclassified into elevation bands with the spatial analyst tool of ArcGIS. The low and high value range of elevation in raster DEM were 2179 and 8566 m.a.s.l. The raster DEM was reclassified into 8 elevation bands with an equal interval of 500 meter as shown in Fig. 4. The reclass raster was converted into polygon and further polygons were dissolved according to the defined elevation zones. Finally, the area of each elevation was calculated.
Fig. 4. Classification of Shigar Basin into
Elevation Bands
The area-elevation (Hypsometric) curve is a graphical representation of the relationship between elevation and area of a basin [14]. The area under the hypsometric curve is the hypsometric integral and is used to calculate the hypsometric mean elevation [15]. To develop the hypsometric curve for Shigar Basin, the calculated area and elevation zone data in ArcGIS were plotted as shown in Fig. 5. The each elevation zone, area, count of cells and hypsometric mean elevation are listed in Table II.
Fig. 5. Area-elevation (Hypsometric) Curve
for the Shigar Basin
TABLE II BASIC FEATURES OF SHIGAR BASIN
ELEVATION ZONES
Elevation band (No.)
Minimum Elevation
(m)
Maximum Elevation
(m)
Count of cells (No.)
Area (km2)
Hypsometric Mean (m)
1 2179 2500 32685 265 2290.4 2 2501 3000 29509 239 2732.3 3 3001 3500 50532 409 3233.7 4 3501 4000 86441 700 3744.8 5 4001 4500 155701 1261 4238.0 6 4501 5000 211375 1712 4724.4 7 5000 5500 190198 1541 5170.4 8 5501 8566 111179 901 5744.7
B. Hyrdological Regime of Shigar River Basin
The climatological data used of year 1998 for modeling the Shigar River Basin is illustrated in Fig. 6 in terms of maximum & minimum temperature and precipitation. According to Reference [16], the Shyok, Hunza and Shigar River falls in glacier regime, their combined flows contribute an average less than 30 % of flows in the Indus River. There is positive correlation between runoff and maximum temperatures in these catchments [17], [8]. The observed runoff at Shigar gauging station was compared with the maximum temperature and precipitation for the simulation year 1998. The visual analysis proved that there exist a strong correlation between the summer runoff and maximum temperature as shown in Fig. 7.
Fig. 6. Maximum/Minimum Temperature and
Precipitation at Skardu Meteorological Station for the year 1998
Technical Journal, University of Engineering and Technology Taxila, Vol. 19 No. I - 2014
42

Fig. 7. Comparison of Observed Maximum
Temperature and Runoff at Skardu Meteorological Station and Shigar Gauging Station for the year 1998
Whereas there was contrasting insignificant correlation between the precipitation and runoff shown in Fig. 8. A negative or poor relation existed between the runoff and precipitation. Hence the temperature pattern in summer has great impact on trends in runoff. Thus, the rise in global temperatures will increase the runoff initially but falls sharply due to retreating glacier mass [19].
Fig. 8. Comparison of Observed Precipitation and
Runoff at Skardu Meteorological Station and Shigar Gauging Station for the year 1998
C. Snow Cover/Glacier Extent
The snow cover/glacier extent is the vital parameter in UBC watershed model indicating the snow cover feature of a basin. Snow Cover / glacier extent was obtained from daily satellite images of MODIS (Moderate-resolution Imaging Spectro radio meter). There are two sensors equipped with this satellite, Aqua and Terra which pass at different times of the day. There are different products available by MODIS. For this study, the readily processed snow tiles by the "MODIS Snow & Sea Ice Global Mapping Project" of NASA were used. The geo-correction and classification has already been made by the NASA. The MODIS Snow Cover Daily L3 Products (MOD10A1) can be downloaded free of charge from NASA (http://modis-snow-ice.gsfc.nasa.gov). The daily data is available in compressed Hierarchical Data Format-Earth Observing System (HDF-EOS) format and size varies
between 0.5 and 2.5 MB. The daily MOD10A1 snow products are tiles of gridded data which consists of (1200 x 1200) km2 area. The spatial resolution of tile (cell size) is about 500 m and tile is in the sinusoidal projection [19], [20], [21], [22]. A single tile is sufficient to cover the Shigar catchment and it falls in h24v05 tile. The MODIS standard snow-cover products–providing snow extent and albedo–are useful, as input to models [23]. The historic MODIS imageries were downloaded and processed for year 2002 before using in the UBC watershed model. The MODIS Reprojection tool (MRT) was used to convert sinusoidal HDF data into Geo-Tiff format with WGS84 Datum and UTM projection (Zone 43). The Shigar catchment area was extracted from the Geo-Tiff tiles. The raster cells with clouds or undefined data were corrected through temporal interpolation. The daily statistics (snow/ no snow) per elevation zone was analyzed. The snow depletion curve was calculated by smoothing through 9 daily moving averages which is the plot between percent snow cover and time as shown in Fig. 9.
Fig. 9. Observed/smoothed Snow Depletion Curve after Cloud Cover Elimination Area for the Shigar
Catchment in 8 zones year 2002
VII. METHODOLOGY
The flow chart in Fig. 10 shows the entire methodology used in this study. The calibration of model parameters was carried out for the Shigar catchment. In order to find a set of best tuned set of parameters for the hydrological model, a two-step calibration approach was applied to find the best parameters within a wide range of acceptable values, in order to identify the driving parameters in the different sections of the hydrograph, find the overall level of each parameter and establish a baseline of best-match by giving the available input variables. To reduce the temporal variability and restrict the parameters to reasonable values, while keeping the achieved goodness of fit as much as possible. Model calibration was performed for years 1998 and 2001 where inflow data at the Shigar gauging station was
Technical Journal, University of Engineering and Technology Taxila, Vol. 19 No. I - 2014
43

available. All calculations were carried out “year round”, i.e. from 1st January to 31st December. The Best suited Calibrated parameters are listed in Table III along with their description as they are described in the UBCWM user Manual. The range and default values of parameters defined in Manual are also shown. The parameters describing the characteristics of study area are listed in Table IV.
TABLE III BEST-SUITED CALIBRATED PARAMETERS OF
UBCWM FOR SHIGAR BASIN
Parameter Range Default Best suited value
Description
P0SREP -1.0 to 1.0 0.0 0.25 Adjustement to precipitation when average temperature <0 (snowfall)
P0RREP -1.0 to 1.0 0.0 1
Adjustement to precipitation when average temperature >A0FORM (rain)
A0EDDF 0.0 to 0.5 0.2 0.2 Potential evapo transpiration factor in mm/day
P0GRADL 0 to 20 5 6 Precipitation gradient factor (%) for elevations below E0LMID
P0GRADM 0 to 20 0 0 Precipitation gradient factor (%) for elevations below E0LHI
P0GRADU 0 to 20 0 0 Precipitation gradient factor (%) for elevations above E0LHI
E0LMID - - 4500 Elevation at which P0GRADM is effective (m)
E0LHI - - 5500 Elevation above which P0GRADU is effective (m)
P0EGEN - 100 100 Impermeable area factor
P0PERC 0 to 50 15 7 Groundwater percolation in mm/day
P0DZSH 0.0 to 1.0 0.5 0.5 Deep zone share fraction
TABLE IV FINAL DESCRIPTION OF SHIGAR WATERSHED
FOR FLOW SIMULATION IN UBWCM
Band 1 2 3 4 5 6 7 8
Midelevation band (m) 2339 2750 3250 3750 4250 4750 5250 6783
Band area (km2) 265 240 410 700 1261 1712 1540 900
Forest fraction 0.3 0.5 0.5 0 0 0 0 0
Density of canopy 0.5 0.5 0.5 0 0 0 0 0
Orientation 1 0.5 0.5 0.5 0.5 0.5 0 0
Glacier area (km2) 0 0 0 0 88 650 1120 860
Glacier Orientation 0 0 0 0 0.2 0.9 1 1
Impermeable fraction 0.1 0.1 0.1 0.13 0.15 0.18 0.2 0.2
Precipitation adjustment 0 0 0 0 0 0 0 0
Satellite Data
SRTMMODIS Data
DEM
MOD10A1
MRT - Swath
Removal ofClouds
ImageClassification
MODIS SnowMaps
Archydro-ArcGISExtension
WatershedDelination
ElevationBands
Area-Elevation
WATFile
Hydrological &Meteorological
ParametersMin/Max
Temprature
Preciptation
BDMFile
Discharge(result comparison)
BDMFile
UBC WatershedModel
Generated Streamflow
Fig. 10. Research Methodology Flow Chart
VIII. CALIBRATION RESULTS
The performance of UBC watershed model can be checked by “Statistical” and “Graphical” options. The statistical accuracy of the UBC watershed model was determined by the comparison of observed and simulated discharges. The accuracy assessment of the model was determined by the following coefficients:
i. The Coefficient of Efficiency, !e compares the shape and volume of estimate hydrograph to the observed hydrograph.
n
ii
n
iii
QobsQobs
QestQobse
1
2
1
2
)(
)(1!
(1)
Where,
n
iQobs
nQobs
1
1
n = the number of days for daily runs Qobsi= the observed daily discharge on day i Qesti= the computed daily discharge on day i
ii. The Coefficient of Determination !d relates the shape of estimated hydrograph to the observed hydrograph.
Technical Journal, University of Engineering and Technology Taxila, Vol. 19 No. I - 2014
44

n
ii
n
iii
QobsQobs
aQestbQobsd
1
2
1
2
)(
))((1!
(2) Where,
n
i
n
iii QestbQobs
na
1 1
1
(3)
n
i
n
iii
n
i
n
iiii
n
ii
Qestn
Qest
QobsQestn
QestQobsb
1
2
1
2
1 11
1
1))((
)( (4)
Where n is the number of days for daily runs,
Qobsi is the observed daily discharge on day I and Qesti is the computed daily discharge on day i. R2approaches 1 as the root mean square prediction error decreases to 0. An efficiency of 1.0 indicates a best fit between the observed and computed hydrographs. The coefficient of Determination relates how well the shape of calculated hydrograph corresponds to the observed hydrograph.
The UBC Watershed Model was applied in the present study for year round (January to December) calculation of outflows for year 1998 and 2001. The Coefficient of Efficiency and Coefficient of Determination for the year 1998 were 0.93 and 0.94 respectively and for the year 2001, they were 0.86 and 0.89 respectively which are quiet reasonable and acceptable. A graphical representation is very important to indicate the behavior of watershed for visual judgment. The calibrated years 1998 and 2001 are represented in the Fig. 11 and 12 respectively.
Fig. 11. UBCWM Calibration year 1998
for Shigar River
Fig. 12. UBCWM Calibration Year 2001 for Shigar
River
The temporal distribution of various components of runoff in Shigar River at Shigar stream gauging station is illustrated in Fig. 13. These components include glacier melt flow, snow melt flow, flow due to rainfall and ground flow. The distribution of the computed average daily flow of 221.38 cumecs for year 1998 is given in Fig. 15. The observed flow for year 1998 is 230.52 cumecs. The major contribution to the runoff is from glacier melting about 46% as listed in Table V. The snow melt and groundwater discharge 52% also cover significant part of total runoff, whereas the amount of rainfall runoff is relatively not so considerable.
Fig. 13. Runoff Components Determined from
UBCWM Calibrated Year 1998 for Shigar River
TABLE V DISTRIBUTION OF COMPONENTS OF FLOWS
FOR THE CALIBRATION YEAR 1998 AT SHIGAR RIVER
Flow (cumecs)
Percentage (%)
Snow 88.5 40 Glacier 102.5 46 Rainfall 5.6 3 Ground water 27.4 12 Total 221.4 100
A. Validation Results
Technical Journal, University of Engineering and Technology Taxila, Vol. 19 No. I - 2014
45
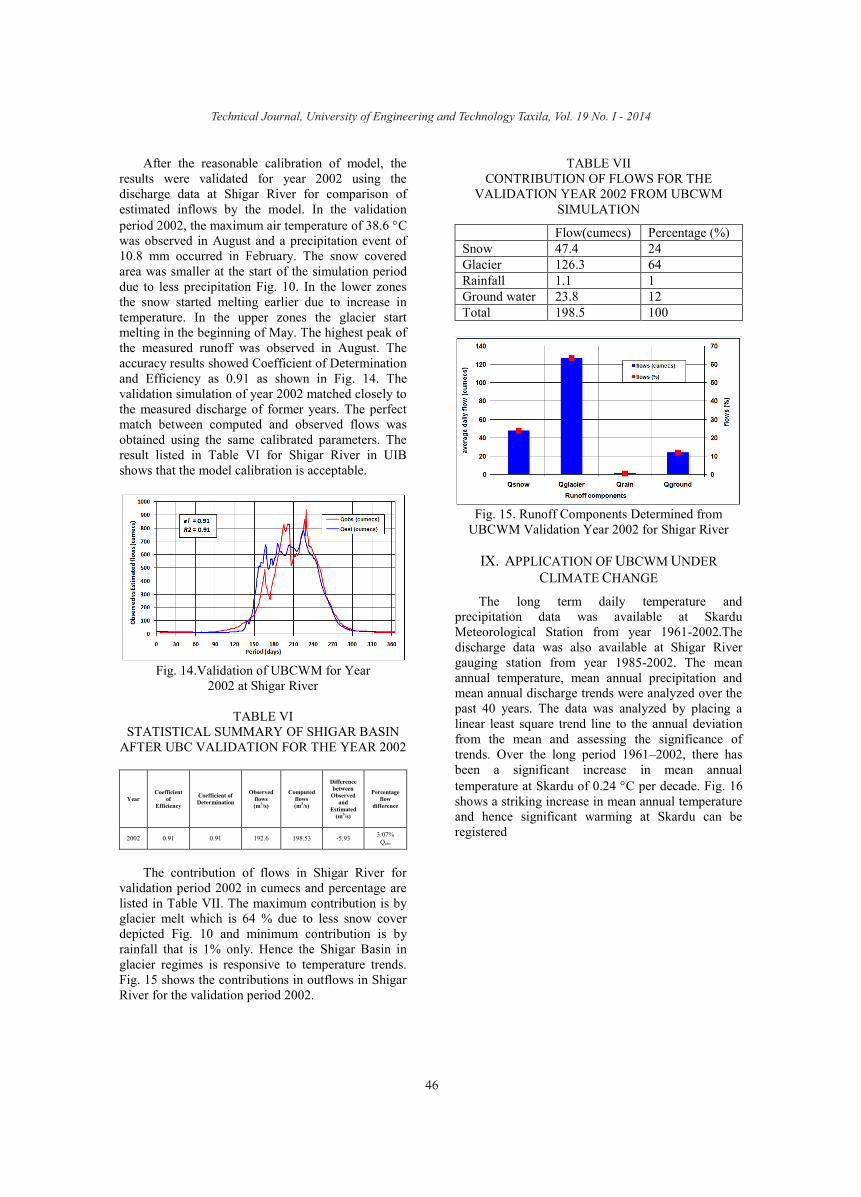
After the reasonable calibration of model, the results were validated for year 2002 using the discharge data at Shigar River for comparison of estimated inflows by the model. In the validation period 2002, the maximum air temperature of 38.6 C was observed in August and a precipitation event of 10.8 mm occurred in February. The snow covered area was smaller at the start of the simulation period due to less precipitation Fig. 10. In the lower zones the snow started melting earlier due to increase in temperature. In the upper zones the glacier start melting in the beginning of May. The highest peak of the measured runoff was observed in August. The accuracy results showed Coefficient of Determination and Efficiency as 0.91 as shown in Fig. 14. The validation simulation of year 2002 matched closely to the measured discharge of former years. The perfect match between computed and observed flows was obtained using the same calibrated parameters. The result listed in Table VI for Shigar River in UIB shows that the model calibration is acceptable.
Fig. 14.Validation of UBCWM for Year
2002 at Shigar River
TABLE VI STATISTICAL SUMMARY OF SHIGAR BASIN
AFTER UBC VALIDATION FOR THE YEAR 2002
Year Coefficient
of Efficiency
Coefficient of Determination
Observed flows (m3/s)
Computed flows (m3/s)
Difference between
Observed and
Estimated (m3/s)
Percentage flow
difference
2002 0.91 0.91 192.6 198.53 -5.93 3.07% Qobs
The contribution of flows in Shigar River for
validation period 2002 in cumecs and percentage are listed in Table VII. The maximum contribution is by glacier melt which is 64 % due to less snow cover depicted Fig. 10 and minimum contribution is by rainfall that is 1% only. Hence the Shigar Basin in glacier regimes is responsive to temperature trends. Fig. 15 shows the contributions in outflows in Shigar River for the validation period 2002.
TABLE VII CONTRIBUTION OF FLOWS FOR THE
VALIDATION YEAR 2002 FROM UBCWM SIMULATION
Flow(cumecs) Percentage (%) Snow 47.4 24 Glacier 126.3 64 Rainfall 1.1 1 Ground water 23.8 12 Total 198.5 100
Fig. 15. Runoff Components Determined from
UBCWM Validation Year 2002 for Shigar River
IX. APPLICATION OF UBCWM UNDER CLIMATE CHANGE
The long term daily temperature and precipitation data was available at Skardu Meteorological Station from year 1961-2002.The discharge data was also available at Shigar River gauging station from year 1985-2002. The mean annual temperature, mean annual precipitation and mean annual discharge trends were analyzed over the past 40 years. The data was analyzed by placing a linear least square trend line to the annual deviation from the mean and assessing the significance of trends. Over the long period 1961–2002, there has been a significant increase in mean annual temperature at Skardu of 0.24 C per decade. Fig. 16 shows a striking increase in mean annual temperature and hence significant warming at Skardu can be registered
Technical Journal, University of Engineering and Technology Taxila, Vol. 19 No. I - 2014
46

. Fig. 16. Mean Annual Temperature Trends at Skardu
Meteorological Station (1961-2002)
On the basis of long term daily precipitation data 1961-2002 at Skardu, there is no significant change in annual precipitation over the last forty years as shown in Fig. 17. An increase of 47% flows in 17 years at Shigar River since 1985 has been observed as shown in Fig. 18.
Fig. 17. Mean Annual Precipitation Trends at Skardu
Meteorological Station (1961-2002)
Fig. 18. Mean Annual Discharge Trend at Shigar
River Gauging Station (1985 – 2002)
The trends in mean annual maximum and minimum temperatures at Skardu over the period 1961-2002 were investigated for future climate prediction. Fig. 16 shows that there is an increase of 0.56C per decade in mean annual maximum temperature at Skardu since 1961-2002. There is contradicting reduction in annual minimum temperature of -0.079 C per decade. Both the trends
were projected for the next ten year using the linear trend line up to 2012 as the UBC watershed model accept the daily minimum and maximum temperature. The daily minimum temperature of year 2002 was multiplied by a factor -1.5% and similarly the daily maximum temperature was multiplied by factor 2.77 % to get the projected temperatures of 2012 on the basis of determined trends in minimum and maximum temperatures as shown in Fig. 19 and 20 respectively.
Fig. 19. Projection of Mean Annual Minimum Temperatures w.r.t Base Period (1961-2002)
Fig. 20. Projection of Mean Annual Maximum Temperatures w.r.t Base Period (1961-2002)
As Shigar River is the important tributary of
Indus River, it is important to estimate the future flow contribution due to changing climate pattern and melting of glaciers. After the satisfactory statistical results were achieved, the model was used to generate the flows for next ten years using the projected temperatures. The projected maximum and minimum temperatures were used as input in the UBC watershed model using the same calibrated WAT file for assessment of flows for next ten years 2012. As there is no significant trend exist in annual precipitation, therefore the input precipitation were kept the same as that were observed in 2002 at Skardu Meteorological Station. All the calibrated parameters were kept fixed. The projected flows for the next ten years in 2012 are 201.4 cumecs which are represented in Fig. 21. Like calibration and validation inflows, the major contribution in predicted inflows is from glacier melting which is
Technical Journal, University of Engineering and Technology Taxila, Vol. 19 No. I - 2014
47

65% of the total inflows. Thus, projected hydrological flows are clearly sensitive to the climate inputs. The volume and percentage distribution of various components of predicted inflows by UBCWM for year 2012 are listed in Table VII. The use of projected temperatures rather than measured may affect the performance of the model. This result demonstrates a dominant use of a physically based runoff generating method when applied to water resource planning studies. The Overall Increase in flows is 4 percent with respect to base year 2002. The rainfall and groundwater component flows remains the similar because the input precipitation and geographical parameters of basin were kept same as that of year 2002 for flows predication of year 2012. The main focus was to consider the affect of temperature on the flow regime generated by the glaciers. The predication duration is only after 10 years.
Fig. 21. Predicted Flows at Shigar River for year
2012 using UBCWM
TABLE VIII DISTRIBUTION OF COMPONENTS OF
PREDICTED FLOWS FOR YEAR 2012 AT SHIGAR FROM UBCWM SIMULATION
Flow (cumecs) Percentage (%) Snow 46 23 Glacier 131 65 Rainfall 1.1 1 Ground water 23.3 11
Total 201.4 100
TABLE IX OBSERVED AND ESTIMATED/PREDICTED
FLOWS FOR RISING AND ENDING OF FLOWS TIME PERIOD IN JULIAN DAYS
Year Observed
Flows (Cumecs)
Estimated/ Predicted
Flows (Cumecs)
Observed-Estimated (Cumecs)
Duration Starting
to Ending (Julian Days)
Coefficient of
Efficiency
Coefficient of
Determination
1998 377.92 368.91 8.09 90 – 290 -0.05 0.76
2001 370.5 421.9 -51.9 90 – 300 -6.26 0.83
2002 365.61 378.47 -12.86 135 – 285 -0.76 0.67
2012 Predicted - 453.13 135 –
285 - -
CONCLUSIONS
The University of British Columbia Watershed Model (UBCWM) was developed and used by M.C. Quick and A. Pipes in 1972 for daily stream flow forecasting at the Fraser River system in British Columbia (Quick and Pipes, 1972). In this research study, UBCWM windows version 1.1 was applied in the UIB on Shigar River for year round (January to December) 1998-2002. The following conclusions were drawn from the study: Analysis of temperature, precipitation and runoff
time series data showed positive trends as shown in Fig. 17, 18 and 19 respectively. They are increasing with the rising global warming. The mean annual temperature showed an increase of 0.24 C per decade at Skardu for record of 40 years 1961-2002. For annual precipitation, there is no considerable rise in trend as rainfall is scarce in this region. The effect of climate change has also been investigated. The trend of annual discharge showed increase in runoff volume up to 80 cumecs in 17 years 1985–2002.However it is not easy to predict the runoff response to climate change in such a daily varying runoff.
Relationships have been established between temperature, precipitation and runoff. The summer runoff and summer temperature are strongly correlated, hence Shigar Basin is sensitive to temperatures which is depicted in comparison graphs of temperature and runoff Fig. 8. The visual temperature-runoff relation suggests seasonal increase runoff in summer due to glacier melt. In glaciated Shigar Watershed, the runoff and precipitation are poorly or negatively correlated as lowest precipitation occurs in this region Fig. 9. Since 1961 the annual maximum temperatures have increased by 0.56 C per decade while there has been a reduction in annual minimum temperatures of
Technical Journal, University of Engineering and Technology Taxila, Vol. 19 No. I - 2014
48

0.079 C per decade at Skardu. The decrease in minimum temperature may change a part of precipitation falling as snow. Thus overall there is warming trend in winter due to increasing maximum temperature and a cooling summer due to decrease in minimum temperatures.
Geographic Information System (GIS) is very useful in describing the characteristics of watershed otherwise; characteristics like watershed delineation, area, elevation bands, hypsometric elevation mean have to be computed manually which are subjected to human error and physically very hard job to perform.
There is enormous amount of information available in GIS, the most represented databases of watershed are extracted on terrain and ecology. In this research, topographical characteristics of Shigar watershed were established from GIS information. The basin was accurately divided into 8 bands according to each 400 meter elevation interval.
After examining the statistical and graphical analysis of Shigar Watershed, it is concluded that UBCWM is well calibrated and validated. The computed model flows fits well to the recorded flows. There is a perfect match and correlation replicating the main features of hydrographs.
The UBCWM was able to simulate recorded flows in Shigar Watershed with an average coefficient of efficiency 0.895 and coefficient of determination 0.915 for the years 1998 and 2001. The difference between observed and calculated flow was 8.05% for two years. The major contribution in Shigar River is due to
glacier melting about 40% as the basin is more sensitive to varying temperatures thus the increase in trends give more input energy for higher melting rate of snow and glaciers. The rainfall is less in Shigar Basin therefore its effect or contribution is not prominent in UBCWM simulations. The reasonable calibrated and validated statistics indicate that the model can be applied for future water resource studies. Due to projected climatic change, the model predicted 4 percent more flows for 10 next ten years with respect to the validated year.
X. RECOMMENDATIONS
In this study, the trends of temperature and precipitation have been analyzed using the meteorological data of Valley Station which may be not representative for higher elevations. The flows may also be computed by considering the future precipitation changes. It is suggested to investigate that how the glaciers in Shigar Basin will behave in future with respect to the global warming. The flows data have not been gauged at Shigar River since 2002,
it is recommended to predict more precisely the hydrological flows in poorly gauged highly altitude basin as storing tremendous amount of water. The computation of future flows should also include the impact of change in precipitation. Since after 2002, the stream gauging station at Shigar River is inoperative due to flood. Therefore it is recommended to correlate Shigar River flows with a nearby recording gauge.
REFERENCES
[1] SIHP: Snow and Ice Hydrology Project Upper Indus Basin, Overall Report, WAPDA- IDRC- Wilfrid Laurier University, 179pp (1990).
[2] A. Ghazanfar, “Impact of Climate Change on Fresh Water Resources of Pakistan”. IUCN Climate Change Seminar (2007).
[3] A. S. Shakir, H. Rehman and S. Ehsan. S., “Climate Change Impact on River Flows in Chitral Watershed”, Pakistan Journal of Engineering & Applied Sciences, Vol. 7, 12-23 (2010).
[4] ICIMOD (International Centre for Integrated Mountain Development): Technical Report. Inventory of Glaciers and Glaciers Lakes and Identification of Potential Glacial Lake Outburst Floods (GLOFs) Affected by Global Warming in the Mountains of Himalayan Region Pakistan (2005).
[5] WAPDA: Water and Power Development Authority Report, Pakistan Snow & Ice Hydrology Project Report, Upper Indus Basin, (1993).
[6] H. J. Fowler and D. R. Archer, “Conflicting Signals of Climate Change in the Upper Indus Basin,” Journal of Climate, Vol. 19, 4276–4292 (2006).
[7] D. Bocchiola1, G. Diolaiuti, A. Soncini, C. Mihalcea, C. D’Agata, C. Mayer, A. Lambrecht, R. Rosso1, and C. Smiraglia, “Prediction of future hydrological regimes in poorly gauged high altitude basins: the case study of the upper Indus, Pakistan,” Hydrology and Earth System Science, 15, 2059–2075 (2011).
[8] H. J. Fowler and D. R. Archer, “Hydro-climatological Variability in the Upper Indus Basin and Implications for Water Resources”, Regional Hydrological Impacts of Climatic Change-Impact Assessment and Decision Making, T. Wagener et al., Eds., IAHS Publication 295, 131-138 (2005).
[9] C. P. Wake, “Snow accumulation studies in the central Karakoram,” Proc. Eastern Snow Conference 44thAnnual Meeting Frederiction, Canada. 19-33 (1987).
Technical Journal, University of Engineering and Technology Taxila, Vol. 19 No. I - 2014
49

[10] M. C. Quick and A. Pipes, “Daily and Seasonal Forecasting With a Water Budget Model”, In Role of Snow and Ice in Hydrology (Proceedings of the UNESCO/WMO/IAHS Symposium, Banff, September 1972), IAHS Publ., no. 106, 1017-1034 (1972).
[11] M. C. Quick and A. Pipes, “A Combined Snowmelt and Rainfall Runoff Model”, Canadian Journal of Civil Engineering, Vol. 3, No. 3, 449-460 (1976).
[12] M. C. Quick and A. Pipes, “UBC Watershed Model”, Hydrological Sciences Bulletin, 153-161 (1977).
[13] B. C. Hydro Engineering: Campbell River System Probable Maximum Flood. Report No.E347 (2005).
[14] A. N. Strahler, “Hypsometric (area–altitude) Analysis of Erosional Topography”, Geological Society of America Bulletin, 63, 1117–1142 (1952).
[15] M. J. Butt and M. Bilal, “Application of Snowmelt Runoff Model for Water Resource Management,” Hydrological Processes. Volume 25, Issue 24, 3735-3747 (2011).
[16] D. R. Archer, N. Forsythe, H. J. Fowler and S. M. Shah, “Sustainability of Water Resources Management in the Indus Basin under Changing Climatic and Socio Economic Conditions”. Hydrology and Earth System Science, Discuss. 7, 1883–1912 (2010).
[17] D. R. Archer, “Contrasting Hydrological Regimes in the Upper Indus Basin”. Journal of Hydrology, 274, Issues 1 – 4, 198– 210 (2003).
[18] H. G. Rees, H. G. and D. N. Collins, “Regional Deference in Response of Flows in Glacier-fed Himalayan Rivers to Climatic Warming,” Hydrological Process, 20 (10), 2157–2169 (2010).
[19] D. K. Hall, G. A. Riggs, V. V. Salomonson, N. E. DiGirolamo, K. J. Bayr, “MODIS Snow-cover Products.” Remote Sensing of Environment, 83:181–194 (2002).
[20] D. K. Hall, J. L. Foster, D. A. Robinson, G. A. Riggs, “Merging the MODIS and RUCL Monthly Snow-cover Records”. Proceedings of IGARSS’04, Anchorage, AK, USA, 20–24 (2004).
[21] D. K. Hall and G. A. Riggs, “Assessment of Errors in the MODIS Suite of Snow-cover Products,” Hydrological Processes (2006).
[22] G. A. Riggs, D. K. Hall, V. V. Salomonson, MODIS Snow Products User Guide Collection 5. http://modis-snow-ice.gsfc.nasa.gov/ sugkc2.html (2006).
[23] D. K. Hall, G. A. Riggs, and V. V. Salomonson, “MODIS Snow and Sea Ice Products”. Earth Science Satellite Remote Sensing–Volume I: Science and Instruments, Qu J (ed.). Springer-Verlag Press: Berlin, Heidelburg (2006).
Technical Journal, University of Engineering and Technology Taxila, Vol. 19 No. I - 2014
50