Embed Size (px)
Citation preview

ISSN: 0973-4945; CODEN ECJHAO
E-Journal of Chemistry
http://www.e-journals.net 2010, 7(2), 473-478
Assessment of Groundwater Pollution and its
Impact in and around Punnam Area of
Karur District, Tamilnadu, India
G. RAJA* and P. VENKATESAN
*Department of Chemistry, Paavai Engineering College,
Namakkal – 637 018, Tamilnadu, India.
Department of Chemistry, Mahendra Institute of Technology,
Namakkal – 637 503, Tamilnadu, India.
Received 8 October 2009; Accepted 5 December 2009
Abstract: Various samples of groundwater were collected from different areas
in and around the Punnam village of Karur District, India and analyzed for
their physicochemical characteristics. The results of this analysis were
compared with the water quality standards of WHO and CPHEEO. In this
analysis the various physicochemical parameters such as pH, electrical
conductivity, turbidity, total dissolved solids, Cl-, F-, SO42-, NO3
-, Na+, K+, Fe,
Cr, calcium and magnesium etc., were determined using standard procedures.
The quality of groundwater samples were discussed with respect to these
parameters and thus an attempt were made to ascertain the quality of
groundwater used for drinking and cooking purposes in the sampling areas.
Keywords: Groundwater, Physiochemical parameter, Water quality, Correlation coefficient.
Introduction
Water sources available for drinking and other domestic purposes must possess high degree of
purity, free from chemical contamination and microorganisms. The rapid growth of urban
areas has further affected the groundwater quality due to over exploitation of resources and
improper waste disposal practices1. Also, the effluent from the textile industry are
characteristics of waste water released from sizing, desizing, kiering, bleaching, mercerizing,
dye house and printing sections of composite cotton textile mills. The wastewater is highly
viscous with high suspended solids and total dissolved solids2. Therefore, pollution of water
resources needs a serious and immediate attention through periodical checkup of water quality.
The purpose of this study was to evaluate the composition and quality of groundwater and the
saline water intrusion in and around the Punnam village of Karur District, India.

474 G. RAJA et al.
Experimental
The study area, the Punnam village, is situated (11°0'23"N and 77°57'47"E) in 8 km away
from Karur District of Tamilnadu, India. The Punnam village is spread over 17 sq. km and
having population about 12,000. As large textile industries are situated in the Karur
district, the ground water gets contaminated at highest rate. Particularly, Punnam village is
depending on textile industries, wells and bore wells are significantly polluted. Hence, it
is proposed to study the ground water pollution and its impact in and around the Punnam
village.
Overall, 30 samples (3 samples from each location) were collected from the bore wells
of various places in and around of Punnam in Karur district and during this collection the
distance between one and other location was maintained at a minimum of one kilometer in
order to carry out a broad study on the quality of water in this area. The area of the sample
collected includes; Pasupathipalayam (1), Kulathur (2), Naduppalayam (3), Chathiram (4),
Sadaiyampalayam (5), Govindampalayam (6), Kuttakadai (7), Kuppam (8), Pavithram (9),
Punnam (10).
Collection of samples
Various water samples were collected in clean and dry polyethylene bottles from bore wells
after running them for 5 minutes. All the collection of samples are immediately preserved in
dark boxes and processed for the different analysis within 6 hours after collection. In this
present study, various physical and chemical parameters of water samples were determined
and the results were compared with the values of various water quality standards such as
World Health Organization (WHO) and Central Public Health and Environmental
Engineering Organization (CPHEEO).
Physicochemical analysis
The temperature of the samples was noted at their sampling point itself. The samples
collected were analyzed for important physical and chemical parameters such as
temperature, taste, turbidity, conductivity, pH, hardness, total solids, total dissolved solids,
total suspended solids, chlorides, sulphate, nitrate, fluorides dissolved oxygen, sodium,
potassium and heavy metals. Standard procedure involving spectrophotometry, flame
photometry and volumetry were used for the experiment3.
Bacteriological analysis
In bacteriological examination4, total coliforms (28 °C for 24 h) and faecal
coliforms (44.5 °C for 24 h) were determined by Membrane Filtration (MF)
technique, and the average values were recorded. The TC was enumerated by
M-Endo Agar, (Hi-Media Mumbai) which appeared as metallic sheen colour
colonies, and FC was enumerated by M-FC Agar, (Hi-Media Mumbai) which
appeared as blue colour colonies.
Results and Discussion
The various physical, chemical and biological parameters determined for the water samples
were given in Tables 1, 2 and 3 respectively. The statistical evaluation was given in Table 4.
From the analyzed results it was found that the quality of water considerably varies from
location to location.

Assessment of Groundwater Pollution and its Impact 475
Table 1. Physical parameters, in mg/L
Parameters 1 2 3 4 5 6 7 8 9 10
Temp, °C 31.5 31.5 32.5 31 30 31.5 29.5 29.5 30.5 30.0
Colour CL CL CL CL CL CL CL CL CL CL
Odour OL OL OL OL OL OL OL OL OL OL
Taste S B SS B N SS SS SS N SS
Turbidity CLR CLR CLR CLR CLR CLR CLR CLR CLR CLR
Conductivity 2.16 2.91 1.59 2.80 1.01 2.14 2.06 2.09 1.16 1.93
Total solids 2,125 2,845 1,695 3,020 925 2,060 2,328 2,080 988 1,885
TDS 2,065 2,790 1,675 2,940 905 2,030 2,278 2,040 968 1,865
TSS 60 55 20 80 20 30 50 40 20 20
CL – Colourless; OL – Odourless; S – Salt; SS – Slightly Salt; N – Normal; B – Bitter; CLR – Clear;
TDS – Total Dissolved Solid; TSS – Total Suspended Solid
Physical parameters
As far as the physical parameters are concerned all the samples were appeared colorless,
clear and odourless. The temperature of the sample is lies between 29.5 to 32.5 °C. The
increase in the temperature decreases the portability of water due to expel of taste imparting
CO2 and others gases. Thus, the taste of sample differs from place to place5.
Table 2. Chemical parameters, in mg/L.
Parameters 1 2 3 4 5 6 7 8 9 10
pH 8.6 8.0 8.5 8.0 7.3 8.7 7.8 7.3 7.4 8.1
Total hardness 315 455 225 520 210 245 912 424 188 245
Total Alkalinity 818 725 388 905 315 445 894 495 310 325
Calcium
Hardness 205 165 71 223 85 92 124 85 98 106
Magnesium
Hardness 147 68 96 88 75 112 52 126 78 64
Sodium 550 470 420 390 170 330 340 350 180 450
Potassium 135 95 80 40 20 40 40 30 20 40
Iron 0.2 0.3 0.1 0.2 0.3 0.2 0.1 0.2 0.4 0.2
Chromium 0.06 0.09 1.0 0.07 0.09 0.05 0.08 0.07 0.06 0.09
Chloride 195 305 158 382 125 228 115 195 178 125
Sulphate 165 228 104 290 115 196 75 148 155 195
Nitrate 75 40 40 35 20 25 15 30 40 50
Fluoride 0.72 0.82 0.57 1.20 0.68 1.30 0.91 0.89 0.75 0.30
Table 3. Biological parameters, in mg/L.
Parameters 1 2 3 4 5 6 7 8 9 10
Dissolved
oxygen 2.2 2.5 3.5 1.6 5.5 2.4 2.6 2.3 3.9 3.7
COD 65.4 85.2 47.0 98.5 46.0 65.7 67.8 62.0 51.0 48.0
BOD 2.5 3.2 1.4 3.1 1.2 2.6 2.3 1.9 1.4 1.5
faecal coliforms,
MPN/100 mL 50 80 40 70 20 70 50 70 30 100
COD – Chemical Oxygen Demand; BOD – Biological Oxygen Demand
476 G. RAJA et al.
Chemical parameters
Conductance of water samples varied from 1.01 to 2.91 mS/cm. But samples 2 and 4 had
relatively higher conductivity, which may be due to contamination of conducting material in
water samples. According to WHO and CPHEEO Standards, the acceptance limit for TDS in
groundwater is 500 mg/L, which may go up to 1500 mg/L in case of any alternative source.
But, almost all the samples exceed the permissible limit and sample 5 and 9 are found
moderately hard.
The pH values of all the sample shows in the range of pH 7.3 to 8.7, which indicates
they were with in the desirable limit except sample 6. The mild alkalinity may be due to the
bicarbonates. The alkalinity of the samples 1, 2, 4 and 7 are found to be high due to more
seepage of effluent, domestic sewage around the stations.
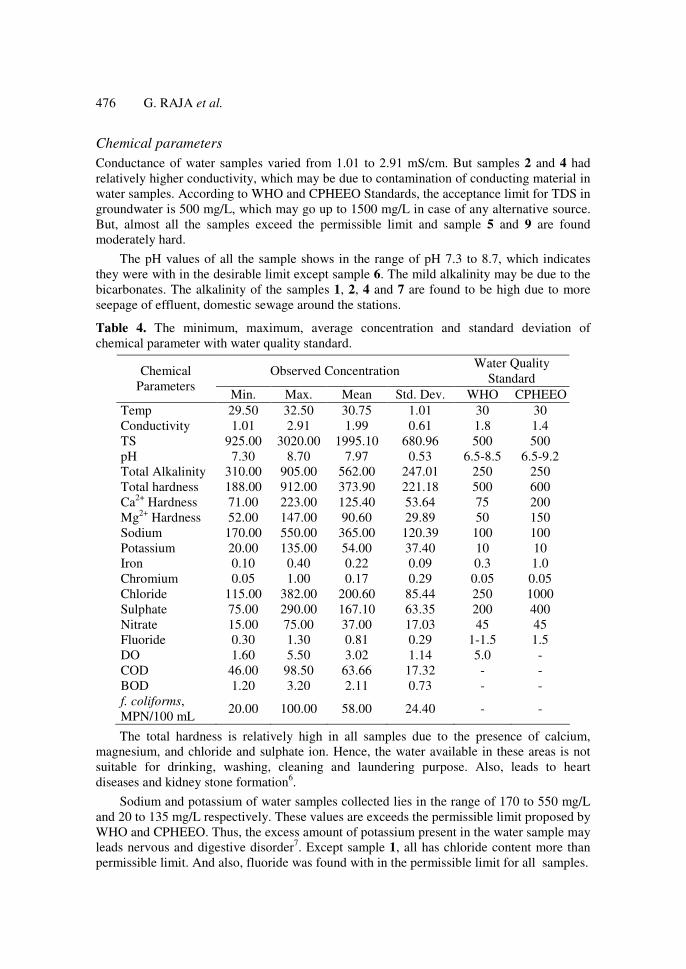
Table 4. The minimum, maximum, average concentration and standard deviation of
chemical parameter with water quality standard.
Observed Concentration Water Quality
Standard Chemical
Parameters Min. Max. Mean Std. Dev. WHO CPHEEO
Temp 29.50 32.50 30.75 1.01 30 30
Conductivity 1.01 2.91 1.99 0.61 1.8 1.4
TS 925.00 3020.00 1995.10 680.96 500 500
pH 7.30 8.70 7.97 0.53 6.5-8.5 6.5-9.2
Total Alkalinity 310.00 905.00 562.00 247.01 250 250
Total hardness 188.00 912.00 373.90 221.18 500 600
Ca2+
Hardness 71.00 223.00 125.40 53.64 75 200
Mg2+
Hardness 52.00 147.00 90.60 29.89 50 150
Sodium 170.00 550.00 365.00 120.39 100 100
Potassium 20.00 135.00 54.00 37.40 10 10
Iron 0.10 0.40 0.22 0.09 0.3 1.0
Chromium 0.05 1.00 0.17 0.29 0.05 0.05
Chloride 115.00 382.00 200.60 85.44 250 1000
Sulphate 75.00 290.00 167.10 63.35 200 400
Nitrate 15.00 75.00 37.00 17.03 45 45
Fluoride 0.30 1.30 0.81 0.29 1-1.5 1.5
DO 1.60 5.50 3.02 1.14 5.0 -
COD 46.00 98.50 63.66 17.32 - -
BOD 1.20 3.20 2.11 0.73 - -
f. coliforms,
MPN/100 mL 20.00 100.00 58.00 24.40 - -
The total hardness is relatively high in all samples due to the presence of calcium,
magnesium, and chloride and sulphate ion. Hence, the water available in these areas is not
suitable for drinking, washing, cleaning and laundering purpose. Also, leads to heart
diseases and kidney stone formation6.
Sodium and potassium of water samples collected lies in the range of 170 to 550 mg/L
and 20 to 135 mg/L respectively. These values are exceeds the permissible limit proposed by
WHO and CPHEEO. Thus, the excess amount of potassium present in the water sample may
leads nervous and digestive disorder7. Except sample 1, all has chloride content more than
permissible limit. And also, fluoride was found with in the permissible limit for all samples.

Assessment of Groundwater Pollution and its Impact 477
High amount of sulphate imparts bitter taste to the sample 2 and 4. Also, this will cause
laxative effect to the children in hot weather climates8. As sample 1 and 10 has nitrate
concentration above permissible limit (45 mg/L) according to WHO, It has been reported
that nitrate concentration causes Methemoglobinemia and cyanosis in these sampling area9.
Biological parameter
The DO level of all samples except station 5 shows very low value because of the effluent
from the industries containing high amount of organic wastes depletes the oxygen level. It is
observed from the experimental data that the COD ranges from 46 to 98.5 g/L, which exist in
the permissible limit except sample 2 and 4. It clearly indicates the toxic nature of water found
in those areas. Also, it was further confirmed by higher concentration of BOD found in those
areas. Hence, water from sampling area 2 and 4 was not suitable for drinking purpose. The
faecal coliforms values are in the range of 20 to 100 MPN/100 mL. This is higher than the
permissible limit according to ISI. Hence, they may not be used for drinking purpose.
Table 5. Correlation coefficient (r) for different parameter.
Parameters EC pH TH TA Ca2+
Mg2+
Na+
K+
Cl-
SO42-
NO3-
EC 1.00
pH 0.38 1.00
Total
Hardness 0.48 0.12 1.00
Total
Alkalinity 0.74 0.23 0.78 1.00
Calcium 0.69 0.27 0.34 0.82 1.00
Magnesium 0.10 0.36 0.33 0.07 0.17 1.00
Sodium 0.69 0.68 0.16 0.50 0.54 0.34 1.00
Potassium 0.42 0.65 0.01 0.44 0.52 0.45 0.82 1.00
Chloride 0.75 0.18 0.11 0.51 0.69 0.16 0.28 0.19 1.00
Sulphate 0.67 0.22 0.12 0.28 0.64 0.09 0.32 0.10 0.87 1.00
Nitrate 0.17 0.45 0.38 0.10 0.47 0.51 0.67 0.74 0.11 0.28 1.00
Correlation coefficient analysis
Sources of measured parameters in groundwater were examined through the analysis of
linear correlation10
. The correlation metric for all samples are given in Table 5. We
considered the correlation as good if r>0.6 and marginal of 0.47<r<0.6. Since the total
hardness and total alkalinity (r = 0.78) has good correlation as well as pH with Sodium and
Potassium (r = 0.68, 0.65 respectively), it clearly indicates the level of bicarbonate and
carbonate of Sodium and Potassium were found excess in the ground water. Hence, it makes
ground water more alkaline. Calcium has good correlation with chloride and sulphate
(r = 0.69 and 0.64 respectively) indicating that it is in the form of CaCl2 and CaSO4 so as to
produces permanent hardness. Also, Nitrate shows marginal correlation with magnesium
(r = 0.51) and good correlation with sodium (r = 0.67) and potassium (r = 0.74). It means
that nitrate exist in the non-acidic salt form. Similarly, the conductivity has good correlation
with calcium (r = 0.69), sodium (r = 0.69), chloride (r = 0.75) and sulphate (r = 0.67).
Conclusion
The water quality parameter of the various areas around Punnam clearly indicates that the
water samples are highly polluted. It is observed that the water taken from Pasupathipalayam,

478 G. RAJA et al.
Kulathur, Chathiram are alarmingly get polluted followed by Kuttakadai. These areas
situated nearer to the textile industries. So, the proper environment management plan may be
adopted to control the release of effluent. Hence it is suggested to exercise all the necessary
precaution before the water is used for drinking and irrigation. Otherwise, it may lead to
much adverse health effect.
References
1. Rajankar P N, Gulhane S R, Tambekar D H, Ramteke D S and Wate S R, E-Journal
of Chemistry, 2009, 6(3), 905.
2. Sekar P, Hariprasad S and Deccaraman M, J Appl Sci Res., 2008, 4(11), 1526.
3. Nagarajan S, Swaminathan M and Sabarathinam P L, Poll Res., 1993, 12(4), 245.
4. Hank Mikaelian, ASHI Technical Journal, 1991, 1(2), 39
5. Karunakaran K, Thamilarasu P and Sharmila R, E-Journal of Chemistry, 2009,
6(3), 909.
6. Lalitha S and Barani A V, Indian J Environ Protect., 2004, 24(12), 925.
7. Tiwari T R, Indian J Environ Health, 2001, 43(1), 176.
8. Gupta and Suruchi, Asian J Chem., 2001, 13(3), 16.
9. Van Grinson H J M, Ward M H, Benjamin N and De Kok T M, Environmental
Health, 2006, 5(26), 1.
10. Suresh Tewari, Ashwini Ranade and Deewan Singh, Indian Journal of Radio &
Space Physics, 2006, 35, 35.

Submit your manuscripts athttp://www.hindawi.com
Hindawi Publishing Corporationhttp://www.hindawi.com Volume 2014
Inorganic ChemistryInternational Journal of
Hindawi Publishing Corporation http://www.hindawi.com Volume 2014
International Journal ofPhotoenergy
Hindawi Publishing Corporationhttp://www.hindawi.com Volume 2014
Carbohydrate Chemistry
International Journal of
Hindawi Publishing Corporationhttp://www.hindawi.com Volume 2014
Journal of
Chemistry
Hindawi Publishing Corporationhttp://www.hindawi.com Volume 2014
Advances in
Physical Chemistry
Hindawi Publishing Corporationhttp://www.hindawi.com
Analytical Methods in Chemistry
Journal of
Volume 2014
Bioinorganic Chemistry and ApplicationsHindawi Publishing Corporationhttp://www.hindawi.com Volume 2014
SpectroscopyInternational Journal of
Hindawi Publishing Corporationhttp://www.hindawi.com Volume 2014
The Scientific World JournalHindawi Publishing Corporation http://www.hindawi.com Volume 2014
Medicinal ChemistryInternational Journal of
Hindawi Publishing Corporationhttp://www.hindawi.com Volume 2014
Chromatography Research International
Hindawi Publishing Corporationhttp://www.hindawi.com Volume 2014
Applied ChemistryJournal of
Hindawi Publishing Corporationhttp://www.hindawi.com Volume 2014
Hindawi Publishing Corporationhttp://www.hindawi.com Volume 2014
Theoretical ChemistryJournal of
Hindawi Publishing Corporationhttp://www.hindawi.com Volume 2014
Journal of
Spectroscopy
Analytical ChemistryInternational Journal of
Hindawi Publishing Corporationhttp://www.hindawi.com Volume 2014
Journal of
Hindawi Publishing Corporationhttp://www.hindawi.com Volume 2014
Quantum Chemistry
Hindawi Publishing Corporationhttp://www.hindawi.com Volume 2014
Organic Chemistry International
Hindawi Publishing Corporationhttp://www.hindawi.com Volume 2014
CatalystsJournal of
ElectrochemistryInternational Journal of
Hindawi Publishing Corporation http://www.hindawi.com Volume 2014