Embed Size (px)
Citation preview

Atomic and Electronic Structure of the BaTiO3(001) ðffiffiffi
5p � ffiffiffi
5p ÞR26:6�
Surface Reconstruction
John Mark P. Martirez,1 Erie H. Morales,2 Wissam A. Saidi,3 Dawn A. Bonnell,2 and Andrew M. Rappe1
1The Makineni Theoretical Laboratories, Department of Chemistry, University of Pennsylvania,Philadelphia, Pennsylvania 19104-6323, USA
2Department of Materials Science and Engineering, University of Pennsylvania, Philadelphia, Pennsylvania 19104-6202, USA3Department of Chemical and Petroleum Engineering, University of Pittsburgh, Pittsburgh, Pennsylvania 15261, USA
(Received 20 August 2012; published 20 December 2012)
This contribution presents a study of the atomic and electronic structure of the ð ffiffiffi
5p � ffiffiffi
5p ÞR26:6�
surface reconstruction on BaTiO3 (001) formed by annealing in ultrahigh vacuum at 1300 K. Through
density functional theory calculations in concert with thermodynamic analysis, we assess the stability of
several BaTiO3 surface reconstructions and construct a phase diagram as a function of the chemical
potential of the constituent elements. Using both experimental scanning tunneling microscopy (STM)
and scanning tunneling spectroscopy measurements, we were able to further narrow down the candidate
structures, and conclude that the surface is either TiO2-Ti3=5, TiO2-Ti4=5, or some combination, where Ti
adatoms occupy hollow sites of the TiO2 surface. Density functional theory indicates that the defect
states close to the valence band are from Ti adatom 3d orbitals (�1:4 eV below the conduction band
edge) in agreement with scanning tunneling spectroscopy measurements showing defect states 1:56�0:11 eV below the conduction band minimum (1:03� 0:09 eV below the Fermi level). STM measure-
ments show electronic contrast between empty and filled states’ images. The calculated local density of
states at the surface shows that Ti 3d states below and above the Fermi level explain the difference in
electronic contrast in the experimental STM images by the presence of electronically distinctive
arrangements of Ti adatoms. This work provides an interesting contrast with the related oxide
SrTiO3, for which the (001) surface ð ffiffiffi
5p � ffiffiffi
5p ÞR26:6� reconstruction is reported to be the TiO2 surface
with Sr adatoms.
DOI: 10.1103/PhysRevLett.109.256802 PACS numbers: 73.20.�r, 68.35.Md, 68.47.Gh, 68.37.Ef
The last decade has seen a resurgence of interest inferroelectric compounds, due in a large part to recentdevelopments in materials processing that enable newmaterials properties. Examples include strain controlledferroelectric coupling [1], polarization controlledsurface reactions [2,3], surface chemical control of polar-ization [4,5], and multiferroic behavior [6]. Surfaceatomic and electronic structure is a crucial parameterthat influences these phenomena, and although the surfacescience of transition metal oxides is a long-standingfield, its application to ferroelectric compounds has beenlimited. BaTiO3 is considered the prototypical ferroelectricperovskite compound and a model system on which toexamine ferroelectric interactions, yet, it is only recentlythat surface reconstructions have been observed on the(001) surface [7–10]. The determination of the detailedgeometric and electronic structure of BaTiO3 (001) is aprecursor to understanding interactions at the surfaceof this compound and of ferroelectric materials ingeneral.
Experimental evidence shows that BaTiO3 undergoesa series of surface reconstructions with (1� 1), (2� 1),
cð2� 2Þ, ð ffiffiffi
5p � ffiffiffi
5p ÞR26:6�, (3� 1), (3� 2), and (6� 1)
periodicity at increasing annealing temperatures inhighly reducing conditions [8]. The identity of the
ð ffiffiffi
5p � ffiffiffi
5p ÞR26:6� is also believed to be of the TiO2-Tix
type, because experimentally the (3� 1) TiO2-Ti2=3 forms
under similar experimental conditions [8]. However, the
ð ffiffiffi
5p � ffiffiffi
5p ÞR26:6� reconstruction has not been investigated
theoretically or experimentally in detail.
The present contribution explores the atomic and elec-
tronic structure of the ð ffiffiffi
5p � ffiffiffi
5p ÞR26:6� surface theoreti-
cally and experimentally using ab initio density functional
theory (DFT) and scanning tunnelling techniques [scan-
ning tunneling microscopy (STM) and scanning tunneling
spectroscopy (STS)]. We examine many structures and
compositions with the same periodicity to identify the
experimentally observed surface structures. Our DFT
results explain the electronic contrast in STM images,
and the surface atomic state contributions to the valence
and conduction bands, which are corroborated by STS
measurements. The surface model, consistent with thermo-
dynamic stability analysis, confirms a TiO2 with Ti adatom
surface.BaTiO3 single crystals are (001) oriented and one side
polished. The single crystal is radiatively heated in UHV(pressure of 2� 10�10 Torr), effectively reducing it andchanging its color to either dark blue or black [11]. Aftersputtering at 1 kV and 1 �A for 20 minutes [12] and
PRL 109, 256802 (2012) P HY S I CA L R EV I EW LE T T E R Sweek ending
21 DECEMBER 2012
0031-9007=12=109(25)=256802(5) 256802-1 � 2012 American Physical Society

two UHVannealing steps at 1000 K and 1300 K, we obtainthe desired reconstruction. STS measurements are per-formed by measuring I � V curves from �3 to 3 V, withthe feedback loop turned off in UHV conditions. See theSupplemental Material for details on the experimentalprocedure [13].
The surfaces are simulated using slabs with 6-7 atomiclayers with the in-plane supercell periodicity fixed at
4:00� ffiffiffi
5p
�A, where 4.00 A is the BaTiO3 experimentallattice constant, a. The DFT calculations are performedusing the Quantum ESPRESSO [14] package and thePerdew-Burke-Ernzerhof form of the generalized gradientapproximation. The core electronic states of the elementswere described using norm-conserving pseudopotentials[15–17], generated using the OPIUM code [18]. We didspin-polarized DFTþU [19] (U ¼ 4:9 eV) calculationsfor the electronic structure studies. Further detailsabout the calculations are provided in the SupplementalMaterial [13].
Approximately 50 surface structures with ð ffiffiffi
5p �
ffiffiffi
5p ÞR26:6� symmetry, resulting from the introduction ofoxygen vacancies on both BaO and TiO2 surfaces, and ada-toms (Ba and Ti) and TixOy-layers on the TiO2 surface, were
studied. The construction of the phase diagram is described inthe Supplemental Material [13].
STM empty state [Fig. 1(a)] and filled state [Fig. 1(b)]images have atomically resolved features corresponding
to the periodicity of the ð ffiffiffi
5p � ffiffiffi
5p ÞR26:6� surface recon-
struction previously observed in BaTiO3 (001) singlecrystals [8]. Both Figs. 1(a) and 1(b) show white agglom-erates that could be composed of BaO-like, BaO2, orBaTiO3 [20]. Additionally, both figures have the sameperiodicity; however, the latter exhibits contrast thatresembles a mesh whereas the former presents sharpercircular atomic features. A representative experimentallocal density of states (LDOS) obtained from an I � Vcurve (Fig. S1, Supplemental Material [13]) in Fig. 2(a)
was measured on a ð ffiffiffi
5p � ffiffiffi
5p ÞR26:6� surface. The values
shown are average values drawn from several x-y mea-surements. The onset of the conduction band minimum islocated 0.59 eV above the Fermi level (EF), and thusthe bulk gap is roughly estimated to be from -2.6 to0.59 eV since the bulk band gap energy is 3.2 eV[21,22]. The I� V curve has negative static conductancethat produces an extra gap from 1.51 to 1.86 eV above EF
in Fig. 2(a) which is not an artifact and will be analyzedin context with other BaTiO3 surface reconstructions ina future publication [23]. The energy between the top ofthe defect states and the conduction band minimum is1:56�0:11 eV, which is less than the bulk band gap.STS measures the local electronic structure, thus, havingstates below EF and in the gap indicates that surface Tiatoms are indeed reduced. The surface states located1:03� 0:09 eV below EF are attributed to Ti 3d3þ andalso are observed 0.9 eV below EF in ultraviolet
photoelectron spectroscopy measurements [24]. The Ti3d3þ surface states seen in our study are in close agree-ment with previous STS measurements on a surface
addressed as the multiple of ð ffiffiffi
5p � ffiffiffi
5p ÞR26:6� where
defect states located at 0.8 and 1.2 eV below EF havealso been observed [7,25]. The Ti 3d–derived states are acommon constituent of the electronic structures of tita-nates. They are, for example, observed in TiO2 [26,27]
approximately 1 eV below EF. Additionally, the ð ffiffiffi
5p �
ffiffiffi
5p ÞR26:6� reconstruction occurs in SrTiO3 and showssimilar defect states at approximately 1.2 eV below EF,see, for example, Ref. [28].
FIG. 1 (color online). Experimental and calculated STM im-ages of BaTiO3 (001) ð
ffiffiffi
5p � ffiffiffi
5p ÞR26:6� surface. (a) Empty-state
image at bias�3:02 V and 0.17 nA, 30 nm� 10 nm. (b) Filled-state image at bias 2.09 V and 0.17 nA, 30 nm� 10 nm.Simulated STM [30]; (c) and (d) are the empty (3 eV aboveEF) and filled (2 eV below EF) state images for TiO2-Ti3=5,
respectively. (e) and (f) are the empty and filled state images forTiO2-Ti4=5, respectively. The white dash-lined squares denote
the ð ffiffiffi
5p � ffiffiffi
5p ÞR26:6� unit, while the lower left insets are the
raw images prior to computational smearing to mimic the finitetip resolution. (g) and (h) are the ball-and-stick models ofð ffiffiffi
5p � ffiffiffi
5p ÞR26:6� TiO2-Ti3=5 and TiO2-Ti4=5 reconstructions,
with dashed lines denoting theffiffiffi
5p � ffiffiffi
5p
super cell. Largespheres: O; small spheres: Ti.
PRL 109, 256802 (2012) P HY S I CA L R EV I EW LE T T E R Sweek ending
21 DECEMBER 2012
256802-2

The first principles surface phase diagram for surfaces
with ð ffiffiffi
5p � ffiffiffi
5p ÞR26:6� symmetry is shown in Fig. 3(a).
The upper right corner is dominated by BaO and BaO-derived (BaO with O vacancy) surfaces, while the lowerleft corner contains TiO2-derived surfaces: the TiO2
double layer structure (TiO2 DL), partially reduced TiO2
DL (TiO2-TiO9=5), and Ti and TiO covered TiO2 surfaces.
The region of stability of BaTiO3 at 1300 K with respect toother secondary phases [29], bordered by the white solidline, runs across the TiO2-derived surfaces. Given the hightemperature conditions of the experiment and the smallfree energy error due to neglect of entropic contributionsfrom the surface, Fig. 3(b) shows the number of surfacephases whose energies are within 0.10 eV per primitive unitcell (� kBT) of the lowest energy surface, at any Ba and Ochemical potentials.
Within the bulk stability boundary at 1300 K, severalsurface phases are possible as suggested by the stabi-lity analysis represented in Figs. 3(a) and 3(b) (seeSupplemental Material for the complete list [13]). Wecalculated the surface LDOS, and empty and filled stateSTM images for TiO2 DL, TiO2-TiO9=5 (owing to their
wide range of stability), TiO2-Ti1=5 to TiO2-Ti4=5, and
TiO2-Ba1=5 and TiO2-Ba2=5 (TiO2-Sr1=5 having being pro-
posed for the SrTiO3(001) ðffiffiffi
5p � ffiffiffi
5p ÞR26:6� reconstruc-
tion). The TiO2-Ti3=5 and TiO2-Ti4=5 proved to be most
consistent with both the experimental LDOS spectrum andthe STM images, and are identified as stable and close inenergy by the DFT-thermodynamic calculations, and thuswill be discussed here in more detail. For the structure,calculated LDOS and STM images of other phases, see theSupplemental Material [13].
The ball-and-stick models for ð ffiffiffi
5p � ffiffiffi
5p ÞR26:6�
TiO2-Ti3=5 (hereafter TiO2-Ti3=5) and ð ffiffiffi
5p � ffiffiffi
5p ÞR26:6�
TiO2-Ti4=5 (hereafter TiO2-Ti4=5) are shown in Figs. 1(g)
and 1(h). In both surfaces, Ti adatoms are situated at thehollow sites of the TiO2 surface. For TiO2-Ti3=5, each Ti
adatom has two Ti adatom neighbors and are arranged in azigzag pattern where one type (TiA, yellow spheres) has itsneighbors in a straight line, while the other (TiB, purplespheres) has its neighbors 90� to each other. In the case ofTiO2-Ti4=5, all Ti adatoms have the same number of Ti-
adatom neighbors and neighbors’ orientation. However,their electronic structures are different, thus resulting indifferent appearance in the empty and filled STM images,we annotate them as TiA (yellow spheres), TiB (purplespheres), and TiC (pink spheres).Calculated empty and filled state STM images
[30] of TiO2-Ti3=5 and TiO2-Ti4=5 are shown in
Figs. 1(c)–1(f). For TiO2-Ti3=5, the empty state image
has bright spots spacedffiffiffi
5p
a from each other, correspond-ing to TiA adatoms. In the filled state image, a pair ofbright spots corresponding to the TiB adatoms gives a
columnar feature, where the columns are spacedffiffiffi
5p
aapart. For TiO2-Ti4=5, the empty state image also has
FIG. 3 (color online). (a) Phase diagram generated from first-principles thermodynamic calculations as a function of therelative chemical potential of Ba and O. The white solid linesbound the stability region of BaTiO3 relative to the secondaryphases [29] at 1300 K. DL and VO refer to the double layerstructure and surface oxygen vacancy, respectively. (b) Surfacephase population where we count the number of surface phaseswhose energies are within 0.10 eV/primitive unit cell of thelowest energy structure. Regions I to III correspond tolog½pO2
ðtorrÞ� in the range of �9 to �17, �17 to �20, and
�20 to �24, respectively. The experiment is believed to bebetween log½pO2
ðtorrÞ� ¼ �10 to �27 [8].FIG. 2 (color online). Experimental and calculated LDOS ofBaTiO3 (001) ð ffiffiffi
5p � ffiffiffi
5p ÞR26:6� surface. (a) Experimental sur-
face LDOS and calculated z-scaled projected densities of states(PDOS) [31] of ð ffiffiffi
5p � ffiffiffi
5p ÞR26:6� TiO2-Ti3=5 and TiO2-Ti4=5.
The valance band maxima (VBM) of the experimental andcalculated LDOS are aligned. (b) and (c) PDOS for Ti speciesfound on the surface. The sets of three lines for each Ti adatom(TiA, TiB, and TiC) correspond to dx2�y2 þ dxy, dxz þ dyz, and
dz2 , from top to bottom (lightest to darkest shade). For subsur-
face Ti (found on the underlying TiO2), the sum of the contri-bution of all sub-surface Ti states are shown. Some of the spectraare shifted along the y axis for clarity.
PRL 109, 256802 (2012) P HY S I CA L R EV I EW LE T T E R Sweek ending
21 DECEMBER 2012
256802-3
bright spots spacedffiffiffi
5p
a from each other, associated withTiA. The filled state image shows three prominent con-tinuous spots per unit-cell associated with TiB and TiC,with slight distinction between the shape of their contri-bution as shown in its inset STM.
The calculated local and projected densities of states[31] for the surfaces indicate that most of the states near EF
(above and below) are derived from d states of Ti adatoms,as shown in Figs. 2(b) and 2(c). TiA adatoms compose mostof the conduction band while TiB and TiC adatomsare mostly filled and are found in the energy gap. TheLDOS for TiO2-Ti3=5 and TiO2-Ti4=5 have peaks at
�1:44� 0:01 eV and�1:45� 0:01 eV below the surfaceconduction band, respectively, within the experimentaluncertainty. The projected density of states explain thecontrast between filled and empty state images, whereTiA adatoms show in the empty state image while TiBand TiC show more prominently in the filled state image.
Annealing at extremely high temperature and UHVconditions is a reducing environment, increasing the metalcation-to-oxygen ratio at the surface and changing the Ba:Ti cation ratio as well. The experimental conditions arebelieved to be such that BaO forms surface agglomerates,which manifest as white cloud-like features in the STMimages. Further, the experiment is estimated to be betweenlog½pO2
ðtorrÞ� ¼ �10 and�27, where the UHV base pres-
sure serves as the upper limit, while the water partialpressure defines the lower limit [8]. The phase diagram[Fig. 3(a)] predicts the stability of TiO2-Ti4=5 at a point
where BaO precipitates and at about ��O ¼ �5 eV( log½pO2
ðtorrÞ� ¼ �24), where, according to Fig. 3(b), a
wide variety of phases may coexist at a 0.10 eV/primitive-unit-cell surface energy window. Despite possible coexis-
tence, we assign the consistency of the ð ffiffiffi
5p � ffiffiffi
5p ÞR26:6�
surface reconstruction to be of the TiO2-Tix type, basedon the experimental STM and STS and computed STMimages and LDOS spectra.
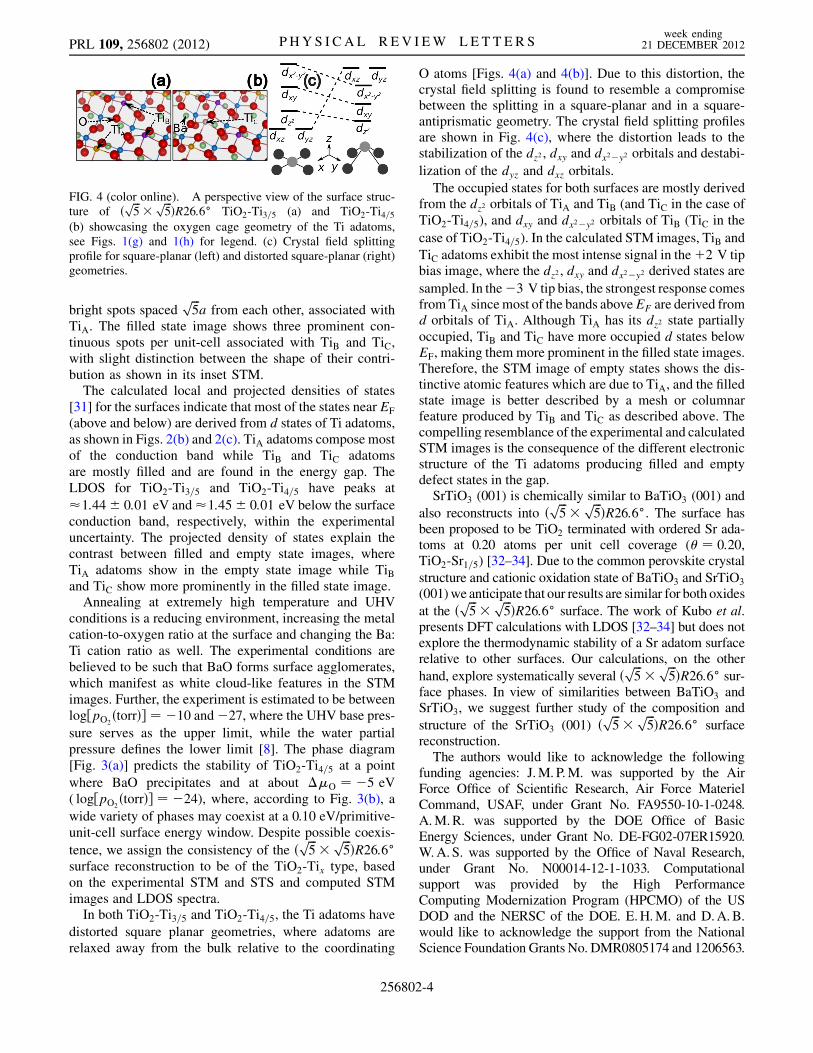
In both TiO2-Ti3=5 and TiO2-Ti4=5, the Ti adatoms have
distorted square planar geometries, where adatoms arerelaxed away from the bulk relative to the coordinating
O atoms [Figs. 4(a) and 4(b)]. Due to this distortion, thecrystal field splitting is found to resemble a compromisebetween the splitting in a square-planar and in a square-antiprismatic geometry. The crystal field splitting profilesare shown in Fig. 4(c), where the distortion leads to thestabilization of the dz2 , dxy and dx2�y2 orbitals and destabi-
lization of the dyz and dxz orbitals.
The occupied states for both surfaces are mostly derivedfrom the dz2 orbitals of TiA and TiB (and TiC in the case of
TiO2-Ti4=5), and dxy and dx2�y2 orbitals of TiB (TiC in the
case of TiO2-Ti4=5). In the calculated STM images, TiB and
TiC adatoms exhibit the most intense signal in theþ2 V tipbias image, where the dz2 , dxy and dx2�y2 derived states are
sampled. In the�3 V tip bias, the strongest response comesfromTiA sincemost of the bands aboveEF are derived fromd orbitals of TiA. Although TiA has its dz2 state partially
occupied, TiB and TiC have more occupied d states belowEF, making them more prominent in the filled state images.Therefore, the STM image of empty states shows the dis-tinctive atomic features which are due to TiA, and the filledstate image is better described by a mesh or columnarfeature produced by TiB and TiC as described above. Thecompelling resemblance of the experimental and calculatedSTM images is the consequence of the different electronicstructure of the Ti adatoms producing filled and emptydefect states in the gap.SrTiO3 (001) is chemically similar to BaTiO3 (001) and
also reconstructs into ð ffiffiffi
5p � ffiffiffi
5p ÞR26:6�. The surface has
been proposed to be TiO2 terminated with ordered Sr ada-toms at 0.20 atoms per unit cell coverage (� ¼ 0:20,TiO2-Sr1=5) [32–34]. Due to the common perovskite crystal
structure and cationic oxidation state of BaTiO3 and SrTiO3
(001)we anticipate that our results are similar for both oxides
at the ð ffiffiffi
5p � ffiffiffi
5p ÞR26:6� surface. The work of Kubo et al.
presents DFT calculations with LDOS [32–34] but does notexplore the thermodynamic stability of a Sr adatom surfacerelative to other surfaces. Our calculations, on the other
hand, explore systematically several ð ffiffiffi
5p � ffiffiffi
5p ÞR26:6� sur-
face phases. In view of similarities between BaTiO3 andSrTiO3, we suggest further study of the composition and
structure of the SrTiO3 (001) ð ffiffiffi
5p � ffiffiffi
5p ÞR26:6� surface
reconstruction.The authors would like to acknowledge the following
funding agencies: J.M. P.M. was supported by the AirForce Office of Scientific Research, Air Force MaterielCommand, USAF, under Grant No. FA9550-10-1-0248.A.M.R. was supported by the DOE Office of BasicEnergy Sciences, under Grant No. DE-FG02-07ER15920.W.A. S. was supported by the Office of Naval Research,under Grant No. N00014-12-1-1033. Computationalsupport was provided by the High PerformanceComputing Modernization Program (HPCMO) of the USDOD and the NERSC of the DOE. E.H.M. and D.A.B.would like to acknowledge the support from the NationalScience Foundation Grants No. DMR0805174 and 1206563.
FIG. 4 (color online). A perspective view of the surface struc-ture of ð ffiffiffi
5p � ffiffiffi
5p ÞR26:6� TiO2-Ti3=5 (a) and TiO2-Ti4=5
(b) showcasing the oxygen cage geometry of the Ti adatoms,see Figs. 1(g) and 1(h) for legend. (c) Crystal field splittingprofile for square-planar (left) and distorted square-planar (right)geometries.
PRL 109, 256802 (2012) P HY S I CA L R EV I EW LE T T E R Sweek ending
21 DECEMBER 2012
256802-4

[1] D. G. Schlom, L. Q. Chen, C. B. Eom, K.M. Rabe, S. K.Streiffer, and J.M. Triscone, Annu. Rev. Mater. Res. 37,589 (2007).
[2] A.M. Kolpak, I. Grinberg, and A.M. Rappe, Phys. Rev.Lett. 98, 166101 (2007).
[3] D. Li, M.H. Zhao, J. Garra, A. Kolpak, A. Rappe, D. A.Bonnell, and J.M. Vohs, Nat. Mater. 7, 473 (2008).
[4] D. D. Fong, A.M. Kolpak, J. A. Eastman, S. K. Streiffer,P. H. Fuoss, G. B. Stephenson, C. Thompson, D.M. Kim,K. J. Choi, C. B. Eom, I. Grinberg, and A.M. Rappe, Phys.Rev. Lett. 96, 127601 (2006).
[5] M. J. Highland, T. T. Fister, D. D. Fong, P. H. Fuoss,C. Thompson, J. A. Eastman, S. K. Streiffer, and G. B.Stephenson, Phys. Rev. Lett. 107, 187602 (2011).
[6] R. Ramesh and N. Spaldin, Nat. Mater. 6, 21 (2007).[7] H. Bando, T. Shimitzu, Y. Aiura, Y. Haruyama, K. Oka,
and Y. Nishihara, J. Vac. Sci. Technol. B 14, 1060 (1996).[8] A.M. Kolpak, D. Li, R. Shao, A.M. Rappe, and D.A.
Bonnell, Phys. Rev. Lett. 101, 036102 (2008).[9] A.M. Kolpak, Ph.D. thesis, University of Pennsylvania,
Philadelphia, Pennsylvania, (2007).[10] N. Iles, F. Finocchi, and K. Driss Khodja, J. Phys.
Condens. Matter 22, 305001 (2010).[11] D. Aberdam, G. Bouchet, and P. Ducros, Surf. Sci. 27, 559
(1971).[12] A. Berlich, H. Strauss, C. Langheinrich, A. Chass, and
H. Morgner, Surf. Sci. 605, 158 (2011).[13] See Supplemental Material at http://link.aps.org/
supplemental/10.1103/PhysRevLett.109.256802 for furtherdetails about the experiment and calculations, experimen-tal I-V curve, ball-and-stick models, simulated STM, andz-scaled PDOS.
[14] P. Giannozzi et al. J. Phys. Condens. Matter 21, 395502(2009).
[15] A.M. Rappe, K.M. Rabe, E. Kaxiras, and J. D.Joannopoulos, Phys. Rev. B 41, 1227 (1990).
[16] N. J. Ramer and A.M. Rappe, Phys. Rev. B 59, 12471(1999).
[17] I. Grinberg, N. J. Ramer, and A.M. Rappe, Phys. Rev. B63, 201102(R) (2001).
[18] http://opium.sourceforge.net.[19] M. Cococcioni and S. de Gironcoli, Phys. Rev. B 71,
035105 (2005).[20] U. Cord and R. Courths, Surf. Sci. 152-153, 1141 (1985).[21] M. Cardona, Phys. Rev. 140, A651 (1965).[22] M. DiDomenico and S. H. Wemple, Phys. Rev. 166, 565
(1968).[23] E. H. Morales and D.A. Bonnell (unpublished).[24] R. Courths, Phys. Status Solidi B 100, 135 (1980).[25] T. Shimizu, H. Bando, Y. Aiura, Y. Haruyama, K. Oka, and
Y. Nishihara, Jpn. J. Appl. Phys. 34, L1305 (1995).[26] Z. Klusek, S. Pierzgalski, and S. Datta, Appl. Surf. Sci.
221, 120 (2004).[27] M. Batzill, K. Katsiev, D. Gaspar, and U. Diebold, Phys.
Rev. B 66, 235401 (2002).[28] H. Tanaka, T. Matsumoto, T. Kawai, and S. Kawai, Jpn.
J. Appl. Phys. 32, 1405 (1993).[29] Secondary phases considered are BaO2 (tetragonal), BaO
(rock-salt), Ba(liquid), TiO2 (rutile), Ti2O3 (corundum),and Ti(hexagonal close-packed).
[30] The 2D STM images are generated from 3D data bysumming over-all contribution along the z coordinatemultiplied by expðz� z0Þ, where z0 is the z coordinateof the top most atom on the surface, at given x and ycoordinates. Further, the images were Gaussian-blurredto capture the spatial resolution of the experimentalSTM.
[31] The contribution of atom i to the PDOS is multiplied by anexponential decay function, expðzi � z0Þ, where zi and z0
are the the z coordinate of atom i and of the top most atomon the surface, respectively.
[32] T. Kubo and H. Nozoye, Phys. Rev. Lett. 86, 1801(2001).
[33] T. Kubo and H. Nozoye, Surf. Sci. 542, 177 (2003).[34] T. Kubo, H. Orita, and H. Nozoye, Phys. Chem. Chem.
Phys. 13, 16516 (2011).
PRL 109, 256802 (2012) P HY S I CA L R EV I EW LE T T E R Sweek ending
21 DECEMBER 2012
256802-5