Embed Size (px)
Citation preview

ORIGINAL PAPER
Atomic Friction Modulation on the Reconstructed Au(111)Surface
Qunyang Li • Yalin Dong • Ashlie Martini •
Robert W. Carpick
Received: 17 March 2011 / Accepted: 2 July 2011
� Springer Science+Business Media, LLC 2011
Abstract Friction between a nanoscale tip and a recon-
structed Au(111) surface is investigated both by atomic
force microscopy (AFM) and molecular statics calcula-
tions. Lateral force AFM images exhibit atomic lattice
stick–slip behavior with a superstructure corresponding to
the herringbone reconstruction pattern. However, the
superstructure contrast is not primarily due to variations in
the local frictional dissipation (which corresponds to the
local width of the friction loop). Rather, the contrast occurs
primarily because the local centerline position of the fric-
tion loop is periodically shifted from its usual value of
zero. Qualitatively, similar behavior is reproduced in
atomistic simulations of an AFM tip sliding on the recon-
structed Au(111) substrate. In both simulations and
experiments, this centerline modulation effect is not
observed on unreconstructed surfaces. Similarly, using a
topographically flat surface as a hypothetical control sys-
tem, the simulations show that the centerline modulation is
not caused by variations in the reconstructed surface’s
topography. Rather, we attribute it to the long-range vari-
ation of the local average value of the tip-sample interac-
tion potential that arises from the surface reconstruction. In
other words, surface atoms located at unfavorable sites, i.e.,
in the transition between face-centered-cubic (FCC) and
hexagonal-close-packed (HCP) regions, have a higher
surface free energy. This leads to a varying conservative
force which locally shifts the centerline position of the
friction force. This demonstrates that stick–slip behavior in
AFM can serve as a rather sensitive probe of the local
energetics of surface atoms, with an attainable lateral
spatial resolution of a few nanometers.
Keywords Nanotribology � Stick–slip � AFM � Friction
mechanisms � Gold
1 Introduction
Despite the crucial role of friction in controlling the energy
dissipation and wear [1] in small-scale engineering systems
such as micro- and nano-scale mechanical systems,
understanding and controlling friction at the nanometer
scale remains a substantial challenge. One of the funda-
mental processes in nano-scale sliding is atomic stick–slip
sliding. Theoretically predicted independently by Prandtl
[2] and Tomlinson [3] (in a framework referred to as the
‘‘PT model’’), atomic stick–slip friction was first observed
by Mate et al. [4] using atomic force microscopy (AFM). It
is caused by the local mechanical instabilities that occur
when the downward gradient of the lateral tip-sample
interaction force in the sliding direction approaches or
exceeds the lateral stiffness of the system. The instability
can be suppressed to enable smooth sliding with negligible
dissipation via incommensurability [5], or by reducing [6],
or oscillating [7] the load to avoid steep gradients in the
lateral tip-sample interaction force. Transitions to multiple
lattice-site slip [8, 9] and non-linear dynamical behavior
[10] can also be observed. The stick–slip phenomenon
enables imaging of the surface lattice of a broad range of
materials [11], from graphene [12, 13] to self-assembled
monolayers [14].
Q. Li (&) � R. W. Carpick
Department of Mechanical Engineering and Applied Mechanics,
University of Pennsylvania, Philadelphia, PA 19104, USA
e-mail: [email protected]
Y. Dong � A. Martini
School of Mechanical Engineering, Purdue University,
West Lafayette, IN 47907, USA
123
Tribol Lett
DOI 10.1007/s11249-011-9824-4
Most previous atomic stick–slip studies [15–17] have
been focused on well-ordered, defect-free surfaces, where
the interaction is a periodic function in space described by
the two surface lattice vectors corresponding to the surface
unit cell [18]. Therefore the ‘‘saw-tooth’’-patterned varia-
tion of the lateral force along a given direction depends on
a single length scale—the surface lattice periodicity in that
direction. Recently, it was reported that atomic friction on
certain surfaces with superstructures could exhibit inter-
esting modulation effects: the local center position of the
trace-retrace friction loops measured on graphene grown
on SiC 81 substrate [19, 20], (referred to as the centerline
modulation or sometimes as the friction loop offset) or the
local amplitude (or half-width) of the trace-retrace friction
loops measured on a KBr film deposited on a NaCl(001)
substrate [20, 21], (referred to as the amplitude modulation
or the friction loop width) could vary in concert with the
underlying superstructures, as shown schematically in
Fig. 1. It is noted that ‘‘local’’ here means a running
average over a few stick–slip periods.
A centerline modulation can result from geometry, i.e.,
from a local slope of the surface [22], or can be the result of
friction asymmetry, where the magnitude of the local
friction force is different for forward (trace) and backward
(retrace) scan directions [23–25]. The latter has been
associated with the molecular tilt angle of monolayer films,
which leads to an asymmetric mechanical response for
shear forces [24]. In either case, the centerline modulation
is a conservative effect: it does not affect the width of the
friction loop, and thus there is no change in the energy
dissipated during frictional sliding (which corresponds to
the area enclosed by the friction loop). Alternatively,
amplitude modulation involves a change in the amount of
energy dissipated by friction.
Bennewitz and co-workers showed that the PT model
can be modified to produce both of these friction modu-
lation effects by considering phenomenological perturba-
tions to the tip-sample interaction potential V as follows
[19, 20, 26]:
V ¼ Vlat 1þ a ~V sup1
� �þ bE0
~Vsup2 : ð1Þ
Here, E0 is the amplitude of the original periodic tip-
sample interaction potential Vlat (which could have a
dependence on position x such as Vlat xð Þ ¼ E0 sin 2pxa
� �
where a is the lattice spacing), ~V sup1 and ~V sup
2 are the non-
dimensional modulation functions with long-range periods
(much larger than the atomic spacing), and parameters a
and b are the relative strength of the modulations. If ~Vsup1
dominates b=a� 1ð Þ, then the amplitude of the friction
loops will be locally modulated (Fig. 1a). As an example,
using a one-dimensional model consisting of an elastic
chain being dragged over a rigid substrate, Negri et al.
recently showed that friction amplitude modulation could
be caused by local mechanical softness and hysteresis at
surface defects [27]. This also described friction force
variations seen on ultrathin KBr films that had super-
structures being deposited on the lattice-mismatched sub-
strates [20]. If instead ~V sup2 dominates a=b� 1ð Þ, then the
center position of the friction loops will be locally modu-
lated (Fig. 1b). This was seen to apply well to the super-
structures in graphene mono- and bi-layers on SiC [20].
Despite the apparent consistency with experiments, the
Late
ral f
orce
Lateral displacement
trace retrace scan direction
scan direction
Late
ral f
orce
Lateral displacement
trace retrace scan direction
scan direction
(a)
(b)
centerline modulation
amplitude modulation
Inte
ract
ion
pote
ntia
l
Lateral displacement
Inte
ract
ion
pote
ntia
l
Lateral displacement
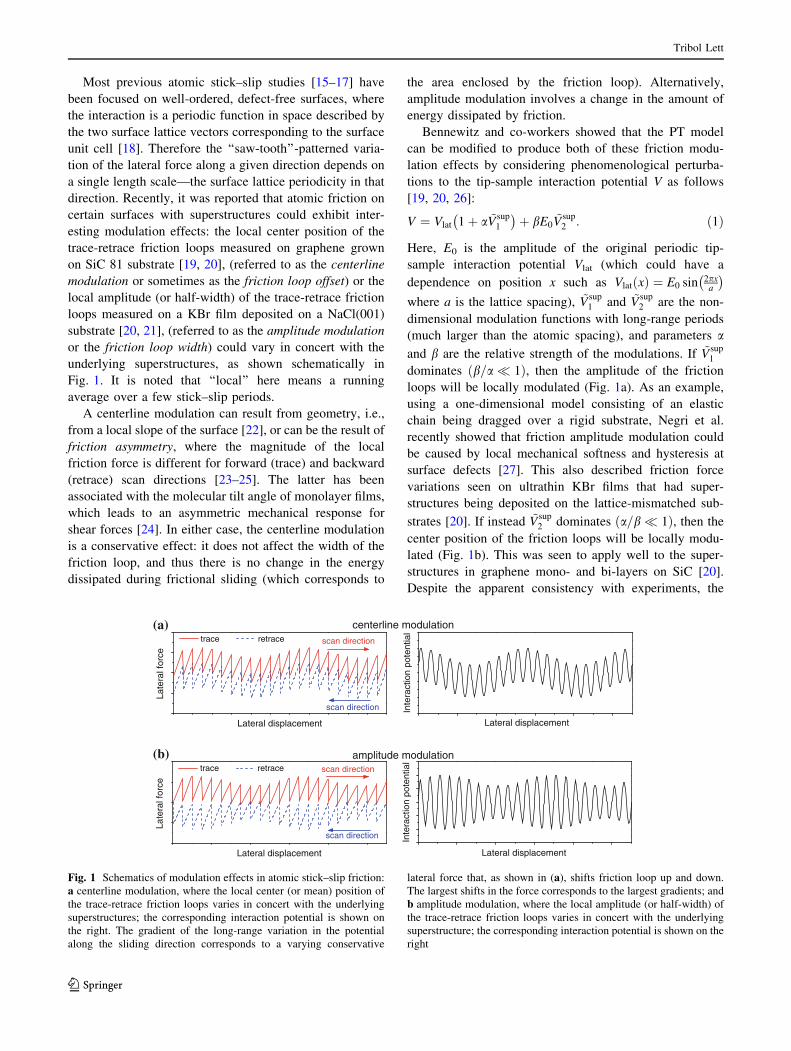
Fig. 1 Schematics of modulation effects in atomic stick–slip friction:
a centerline modulation, where the local center (or mean) position of
the trace-retrace friction loops varies in concert with the underlying
superstructures; the corresponding interaction potential is shown on
the right. The gradient of the long-range variation in the potential
along the sliding direction corresponds to a varying conservative
lateral force that, as shown in (a), shifts friction loop up and down.
The largest shifts in the force corresponds to the largest gradients; and
b amplitude modulation, where the local amplitude (or half-width) of
the trace-retrace friction loops varies in concert with the underlying
superstructure; the corresponding interaction potential is shown on the
right
Tribol Lett
123
physical origins of these two types of modulations require
further investigation.
Molecular simulation has evolved to be a very powerful
tool for studying atomic stick–slip friction [28]. It has the
advantage that it takes into account the position of every
atom (and velocity, for dynamic simulations), which is
impossible for reduced-order models like the PT model.
Similarly, molecular simulations can capture the physical
processes at the buried interface and within the surrounding
material, which are rarely accessible to experiments. In
addition, many more parameters can be altered and studied
in molecular simulations, such as materials, orientations,
geometries, surface reconstruction, and so on, to control
conditions at the atomic level to validate ideas and isolate
proposed mechanisms. Recently, we demonstrated that the
energetics of the stick–slip behavior observed by AFM
experiments can be well described by molecular dynamics
simulations, provided that the simulated sliding speed is
low enough [29], and that molecular statics provides a
consistent description of the friction process in the low-
temperature limit.
In this study, atomic stick–slip friction on a recon-
structed Au(111) surface with a well-known superstructure
is studied by AFM and molecular statics simulations. In
experiments, we observe a clear centerline modulation in
the lateral force whose structure is consistent with the
Au(111) herringbone reconstruction. A qualitatively simi-
lar modulation effect is reproduced by molecular statics
simulations on a rigid reconstructed Au(111) surface. The
simulations confirm that the centerline modulation is
caused by the surface reconstruction, because the modu-
lation is absent on an unreconstructed surface, even when
the scan direction is not along the close-packed direction of
the Au(111) surface. More importantly, the simulations
indicate that the modulation effect is not primarily due to
any topography (slope) as previously suggested [20];
instead, it is due to long-range lateral variations of the
interfacial potential which arise from the periodic transi-
tions of Au surface atoms between face-centered-cubic
(FCC) and hexagonal-close-packed (HCP) domains.
2 Experimental Results
Friction measurements were conducted using a RHK-
UHV350 AFM operated in contact mode. A silicon canti-
lever with its tip coated by silicon nitride (CSC38 from
MikroMasch) was used as the force sensor. The probe has a
nominal spring constant k ¼ 0:03 N=m and a nominal tip
radius R � 20 nm. During the experiments, the normal
force was kept at a constant positive value (approximately
0.4 nN, with a pull-off force of approximately 1.3 nN,
based on similar probes calibrated with the same system)
via a feedback system. The lateral force was continuously
recorded during scanning. The reconstructed Au(111) sur-
faces were prepared by thermally evaporating 150 nm
thick Au films onto freshly-cleaved mica disks (Ted Pella,
Inc.) under high vacuum conditions (1 9 10-7 Torr).
Films were then annealed with a hydrogen flame in air and
immediately introduced into the AFM chamber. To desorb
surface contaminants, films were briefly re-heated to
*400�C under vacuum (1 9 10-6 Torr) right before the
measurements. After heating, the chamber was back-filled,
and continuously purged with the clean, dry nitrogen vapor
from a liquid nitrogen dewar. All measurements were
performed at room temperature.
Depending on the annealing time and temperature, we
find that the Au(111) surfaces exhibit different degrees of
reconstruction. Higher annealing temperatures and longer
annealing periods tend to produce surfaces with a higher
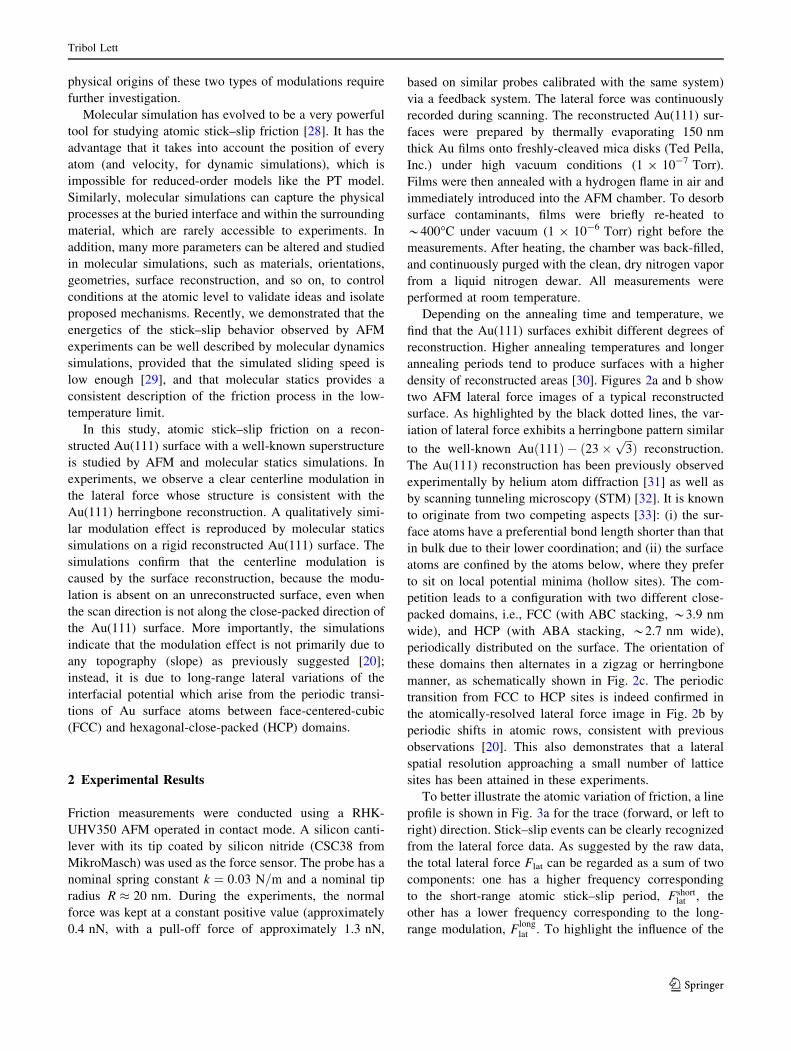
density of reconstructed areas [30]. Figures 2a and b show
two AFM lateral force images of a typical reconstructed
surface. As highlighted by the black dotted lines, the var-
iation of lateral force exhibits a herringbone pattern similar
to the well-known Auð111Þ � ð23�ffiffiffi3pÞ reconstruction.
The Au(111) reconstruction has been previously observed
experimentally by helium atom diffraction [31] as well as
by scanning tunneling microscopy (STM) [32]. It is known
to originate from two competing aspects [33]: (i) the sur-
face atoms have a preferential bond length shorter than that
in bulk due to their lower coordination; and (ii) the surface
atoms are confined by the atoms below, where they prefer
to sit on local potential minima (hollow sites). The com-
petition leads to a configuration with two different close-
packed domains, i.e., FCC (with ABC stacking, *3.9 nm
wide), and HCP (with ABA stacking, *2.7 nm wide),
periodically distributed on the surface. The orientation of
these domains then alternates in a zigzag or herringbone
manner, as schematically shown in Fig. 2c. The periodic
transition from FCC to HCP sites is indeed confirmed in
the atomically-resolved lateral force image in Fig. 2b by
periodic shifts in atomic rows, consistent with previous
observations [20]. This also demonstrates that a lateral
spatial resolution approaching a small number of lattice
sites has been attained in these experiments.
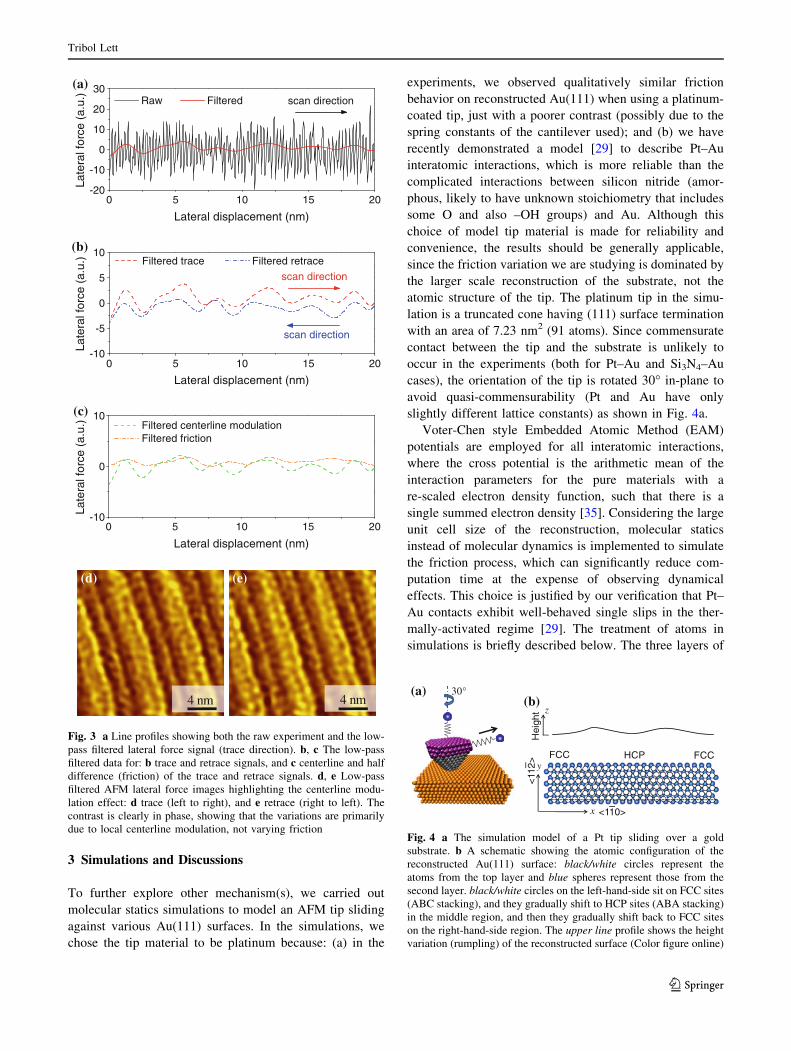
To better illustrate the atomic variation of friction, a line
profile is shown in Fig. 3a for the trace (forward, or left to
right) direction. Stick–slip events can be clearly recognized
from the lateral force data. As suggested by the raw data,
the total lateral force Flat can be regarded as a sum of two
components: one has a higher frequency corresponding
to the short-range atomic stick–slip period, Fshortlat , the
other has a lower frequency corresponding to the long-
range modulation, Flonglat . To highlight the influence of the
Tribol Lett
123
long-range superstructure due to the reconstruction, (i.e.,
Flonglat ), we applied a low-pass Fourier filter with a 2 nm cut-
off period to the raw lateral force data so that the local
high-frequency atomic stick–slip variation, (i.e., Fshortlat ) is
suppressed. The filtered data essentially represents the local
mean value of the raw stick–slip curves averaged over a
few stick–slip periods. The filtered lateral force data, the
red solid curve in Fig. 3a, varies as the tip slides over the
reconstructed surface. The same variation occurs for
scanning in the retrace (right to left) direction as well, in
phase with the variation in the forward direction (blue
dashed curve in Fig. 3b). This means that the centerline of
the friction loops (the local average of the trace and retrace
lateral forces) is varying substantially (Fig. 3c, green solid
curve), while the variation in friction (half the difference
between the trace and retrace lateral forces or half-width of
the friction loops, Fig. 3c, orange dashed curve) is much
less significant. This centerline modulation effect is more
obvious in the low-pass filtered 2D lateral force images,
shown in Figs. 3d and e for the trace and retrace directions,
respectively, where the variations are nearly in phase for
both trace and retrace scan directions. The variation of the
filtered lateral force exhibits essentially the same pattern as
the reconstruction, demonstrating that there is a direct
relation between the two.
It is noted that both amplitude modulation [19, 20] and
centerline modulation [20, 21] will lead to variations of the
local averaged lateral force. However, for amplitude
modulation, the variations for trace and retrace curves will
have opposite phases (i.e., maxima in the long-range var-
iation of the trace curve are minima for the retrace curves);
while for centerline modulation, the variations will have
the same phase (i.e., peak local averaged lateral forces
occur at the same location for the trace and the retrace). As
seen in the friction loop in Fig. 3b, and in the full lateral
force images shown in Figs. 3d and e, the contrast for the
trace and the retrace lateral force measurements is in phase,
clearly demonstrating that the observed modulation is pri-
marily a centerline modulation, not an amplitude modula-
tion. Because the lateral force of the trace and retrace
curves vary nearly in concert with one another, the local
frictional dissipation (the area enclosed between trace and
retrace curves) is relatively constant.
Recently, a long-range variation in the lateral force
image was reported for the reconstructed Au(111) surface
by Steiner et al. [20]. The data that was shown for the
forward scan direction only, exhibited a ‘‘tilted’’ appear-
ance over several atomic periods. In other words, there was
an overall slope to the filtered lateral force data. This tilt,
which could be an example of centerline modulation, was
proposed to be caused by variations in the local slope of the
surface due to topographic height changes of the recon-
structed surface. In the present experiments, the peak-to-
peak amplitude of the long-range centerline modulation is
approximately 0.5 nN, which is 1/4 to 1/5 of the local
stick–slip amplitude. The height variation on the recon-
structed Au(111) surface is only 0.015 nm [31], and the
external normal load is rather small (*0.4 nN). The
expected lateral force fluctuation due to topographic slope
[22] will then be only a few picoNewtons. This is over 10
times smaller than our experimental observations (we
assume a typical lateral force constant—roughly 14 pN/
signal unit—calibrated for similar AFM cantilevers on the
same AFM system).
Thus, something other than local topographic slopes
must contribute to this long-range centerline modulation.
Variation of the lateral force due to surface reconstruc-
tion was also observed by Nie et al. [34] for an AFM tip
sliding over reconstructed gold surface in air. Although the
authors did not specify the type of modulation, they pro-
posed that the variation was caused by variation of the
potential corrugation, rather than the reconstructed sur-
face’s topography. This mechanism is explored further in
the next section.
10 nm
(a)
4 nm
(b) (c)
Fig. 2 AFM lateral force images of a reconstructed Au(111) surface
at a a 50 nm scan size, b a 20 nm scan size, c A schematic of the
Au(111) herringbone reconstruction showing two domains with
different atomic stacking (FCC and HCP). Scan directions are from
left to right in (a) and (b). The dotted lines are drawn to highlight the
pattern of the friction variation. The atomic lattice is resolved in (b)
Tribol Lett
123
3 Simulations and Discussions
To further explore other mechanism(s), we carried out
molecular statics simulations to model an AFM tip sliding
against various Au(111) surfaces. In the simulations, we
chose the tip material to be platinum because: (a) in the
experiments, we observed qualitatively similar friction
behavior on reconstructed Au(111) when using a platinum-
coated tip, just with a poorer contrast (possibly due to the
spring constants of the cantilever used); and (b) we have
recently demonstrated a model [29] to describe Pt–Au
interatomic interactions, which is more reliable than the
complicated interactions between silicon nitride (amor-
phous, likely to have unknown stoichiometry that includes
some O and also –OH groups) and Au. Although this
choice of model tip material is made for reliability and
convenience, the results should be generally applicable,
since the friction variation we are studying is dominated by
the larger scale reconstruction of the substrate, not the
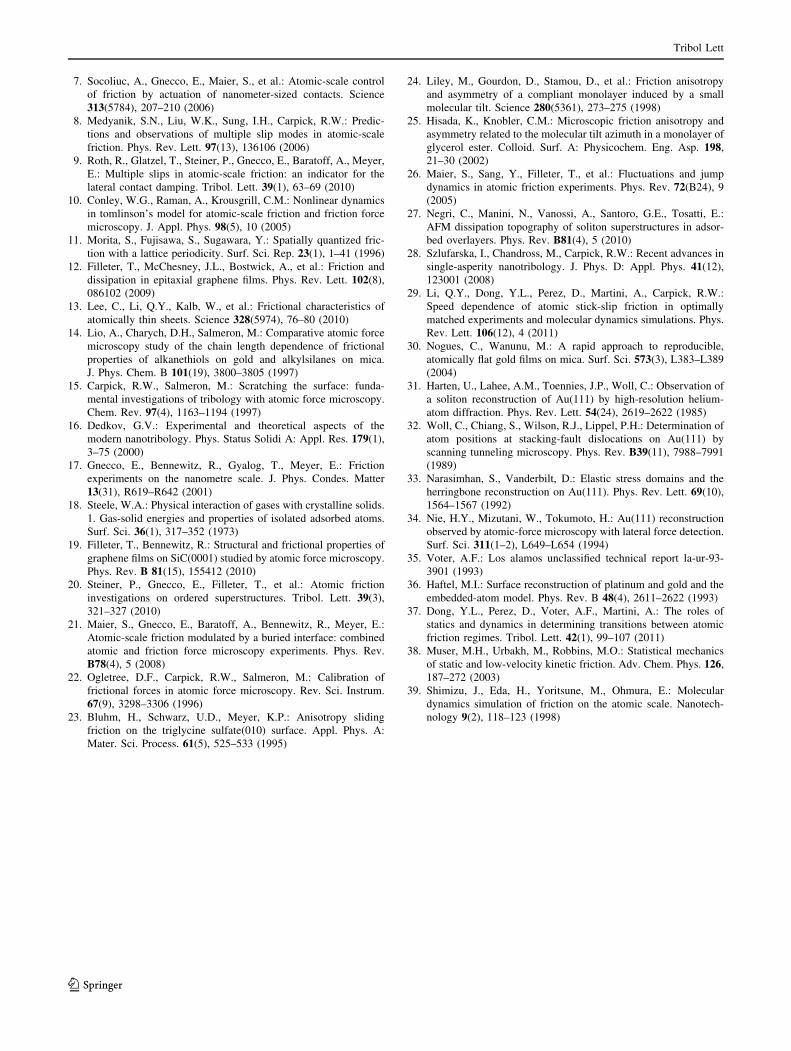
atomic structure of the tip. The platinum tip in the simu-
lation is a truncated cone having (111) surface termination
with an area of 7.23 nm2 (91 atoms). Since commensurate
contact between the tip and the substrate is unlikely to
occur in the experiments (both for Pt–Au and Si3N4–Au
cases), the orientation of the tip is rotated 30� in-plane to
avoid quasi-commensurability (Pt and Au have only
slightly different lattice constants) as shown in Fig. 4a.
Voter-Chen style Embedded Atomic Method (EAM)
potentials are employed for all interatomic interactions,
where the cross potential is the arithmetic mean of the
interaction parameters for the pure materials with a
re-scaled electron density function, such that there is a
single summed electron density [35]. Considering the large
unit cell size of the reconstruction, molecular statics
instead of molecular dynamics is implemented to simulate
the friction process, which can significantly reduce com-
putation time at the expense of observing dynamical
effects. This choice is justified by our verification that Pt–
Au contacts exhibit well-behaved single slips in the ther-
mally-activated regime [29]. The treatment of atoms in
simulations is briefly described below. The three layers of
4 nm
(e)
4 nm
(d)
(a)
(b)
0 5 10 15 20-20
-10
0
10
20
30 Raw Filtered
Late
ral f
orce
(a.
u.)
Lateral displacement (nm)
scan direction
0 5 10 15 20-10
-5
0
5
10 Filtered trace Filtered retrace
Late
ral f
orce
(a.
u.)
Lateral displacement (nm)
scan direction
scan direction
0 5 10 15 20-10
0
10 Filtered centerline modulation Filtered friction
Late
ral f
orce
(a.
u.)
Lateral displacement (nm)
(c)
Fig. 3 a Line profiles showing both the raw experiment and the low-
pass filtered lateral force signal (trace direction). b, c The low-pass
filtered data for: b trace and retrace signals, and c centerline and half
difference (friction) of the trace and retrace signals. d, e Low-pass
filtered AFM lateral force images highlighting the centerline modu-
lation effect: d trace (left to right), and e retrace (right to left). The
contrast is clearly in phase, showing that the variations are primarily
due to local centerline modulation, not varying friction
<110>
<11
2>
x
yFCC HCP FCC
Hei
ght
(a)(b)
z
30°
Fig. 4 a The simulation model of a Pt tip sliding over a gold
substrate. b A schematic showing the atomic configuration of the
reconstructed Au(111) surface: black/white circles represent the
atoms from the top layer and blue spheres represent those from the
second layer. black/white circles on the left-hand-side sit on FCC sites
(ABC stacking), and they gradually shift to HCP sites (ABA stacking)
in the middle region, and then they gradually shift back to FCC sites
on the right-hand-side region. The upper line profile shows the height
variation (rumpling) of the reconstructed surface (Color figure online)
Tribol Lett
123

the tip furthest from the interface are treated as rigid
bodies. The model system also includes virtual atoms that
do not experience inter-atomic interactions, but are coupled
one by one to individual Pt atoms in the top three layers of
the tip through harmonic loading springs as shown in
Fig. 4a. The virtual atoms and springs, therefore, mimic the
motion and stiffness of the AFM cantilever. The atoms are
given freedom of movement in the direction perpendicular
to the interface such that a given applied normal load (0 nN
is used in the simulations) can be maintained. For each data
point from the simulation, the virtual atoms are translated
laterally at 15� with respect to the ½1�10� direction with a
distance of 0.01 nm, and the energetically relaxed config-
uration of unconstrained atoms is found using the L-BFGS
minimization algorithm [24].
Conventional EAM potentials are unable to generate the
Au(111) surface reconstruction. It has been suggested that
this arises because these potentials, which are usually fitted
to bulk material properties, underestimate the potential
curvature for atoms close to the surface [36]. In our sim-
ulation, the reconstructed structure is imposed by manually
positioning the gold atoms of the substrate according to the
known reconstruction configuration and fixing their posi-
tions. Atoms in a perfect Au crystal have an FCC structure
with an ABC stacking sequence of planes. In the presence
of the reconstruction, some atoms on the surface relocate to
new positions corresponding to a HCP structure, i.e., to a
position corresponding to ABA stacking. Figure 4b shows
a single period of the Auð111Þ � ð23�ffiffiffi3pÞ reconstruction
with its alternating FCC and HCP domains. The periodic
transition (from FCC to HCP and then back to FCC) results
in an extra atom in the uppermost layer in each period. The
atoms in the upper layer shift from their perfectly ordered
FCC positions both in x (along the\1�10[direction) by an
amount ushift, and y (along the \11�2[ direction) by an
amount vshift. The shifts can be described by the soliton
expression suggested by Harten et al. [31]
ushiftðXÞ ¼ 2
parctan exp
X
DS
� �� �� uFH; ð2Þ
vshiftðXÞ ¼ 2
parctan exp
X
DS
� �� �� vFH; ð3Þ
where 2DS = 1.18 nm which is the half-width of the
transition region bound by both the FCC and HCP
domains, and uFH = 0.144 nm and vFH = 0.083 nm are
the displacement shifts in the x and y directions when an
atom moves from a perfect FCC site to a perfect HCP site.
In addition to the lateral shifts, the reconstructed surface
also rumples in the z direction (perpendicular to the
Au(111) surface). The rumpling can be described by a
Gaussian,
ZðXÞ ¼ H exp � 1
2
X
DS
� �2" #
; ð4Þ
with height H = 0.015 nm.
Figure 5a shows the lateral force versus lateral dis-
placement obtained from simulations of scans on the
reconstructed surface with relatively compliant loading
springs (total lateral spring constant kspr = 22 N/m). This
leads to a total lateral stiffness (the slope of the lateral force
with respect to the lateral displacement) of 12.0 ± 0.6 N/m
(the reduction in stiffness is due to compliance of the tip,
the contact, and the interface). The experimental value is
17.0 ± 0.9 N/m. As with the experimental data in Fig. 3,
we applied a low-pass filter to the raw simulation data to
highlight the influence of the relatively long-range super-
structure from the reconstruction (red solid line in Fig. 5a).
For a clearer comparison, the filtered curves (red solid
curve and blue dashed curve for trace and retrace,
respectively) are plotted in Fig. 5b together with the height
profile (black dash-dot curve). The side-by-side compari-
son demonstrates that the filtered trace and retrace scans
have a significant degree of coherence.
The centerline modulation effect is shown more clearly
in Fig. 5c by the filtered centerline modulation curve
(green solid curve), which is consistent with the experi-
mental observations. In Fig. 5b, there are some regions
where the variations of the filtered trace and retrace curves
are slightly out of phase, which leads to some variation in
the filtered friction curve in Fig. 5c. The system potential
energy relative to its mean value as a function of the lateral
displacement is shown as blue circles in Fig. 5d. In addi-
tion to the local atomic fluctuations, the potential clearly
exhibits a long-range variation due to the surface recon-
struction. This variation in potential energy is expected to
lead to the centerline modulation of the lateral force, as
shown in Fig. 1b. Indeed, as seen in Fig. 5e, where the
gradient of the total potential energy along the sliding
direction, with a low-pass filter is applied, is plotted with
the centerline modulation from the simulation. The two are
very well correlated.
While the simulation agrees with the experiment in
showing that a centerline modulation effect occurs, the
friction modulation seen in the simulation is larger than in
the experiments. This may be attributed to the differences
in energetics (which will occur, because the tip material is
different than in the experiment), contact area, scanning
speed, and inertia [29]. It may also be due to the different
relative system compliances in the experiments and the
simulations. Previous studies [6, 8, and 37–39] showed that
frictional dissipation can strongly depend on the compli-
ance of the loading system: stiffer systems give lower
frictional dissipation. To investigate this, we performed
Tribol Lett
123

another set of simulations with much stiffer loading springs
(total lateral spring constant kspr = 5000 N/m; total lateral
stiffness 19 N/m). The results are shown in Fig. 6. As
expected, for simulations with a stiffer loading system,
atomic stick–slip is substantially reduced (see Fig. 6a), and
the lateral force signals for trace and retrace scans almost
overlap with each other (see Fig. 6b). Therefore, the fric-
tional dissipation and its variation are extremely small as
depicted by the filtered lateral force curve (orange dash-dot
curve) in Fig. 6c. In contrast to the diminishing friction,
the variation of the centerline position is not sensitive to
the system compliance, and it remains nearly as large as the
calculations with the compliant loading system (see
Figs. 6b, c). Both the experiment and the simulations yield
a similar periodicity for the centerline modulation (about
6.8 nm, estimated from the peaks of autocorrelation func-
tion of the filtered lateral force signals).
The similarity in periodicity between the centerline
modulation and the reconstruction superstructure
(a)
(b)
(c)
0 5 10 15 20-2
-1
0
1
2
3
Late
ral f
orce
(nN
)
Lateral displacement (nm)
Raw Filtered scan direction
-1.0
-0.5
0.0
0.5
1.0
1.5 Filtered trace Filtered retrace Height-profile
Lateral displacement (nm)
Late
ral f
orce
(nN
)
-1.0
-0.5
0.0
0.5
1.0
1.5
Hei
ght p
rofil
e (A
)
scan direction
scan direction
-1.0
-0.5
0.0
0.5
1.0
1.5 Filtered centerline modulation Filtered friction Height-profile
Lateral displacement (nm)
Late
ral f
orce
(nN
)
-1.0
-0.5
0.0
0.5
1.0
1.5
Hei
ght p
rofil
e (A
)
(d)
-1.0
-0.5
0.0
0.5
1.0
Late
ral f
orce
(nN
)
Lateral displacement (nm)
Filtered centerline modulation Derivative of filtered potential
(e)
0 5 10 15 20
0 5 10 15 20
0 5 10 15 20
0 5 10 15 20-6
-3
0
3
6 Potential energy relative to mean
Height-profile
Lateral displacement (nm)
Pot
entia
l ene
rgy
(eV
)
-1.0
-0.5
0.0
0.5
1.0
Hei
ght p
rofil
e (A
)
Fig. 5 a Lateral force versus lateral displacement data from
simulations on the reconstructed Au(111) surface with relatively
compliant loading springs: black curve for raw data, red curve for
low-passed filtered data. b The low-pass filtered lateral force signal
for trace (red dashed curve) and retrace (blue dash-dot curve)
directions. c The filtered centerline modulation (green dashed curve)
and friction (orange dash-dot curve) curves are also plotted side-by-
side with the surface height profile (black solid curve). d The
potential energy relative to its mean value (blue circles) is plotted
side-by-side with the surface height profile (black solid curve).
Topographically higher atoms, found on bridge sites in the HCP-
FCC transition regions, are correlated with higher potential energy.
e The gradient of total potential energy (low-pass filtered) along the
lateral displacement direction (blue dash-dot curve), and the
centerline modulation from (c) (green dashed curve) are highly
correlated (Color figure online)
(a)
(b)
(c)
-2
-1
0
1
2
3La
tera
l for
ce (
nN)
Lateral displacement (nm)
Raw Filtered scan direction
-1.0
-0.5
0.0
0.5
1.0
1.5 Filtered trace Filtered retrace Height-profile
Lateral displacement (nm)
Late
ral f
orce
(nN
)
-1.0
-0.5
0.0
0.5
1.0
1.5
Hei
ght p
rofil
e (A
)
scan direction
scan direction
0 4 8 12 16
0 4 8 12 16
0 4 8 12 16-1.0
-0.5
0.0
0.5
1.0
1.5 Filtered centerline modulation Filtered friction Height-profile
Lateral displacement (nm)
Late
ral f
orce
(nN
)
-1.0
-0.5
0.0
0.5
1.0
1.5H
eigh
t pro
file
(A)
Fig. 6 a Lateral force versus lateral displacement curves obtained
from simulations on the reconstructed Au(111) surface with stiff
loading springs: black curve for raw data, red curve for low-passed
filtered data. b The low-pass filtered lateral force signal for trace (reddashed curve) and retrace (blue dash-dot curve). c The filtered
centerline modulation (green dashed curve) and friction (orangedash-dot curve) curves are also plotted side-by-side with the surface
height profile (black solid curve) (Color figure online)
Tribol Lett
123

demonstrates that the modulation is caused by the surface
reconstruction. This is confirmed by the fact that no clear
centerline variation can be resolved when we run a simu-
lation with an unreconstructed Au(111) surface, as shown
in Fig. 7. Here, the small local amplitude variations of
lateral force signals in Fig. 6a occur because the tip scan
direction is at 15� with respect to the close-packed \1�10[direction. In this case, the friction force can have a com-
ponent in the surface plane that is perpendicular to the
lateral direction [11]. Therefore, the lateral force at which
the tip slips (the component of the static friction force in
the lateral direction) will vary due to the misalignment of
the sliding direction with the close-packed direction.
However, this modulation effect due to misalignment does
not affect the centerline position of lateral force signals
appreciably, as indicated by Figs. 7b and c.
We also confirmed in the simulations that the lateral
force centerline modulation is invariant to translation in the
y (\11�2[) direction. This is shown in Fig. 8 by three sets
of filtered trace-retrace lateral force curves where the y
position has been shifted by 0.05 nm, 0.1 nm, and 0.15 nm.
This again is consistent with the experimental observations.
Thus, the centerline modulation effect is seen to be
correlated with the lateral gradient of the tip-sample
potential. However, the variation of this gradient also
matches the variation of the local topographic slope of the
surface. To check for any contribution of topography to the
lateral force modulation, we carried out another simulation
on a ‘‘modified’’ reconstructed surface. The modified sur-
face had a lateral configuration identical to the normal
reconstruction as specified by Equations 2 and 3, but the
height rumpling is deliberately suppressed to be zero. The
lateral force variation on such a modified reconstructed
surface is shown in Fig. 9. Although the surface is now
atomically flat, we can still see a clear centerline modula-
tion in lateral force signals with a similar magnitude as that
exhibited by a rumpled surface. Similarly, the friction
modulation is again highly correlated with the gradient of
total potential energy, as shown in Fig. 9d. Therefore, we
conclude that the centerline modulation on a reconstructed
Au(111) surface is not primarily induced by the topo-
graphic slope variations, but rather it is caused by the long-
range variation in the local average value of the interaction
potential between the tip atoms and the reconstructed
substrate atoms.
From the centerline modulation curve shown in Figs. 5c
and e as well as Figs. 6c and 9c, and the discussions and
control experiments discussed above, we can conclude that,
in addition to the atomic variations, the tip-sample inter-
action potential is locally shifted to higher magnitude at the
transition regions and to lower magnitude at the ordered
(FCC or HCP) regions. The gradient of this long-range
variation of the tip-sample interaction potential results in a
conservative force that shifts the centerline value of lateral
force as shown in Figs. 1a and 5e, and this shift is super-
posed with the lateral force variations due to atomic stick–
slip behavior.
The long-range variation of the interfacial potential is
not caused by topography; rather, it is governed by the
(a)
(b)
(c)
-2
-1
0
1
2
3
Late
ral f
orce
(nN
)
Lateral displacement (nm)
Raw Filtered scan direction
-1.0
-0.5
0.0
0.5
1.0
1.5
Late
ral f
orce
(nN
)
Lateral displacement (nm)
Filtered trace Filtered retrace
scan direction
scan direction
0 5 10 15 20
0 5 10 15 20
0 5 10 15 20-1.0
-0.5
0.0
0.5
1.0
1.5
Late
ral f
orce
(nN
)
Lateral displacement (nm)
Filtered centerline modulation Filtered friction
Fig. 7 a Lateral force versus lateral displacement curves obtained
from simulation on the unreconstructed Au(111) surface with
compliant loading springs: black curve for raw data, red curve for
low-passed filtered data. b The low-pass filtered lateral force signal
for trace (red solid curve) and retrace (blue dashed curve). c The
filtered centerline modulation (green solid curve) and friction (orangedashed curve) curves are also plotted side-by-side with the surface
height profile (black dash-dot curve) (Color figure online)
0 5 10 15 20-1.0
-0.5
0.0
0.5
1.0
1.5
Filt
ered
late
ral f
orce
(nN
)
Lateral displacement (nm)
0.05 nm shift 0.10 nm shift 0.15 nm shift
scan direction
scan direction
Fig. 8 Three sets of lateral force versus lateral displacement curves
obtained from simulation with different shifts in the y (\11�2[)
direction
Tribol Lett
123

interaction between the tip atoms and the reconstructed
substrate atoms in the contact zone. The magnitude of the
variation will depend on the local commensurability and
contact size, and further study is needed to explore these
phenomena in full detail. However, it is clear that the
bridge atoms in the transition regions between FCC- and
HCP-stacked regions are in unfavorable sites, thus leading
to modulations in the local surface free energy. This results
in gradients (with respect to the lateral direction) in the
long-range Fourier components of the tip-sample
interaction potential, i.e., a force. This varying conserva-
tive force causes the variations in the local centerline of the
friction loops observed here, and probably those reported
elsewhere [19–21]. Unlike a friction force, whose direction
changes depending on the sliding direction, the direction of
this force is independent of sliding direction. It is thus an
example of a locally varying friction asymmetry.
4 Conclusion
Atomically-resolved stick–slip friction between a nano-
scale tip and a reconstructed Au(111) surface is studied
both by AFM experiments and molecular statics simula-
tions. The experiments show that the centerline position of
the friction loops is periodically shifted by the surface
reconstruction resulting in a herringbone pattern in the
lateral force images. However, the net frictional dissipation
does not vary appreciably with location. Qualitatively
consistent behavior is reproduced by atomistic simulations
only on the reconstructed Au(111) surfaces but not on
unreconstructed surfaces. The behavior persists even if the
small topographic variation of the surface atoms is sup-
pressed. Thus, the centerline modulation is not caused by
topographic variations of the reconstructed surface. Rather,
it is caused by the long-range lateral perturbation in the
local centerline value of tip-sample interfacial potential
caused by the higher energy of atoms located in the unfa-
vorable transition regions between HCP and FCC sites in
the surface reconstruction. This suggests that stick–slip
behavior in AFM can actually serve as a rather sensitive
probe of the local energetics of surface atoms, with an
attainable lateral spatial resolution of a few nanometers.
Acknowledgments This study was funded by the National Science
Foundation under grants CMMI-0758604 & 0800154.
References
1. Mate, C.M.: Tribology on the Small Scale: A Bottom up
Approach to Friction Lubrication and Wear. Oxford University
Press, New York (2008)
2. Prandtl, L.: Ein gedankenmodell zur kinetischen theorie der fe-
sten korper. Z. Angew. Math. Mech. 8(2), 85–106 (1928)
3. Tomlinson, G.A.: A molecular theory of friction. Philos. Mag.
Series 7 7(46), 905–939 (1929)
4. Mate, C.M., McClelland, G.M., Erlandsson, R., Chiang, S.:
Atomic-scale friction of a tungsten tip on a graphite surface.
Phys. Rev. Lett. 59(17), 1942–1945 (1987)
5. Dienwiebel, M., Verhoeven, G.S., Pradeep, N., Frenken, J.W.M.,
Heimberg, J.A., Zandbergen, H.W.: Superlubricity of graphite.
Phys. Rev. Lett. 92(12), 126101 (2004)
6. Socoliuc, A., Bennewitz, R., Gnecco, E., Meyer, E.: Transition
from stick-slip to continuous sliding in atomic friction: entering a
new regime of ultralow friction. Phys. Rev. Lett. 92(13), 134301
(2004)
-1.0
-0.5
0.0
0.5
1.0
Late
ral f
orce
(nN
)
Lateral displacement (nm)
Filtered centerline modulation Derivative of filtered potential
(a)
(b)
(c)
-2
-1
0
1
2
3
Late
ral f
orce
(nN
)
Lateral displacement (nm)
Raw Filtered scan direction
-1.0
-0.5
0.0
0.5
1.0
1.5 Filtered trace Filtered retrace Original height-profile
Lateral displacement (nm)
Late
ral f
orce
(nN
)
-1.0
-0.5
0.0
0.5
1.0
1.5
Orig
inal
hei
ght p
rofil
e (A
)
scan direction
scan direction
0 5 10 15 20
0 5 10 15 20
0 5 10 15 20
0 5 10 15 20-1.0
-0.5
0.0
0.5
1.0
1.5 Filtered centerline modulation Filtered friction Original height-profile
Lateral displacement (nm)
Late
ral f
orce
(nN
)
-1.0
-0.5
0.0
0.5
1.0
1.5
Orig
inal
hei
ght p
rofil
e (A
)
(d)
Fig. 9 a Lateral force versus lateral displacement curves obtained
from simulation on a modified reconstructed surface that is atomically
flat, i.e., where the height rumpling is deliberately suppressed with
compliant loading springs: black curve for raw data, red curve for low-
passed filtered data. b The low-pass filtered lateral force signal for trace
(red dashed curve) and retrace (blue dash-dot curve). c The filtered
centerline modulation (green dashed curve) and friction (orange dash-dot curve) curves are also plotted side-by-side with the original surface
height profile (black dash-dot curve). d The gradient of total potential
energy (low-pass filtered) along the lateral displacement direction (bluedash-dot curve), and the centerline modulation from (c) (green dashedcurve) are highly correlated (Color figure online)
Tribol Lett
123
7. Socoliuc, A., Gnecco, E., Maier, S., et al.: Atomic-scale control
of friction by actuation of nanometer-sized contacts. Science
313(5784), 207–210 (2006)
8. Medyanik, S.N., Liu, W.K., Sung, I.H., Carpick, R.W.: Predic-
tions and observations of multiple slip modes in atomic-scale
friction. Phys. Rev. Lett. 97(13), 136106 (2006)
9. Roth, R., Glatzel, T., Steiner, P., Gnecco, E., Baratoff, A., Meyer,
E.: Multiple slips in atomic-scale friction: an indicator for the
lateral contact damping. Tribol. Lett. 39(1), 63–69 (2010)
10. Conley, W.G., Raman, A., Krousgrill, C.M.: Nonlinear dynamics
in tomlinson’s model for atomic-scale friction and friction force
microscopy. J. Appl. Phys. 98(5), 10 (2005)
11. Morita, S., Fujisawa, S., Sugawara, Y.: Spatially quantized fric-
tion with a lattice periodicity. Surf. Sci. Rep. 23(1), 1–41 (1996)
12. Filleter, T., McChesney, J.L., Bostwick, A., et al.: Friction and
dissipation in epitaxial graphene films. Phys. Rev. Lett. 102(8),
086102 (2009)
13. Lee, C., Li, Q.Y., Kalb, W., et al.: Frictional characteristics of
atomically thin sheets. Science 328(5974), 76–80 (2010)
14. Lio, A., Charych, D.H., Salmeron, M.: Comparative atomic force
microscopy study of the chain length dependence of frictional
properties of alkanethiols on gold and alkylsilanes on mica.
J. Phys. Chem. B 101(19), 3800–3805 (1997)
15. Carpick, R.W., Salmeron, M.: Scratching the surface: funda-
mental investigations of tribology with atomic force microscopy.
Chem. Rev. 97(4), 1163–1194 (1997)
16. Dedkov, G.V.: Experimental and theoretical aspects of the
modern nanotribology. Phys. Status Solidi A: Appl. Res. 179(1),
3–75 (2000)
17. Gnecco, E., Bennewitz, R., Gyalog, T., Meyer, E.: Friction
experiments on the nanometre scale. J. Phys. Condes. Matter
13(31), R619–R642 (2001)
18. Steele, W.A.: Physical interaction of gases with crystalline solids.
1. Gas-solid energies and properties of isolated adsorbed atoms.
Surf. Sci. 36(1), 317–352 (1973)
19. Filleter, T., Bennewitz, R.: Structural and frictional properties of
graphene films on SiC(0001) studied by atomic force microscopy.
Phys. Rev. B 81(15), 155412 (2010)
20. Steiner, P., Gnecco, E., Filleter, T., et al.: Atomic friction
investigations on ordered superstructures. Tribol. Lett. 39(3),
321–327 (2010)
21. Maier, S., Gnecco, E., Baratoff, A., Bennewitz, R., Meyer, E.:
Atomic-scale friction modulated by a buried interface: combined
atomic and friction force microscopy experiments. Phys. Rev.
B78(4), 5 (2008)
22. Ogletree, D.F., Carpick, R.W., Salmeron, M.: Calibration of
frictional forces in atomic force microscopy. Rev. Sci. Instrum.
67(9), 3298–3306 (1996)
23. Bluhm, H., Schwarz, U.D., Meyer, K.P.: Anisotropy sliding
friction on the triglycine sulfate(010) surface. Appl. Phys. A:
Mater. Sci. Process. 61(5), 525–533 (1995)
24. Liley, M., Gourdon, D., Stamou, D., et al.: Friction anisotropy
and asymmetry of a compliant monolayer induced by a small
molecular tilt. Science 280(5361), 273–275 (1998)
25. Hisada, K., Knobler, C.M.: Microscopic friction anisotropy and
asymmetry related to the molecular tilt azimuth in a monolayer of
glycerol ester. Colloid. Surf. A: Physicochem. Eng. Asp. 198,
21–30 (2002)
26. Maier, S., Sang, Y., Filleter, T., et al.: Fluctuations and jump
dynamics in atomic friction experiments. Phys. Rev. 72(B24), 9
(2005)
27. Negri, C., Manini, N., Vanossi, A., Santoro, G.E., Tosatti, E.:
AFM dissipation topography of soliton superstructures in adsor-
bed overlayers. Phys. Rev. B81(4), 5 (2010)
28. Szlufarska, I., Chandross, M., Carpick, R.W.: Recent advances in
single-asperity nanotribology. J. Phys. D: Appl. Phys. 41(12),
123001 (2008)
29. Li, Q.Y., Dong, Y.L., Perez, D., Martini, A., Carpick, R.W.:
Speed dependence of atomic stick-slip friction in optimally
matched experiments and molecular dynamics simulations. Phys.
Rev. Lett. 106(12), 4 (2011)
30. Nogues, C., Wanunu, M.: A rapid approach to reproducible,
atomically flat gold films on mica. Surf. Sci. 573(3), L383–L389
(2004)
31. Harten, U., Lahee, A.M., Toennies, J.P., Woll, C.: Observation of
a soliton reconstruction of Au(111) by high-resolution helium-
atom diffraction. Phys. Rev. Lett. 54(24), 2619–2622 (1985)
32. Woll, C., Chiang, S., Wilson, R.J., Lippel, P.H.: Determination of
atom positions at stacking-fault dislocations on Au(111) by
scanning tunneling microscopy. Phys. Rev. B39(11), 7988–7991
(1989)
33. Narasimhan, S., Vanderbilt, D.: Elastic stress domains and the
herringbone reconstruction on Au(111). Phys. Rev. Lett. 69(10),
1564–1567 (1992)
34. Nie, H.Y., Mizutani, W., Tokumoto, H.: Au(111) reconstruction
observed by atomic-force microscopy with lateral force detection.
Surf. Sci. 311(1–2), L649–L654 (1994)
35. Voter, A.F.: Los alamos unclassified technical report la-ur-93-
3901 (1993)
36. Haftel, M.I.: Surface reconstruction of platinum and gold and the
embedded-atom model. Phys. Rev. B 48(4), 2611–2622 (1993)
37. Dong, Y.L., Perez, D., Voter, A.F., Martini, A.: The roles of
statics and dynamics in determining transitions between atomic
friction regimes. Tribol. Lett. 42(1), 99–107 (2011)
38. Muser, M.H., Urbakh, M., Robbins, M.O.: Statistical mechanics
of static and low-velocity kinetic friction. Adv. Chem. Phys. 126,
187–272 (2003)
39. Shimizu, J., Eda, H., Yoritsune, M., Ohmura, E.: Molecular
dynamics simulation of friction on the atomic scale. Nanotech-
nology 9(2), 118–123 (1998)
Tribol Lett
123