Embed Size (px)
Citation preview
Audited results for the year ended 30 June 2008
RESU
LTS AN
D C
OM
MEN
TARY
8936 Discovery ResultsBook A5:Proof 3 9/2/08 11:56 PM Page 1
1
IntroductionThe year under review has been important and successful. Discovery’s core purpose of “making people healthierand enhancing and protecting their lives” has manifested in a consumer-engaged approach to life and healthinsurance and financial services, which has created significant competitive advantage, enabling strong organicgrowth across its businesses and a wide range of opportunities for the future. Discovery’s established businesseshave performed particularly well, despite a challenging economic environment. In addition, during the yearunder review, Discovery launched two substantial businesses, Discovery Invest and PruProtect (the UK lifeinsurance joint venture with the Prudential plc), and commenced the wind-down of Destiny Health, its US healthinsurance subsidiary.
Operating profits of established businesses – Discovery Health, Discovery Life, Vitality and PruHealth – increasedby 39% to R1.8 billion. After the costs of launching Discovery Invest and PruProtect, and the wind-down costs ofDestiny Health, operating profits increased by 13% to R1.3 billion.
Annual recurring new business increased by 18% to R4.8 billion (excluding Destiny Health).The embedded value grew by 16% to R16.4 billion (despite an increase in the risk discount rate of 2.25% due toincreasing interest rates). The quality of the businesses is clearly illustrated by positive experience variances ofR728 million that arose during the year under review – a clear indication of performance exceeding expectation.
Established businesses Discovery HealthDiscovery Health’s performance over the period surpassed expectation. Given its size, social importance, and thecomplexity of the environment in which it operates, the expectations for Discovery Health are based on anapproach that demands excellence in every aspect of its business. The performance during the year across everykey performance measure exceeded expectation, and placed Discovery Health in a uniquely strong position in itschosen market.
Operating profit grew by 21% to R891 million – membership grew by 3.2% from 896 143 families to 924 725families – the lapse rate, despite difficult economic conditions remained stable at 4% and efficiencies increaseddramatically with the staff headcount per 1 000 lives covered, decreasing by 9%. The level of solvency capitalwithin the Discovery Health Medical Scheme increased in line with the stated targets crossing the R5 billion levelas at 30 June 2008, and the scheme is on target to achieve the 25% level by December 2008.
Healthcare environments are typically characterised by regulation and policy debate and, during the year underreview, a considerable number of significant policy issues emerged. Included in this is the potential regulation ofhospital costs and doctor tariffs, the ongoing technical considerations around the implementation of the risk-equalisation fund for medical schemes and changes to medical scheme benefit structures. In particular, the
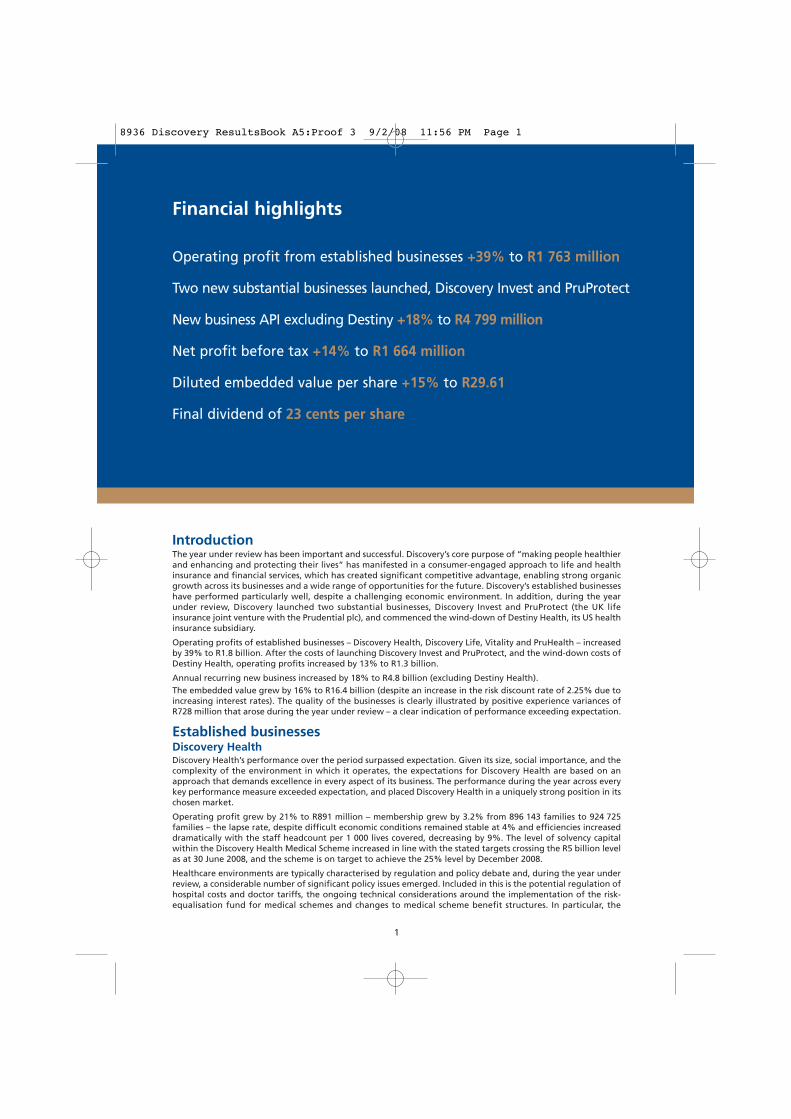
Financial highlights
Operating profit from established businesses +39% to R1 763 million
Two new substantial businesses launched, Discovery Invest and PruProtect
New business API excluding Destiny +18% to R4 799 million
Net profit before tax +14% to R1 664 million
Diluted embedded value per share +15% to R29.61
Final dividend of 23 cents per share
8936 Discovery ResultsBook A5:Proof 3 9/2/08 11:56 PM Page 1
National Health Amendment Bill and the Medical Schemes Amendment Bill reflect these policy considerations.Also, the ANC’s Polokwane Conference in October 2007 placed the concept of a National Health Insurance systemfirmly on the agenda.
While the scale and breadth of these issues invariably stimulate policy debate, Discovery Health is of the view thatthe policy debates will manifest in an acceptable regulatory and policy framework. It expects the emergingenvironment to provide fertile ground for increased cooperation between the public and private components ofthe healthcare system, and to see private healthcare continue to play an integral role within the healthcarelandscape. Discovery Health firmly remains of the view that the private healthcare sector’s role is a pivotal one inthe future of SA, and attention must not be diverted from ensuring its excellence and sustainability. DiscoveryHealth is a central role-player in these discussions and is committed to using its scale, expertise and data to playa meaningful and constructive role in these debates.
Discovery Health is cognisant that its real challenge is to ensure that its members have access to the best qualityhealthcare, at an affordable price and, to this end, a substantial investment was made – and continues to bemade – into actuarial, clinical and technological skills and infrastructure. The performance of the Discovery HealthMedical Scheme is testimony to this, with the scheme generating a surplus of R1 146 million for its 2007 calendaryear. In addition, Vitality has had a significant impact on ensuring demographic balance and controlled lapserates, both of which are pivotal to sustainability.
A notable feature of Discovery Health’s performance during the year has been a considerable gain in operatingefficiencies. This has been achieved through a combination of scale and the use of technology withoutcompromising service levels – which, in fact, have been at their highest levels in the company’s history. Theseefficiencies have been passed on to members through lower administration fees. Administration fees have beenincreased over the last five years by only 2.3% per annum, 4.0% less than CPI over the period. Discovery Healthis particularly well placed for the year ahead.
Discovery LifeDiscovery Life’s performance exceeded expectations. Despite the difficult economic climate – which negativelyimpacts on life assurance – the company’s performance across virtually all aspects of its business was exceptional:new business performance exceeded target; the distribution channels performed well with the recently establishedtied agency force producing significant new business, and the quality of the business transacted was pleasing. Inaddition, Discovery Life rolled out a number of important innovations within its core product range. The only areawherein the environment impacted somewhat negatively, was the lapse rate, which moved upwards, but notsignificantly above expectation.
Operating profit grew by 38% to R978 million, new business (including Discovery Invest) grew by 45% toR1.4 billion and the value of in-force business grew by 22% to R7.3 billion.
It is estimated that Discovery Life transacted more new risk business over the period than any of its competitors.From a quality perspective, the company managed to achieve positive experience variances over the year,reflecting a performance that exceeded expectations – expectations which were set prior to the emergingeconomic climate. In addition to this, the rate of take-up of ancillary benefits – an important barometer of productacceptability and key driver of profitability – has increased compared with the corresponding period last year.While the lapse rate did increase, Discovery Life’s integration strategy, which integrates Vitality and createsdynamic premium pricing, ensured that its products are more persistent and is proving to be an essentialimmunising strategy against economic downturns.
A notable feature during the year has been the performance of Discovery Life’s distribution strategy. DiscoveryLife’s performance during the year under review can largely be attributed to the success of Discovery’s growingtied agency force as a means of product distribution in addition to the 6 961 financial advisers who activelysupport Discovery Life. The agency force, Discovery Financial Consultants (DFC), has been developed based on thehypothesis that given the quality of products available across Discovery, the group would be able to attract andretain the best tied agents. During the year the number of agents grew by 289% to 144, and the average newbusiness produced by agents increased to R136 747 per month– estimated to be around eight times the industryaverage. In addition to the substantial business generated throughout the year, it is expected that DFC will playa central role in the group’s growth going forward.
Toward the end of the period under review, Discovery Life launched a range of important innovations. The CoverIntegrator, which reduces the cost of life cover, and the LifeTime Impact approach to severe illness and disabilitybenefits, which flexes benefit payouts based on policyholders’ personal requirements, are expected to furtherentrench Discovery Life’s leadership position. Accelerating new business production post the reporting periodreflects the acceptance of the approach.
Discovery Life is positioned particularly well for the year ahead.
PruHealthPruHealth, Discovery’s UK health insurance joint venture with the Prudential plc, is an important initiative forDiscovery. It constitutes a fundamental beachhead that Discovery is building in the UK and the approach to thisinitiative has been without compromise: the quality of the team, the product proposition and the infrastructureincorporate all of Discovery’s learnings. There has been a concerted effort in terms of growth and quality, basedon the shareholders’ strategic view that building a business of sustainability and success requires relevance andscale. During the period under review, an intense focus was applied to new business production, innovation andthe drivers of quality and profitability. While it is important that PruHealth generates an accounting profit, the
2
8936 Discovery ResultsBook A5:Proof 3 9/2/08 11:56 PM Page 2
collective view of Discovery and the Prudential is that this should not be achieved at the expense of growthpotential and quality. (In fact, approximately 61% of PruHealth’s expense base was spent on acquisition costs inthe year under review.) Within this context, the year’s performance has been pleasing.
New business increased by 28% from R418 million to R533 million. Industry statistics illustrate that PruHealthcaptured 11% of total new business transacted in the UK private medical insurance market. In addition, over theperiod under review, the fundamental barometers of quality and sustainability, such as the claims-loss-ratio, lapserates, and expense efficiencies, all improved dramatically, positioning the business for substantial embeddedvalue growth going forward. Operating losses were cut by 29% from R218 million to R155 million, and notably,comparing the last six months of the year with the corresponding period in the previous year, Discovery’s shareof the losses reduced by 37% from £7.2 million to £4.6 million. Discovery expects PruHealth to be profitableduring the 2009 calendar year.
A crucial component of a health insurer’s quality and viability is its loss ratio. During the period significantinvestments were made in the managed care capabilities of PruHealth and consequentially, the loss ratio reducedby 7%.
A component of the product strategy was to create an exciting Vitality gym benefit offering. PruHealth has sincebroadened the focus of its gym benefit from purely incentivising the number of gym visits to measuringimprovements in members’ overall health, as indicated by their Vitality status.
PruHealth continued its focus on product leadership and, during the period, launched a number of importantinnovations. In particular, Vitality Interactive is a remarkably powerful online capability, which allows membersto interface more intimately with Vitality. It facilitates a more powerful and personal way for them to managetheir health and access the Vitality rewards. This capability is now being rolled out across all of Discovery’sbusinesses. In addition, a number of valuable new partners, such as Eurostar and Mark Warner, have been addedto Vitality, further enhancing the value proposition and demonstrating the ability to leverage Vitality’s intellectualcapital in other markets.
Vitality Vitality’s performance over the year was both pleasing and important. While Vitality performed well from afinancial perspective and exceeded expectations, its real significance is the foundational impact it has on Discovery’sbusinesses. In this regard, considerable developments and innovations took place within Vitality during the year.
Operating profit increased by 14% from R43 million to R49 million and the number of members increased by 2%from 1.28 million to 1.30 million. It was encouraging to see engagement levels increase a great deal across anumber of areas, including an 8% increase in the number of members exercising at Virgin Active and PlanetFitness gyms.
The most notable progress in the year under review was made in terms of the core clinical capabilities withinVitality and the structures used to create behavioural change.
In addition to Vitality Interactive (discussed in the PruHealth section), fundamental innovations have been thedevelopment of Personal Pathways and the Vitality Age concept, which has been developed in cooperation withthe Sports Science Institute of South Africa at the University of Cape Town. These product features enablemembers to understand their risk-adjusted age and set appropriate goals and activities based on their individualcircumstances. The combination of these developments creates a powerful platform for future differentiationand added-value for all of Discovery’s businesses, and importantly, reflects a deeper understanding of the use ofincentives to change behaviour. Other exciting initiatives were launched, such as Vitality’s wellness initiatives forchildren, which aim to reduce the growing problem of childhood obesity by encouraging better nutrition andincreased physical activity in our youth. Over 1 000 schools are currently participating in the Vitality SchoolsProgramme, developed as part of the initiative.
Importantly, the extent of Vitality’s data and its applicability in Discovery’s life and health insurance markets werefocused on during the period. This has manifested in a number of important studies that will provide Discoverywith deeper insight into the correlations between healthy behaviour and its effect on mortality and morbidity.These studies will soon be submitted to respected international journals for publication.
New businessesDiscovery InvestDuring the period, the Group’s investment business, Discovery Invest, was launched. Over the year, R157 millionwas spent developing, launching and transacting Invest’s initial new business.
The strategy behind Invest is to harness the sophistication of an open architecture investment platform, offeringa broad range of long-term savings products, but differentiating within the products and funds.
Despite Invest’s launch at almost the precise moment the investment markets became difficult and volatile, itsperformance to date has exceeded expectation. Total new business produced amounted to R1.2 billion, consistingof R181 million recurring premium business, and R984 million single premiums – this yielded R206.1 million inannual premium equivalent (APE) for the period under review. Total assets under management, including DiscoveryInvest seed capital, exceeded R1.4 billion at the year end.
Industry surveys illustrate that in the “Endowment and Voluntary Annuity Linked Investment Services Platforms”category in which the bulk of Discovery Invest’s business resides, it managed to capture 11% market share ofnew business.
3
8936 Discovery ResultsBook A5:Proof 3 9/2/08 11:56 PM Page 3
Importantly from an acceptance and profit perspective, the performance has been particularly pleasing: 55%of all funds flow through Discovery’s on-balance sheet products, and 88% of funds flow into Discovery’s in-house portfolios.
There are the two important thrusts of innovation: the use of integration with Vitality and the LIFE PLAN tosignificantly reduce the asset management and operational fees that the investor pays and, secondly, funds suchas RightChoice Investments and the Escalator Funds, which provide the upside of the chosen investment markets,but provide unique and dynamic downside protection. Both of these thrusts are appropriate in volatile investmentmarkets, and the concept of reduced fees has been particularly well received.
Discovery expects an accelerating pace of growth from Discovery Invest. Given the accounting treatment of investmentbusiness, which limits the extent of acquisition cost deferral, the strong expected growth is likely to result in a delayin the emergence of accounting profit, despite a positive contribution to Discovery’s embedded value.
PruProtectPruProtect, Discovery’s UK life assurance joint venture with the Prudential plc, performed below expectation forthe year under review. While the amount spent on PruProtect is in line with budget, the new business productionis lower than anticipated.
PruProtect’s strategy is predicated on the deployment of the Discovery Life product methodology, whereinbenefits are differentiated and modernised. Vitality is used to enable dynamic pricing so that the price pointsachieved are competitive. This ability to offer a differentiated product at a competitive price is important in afiercely competitive and commoditised market, such as the UK life assurance industry. To achieve this, a substantiallife assurance capability has been built and the migration of the product technology and capability has beensuccessful, along with pleasing receptivity from financial advisers.
However, given the differentiated nature of the product range, a fundamental element of the strategy has beenthe need to build a high advice distribution channel which interfaces face-to-face with independent financialadvisers (IFAs). In this regard, the execution has been behind schedule. The strategic intention was to deploy afranchise distribution channel across the UK that mirrors the successful approach taken in the South Africanmarket. This requires a careful establishment of distribution franchises run by hand-picked franchise directorswho, in turn, recruit exceptional account managers who call on the IFAs. The structures and algorithms within thisapproach have been well developed within Discovery, with specifications and account-manager densitypredetermined based on the distribution of financial advisers within a geographic area, as well as other factors.
During the period the progress made was slow and the migration of skills from Discovery ineffective. The resultwas that by March 2008 there were seven franchises and 10 account managers, significantly short of the numbersrequired to achieve the new business targets.
Remedial actions have been taken, including a significant increase and intensity in sales leadership resources and aninjection of key Discovery distribution skills. PruProtect has also recruited a number of leading resources from withinthe UK life assurance market. By 31 August 2008, real progress had been made, with 10 franchises created and anexpectation of 100 account managers expected to be operational by December 2008. This channel is also beingsupported by active telephonic account management. As these channels gain traction, it is expected the business willmove in line with expectation.
The wind-down of Destiny HealthDuring the period under review, Discovery announced its intention to cease transacting health insurance businessin the US and, as a consequence, that Destiny Health would exit the US retail insurance market. It would, however,continue to market the Vitality product on a standalone basis to employer groups and health plans. Discoverystated that the wind-down would cost approximately US$30 million and take a number of years to achieve, giventhe need to transfer the members to other carriers.
The execution of this market withdrawal has progressed according to plan, with all contracts concluded, andregulatory approval received. Plan members have begun transferring coverage – a process that will takeapproximately 24 months, with the greater part of the base moving on 1 January 2009. The extent and complexityof this is substantial: the business is underwritten on four different insurance licenses, within six different USstates. Importantly, Discovery’s approach has been based on maintaining and enhancing its reputation with stateregulators, Discovery’s insurance partners, plan members, employers and other stakeholders, and the methodologyused for the wind-down has kept this mandate top-of-mind. The transfer of business to Trustmark and the exitingof the Guardian Life Insurance Company partnership have been implemented carefully and methodically to ensurethis. Discovery is pleased that every single employer group will be offered state-approved alternative coveragewith a credible carrier as the process unfolds.
For the year under review, the costs of the wind-down have been achieved within the financial budgets laiddown. The membership base had decreased from 33 282 in March 2008 to 26 502 in June 2008, and the cost ofthe wind-down amounted to US$10 million out of a total budget of US$30 million. It is therefore anticipatedthat a further US$20 million will be spent over the next 20 months on the wind-down. The pace of the wind-downis slightly ahead of schedule, reflecting the robustness of the alternative coverages that have been provided.
MI Hilkowitz A GoreChairperson Chief Executive Officer
4
8936 Discovery ResultsBook A5:Proof 3 9/2/08 11:56 PM Page 4
5
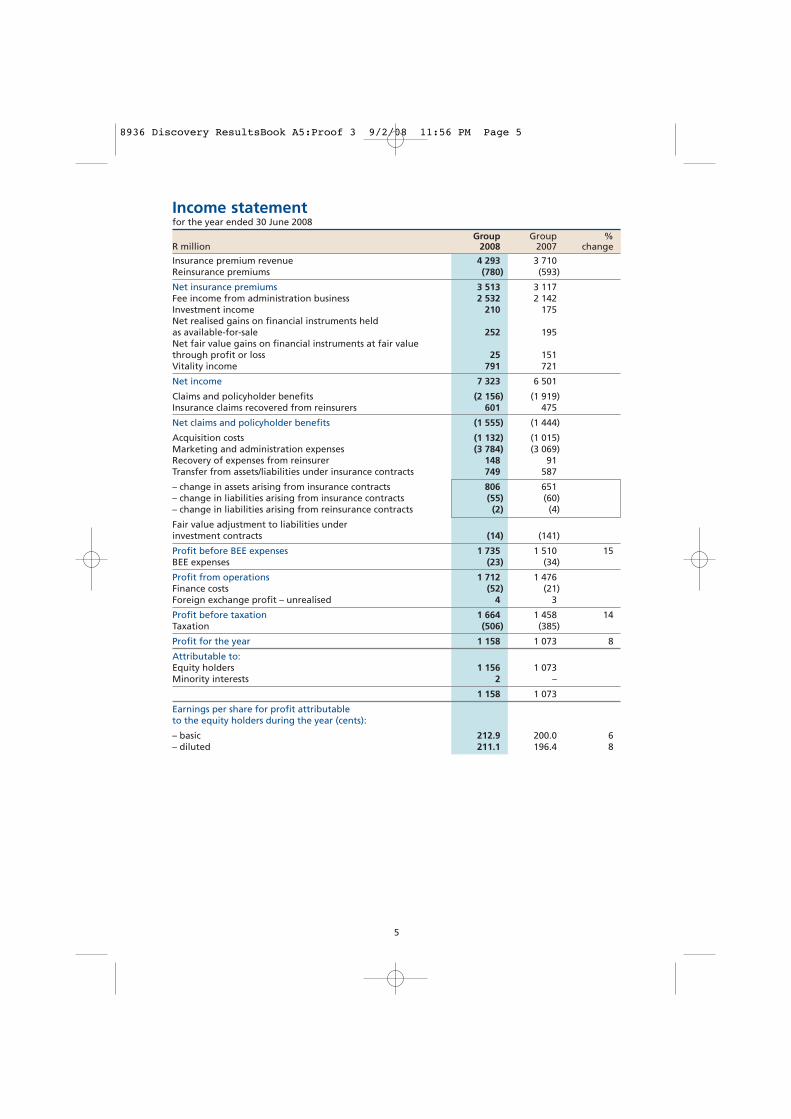
Income statementfor the year ended 30 June 2008
Group Group %R million 2008 2007 change
Insurance premium revenue 4 293 3 710Reinsurance premiums (780) (593)
Net insurance premiums 3 513 3 117Fee income from administration business 2 532 2 142Investment income 210 175Net realised gains on financial instruments held as available-for-sale 252 195Net fair value gains on financial instruments at fair value through profit or loss 25 151Vitality income 791 721
Net income 7 323 6 501
Claims and policyholder benefits (2 156) (1 919)Insurance claims recovered from reinsurers 601 475
Net claims and policyholder benefits (1 555) (1 444)
Acquisition costs (1 132) (1 015)Marketing and administration expenses (3 784) (3 069)Recovery of expenses from reinsurer 148 91Transfer from assets/liabilities under insurance contracts 749 587
– change in assets arising from insurance contracts 806 651– change in liabilities arising from insurance contracts (55) (60)– change in liabilities arising from reinsurance contracts (2) (4)
Fair value adjustment to liabilities under investment contracts (14) (141)
Profit before BEE expenses 1 735 1 510 15BEE expenses (23) (34)
Profit from operations 1 712 1 476Finance costs (52) (21)Foreign exchange profit – unrealised 4 3
Profit before taxation 1 664 1 458 14Taxation (506) (385)
Profit for the year 1 158 1 073 8
Attributable to:Equity holders 1 156 1 073Minority interests 2 –
1 158 1 073
Earnings per share for profit attributable to the equity holders during the year (cents):
– basic 212.9 200.0 6– diluted 211.1 196.4 8
8936 Discovery ResultsBook A5:Proof 3 9/2/08 11:56 PM Page 5
6
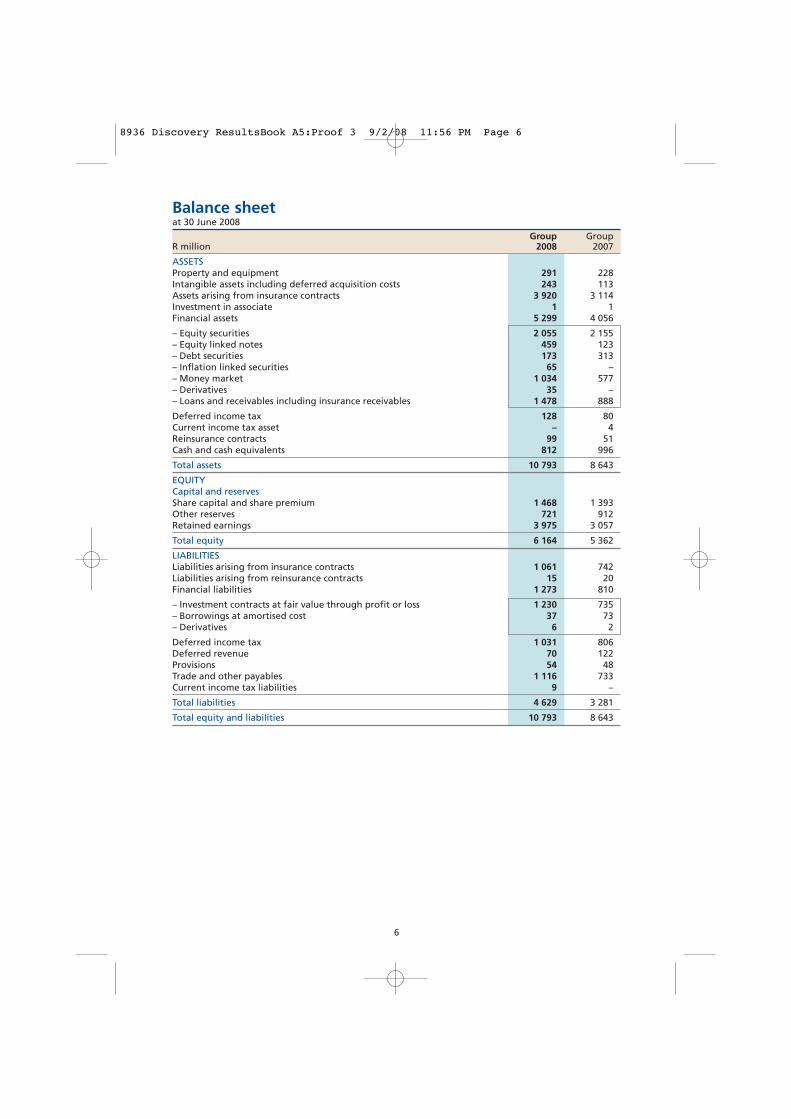
Balance sheetat 30 June 2008
Group GroupR million 2008 2007
ASSETSProperty and equipment 291 228 Intangible assets including deferred acquisition costs 243 113 Assets arising from insurance contracts 3 920 3 114 Investment in associate 1 1 Financial assets 5 299 4 056
– Equity securities 2 055 2 155– Equity linked notes 459 123– Debt securities 173 313– Inflation linked securities 65 –– Money market 1 034 577– Derivatives 35 –– Loans and receivables including insurance receivables 1 478 888
Deferred income tax 128 80 Current income tax asset – 4 Reinsurance contracts 99 51 Cash and cash equivalents 812 996
Total assets 10 793 8 643
EQUITYCapital and reservesShare capital and share premium 1 468 1 393 Other reserves 721 912 Retained earnings 3 975 3 057
Total equity 6 164 5 362
LIABILITIESLiabilities arising from insurance contracts 1 061 742 Liabilities arising from reinsurance contracts 15 20 Financial liabilities 1 273 810
– Investment contracts at fair value through profit or loss 1 230 735– Borrowings at amortised cost 37 73– Derivatives 6 2
Deferred income tax 1 031 806 Deferred revenue 70 122 Provisions 54 48 Trade and other payables 1 116 733 Current income tax liabilities 9 –
Total liabilities 4 629 3 281
Total equity and liabilities 10 793 8 643
8936 Discovery ResultsBook A5:Proof 3 9/2/08 11:56 PM Page 6
7
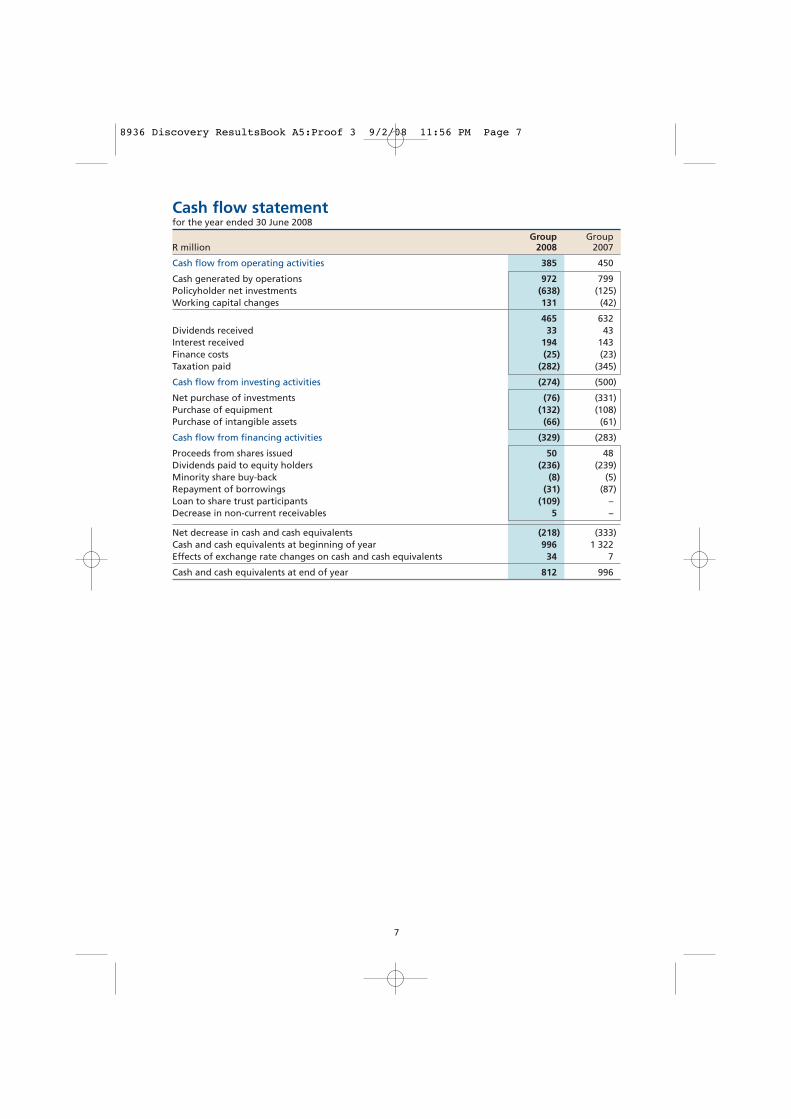
Cash flow statementfor the year ended 30 June 2008
Group GroupR million 2008 2007
Cash flow from operating activities 385 450
Cash generated by operations 972 799Policyholder net investments (638) (125)Working capital changes 131 (42)
465 632Dividends received 33 43Interest received 194 143Finance costs (25) (23)Taxation paid (282) (345)
Cash flow from investing activities (274) (500)
Net purchase of investments (76) (331)Purchase of equipment (132) (108)Purchase of intangible assets (66) (61)
Cash flow from financing activities (329) (283)
Proceeds from shares issued 50 48Dividends paid to equity holders (236) (239)Minority share buy-back (8) (5)Repayment of borrowings (31) (87)Loan to share trust participants (109) –Decrease in non-current receivables 5 –
Net decrease in cash and cash equivalents (218) (333)Cash and cash equivalents at beginning of year 996 1 322Effects of exchange rate changes on cash and cash equivalents 34 7
Cash and cash equivalents at end of year 812 996
8936 Discovery ResultsBook A5:Proof 3 9/2/08 11:56 PM Page 7
8
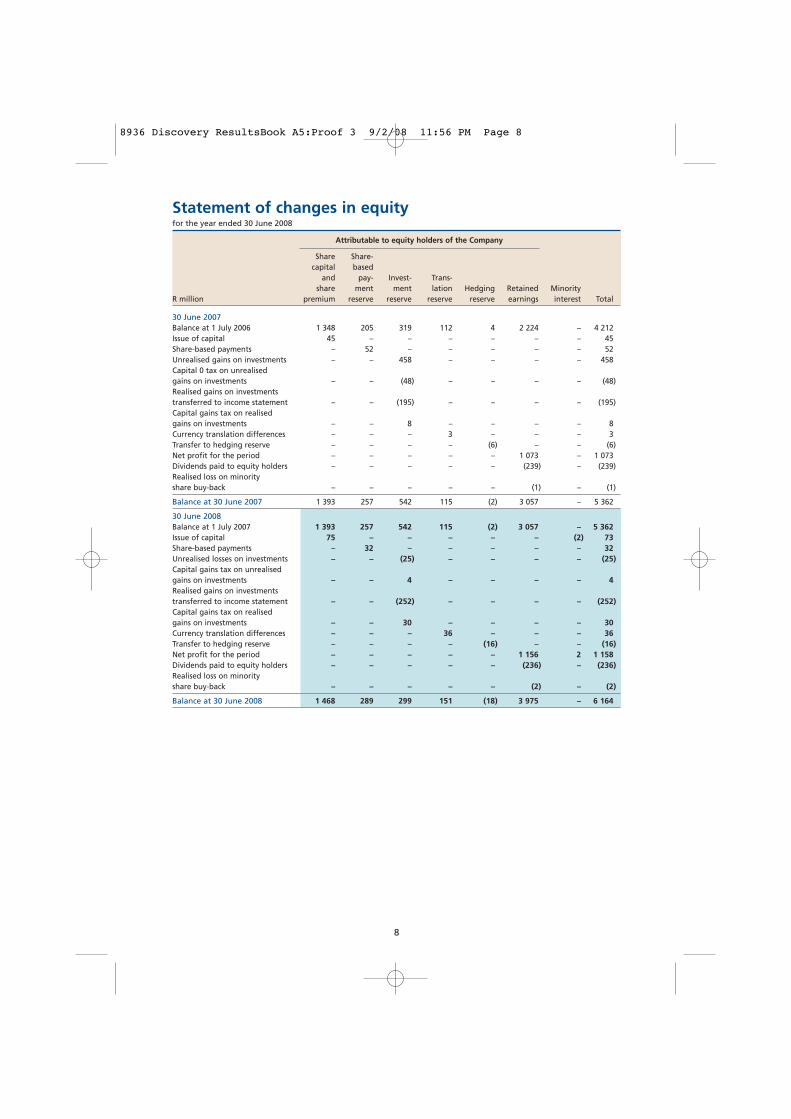
Statement of changes in equityfor the year ended 30 June 2008
Attributable to equity holders of the Company
Share Share-capital based
and pay- Invest- Trans-share ment ment lation Hedging Retained Minority
R million premium reserve reserve reserve reserve earnings interest Total
30 June 2007Balance at 1 July 2006 1 348 205 319 112 4 2 224 – 4 212 Issue of capital 45 – – – – – – 45 Share-based payments – 52 – – – – – 52 Unrealised gains on investments – – 458 – – – – 458 Capital 0 tax on unrealised gains on investments – – (48) – – – – (48)Realised gains on investments transferred to income statement – – (195) – – – – (195)Capital gains tax on realised gains on investments – – 8 – – – – 8 Currency translation differences – – – 3 – – – 3 Transfer to hedging reserve – – – – (6) – – (6)Net profit for the period – – – – – 1 073 – 1 073 Dividends paid to equity holders – – – – – (239) – (239)Realised loss on minority share buy-back – – – – – (1) – (1)
Balance at 30 June 2007 1 393 257 542 115 (2) 3 057 – 5 362
30 June 2008Balance at 1 July 2007 1 393 257 542 115 (2) 3 057 – 5 362 Issue of capital 75 – – – – – (2) 73 Share-based payments – 32 – – – – – 32 Unrealised losses on investments – – (25) – – – – (25)Capital gains tax on unrealised gains on investments – – 4 – – – – 4 Realised gains on investments transferred to income statement – – (252) – – – – (252)Capital gains tax on realised gains on investments – – 30 – – – – 30 Currency translation differences – – – 36 – – – 36 Transfer to hedging reserve – – – – (16) – – (16)Net profit for the period – – – – – 1 156 2 1 158 Dividends paid to equity holders – – – – – (236) – (236)Realised loss on minority share buy-back – – – – – (2) – (2)
Balance at 30 June 2008 1 468 289 299 151 (18) 3 975 – 6 164
8936 Discovery ResultsBook A5:Proof 3 9/2/08 11:56 PM Page 8
9
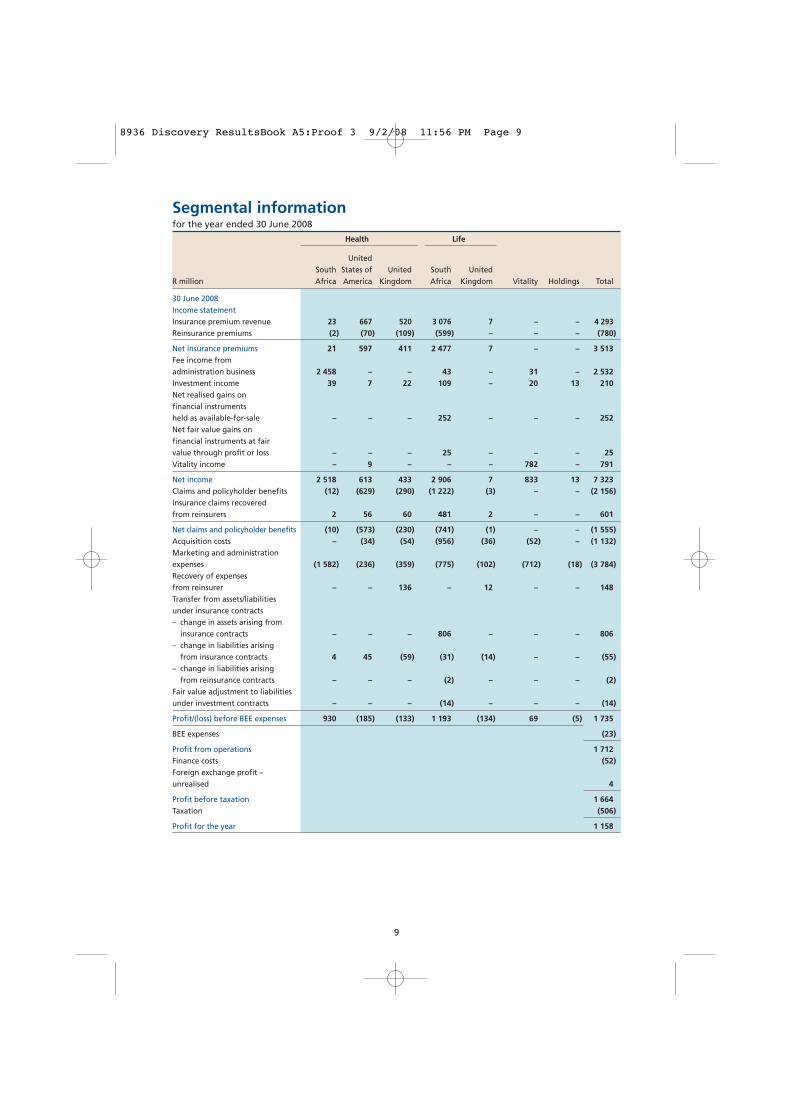
Segmental informationfor the year ended 30 June 2008
Health Life
UnitedSouth States of United South United
R million Africa America Kingdom Africa Kingdom Vitality Holdings Total
30 June 2008Income statementInsurance premium revenue 23 667 520 3 076 7 – – 4 293 Reinsurance premiums (2) (70) (109) (599) – – – (780)
Net insurance premiums 21 597 411 2 477 7 – – 3 513 Fee income from administration business 2 458 – – 43 – 31 – 2 532 Investment income 39 7 22 109 – 20 13 210 Net realised gains on financial instruments held as available-for-sale – – – 252 – – – 252 Net fair value gains on financial instruments at fair value through profit or loss – – – 25 – – – 25 Vitality income – 9 – – – 782 – 791
Net income 2 518 613 433 2 906 7 833 13 7 323Claims and policyholder benefits (12) (629) (290) (1 222) (3) – – (2 156)Insurance claims recovered from reinsurers 2 56 60 481 2 – – 601
Net claims and policyholder benefits (10) (573) (230) (741) (1) – – (1 555)Acquisition costs – (34) (54) (956) (36) (52) – (1 132)Marketing and administration expenses (1 582) (236) (359) (775) (102) (712) (18) (3 784)Recovery of expenses from reinsurer – – 136 – 12 – – 148 Transfer from assets/liabilities under insurance contracts– change in assets arising from
insurance contracts – – – 806 – – – 806 – change in liabilities arising
from insurance contracts 4 45 (59) (31) (14) – – (55)– change in liabilities arising
from reinsurance contracts – – – (2) – – – (2)Fair value adjustment to liabilities under investment contracts – – – (14) – – – (14)
Profit/(loss) before BEE expenses 930 (185) (133) 1 193 (134) 69 (5) 1 735
BEE expenses (23)
Profit from operations 1 712 Finance costs (52)Foreign exchange profit – unrealised 4
Profit before taxation 1 664 Taxation (506)
Profit for the year 1 158
8936 Discovery ResultsBook A5:Proof 3 9/2/08 11:56 PM Page 9
10
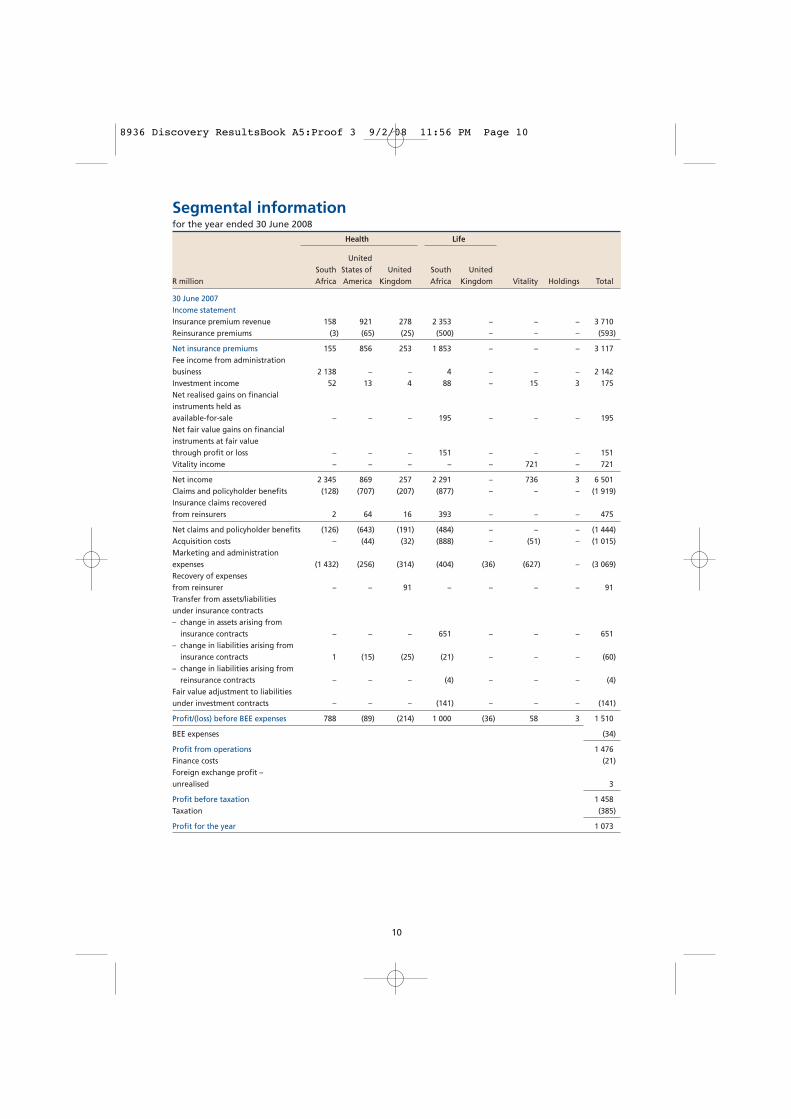
Segmental informationfor the year ended 30 June 2008
Health Life
UnitedSouth States of United South United
R million Africa America Kingdom Africa Kingdom Vitality Holdings Total
30 June 2007Income statementInsurance premium revenue 158 921 278 2 353 – – – 3 710 Reinsurance premiums (3) (65) (25) (500) – – – (593)
Net insurance premiums 155 856 253 1 853 – – – 3 117 Fee income from administration business 2 138 – – 4 – – – 2 142 Investment income 52 13 4 88 – 15 3 175 Net realised gains on financial instruments held as available-for-sale – – – 195 – – – 195 Net fair value gains on financial instruments at fair value through profit or loss – – – 151 – – – 151 Vitality income – – – – – 721 – 721
Net income 2 345 869 257 2 291 – 736 3 6 501 Claims and policyholder benefits (128) (707) (207) (877) – – – (1 919)Insurance claims recovered from reinsurers 2 64 16 393 – – – 475
Net claims and policyholder benefits (126) (643) (191) (484) – – – (1 444)Acquisition costs – (44) (32) (888) – (51) – (1 015)Marketing and administration expenses (1 432) (256) (314) (404) (36) (627) – (3 069)Recovery of expenses from reinsurer – – 91 – – – – 91 Transfer from assets/liabilities under insurance contracts– change in assets arising from
insurance contracts – – – 651 – – – 651 – change in liabilities arising from
insurance contracts 1 (15) (25) (21) – – – (60)– change in liabilities arising from
reinsurance contracts – – – (4) – – – (4)Fair value adjustment to liabilities under investment contracts – – – (141) – – – (141)
Profit/(loss) before BEE expenses 788 (89) (214) 1 000 (36) 58 3 1 510
BEE expenses (34)
Profit from operations 1 476 Finance costs (21)Foreign exchange profit – unrealised 3
Profit before taxation 1 458 Taxation (385)
Profit for the year 1 073
8936 Discovery ResultsBook A5:Proof 3 9/2/08 11:56 PM Page 10
11
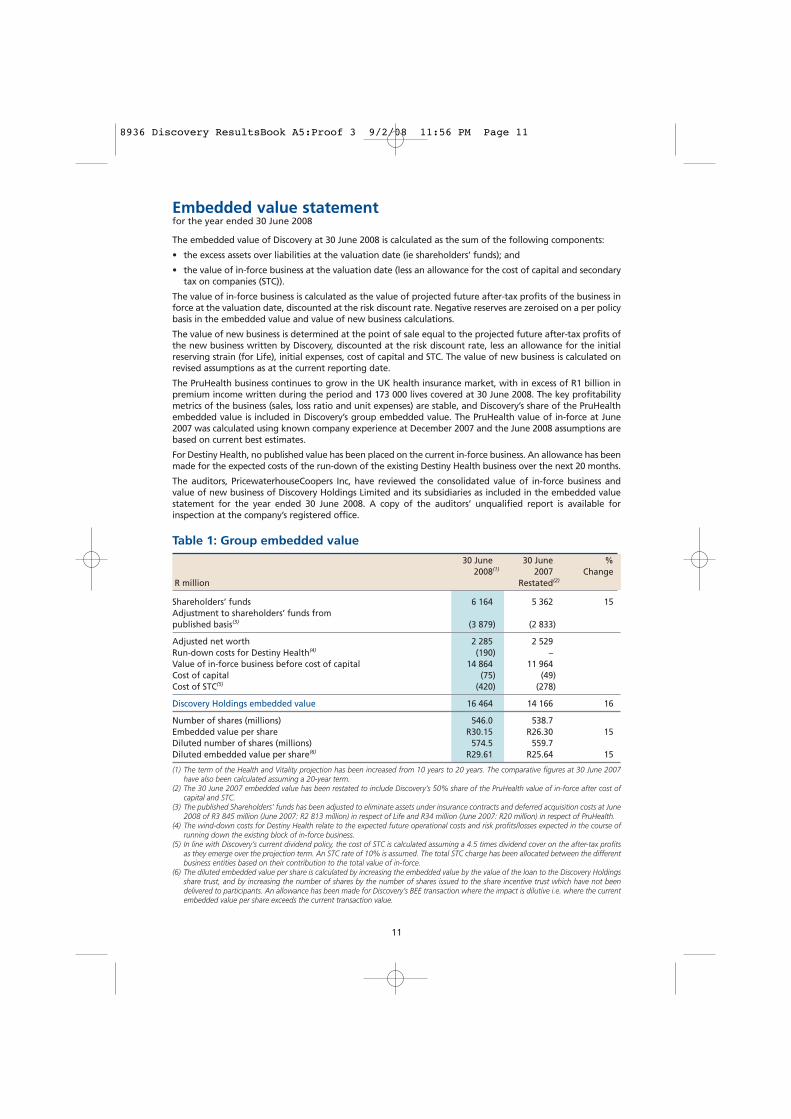
Embedded value statementfor the year ended 30 June 2008
The embedded value of Discovery at 30 June 2008 is calculated as the sum of the following components:
• the excess assets over liabilities at the valuation date (ie shareholders’ funds); and
• the value of in-force business at the valuation date (less an allowance for the cost of capital and secondarytax on companies (STC)).
The value of in-force business is calculated as the value of projected future after-tax profits of the business inforce at the valuation date, discounted at the risk discount rate. Negative reserves are zeroised on a per policybasis in the embedded value and value of new business calculations.
The value of new business is determined at the point of sale equal to the projected future after-tax profits ofthe new business written by Discovery, discounted at the risk discount rate, less an allowance for the initialreserving strain (for Life), initial expenses, cost of capital and STC. The value of new business is calculated onrevised assumptions as at the current reporting date.
The PruHealth business continues to grow in the UK health insurance market, with in excess of R1 billion inpremium income written during the period and 173 000 lives covered at 30 June 2008. The key profitabilitymetrics of the business (sales, loss ratio and unit expenses) are stable, and Discovery’s share of the PruHealthembedded value is included in Discovery’s group embedded value. The PruHealth value of in-force at June2007 was calculated using known company experience at December 2007 and the June 2008 assumptions arebased on current best estimates.
For Destiny Health, no published value has been placed on the current in-force business. An allowance has beenmade for the expected costs of the run-down of the existing Destiny Health business over the next 20 months.
The auditors, PricewaterhouseCoopers Inc, have reviewed the consolidated value of in-force business andvalue of new business of Discovery Holdings Limited and its subsidiaries as included in the embedded valuestatement for the year ended 30 June 2008. A copy of the auditors’ unqualified report is available forinspection at the company’s registered office.
Table 1: Group embedded value
30 June 30 June %2008(1) 2007 Change
R million Restated(2)
Shareholders’ funds 6 164 5 362 15Adjustment to shareholders’ funds from published basis(3) (3 879) (2 833)
Adjusted net worth 2 285 2 529Run-down costs for Destiny Health(4) (190) –Value of in-force business before cost of capital 14 864 11 964Cost of capital (75) (49)Cost of STC(5) (420) (278)
Discovery Holdings embedded value 16 464 14 166 16
Number of shares (millions) 546.0 538.7Embedded value per share R30.15 R26.30 15Diluted number of shares (millions) 574.5 559.7Diluted embedded value per share(6) R29.61 R25.64 15
(1) The term of the Health and Vitality projection has been increased from 10 years to 20 years. The comparative figures at 30 June 2007have also been calculated assuming a 20-year term.
(2) The 30 June 2007 embedded value has been restated to include Discovery’s 50% share of the PruHealth value of in-force after cost ofcapital and STC.
(3) The published Shareholders’ funds has been adjusted to eliminate assets under insurance contracts and deferred acquisition costs at June2008 of R3 845 million (June 2007: R2 813 million) in respect of Life and R34 million (June 2007: R20 million) in respect of PruHealth.
(4) The wind-down costs for Destiny Health relate to the expected future operational costs and risk profits/losses expected in the course ofrunning down the existing block of in-force business.
(5) In line with Discovery’s current dividend policy, the cost of STC is calculated assuming a 4.5 times dividend cover on the after-tax profitsas they emerge over the projection term. An STC rate of 10% is assumed. The total STC charge has been allocated between the differentbusiness entities based on their contribution to the total value of in-force.
(6) The diluted embedded value per share is calculated by increasing the embedded value by the value of the loan to the Discovery Holdingsshare trust, and by increasing the number of shares by the number of shares issued to the share incentive trust which have not beendelivered to participants. An allowance has been made for Discovery’s BEE transaction where the impact is dilutive i.e. where the currentembedded value per share exceeds the current transaction value.
8936 Discovery ResultsBook A5:Proof 3 9/2/08 11:56 PM Page 11
12
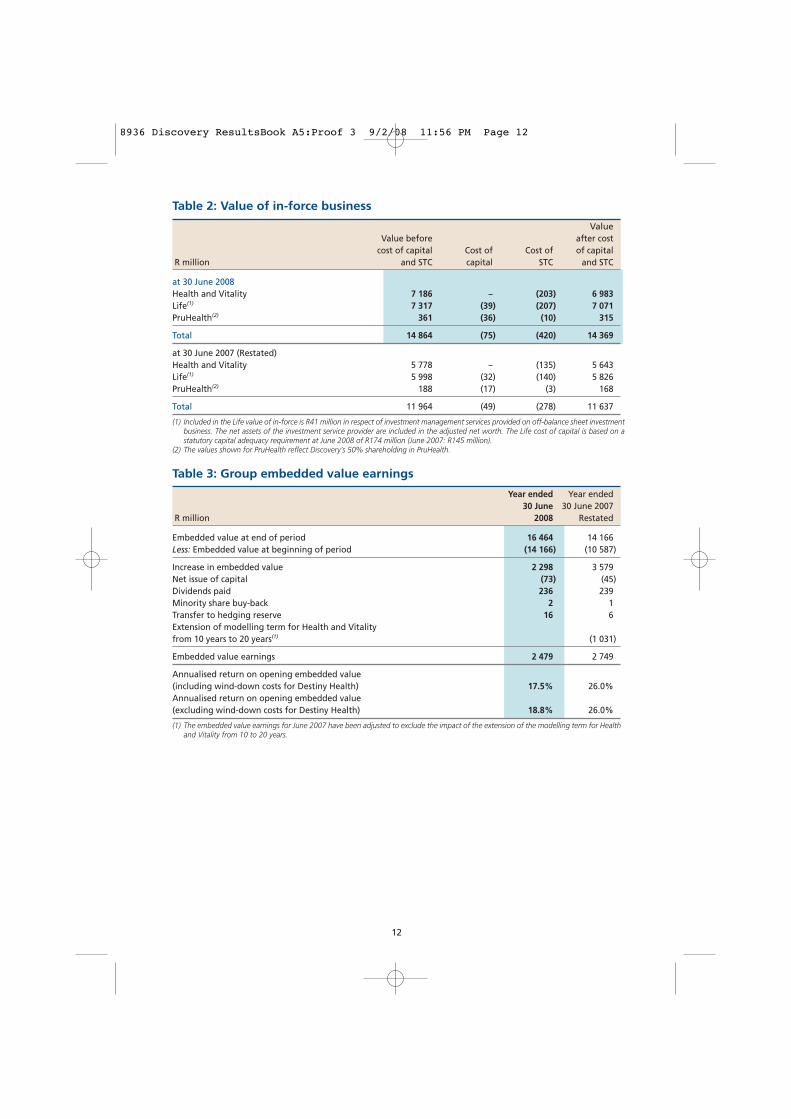
Table 2: Value of in-force business
ValueValue before after cost
cost of capital Cost of Cost of of capitalR million and STC capital STC and STC
at 30 June 2008Health and Vitality 7 186 – (203) 6 983Life(1) 7 317 (39) (207) 7 071PruHealth(2) 361 (36) (10) 315
Total 14 864 (75) (420) 14 369
at 30 June 2007 (Restated)Health and Vitality 5 778 – (135) 5 643Life(1) 5 998 (32) (140) 5 826PruHealth(2) 188 (17) (3) 168
Total 11 964 (49) (278) 11 637
(1) Included in the Life value of in-force is R41 million in respect of investment management services provided on off-balance sheet investmentbusiness. The net assets of the investment service provider are included in the adjusted net worth. The Life cost of capital is based on astatutory capital adequacy requirement at June 2008 of R174 million (June 2007: R145 million).
(2) The values shown for PruHealth reflect Discovery’s 50% shareholding in PruHealth.
Table 3: Group embedded value earnings
Year ended Year ended30 June 30 June 2007
R million 2008 Restated
Embedded value at end of period 16 464 14 166Less: Embedded value at beginning of period (14 166) (10 587)
Increase in embedded value 2 298 3 579Net issue of capital (73) (45)Dividends paid 236 239Minority share buy-back 2 1Transfer to hedging reserve 16 6Extension of modelling term for Health and Vitality from 10 years to 20 years(1) (1 031)
Embedded value earnings 2 479 2 749
Annualised return on opening embedded value (including wind-down costs for Destiny Health) 17.5% 26.0%Annualised return on opening embedded value (excluding wind-down costs for Destiny Health) 18.8% 26.0%
(1) The embedded value earnings for June 2007 have been adjusted to exclude the impact of the extension of the modelling term for Healthand Vitality from 10 to 20 years.
8936 Discovery ResultsBook A5:Proof 3 9/2/08 11:56 PM Page 12
13
Embedded value statement (continued)
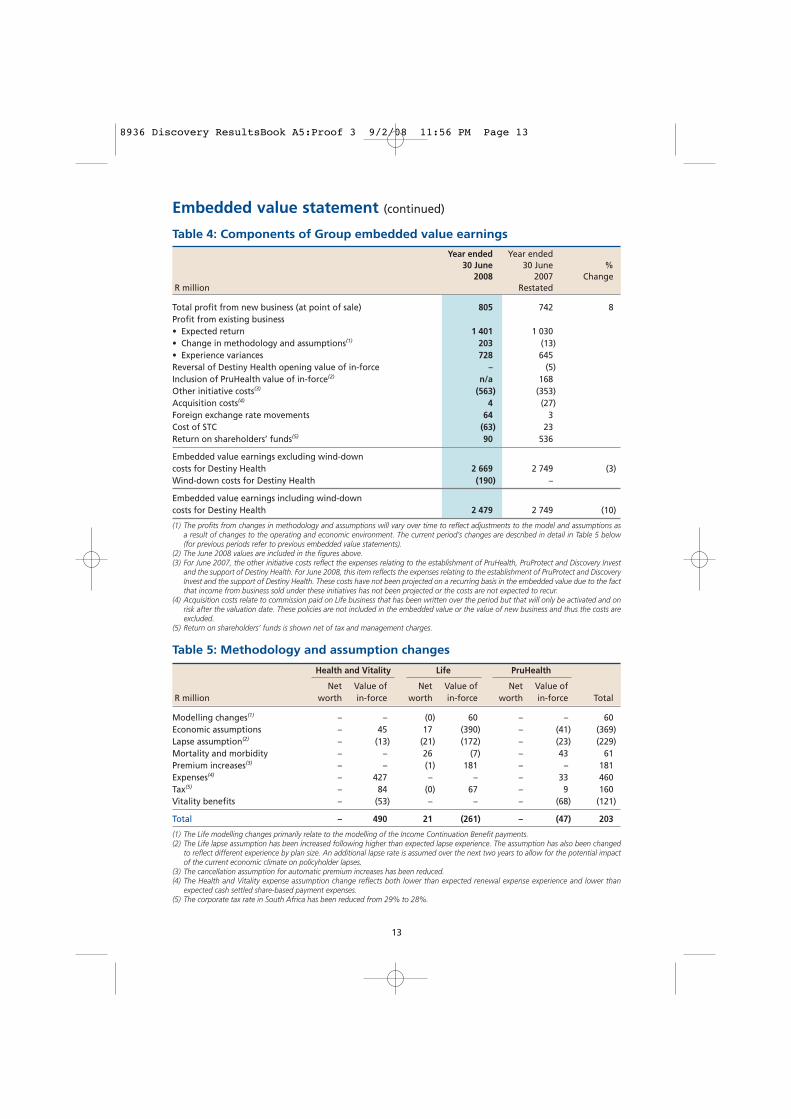
Table 4: Components of Group embedded value earnings
Year ended Year ended30 June 30 June %
2008 2007 ChangeR million Restated
Total profit from new business (at point of sale) 805 742 8Profit from existing business• Expected return 1 401 1 030• Change in methodology and assumptions(1) 203 (13)• Experience variances 728 645Reversal of Destiny Health opening value of in-force – (5)Inclusion of PruHealth value of in-force(2) n/a 168Other initiative costs(3) (563) (353)Acquisition costs(4) 4 (27)Foreign exchange rate movements 64 3Cost of STC (63) 23Return on shareholders’ funds(5) 90 536
Embedded value earnings excluding wind-down costs for Destiny Health 2 669 2 749 (3)Wind-down costs for Destiny Health (190) –
Embedded value earnings including wind-down costs for Destiny Health 2 479 2 749 (10)
(1) The profits from changes in methodology and assumptions will vary over time to reflect adjustments to the model and assumptions asa result of changes to the operating and economic environment. The current period’s changes are described in detail in Table 5 below(for previous periods refer to previous embedded value statements).
(2) The June 2008 values are included in the figures above.(3) For June 2007, the other initiative costs reflect the expenses relating to the establishment of PruHealth, PruProtect and Discovery Invest
and the support of Destiny Health. For June 2008, this item reflects the expenses relating to the establishment of PruProtect and DiscoveryInvest and the support of Destiny Health. These costs have not been projected on a recurring basis in the embedded value due to the factthat income from business sold under these initiatives has not been projected or the costs are not expected to recur.
(4) Acquisition costs relate to commission paid on Life business that has been written over the period but that will only be activated and onrisk after the valuation date. These policies are not included in the embedded value or the value of new business and thus the costs areexcluded.
(5) Return on shareholders’ funds is shown net of tax and management charges.
Table 5: Methodology and assumption changes
Health and Vitality Life PruHealth
Net Value of Net Value of Net Value ofR million worth in-force worth in-force worth in-force Total
Modelling changes(1) – – (0) 60 – – 60Economic assumptions – 45 17 (390) – (41) (369)Lapse assumption(2) – (13) (21) (172) – (23) (229)Mortality and morbidity – – 26 (7) – 43 61Premium increases(3) – – (1) 181 – – 181Expenses(4) – 427 – – – 33 460Tax(5) – 84 (0) 67 – 9 160Vitality benefits – (53) – – – (68) (121)
Total – 490 21 (261) – (47) 203
(1) The Life modelling changes primarily relate to the modelling of the Income Continuation Benefit payments.(2) The Life lapse assumption has been increased following higher than expected lapse experience. The assumption has also been changed
to reflect different experience by plan size. An additional lapse rate is assumed over the next two years to allow for the potential impactof the current economic climate on policyholder lapses.
(3) The cancellation assumption for automatic premium increases has been reduced.(4) The Health and Vitality expense assumption change reflects both lower than expected renewal expense experience and lower than
expected cash settled share-based payment expenses.(5) The corporate tax rate in South Africa has been reduced from 29% to 28%.
8936 Discovery ResultsBook A5:Proof 3 9/2/08 11:56 PM Page 13
14
Table 6: Experience variances
Health and Vitality Life PruHealth
Net Value of Net Value of Net Value ofR million worth in-force worth in-force worth in-force Total
Expenses 99 – 6 – 4 – 109Economic assumptions – – 12 10 – – 22Extended modelling term(1) – 139 – 9 – 19 167Lapses(2) 16 160 (35) (159) – – (18)Policy alterations – 17 (62) 159 – – 114Premium income – – 10 35 – – 45Mortality and morbidity – – 17 8 (9) – 16Deferred profits released – – 11 (11) – – –Tax(3) (3) – 12 19 (62) 23 (11)Administration fees(4) 22 312 – – – – 334Timing of cashflows – – (38) 36 – – (2)Gym start-up costs – – – – (24) – (24)Reinsurance – – – – 83 (83) 0Other (19) (3) (8) (1) (2) 9 (24)
Total 115 625 (75) 105 (10) (32) 728
(1) The projection term for Health, Vitality, PruHealth and Group Life at 30 June 2008 has not been changed from that used in the restated30 June 2007 embedded value. Thus, an experience variance arises because the total term of the in-force business is effectively increasedby one year.
(2) Included in the Health and Vitality lapse experience variance is an amount of R560 million in respect of members joining existing employergroups during the period, offset by an amount of R437 million in respect of members leaving existing employer groups. A positive varianceof R53 million is due to lower than expected lapses. The lapse rate on Life plans and in particular policies with below average premiumsizes was higher than expected.
(3) The tax variance for PruHealth includes R27 million in finance charges relating to a settlement discount on early payment by Prudentialfor UK tax losses ceded to them.
(4 The inflation-linked administration fee increase in 2008 exceeded the long-term inflation assumption in the embedded value model dueto higher than expected inflation levels.
8936 Discovery ResultsBook A5:Proof 3 9/2/08 11:56 PM Page 14
15
Embedded value statement (continued)
Table 7: Embedded value of new business
Year ended Year ended30 June 30 June %
2008 2007 ChangeR million Restated
Health and VitalityGross profit from new business at point of sale 213 129Cost of capital – –Cost of STC (6) (3)
Net profit from new business at point of sale 207 126 64
New business annualised premium income(1) 1 079 1 011 7
LifeGross profit from new business at point of sale(2) 589 639Cost of capital (12) (8)Cost of STC (16) (15)
Net profit from new business at point of sale 561 616 (9)
New business annualised premium income(3) 964 695 39Annualised profit margin(4) 7.3% 10.1%Annualised profit margin excluding Invest Business 8.4% 10.1%
PruHealth(5)
Gross profit from new business at point of sale 48Cost of capital (10)Cost of STC (1)
Net profit from new business at point of sale 37
New business annualised premium income(6) 219Annualised profit margin(4) 2.3%
(1) Health new business annualised premium income is the gross contribution to the medical schemes. For embedded value purposes, Healthnew business is defined as individuals and members of new employer groups, and includes additions to first year business.The new business annualised premium income shown above has been adjusted to exclude premiums in respect of members who join anexisting employer after the first year, as well as premiums in respect of new business written during the period but only activated after30 June 2008.The total Health and Vitality new business annualised premium income written over the period was R2 834 million (June 2007:R2 677 million).
(2) Included in the Life value of new business is R19 million in respect of investment management services provided on off-balance sheetinvestment business.
(3) Life new business is defined as policies which incepted during the reporting period and which are on risk at the valuation date. Invest newbusiness is defined as business where at least one premium has been received and which has not been refunded after receipt.The new business annualised premium income of R964 million (single premium APE: R71 million) shown above excludes automaticpremium increases and servicing increases in respect of existing business. The total Life new business annualised premium income writtenover the period, including both automatic premium increases of R243 million, servicing increases of R171 million and future datedinvestment business of R29 million (single premium APE: R4 million) was R1 407 million (single premium APE: R75 million). Single premiumbusiness is included at 10% of the value of the single premium.Discovery Retirement Optimisers added to existing Life Plans have been included in the value of new business (other policy alterations areshown in Table 6 as experience variances and not included as new business). Term extensions on existing contracts are not included asnew business.
(4) The annualised profit margin is the value of new business expressed as a percentage of the present value of future premiums.(5) The values shown in this table for PruHealth reflect Discovery’s 50% shareholding in PruHealth.(6) PruHealth new business is defined as individuals and employer groups which incepted during the reporting period. The new business
annualised premium income shown above has been adjusted to exclude premiums in respect of members who join an existing employergroup after the first month as well as premiums in respect of new business written during the period but only activated after 30 June 2008.
8936 Discovery ResultsBook A5:Proof 3 9/2/08 11:56 PM Page 15

16
Table 8: Embedded value economic assumptions
30 June 30 June 2008 2007
Risk discount rate (%)– Health and Vitality 14.00 11.75– Life 14.00 11.75– PruHealth 8.70 8.00
Medical inflation (%)South Africa 10.00 7.75United Kingdom Current levels Current levels
reducing to reducing to7.50% over 7.50% over
the projection the projectionperiod period
Expense inflation (%)South Africa 7.00 4.75United Kingdom 6.00% 4.00
initially,reducing to 4.00%
after two years
Pre-tax investment return (%)South Africa – Cash 9.50 7.25– Bonds 11.00 8.75– Equity 13.00 10.75United Kingdom – Cash 5.25 5.25
Dividend cover ratio 4.5 times 4.5 times
Income tax rate (%)– South Africa 28.00 29.00– United Kingdom 28.00 28.00
Projection term– Health and Vitality 20 Years 20 Years– Group Life 10 Years 10 Years– PruHealth 20 Years 20 Years
Life mortality, morbidity and lapse assumptions were derived from internal experience, where available, augmentedby reinsurance and industry information. An additional lapse rate is assumed over the next two years to allow forthe potential impact of the current economic climate on policyholder lapses.The Health lapse assumptions were based on the results of recent experience investigations. The lapse rate for theprojection term after 10 years was increased above current experience.The PruHealth assumptions were derived from internal experience augmented by industry information. Bestestimate morbidity assumptions and forecast Vitality costs allow for the impact of management actions.Renewal expense assumptions were based on the results of the latest expense and budget information. A notionalallocation of corporate overhead expenses has been made to each of the subsidiary companies based onmanagements’ view of each subsidiary’s contribution to overheads. The corporate overhead expense allocation toDestiny Health has not been included under Destiny Health in the segmental income statement.The investment return assumption was based on a single interest rate derived from the risk free zero coupon yieldcurve. Other economic assumptions were set relative to this yield. The risk discount rate has been set relative to therisk-free rate, increased by a risk premium. The current and projected tax position of the policyholder funds withinthe Life company has been taken into account in determining the net investment return assumption.For Life, it is assumed that the capital adequacy requirements in future years will be backed by surplus assetsconsisting of 100% equities for the purposes of calculating the cost of capital at risk. Allowance has been made fortax and investment expenses in the calculation of the cost of capital.
Sensitivity to the embedded value assumptionsIn order to illustrate the effect of using different assumptions, the sensitivity of the embedded value at 30 June 2008to changes in the key assumptions is shown below. For each sensitivity illustrated, all other assumptions have beenleft unchanged. No allowance has been made for management action such as risk premium increases where futureexperience is worse than the base assumptions
8936 Discovery ResultsBook A5:Proof 3 9/2/08 11:56 PM Page 16
Embedded value statement (continued)
Table 9: Embedded value sensitivities
Adjustednet worth
lessHealth and Vitality Life PruHealth
Destiny Value Cost Cost Value Cost Cost Value Cost Cost Em-run-down of in- of of of in- of of of in- of of bedded %
R million costs force capital STC force capital STC force capital STC value Change
Base 2 095 7 186 – (203) 7 317 (39) (207) 361 (36) (10) 16 464Impact of:Risk discount rate + 1% 2 095 6 815 – (187) 6 746 (50) (185) 321 (43) (9) 15 503 (6)Risk discount rate – 1% 2 095 7 596 – (224) 7 994 (27) (235) 406 (28) (12) 17 565 7Lapses + 10% 2 095 6 970 – (197) 6 912 (36) (196) 318 (34) (9) 15 823 (4)Investment return – 1%(1) 2 095 7 186 – (182) 6 901 (78) (175) 358 (46) (9) 16 050 (3)Renewal expenses + 10% 2 095 6 523 – (185) 7 250 (40) (205) 330 (36) (9) 15 723 (5)Mortality and morbidity+ 10% 2 095 7 186 – (205) 6 448 (40) (184) 48 (36) (1) 15 311 (7)Health, Vitality and PruHealth: Projection term + 1 year 2 095 7 245 – (205) 7 317 (39) (207) 381 (37) (11) 16 539 0
(1) For Life, both investment return and inflation assumptions were reduced by 1%.
The following table shows the effect of using different assumptions on the value of new business.
Table 10: Value of new business sensitivities
Health and Vitality Life PruHealth
Value Cost Cost Value Cost Cost Value Cost Cost Valueof in- of of of in- of of of in- of of of new %
R million force capital STC force capital STC force capital STC business Change
Base 213 – (6) 589 (12) (16) 48 (10) (1) 805Impact of:Risk discount rate + 1% 193 – (5) 452 (15) (14) 35 (12) (1) 633 (21)Risk discount rate – 1% 235 – (7) 715 (8) (18) 62 (8) (2) 969 20Lapses + 10% 201 – (6) 499 (11) (15) 31 (10) (1) 688 (15)Investment return – 1%(1) 213 – (5) 494 (23) (13) 47 (13) (1) 699 (13)Renewal expenses + 10% 168 – (5) 569 (12) (16) 38 (10) (1) 731 (9)Mortality and morbidity + 10% 213 – (6) 418 (12) (14) (35) (10) 1 555 (31)Health, Vitality and PruHealth: Projection term + 1 year 216 – (6) 589 (12) (16) 53 (11) (2) 811 1Acquisition expenses + 10% 195 – (6) 559 (12) (15) 38 (10) (1) 748 (7)
(1) For Life, both investment return and inflation assumptions were reduced by 1%.
17
8936 Discovery ResultsBook A5:Proof 3 9/2/08 11:56 PM Page 17
18
Review of Group resultsNew business annualised premium income and gross inflows under management include flows of the schemesDiscovery administers and 100% of the business conducted together with its joint venture partners.
New business annualised premium income excluding Destiny increased 18% for the year ended 30 June 2008.
New business annualised premium incomeJune June %
R million 2008 2007 change
Discovery Health 2 731 2 577 6Discovery Life 1 407 971 45Discovery Vitality 103 100 3PruHealth 533 418 28PruProtect 25 –
New business API excluding Destiny 4 799 4 066 18Destiny Health 345 768 (55)
New business API of Group 5 144 4 834 6
Gross inflows under management increased 16% for the year ended 30 June 2008.
Gross inflows under managementJune June %
R million 2008 2007 change
Discovery Health 21 118 18 828 12Discovery Life 3 719 2 357 58Discovery Vitality 813 721 13Destiny Health 999 1 449 (31)PruHealth 1 040 556 87PruProtect 15 –
Gross inflows under management 27 704 23 911 16Less: collected on behalf of third parties (20 088) (17 338) 16
Discovery Health (18 637) (16 532)Discovery Life (601) –Destiny Health (323) (528)PruHealth (520) (278)PruProtect (7) –
Gross income of Group 7 616 6 573 16
EarningsThe following table shows the main components of the increase in Group profit from operations for the yearended 30 June:
Earnings sourceJune June %
R million 2008 2007 change
Discovery Health 891 736 21Discovery Life 978 707 38Discovery Vitality 49 43 14PruHealth (155) (218) 29
Operating profit from established businesses 1 763 1 268 39Discovery Invest (157) –PruProtect (134) (36) >100Destiny Health (192) (102) (88)
Group operating profit before investment income and unbundling costs 1 280 1 130 13Unbundling costs (18) –Investment income 210 175 20Realised gains on shareholders’ portfolios 252 195 29Investment returns on assets backing policyholder liabilities 25 151 (83)Fair value adjustment to liabilities under investment contracts (14) (141) 90
Profit from operations before BEE expenses 1 735 1 510 15
8936 Discovery ResultsBook A5:Proof 3 9/2/08 11:56 PM Page 18
19
Review of Group results (continued)
Headline earningsThe reconciliation between earnings and headline earnings is shown below:
June June %R million 2008 2007 change
Net profit attributable to equity shareholders 1 156 1 073 8Adjusted for: – realised profit on available-for-sale investments net of CGT (222) (187)
Headline earnings 934 886 5BEE expenses 23 34
Headline earnings before BEE transaction 957 920 4
Headline earnings per share before BEE transaction (cents):– undiluted 176,2 171,5 3– diluted 174,7 168,4 4
Headline earnings per share (cents):– undiluted 172,0 165,2 4– diluted 170,6 162,2 5Weighted number of shares in issue (000’s) 543 016 536 560Diluted weighted number of shares (000’s) 547 530 546 579
TaxationAll South African entities are in a tax paying position. South African income tax has been provided at 28% (2007:29%) and secondary tax on companies at 10% in the financial statements and embedded value statements.Destiny operations have significant tax losses but no deferred tax asset has been accounted for on the foreignlosses incurred in the US.
Discovery obtains tax relief on half of the PruHealth losses and 100% of the PruProtect start-up losses throughPrudential Assurance Company Limited (“Prudential”) in the UK.
R27 million has been included in finance charges relating to a settlement discount on early payment by Prudentialfor UK tax losses ceded to them.
InvestmentsInvestments have increased due to the sale of the new Discovery Invest products. These investments directlymatch the policyholder liabilities. Discovery Invest was launched in October 2007.
Balance sheetThe increase in the assets arising from insurance contracts of R806 million is as a result of profitable new businesswritten by Discovery Life.
The deferred tax liability is primarily attributable to the application of the Financial Services Board directive 145.This directive allows for the zeroing on a statutory basis of the assets arising from insurance contracts.The statutory basis is used when calculating tax payable for Discovery Life, resulting in a timing differencebetween the tax base and the accounting base.
Accounting policiesThe annual financial statements have been prepared in accordance with International Financial ReportingStandards (IFRS) including IAS 34, as well as the South African Companies Act 61 of 1973, as amended, and areconsistent with the accounting policies applied in the annual report and the corresponding prior year period.
8936 Discovery ResultsBook A5:Proof 3 9/2/08 11:56 PM Page 19
20
Share-based paymentsThe issue of 38.7 million shares by Discovery in terms of its BEE transaction in 2005 has been accounted for interms of IFRS 2. These shares are not accounted for as issued in the consolidated accounts of Discovery butrather as a share option transaction. These shares have been considered in the calculation of diluted HEPS anddiluted EPS.
The BEE transaction has resulted in a charge to the income statement of R23 million in the year ended 30 June2008 (2007: R34 million) in accordance with the requirements of IFRS 2.
An additional R19 million (2007: R63 million) in respect of options granted under employee share incentiveschemes has been expensed in the income statement for the year in accordance with the requirements of IFRS 2.
Discovery has acquired cash-settled share options to hedge approximately 66.6% of its obligations in respect ofoptions granted under the employee share incentive scheme.
DirectorateMr AL Owen was appointed as a non-executive director of the board of Discovery with effect from 6 December2007. With effect from 1 January 2008, Mr P Cooper and Ms T Slabbert were appointed as non-executivedirectors of the board of Discovery.
Mr LL Dippenaar, Mr PK Harris and Mr JP Burger resigned as non-executive directors of the board of Discoverywith effect from 31 December 2007.
Dividend policy and capitalAn interim dividend of 21.5 cents per share was paid on 25 March 2008.The directors are of the view that the Discovery Group is adequately capitalised at this time.On the statutory basis the capital adequacy requirements of Discovery Life were R174 million (2007: R145 million)and were covered 7.0 times (2007: 10.7 times).
Cash dividend declaration:The board has declared a final dividend of 23 cents per share. The salient dates are as follows:– Last date to trade “cum” dividend Friday, 10 October 2008– Date trading commences “ex” dividend Monday, 13 October 2008– Record date Friday, 17 October 2008– Date of payment Monday, 20 October 2008
Share certificates may not be dematerialised or rematerialised between Monday, 13 October 2008 and Friday,17 October 2008, both days inclusive.
AuditThe auditors, PricewaterhouseCoopers Inc, have issued their opinion on the Group financial statements for theyear ended 30 June 2008. A copy of the auditors’ unqualified report is available for inspection at the company’sregistered office.
8936 Discovery ResultsBook A5:Proof 3 9/2/08 11:56 PM Page 20
www.discovery.co.za
Transfer secretariesComputershare Investor Services (Pty) Limited (Registration number 2004/003647/07) Ground Floor, 70 Marshall Street, Johannesburg, 2001 PO Box 61051, Marshalltown, 2107
SponsorsRand Merchant Bank (A division of FirstRand Bank Limited)
Secretary and registered officeMJ Botha Discovery Holdings Limited 155 West Street, Sandton, 2146 (Incorporated in the Republic of South Africa) PO Box 786722, Sandton, 2146 (Registration number: 1999/007789/06)Tel: 011 529 2888 JSE share code: DSY Fax: 011 529 2958 ISIN: ZAE000022331
DirectorsMI Hilkowitz (Chairperson), A Gore* (Chief Executive Officer), Dr BA Brink, JP Burger****,P Cooper***, LL Dippenaar****, Dr NJ Dlamini, SB Epstein (USA), PK Harris****,NS Koopowitz*, Dr TV Maphai, HP Mayers*, AL Owen (UK)**, A Pollard*, JM Robertson* (CIO),SE Sebotsa, T Slabbert***, B Swartzberg*, SV Zilwa
*Executive **Appointed 6 December 2007 ***Appointed 1 January 2008 **** Resigned 31 December 2007
8936 Discovery ResultsBook A5:Proof 3 9/2/08 11:56 PM Page 21