Embed Size (px)
Citation preview
Australian Bank and Corporate Sector Vulnerabilities—An International
Perspective
Előd Takáts and Patrizia Tumbarello
WP/09/223

© 2009 International Monetary Fund WP/09/223 IMF Working Paper Asia and Pacific Department Australian Bank and Corporate Sector Vulnerabilities—An International Perspective
Prepared by Előd Takáts and Patrizia Tumbarello1
Authorized for distribution by Ray Brooks
October 2009
Abstract
This Working Paper should not be reported as representing the views of the IMF. The views expressed in this Working Paper are those of the author(s) and do not necessarily represent those of the IMF or IMF policy. Working Papers describe research in progress by the author(s) and are published to elicit comments and to further debate.
This paper focuses on how the exposure to the corporate sector may impact the health of the Australian banking system. It also compares Australian banks with their international peers. Finally, it investigates banks’ exposure to credit risk using the new Basel II Pillar 3 disclosure data. The analysis shows that Australian banks have remained very sound by international standards, despite the global financial turmoil. While the international downturn points to several vulnerabilities, the risks from the corporate and household sectors appear to be manageable. JEL Classification Numbers: G13, G21, L25 Keywords: Australia, contingent claim analysis, bank asset quality, stress tests Author’s E-Mail Address: [email protected] and [email protected]
1 We wish to thank the Australian Treasury, the Reserve Bank of Australia and the Australian Prudential Regulation Authority officials for their valuable suggestions and comments on early drafts of this paper. We also would like to thank Sonali Jain-Chandra, Papa N'Diaye and Kenici Ueda for their suggestions. We are particularly grateful to Ray Brooks for his guidance and comments. Kessia De Leo, Khoi Nguyen, and Ranee Sirihorachai provided excellent research and editorial assistance. This paper is based on information available as of July 2009.

2
Contents Page I. Introduction....................................................................................................................3 II. The Global Turmoil: Impact on Australian Banks ........................................................3 III. How Would Banks Handle a Jump in Corporate Defaults? ..........................................7 IV. International Comparison of Australian Banks............................................................10 V. Asset Quality Shocks ...................................................................................................14 References....................................................................................................................22 Tables 1. Selected Financial Soundness Indicators of the Banking Sector ...................................4 2. Australia’s Four Largest Banks: Selected Financial Soundness Indicators...................5 3. Australian Banks’ Liabilities .........................................................................................6 4. Effects of Corporate Sector Distress on the Banking Sector: CCA Results ................10 5. Leverage of Australian Banks......................................................................................11 6. Deposit Ratio of Australian Banks ..............................................................................11 7. Liquidity Ratio of Australian Banks ............................................................................11 8. Banking Sector Financial Soundness Indicators for Australia and Comparator Countries, 2007......................................................................................................14 9. Losses Under Risk Category Shifting and 40 Percent Mortgage LGD Floor Assumption ............................................................................................................16 10. Impact on the Capital of the Four Large Banks Risk Shifting and 40 Percent
Mortgage LGD Floor Assumption.........................................................................17 11. Losses Under Six-Times Probability of Default and 40 Percent Mortgage LGD Floor Assumption ..................................................................................................18 12. Impact Under Six-Times PD Increase and 40 Percent Mortgage LGD Floor Assumption ............................................................................................................18 13. Corporate Loan Losses ................................................................................................19 Figures 1. Asset Quality..................................................................................................................5 2. Banks’ Bond Issuance....................................................................................................6 3. Selected Balance Sheet and Market-Based Indicators for Nonfinancial Firms.............8 4. Nonfinancial Corporate Sector: Annual Average Expected Losses One Year Ahead ..9 5. Banking Sector: Expected Losses from Corporate Sector Distress One Year Ahead ...9 6. Banking Sector Developments.....................................................................................12 7. Share Price Evolution (2006–09) and Leverage (end-2006) .......................................13 8. Share Price Evolution (2006–09) and Deposit Ratio (end-2006) ................................13 9. Share Price Evolution (2006–09) and Liquidity Ratio (end-2006)..............................13 10. Corporate Loan and Mortgage Distribution by Risk Categories .................................15 Appendix Contingent Claim Analysis ......................................................................................................20

3
I. INTRODUCTION
1. The Australian banking sector entered the financial turmoil in a sound position and has been resilient to the global crisis. Banks’ capital ratios are well above the regulatory requirements. The major banks’ AA credit ratings have remained unchanged since the crisis unfolded, and they were able to raise private equity capital in the midst of the global crisis. Impaired assets are still low by international standards, although they have increased in the past year.
2. The international downturn points to several vulnerabilities. On the liabilities side, banks remain exposed to rollover risks on short-term wholesale funding. On the assets side, banks are vulnerable to the household sector as well as to possible corporate sector distress.
3. Nonetheless, the risks from the corporate and household sectors appear to be manageable.2 Results from contingent claim analysis suggest that Australian banks’ potential losses from their corporate exposures could amount to as much as 2 percent of total banking sector loans, less than in other countries in the region. Analysis of banks’ exposure to the corporate and household sectors shows that banks are able to withstand potential losses from sizable shocks to their loan portfolio. These results should be interpreted with caution as they are not rigorous stress tests. The Australian Prudential Regulation Authority (APRA) has regularly stress tested the banking system but it would be advisable to undertake more extreme stress-test scenarios than applied in the past and include Australia’s overseas subsidiaries.
II. THE GLOBAL TURMOIL: IMPACT ON AUSTRALIAN BANKS
4. The impact of the global financial crisis on banks’ asset quality has been limited so far. This reflects banks’ small exposure to U.S. and domestic securitized assets and to U.S. investment vehicles holding structured finance products.3, 4 Australian banks’ balance sheets are heavily weighted toward domestic loans, in particular the low-risk households. Conservative capital adequacy rules imposed by APRA and regular stress testing of banks
2 An analysis of banks’ exposure to the housing sector was presented in Australia: Selected Issues, IMF Country Report No. 08/311, D. Rozhkov, 2008.
3 The stock of residential mortgage-backed securities (RMBS) and asset-backed commercial paper (ABCP) outstanding was about $A 160 billion in March 2009, about 40 percent below the peak of mid 2007, but is small compared with total financial sector credit of about $A 1,900 billion. Moreover, most of banks’ RMBS operations were generally carried out as true sales to unrelated parties not to banks’ own special purpose vehicles or other off-balance sheet entities. Investors’ capital losses on RMBS holdings have been limited by lenders mortgage insurance and credit enhancements from profits of the securitization vehicles.
4 Information reported in the largest banks’ disclosure statements indicates either no direct exposure to U.S. securitized assets (Westpac and the Commonwealth Bank of Australia), or limited exposure. In particular, Australia and New Zealand Banking Group Limited (ANZ) has reported an exposure of about $A 500 million to U.S. asset-backed securities (ABS); and the National Australia Bank (NAB) has disclosed $A 360 million exposure to U.S. ABS collateralized debt obligations (CDOs) and $A 1 billion exposure to U.S. credit wrapped ABS.
4
helped limit risks. The large banks are less leveraged than banks in comparable countries (Section IV). On the liabilities side, however, banks had sizable short-term external debt obligations, and access to offshore wholesale markets was disrupted by the Lehman Brothers collapse in September 2008. Policy measures introduced to cope with the crisis, such as wholesale funding guarantees and guarantees on all deposits under a million dollars introduced in October 2008, have allowed banks to continue to access international capital markets and helped ensure liquidity.
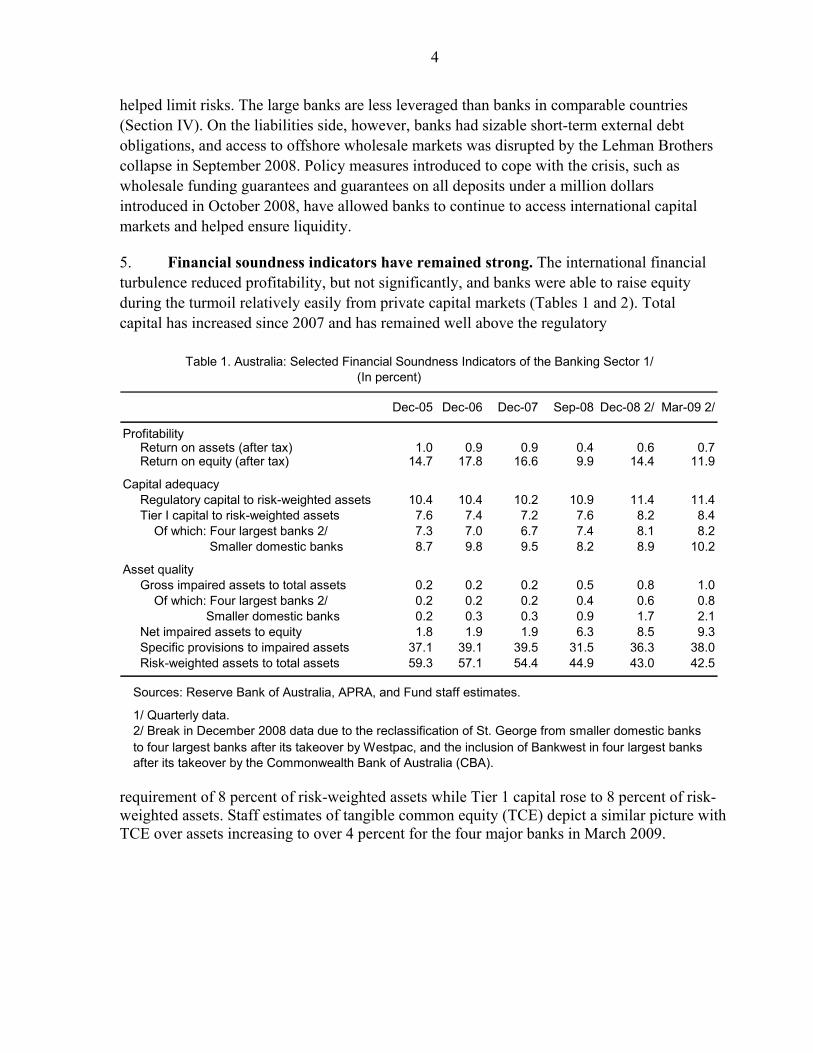
5. Financial soundness indicators have remained strong. The international financial turbulence reduced profitability, but not significantly, and banks were able to raise equity during the turmoil relatively easily from private capital markets (Tables 1 and 2). Total capital has increased since 2007 and has remained well above the regulatory
Dec-05 Dec-06 Dec-07 Sep-08 Dec-08 2/ Mar-09 2/
Profitability Return on assets (after tax) 1.0 0.9 0.9 0.4 0.6 0.7 Return on equity (after tax) 14.7 17.8 16.6 9.9 14.4 11.9
Capital adequacy Regulatory capital to risk-weighted assets 10.4 10.4 10.2 10.9 11.4 11.4 Tier I capital to risk-weighted assets 7.6 7.4 7.2 7.6 8.2 8.4
Of which: Four largest banks 2/ 7.3 7.0 6.7 7.4 8.1 8.2 Smaller domestic banks 8.7 9.8 9.5 8.2 8.9 10.2
Asset quality Gross impaired assets to total assets 0.2 0.2 0.2 0.5 0.8 1.0
Of which: Four largest banks 2/ 0.2 0.2 0.2 0.4 0.6 0.8Smaller domestic banks 0.2 0.3 0.3 0.9 1.7 2.1
Net impaired assets to equity 1.8 1.9 1.9 6.3 8.5 9.3 Specific provisions to impaired assets 37.1 39.1 39.5 31.5 36.3 38.0 Risk-weighted assets to total assets 59.3 57.1 54.4 44.9 43.0 42.5
Sources: Reserve Bank of Australia, APRA, and Fund staff estimates.
1/ Quarterly data.2/ Break in December 2008 data due to the reclassification of St. George from smaller domestic banks to four largest banks after its takeover by Westpac, and the inclusion of Bankwest in four largest banks after its takeover by the Commonwealth Bank of Australia (CBA).
(In percent)Table 1. Australia: Selected Financial Soundness Indicators of the Banking Sector 1/
requirement of 8 percent of risk-weighted assets while Tier 1 capital rose to 8 percent of risk-weighted assets. Staff estimates of tangible common equity (TCE) depict a similar picture with TCE over assets increasing to over 4 percent for the four major banks in March 2009.

5
Mar-09 Sep-08 Mar-09 Sep-08 Dec-08 Jun-08 Mar-09 Sep-08
ProfitabilityReturn on assets 0.5 0.6 0.6 0.6 0.8 1.1 0.8 1.0Return on equity 10.3 10.7 12.7 11.9 12.7 11.9 14.3 21.0Net interest margin 2.2 2.0 2.1 2.3 2.0 2.0 2.2 2.1
Capital adequacyTier one capital ratio (Basel II) 8.2 7.7 8.3 7.3 8.8 8.2 8.4 7.8Total capital ratio (Basel II) 11.0 11.1 12.2 10.9 11.4 11.6 11.4 10.8TCE/total assets 2/ 4.9 4.9 4.4 4.0 3.6 3.8 4.2 4.0
TCE/tangible assets 3/ 4.9 4.9 4.5 4.1 3.7 3.9 4.3 4.0
Assets quality and provisioning Past due 90 days plus/total loans 0.5 0.3 0.5 0.3 0.4 0.3 0.3 0.2
Gross impaired to total assets 0.7 0.4 0.6 0.3 0.4 0.1 0.6 0.2Net impaired assets to equity 8.3 4.2 7.3 4.6 5.3 1.5 5.2 3.6Specific provision to gross impaired assets 36.1 36.9 32.5 30.0 41.8 40.8 42.9 32.6Total provision to gross impaired assets 110.4 198.1 105.6 137.9 131.8 250.8 125.6 167.8
LiquidityCash to total assets 5.3 5.3 2.7 2.8 2.0 1.6 0.7 0.9Cash and due from banks to total assets 6.4 7.4 7.2 9.9 4.4 3.0 4.8 6.3
Sources: Banks' disclosure statements, and Fund staff calculations.
1/ Includes St. George.2/ TCE = tangible common equity = total equity minus intangible assets (including goodwill).3/ Tangible assets = total assets minus intangible assets (including goodwill).
Table 2. Australia's Four Largest Banks: Selected Financial Soundness Indicators
CBAANZ NAB Westpac 1/
(In percent)
6. However, a deterioration in banks’ asset quality has been evident since early 2008 (Figure 1). Past due loans plus impaired assets rose to around 1 percent of total assets for the four largest banks as of March 2009, and several large banks have increased their specific provisions for bad loans. Gross impaired assets for the smaller domestic banks have deteriorated more than for the four larger banks, with past due plus impaired assets for all banks reaching almost 1½ percent of assets in March 2009 and for smaller domestic banks
Figure 1. Asset Quality(Percent)
0
10
20
30
40
50
60
70
80
90
100
1996 1997 1998 1999 2000 2001 2002 2003 2004 2005 2006 2007 2008 2009
0.0
0.2
0.4
0.6
0.8
1.0
1.2
1.4
1.6
1.8
2.0
Specific provisions to impaired assets (lhs)
Impaired assets plus past-due to total assets (rhs)
Impaired assets to total assets (rhs)
Source: Reserve Bank of Australia.

6
nearly 3 percent. This mainly reflects smaller banks’ relatively large exposures to some lower quality commercial property and to a lesser extent their higher share of low-doc lending.5 Nevertheless, the aggregate Tier 1 capital of the smaller domestic banks was more than 10 percent as of March 2009.
7. A key remaining vulnerability is the roll-over risk associated with sizable short-term external debt. Banks’ wholesale funding (domestic and offshore) accounts for about 50 percent of total funding, of which about 60 percent is offshore (Table 3). Financial institutions short-term external debt (on a residual maturity basis) is estimated by staff at about $A 400 billion (35 percent of GDP) in March 2009.
Dec 06 Dec 07 Dec 08 Jun 09
Deposits 41.5 39.3 42.5 45.3Domestic wholesale funding 23.3 26.7 24.7 21.1Offshore wholesale funding 29.0 28.2 28.7 30.0Securitization 6.2 5.8 4.1 3.6
Total funding liabilities 1/ 100.0 100.0 100.0 100.0Memorandum item:Equity (as a percent of total liabilities) 5.8 5.6 6.2 6.6
Sources: APRA, Reserve Bank of Australia, and Fund staff calculations.
1/ Excluding equity.
Table 3. Australia: Australian Banks' Liabilities (Percent of total)
0
5
10
15
20
25
30
Jan-06 Jul-06 Jan-07 Jul-07 Jan-08 Jul-08 Jan-09 Jul-09
0
5
10
15
20
25
30
Offshore guaranteedDomestic guaranteedOffshore nonguaranteedDomestic nonguaranteed
Source: Reserve Bank of Australia.
Figure 2. Banks' Bond Issuance(In billions of Australian dollars)
8. The establishment of deposit and wholesale funding guarantees in October 2008 helped maintain confidence in the financial sector. As a result, banks were able to raise about $A 140 billion between December 2008 and early July 2009 (Figure 2) and have rolled over short-term debt. Recognizing the increased importance of liquidity and rollover risks associated with short-term liabilities, banks have started to increase medium-term funding.
5 As of September 2008, total commercial property exposures of smaller domestic banks amounted to $A 33 billion—about 12 percent of smaller banks’ total assets—with specific provisions and security held accounting for 97 percent of impaired commercial property exposures.
7
III. How Would Banks Handle a Jump in Corporate Defaults?
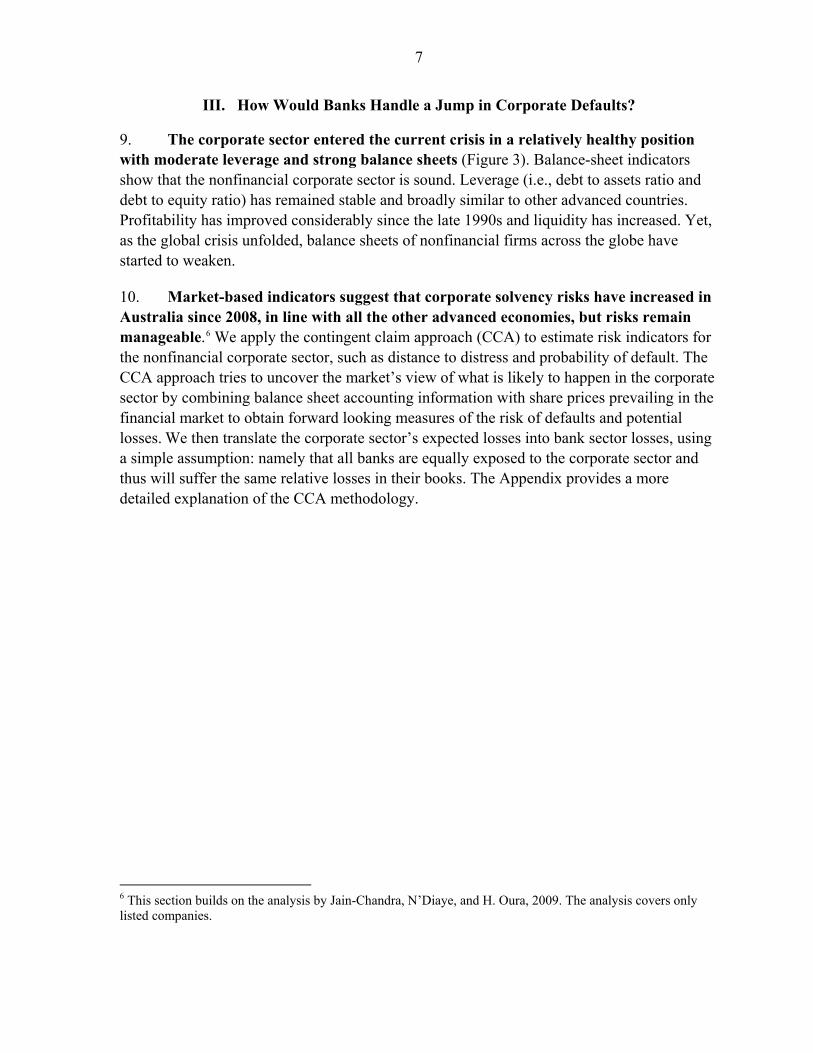
9. The corporate sector entered the current crisis in a relatively healthy position with moderate leverage and strong balance sheets (Figure 3). Balance-sheet indicators show that the nonfinancial corporate sector is sound. Leverage (i.e., debt to assets ratio and debt to equity ratio) has remained stable and broadly similar to other advanced countries. Profitability has improved considerably since the late 1990s and liquidity has increased. Yet, as the global crisis unfolded, balance sheets of nonfinancial firms across the globe have started to weaken.
10. Market-based indicators suggest that corporate solvency risks have increased in Australia since 2008, in line with all the other advanced economies, but risks remain manageable.6 We apply the contingent claim approach (CCA) to estimate risk indicators for the nonfinancial corporate sector, such as distance to distress and probability of default. The CCA approach tries to uncover the market’s view of what is likely to happen in the corporate sector by combining balance sheet accounting information with share prices prevailing in the financial market to obtain forward looking measures of the risk of defaults and potential losses. We then translate the corporate sector’s expected losses into bank sector losses, using a simple assumption: namely that all banks are equally exposed to the corporate sector and thus will suffer the same relative losses in their books. The Appendix provides a more detailed explanation of the CCA methodology.
6 This section builds on the analysis by Jain-Chandra, N’Diaye, and H. Oura, 2009. The analysis covers only listed companies.
8
Figure 3. Selected Balance Sheet and Market-Based Indicators for Nonfinancial Firms 1/
Leverage has remained stable in Australia… …since the early 1990s.
10
20
30
40
50
60
1991 1995 1999 2003 2007
10
20
30
40
50
60
AUS CANNZ US
Debt to Assets Ratio
0
50
100
150
200
250
300
1991 1995 1999 2003 2007
0
50
100
150
200
250
300
AUS CANNZ US
Debt to Equity Ratio
Profitability fell in Australia in 2008 but remained slightly above
other countries…
…and liquidity has increased in Australia.
2
4
6
8
10
12
14
16
18
1991 1995 1999 2003 2007
2
4
6
8
10
12
14
16
18
AUS UKNZ US
Retun on Assets
0
10
20
30
40
50
1991 1995 1999 2003 2007
0
10
20
30
40
50
AUS UKNZ US
Interest Coverage Ratio
CAP weighted average. Earnings before interest and taxes to interest payments falling
However, risk default indicators have worsened recently…
…with the probability of default jump in 2008.
5
10
15
20
25
1992 1996 2000 2004 2008
5
10
15
20
25
AUS UK
NZ US
CAN
Distance to Default
0
1
2
3
4
5
6
7
8
9
10
11
12
1994 1996 1998 2000 2002 2004 2006 2008
0
1
2
3
4
5
6
7
8
AUS UK
NZ US
CAN
Probability of Default
Sources: Worldscope and Fund staff calculations. 1/ Listed companies, only, CAP-weighted average.
9
11. Compared to simple accounting ratios, default risk indicators have two main advantages: they are forward looking and they combine various dimensions of risk into a single statistic, which gives the overall impact on vulnerability from potentially offsetting changes, such as a rise in leverage versus a rise in profitability. The default risk of a firm is computed from its balance sheet and equity price data under the assumption that the equity market price should incorporate investors’ estimate of the company’s default risk. On the other hand, balance sheet indicators based on accounting data are backward looking indicators that can deteriorate rapidly under stress.
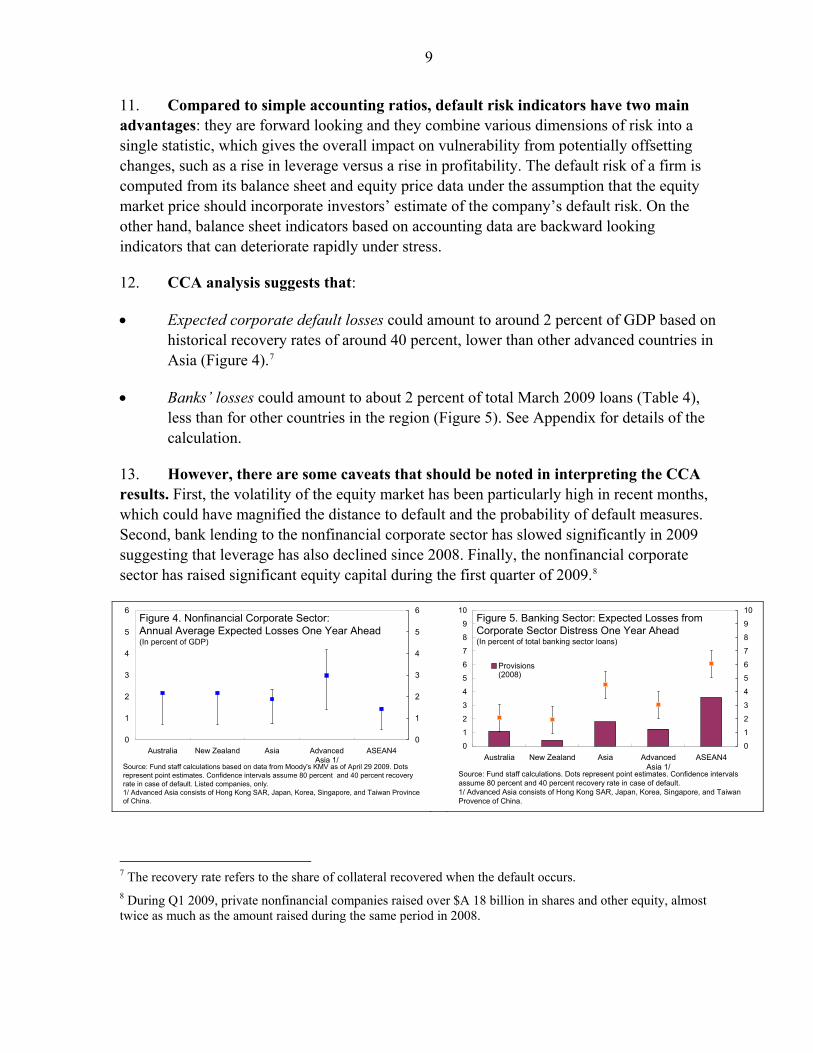
12. CCA analysis suggests that:
Expected corporate default losses could amount to around 2 percent of GDP based on historical recovery rates of around 40 percent, lower than other advanced countries in Asia (Figure 4).7
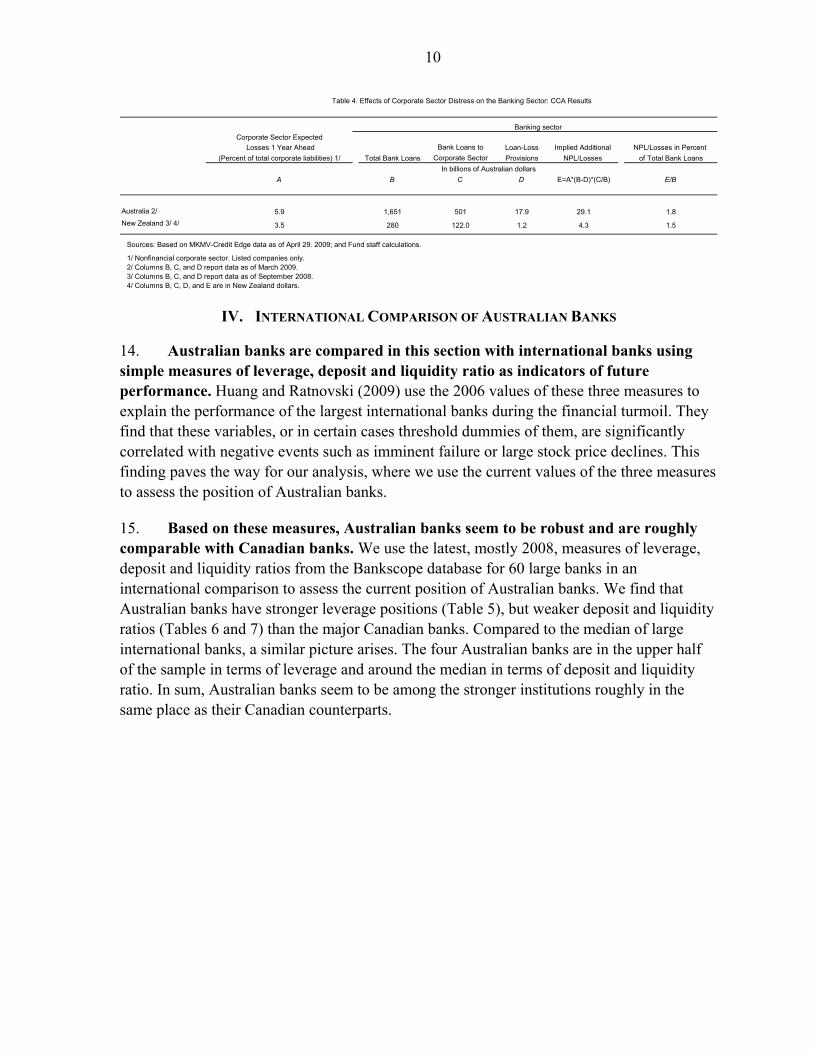
Banks’ losses could amount to about 2 percent of total March 2009 loans (Table 4), less than for other countries in the region (Figure 5). See Appendix for details of the calculation.
13. However, there are some caveats that should be noted in interpreting the CCA results. First, the volatility of the equity market has been particularly high in recent months, which could have magnified the distance to default and the probability of default measures. Second, bank lending to the nonfinancial corporate sector has slowed significantly in 2009 suggesting that leverage has also declined since 2008. Finally, the nonfinancial corporate sector has raised significant equity capital during the first quarter of 2009.8
0
1
2
3
4
5
6
Australia New Zealand Asia AdvancedAsia 1/
ASEAN4
0
1
2
3
4
5
6Figure 4. Nonfinancial Corporate Sector:Annual Average Expected Losses One Year Ahead(In percent of GDP)
Source: Fund staff calculations based on data from Moody's KMV as of April 29 2009. Dots represent point estimates. Confidence intervals assume 80 percent and 40 percent recovery rate in case of default. Listed companies, only.1/ Advanced Asia consists of Hong Kong SAR, Japan, Korea, Singapore, and Taiwan Province of China.
0
1
2
3
4
5
6
7
8
9
10
Australia New Zealand Asia AdvancedAsia 1/
ASEAN4
0
1
2
3
4
5
6
7
8
9
10
Provisions(2008)
Figure 5. Banking Sector: Expected Losses from Corporate Sector Distress One Year Ahead(In percent of total banking sector loans)
Source: Fund staff calculations. Dots represent point estimates. Confidence intervals assume 80 percent and 40 percent recovery rate in case of default. 1/ Advanced Asia consists of Hong Kong SAR, Japan, Korea, Singapore, and Taiwan Provence of China.
7 The recovery rate refers to the share of collateral recovered when the default occurs. 8 During Q1 2009, private nonfinancial companies raised over $A 18 billion in shares and other equity, almost twice as much as the amount raised during the same period in 2008.
10
Losses 1 Year Ahead Bank Loans to Loan-Loss Implied Additional NPL/Losses in Percent
Total Bank Loans Corporate Sector Provisions NPL/Losses of Total Bank Loans
A B C D E=A*(B-D)*(C/B) E/B
Australia 2/ 5.9 1,651 501 17.9 29.1 1.8
New Zealand 3/ 4/ 3.5 280 122.0 1.2 4.3 1.5
Sources: Based on MKMV-Credit Edge data as of April 29. 2009; and Fund staff calculations.
1/ Nonfinancial corporate sector. Listed companies only.2/ Columns B, C, and D report data as of March 2009.3/ Columns B, C, and D report data as of September 2008.4/ Columns B, C, D, and E are in New Zealand dollars.
Corporate Sector Expected
(Percent of total corporate liabilities) 1/
Banking sector
Table 4. Effects of Corporate Sector Distress on the Banking Sector: CCA Results
In billions of Australian dollars
IV. INTERNATIONAL COMPARISON OF AUSTRALIAN BANKS
14. Australian banks are compared in this section with international banks using simple measures of leverage, deposit and liquidity ratio as indicators of future performance. Huang and Ratnovski (2009) use the 2006 values of these three measures to explain the performance of the largest international banks during the financial turmoil. They find that these variables, or in certain cases threshold dummies of them, are significantly correlated with negative events such as imminent failure or large stock price declines. This finding paves the way for our analysis, where we use the current values of the three measures to assess the position of Australian banks.
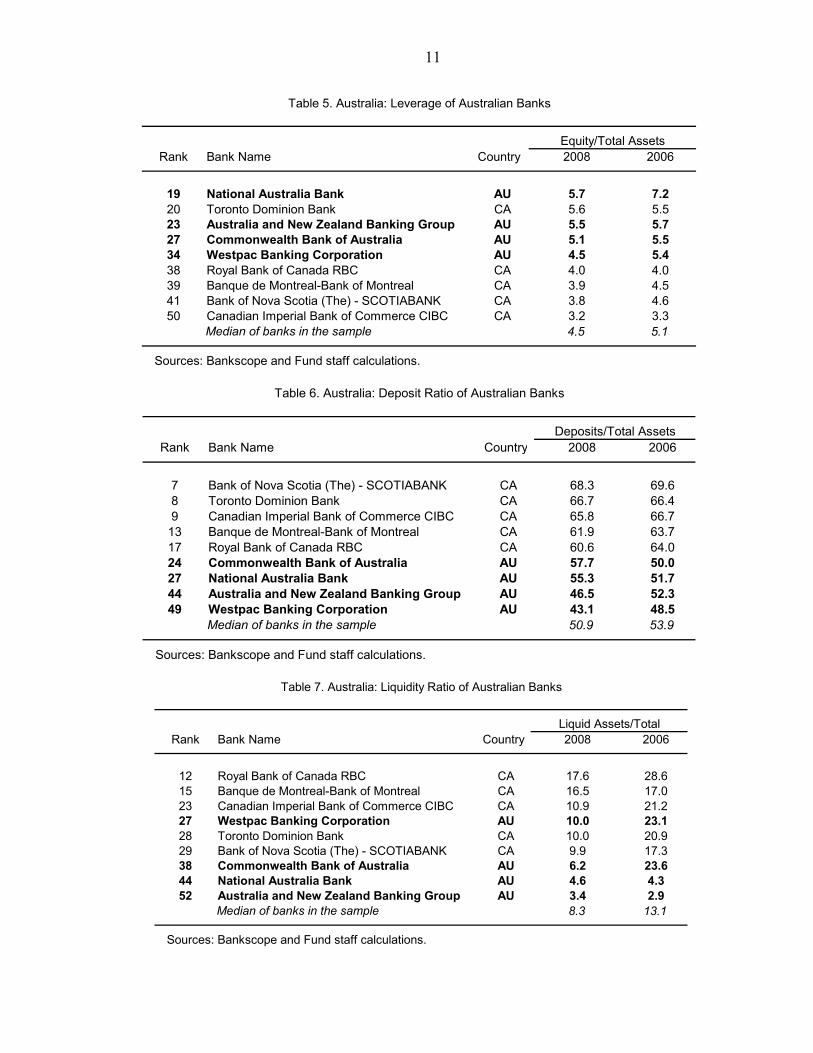
15. Based on these measures, Australian banks seem to be robust and are roughly comparable with Canadian banks. We use the latest, mostly 2008, measures of leverage, deposit and liquidity ratios from the Bankscope database for 60 large banks in an international comparison to assess the current position of Australian banks. We find that Australian banks have stronger leverage positions (Table 5), but weaker deposit and liquidity ratios (Tables 6 and 7) than the major Canadian banks. Compared to the median of large international banks, a similar picture arises. The four Australian banks are in the upper half of the sample in terms of leverage and around the median in terms of deposit and liquidity ratio. In sum, Australian banks seem to be among the stronger institutions roughly in the same place as their Canadian counterparts.
11
Rank Bank Name Country 2008 2006
19 National Australia Bank AU 5.7 7.220 Toronto Dominion Bank CA 5.6 5.523 Australia and New Zealand Banking Group AU 5.5 5.727 Commonwealth Bank of Australia AU 5.1 5.534 Westpac Banking Corporation AU 4.5 5.438 Royal Bank of Canada RBC CA 4.0 4.039 Banque de Montreal-Bank of Montreal CA 3.9 4.541 Bank of Nova Scotia (The) - SCOTIABANK CA 3.8 4.650 Canadian Imperial Bank of Commerce CIBC CA 3.2 3.3
4.5 5.1
Sources: Bankscope and Fund staff calculations.
Equity/Total Assets
Median of banks in the sample
Table 5. Australia: Leverage of Australian Banks
Rank Bank Name Country 2008 2006
7 Bank of Nova Scotia (The) - SCOTIABANK CA 68.3 69.68 Toronto Dominion Bank CA 66.7 66.49 Canadian Imperial Bank of Commerce CIBC CA 65.8 66.7
13 Banque de Montreal-Bank of Montreal CA 61.9 63.717 Royal Bank of Canada RBC CA 60.6 64.024 Commonwealth Bank of Australia AU 57.7 50.027 National Australia Bank AU 55.3 51.744 Australia and New Zealand Banking Group AU 46.5 52.349 Westpac Banking Corporation AU 43.1 48.5
50.9 53.9
Sources: Bankscope and Fund staff calculations.
Deposits/Total Assets
Median of banks in the sample
Table 6. Australia: Deposit Ratio of Australian Banks
Rank Bank Name Country 2008 2006
12 Royal Bank of Canada RBC CA 17.6 28.615 Banque de Montreal-Bank of Montreal CA 16.5 17.023 Canadian Imperial Bank of Commerce CIBC CA 10.9 21.227 Westpac Banking Corporation AU 10.0 23.128 Toronto Dominion Bank CA 10.0 20.929 Bank of Nova Scotia (The) - SCOTIABANK CA 9.9 17.338 Commonwealth Bank of Australia AU 6.2 23.644 National Australia Bank AU 4.6 4.352 Australia and New Zealand Banking Group AU 3.4 2.9
8.3 13.1
Sources: Bankscope and Fund staff calculations.
Liquid Assets/Total
Median of banks in the sample
Table 7. Australia: Liquidity Ratio of Australian Banks

12
16. Furthermore, market based indicators seem to support the similarity between Australian and Canadian banks (Figure 6). The market based equity price and CDS spread indicators show very strong co-movement among the four major Australian banks. The similarity between Australian and Canadian banks is also supported by the strong correlation between their equity indicators, and also by the divergence shown with other advanced countries.
Figure 6. Australia: Banking Sector Developments
.
Bank Equity Prices(March 2007=100)
40
60
80
100
120
140
160
Mar-07 Jul-07 Nov-07 Mar-08 Jul-08 Nov-08 Mar-09 Jul-09
40
60
80
100
120
140
160
Westpac Banking Corp.Commonwealth Bank ANZNational Australia Bank
Source: Bloomberg.
Bank Equity Prices(March 2007=100)
0
20
40
60
80
100
120
140
Mar-07 Jul-07 Nov-07 Mar-08 Jul-08 Nov-08 Mar-09 Jul-09
0
20
40
60
80
100
120
140
Canada (4 largest)Australia (4 largest)Euro Area (wider group)United States (4 largest)United Kingdom (4 largest)
Source: Bloomberg.
Credit Default Swaps
0
50
100
150
200
250
300
Mar-07 Jun-07 Sep-07 Dec-07 Mar-08 Jun-08 Sep-08 Dec-08 Mar-09 Jun-09
0
50
100
150
200
250
300
ANZCommonwealth BankWestpac National Australia Bank
Source: Bloomberg.
0
100
200
300
400
500
600
Jul-07 Nov-07 Mar-08 Jul-08 Nov-08 Mar-09 Jul-09
0
100
200
300
400
500
600
United States (4 largest)
United Kingdom (4 largest)
Australia (4 largest)
Euro Area (wider group)
Credit Default Swap (CDS) Spreads 1/(5-year, average largest banks)
Source: Bloomberg.
13
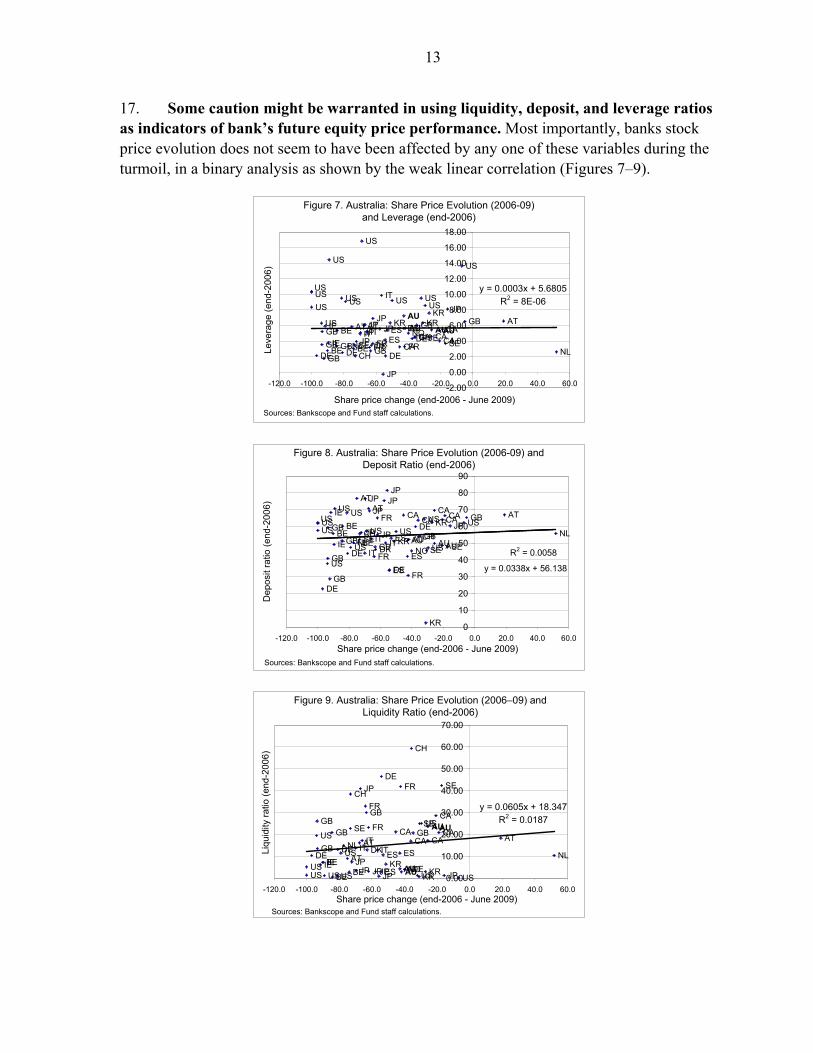
17. Some caution might be warranted in using liquidity, deposit, and leverage ratios as indicators of bank’s future equity price performance. Most importantly, banks stock price evolution does not seem to have been affected by any one of these variables during the turmoil, in a binary analysis as shown by the weak linear correlation (Figures 7–9).
Figure 7. Australia: Share Price Evolution (2006-09) and Leverage (end-2006)
US
US
US
KRAU
USUS
IT
CH
CA
SE
US
JP
JPGB
FRSE
KRGB
CA
JP
US
AT
GB
SE
JPAU
JP
JP
GB
KR
BE JP
USIT
NLDE
GB
GBIT
BE
ATNO
BEDE
DKCH
FR
AU
DE
US
US
US
CAFRDE
GB
CA CAIE
US
ATES
ESES AUIE
NL
y = 0.0003x + 5.6805
R2 = 8E-06
-2.00
0.00
2.00
4.00
6.00
8.00
10.00
12.00
14.00
16.00
18.00
-120.0 -100.0 -80.0 -60.0 -40.0 -20.0 0.0 20.0 40.0 60.0
Share price change (end-2006 - June 2009)
Leve
rage
(en
d-20
06)
Sources: Bankscope and Fund staff calculations.
Figure 8. Australia: Share Price Evolution (2006-09) and Deposit Ratio (end-2006)
USUSUS BE
DEFR
GB
DE
CH
FR
GB
ESGB
KR
US
SEDK SEIT
NOAU
NL
GBUS
AU
ESDEUS
FR
GB
JP
BESENLIT
IEES CHITJP
GB AUKRJP
AU
BE USUSUS
USJP
CAKRGB
DECA
USIE
US
CA CACA AT
JPAT
AT JPJP
R2 = 0.0058
y = 0.0338x + 56.138
0
10
20
30
40
50
60
70
80
90
-120.0 -100.0 -80.0 -60.0 -40.0 -20.0 0.0 20.0 40.0 60.0
Share price change (end-2006 - June 2009)
Dep
osit
ratio
(en
d-20
06)
Sources: Bankscope and Fund staff calculations.
Figure 9. Australia: Share Price Evolution (2006–09) and Liquidity Ratio (end-2006)
USUS KR
AU
US
IT
CH
CA
SE
US JPJP
FR
SE
KR
GB
CA
JPUS
AT
SE
JP
AUJP
JP
GB
KRBE
JP
US
ITNL
DE
GB
GB
IT
BE
AT
NOBE
DE
DK
CH
FR AU
DE
US
US CA
FR
DE
GB
CA CA
IEUS
AT
ES
ES
ES
AUIE
NL
y = 0.0605x + 18.347R2 = 0.0187
0.00
10.00
20.00
30.00
40.00
50.00
60.00
70.00
-120.0 -100.0 -80.0 -60.0 -40.0 -20.0 0.0 20.0 40.0 60.0Share price change (end-2006 - June 2009)
Liqu
idity
rat
io (
end
-200
6)
Sources: Bankscope and Fund staff calculations.

14
18. These figures highlight the complexity of the assessment and suggest attention should be paid to asset quality and other more complex measures. This is not surprising given the lessons learned during the financial turmoil. For instance, Icelandic banks had excellent leverage ratios before the turmoil (Table 8), but they failed subsequently. It seems that meaningful assessments need to include focus on asset quality, quality of supervision and regulation, market structure (including securitization), and competition, among other possible features.
Australia Austria Canada Finland Greece Iceland IrelandNew
ZealandPortugal Spain
United Kingdom
Sample Average 2/
CapitalAssets to Tier 1 capital multiple 3/ 33.2 28.8 26.4 185.1 25.6 16.2 43.7 24.8 32.1 25.4 51.2 45.9Assets to total capital multiple 3/ 23.2 19.9 21.7 156.9 30.8 13.0 33.3 21.9 21.2 16.3 33.8 36.9
Asset qualityImpaired loans to total loans 0.3 3.4 0.5 0.5 6.2 0.9 0.7 0.2 1.3 1.0 1.6 1.6Provisions to impaired loans 216.6 82.0 156.7 62.5 43.3 84.2 52.3 239.6 154.8 188.4 59.0 112.3
ProfitabilityReturn on average assets 1.0 0.8 0.9 2.1 1.2 1.6 0.5 1.0 0.9 1.0 0.6 1.1Return on average equity 17.4 11.5 18.1 21.8 17.1 18.5 14.5 16.9 14.4 14.4 13.7 16.1Net interest margin 1.8 1.9 1.8 1.4 3.0 1.4 1.0 2.0 1.9 1.8 1.1 1.7Dividend payout 74.2 19.7 43.4 60.9 35.9 21.3 56.0 61.0 35.4 22.1 49.5 40.5
Composition of assets and liabilitiesMortgages to total loans 53.1 5.4 10.2 7.6 27.8 3.5 1.7 56.0 21.4 5.0 15.8 15.4Loans to total assets 61.8 53.3 47.7 45.4 61.8 59.8 52.8 69.4 68.3 67.6 43.4 57.0Retail deposits to total liabilities 41.3 41.5 31.7 31.0 60.8 29.7 25.7 56.6 46.5 42.1 38.1 40.4Liquid assets to deposits and ST funding 4.1 15.1 2.1 25.6 20.8 16.5 9.0 5.3 9.0 9.5 7.7 12.0
Sources: Bankscope, APRA, and Fund staff estimates.
1/ Annual data.2/ Simple (unweighted) average of comparator countries, excluding Australia. 3/ Assets include off-balance sheet items; figures expressed as a multiple, not in percent.
Table 8. Australia: Banking Sector Financial Soundness Indicators for Australia and Comparator Countries, 2007 1/
(In percent, except where otherwise indicated)
V. ASSET QUALITY SHOCKS
19. In order to analyze the asset quality of banks, this section simulates a shock to banks’ loan portfolios. The analysis is based on new Pillar 3 reports under the Basel II framework that provide finely granulated asset quality data for the major banks. Banks’ loan portfolios are organized into several risk categories in the Pillar 3 reports. In each risk category the probability of default (PD) and the loss given default (LGD) is estimated. Supervisors can adjust these variables to reflect the risks undertaken appropriately. In particular, APRA prescribed having at least 20 percent LGD ratios for mortgages instead of the general Basel II frameworks’ 10 percent floor. The PD and LGD data is used to calculate the likely losses the bank might suffer in a year. This loss can be contrasted to existing general and specific provisions of banks. Here, we collect data from the Pillar 3 reports for
15
the large four banks and aggregate them.9 We also consolidate the loan portfolios into seven risk categories.
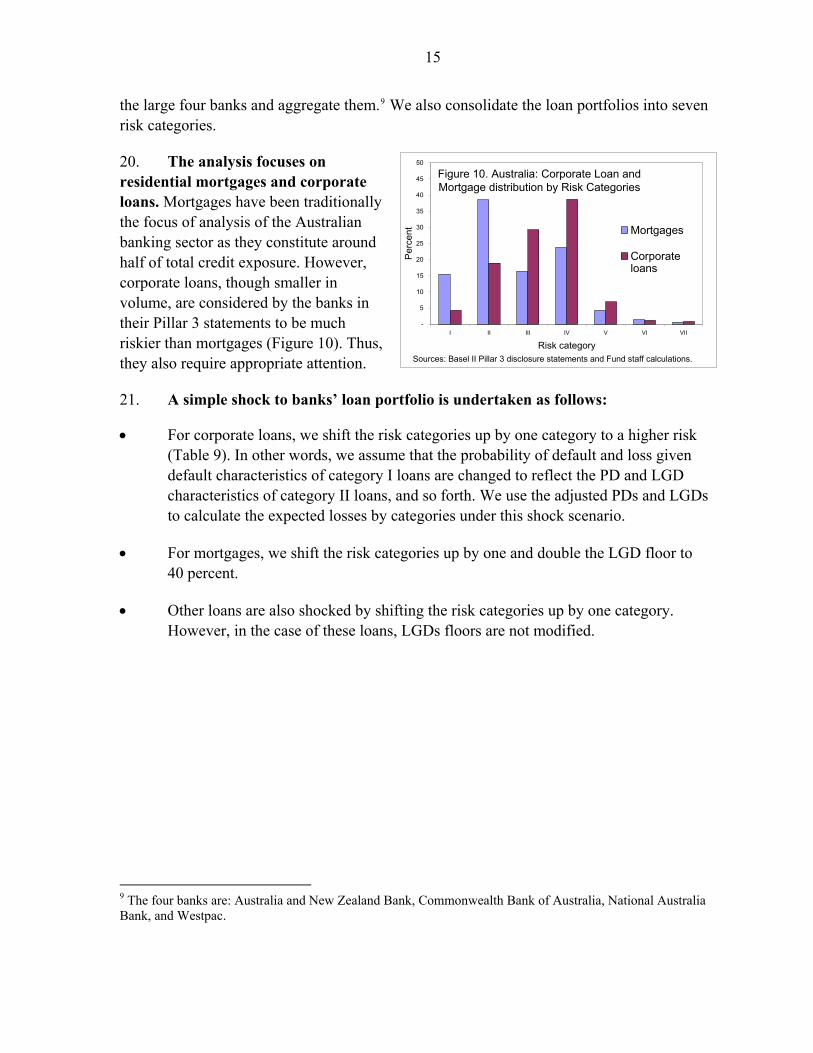
20. The analysis focuses on residential mortgages and corporate loans. Mortgages have been traditionally the focus of analysis of the Australian banking sector as they constitute around half of total credit exposure. However, corporate loans, though smaller in volume, are considered by the banks in their Pillar 3 statements to be much riskier than mortgages (Figure 10). Thusthey also require appropriate attenti
Figure 10. Australia: Corporate Loan and Mortgage distribution by Risk Categories
-
5
10
15
20
25
30
35
40
45
50
I II III IV V VI VII
Risk category
Per
cent Mortgages
Corporateloans
Sources: Basel II Pillar 3 disclosure statements and Fund staff calculations.
, on.
21. A simple shock to banks’ loan portfolio is undertaken as follows:
For corporate loans, we shift the risk categories up by one category to a higher risk (Table 9). In other words, we assume that the probability of default and loss given default characteristics of category I loans are changed to reflect the PD and LGD characteristics of category II loans, and so forth. We use the adjusted PDs and LGDs to calculate the expected losses by categories under this shock scenario.
For mortgages, we shift the risk categories up by one and double the LGD floor to 40 percent.
Other loans are also shocked by shifting the risk categories up by one category. However, in the case of these loans, LGDs floors are not modified.
9 The four banks are: Australia and New Zealand Bank, Commonwealth Bank of Australia, National Australia Bank, and Westpac.

16
Risk Categories (I - VII): I II III IV V VI VII
Regulatory credit exposure Corporate 29,848 132,248 204,900 270,630 48,307 8,024 5,880 Residential mortgage 125,240 313,816 133,114 193,393 34,132 10,838 4,407 Other 188,191 80,712 19,305 45,389 16,788 4,996 1,261
Exposure weighted average LGD Corporate 50.8 53.9 47.4 36.6 36.2 45.2 47.7 Residential mortgage 20.0 20.0 20.5 20.9 20.4 20.3 20.6 Other 45.7 52.4 57.0 60.1 65.9 67.6 61.7
Average midpoint probability of default Corporate 0.01 0.08 0.31 1.77 6.41 19.46 100.00 Residential mortgage 0.06 0.19 0.41 1.74 5.83 22.19 100.00 Other 0.02 0.11 0.38 1.75 5.84 22.17 100.00
Adjusted average probability of default corporate 0.08 0.31 1.77 6.41 19.46 100.00 100.00 residential mortgage 0.19 0.41 1.74 5.83 22.19 100.00 100.00 other 0.11 0.38 1.75 5.84 22.17 100.00 100.00
Expected losses by categories under adjuste probability of default and higher mortgage LGD
Corporate 13 228 1,707 5,971 3,811 3,630 2,808 Residential mortgage 88 471 875 4,764 3,324 4,335 1,763 Other 79 134 188 1,716 2,371 3,377 778
Total losses by category 181 833 2,770 12,451 9,506 11,343 5,348
Sources: Basel II Pillar 3 disclosure statements and Fund staff calculations.
Table 9. Australia: Losses Under Risk Category Shifting and 40 Percent Mortgage LGD Floor Assumption
(In millions of Australian dollars)
(In millions of Australian dollars)
(In percent)
(In percent)
(In percent)
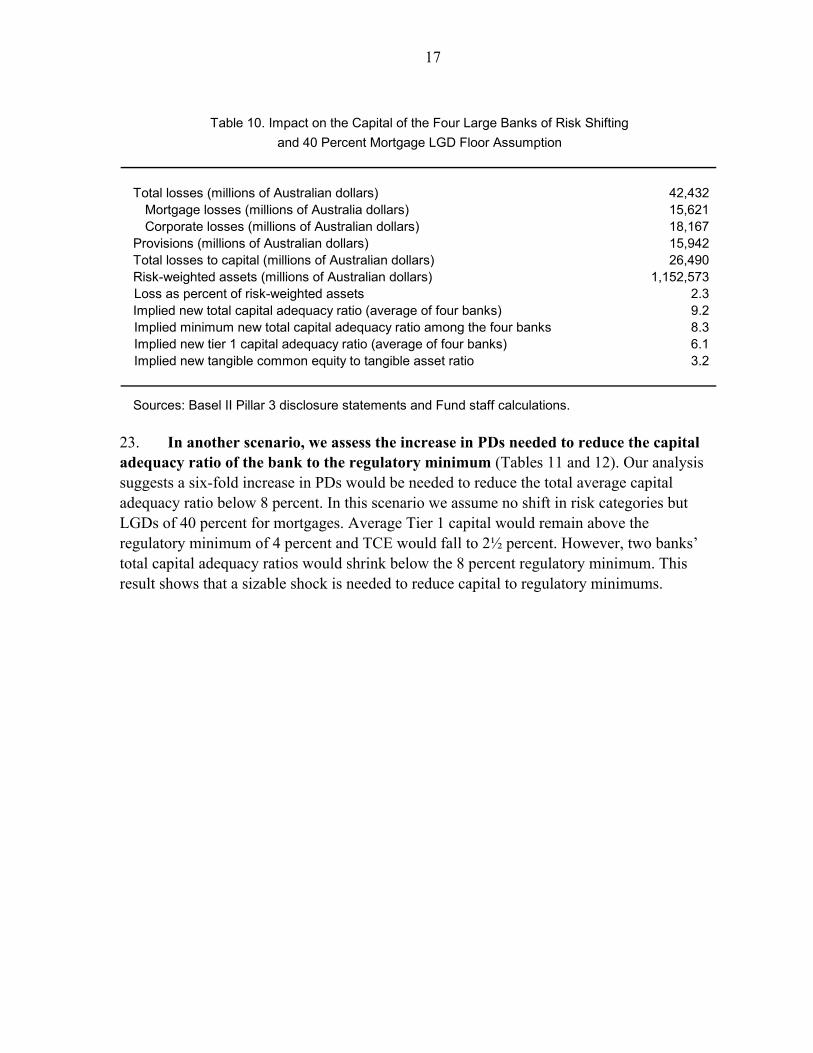
22. Banks seem to be resilient to this shock (Table 10). The total losses amount to $A 42½ billion, around 2 percent of risk-weighted assets. About 4/5 of the losses are mortgages and corporate loans. We apply these losses on provisions first and then the remainder on banks’ capital. Banks’ average total capital adequacy ratio is reduced to 9.2 percent. Even the hardest hit bank’s total capital adequacy ratio remains above the regulatory 8 percent minimum after this shock. Moreover, this shock does not take account of mortgage insurance, which may reduce the impact of higher mortgage defaults on bank capital.
17
Total losses (millions of Australian dollars) 42,432 Mortgage losses (millions of Australia dollars) 15,621 Corporate losses (millions of Australian dollars) 18,167
Provisions (millions of Australian dollars) 15,942 Total losses to capital (millions of Australian dollars) 26,490 Risk-weighted assets (millions of Australian dollars) 1,152,573
Loss as percent of risk-weighted assets 2.3 Implied new total capital adequacy ratio (average of four banks) 9.2
Implied minimum new total capital adequacy ratio among the four banks 8.3 Implied new tier 1 capital adequacy ratio (average of four banks) 6.1 Implied new tangible common equity to tangible asset ratio 3.2
Sources: Basel II Pillar 3 disclosure statements and Fund staff calculations.
Table 10. Impact on the Capital of the Four Large Banks of Risk Shifting
and 40 Percent Mortgage LGD Floor Assumption
23. In another scenario, we assess the increase in PDs needed to reduce the capital adequacy ratio of the bank to the regulatory minimum (Tables 11 and 12). Our analysis suggests a six-fold increase in PDs would be needed to reduce the total average capital adequacy ratio below 8 percent. In this scenario we assume no shift in risk categories but LGDs of 40 percent for mortgages. Average Tier 1 capital would remain above the regulatory minimum of 4 percent and TCE would fall to 2½ percent. However, two banks’ total capital adequacy ratios would shrink below the 8 percent regulatory minimum. This result shows that a sizable shock is needed to reduce capital to regulatory minimums.

18
Risk Categories (I - VII): I II III IV V VI VII
Regulatory credit exposure Corporate 29,848 132,248 204,900 270,630 48,307 8,024 5,880 Residential mortgage 125,240 313,816 133,114 193,393 34,132 10,838 4,407 Other 188,191 80,712 19,305 45,389 16,788 4,996 1,261
Exposure weighted average LGD Corporate 50.8 53.9 47.4 36.6 36.2 45.2 47.7 Residential mortgage 20.0 20.0 20.5 20.9 20.4 20.3 20.6 Other 45.7 52.4 57.0 60.1 65.9 67.6 61.7
Average midpoint probability of default Corporate 0.01 0.08 0.31 1.77 6.41 19.46 100.00 Residential mortgage 0.06 0.19 0.41 1.74 5.83 22.19 100.00 Other 0.02 0.11 0.38 1.75 5.84 22.17 100.00
Adjusted average probability of default corporate 0.08 0.50 1.88 10.62 38.44 100.00 100.00 residential mortgage 0.35 1.15 2.45 10.46 35.00 100.00 100.00 other 0.11 0.65 2.25 10.48 35.05 100.00 100.00
Expected losses by categories under adjusted probability of default and higher mortgage LGD
Corporate 13 362 1,829 10,561 6,734 3,549 2,808 Residential mortgage 175 1,444 1,298 8,056 4,726 4,335 1,763 Other 99 284 259 2,912 3,992 3,377 778
Total losses by category 287 2,091 3,385 21,529 15,451 11,261 5,348
Sources: Basel II Pillar 3 disclosure statements and Fund staff calculations.
Table 11. Australia: Losses Under Six-Times Probability of Default and 40 Percent Mortgage LGD Floor Assumption
(In millions of Australian dollars)
(In millions of Australian dollars)
(In percent)
(In percent)
(In percent)
Total losses (millions of Australian dollars) 59,353 Mortgage losses (millions of Australia dollars) 21,796 Corporate losses (millions of Australian dollars) 25,855
Provisions (millions of Australian dollars) 15,942 Total losses to capital (millions of Australian dollars) 43,411
Loss as percent of risk-weighted assets 3.8 Implied new total capital adequacy ratio (average of four banks) 7.8
Implied minimum new total capital adequacy ratio among the four banks 6.6 Implied new tier 1 capital adequacy ratio (average of four banks) 4.6
Implied new tangible common equity to tangible asset ratio 2.5
Sources: Basel II Pillar 3 disclosure statements and Fund staff calculations.
Table 12. Impact Under Six-Times PD Increase and40 Percent Mortgage LGD Floor Assumption
19
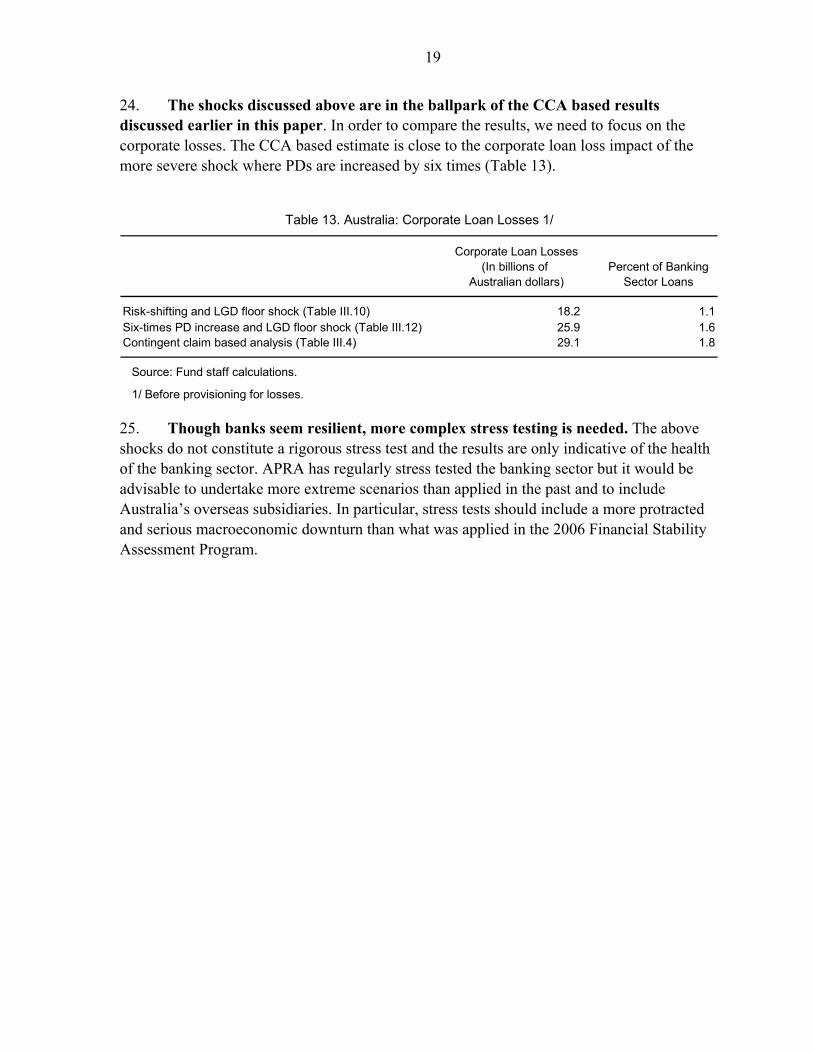
24. The shocks discussed above are in the ballpark of the CCA based results discussed earlier in this paper. In order to compare the results, we need to focus on the corporate losses. The CCA based estimate is close to the corporate loan loss impact of the more severe shock where PDs are increased by six times (Table 13).
Corporate Loan Losses(In billions of Percent of Banking
Australian dollars) Sector Loans
Risk-shifting and LGD floor shock (Table III.10) 18.2 1.1Six-times PD increase and LGD floor shock (Table III.12) 25.9 1.6Contingent claim based analysis (Table III.4) 29.1 1.8
Source: Fund staff calculations.
1/ Before provisioning for losses.
Table 13. Australia: Corporate Loan Losses 1/
25. Though banks seem resilient, more complex stress testing is needed. The above shocks do not constitute a rigorous stress test and the results are only indicative of the health of the banking sector. APRA has regularly stress tested the banking sector but it would be advisable to undertake more extreme scenarios than applied in the past and to include Australia’s overseas subsidiaries. In particular, stress tests should include a more protracted and serious macroeconomic downturn than what was applied in the 2006 Financial Stability Assessment Program.
20
APPENDIX. AUSTRALIA: CONTINGENT CLAIM ANALYSIS
The CCA is a risk-adjusted balance sheet framework where equity and risky debt of a firm or financial institution derive their value from assets. In this framework, first proposed by Robert Merton (1973) and by Black and Scholes (1973), the total value of assets is equal to the market value of equity and risky debt. Asset values are uncertain and in the future may decline below the point where debt payments on scheduled dates cannot be made. Debt is “risky” since there is a chance of default. The assets are stochastic and evolve according to a “distress barrier”. See Gray and Malone (2008) for a comprehensive analysis of the CCA framework.
We estimate the default probability and distance-to-default according the to Black-Scholes-Merton (BSM) option pricing model. BSM derive the market’s assessment of default risk for a company from its equity price, assuming that the market price reflects investors’ correct calculation of default risk. The BSM default probabilities show the theoretical probability of default one year-ahead. See the formulas and computational notes below for further details. Distance-to-default—an input into the default probability—shows how much the asset value needs to fall one-year-ahead for a firm to default given its current balance sheet position. It is reported in terms of the number of standard deviations of asset returns: the higher this number, the lower the BSM probability of default. According to the BSM model, the logarithm of a firm’s assets is assumed to follow the standard Brownian motion.
The distance to default within one year is equal to (DtD)= A
ABA
2
)log()log(
3
2
,
where A is total assets, B is the default barrier measured as short-term debt plus one half of long-term debt plus interest payments, μ is the expected return on assets (based on last year's annual capital gain including dividends), and σA is the standard deviation of the asset return. Because DtD is normally distributed with mean zero, we add 3 to the calculated DtD measure so that the reported DtD is always positive. DtD is calculated from pooled data, adding all inputs into a synthetic company at the country level. Asset values and the standard deviation of asset returns are derived using the Black-Scholes-Merton option pricing formula, with stock prices and their volatility as inputs. Computation of Banks’ Expected Losses from Corporate Sector Distress
Banks’ expected losses from corporate sector distress (Figures 4 and 5) were calculated using information from Moody’s KMV implied CDS (EICDS) spreads and banks’ exposure to the corporate sector.
21
The calculation involved the following steps:
Expected losses for the corporate sector one year ahead embedded in EICDS spreads were calculated using the contingent claim analysis framework.
The corporate sector expected losses were expressed as ratios of the corporate sector’s total liabilities. It was then assumed that all the corporate sector’s creditors would suffer the same relative losses in their books in order to overcome lack of more precise calculation on the seniority structure of the debt and on the relative importance of domestic versus foreign financing sources.
Banks’ current performing loans to the corporate sector were calculated. Here in the absence of information on banks’ current provisions for losses on loans to the corporate sector, banks’ overall provisions for losses were subtracted from the current stock of their loans to the corporate sector, and the resulting amount was scaled by banks’ exposure to the corporate sector.
The relative losses calculated in the second step were multiplied by the current stock of performing loans to the corporate sector. The resulting amount was the expected increase in banks losses stemming from banks’ exposure to the corporate sector.
22
References
Black, F., and M. Scholes, 1973, “The Pricing of Options and Corporate Liabilities,” Journal
of Political Economy 81: pp. 637–654. Brooks, R., and R. Cubero, “New Zealand Banks––How Vulnerable are They to the Global
Crisis and Domestic Recession?,” New Zealand: Selected Issues, IMF Country Report No. 09/146 (Washington: International Monetary Fund).
Gray, D., and S. Malone, 2008, Microfinancial Risk Analysis, Chichester, West Sussex,
England; Hoboken, NJ: J. Wiley & Sons Inc. Jain-Chandra, S., P. N’Diaye, and H. Oura, 2009, “How Vulnerable is Corporate Asia?,”
Chapter 3, Regional Economic Outlook, Asia and Pacific: Global Crisis: the Asian Context, (Washington: International Monetary Fund).
Merton, R., 1973, “Theory of Rational Option Pricing” Bell Journal of Economics and
Management Science, Vol. 4: 141–83. Ratnovski, Lev., and Rocco Hunga, 2009, “Why Are Canadian Banks More Resilient?,” IMF
Working Paper No. 09/134 (Washington: International Monetary Fund). Reserve Bank of Australia, 2009, Financial Stability Report: March 2009 (Sydney: Reserve
Bank of Australia). Rozhkov, D., 2008, “Australian Banks: Weathering the Global Storm,” Australia: Selected
Issues, IMF Country Report No. 08/311 (Washington: International Monetary Fund).


![[Bank of America] Outlook for the RMBS Market in 2007](https://img.pdfslide.net/doc/110x75/577d38c61a28ab3a6b9877d8/bank-of-america-outlook-for-the-rmbs-market-in-2007.jpg)
