Embed Size (px)
Citation preview
Automatic Music Transcription: from
Monophonic to Polyphonic
F. Argenti, P. Nesi, G. Pantaleo
Department of Systems and Informatics
Hhttp://www.disit.dsi.unifi.it
University of Florence
Via S. Marta 3, Florence 50139, Italy
e-mail: [email protected]
Abstract
Music understanding from audio track and performance is a key problem and a
challenge for many applications ranging from: automated music transcoding,
music education, interactive performance, etc. The transcoding of polyphonic
music is a one of the most complex and still open task to be solved in order to
become a common tool for the above mentioned applications. Techniques suitable
for monophonic transcoding have shown to be largely unsuitable for polyphonic
cases. Recently, a range of polyphonic understanding algorithms and models have
been proposed and compared against worldwide accepted test cases such as those
adopted in the MIREX competition. Several different approaches are based on
techniques such as: pitch trajectory analysis, harmonic clustering, bispectral
analysis, event tracking, nonnegative matrix factorization, hidden Markov model.
The chapter will focus on analyzing the evolution of music understanding
algorithms and models from monophonic to polyphonic, showing and comparing
the solutions, while commenting them against commonly accepted assessment
methods and formal metrics.
2.1 Introduction
Music Information Retrieval (MIR) multidisciplinary research field has
revealed a great increment in academic interest in the last fifteen years, although
yet barely comparable to the commercial involvement grown around speech
recognition. It must be noticed that music information is much more complex than
speech information, both from a physical (range of frequency analysis) and a
2
semantic (big number, high complexity and many abstraction levels of the
possible queries) point of view.
Automatic transcription is a specific task within MIR, and it is considered one
of the most difficult and challenging problems. It is here defined as the process of
both analyzing a musical recorded signal, or a musical performance, and
converting it into a symbolic notation (a musical score or sheet) or any equivalent
representation concerning note parameters such as pitch, onset time, duration and
intensity.
A musical signal is generally understood as composed by a single or a mixture
of approximately periodic, locally stationary acoustic waves. According to the
Fourier representation, any finite energy signal is represented as the sum of an
infinite number of sinusoidal components weighted by appropriate amplitude
coefficients. A musical sound is a particular case where, ideally, frequency values
of single harmonic components are integer multiples of the first one, called
fundamental frequency (defined as F0, which is the perceived pitch). Many real
instruments, however, produce sounds having not exactly harmonically spaced
partials. The phenomenon is called partial inharmonicity, and it was analytically
described by Fletcher and Rossing (Fletcher and Rossing 1998), and brought to
the attention of music transcription research community by Klapuri (Klapuri
2004a).
A major distinctive cue in music transcoding is given by the number of voices a
music piece consists of: there can be only one voice playing at each time; these
cases are treated as a monophonic transcription task. On the contrary, if several
voices are played simultaneously, we deal with a polyphonic transcription
process. The former is currently considered a resolved problem, while the latter is
still far from being successfully settled, and additional difficulties arise in
presence of multi-instrumental contexts. Development of techniques for
monophonic pitch detection has received a greater attention and deeper interest for
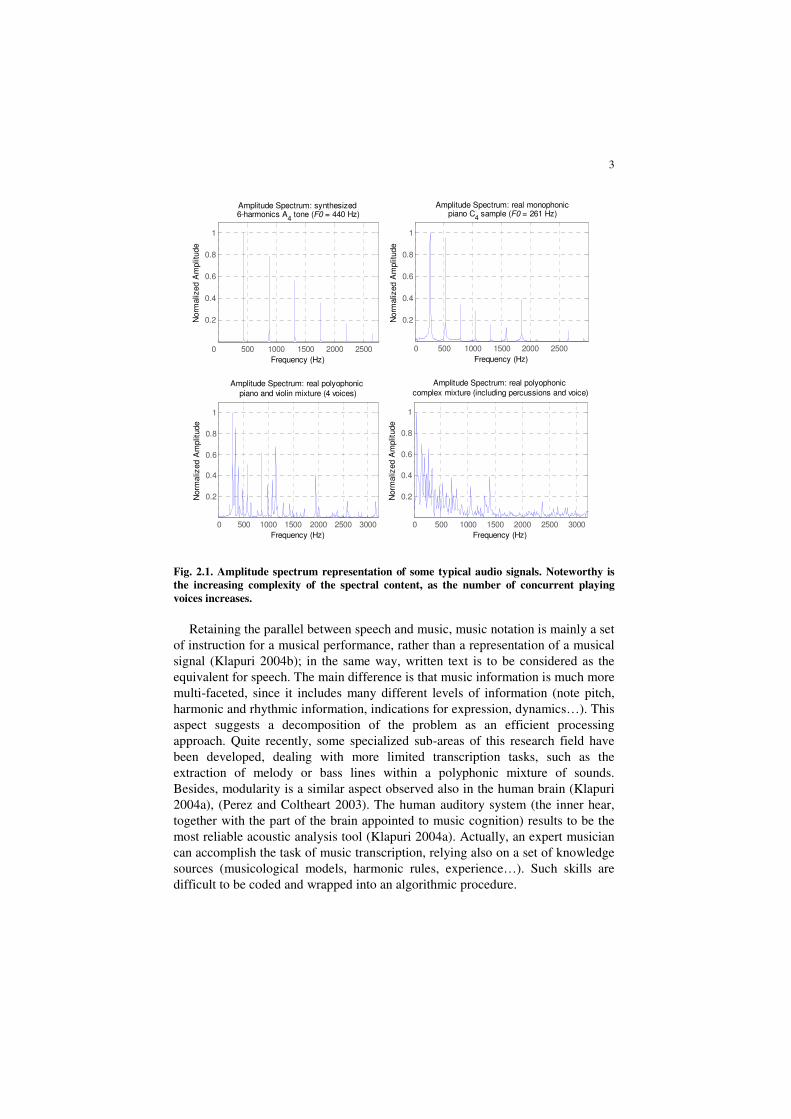
speech analysis, rather than for music, even in quite recent literature. In Figure
2.1, some examples of the spectral content of typical audio signals, are shown.
Difficulties arise in polyphonic music transcription since two or more
concurrent sounds may contain partials which share the same frequency values.
This generates the well known problem of partials overlapping, which is one of
the main reasons why simple amplitude spectral analysis is considered inadequate,
if not joined to other signal processing techniques or a priori knowledge
resources.
3
0 500 1000 1500 2000 2500 3000
0.2
0.4
0.6
0.8
1
Frequency (Hz)
Norm
aliz
ed A
mplit
ude
Amplitude Spectrum: real polyophonic
piano and violin mixture (4 voices)
0 500 1000 1500 2000 2500
0.2
0.4
0.6
0.8
1
Frequency (Hz)
Norm
aliz
ed A
mplit
ude
Amplitude Spectrum: real monophonicpiano C
4 sample (F0 = 261 Hz)
0 500 1000 1500 2000 2500 3000
0.2
0.4
0.6
0.8
1
Frequency (Hz)
Norm
aliz
ed A
mplit
ude
Amplitude Spectrum: real polyophonic
complex mixture (including percussions and voice)
0 500 1000 1500 2000 2500
0.2
0.4
0.6
0.8
1
Frequency (Hz)
Norm
aliz
ed A
mplit
ude
Amplitude Spectrum: synthesized 6-harmonics A
4 tone (F0 = 440 Hz)
Fig. 2.1. Amplitude spectrum representation of some typical audio signals. Noteworthy is
the increasing complexity of the spectral content, as the number of concurrent playing
voices increases.
Retaining the parallel between speech and music, music notation is mainly a set
of instruction for a musical performance, rather than a representation of a musical
signal (Klapuri 2004b); in the same way, written text is to be considered as the
equivalent for speech. The main difference is that music information is much more
multi-faceted, since it includes many different levels of information (note pitch,
harmonic and rhythmic information, indications for expression, dynamics…). This
aspect suggests a decomposition of the problem as an efficient processing
approach. Quite recently, some specialized sub-areas of this research field have
been developed, dealing with more limited transcription tasks, such as the
extraction of melody or bass lines within a polyphonic mixture of sounds.
Besides, modularity is a similar aspect observed also in the human brain (Klapuri
2004a), (Perez and Coltheart 2003). The human auditory system (the inner hear,
together with the part of the brain appointed to music cognition) results to be the
most reliable acoustic analysis tool (Klapuri 2004a). Actually, an expert musician
can accomplish the task of music transcription, relying also on a set of knowledge
sources (musicological models, harmonic rules, experience…). Such skills are
difficult to be coded and wrapped into an algorithmic procedure.
4
Many efforts have been made to realize exhaustive reviews of automatic
transcription methods. Remarkable works are the ones by Rabiner (Rabiner
1977a) for monophonic transcription, and by Bello (Bello 2003), Klapuri (Klapuri
2004a), (Klapuri 2004b), Brossier (Brossier 2006) and Yeh (Yeh 2008) also for
polyphonic transcription. However, it is difficult to categorize music transcription
methods according to any single taxonomy, since human capability to achieve the
comprehension of music transcription is understood as the sum of two different
attitudes: the bottom-up and the top-down processing. This suggests a first
boundary of classification, given by the following approaches:
• The bottom-up processing, or data-driven model, starts from low level
elements (the raw audio samples) and it uses processing blocks to analyze and
cluster these elements in order to gather the required information.
• The top-down processing, or prediction-driven model, starts from information
at a higher level (based on external knowledge) and it uses such information to
understand and explain elements at lower hierarchy levels (physical stimuli).
We have considered this, reported by Bello (Bello 2003), as the most general
categorization criterion for the music transcription problem, since these two
approaches are non-mutual-exclusive, and contain ideally all the other fields of
codification we intend to review in the following.
There are many reviews of automatic music transcription methods in literature,
and most of them present their own criteria, upon which the different front ends,
used to obtain a useful mid-level representation of the audio input signal, are
grouped together. One of the most commonly used criterion, adopted by Gerhard
(Gerhard 2003), Brossier (Brossier 2006) and Yeh (Yeh 2008), is based on a
differentiation at signal analysis level:
• Time domain analysis: systems belonging to this category process the audio
waveform in order to obtain information about pitches (periodicities of the
audio signal) or onset times. In general, this family of methods is suitable for
monophonic transcription.
• Frequency domain analysis: methods belonging to this class vary from spectral
analysis (FFT, cepstrum, multi-resolution filtering, Wavelet transform and
related variants) to auditory models developed in the first 90s within the
Computational Auditory Scene Analysis (CASA) framework (Slaney and Lyon
1990), (Ellis 1996), (Meddis 1997), as well as many spectral matching or
spectral features extraction techniques.
Another classification concept is reported by Yeh (Yeh 2008), for whom
music transcription methods can be catalogued into two different approaches:
• Iterative estimation: such principle refers to all the methods which iteratively
estimate predominant F0, and subsequently cancel the residual harmonic
pattern of estimated notes from the observed spectrum, processing the residual
5
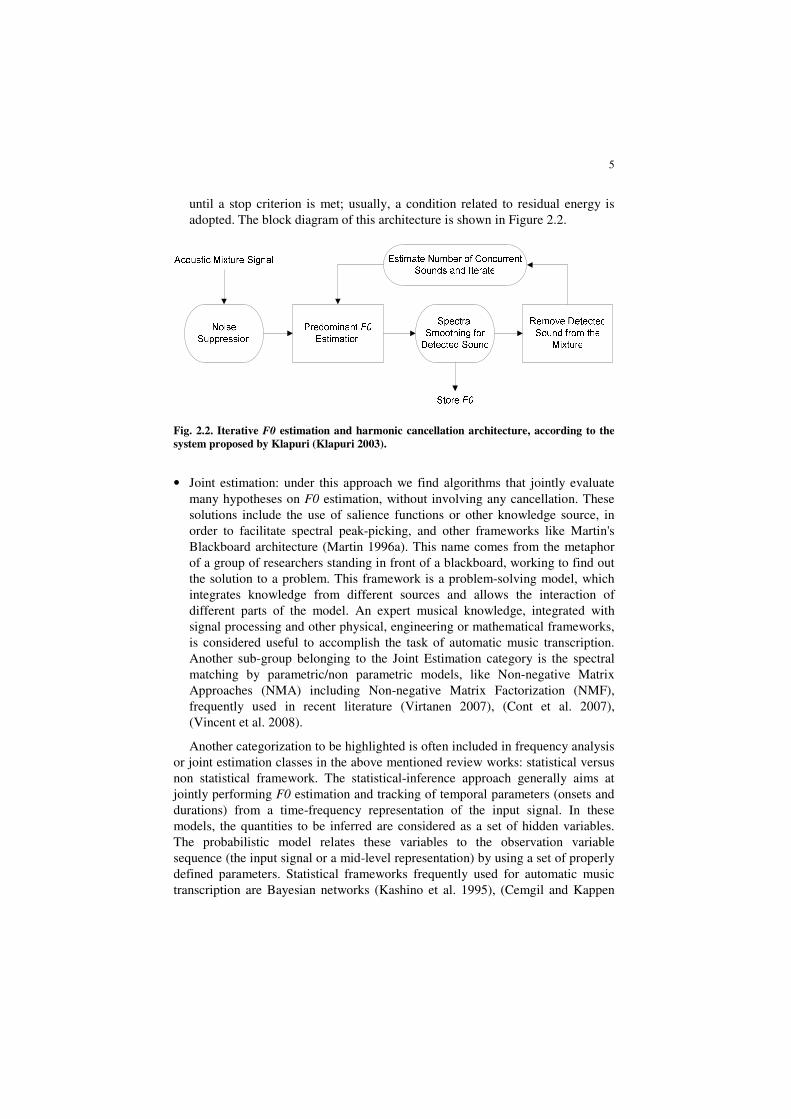
until a stop criterion is met; usually, a condition related to residual energy is
adopted. The block diagram of this architecture is shown in Figure 2.2.
Fig. 2.2. Iterative F0 estimation and harmonic cancellation architecture, according to the
system proposed by Klapuri (Klapuri 2003).
• Joint estimation: under this approach we find algorithms that jointly evaluate
many hypotheses on F0 estimation, without involving any cancellation. These
solutions include the use of salience functions or other knowledge source, in
order to facilitate spectral peak-picking, and other frameworks like Martin's
Blackboard architecture (Martin 1996a). This name comes from the metaphor
of a group of researchers standing in front of a blackboard, working to find out
the solution to a problem. This framework is a problem-solving model, which
integrates knowledge from different sources and allows the interaction of
different parts of the model. An expert musical knowledge, integrated with
signal processing and other physical, engineering or mathematical frameworks,
is considered useful to accomplish the task of automatic music transcription.
Another sub-group belonging to the Joint Estimation category is the spectral
matching by parametric/non parametric models, like Non-negative Matrix
Approaches (NMA) including Non-negative Matrix Factorization (NMF),
frequently used in recent literature (Virtanen 2007), (Cont et al. 2007),
(Vincent et al. 2008).
Another categorization to be highlighted is often included in frequency analysis
or joint estimation classes in the above mentioned review works: statistical versus
non statistical framework. The statistical-inference approach generally aims at
jointly performing F0 estimation and tracking of temporal parameters (onsets and
durations) from a time-frequency representation of the input signal. In these
models, the quantities to be inferred are considered as a set of hidden variables.
The probabilistic model relates these variables to the observation variable
sequence (the input signal or a mid-level representation) by using a set of properly
defined parameters. Statistical frameworks frequently used for automatic music
transcription are Bayesian networks (Kashino et al. 1995), (Cemgil and Kappen
6
2006) or Hidden Markov Models (HMM) (Ryynänen and Klapuri 2005), (Chang
et al. 2008).
Finally, another pivotal aspect is the evaluation of the transcription systems
proposed so far. The absence of formalized paradigms to compare different
methods, the necessity of commonly accepted evaluation criteria, and finally the
difficulties to collect large enough databases (often due to intellectual property
rights restrictions, which is another important difference with the speech
recognition research area) led the IMIRSEL (International Music Information
Retrieval Systems Evaluation Laboratory) community to create, in 2005, the
MIREX (Music Information Retrieval Evaluation eXchange) evaluation
framework. In few editions, MIREX has already become a worldwide accepted,
standard reference for the evaluation of submitted methods and algorithms aimed
at resolving several MIR proposed tasks , including polyphonic pitch estimation
and note tracking. The tasks, the evaluation material and conditions, as well as
many other elements of the MIREX architecture are defined and discussed within
the whole community, thus reflecting its own interests and accomplishing the
necessity of formality and repeatability.
2.1.1 State of the Art
In literature, a large variety of methods for both monophonic and polyphonic
music transcription has been realized. Monophonic transcription solutions were
the first to be proposed, starting from the second half of the 60s, in parallel with
the initial development of the newly-born speech processing; in fact, monophonic
pitch detection was basically applied for speech recognition purposes. Some of
these methods were based on time-domain techniques like Zero Crossing Rate
(Miller 1975), or on autocorrelation function (ACF) in the time-domain (Rabiner
1977b), as well as parallel processing (Gold and Rabiner 1969) or Linear
Predictive Coding (LPC) analysis (Markel 1972).
First attempts of performing polyphonic music transcription started in the late
1970s, with the pioneering work of Moorer (Moorer 1977) and Piszczalski and
Galler (Piszczalski and Galler 1977). As time went by, the commonly-used
frequency representation of audio signals as a front-end for transcription systems
has been developed in many different ways, and several techniques have been
proposed. Klapuri (Klapuri 2003), (Klapuri 2005) performed an iterative
predominant F0 estimation and a subsequent cancelation of each harmonic pattern
from the spectrum; Nawab (Nawab 2001) used an iterative pattern matching
algorithm upon a constant-Q spectral representation. In the early 1990s, other
approaches began to develop, based on applied psycho-acoustic models and also
known as Computational Auditory Scene Analysis (CASA), from the work by
Bregman (Bregman 1990), started to be developed. This framework was focused
on the idea of formulating a computational model of the human inner ear system,
7
which is known to work as a frequency-selective bank of passband filters;
techniques based on this model, formalized by Slaney and Lyon (Slaney and Lyon
1990), were proposed by Ellis (Ellis 1996), Meddis and O’Mard (Meddis and
O’Mard 1997), Tolonen and Karjalainen (Tolonen and Karjalainen 2000) and
Klapuri (Klapuri 2008). Marolt (Marolt 2001), (Marolt 2004) used the output of
adaptive oscillators as a training set for a bank of neural networks to track partials
of piano recordings. A systematic and collaborative organization of different
approaches to the music transcription problem is the mainstay of the idea
expressed in the Blackboard Architecture proposed by Martin (Martin 1996a).
More recently, physical (Ortiz-Berenguer et al. 2005) and musicological models,
like average harmonic structure (AHS) extraction in (Duan et al. 2008), as well as
other a priori knowledge (Kameoka et al. 2007), and possibly temporal
information (Bello et al. 2006) have been joined to the audio signal analysis in the
frequency-domain to improve transcription systems performances. Other
frameworks rely on statistical inference, like hidden Markov models (Raphael
2002), (Ryynänen and Klapuri 2005), (Chang et al. 2008), Bayesian networks
(Kashino et al. 1995), (Cemgil and Kappen 2006) or Bayesian models (Godsill et
al. 2006), (Dubois and Davy 2007). Others systems were proposed, aiming at
estimating the bass line (Ryynänen and Klapuri 2007), or the melody and bass
lines in musical audio signals (Goto 2000), (Goto 2004). Currently, the approach
based on non-negative matrix approximation (Raczynksi et al. 2007), in different
versions like nonnegative matrix factorization of spectral features (Smaragdis and
Brown 2003), (Virtanen 2007), (Cont et al. 2007), (Vincent et al. 2008), has
received much attention within the music transcription community.
2.2 Methods Overview and Comparison
In this section, a comparative review of some of the most important and cited
music transcription systems is proposed. This review is not meant to be as an
exhaustive and omni-comprehensive work, although it covers large part of the
literature, starting from the first pioneering methods, realized at the end of the 70s,
until nowadays. The aim is to illustrate the evolution of the state of the art, which
is supposed to run in parallel with the development of technology in the fields of
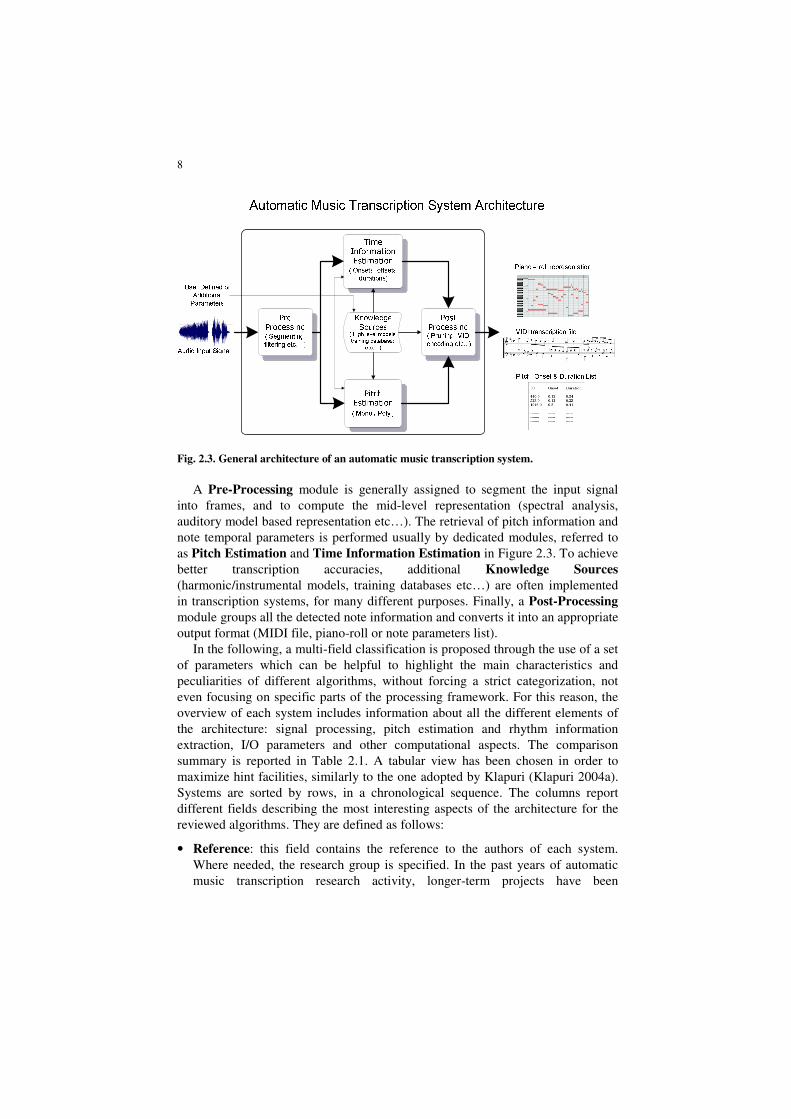
signal processing and computational elaboration power. In Figure 2.3, a functional
block diagram related to the general architecture of an automatic music
transcription system, is shown.
8
Fig. 2.3. General architecture of an automatic music transcription system.
A Pre-Processing module is generally assigned to segment the input signal
into frames, and to compute the mid-level representation (spectral analysis,
auditory model based representation etc…). The retrieval of pitch information and
note temporal parameters is performed usually by dedicated modules, referred to
as Pitch Estimation and Time Information Estimation in Figure 2.3. To achieve
better transcription accuracies, additional Knowledge Sources
(harmonic/instrumental models, training databases etc…) are often implemented
in transcription systems, for many different purposes. Finally, a Post-Processing
module groups all the detected note information and converts it into an appropriate
output format (MIDI file, piano-roll or note parameters list).
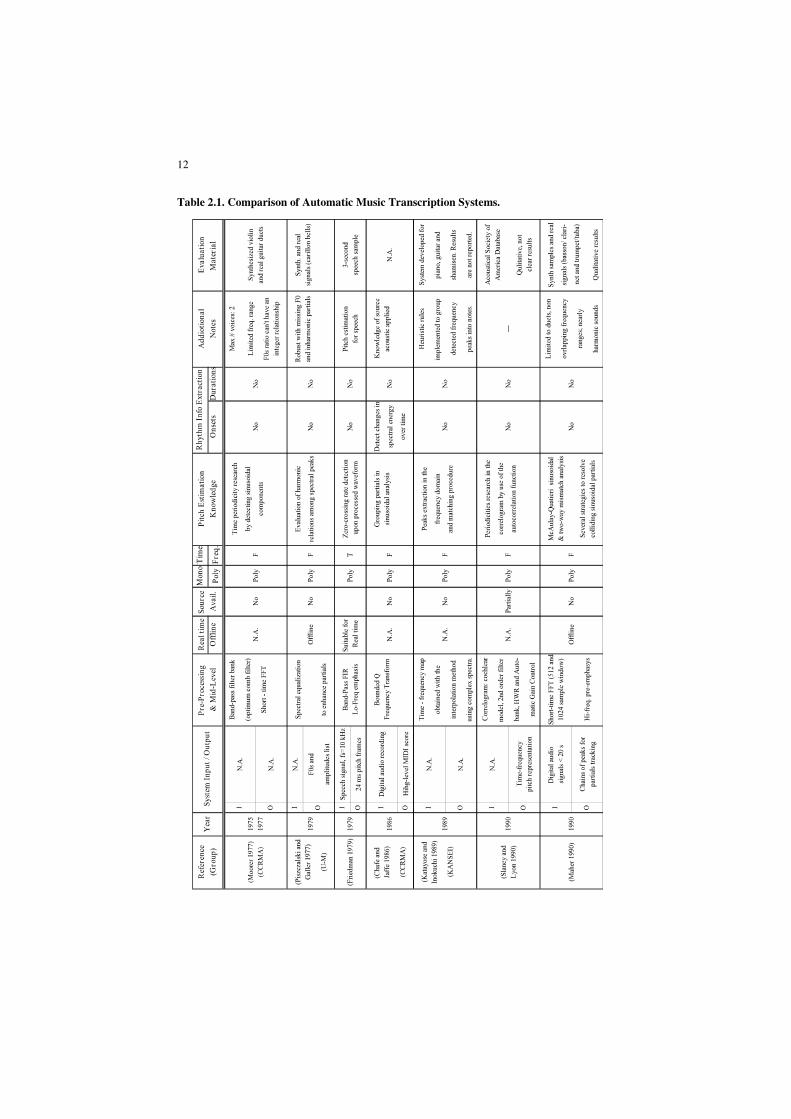
In the following, a multi-field classification is proposed through the use of a set
of parameters which can be helpful to highlight the main characteristics and
peculiarities of different algorithms, without forcing a strict categorization, not
even focusing on specific parts of the processing framework. For this reason, the
overview of each system includes information about all the different elements of
the architecture: signal processing, pitch estimation and rhythm information
extraction, I/O parameters and other computational aspects. The comparison
summary is reported in Table 2.1. A tabular view has been chosen in order to
maximize hint facilities, similarly to the one adopted by Klapuri (Klapuri 2004a).
Systems are sorted by rows, in a chronological sequence. The columns report
different fields describing the most interesting aspects of the architecture for the
reviewed algorithms. They are defined as follows:
• Reference: this field contains the reference to the authors of each system.
Where needed, the research group is specified. In the past years of automatic
music transcription research activity, longer-term projects have been
9
undertaken by Stanford university (in particular the Centre for Computer
Research in Music and Acoustics, referred to as CCRMA in the Table 2.1),
University of Michigan (U-M), University of Tokyo (UT), National Institute of
Advanced Industrial Science and Technology (AIST), Massachusetts Institute
of Technology (MIT), Queen Mary University of London (QMUL), University
of Cambridge (CAM), Tampere/Helsinki University of Technology
(TUT/HUT), and the Institut de Recherche et Coordination
Acoustique/Musique (IRCAM) of Paris, France. Other names and
abbreviations, not included in the above mentioned list, refer either to the name
of the research projects, or to the commercial development of such systems
(e.g., KANSEI, SONIC, YIN).
• Year: the year of publication of the referenced papers.
• System Input / Output: this field contains specifications, if they exist, on the
input audio file, and it reports also the output format of the transcription
process, whether described in the referenced papers.
• Pre-Processing and Mid-Level: a list of the signal processing techniques, used
to obtain a useful front end.
• Real time / Offline: this field specifies, if the system operates in real time or
not.
• Source Availability: this specifies if the source code is available, directly or
web-linked.
• Mono / Poly: this field shows if the system is mainly dedicated to monophonic
or polyphonic transcription.
• Time / Frequency: indicates if the signal processing techniques used by the
algorithm (which are listed in the Pre-Processing and Mid-Level categories
described above) operates either in the time or in the frequency domain.
• Pitch Estimation Knowledge: a brief description about the approaches and the
knowledge used to extract pitch information.
• Rhythm Info Extraction: in this field the techniques used to retrieve temporal
information of estimated F0s (where this task is performed) are summarized. It
is divided into two sub-fields: Onsets and Durations, as they are often
estimated with different strategies.
• Evaluation Material: this section shortly reports, where described, the type of
the dataset used for evaluation and the number of test files / samples.
Evaluation results are omitted. Only MIREX results are reported, for all those
algorithms which participated in the past editions. As to this topic, noteworthy
is to highlight that a methodology for the evaluation of music transcription
systems has not been firmly established yet. The transcription output (MIDI file
or piano-roll usually) is compared with a reference ground truth of the audio
source data; evaluation databases generally provide a reference MIDI file for
each audio track or sample contained. Further work has often to be done, in
order to check the correct alignment between the two representations. The
procedure is as follows: a graphical comparison is commonly made, by using a
dedicated GUI or other devices, between the audio signal spectrogram and the
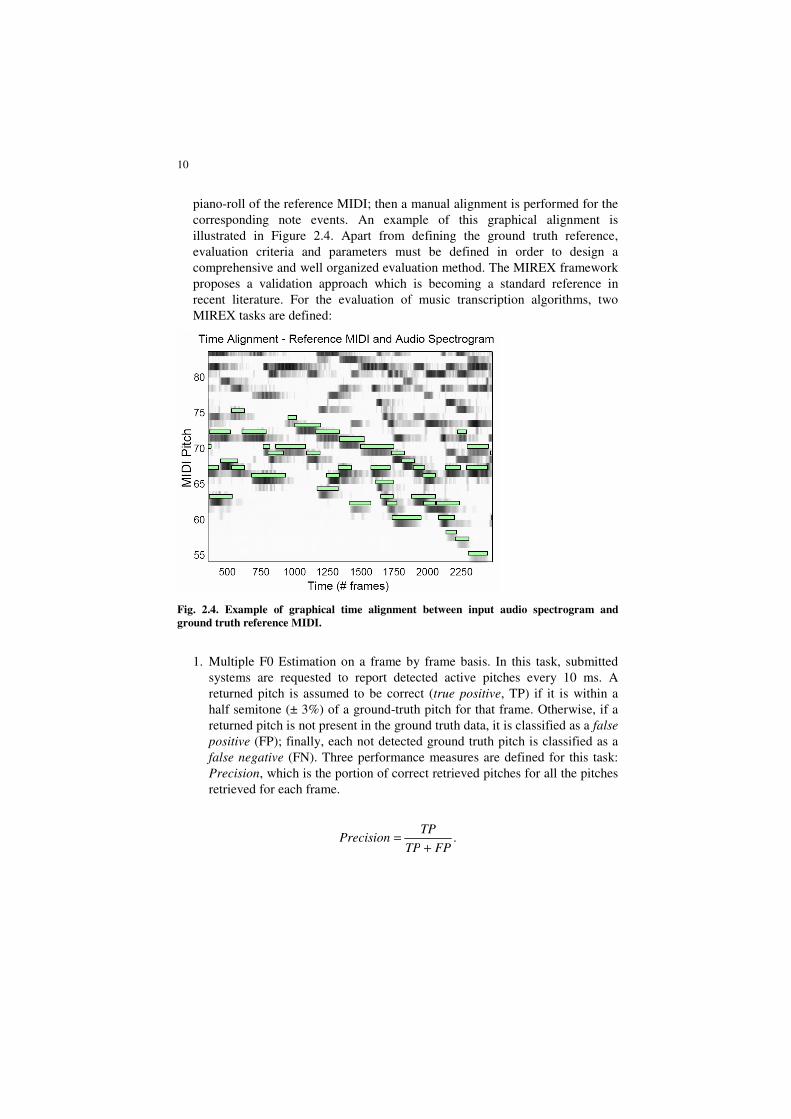
10
piano-roll of the reference MIDI; then a manual alignment is performed for the
corresponding note events. An example of this graphical alignment is
illustrated in Figure 2.4. Apart from defining the ground truth reference,
evaluation criteria and parameters must be defined in order to design a
comprehensive and well organized evaluation method. The MIREX framework
proposes a validation approach which is becoming a standard reference in
recent literature. For the evaluation of music transcription algorithms, two
MIREX tasks are defined:
Fig. 2.4. Example of graphical time alignment between input audio spectrogram and
ground truth reference MIDI.
1. Multiple F0 Estimation on a frame by frame basis. In this task, submitted
systems are requested to report detected active pitches every 10 ms. A
returned pitch is assumed to be correct (true positive, TP) if it is within a
half semitone (± 3%) of a ground-truth pitch for that frame. Otherwise, if a
returned pitch is not present in the ground truth data, it is classified as a false
positive (FP); finally, each not detected ground truth pitch is classified as a
false negative (FN). Three performance measures are defined for this task:
Precision, which is the portion of correct retrieved pitches for all the pitches
retrieved for each frame.
.FPTP
TPPrecision
+=
11
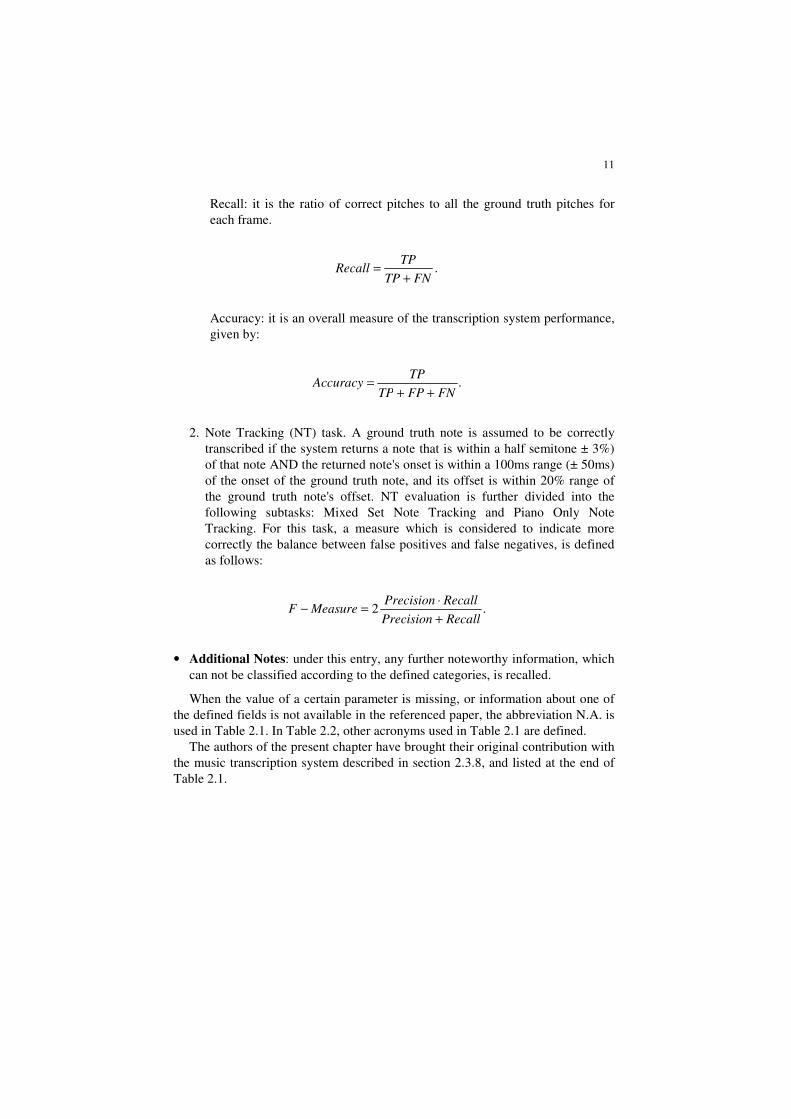
Recall: it is the ratio of correct pitches to all the ground truth pitches for
each frame.
.FNTP
TPRecall
+=
Accuracy: it is an overall measure of the transcription system performance,
given by:
.FNFPTP
TPccuracyA
++=
2. Note Tracking (NT) task. A ground truth note is assumed to be correctly
transcribed if the system returns a note that is within a half semitone ± 3%)
of that note AND the returned note's onset is within a 100ms range (± 50ms)
of the onset of the ground truth note, and its offset is within 20% range of
the ground truth note's offset. NT evaluation is further divided into the
following subtasks: Mixed Set Note Tracking and Piano Only Note
Tracking. For this task, a measure which is considered to indicate more
correctly the balance between false positives and false negatives, is defined
as follows:
.2RecallPrecision
RecallPrecisionMeasureF
+
⋅=−
• Additional Notes: under this entry, any further noteworthy information, which
can not be classified according to the defined categories, is recalled.
When the value of a certain parameter is missing, or information about one of
the defined fields is not available in the referenced paper, the abbreviation N.A. is
used in Table 2.1. In Table 2.2, other acronyms used in Table 2.1 are defined.
The authors of the present chapter have brought their original contribution with
the music transcription system described in section 2.3.8, and listed at the end of
Table 2.1.
12
Table 2.1. Comparison of Automatic Music Transcription Systems.
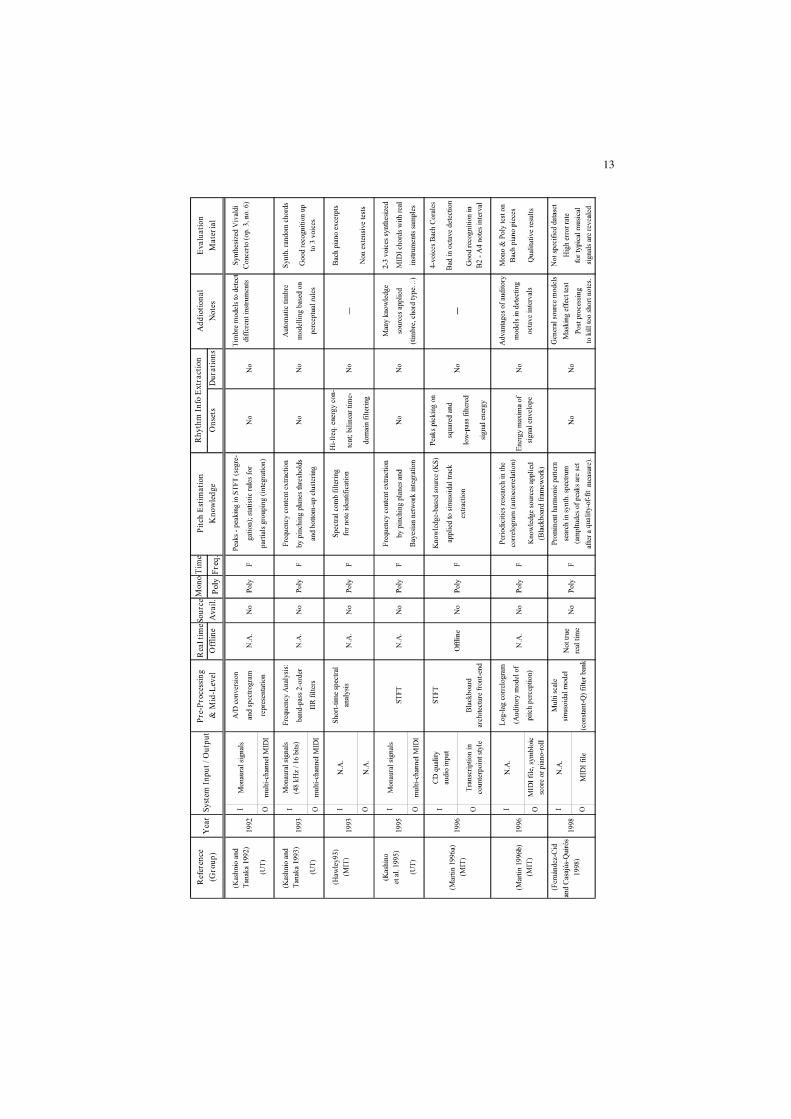
13
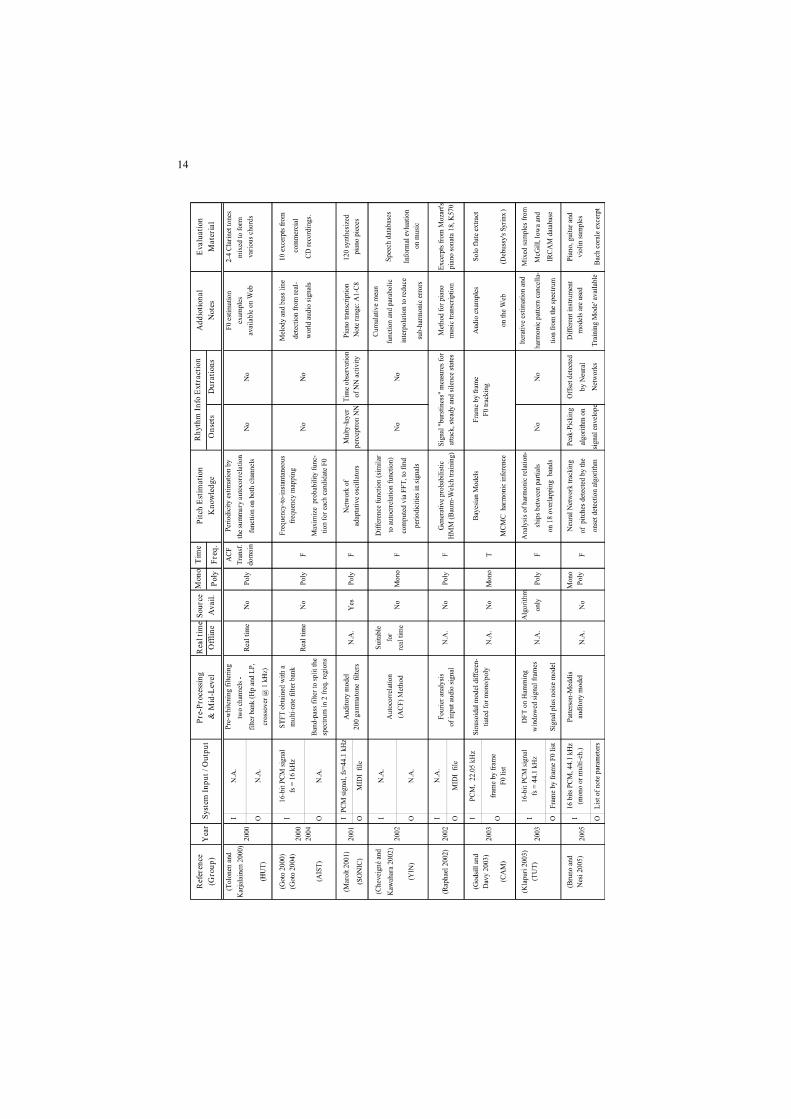
14
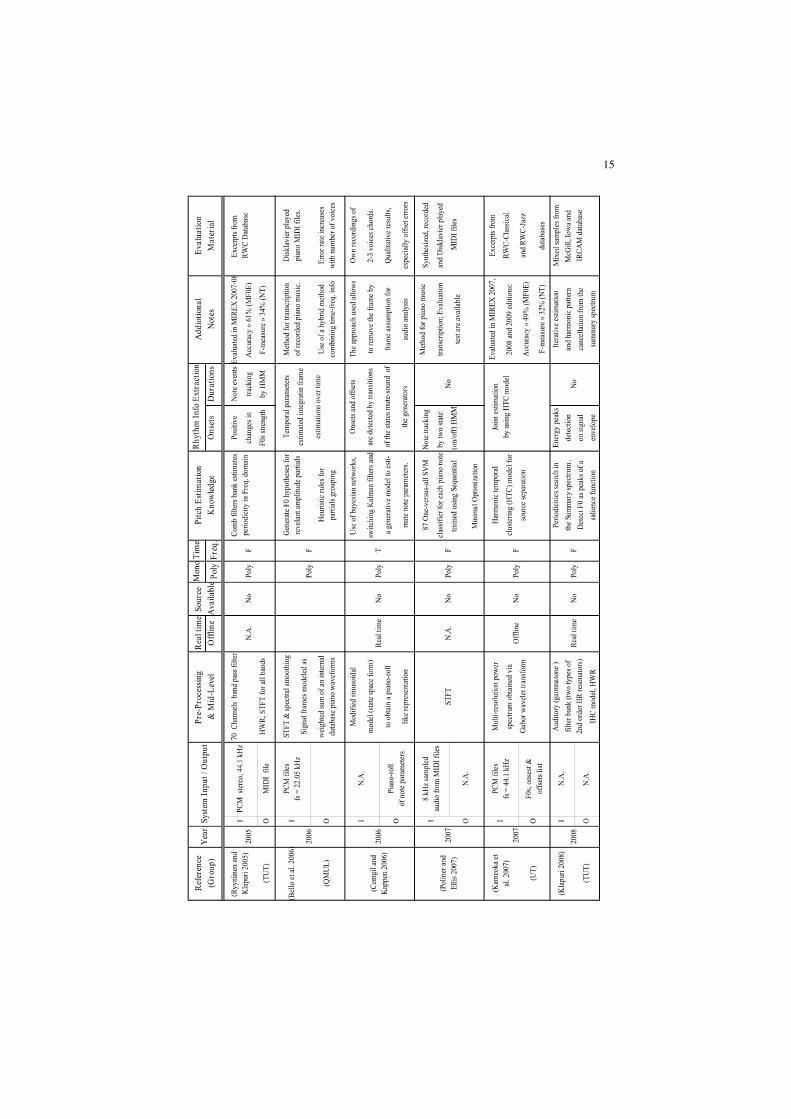
15
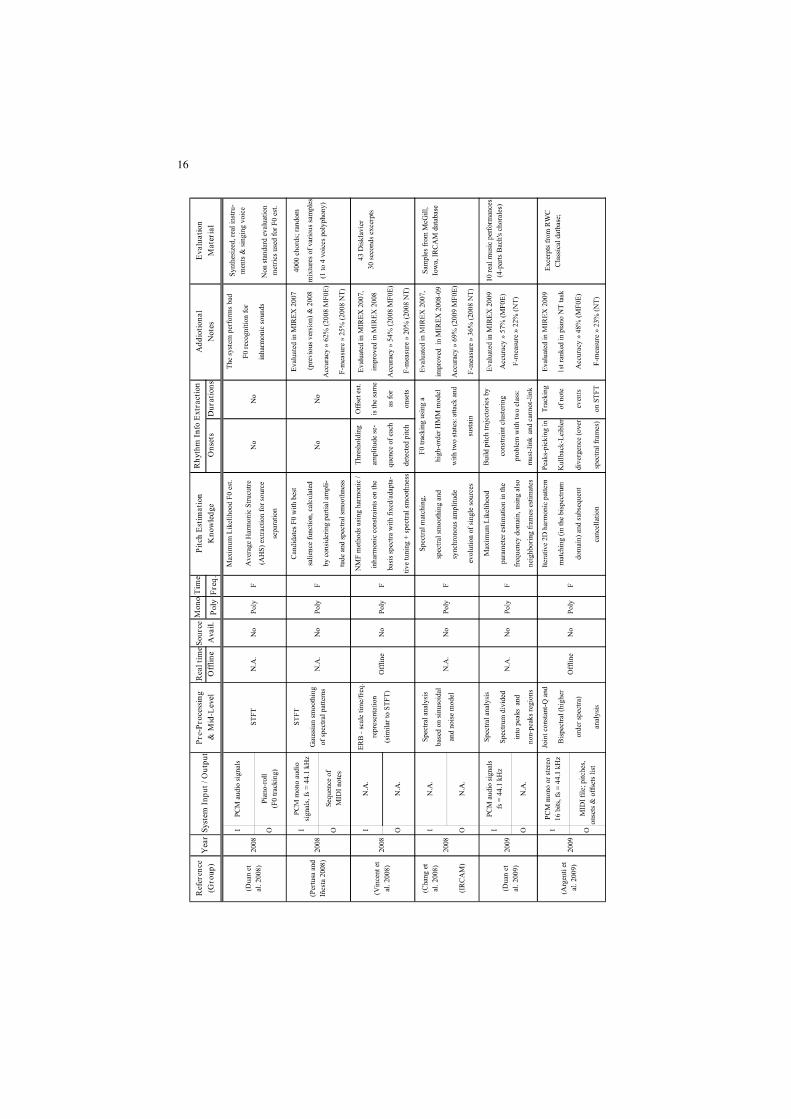
16
17
Table 2.2. Definition of acronyms used in Table 2.1.
ACF Autocorrelation Function IHC Inner Hair Cell
AHS Average Harmonic Structure IIR Infinite Impulse Response filter
DFT Discrete Fourier Transform MCMC Markov Chain Monte Carlo
F0 Fundamental Frequency MF0E Multiple F0 Estimation MIREX task
FFT Fast Fourier Transform NN Neural Network
FIR Finite Impulse Response filter NT Note Tracking MIREX task
fs Sampling Frequency PCM Pulse Code Modulation
HMM Hidden Markov Models RWC Real World Computing database
HTC Harmonic Temporal Clustering STFT Short Time Fourier Transform
HWR Half Wave Rectification SVM Support Vector Machine
2.3 Review of Some Music Transcription Systems
2.3.1 Moorer (1977)
Moorer was one of the first, in literature, to propose a system which attempted
to separate simultaneous harmonic sounds in a polyphonic mixture (Moorer 1977).
His system has been developed to track pitches of both synthesized and real duets,
although it presents several strong limitations: sounds are supposed to be
harmonic and characterized by constant amplitude (no vibrato or jitter is therefore
allowed). In addition, the two voices should not cross in pitch, and the two
fundamental frequencies should not be in an 1:N relationship, which is equivalent
to a complete overlapping of the partials of the concurrent sounds. The frequency
range of analysis is also limited. The mid-level spectral representation is obtained
by using a bank of band-pass filters, called optimum comb filter. This has been
demonstrated to be a robust but computationally expensive algorithm; the pitch
estimation strategy is to search for periodicities in the input signal by minimizing
the summed absolute value of its magnitude difference. The system has revealed
relatively good recognition performances with synthesized strings and real guitar
duets.
18
2.3.2 Slaney and Lyon (1990)
Human great capabilities of perceiving pitch, even in cases of missing
fundamental frequencies and partials inharmonicity, led to an increasing interest in
the Auditory Scene Analysis (ASA) in the first half of 90s. One of the first and
most remarkable works belonging to this area was the "Perceptual Pitch Detector"
by Slaney and Lyon (Slaney and Lyon 1990), based on Licklider’s “Duplex
Theory” of pitch perception. The system is divided into three stages:
1. A Cochlear model which approximates the behavior of the human inner ear
system, particularly the response of the auditory nerve. The cochlear model
consists of a multi-channel bank of second order filters modeling the
propagation of sound along the Basilar Membrane (BM); an array of Half-
Wave Rectifiers (HWRs), aimed at emulating the role of the inner hair cells
which respond to the BM movement in only one direction; finally, a four stage
Automatic Gain Control (AGC) compresses the dynamic range of the
processed signal.
2. The mid-level representation is obtained by computing the short-time
windowed autocorrelation of the output of each cochlear channel. Collecting
such information for each channel leads to the correlogram 2D representation,
which allows to find periodicities (related to the perceived pitches) of the input
signal (the latter are located at horizontal positions corresponding to the
correlation delay-times equal to the periods of repetition).
3. The pitch detector block performs a peak enhancement in the correlogram; then
the value at each time-lag is summed across all the frequencies, and the
obtained array show peaks in correspondence of possible periodicities in the
correlogram. Each detected periodicity τ reveal the presence of a pitched sound
at frequency 1/τ.
2.3.3 Martin (1996)
Martin proposes the Blackboard architecture for automatic music transcription
(Martin 1996b). This name comes from the metaphor of a group of researchers
standing in front of a blackboard, working to find out the solution to a problem.
This framework is a problem-solving model, which integrates knowledge from
different sources and allows the interaction of different parts of the model. An
expert musical knowledge, integrated with signal processing and other physical,
engineering or mathematical frameworks, is considered useful to accomplish the
task of automatic transcription of music.
The front end of Martin's system is an auditory model, similar to the one by
Slaney and Lyon: it is a variant of the correlogram, according to Ellis' work. The
19
filtering stage is composed by a 40 gammatone filter bank. The input signal is
later half-wave rectified, and a short-time autocorrelation is made across each
channel, obtaining a correlogram representation. Finally, the autocorrelations are
summed across each band, and the time-lag presenting the largest peak is chosen
as the pitch percept. A summary autocorrelation (periodogram) is obtained by
averaging each frequency cell output by the zero-lag energy in the same frequency
band, and then performing another average across all the frequency channels. This
representation is an improvement over standard correlogram, since the
periodogram presents a log-lag axis (lag, or inverse pitch, in a logarithmic scale)
in addition to usual frequency channels and time axis.
The knowledge source (KS) is a set of five hypotheses (read correlogram
frames, summary autocorrelation peaks, propose periodicities, note support and
prune notes), which are organized into different levels of abstraction, and added to
the periodogram front end, in order to improve the recognition performances.
2.3.4 Goto (2000 and 2004)
Goto was one of the first who proposed a transcription system (PreFEst, from
"Predominant F0 Estimation") for real-world audio signals (Goto2000), (Goto
2004), characterized by complex polyphony, presence of drum or percussion, and
singing voice also. To achieve such a goal, the music scene description and the
signal analysis are carried out at a more specific level, focusing on the
transcription of the melody and the bass line in musical fragments. Further
limitations are imposed: the melody and the bass line should have the most
predominant harmonic structure in the middle-high and in the low frequency
regions, respectively.
The front end extracts instantaneous frequency components by using a STFT
multi-rate filter bank, thus limiting the frequency regions of the spectrum with two
band-pass filters. A probability density function is then assigned to each filtered
frequency component; this function is a weighted combination of different
harmonic-structure tone models. An Expectation-Maximization (EM) algorithm
then estimates the model parameters. The frequency value that maximizes the
probability function is detected as a predominant F0. Finally, a multi-agent
architecture is used to sequentially track F0 peak trajectories, and to select the
most stable ones; this operation is carried out by a salience detection and a
dynamic thresholding procedures.
20
2.3.5 Ryynänen and Klapuri (2005)
This system (Ryynänen and Klapuri 2005) uses a probabilistic framework, a
hidden Markov Model (HMM), to track note events. The multiple F0 estimator
front end is based on auditory model: a 70-channel bandpass filter bank splits the
audio input into sub-band signals which are later compressed, half-wave rectified
and low-pass filtered with a frequency response close to 1/f. Short time Fourier
Transform is then performed across the channels, and the obtained magnitude
spectra are summed together into a summary spectrum. Predominant F0
estimation, and cancelation from the spectrum of the harmonic set of detected F0
is performed iteratively. Onset detection is also performed by observing positive
energy variation in the amplitude of detected F0 values. The output of F0
estimator is further processed by a set of three probabilistic models: a HMM note
event model tracks the likelihood for each single detected note; a silence model
detects temporal intervals where no notes are played; finally, a musicological
model controls the transitions between note event and silence models.
2.3.6 Vincent, Bertin and Badeau (2008)
Vincent, Bertin and Badeau have proposed a system based on Non-negative
Matrix Factorization (NMF) [ViBeBa08]. By using this technique, the observed
signal spectrogram (Y) is decomposed into a weighted sum of basis spectra
(contained in H) scaled by a matrix of weighting coefficients (W):
WHY =
Since the elements of Y are non-negative by nature, the NMF method
approximates it as a product of two non-negative matrixes, W and H.
The system at issue uses a family of constrained NMF models, where each
basis spectrum is a sum of narrow-band spectrum (scaled by a model function of
the spectral envelope) containing partials at harmonic or inharmonic frequencies.
This assures that the estimated basis spectra are pitched at known fundamental
frequencies; such condition is not always guaranteed if standard NMF models are
applied without any of these constraints.
The input signal is first pre-processed to obtain a representation similar to the
Short-time Fourier Transform, by performing an ERB-scale representation. Then,
the parameters of the models are adapted by minimizing the residual loudness
after applying the NMF model: the linear parameters (amplitude sequence,
envelope coefficients) are multiplicatively updated, while the other nonlinear
parameters (tuning and inharmonicity factors) are updated via a Newton-based
21
optimizer. Pitches, onsets and offsets of detected notes are transcribed by simply
thresholding the amplitude sequence.
The system has been evaluated in the MIREX 2007 framework: the two
submitted versions reached average accuracies of 46.6% and 54.3% in the task 1
(multi-F0 estimation over 10 ms frames) and an average F-measure of 45.3% and
52.7% in the task 2 (note tracking).
2.3.7 Chang, Su, Yeh, Roebel and Rodet (2008)
In this method (Chang et al. 2008), instantaneous spectra are obtained by FFT
analysis. A noise level estimation algorithm is applied to enhance the peaks
generated by sinusoidal components (produced by an unknown number of audio
sources) with respect to noise peaks. Subsequently, a matching between a set of
hypothetical sources and the observed spectral peaks is made, by using a score
function based on the following three assumptions: spectral match with low
inharmonicity, spectral smoothness and synchronous amplitude evolution. These
features are based on physical characteristics generally showed by the partials
generated by a single source.
Musical notes tracking is carried out by applying a high order hidden Markov
model (HMM) having two states: attack and sustain. This is a probabilistic
framework aimed at describing notes evolution as a sequence of states evolving on
a frame by frame basis. The goal is to estimate optimal note paths and the length
of each note trajectory. The connection weights among the different states are
calculated in the forward tracking stage; candidate best trajectories are estimated
iteratively in the backward stage, by extracting most likely paths between recorded
roots and leaves. Finally, the source streams are obtained by pruning the candidate
trajectories, in order to maximize the likelihood of the observed polyphony.
The system has been evaluated within the MIREX 2007 framework, and
improved versions were submitted to MIREX 2008 and MIREX 2009 contests.
Best multiple F0 estimation accuracy of 69% has been achieved in 2009 running
(1st ranked in task 1): this is currently the highest accuracy reached in all the
MIREX editions for the first task. Best performance in the note tracking task was
reached in 2008 edition, with an F-measure of 35.5% (1st ranked).
2.3.8 Argenti, Nesi and Pantaleo (2009)
This transcription method [ArNePa09] has an original front-end: a constant-Q
bispectral analysis is actually applied to the input signal. The bispectrum belongs
to the class of higher-order spectra (HOS), or polyspectra. They are defined as the
Fourier Transform of corresponding order cumulants, which are strictly related to
22
statistical moments. The bispectrum, in particular, is also known as the third-order
spectrum: it is a bivariate frequency function, ),( 21 ffB , capable of detecting
nonlinear activities like phase or frequency coupling, for example amongst the
partials of a sound, or a mixture of sounds.
Pitch estimation is performed by harmonic pattern matching procedure in the
bispectrum domain. In the spectrum domain, a monophonic musical signal is
described as a comb-pattern of amplitude peaks, located at integer multiple values
of the fundamental frequency. In the bispectrum domain, a monophonic sound
composed of T partials generates a 2D pattern characterized by peaks positions
{ },),(,),,(),,( 1 iiTiiii ffffff −+ K
.2
,,2,1
=
Ti K
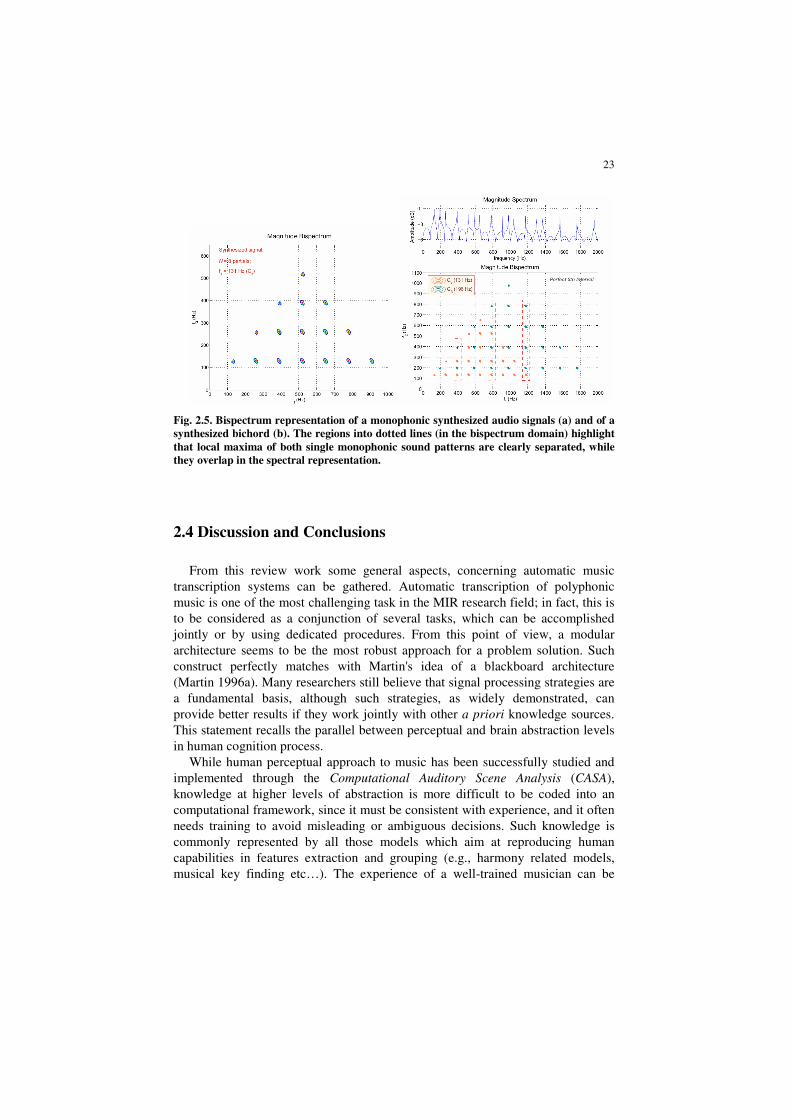
Examples of bispectrum representation of some synthesized audio signals are
depicted in Figure 2.5. Two sounds presenting some colliding partials generate
spectral overlapping patterns; this is a well known problematic situation that leads
to detection errors in a pattern matching/correlation based method; besides, in a
iterative pitch estimation and cancelation/subtraction algorithm, cancelation of 1D
spectral pattern may cause loss of information, or degradation of the input signal.
On the contrary, the geometry of bispectral 2D pattern is more useful in preserving
information about overlapping partials. This is demonstrated by evaluation results,
made on excerpts from the RWC database: a comparison between a spectral based
and a bispectral based transcription system (both performing an iterative F0
estimation and harmonic pattern cancelation procedure) shows that the latter
outperforms the former, with average F-measures of 72.1% and 57.8%,
respectively.
Onset detection are estimated using the Kullback-Leibler divergence, which
gives a measure of amplitude difference among consecutive spectral frames, thus
highlighting energy variations which are expected to be found at onset times. Note
durations are estimated by thresholding the spectrogram envelope.
The system has been evaluated in the MIREX 2009 framework: it has reached a
48.8% frame by frame F0 estimation accuracy (task 1); it has been 3rd
ranked in
the mixed set note tracking (task 2a, with an F-measure of 22.7%), and 1st ranked
in the piano-only tracking note task (task 2b).
23
Fig. 2.5. Bispectrum representation of a monophonic synthesized audio signals (a) and of a
synthesized bichord (b). The regions into dotted lines (in the bispectrum domain) highlight
that local maxima of both single monophonic sound patterns are clearly separated, while
they overlap in the spectral representation.
2.4 Discussion and Conclusions
From this review work some general aspects, concerning automatic music
transcription systems can be gathered. Automatic transcription of polyphonic
music is one of the most challenging task in the MIR research field; in fact, this is
to be considered as a conjunction of several tasks, which can be accomplished
jointly or by using dedicated procedures. From this point of view, a modular
architecture seems to be the most robust approach for a problem solution. Such
construct perfectly matches with Martin's idea of a blackboard architecture
(Martin 1996a). Many researchers still believe that signal processing strategies are
a fundamental basis, although such strategies, as widely demonstrated, can
provide better results if they work jointly with other a priori knowledge sources.
This statement recalls the parallel between perceptual and brain abstraction levels
in human cognition process.
While human perceptual approach to music has been successfully studied and
implemented through the Computational Auditory Scene Analysis (CASA),
knowledge at higher levels of abstraction is more difficult to be coded into an
computational framework, since it must be consistent with experience, and it often
needs training to avoid misleading or ambiguous decisions. Such knowledge is
commonly represented by all those models which aim at reproducing human
capabilities in features extraction and grouping (e.g., harmony related models,
musical key finding etc…). The experience of a well-trained musician can be
24
understood as a greatly flexible and deep network of state-machine like hints, as
well as complex matching procedures.
Review of music transcription systems in literature suggests that time-
frequency representation (usually performed through short-time Fourier
transform) of the signal is the most used front end, upon which pitch estimation
and onset/offset detection strategies can be applied. Multi resolution spectrogram
representation (obtained by using constant-Q or wavelet transform) seems to be, in
our opinion, the most suitable, since it fits properly the exponential spacing of
note frequencies, and it also reduces computational load to achieve the desired
time/frequency resolution. Auditory model based front ends have been largely
studied and applied in the 90s; however, the interest toward this approach has
decreased. Time domain techniques are becoming more and more infrequent,
since they have provided poor performances in polyphonic contexts.
About pitch estimation strategies, the largely adopted class of spectral content
peak-picking based algorithms has revealed to be not sufficient to achieve
satisfactory transcription accuracies. Actually, amplitude thresholding in the
spectrum domain, as well as simple harmonic pattern matching, leads to frequent
false positive detection, if no other knowledge is applied. A large variety of
models has been proposed to spectral analysis, and it is not easy to find out if
which is the best approach among the others. The most used techniques in recent
literature are: Nonnegative Matrix Factorization (Smaragdis and Brown 2003),
(Virtanen 2007), (Vincent et al. 2008), Hidden Markov Models (Raphael 2002),
(Ryynänen and Klapuri 2005), (Chang et al. 2008), Bayesian models (Kashino et
al 1995), (Godsill and Davy 2003), (Godsill et al. 2006), (Dubois and Davy 2007),
generative harmonic models (Cemgil and Kappen 2006), and the use of jointed
frequency and time information.
Onset detection is often devolved upon detecting rapid spectral energy over
time. Techniques such as the phase-vocoder based functions, applied to audio
spectrogram, seem to be more robust with respect to peak-picking algorithms
performed upon the signal envelope. Offset detection is still considered as of less
perceptual importance. Statistical frameworks offer an interesting perspective in
solving discontinuities in joint time-pitch information, typically yielded by lower
processing levels techniques. On the contrary, other devices that usually reach a
deep level of specialization, like neural networks, are more suitable for particular
areas or subsets of automatic transcription; actually this kind of tools is often
trained at recognizing specific notes or at inferring particular instrumental models
(Marolt 2001).
In conclusion, as a key point for future work, we can assert that model based
integration seems to be an area definitely more amenable to new solutions, with
respect to signal processing field. We expect that the increasing progress and
improvements in computational processing will allow to build more and more
refined systems, with a higher parallelism degree and a joint involvement of a
greater number of techniques.
25
References
(Argenti et al. 2009) Argenti F, Nesi P and Pantaleo G (2009) Automatic Transcription of
Polyphonic Music Based on Constant-Q Bispectral Analysis for MIREX 2009. Proc. on 10th
ISMIR Conference.
(Bello 2003) Bello JP (2003) Towards the Automated Analysis of Simple Polyphonic Music: A
Knowledge-based Approach. PhD Thesis, Jan. 2003.


![MONOPHONIC!AND!blogs.maristassegovia.org/secundaria1/files/Unit-4.pdfUNIT!4! !MONOPHONIC!AND!POLYPHONIC!MUSIC!!]! Homophonic!music:!This!texture!is!characterized!by!different!pitches!occurring!](https://img.pdfslide.net/doc/110x75/60f75ec1455f341ad3153fd0/monophonicandblogs-unit4-monophonicandpolyphonicmusic-homophonicmusicthistextureischaracterizedbydifferentpitchesoccurring.jpg)