Embed Size (px)
Citation preview
AUTOSTRADA TORINO – MILANOSOCIETA’ INIZIATIVE AUTOSTRADALI E SERVIZI
GAVIO GROUP
SOCIETA’ INIZIATIVE AUTOSTRADALI E SERVIZI
March, 2012
IndexIndexKey Facts
Group Structure
Financial Results
Concession AgreementsConcession Agreements
Group Financial Structure
Closing Remarks
AppendixAppendix
Key Facts
Group Structure
Financial Results
Concession AgreementsConcession Agreements
Group Financial Structure
Closing Remarks
AppendixAppendix
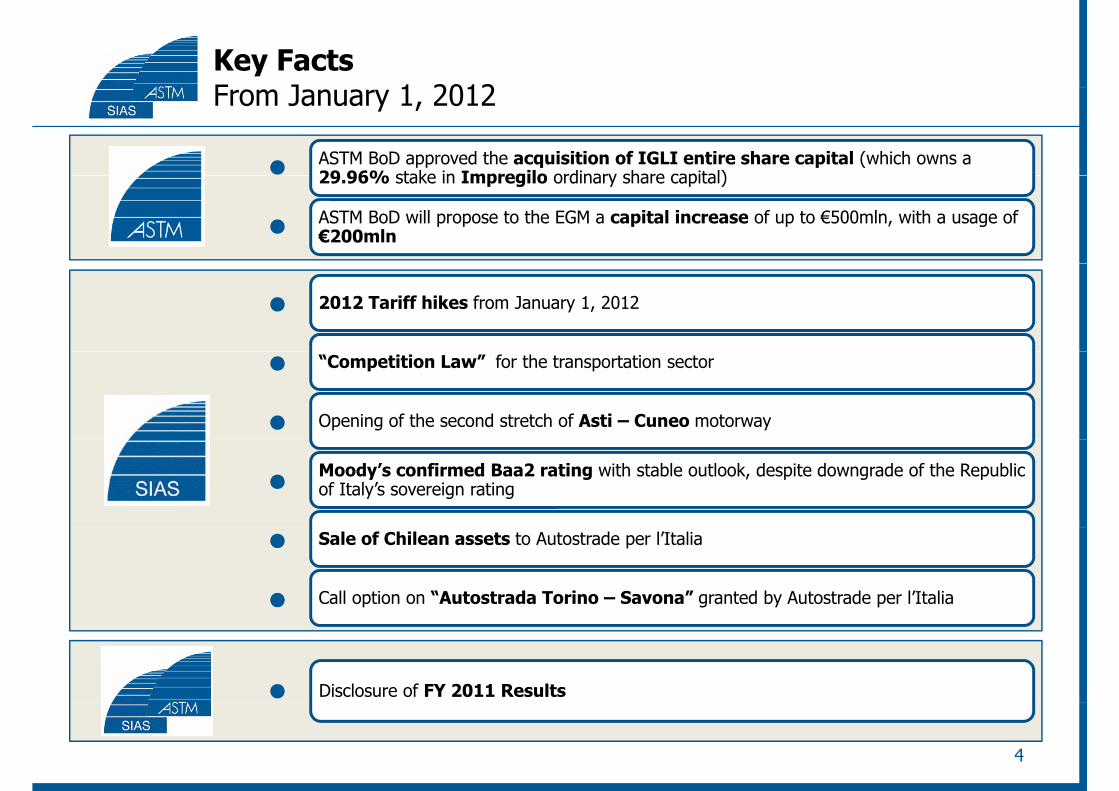
Key FactsF J 1 2012From January 1, 2012
ASTM BoD approved the acquisition of IGLI entire share capital (which owns a 29 96% stake in Impregilo ordinary share capital)29.96% stake in Impregilo ordinary share capital)
ASTM BoD will propose to the EGM a capital increase of up to €500mln, with a usage of €200mln
2012 Tariff hikes from January 1, 2012
“Competition Law” for the transportation sector
Opening of the second stretch of Asti – Cuneo motorway
Moody’s confirmed Baa2 rating with stable outlook, despite downgrade of the Republic of Italy’s sovereign rating
Sale of Chilean assets to Autostrade per l’Italia
Call option on “Autostrada Torino – Savona” granted by Autostrade per l’Italia
Disclosure of FY 2011 Results
4
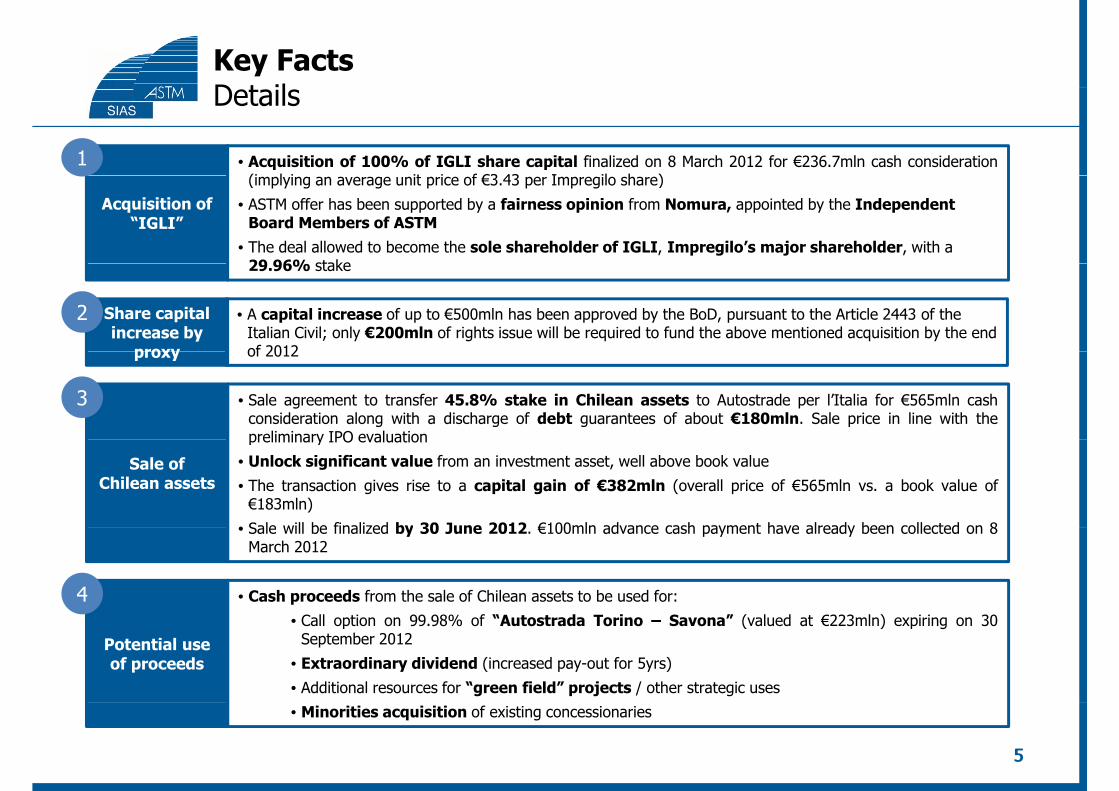
Key FactsD t ilDetails
• Acquisition of 100% of IGLI share capital finalized on 8 March 2012 for €236.7mln cash consideration(i l i it i f €3 43 I il h )
1
Acquisition of “IGLI”
(implying an average unit price of €3.43 per Impregilo share)
• ASTM offer has been supported by a fairness opinion from Nomura, appointed by the Independent Board Members of ASTM
• The deal allowed to become the sole shareholder of IGLI, Impregilo’s major shareholder, with a 29 96% stake29.96% stake
Share capital increase by
proxy
• A capital increase of up to €500mln has been approved by the BoD, pursuant to the Article 2443 of the Italian Civil; only €200mln of rights issue will be required to fund the above mentioned acquisition by the end of 2012
2
• Sale agreement to transfer 45.8% stake in Chilean assets to Autostrade per l’Italia for €565mln cashconsideration along with a discharge of debt guarantees of about €180mln. Sale price in line with thepreliminary IPO evaluation
3
proxy of 2012
Sale of Chilean assets
preliminary IPO evaluation
• Unlock significant value from an investment asset, well above book value
• The transaction gives rise to a capital gain of €382mln (overall price of €565mln vs. a book value of€183mln)
• Sale will be finalized by 30 June 2012 €100mln advance cash payment have already been collected on 8• Sale will be finalized by 30 June 2012. €100mln advance cash payment have already been collected on 8March 2012
• Cash proceeds from the sale of Chilean assets to be used for:
C ll i 99 98% f “A d T i S ” ( l d €223 l ) i i 30
4
Potential use of proceeds
• Call option on 99.98% of “Autostrada Torino – Savona” (valued at €223mln) expiring on 30September 2012
• Extraordinary dividend (increased pay-out for 5yrs)
• Additional resources for “green field” projects / other strategic uses
55
• Minorities acquisition of existing concessionaries
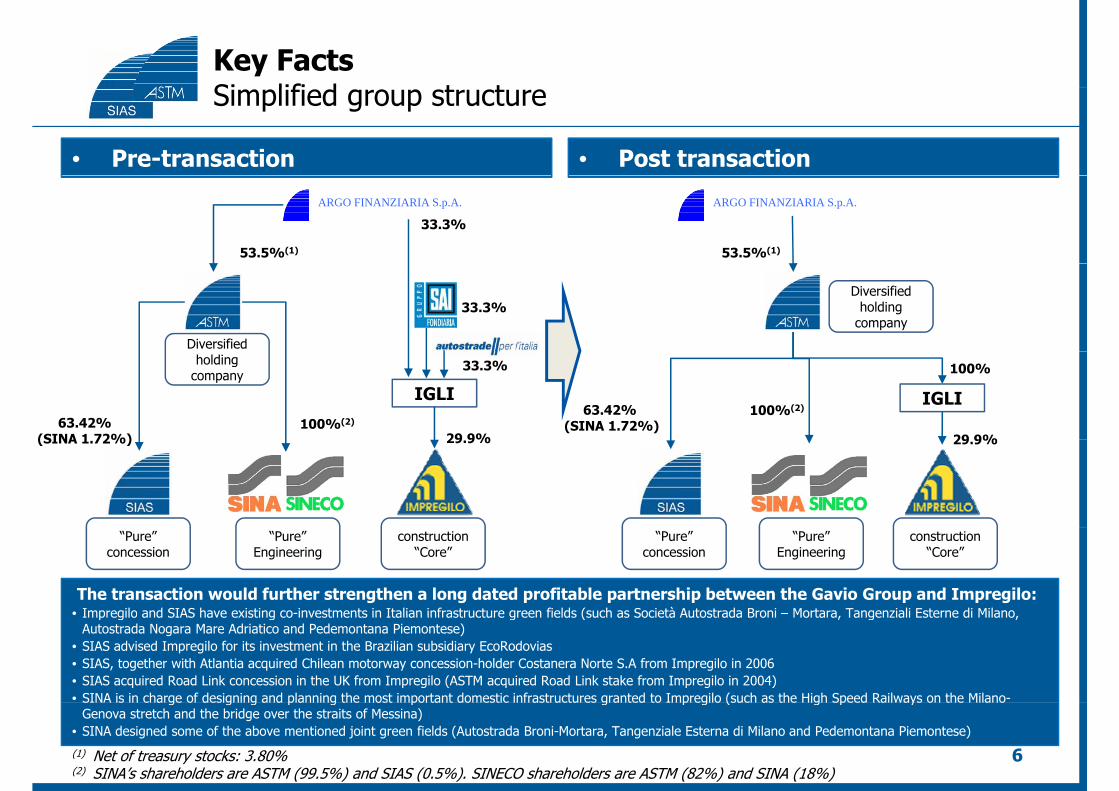
Key FactsSi lifi d t tSimplified group structure
• Pre-transaction • Post transaction
ARGO FINANZIARIA S.p.A.
33.3%
53.5%(1)
ARGO FINANZIARIA S.p.A.
53.5%(1)
Diversified
Diversified holding
company33.3%
IGLI
holding company
IGLI
100%
29 9%29 9%
33.3%
63.42% (SINA 1 72%)
63.42%(SINA 1.72%) 100%(2)
100%(2)
29.9%29.9%(SINA 1.72%)
The transaction would further strengthen a long dated profitable partnership between the Gavio Group and Impregilo:• Impregilo and SIAS have existing co-investments in Italian infrastructure green fields (such as Società Autostrada Broni – Mortara Tangenziali Esterne di Milano
“Pure” concession
construction“Core”
construction“Core”
“Pure” concession
“Pure” Engineering
“Pure” Engineering
Impregilo and SIAS have existing co investments in Italian infrastructure green fields (such as Società Autostrada Broni Mortara, Tangenziali Esterne di Milano, Autostrada Nogara Mare Adriatico and Pedemontana Piemontese)
• SIAS advised Impregilo for its investment in the Brazilian subsidiary EcoRodovias• SIAS, together with Atlantia acquired Chilean motorway concession-holder Costanera Norte S.A from Impregilo in 2006• SIAS acquired Road Link concession in the UK from Impregilo (ASTM acquired Road Link stake from Impregilo in 2004)• SINA is in charge of designing and planning the most important domestic infrastructures granted to Impregilo (such as the High Speed Railways on the Milano-g g g p g p g p g ( g p y
Genova stretch and the bridge over the straits of Messina)• SINA designed some of the above mentioned joint green fields (Autostrada Broni-Mortara, Tangenziale Esterna di Milano and Pedemontana Piemontese)
6(1) Net of treasury stocks: 3.80%(2) SINA’s shareholders are ASTM (99.5%) and SIAS (0.5%). SINECO shareholders are ASTM (82%) and SINA (18%)
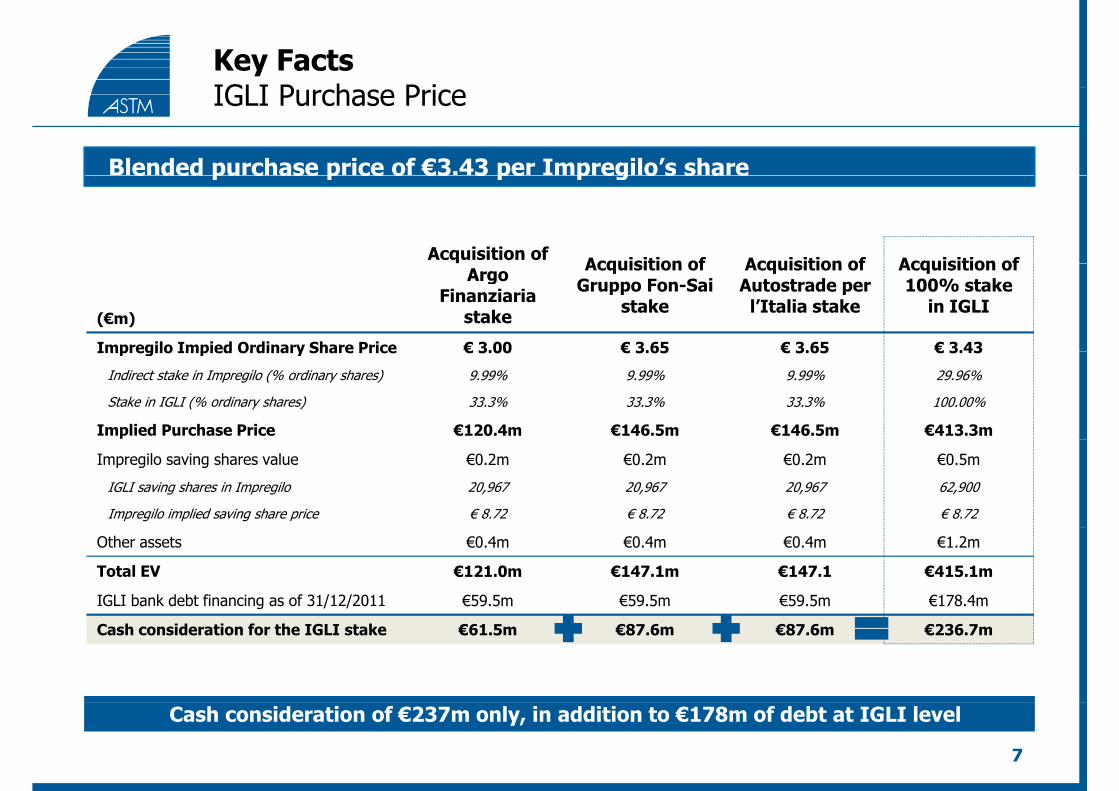
Key FactsIGLI P h P iIGLI Purchase Price
Blended purchase price of €3.43 per Impregilo’s share
Acquisition of Acquisition of Acquisition of Acquisition of
e ded pu c ase p ce o €3 3 pe p eg o s s a e
(€m)
Argo Finanziaria
stake
Acquisition of Gruppo Fon-Sai
stake
Acquisition of Autostrade per
l’Italia stake
Acquisition of 100% stake
in IGLI
Impregilo Impied Ordinary Share Price € 3.00 € 3.65 € 3.65 € 3.43Impregilo Impied Ordinary Share Price € 3.00 € 3.65 € 3.65 € 3.43
Indirect stake in Impregilo (% ordinary shares) 9.99% 9.99% 9.99% 29.96%
Stake in IGLI (% ordinary shares) 33.3% 33.3% 33.3% 100.00%
Implied Purchase Price €120.4m €146.5m €146.5m €413.3m
Impregilo saving shares value €0.2m €0.2m €0.2m €0.5m
IGLI saving shares in Impregilo 20,967 20,967 20,967 62,900
Impregilo implied saving share price € 8.72 € 8.72 € 8.72 € 8.72
Other assets €0.4m €0.4m €0.4m €1.2m
Total EV €121.0m €147.1m €147.1 €415.1m
IGLI bank debt financing as of 31/12/2011 €59.5m €59.5m €59.5m €178.4m
Cash consideration for the IGLI stake €61.5m €87.6m €87.6m €236.7m
Cash consideration of €237m only, in addition to €178m of debt at IGLI level
7
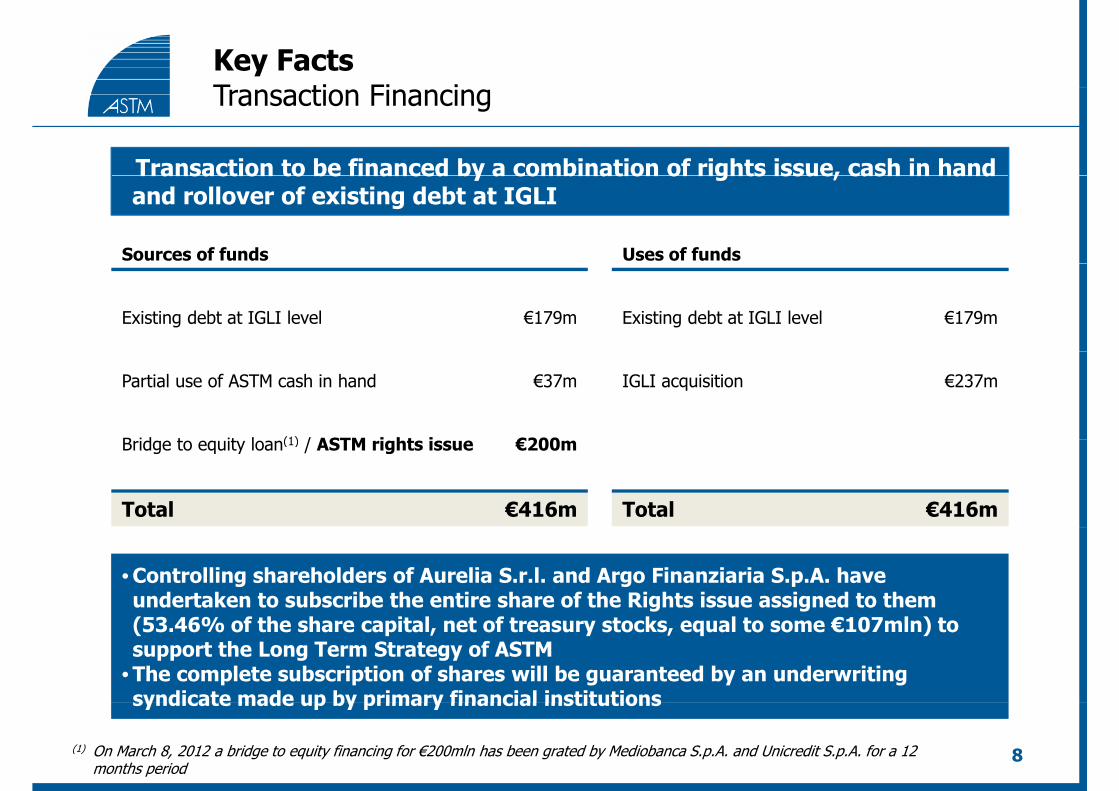
Key FactsT ti Fi iTransaction Financing
Transaction to be financed by a combination of rights issue, cash in handTransaction to be financed by a combination of rights issue, cash in hand and rollover of existing debt at IGLI
Sources of funds Uses of funds
Existing debt at IGLI level €179m Existing debt at IGLI level €179m
Partial use of ASTM cash in hand €37m IGLI acquisition €237m
B id t it l (1) / ASTM i ht i €200Bridge to equity loan(1) / ASTM rights issue €200m
Total €416m Total €416m
• Controlling shareholders of Aurelia S.r.l. and Argo Finanziaria S.p.A. have undertaken to subscribe the entire share of the Rights issue assigned to them (53.46% of the share capital, net of treasury stocks, equal to some €107mln) to support the Long Term Strategy of ASTM
• The complete subscription of shares will be guaranteed by an underwriting syndicate made up by primary financial institutionssyndicate made up by primary financial institutions
8(1) On March 8, 2012 a bridge to equity financing for €200mln has been grated by Mediobanca S.p.A. and Unicredit S.p.A. for a 12 months period
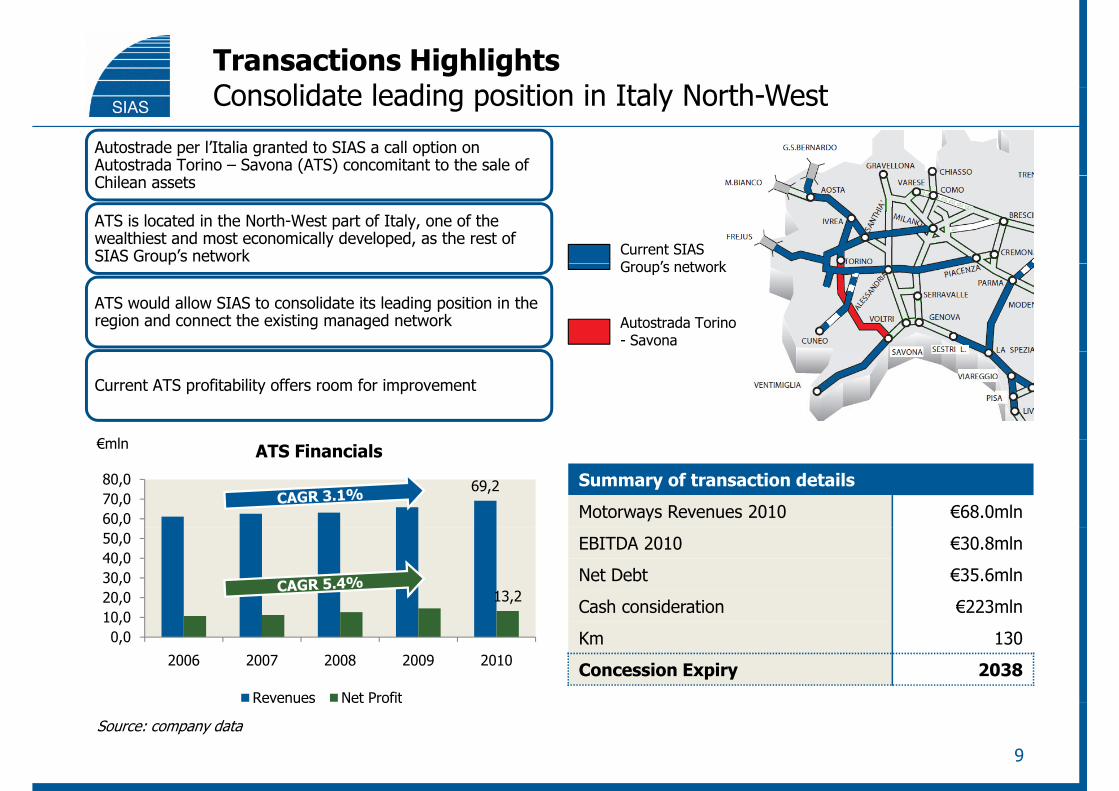
Transactions HighlightsC lid t l di iti i It l N th W tConsolidate leading position in Italy North-West
Autostrade per l’Italia granted to SIAS a call option on Autostrada Torino – Savona (ATS) concomitant to the sale of Chilean assets
ATS is located in the North-West part of Italy, one of the wealthiest and most economically developed, as the rest of SIAS Group’s network Current SIAS
G ’ t kp
ATS would allow SIAS to consolidate its leading position in the region and connect the existing managed network
Group’s network
Autostrada Torino - Savona
Current ATS profitability offers room for improvement
€ l
69,2
60,070,080,0
ATS Financials
Summary of transaction details
Motorways Revenues 2010 €68.0mln
€mln
13,210 020,030,040,050,0 EBITDA 2010 €30.8mln
Net Debt €35.6mln
Cash consideration €223mln
0,010,0
2006 2007 2008 2009 2010
Revenues Net Profit
Km 130
Concession Expiry 2038e e ues et o t
9
Source: company data
Key Facts
Group Structure
Financial Results
Concession AgreementsConcession Agreements
Group Financial Structure
Closing Remarks
AppendixAppendix
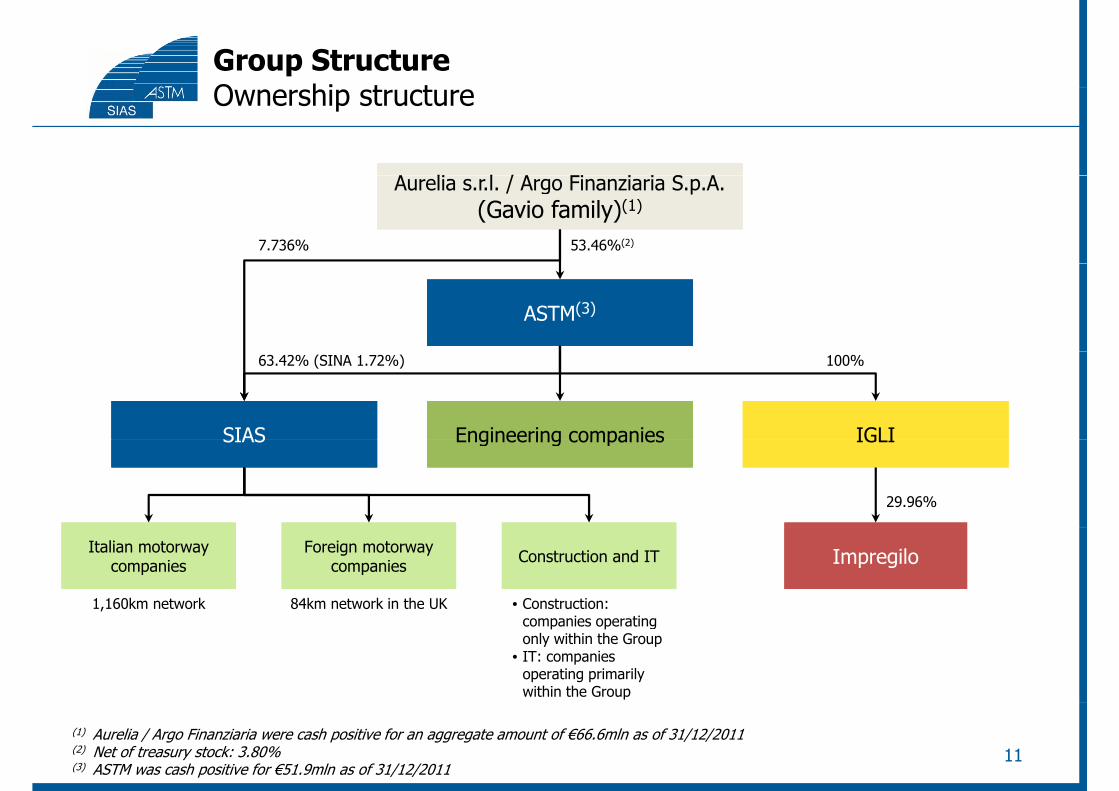
Group StructureO hi t tOwnership structure
A li l / A Fi i i S AA li l / A Fi i i S AAurelia s.r.l. / Argo Finanziaria S.p.A.(Gavio family)(1)
Aurelia s.r.l. / Argo Finanziaria S.p.A.(Gavio family)(1)
7.736% 53.46%(2)
ASTM(3)ASTM(3)
SIASSIAS IGLIIGLIEngineering companiesEngineering companies
63.42% (SINA 1.72%) 100%
SIASSIAS IGLIIGLIEngineering companiesEngineering companies
29.96%
Italian motorway companies
Italian motorway companies
Foreign motorway companies
Foreign motorway companies Construction and ITConstruction and IT ImpregiloImpregilo
1,160km network 84km network in the UK • Construction: companies operating only within the Group
• IT: companies operating primarily within the Group
11(1) Aurelia / Argo Finanziaria were cash positive for an aggregate amount of €66.6mln as of 31/12/2011(2) Net of treasury stock: 3.80%(3) ASTM was cash positive for €51.9mln as of 31/12/2011
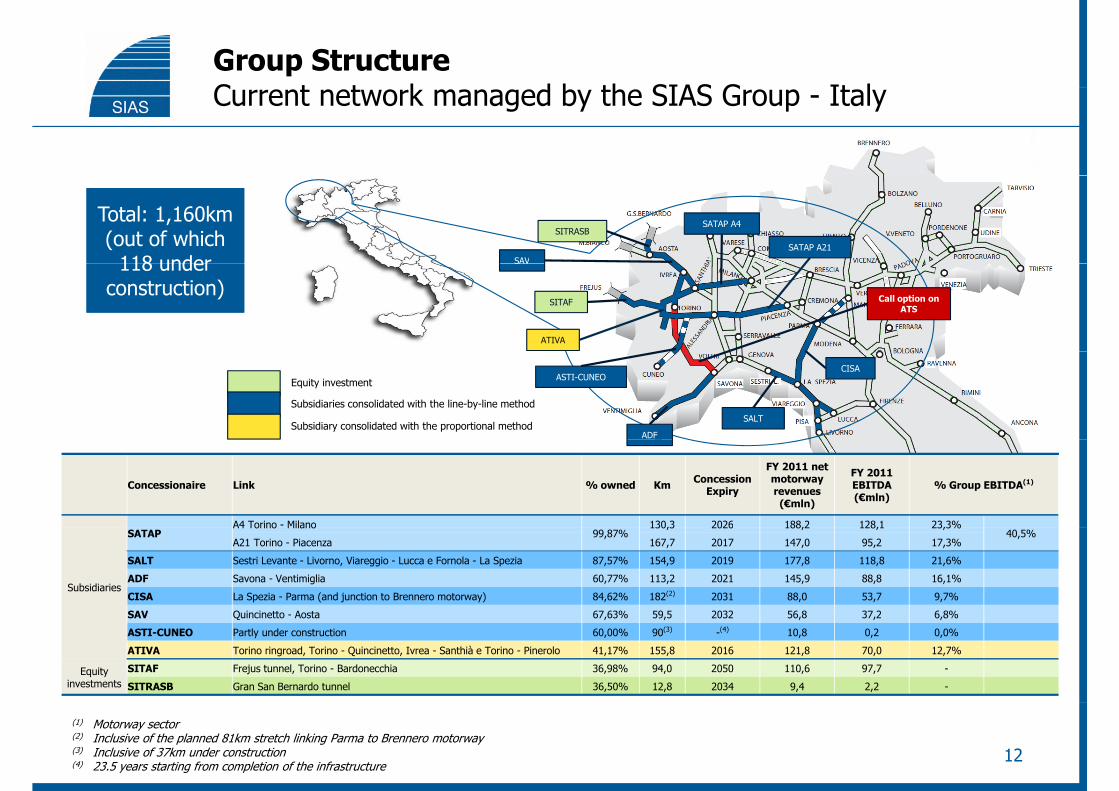
Group StructureC t t k d b th SIAS G It lCurrent network managed by the SIAS Group - Italy
SATAP A4
SATAP A21SAV
SITRASBTotal: 1,160km(out of which
118 under
Total: 1,160km(out of which
118 under SAV
ATIVA
SITAF
118 under construction)
118 under construction)
Call option on ATS
ASTI-CUNEO
ADF
CISA
SALT
Equity investment
Subsidiaries consolidated with the line-by-line method
Subsidiary consolidated with the proportional method
Concessionaire Link % owned Km Concession Expiry
FY 2011 net motorway revenues (€mln)
FY 2011 EBITDA (€mln)
% Group EBITDA(1)
A4 Torino - Milano 130,3 2026 188,2 128,1 23,3%
Subsidiaries
SATAP A4 Torino Milano
99,87%130,3 2026 188,2 128,1 23,3%
40,5%A21 Torino - Piacenza 167,7 2017 147,0 95,2 17,3%
SALT Sestri Levante - Livorno, Viareggio - Lucca e Fornola - La Spezia 87,57% 154,9 2019 177,8 118,8 21,6%
ADF Savona - Ventimiglia 60,77% 113,2 2021 145,9 88,8 16,1%
CISA La Spezia - Parma (and junction to Brennero motorway) 84,62% 182(2) 2031 88,0 53,7 9,7%
SAV Quincinetto - Aosta 67 63% 59 5 2032 56 8 37 2 6 8%SAV Quincinetto - Aosta 67,63% 59,5 2032 56,8 37,2 6,8%
ASTI-CUNEO Partly under construction 60,00% 90(3) -(4) 10,8 0,2 0,0%
ATIVA Torino ringroad, Torino - Quincinetto, Ivrea - Santhià e Torino - Pinerolo 41,17% 155,8 2016 121,8 70,0 12,7%
Equity investments
SITAF Frejus tunnel, Torino - Bardonecchia 36,98% 94,0 2050 110,6 97,7 -
SITRASB Gran San Bernardo tunnel 36,50% 12,8 2034 9,4 2,2 -
12
(1) Motorway sector(2) Inclusive of the planned 81km stretch linking Parma to Brennero motorway(3) Inclusive of 37km under construction(4) 23.5 years starting from completion of the infrastructure
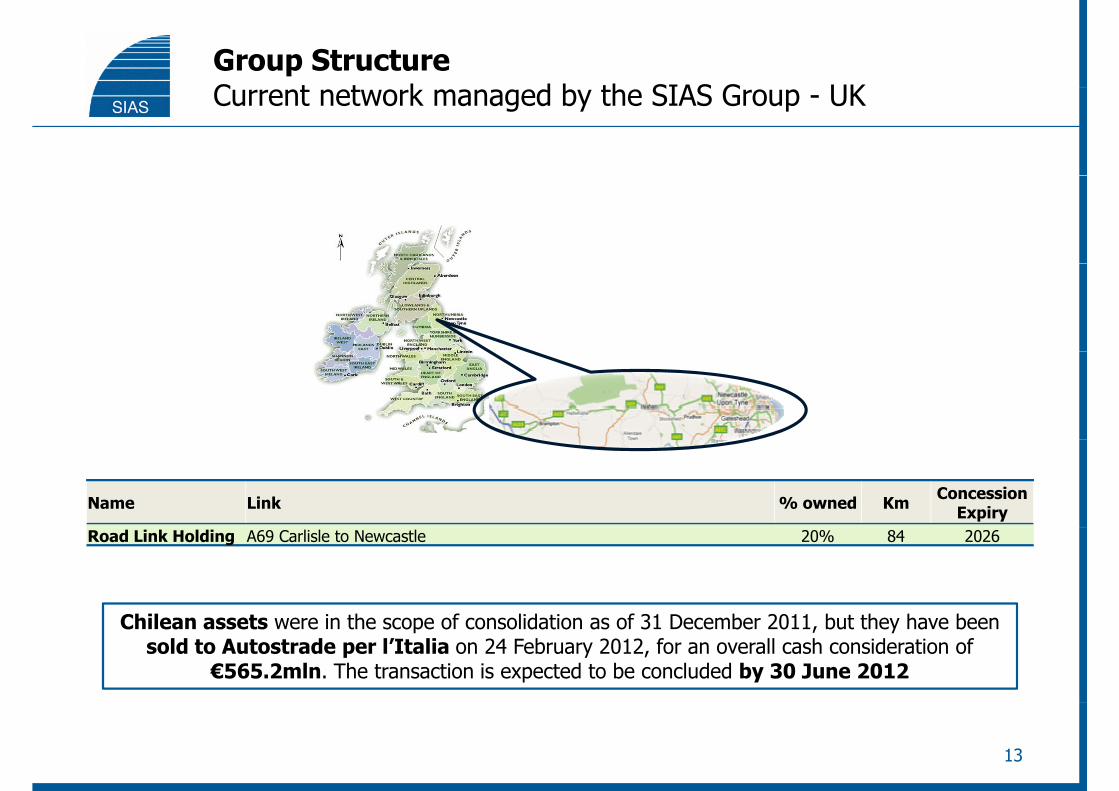
Group StructureC t t k d b th SIAS G UKCurrent network managed by the SIAS Group - UK
Name Link % owned Km Concession Expiry
Road Link Holding A69 Carlisle to Newcastle 20% 84 2026
Chil t i th f lid ti f 31 D b 2011 b t th h bChilean assets were in the scope of consolidation as of 31 December 2011, but they have been sold to Autostrade per l’Italia on 24 February 2012, for an overall cash consideration of
€565.2mln. The transaction is expected to be concluded by 30 June 2012
13
Key Facts
Group Structure
Financial Results
Concession AgreementsConcession Agreements
Group Financial Structure
Closing Remarks
AppendixAppendix
Financial ResultsFi i l hi hli htFinancial highlights
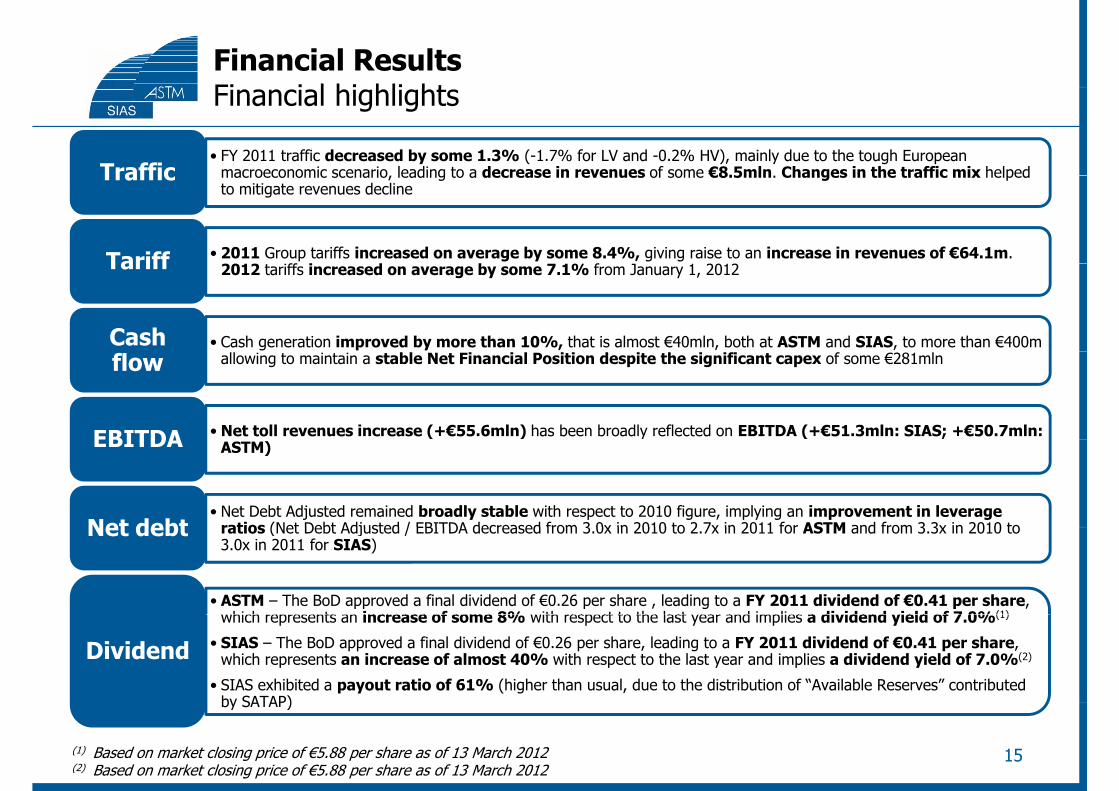
• FY 2011 traffic decreased by some 1.3% (-1.7% for LV and -0.2% HV), mainly due to the tough European macroeconomic scenario, leading to a decrease in revenues of some €8.5mln. Changes in the traffic mix helpedTraffic macroeconomic scenario, leading to a decrease in revenues of some €8.5mln. Changes in the traffic mix helped to mitigate revenues decline
Traffic
• 2011 Group tariffs increased on average by some 8.4%, giving raise to an increase in revenues of €64.1m. 20 2 ff i d b % f 20 2Tariff 2012 tariffs increased on average by some 7.1% from January 1, 2012Tariff
• Cash generation improved by more than 10%, that is almost €40mln, both at ASTM and SIAS, to more than €400m Cash allowing to maintain a stable Net Financial Position despite the significant capex of some €281mlnflow
• Net toll revenues increase (+€55.6mln) has been broadly reflected on EBITDA (+€51.3mln: SIAS; +€50.7mln: EBITDA ASTM)EBITDA
• Net Debt Adjusted remained broadly stable with respect to 2010 figure, implying an improvement in leverage ratios (Net Debt Adjusted / EBITDA decreased from 3 0x in 2010 to 2 7x in 2011 for ASTM and from 3 3x in 2010 toNet debt ratios (Net Debt Adjusted / EBITDA decreased from 3.0x in 2010 to 2.7x in 2011 for ASTM and from 3.3x in 2010 to 3.0x in 2011 for SIAS)
Net debt
• ASTM – The BoD approved a final dividend of €0.26 per share , leading to a FY 2011 dividend of €0.41 per share, which represents an increase of some 8% with respect to the last year and implies a dividend yield of 7 0%(1)which represents an increase of some 8% with respect to the last year and implies a dividend yield of 7.0%(1)
• SIAS – The BoD approved a final dividend of €0.26 per share, leading to a FY 2011 dividend of €0.41 per share, which represents an increase of almost 40% with respect to the last year and implies a dividend yield of 7.0%(2)
• SIAS exhibited a payout ratio of 61% (higher than usual, due to the distribution of “Available Reserves” contributed by SATAP)
Dividend
by SATAP)
15(1) Based on market closing price of €5.88 per share as of 13 March 2012(2) Based on market closing price of €5.88 per share as of 13 March 2012
Financial ResultsT ffiTraffic
Km travelled
+1 76%+2 00%
Q1 Q2 Q3 Q4
2010
+1 00%
Q1 Q2 Q3 Q4
2011
+1,76%
+0,98%
+1,35%
+1,00%
+1,50%
+2,00% +0,59%
-0,50%
+0,00%
+0,50%
+1,00%
+0,00%
+0,50%-1,23%
-1,57%
-2 50%
-2,00%
-1,50%
-1,00%
-0,62%-1,00%
-0,50%
-3,04%-3,50%
-3,00%
2,50%
(3)
Like-for-like: -2.48%(3)
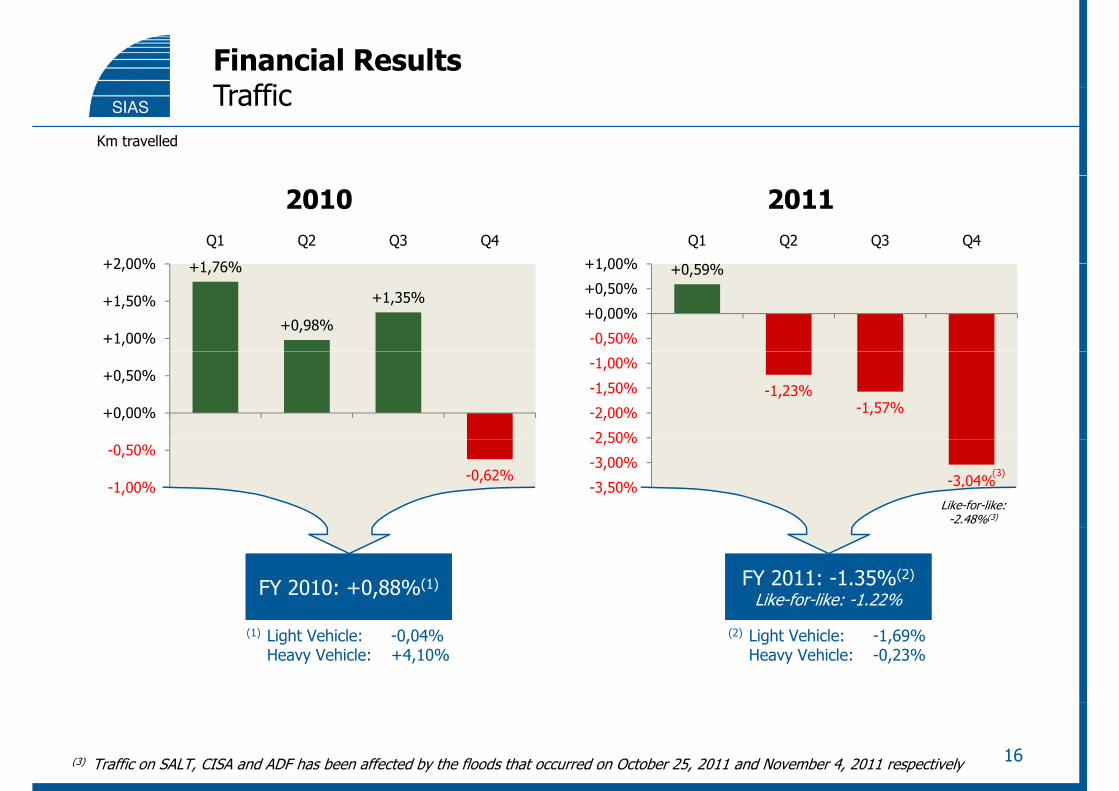
FY 2010: +0,88%(1)FY 2010: +0,88%(1) FY 2011: -1.35%(2)
Like-for-like: -1.22%FY 2011: -1.35%(2)
Like-for-like: -1.22%
(1) Light Vehicle: -0,04%Heavy Vehicle: +4,10%
(2) Light Vehicle: -1,69%Heavy Vehicle: -0,23%
16(3) Traffic on SALT, CISA and ADF has been affected by the floods that occurred on October 25, 2011 and November 4, 2011 respectively
Financial ResultsT ffi b tTraffic by category
2011 - LV FY 2011 - LVKm travelled
-0,43%-0,50%
+0,00%
Q1 Q2 Q3 Q4
-1 00%
-0,50%
+0,00%
-1,62%-2,00%
-1,50%
-1,00%
-1,69%-2,00%
-1,50%
1,00%
-2,14%
-2,44%
-3,00%
-2,50%
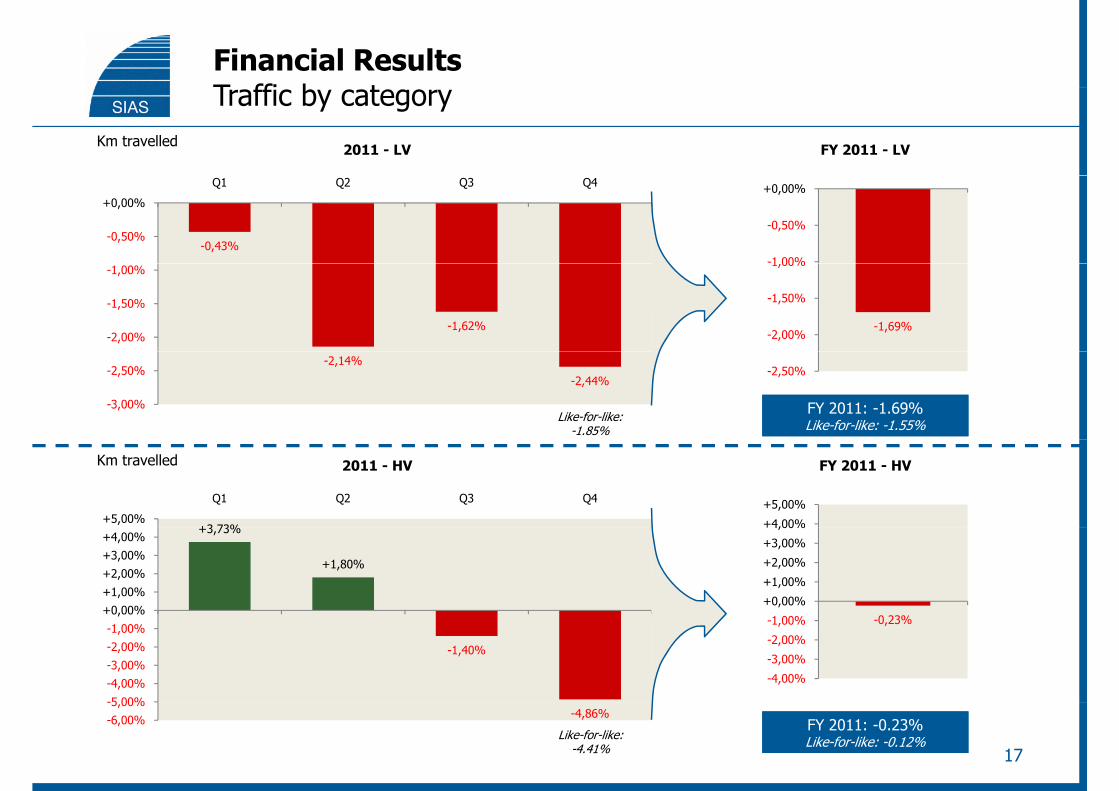
FY 2011: -1.69%Like-for-like: -1.55%FY 2011: -1.69%Like-for-like: -1.55%
Like-for-like: -1.85%
-2,50%
+3 73%+5,00%
Q1 Q2 Q3 Q4
2011 - HV
+4,00%
+5,00%
FY 2011 - HVKm travelled
+3,73%
+1,80%
+0,00%+1,00%
+2,00%+3,00%
+4,00%
+0,00%
+1,00%
+2,00%
+3,00%
+4,00%
-1,40%
-5 00%
-4,00%-3,00%
-2,00%-1,00%
,-0,23%
-4,00%
-3,00%
-2,00%
-1,00%
-4,86%-6,00%5,00%
FY 2011: -0.23%Like-for-like: -0.12%FY 2011: -0.23%Like-for-like: -0.12%Like-for-like:
-4.41% 17
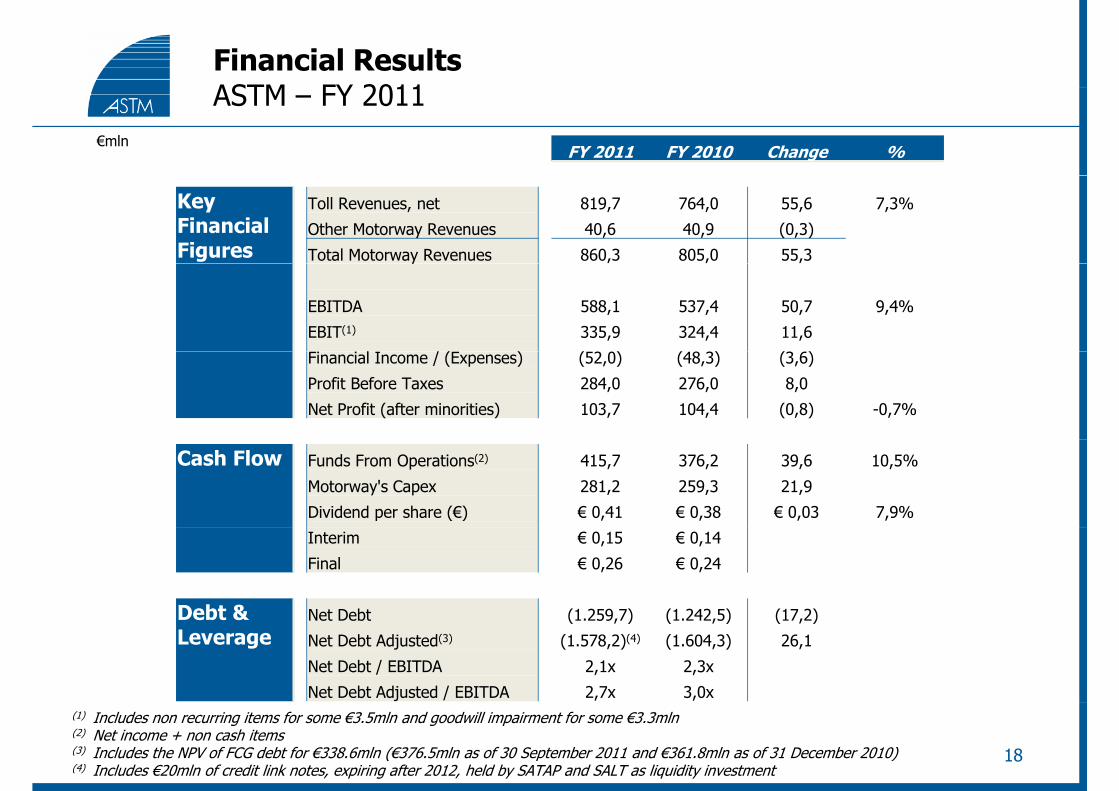
Financial ResultsASTM FY 2011ASTM – FY 2011
€mlnFY 2011 FY 2010 Change %
Key Financial Figures
Toll Revenues, net 819,7 764,0 55,6 7,3%
Other Motorway Revenues 40,6 40,9 (0,3)
Total Motorway Revenues 860,3 805,0 55,3y
EBITDA 588,1 537,4 50,7 9,4%
EBIT(1) 335,9 324,4 11,6
l / ( ) ( ) ( ) ( )Financial Income / (Expenses) (52,0) (48,3) (3,6)
Profit Before Taxes 284,0 276,0 8,0
Net Profit (after minorities) 103,7 104,4 (0,8) -0,7%
Cash Flow Funds From Operations(2) 415,7 376,2 39,6 10,5%
Motorway's Capex 281,2 259,3 21,9
Dividend per share (€) € 0,41 € 0,38 € 0,03 7,9%
Interim € 0,15 € 0,14
Final € 0,26 € 0,24
Debt & Net Debt (1 259 7) (1 242 5) (17 2)Debt & Leverage
Net Debt (1.259,7) (1.242,5) (17,2)
Net Debt Adjusted(3) (1.578,2)(4) (1.604,3) 26,1
Net Debt / EBITDA 2,1x 2,3x
Net Debt Adjusted / EBITDA 2,7x 3,0x
18
(1) Includes non recurring items for some €3.5mln and goodwill impairment for some €3.3mln(2) Net income + non cash items(3) Includes the NPV of FCG debt for €338.6mln (€376.5mln as of 30 September 2011 and €361.8mln as of 31 December 2010)(4) Includes €20mln of credit link notes, expiring after 2012, held by SATAP and SALT as liquidity investment
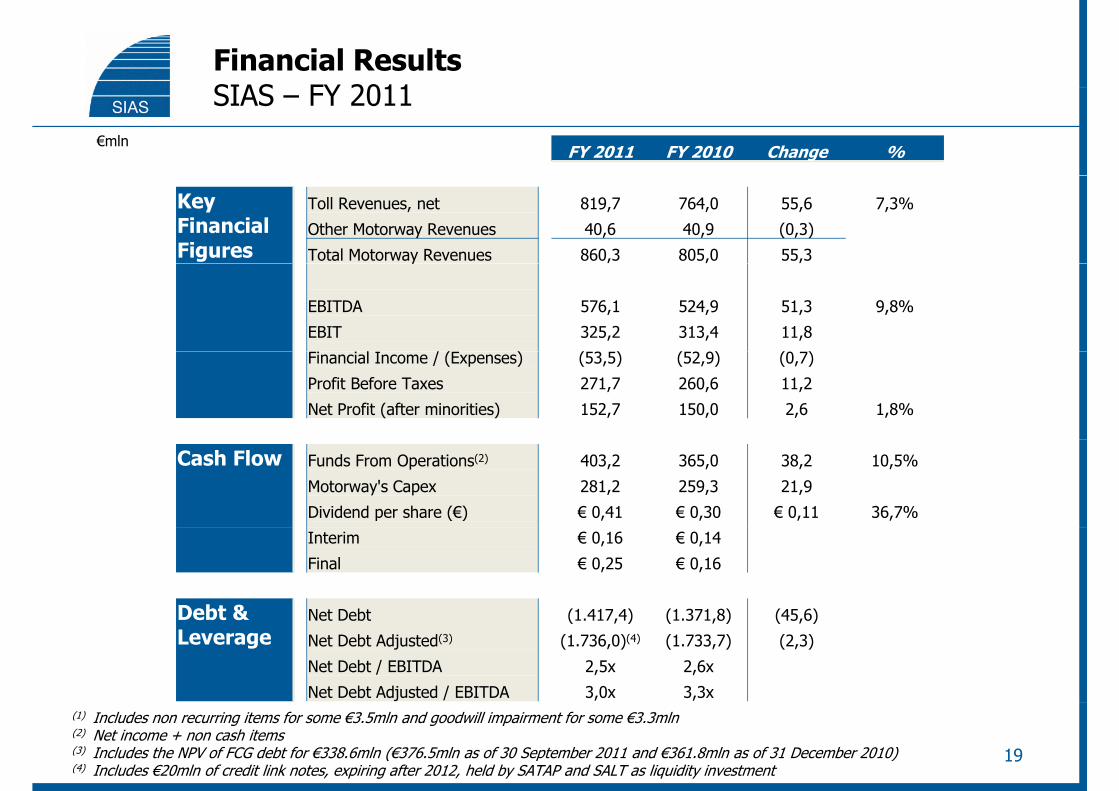
Financial ResultsSIAS FY 2011SIAS – FY 2011
€mlnFY 2011 FY 2010 Change %
Key Financial Figures
Toll Revenues, net 819,7 764,0 55,6 7,3%
Other Motorway Revenues 40,6 40,9 (0,3)
Total Motorway Revenues 860,3 805,0 55,3y
EBITDA 576,1 524,9 51,3 9,8%
EBIT 325,2 313,4 11,8
l / ( ) ( ) ( ) ( )Financial Income / (Expenses) (53,5) (52,9) (0,7)
Profit Before Taxes 271,7 260,6 11,2
Net Profit (after minorities) 152,7 150,0 2,6 1,8%
Cash Flow Funds From Operations(2) 403,2 365,0 38,2 10,5%
Motorway's Capex 281,2 259,3 21,9
Dividend per share (€) € 0,41 € 0,30 € 0,11 36,7%
Interim € 0,16 € 0,14
Final € 0,25 € 0,16
Debt & Net Debt (1 417 4) (1 371 8) (45 6)Debt & Leverage
Net Debt (1.417,4) (1.371,8) (45,6)
Net Debt Adjusted(3) (1.736,0)(4) (1.733,7) (2,3)
Net Debt / EBITDA 2,5x 2,6x
Net Debt Adjusted / EBITDA 3,0x 3,3x
19
(1) Includes non recurring items for some €3.5mln and goodwill impairment for some €3.3mln(2) Net income + non cash items(3) Includes the NPV of FCG debt for €338.6mln (€376.5mln as of 30 September 2011 and €361.8mln as of 31 December 2010)(4) Includes €20mln of credit link notes, expiring after 2012, held by SATAP and SALT as liquidity investment
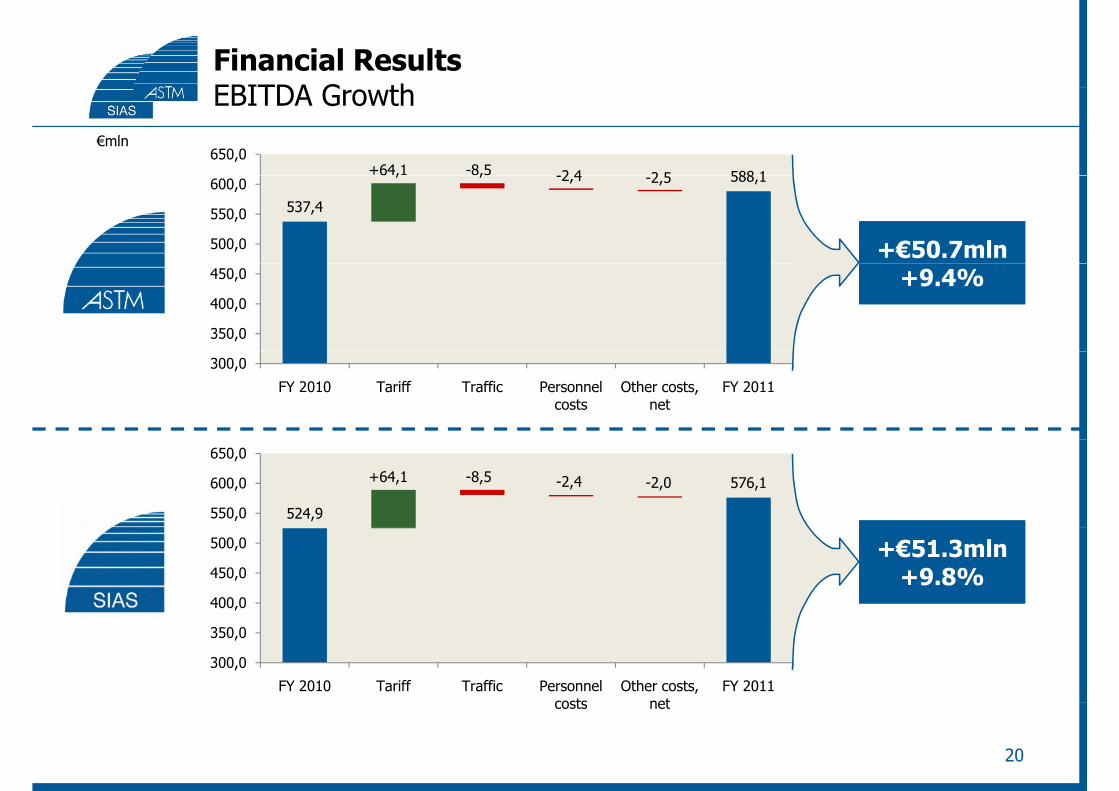
Financial ResultsEBITDA G thEBITDA Growth
588 1650,0
€mln
+64,1 -8,5 -2 4 2 5
537,4
588,1
500,0
550,0
600,0
+€50.7mln+€50.7mln
, , -2,4 -2,5
350,0
400,0
450,0 +9.4%+9.4%
300,0
FY 2010 Tariff Traffic Personnel costs
Other costs, net
FY 2011
524,9
576,1
550,0
600,0
650,0
+64,1 -8,5 -2,4 -2,0
400,0
450,0
500,0 +€51.3mln+9.8%
+€51.3mln+9.8%
300,0
350,0
FY 2010 Tariff Traffic Personnel costs
Other costs, net
FY 2011
20
costs net
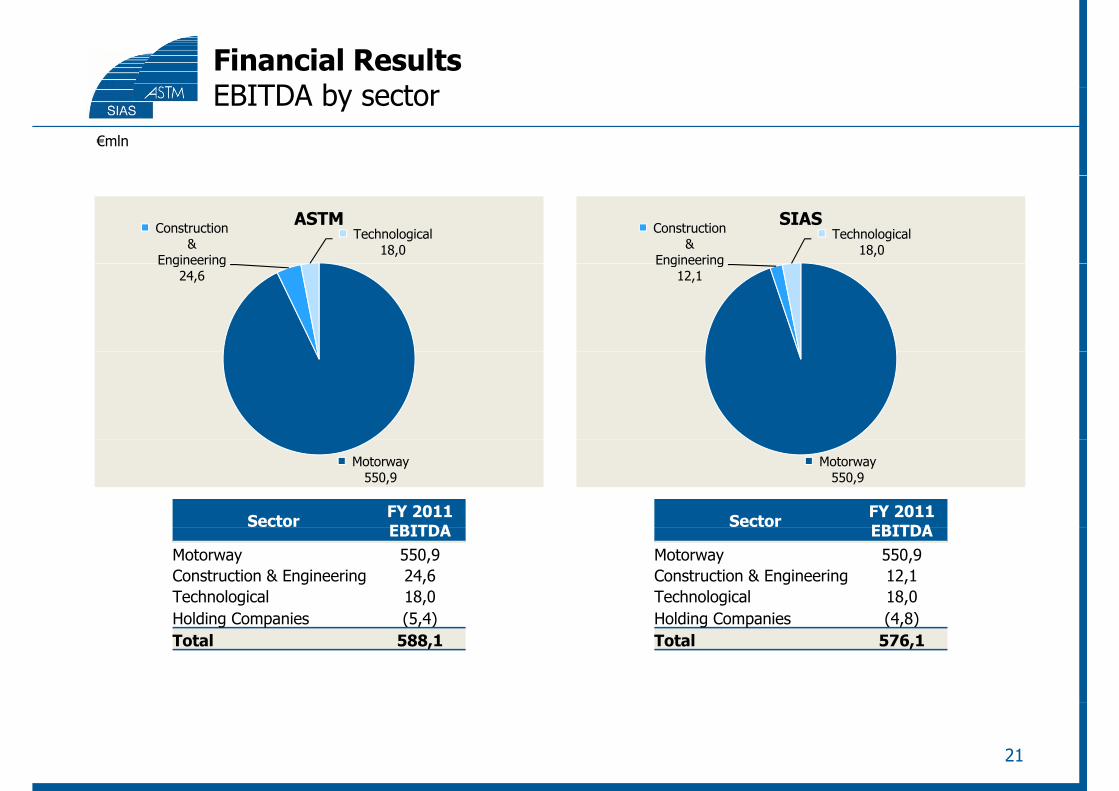
Financial ResultsEBITDA b tEBITDA by sector
€mln
Construction &
Engineering
Technological18,0
ASTM Construction &
Engineering
Technological18,0
SIAS
Engineering24,6
Engineering12,1
Sector FY 2011 EBITDA Sector FY 2011
EBITDA
Motorway550,9
Motorway550,9
EBITDAMotorway 550,9Construction & Engineering 24,6Technological 18,0H ldi C i (5 4)
EBITDAMotorway 550,9Construction & Engineering 12,1Technological 18,0H ldi C i (4 8)Holding Companies (5,4)
Total 588,1Holding Companies (4,8)Total 576,1
21
Key Facts
Group Structure
Financial Results
Concession AgreementsConcession Agreements
Group Financial Structure
Closing Remarks
AppendixAppendix
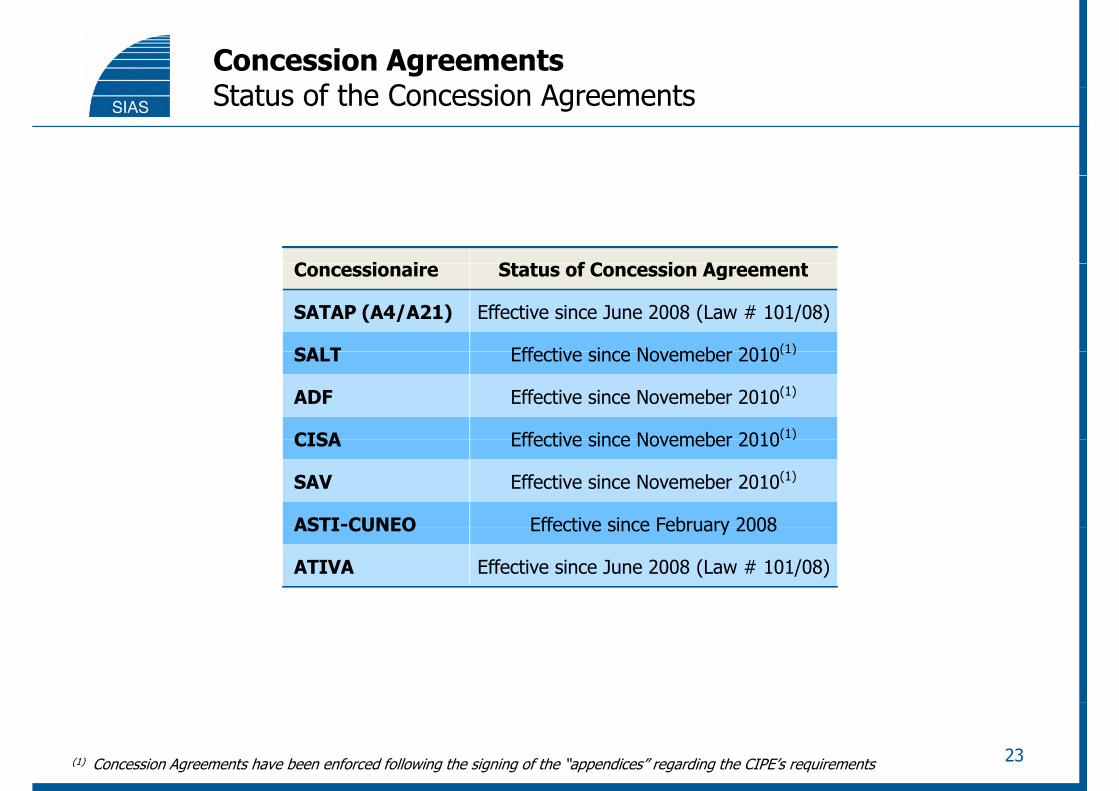
Concession AgreementsSt t f th C i A tStatus of the Concession Agreements
C i i St t f C i A tConcessionaire Status of Concession Agreement
SATAP (A4/A21) Effective since June 2008 (Law # 101/08)
SALT Effective since Novemeber 2010(1)SALT Effective since Novemeber 2010(1)
ADF Effective since Novemeber 2010(1)
CISA Effective since Novemeber 2010(1)CISA Effective since Novemeber 2010( )
SAV Effective since Novemeber 2010(1)
ASTI-CUNEO Effective since February 2008ASTI CUNEO Effective since February 2008
ATIVA Effective since June 2008 (Law # 101/08)
23(1) Concession Agreements have been enforced following the signing of the “appendices” regarding the CIPE’s requirements
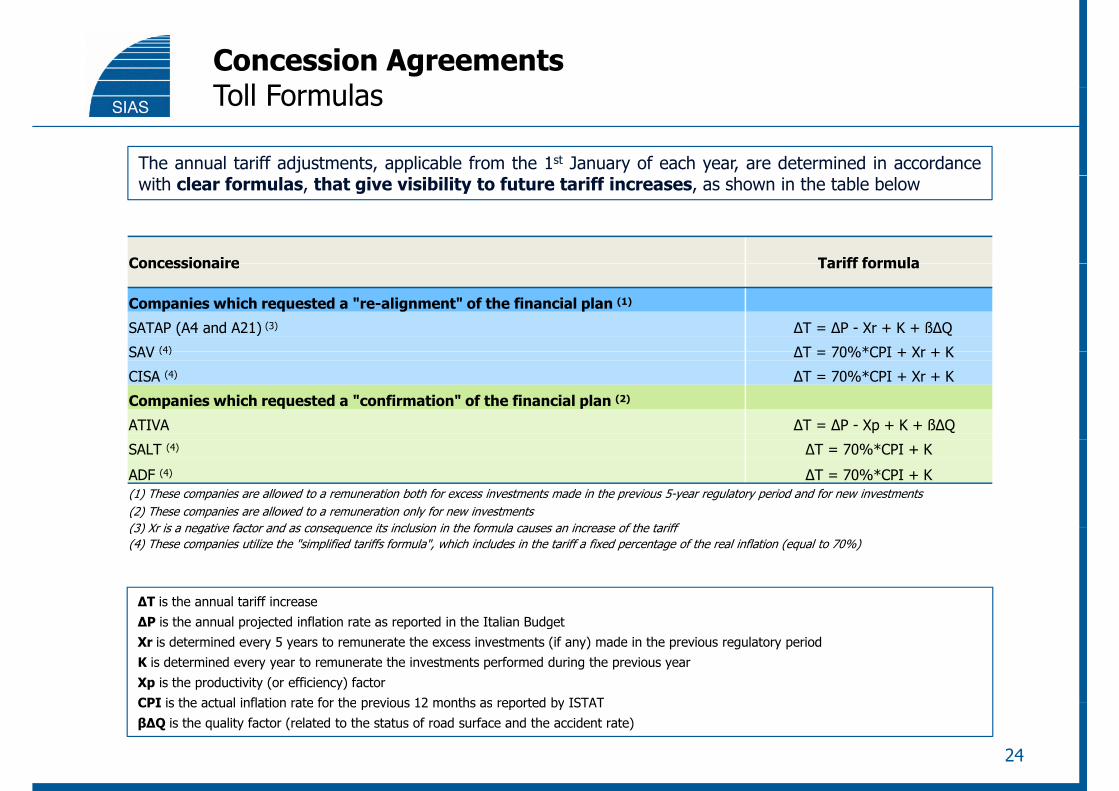
Concession AgreementsT ll F lToll Formulas
The annual tariff adjustments, applicable from the 1st January of each year, are determined in accordancewith clear formulas, that give visibility to future tariff increases, as shown in the table below
Concessionaire Tariff formulaConcessionaire Tariff formula
Companies which requested a "re-alignment" of the financial plan (1)
SATAP (A4 and A21) (3) ∆T = ∆P - Xr + K + ß∆Q
SAV (4) ∆T = 70%*CPI + Xr + KSAV (4) ∆T = 70%*CPI + Xr + K
CISA (4) ∆T = 70%*CPI + Xr + K
Companies which requested a "confirmation" of the financial plan (2)
ATIVA ∆T = ∆P - Xp + K + ß∆Q
SALT (4) ∆T = 70%*CPI + K
ADF (4) ∆T = 70%*CPI + K(1) These companies are allowed to a remuneration both for excess investments made in the previous 5-year regulatory period and for new investments(2) These companies are allowed to a remuneration only for new investments(3) Xr is a negative factor and as consequence its inclusion in the formula causes an increase of the tariff
ΔT is the annual tariff increase
(3) Xr is a negative factor and as consequence its inclusion in the formula causes an increase of the tariff(4) These companies utilize the "simplified tariffs formula", which includes in the tariff a fixed percentage of the real inflation (equal to 70%)
ΔP is the annual projected inflation rate as reported in the Italian BudgetXr is determined every 5 years to remunerate the excess investments (if any) made in the previous regulatory periodK is determined every year to remunerate the investments performed during the previous yearXp is the productivity (or efficiency) factorCPI is the actual inflation rate for the previous 12 months as reported by ISTAT
24
CPI is the actual inflation rate for the previous 12 months as reported by ISTATβΔQ is the quality factor (related to the status of road surface and the accident rate)
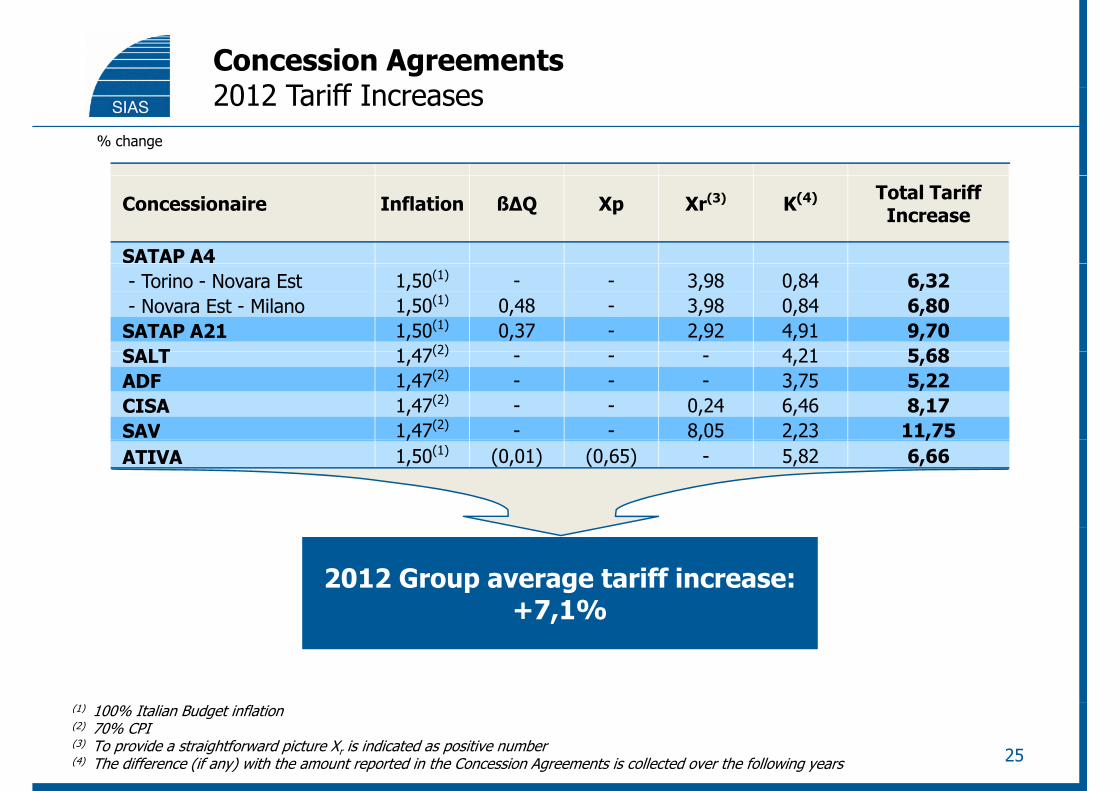
Concession Agreements2012 T iff I2012 Tariff Increases
% change
Concessionaire Inflation ß∆Q Xp Xr(3) K(4) Total Tariff Increase
SATAP A4- Torino - Novara Est 1,50(1) - - 3,98 0,84 6,32- Novara Est - Milano 1,50(1) 0,48 - 3,98 0,84 6,80
SATAP A21 1,50(1) 0,37 - 2,92 4,91 9,70SALT 1 47(2) 4 21 5 68SALT 1,47(2) - - - 4,21 5,68ADF 1,47(2) - - - 3,75 5,22CISA 1,47(2) - - 0,24 6,46 8,17SAV 1,47(2) - - 8,05 2,23 11,75, , , ,ATIVA 1,50(1) (0,01) (0,65) - 5,82 6,66
2012 Group average tariff increase: +7,1%
2012 Group average tariff increase: +7,1%+7,1%+7,1%
25
(1) 100% Italian Budget inflation(2) 70% CPI(3) To provide a straightforward picture Xr is indicated as positive number(4) The difference (if any) with the amount reported in the Concession Agreements is collected over the following years
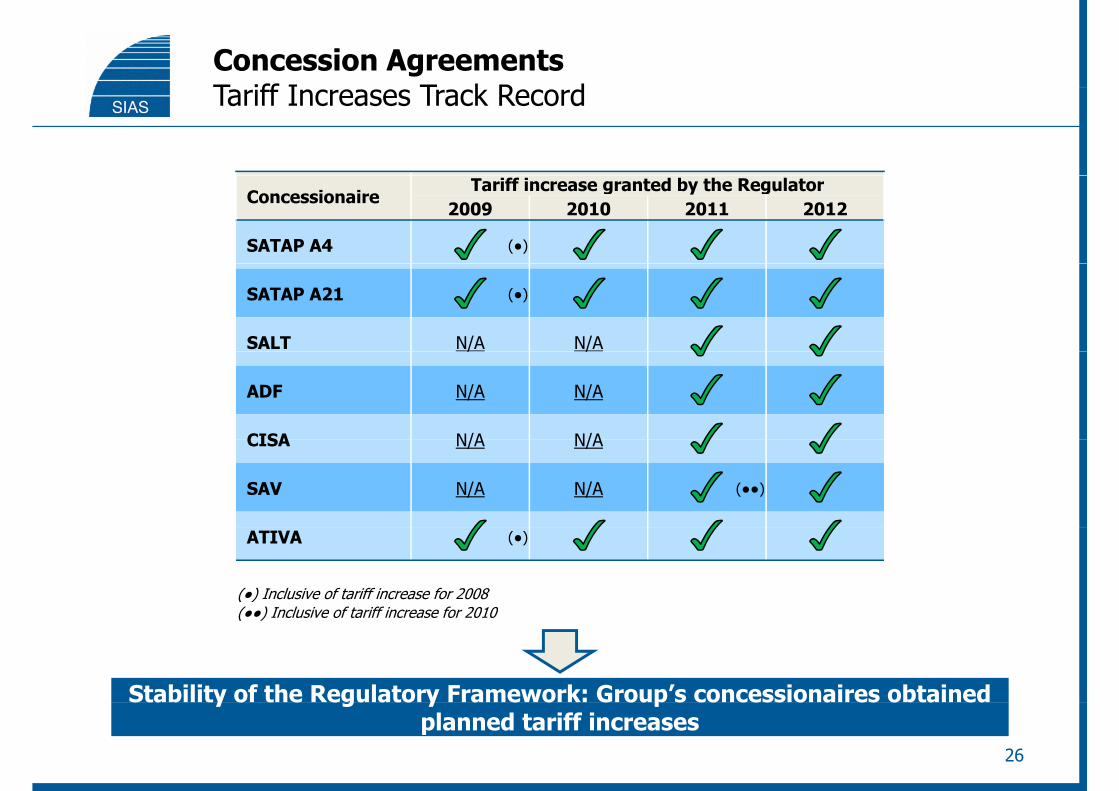
Concession AgreementsT iff I T k R dTariff Increases Track Record
ConcessionaireTariff increase granted by the Regulator
2009 2010 2011 2012
SATAP A4 (●)
SATAP A21 (●)
SALT N/A N/A/ /
ADF N/A N/A
CISA N/A N/ACISA N/A N/A
SAV N/A N/A (●●)
ATIVA (●)
(●) Inclusive of tariff increase for 2008(●●) Inclusive of tariff increase for 2010(●●) Inclusive of tariff increase for 2010
Stability of the Regulatory Framework: Group’s concessionaires obtained
26
y g y pplanned tariff increases
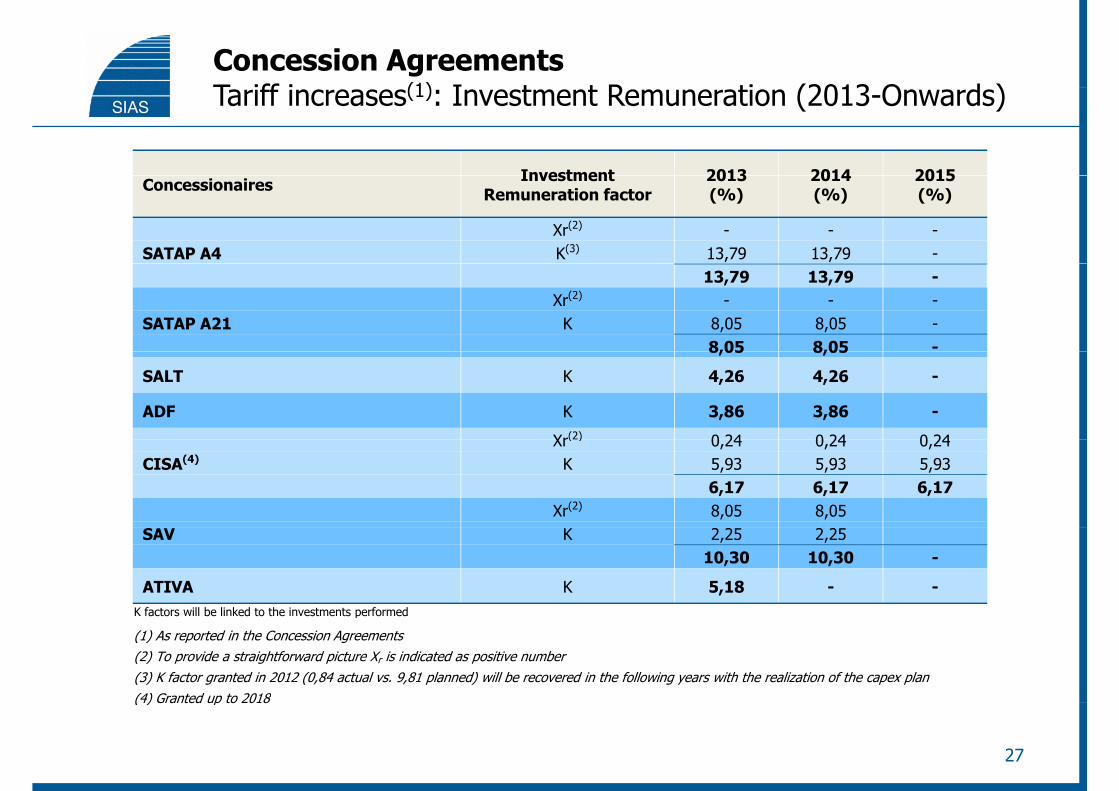
Concession AgreementsT iff i (1) I t t R ti (2013 O d )Tariff increases(1): Investment Remuneration (2013-Onwards)
Investment 2013 2014 2015Concessionaires Investment Remuneration factor
2013 (%)
2014 (%)
2015 (%)
Xr(2) - - -SATAP A4 K(3) 13,79 13,79 -
13,79 13,79 -Xr(2) - - -
SATAP A21 K 8,05 8,05 -8,05 8,05 -8,05 8,05
SALT K 4,26 4,26 -
ADF K 3,86 3,86 -
Xr(2) 0 24 0 24 0 24Xr(2) 0,24 0,24 0,24CISA(4) K 5,93 5,93 5,93
6,17 6,17 6,17Xr(2) 8,05 8,05
SAV K 2,25 2,2510,30 10,30 -
ATIVA K 5,18 - -K factors will be linked to the investments performedK factors will be linked to the investments performed
(1) As reported in the Concession Agreements(2) To provide a straightforward picture Xr is indicated as positive number(3) K factor granted in 2012 (0,84 actual vs. 9,81 planned) will be recovered in the following years with the realization of the capex plan(4) Granted up to 2018(4) Granted up to 2018
27
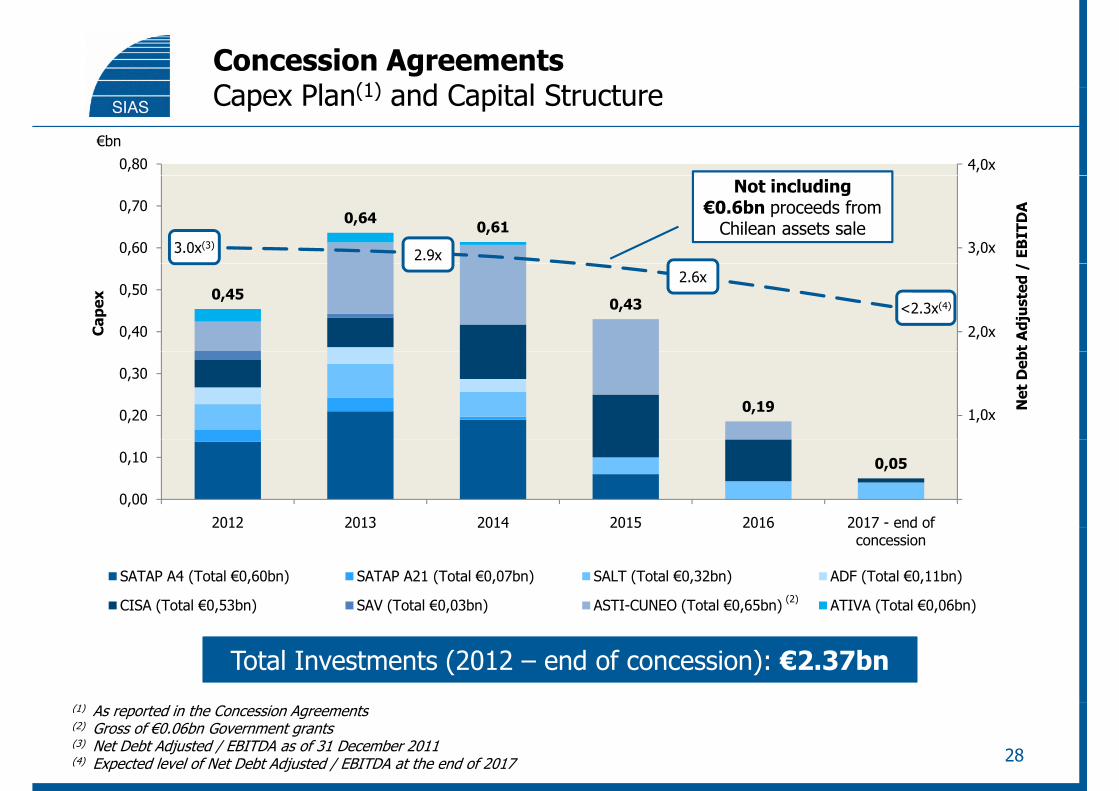
Concession AgreementsC Pl (1) d C it l St t
0,80
Capex Plan(1) and Capital Structure€bn
4,0x
0,64 0,610,60
0,70
EB
ITD
A
3,0x3.0x(3)2.9x
Not including €0.6bn proceeds from
Chilean assets sale
0,450,43
0,40
0,50
t A
djus
ted
/
Cap
ex
2,0x
2.6x
<2.3x(4)
0,190,20
0,30
Net
Deb
1,0x
0,05
0,00
0,10
2012 2013 2014 2015 2016 2017 - end of2012 2013 2014 2015 2016 2017 end of concession
SATAP A4 (Total €0,60bn) SATAP A21 (Total €0,07bn) SALT (Total €0,32bn) ADF (Total €0,11bn)
CISA (Total €0,53bn) SAV (Total €0,03bn) ASTI-CUNEO (Total €0,65bn) ATIVA (Total €0,06bn)(2)
Total Investments (2012 – end of concession): €2.37bnTotal Investments (2012 – end of concession): €2.37bn
28
(1) As reported in the Concession Agreements(2) Gross of €0.06bn Government grants(3) Net Debt Adjusted / EBITDA as of 31 December 2011(4) Expected level of Net Debt Adjusted / EBITDA at the end of 2017
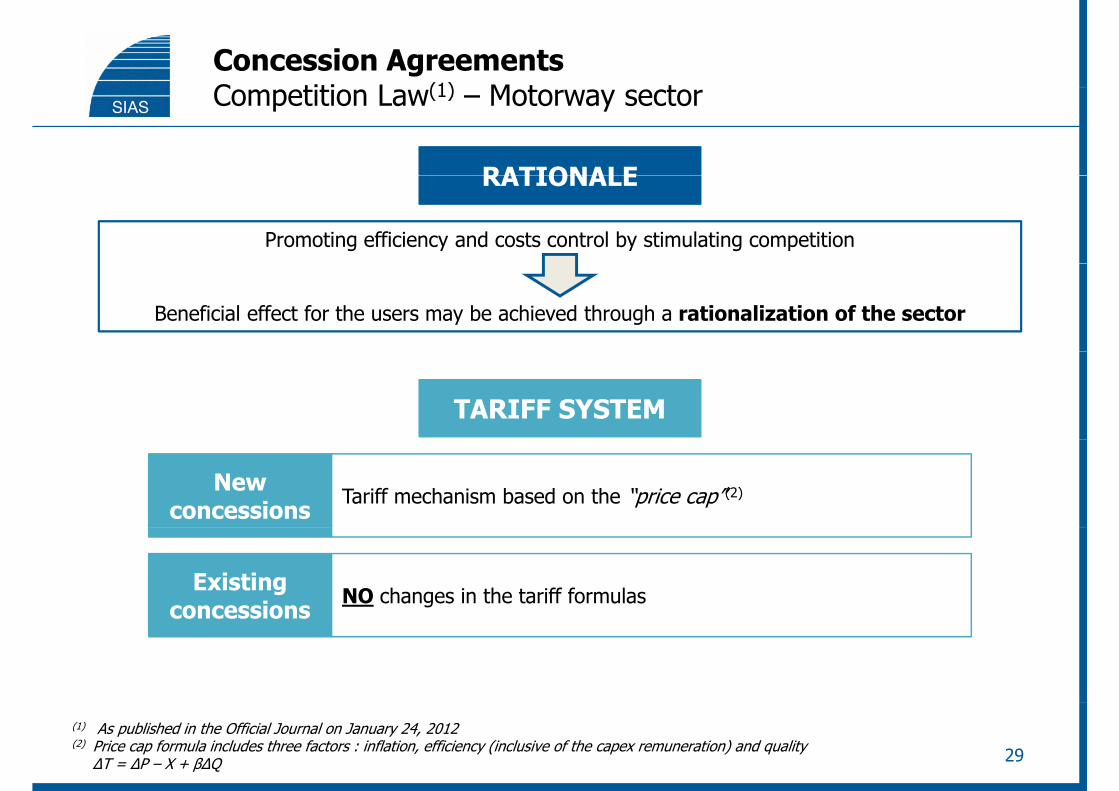
Concession AgreementsC titi L (1) M t tCompetition Law(1) – Motorway sector
RATIONALERATIONALERATIONALERATIONALE
Promoting efficiency and costs control by stimulating competition
Beneficial effect for the users may be achieved through a rationalization of the sector
TARIFF SYSTEMTARIFF SYSTEM
New concessions
Tariff mechanism based on the “price cap”(2)
Existing concessions
NO changes in the tariff formulasconcessions
29
(1) As published in the Official Journal on January 24, 2012(2) Price cap formula includes three factors : inflation, efficiency (inclusive of the capex remuneration) and quality ∆T = ∆P – X + β∆Q
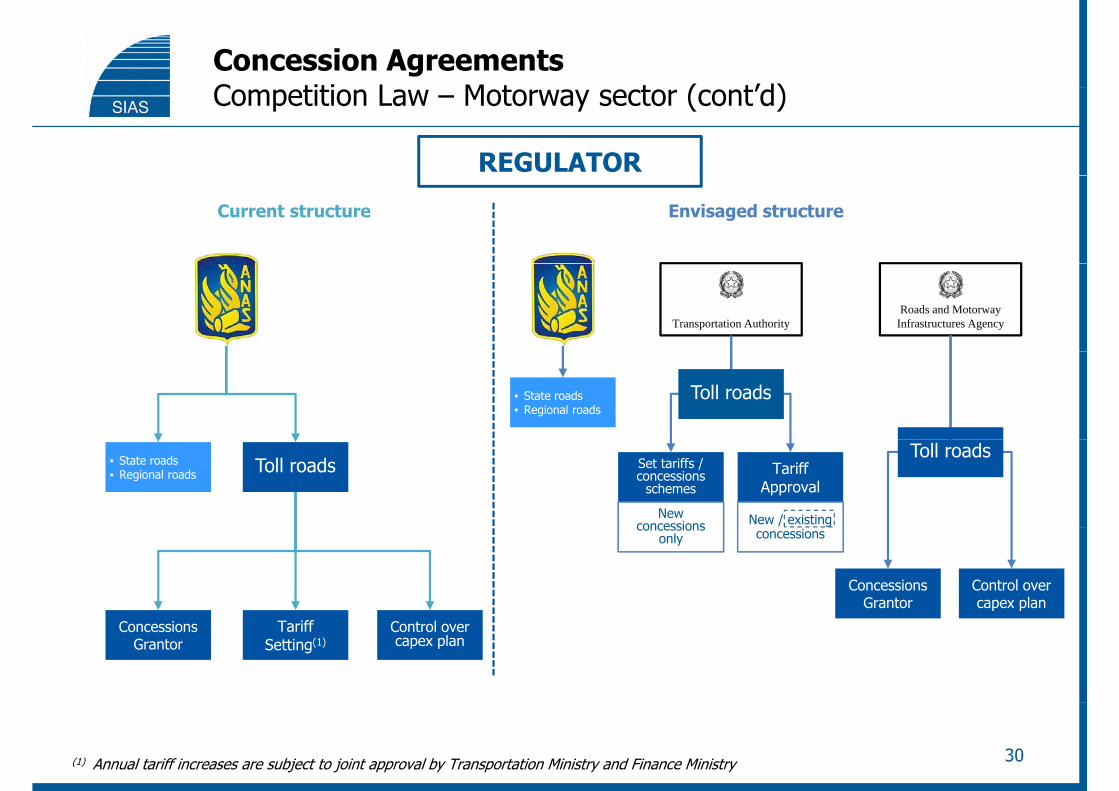
Concession AgreementsC titi L M t t ( t’d)Competition Law – Motorway sector (cont’d)
REGULATOR
Current structure Envisaged structure
Roads and Motorway Infrastructures AgencyTransportation Authority
• State roads• Regional roads
Toll roads
• State roads• Regional roads Toll roads
Toll roadsSet tariffs / concessions
schemesTariff
Approval
New concessions New / existing
Control over capex plan
Concessions Grantor
concessions only concessions
Concessions Grantor
Control over capex plan
Tariff Setting(1)
30(1) Annual tariff increases are subject to joint approval by Transportation Ministry and Finance Ministry
Key Facts
Group Structure
Financial Results
Concession AgreementsConcession Agreements
Group Financial Structure
Closing Remarks
AppendixAppendix
Group Financial StructureF di t li iFunding centralizing
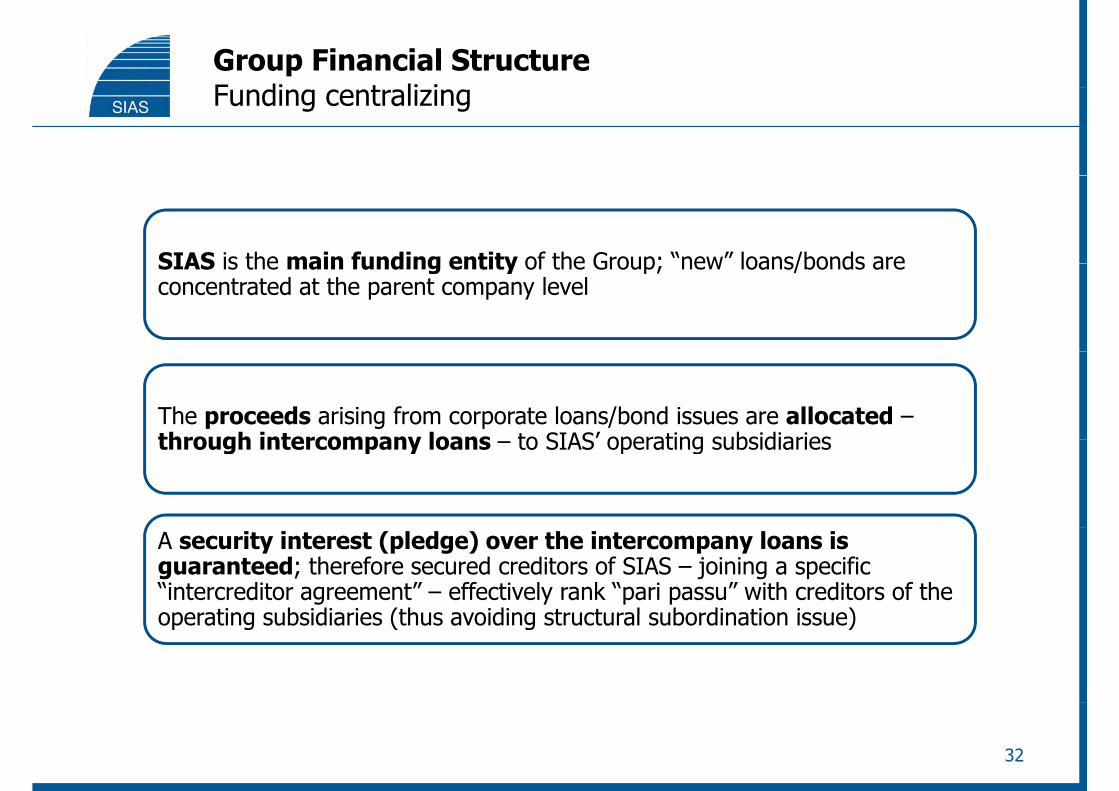
SIAS is the main funding entity of the Group; “new” loans/bonds areSIAS is the main funding entity of the Group; new loans/bonds are concentrated at the parent company level
The proceeds arising from corporate loans/bond issues are allocated –through intercompany loans to SIAS’ operating subsidiariesthrough intercompany loans – to SIAS operating subsidiaries
A security interest (pledge) over the intercompany loans is guaranteed; therefore secured creditors of SIAS – joining a specific “intercreditor agreement” – effectively rank “pari passu” with creditors of the operating subsidiaries (thus avoiding structural subordination issue)operating subsidiaries (thus avoiding structural subordination issue)
32
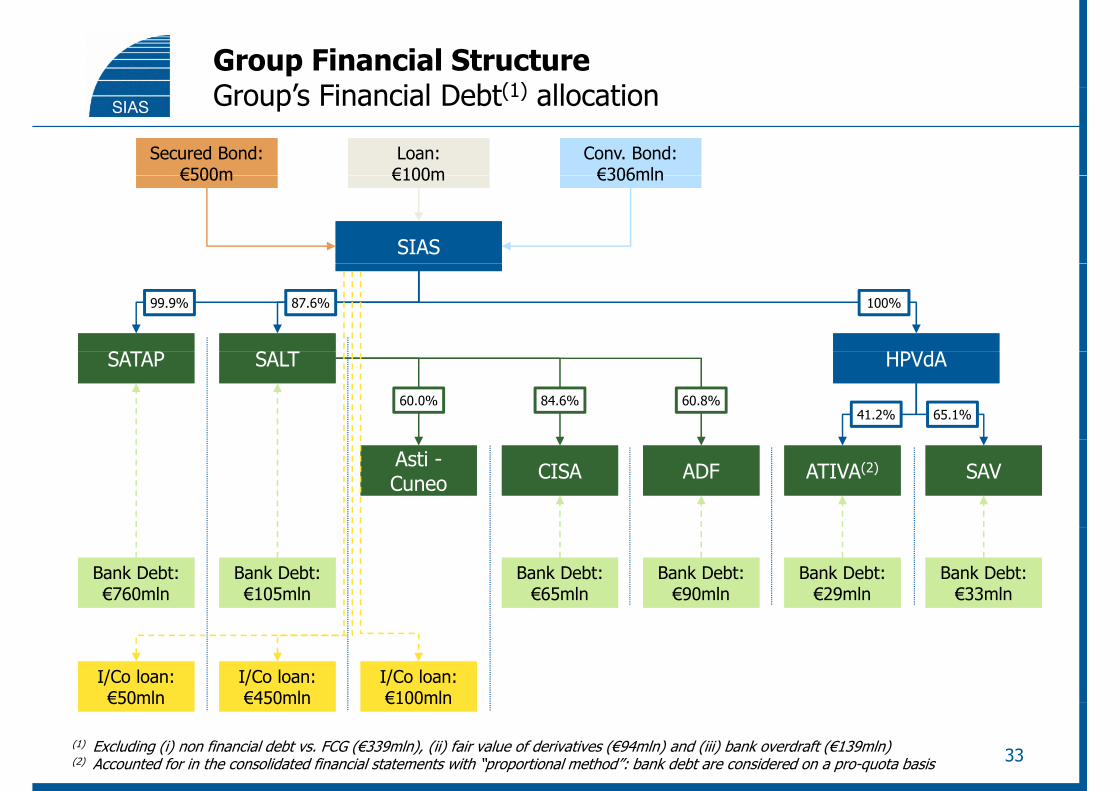
Group Financial StructureG ’ Fi i l D bt(1) ll tiGroup’s Financial Debt(1) allocation
Conv. Bond:€306mln
Conv. Bond:€306mln
Secured Bond:€500m
Secured Bond:€500m
Loan:€100mLoan:€100m
SIASSIAS
€306mln€306mln€500m€500m €100m€100m
ddSSSS
99.9% 87.6% 100%
HPVdAHPVdASALTSALTSATAPSATAP
41.2% 65.1%60.8%84.6%60.0%
SAVSAVAsti -CuneoAsti -Cuneo ADFADF ATIVA(2)ATIVA(2)CISACISA
Bank Debt:€33mln
Bank Debt:€33mln
Bank Debt:€760mln
Bank Debt:€760mln
Bank Debt:€90mln
Bank Debt:€90mln
Bank Debt:€105mln
Bank Debt:€105mln
Bank Debt:€65mln
Bank Debt:€65mln
Bank Debt:€29mln
Bank Debt:€29mln
I/Co loan:€100mlnI/Co loan:€100mln
I/Co loan:€450mlnI/Co loan:€450mln
I/Co loan:€50mln
I/Co loan:€50mln €100mln€100mln€450mln€450mln€50mln€50mln
(1) Excluding (i) non financial debt vs. FCG (€339mln), (ii) fair value of derivatives (€94mln) and (iii) bank overdraft (€139mln)(2) Accounted for in the consolidated financial statements with “proportional method”: bank debt are considered on a pro-quota basis 33
Group Financial StructureG ’ Fi i l D bt d t ilGroup’s Financial Debt details
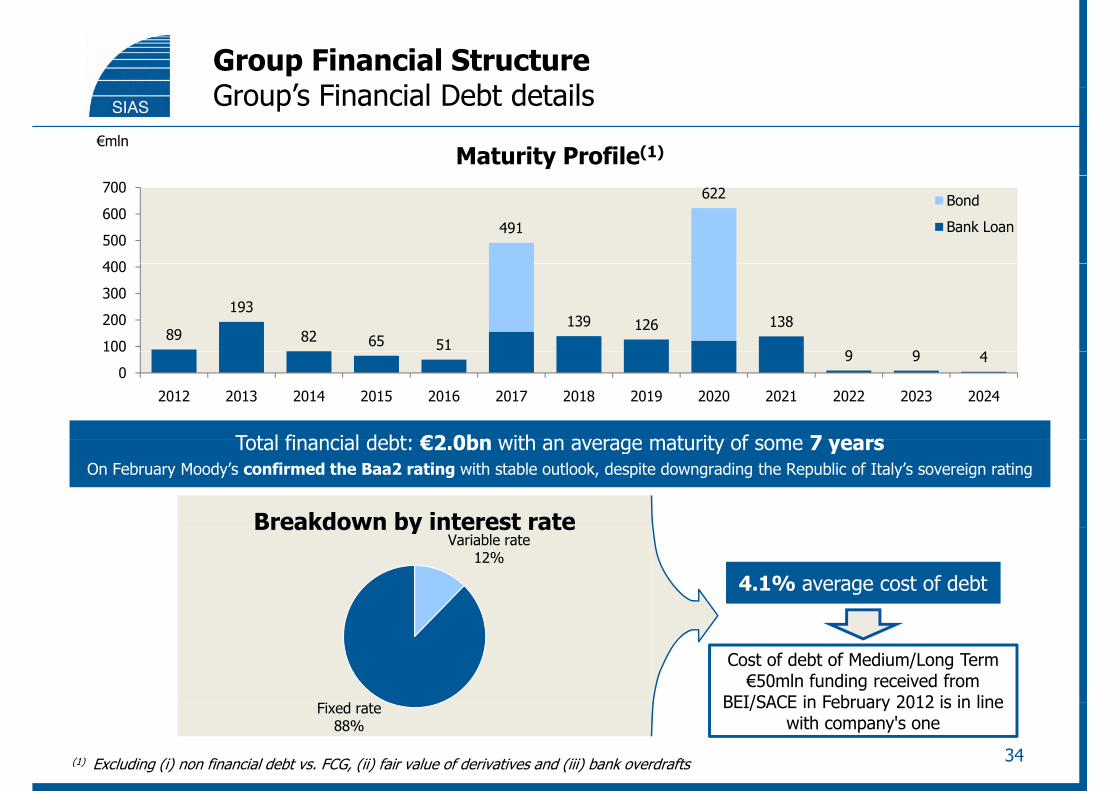
€mlnMaturity Profile(1)
491
622
400
500
600
700Bond
Bank Loan
89
193
82 65 51
139 126 138
9 9100
200
300
400
9 9 40
100
2012 2013 2014 2015 2016 2017 2018 2019 2020 2021 2022 2023 2024
Total financial debt: €2 0bn with an average maturity of some 7 yearsTotal financial debt: €2 0bn with an average maturity of some 7 years
Breakdown by interest rate
Total financial debt: €2.0bn with an average maturity of some 7 yearsOn February Moody’s confirmed the Baa2 rating with stable outlook, despite downgrading the Republic of Italy’s sovereign rating
Total financial debt: €2.0bn with an average maturity of some 7 yearsOn February Moody’s confirmed the Baa2 rating with stable outlook, despite downgrading the Republic of Italy’s sovereign rating
Variable rate12%
Breakdown by interest rate
4.1% average cost of debt4.1% average cost of debt
Fi d
Cost of debt of Medium/Long Term €50mln funding received from
BEI/SACE in February 2012 is in line
34
Fixed rate88%
(1) Excluding (i) non financial debt vs. FCG, (ii) fair value of derivatives and (iii) bank overdrafts
BEI/SACE in February 2012 is in line with company's one
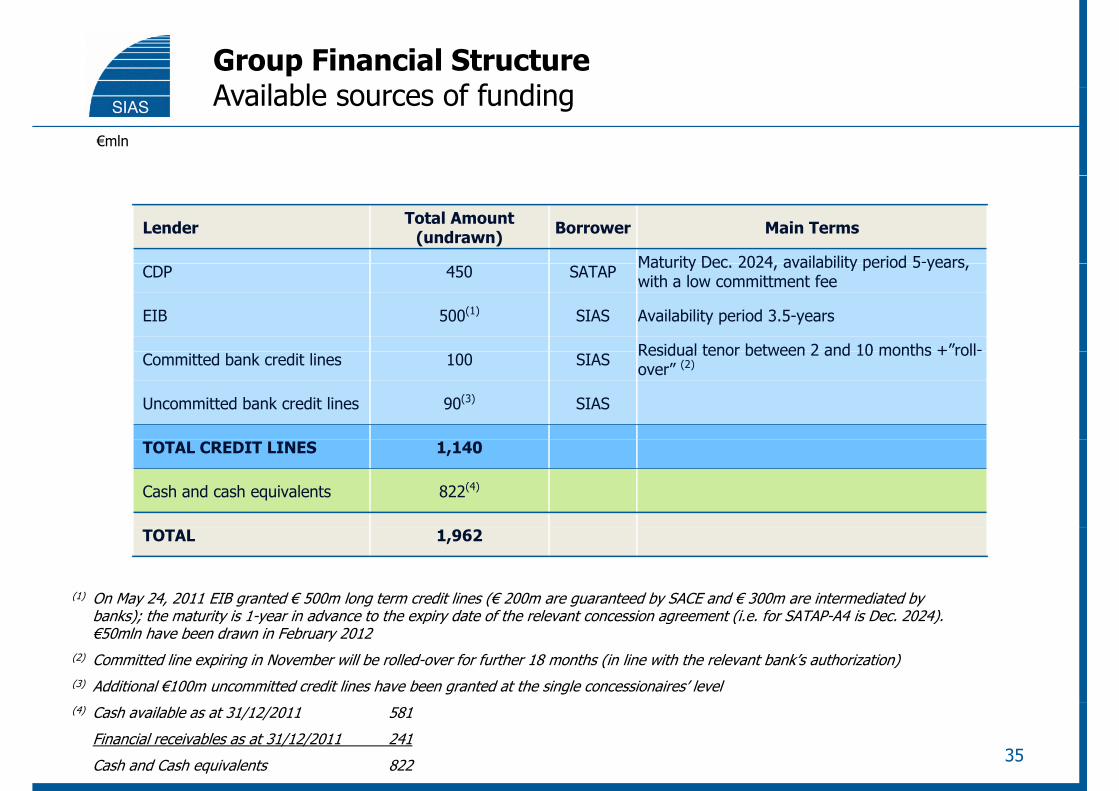
Group Financial StructureA il bl f f diAvailable sources of funding
€mln
Lender Total Amount (undrawn) Borrower Main Terms
Maturity Dec 2024 availability period 5-yearsCDP 450 SATAP Maturity Dec. 2024, availability period 5 years, with a low committment fee
EIB 500(1) SIAS Availability period 3.5-years
Residual tenor between 2 and 10 months +”roll-Committed bank credit lines 100 SIAS Residual tenor between 2 and 10 months + rollover” (2)
Uncommitted bank credit lines 90(3) SIAS
TOTAL CREDIT LINES 1,140
Cash and cash equivalents 822(4)
(1) On May 24, 2011 EIB granted € 500m long term credit lines (€ 200m are guaranteed by SACE and € 300m are intermediated by banks); the maturity is 1 year in advance to the expiry date of the relevant concession agreement (i e for SATAP A4 is Dec 2024)
TOTAL 1,962
banks); the maturity is 1-year in advance to the expiry date of the relevant concession agreement (i.e. for SATAP-A4 is Dec. 2024).€50mln have been drawn in February 2012
(2) Committed line expiring in November will be rolled-over for further 18 months (in line with the relevant bank’s authorization)(3) Additional €100m uncommitted credit lines have been granted at the single concessionaires’ level
35
(4) Cash available as at 31/12/2011 581
Financial receivables as at 31/12/2011 241
Cash and Cash equivalents 822
Key Facts
Group Structure
Financial Results
Concession AgreementsConcession Agreements
Group Financial Structure
Closing Remarks
AppendixAppendix
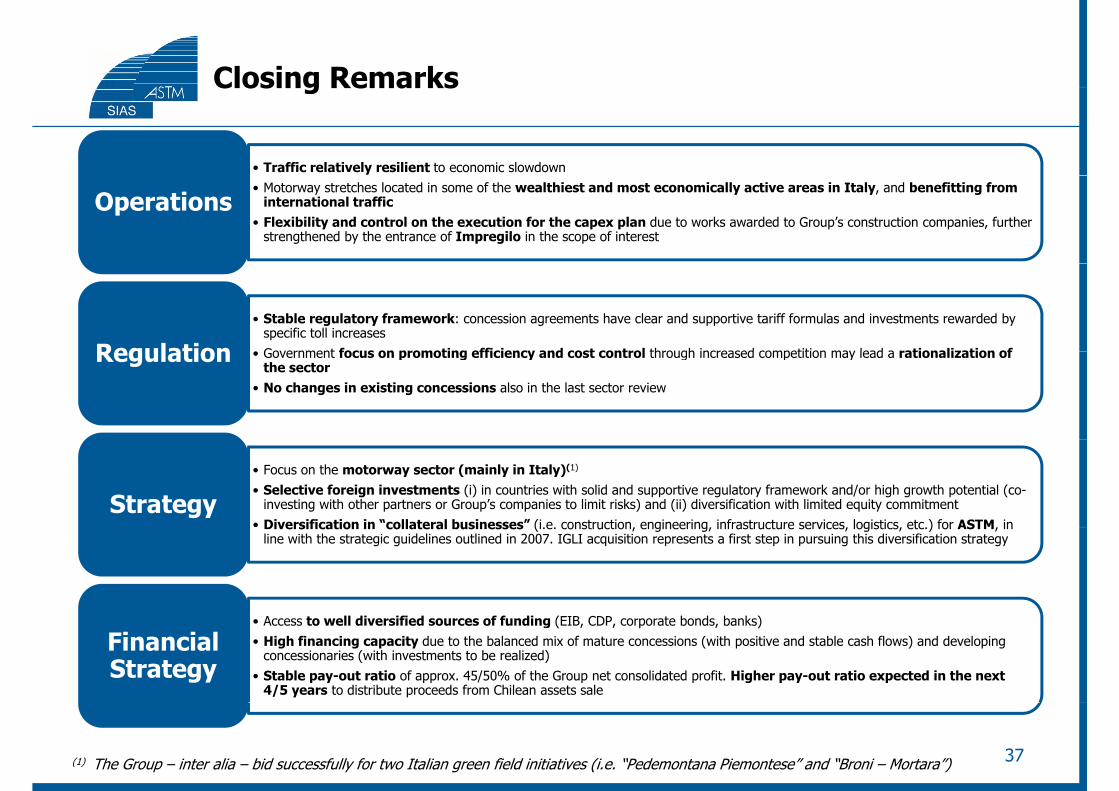
Closing RemarksClosing Remarks
• Traffic relatively resilient to economic slowdown• Motorway stretches located in some of the wealthiest and most economically active areas in Italy, and benefitting from
international traffic• Flexibility and control on the execution for the capex plan due to works awarded to Group’s construction companies, further
strengthened by the entrance of Impregilo in the scope of interest
Operations
• Stable regulatory framework: concession agreements have clear and supportive tariff formulas and investments rewarded by specific toll increases
• Government focus on promoting efficiency and cost control through increased competition may lead a rationalization ofRegulation • Government focus on promoting efficiency and cost control through increased competition may lead a rationalization of the sector
• No changes in existing concessions also in the last sector review
Regulation
• Focus on the motorway sector (mainly in Italy)(1)
• Selective foreign investments (i) in countries with solid and supportive regulatory framework and/or high growth potential (co-investing with other partners or Group’s companies to limit risks) and (ii) diversification with limited equity commitment
• Diversification in “collateral businesses” (i e construction engineering infrastructure services logistics etc ) for ASTM inStrategy
Diversification in collateral businesses (i.e. construction, engineering, infrastructure services, logistics, etc.) for ASTM, in line with the strategic guidelines outlined in 2007. IGLI acquisition represents a first step in pursuing this diversification strategy
• Access to well diversified sources of funding (EIB, CDP, corporate bonds, banks)• High financing capacity due to the balanced mix of mature concessions (with positive and stable cash flows) and developing
concessionaries (with investments to be realized)• Stable pay-out ratio of approx. 45/50% of the Group net consolidated profit. Higher pay-out ratio expected in the next
4/5 years to distribute proceeds from Chilean assets sale
Financial Strategy
37(1) The Group – inter alia – bid successfully for two Italian green field initiatives (i.e. “Pedemontana Piemontese” and “Broni – Mortara”)
Key Facts
Group Structure
Financial Results
Concession AgreementsConcession Agreements
Group Financial Structure
Closing Remarks
AppendixAppendix
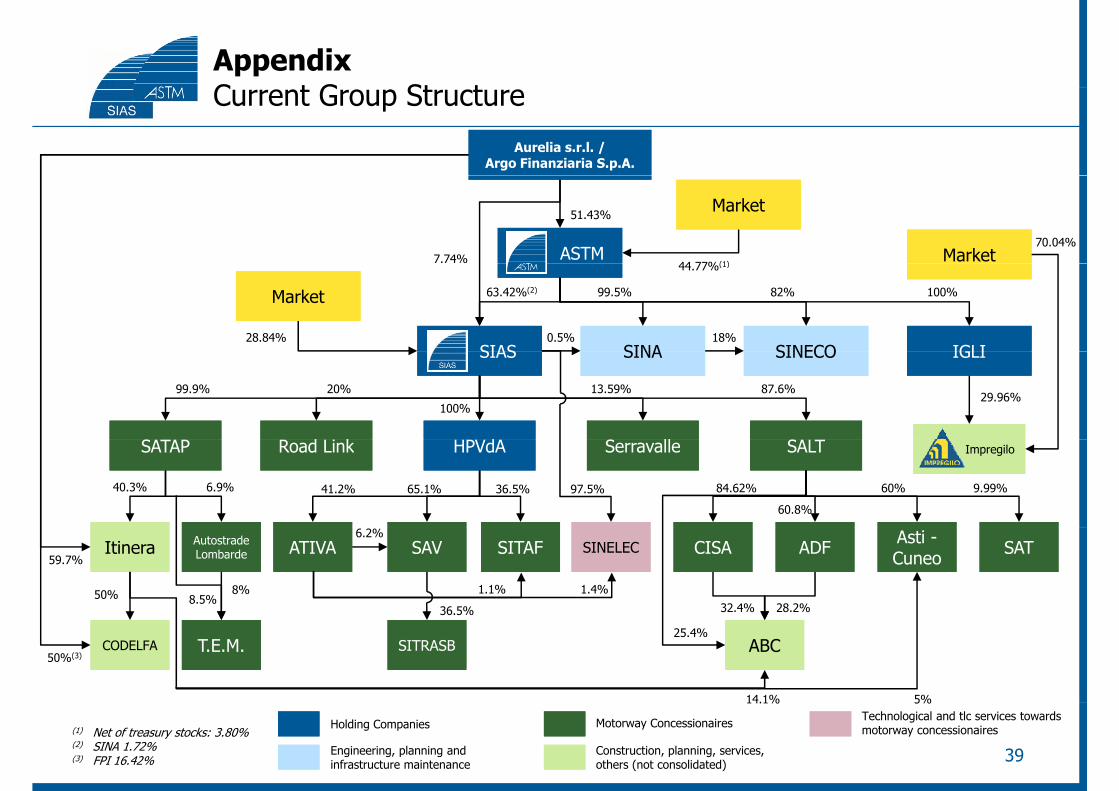
AppendixC t G St tCurrent Group Structure
Aurelia s.r.l. / Argo Finanziaria S.p.A.
Aurelia s.r.l. / Argo Finanziaria S.p.A.
ASTMASTM MarketMarket
MarketMarket
70.04%7.74%
44 77%(1)
51.43%
SIASSIAS IGLIIGLISINASINA SINECOSINECO
MarketMarket
44.77%(1)
28.84%
100%82%99.5%
18%0.5%
63.42%(2)
SIASSIAS IGLIIGLISINASINA SINECOSINECO
llllddd kd k
29.96%99.9% 20%
100%
13.59% 87.6%
ImpregiloImpregiloSALTSALTSerravalleSerravalleHPVdAHPVdARoad LinkRoad LinkSATAPSATAP
97.5% 84.62% 60% 9.99%
60.8%
65.1% 36.5%6.9%40.3% 41.2%
ItineraItinera ATIVAATIVA SAVSAV SINELECSINELEC ADFADF SATSATAsti -CuneoAsti -Cuneo
AutostradeLombardeAutostradeLombarde SITAFSITAF CISACISA
36.5%
1.1% 1.4%
32.4% 28.2%8%
8.5%
59.7%
50%
6.2%
T.E.M.T.E.M.CODELFACODELFA SITRASBSITRASB ABCABC
36 5%
25.4%
14.1% 5%
50%(3)
39
(1) Net of treasury stocks: 3.80%(2) SINA 1.72%(3) FPI 16.42%
Holding Companies
14.1% 5%
Engineering, planning and infrastructure maintenance
Construction, planning, services, others (not consolidated)
Motorway Concessionaires Technological and tlc services towards motorway concessionaires
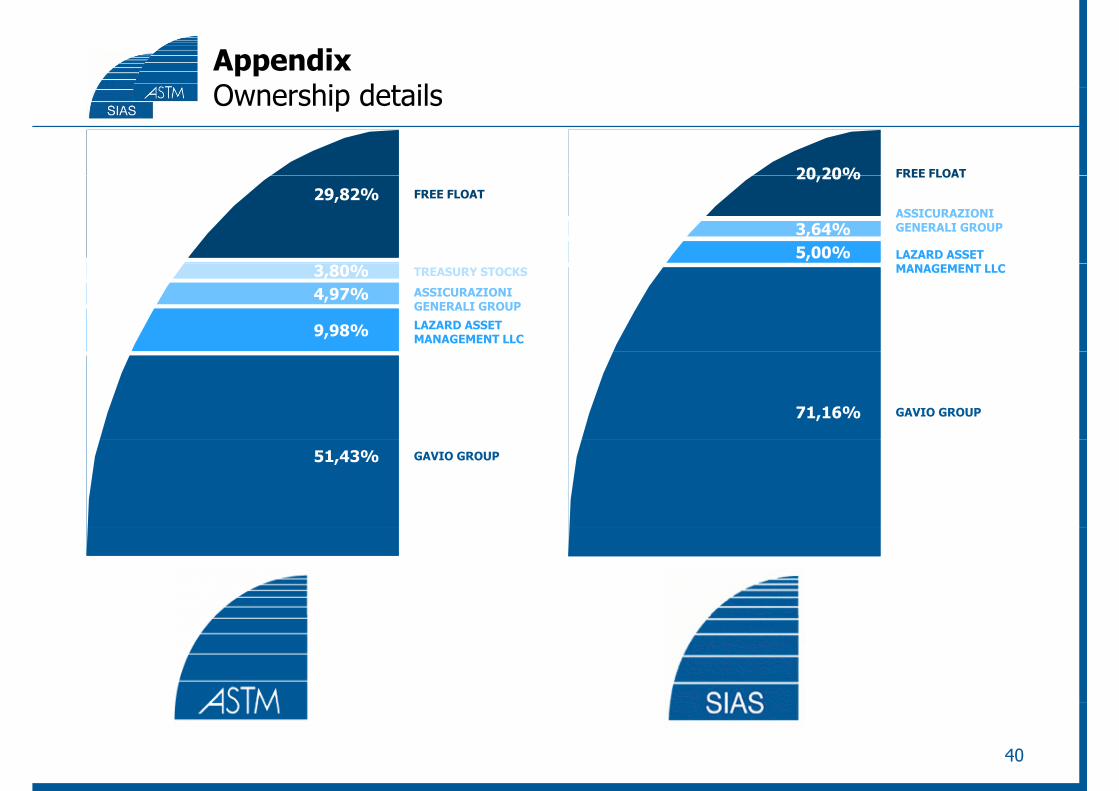
AppendixO hi d t ilOwnership details
20 20%20 20% FREE FLOAT
5,00%5,00%3,64%3,64%
20,20%20,20%
LAZARD ASSET
FREE FLOAT
ASSICURAZIONI GENERALI GROUP
29,82%29,82% FREE FLOAT
MANAGEMENT LLC
9,98%9,98%
3,80%3,80%
LAZARD ASSET MANAGEMENT LLC
ASSICURAZIONI GENERALI GROUP
4,97%4,97%TREASURY STOCKS
71,16%71,16% GAVIO GROUP
51,43%51,43% GAVIO GROUP
40
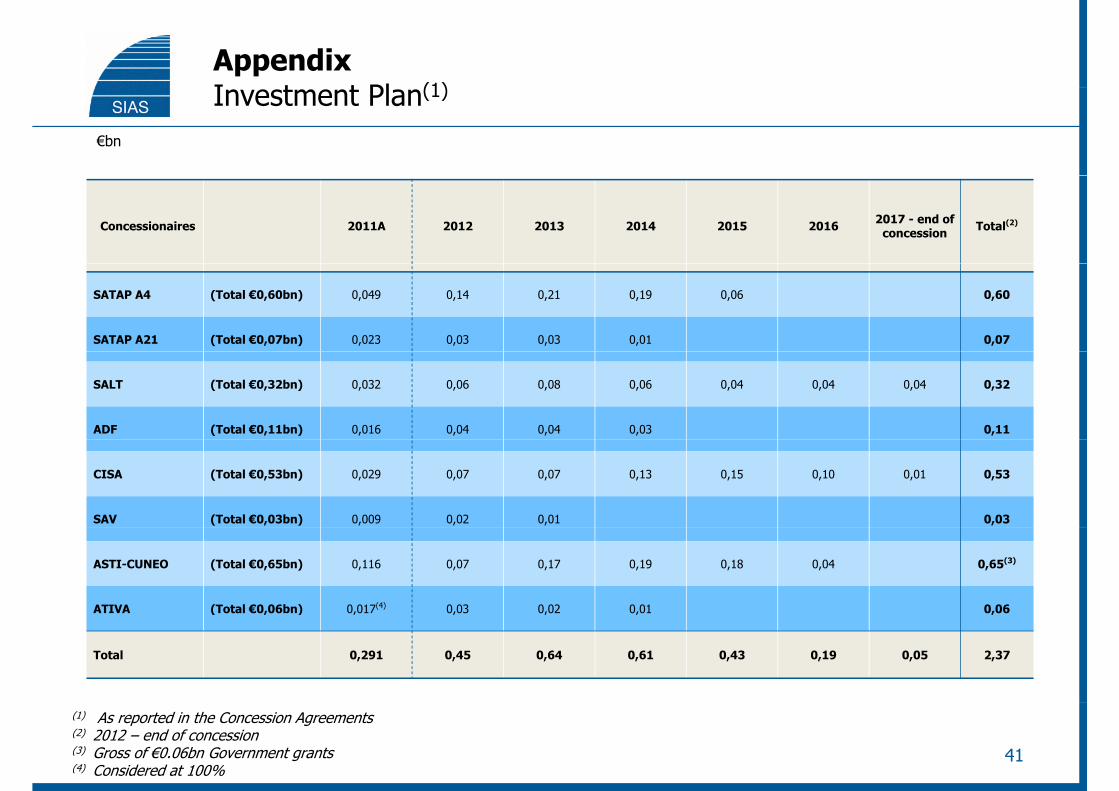
AppendixI t t Pl (1)Investment Plan(1)
€bn
Concessionaires 2011A 2012 2013 2014 2015 2016 2017 - end of concession Total(2)
SATAP A4 (Total €0,60bn) 0,049 0,14 0,21 0,19 0,06 0,60
SATAP A21 (Total €0,07bn) 0,023 0,03 0,03 0,01 0,07
SALT (Total €0,32bn) 0,032 0,06 0,08 0,06 0,04 0,04 0,04 0,32
ADF (Total €0,11bn) 0,016 0,04 0,04 0,03 0,11
CISA (Total €0,53bn) 0,029 0,07 0,07 0,13 0,15 0,10 0,01 0,53
SAV (Total €0,03bn) 0,009 0,02 0,01 0,03
ASTI-CUNEO (Total €0,65bn) 0,116 0,07 0,17 0,19 0,18 0,04 0,65(3)
ATIVA (Total €0,06bn) 0,017(4) 0,03 0,02 0,01 0,06( , ) , , , , ,
Total 0,291 0,45 0,64 0,61 0,43 0,19 0,05 2,37
41
(1) As reported in the Concession Agreements(2) 2012 – end of concession(3) Gross of €0.06bn Government grants(4) Considered at 100%
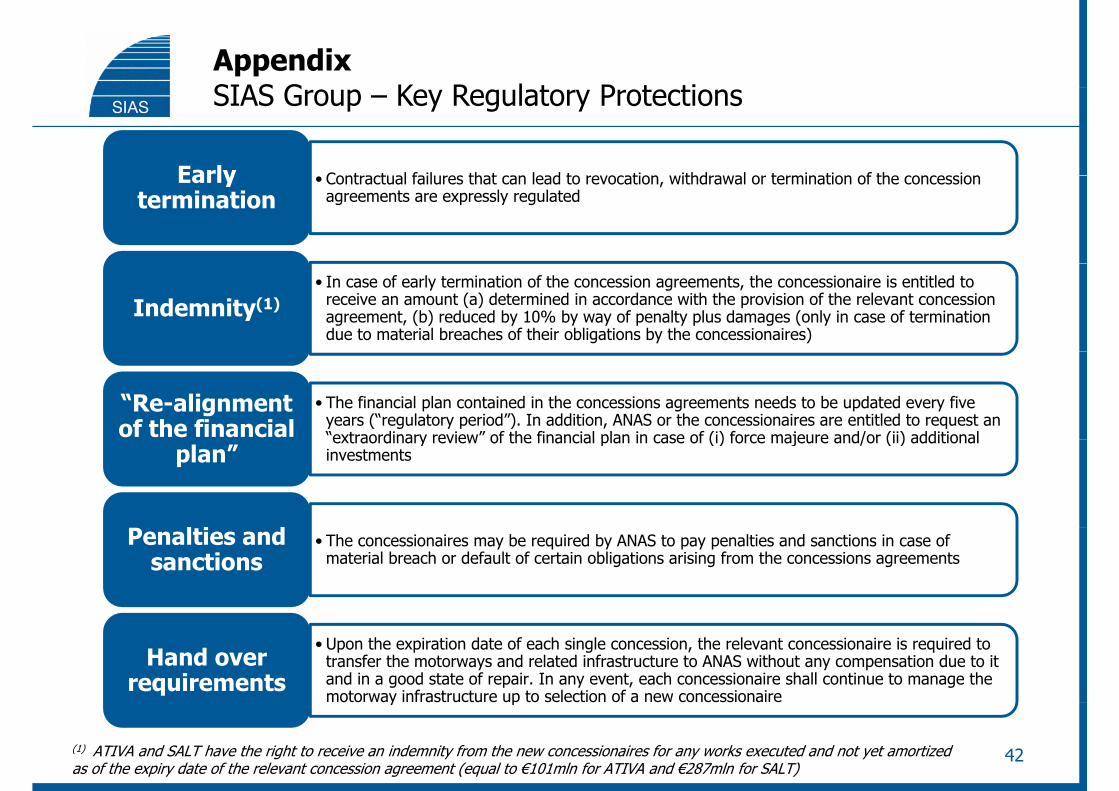
AppendixSIAS G K R l t P t tiSIAS Group – Key Regulatory Protections
Contractual failures that can lead to revocation withdrawal or termination of the concessionEarly • Contractual failures that can lead to revocation, withdrawal or termination of the concession agreements are expressly regulated
Early termination
• In case of early termination of the concession agreements, the concessionaire is entitled to receive an amount (a) determined in accordance with the provision of the relevant concession agreement, (b) reduced by 10% by way of penalty plus damages (only in case of termination due to material breaches of their obligations by the concessionaires)
Indemnity(1)
• The financial plan contained in the concessions agreements needs to be updated every five years (“regulatory period”). In addition, ANAS or the concessionaires are entitled to request an “extraordinary review” of the financial plan in case of (i) force majeure and/or (ii) additional
“Re-alignment of the financial extraordinary review of the financial plan in case of (i) force majeure and/or (ii) additional
investmentsplan”
l i d • The concessionaires may be required by ANAS to pay penalties and sanctions in case of material breach or default of certain obligations arising from the concessions agreements
Penalties and sanctions
• Upon the expiration date of each single concession, the relevant concessionaire is required to transfer the motorways and related infrastructure to ANAS without any compensation due to it and in a good state of repair. In any event, each concessionaire shall continue to manage the motorway infrastructure up to selection of a new concessionaire
Hand over requirements
y p
42(1) ATIVA and SALT have the right to receive an indemnity from the new concessionaires for any works executed and not yet amortizedas of the expiry date of the relevant concession agreement (equal to €101mln for ATIVA and €287mln for SALT)
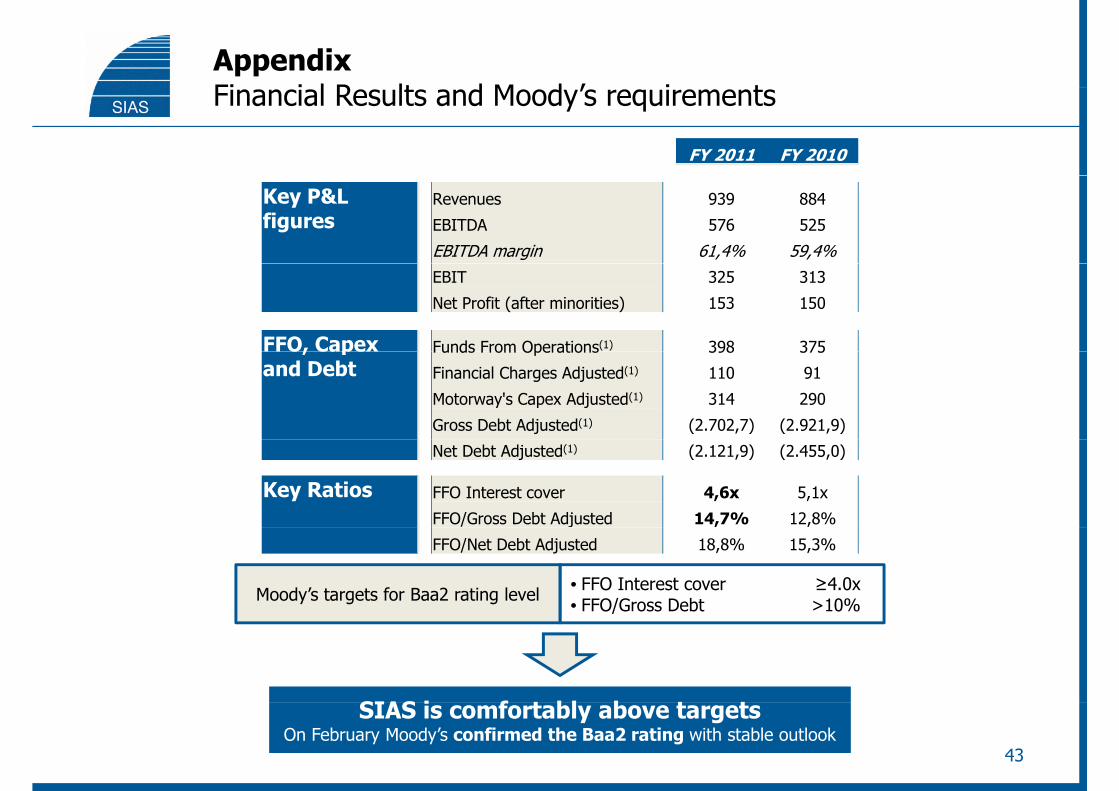
AppendixFi i l R lt d M d ’ i tFinancial Results and Moody’s requirements
FY 2011 FY 2010
Key P&L figures
Revenues 939 884
EBITDA 576 525
EBITDA margin 61,4% 59,4%EBIT 325 313
Net Profit (after minorities) 153 150
FFO, Capex Funds From Operations(1) 398 375FFO, Capex and Debt
Funds From Operations 398 375
Financial Charges Adjusted(1) 110 91
Motorway's Capex Adjusted(1) 314 290
Gross Debt Adjusted(1) (2.702,7) (2.921,9)
Net Debt Adjusted(1) (2.121,9) (2.455,0)
Key Ratios FFO Interest cover 4,6x 5,1x
FFO/Gross Debt Adjusted 14,7% 12,8%
• FFO Interest cover ≥4.0x• FFO/Gross Debt >10%
j
FFO/Net Debt Adjusted 18,8% 15,3%
Moody’s targets for Baa2 rating level
SIAS i f t bl b t tSIAS is comfortably above targetsOn February Moody’s confirmed the Baa2 rating with stable outlook
43
AppendixDi l iDisclaimer
THIS DOCUMENT HAS BEEN PREPARED BY ASTM S.P.A. AND SIAS S.P.A. (THE “COMPANIES”) FOR THE SOLEPURPOSE DESCRIBED HEREIN IN NO CASE MAY IT BE INTERPRETED AS AN OFFER OR INVITATION TO SELL ORPURPOSE DESCRIBED HEREIN. IN NO CASE MAY IT BE INTERPRETED AS AN OFFER OR INVITATION TO SELL ORPURCHASE ANY SECURITY ISSUED BY THE COMPANY OR ITS SUBSIDIARIES.
THE CONTENT OF THIS DOCUMENT HAS A MERELY INFORMATIVE AND PROVISIONAL NATURE AND THE STATEMENTSTHE CONTENT OF THIS DOCUMENT HAS A MERELY INFORMATIVE AND PROVISIONAL NATURE AND THE STATEMENTSCONTAINED HEREIN HAVE NOT BEEN INDEPENDENTLY VERIFIED. NEITHER THE COMPANIES NOR ANY OF ITSREPRESENTATIVES SHALL ACCEPT ANY LIABILITY WHATSOEVER (WHETHER IN NEGLIGENCE OR OTHERWISE)ARISING IN ANY WAY FROM THE USE OF THIS DOCUMENT. THIS DOCUMENT MAY NOT BE REPRODUCED ORREDISTRIBUTED IN WHOLE OR IN PART TO ANY OTHER PERSONREDISTRIBUTED, IN WHOLE OR IN PART, TO ANY OTHER PERSON.
THE INFORMATION CONTAINED HEREIN AND OTHER MATERIAL DISCUSSED AT THE PRESENTATION MAY INCLUDEFORWARD-LOOKING STATEMENTS THAT ARE NOT HISTORICAL FACTS, INCLUDING STATEMENTS ABOUT THEFORWARD LOOKING STATEMENTS THAT ARE NOT HISTORICAL FACTS, INCLUDING STATEMENTS ABOUT THECOMPANIES’ BELIEFS AND EXPECTATIONS. THESE STATEMENTS ARE BASED ON CURRENT PLANS, ESTIMATES ANDPROJECTIONS, AND PROJECTS. HOWEVER, FORWARD-LOOKING STATEMENTS INVOLVE INHERENT RISKS ANDUNCERTAINTIES. WE CAUTION YOU THAT A NUMBER OF FACTORS COULD CAUSE THE COMPANIES’ ACTUAL RESULTSTO DIFFER MATERIALLY FROM THOSE CONTAINED IN ANY FORWARD-LOOKING STATEMENT. THEREFORE, YOU,SHOUD NOT PLACE UNDUE RELIANCE ON SUCH FORWARD-LOOKING STATEMENTS.
44
www.autostradatomi.itwww.grupposias.it