Embed Size (px)
Citation preview

Axon
Group
plcA
nnualreportandaccounts
2007
SAP-enabled Business TransformationAxon Group plcAnnual report and accounts 2007
www.axonglobal.com
12246 Axon R&A - cover:Layout 1 27/3/08 10:22 Page 1
ifc Financial highlights01 Global reach10 Chairman’s statement11 Business review14 Financial review16 Board profiles18 Directors’ report21 Report on corporate governance24 Audit committee report25 Remuneration report30 Independent auditors’ report31 Consolidated income statement31 Consolidated statement of
recognised income and expense32 Consolidated balance sheet33 Company balance sheet34 Consolidated cash flow statement34 Company cash flow statement35 Notes to the consolidated
financial statements70 Five year summary71 Financial calendar 200872 Company information
and advisers
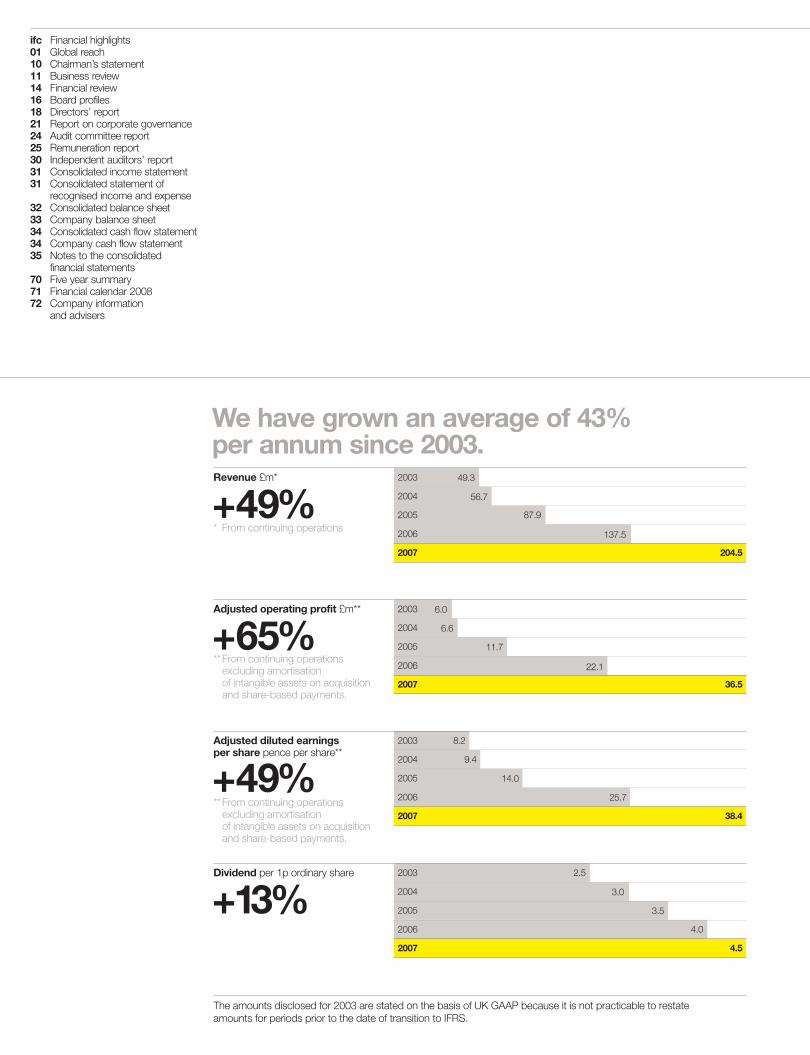
We have grown an average of 43%per annum since 2003.
+49%Revenue £m*
* From continuing operations
2003 49.3
2004 56.7
2005 87.9
2006 137.5
2007 204.5
+65%Adjusted operating profit £m**
**From continuing operations excluding amortisation of intangible assets on acquisition and share-based payments.
2003 6.0
2004 6.6
2005 11.7
2006 22.1
2007 36.5
+49%Adjusted diluted earningsper share pence per share**
**From continuing operations excluding amortisation of intangible assets on acquisition and share-based payments.
2003 8.2
2004 9.4
2005 14.0
2006 25.7
2007 38.4
+13%Dividend per 1p ordinary share 2003 2.5
2004 3.0
2005 3.5
2006 4.0
2007 4.5
The amounts disclosed for 2003 are stated on the basis of UK GAAP because it is not practicable to restate amounts for periods prior to the date of transition to IFRS.
01 Axon Group plcAnnual report and accounts 2007
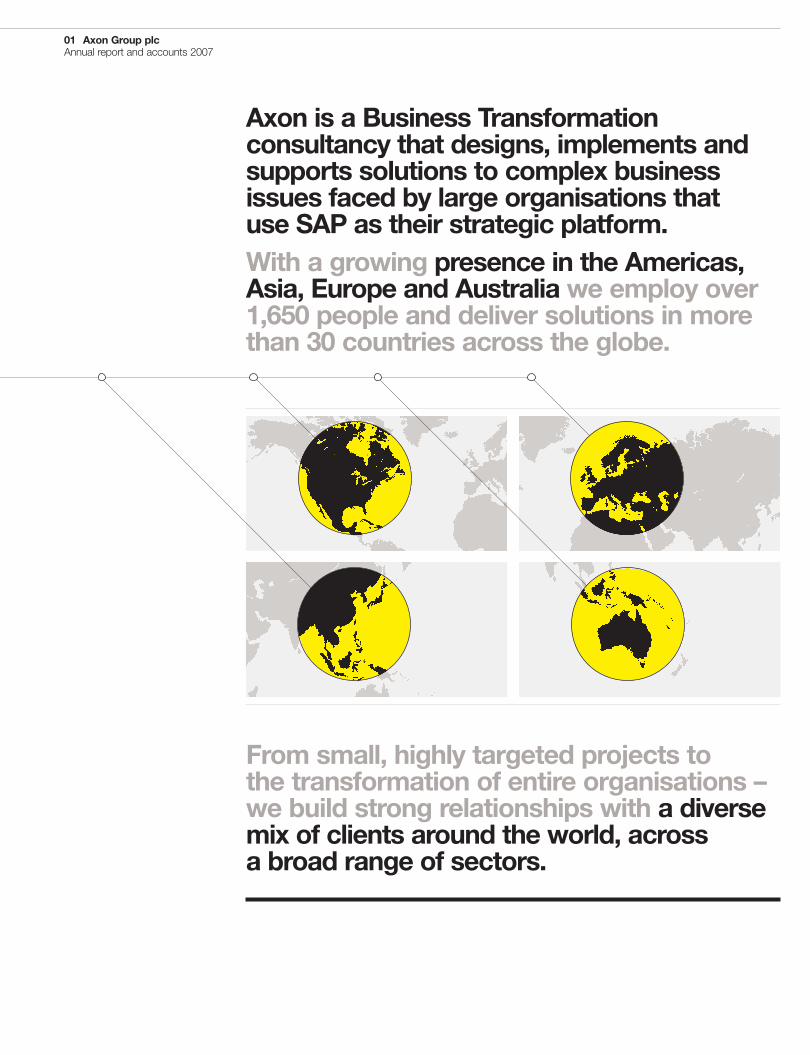
Axon is a Business Transformationconsultancy that designs, implements andsupports solutions to complex businessissues faced by large organisations thatuse SAP as their strategic platform.With a growing presence in the Americas,Asia, Europe and Australia we employ over1,650 people and deliver solutions in morethan 30 countries across the globe.
From small, highly targeted projects tothe transformation of entire organisations –we build strong relationships with a diversemix of clients around the world, acrossa broad range of sectors.

1. Chong Mei San(Lead FICO Consultant)The finance team ensured compliancewith Arch corporate accountingprinciples as well as satisfying localstatutory requirements. Axon providedviable solutions for localisationrequirements such as PRC GAAPvs US GAAP, Golden Tax Interfaceand Golden Audit.
2. Expanding Chinese OperationsArch Chemicals is constructinga new biocides plant in China to meeta strategic customer’s growing demandfor biocides used in the health andhygiene market.
02 Axon Group plcAnnual report and accounts 2007
1 2

03 Axon Group plcAnnual report and accounts 2007
3. Rapidly Growing Sales in ChinaSince 2003, Arch has been rapidlygrowing in China. Their product portfolioincludes health, hygiene and personalcare products, water products, woodcoatings and industrial biocides.
4. Tan Boon Hoi(Project Manager)Effective communication andcoordination were critical to the successof this project with resources workingacross multiple regions. Continualmonitoring and reporting of the projectstatus and deliverables contributedto the successful go-live of the project.
5. Ting Woo Lee(Lead Technical Consultant)Axon was responsible for the deliveryof reports, forms and interfacesin both Chinese and English. Whilstmanaged and delivered locally, thesewere developed in compliance withArch Chemicals’ global standards.
Arch ChemicalsArch Chemicals Inc, headquartered in Norwalk, USA, is a global biocidescompany with approximately $1.5 billion in annual sales. Since 2003,Arch Chemicals has strengthened its presence in China by establishingtrading and/or production facilities in Shanghai, Suzhou and Hong Kongto enhance its ability to provide superior products and technical supportservices in this fast-growing region.
Axon China worked with Arch to roll the Chinese subsidiaries into Arch’sglobal SAP system. The subsidiaries are now using corporate businessprocesses, a common technology platform and global system governance.
4 5
3
04 Axon Group plcAnnual report and accounts 2007
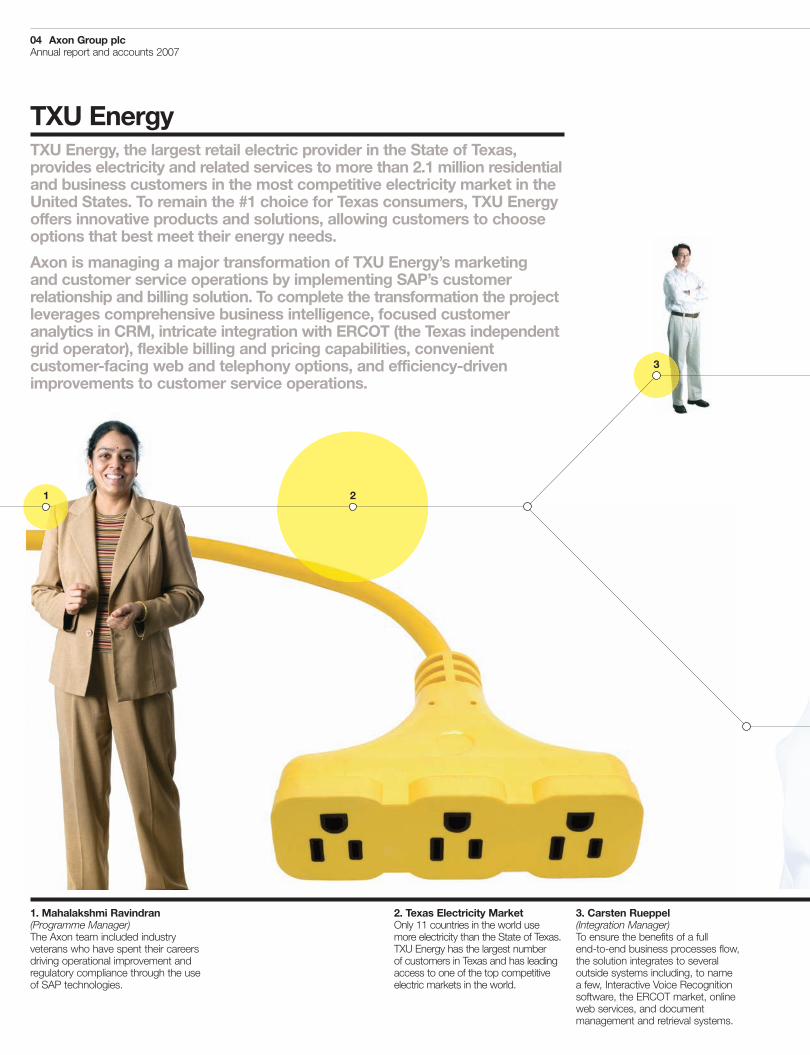
1. Mahalakshmi Ravindran(Programme Manager)The Axon team included industryveterans who have spent their careersdriving operational improvement andregulatory compliance through the useof SAP technologies.
2. Texas Electricity MarketOnly 11 countries in the world usemore electricity than the State of Texas.TXU Energy has the largest numberof customers in Texas and has leadingaccess to one of the top competitiveelectric markets in the world.
3. Carsten Rueppel(Integration Manager)To ensure the benefits of a fullend-to-end business processes flow,the solution integrates to severaloutside systems including, to namea few, Interactive Voice Recognitionsoftware, the ERCOT market, onlineweb services, and documentmanagement and retrieval systems.
TXU EnergyTXU Energy, the largest retail electric provider in the State of Texas,provides electricity and related services to more than 2.1 million residentialand business customers in the most competitive electricity market in theUnited States. To remain the #1 choice for Texas consumers, TXU Energyoffers innovative products and solutions, allowing customers to chooseoptions that best meet their energy needs.
Axon is managing a major transformation of TXU Energy’s marketingand customer service operations by implementing SAP’s customerrelationship and billing solution. To complete the transformation the projectleverages comprehensive business intelligence, focused customeranalytics in CRM, intricate integration with ERCOT (the Texas independentgrid operator), flexible billing and pricing capabilities, convenientcustomer-facing web and telephony options, and efficiency-drivenimprovements to customer service operations.
21
3

05 Axon Group plcAnnual report and accounts 2007
4. Andre Vanhonschooten(Customer Services Lead)The solution provides a variety ofmethods for the customer to interactwith TXU Energy at their comfortand convenience. These methodsinclude 24/7 personal interactionwith customer service representatives,automated voice recognitionand easy-to-use web services.
5. Increasing CompetitionSince the market ‘opened’ in 2002,TXU Energy has experienced increasingcompetition. The company’s focushas been to improve its competitiveofferings while bringing innovativecomplementary products to market, suchas competitively priced service plans,innovative energy efficiency offerings,and renewable energy programmes.
5
4
06 Axon Group plcAnnual report and accounts 2007
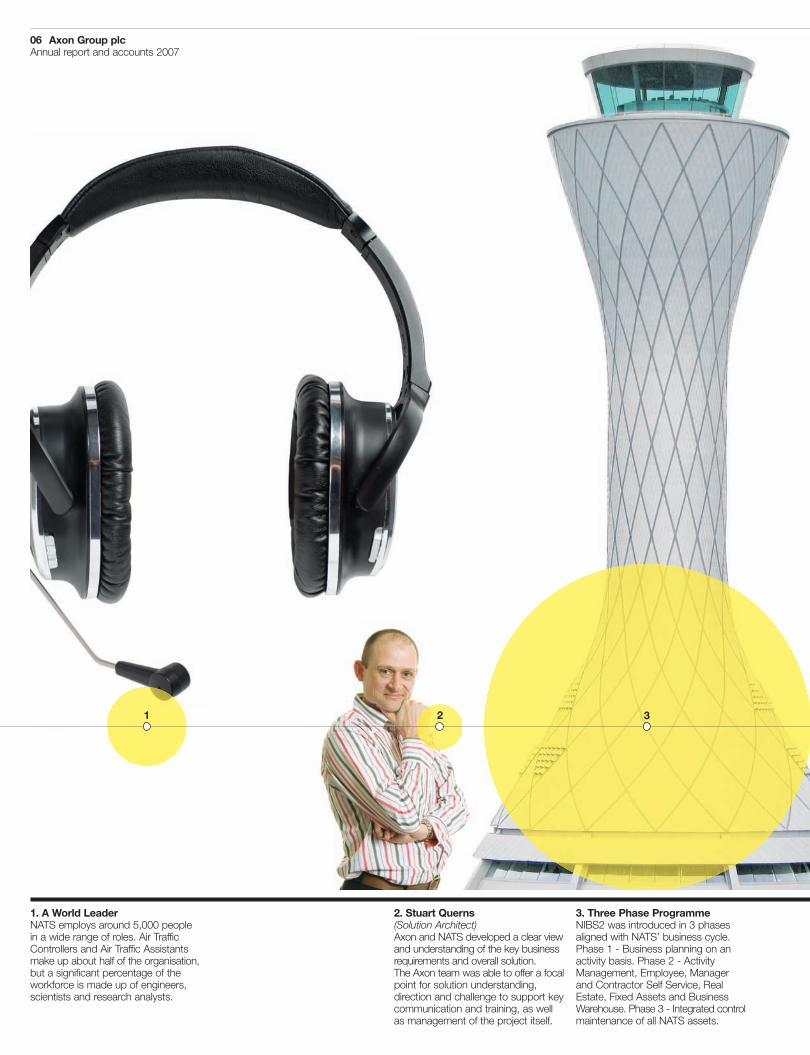
1. A World LeaderNATS employs around 5,000 peoplein a wide range of roles. Air TrafficControllers and Air Traffic Assistantsmake up about half of the organisation,but a significant percentage of theworkforce is made up of engineers,scientists and research analysts.
2. Stuart Querns(Solution Architect)Axon and NATS developed a clear viewand understanding of the key businessrequirements and overall solution.The Axon team was able to offer a focalpoint for solution understanding,direction and challenge to support keycommunication and training, as wellas management of the project itself.
3. Three Phase ProgrammeNIBS2 was introduced in 3 phasesaligned with NATS’ business cycle.Phase 1 - Business planning on anactivity basis. Phase 2 - ActivityManagement, Employee, Managerand Contractor Self Service, RealEstate, Fixed Assets and BusinessWarehouse. Phase 3 - Integrated controlmaintenance of all NATS assets.
2 31
07 Axon Group plcAnnual report and accounts 2007
NATS
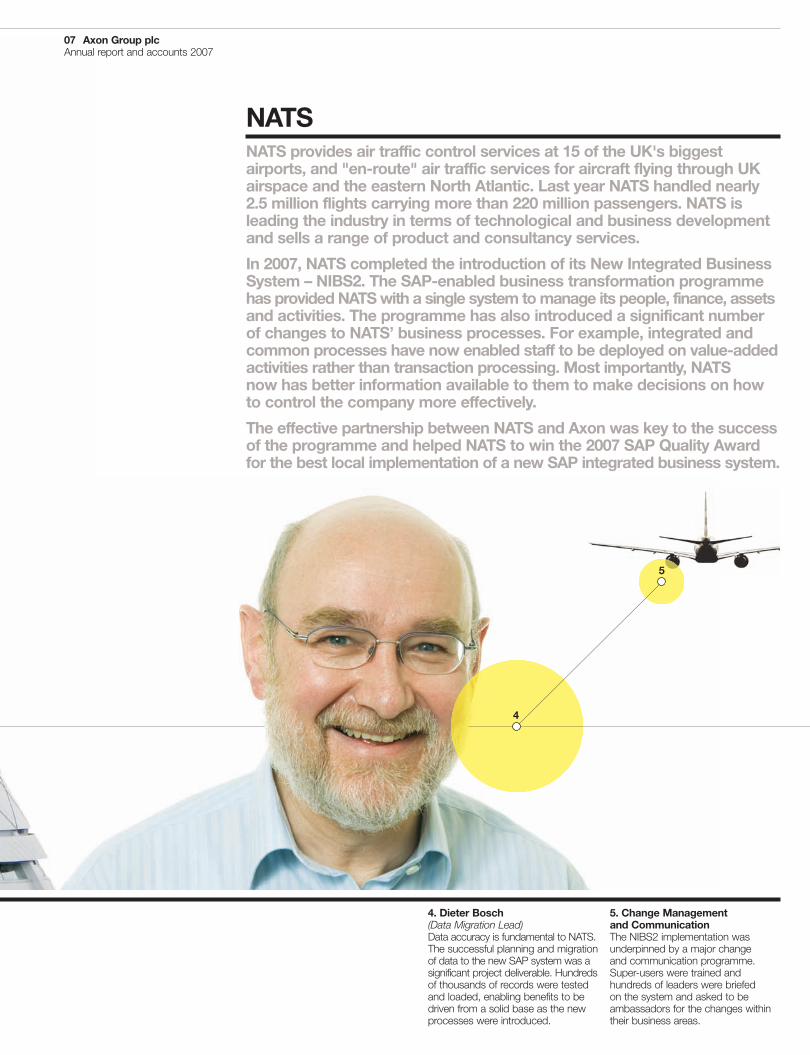
4. Dieter Bosch(Data Migration Lead)Data accuracy is fundamental to NATS.The successful planning and migrationof data to the new SAP system was asignificant project deliverable. Hundredsof thousands of records were testedand loaded, enabling benefits to bedriven from a solid base as the newprocesses were introduced.
5. Change Managementand CommunicationThe NIBS2 implementation wasunderpinned by a major changeand communication programme.Super-users were trained andhundreds of leaders were briefedon the system and asked to beambassadors for the changes withintheir business areas.
NATS provides air traffic control services at 15 of the UK's biggestairports, and "en-route" air traffic services for aircraft flying through UKairspace and the eastern North Atlantic. Last year NATS handled nearly2.5 million flights carrying more than 220 million passengers. NATS isleading the industry in terms of technological and business developmentand sells a range of product and consultancy services.
In 2007, NATS completed the introduction of its New Integrated BusinessSystem – NIBS2. The SAP-enabled business transformation programmehas providedNATSwith a single system tomanage its people, finance, assetsand activities. The programme has also introduced a significant numberof changes to NATS’ business processes. For example, integrated andcommon processes have now enabled staff to be deployed on value-addedactivities rather than transaction processing. Most importantly, NATSnow has better information available to them to make decisions on howto control the company more effectively.
The effective partnership between NATS and Axon was key to the successof the programme and helped NATS to win the 2007 SAP Quality Awardfor the best local implementation of a new SAP integrated business system.
5
4
08 Axon Group plcAnnual report and accounts 2007
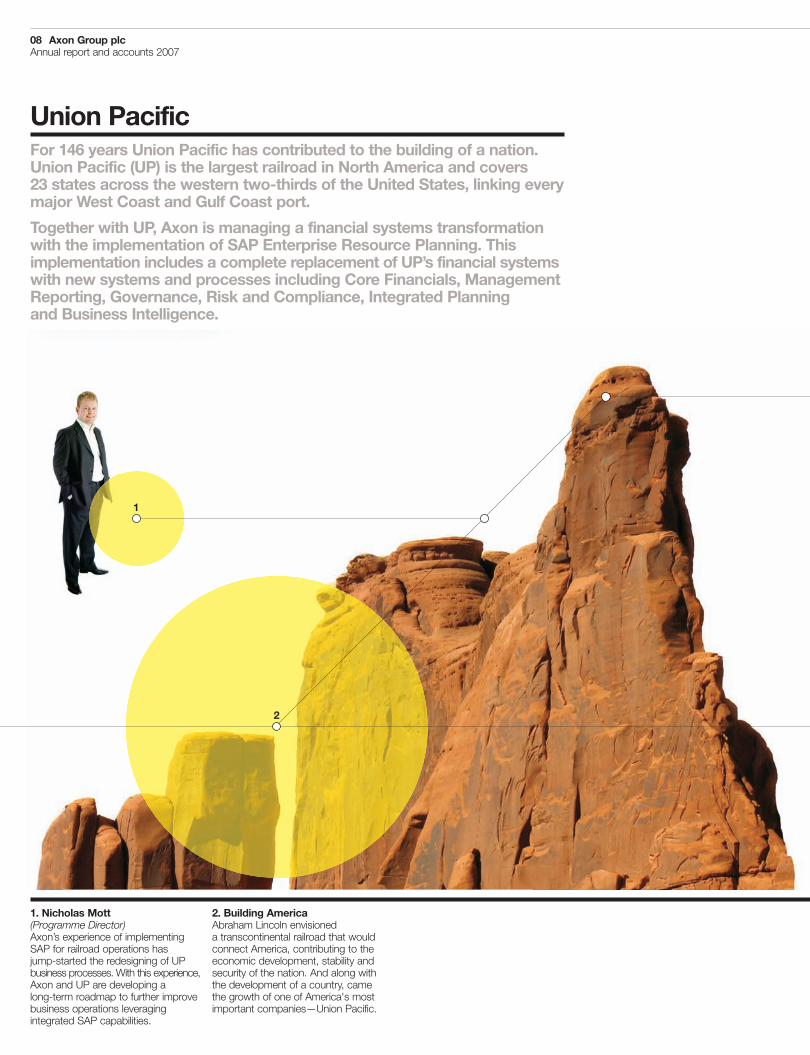
1. Nicholas Mott(Programme Director)Axon’s experience of implementingSAP for railroad operations hasjump-started the redesigning of UPbusiness processes. With this experience,Axon and UP are developing along-term roadmap to further improvebusiness operations leveragingintegrated SAP capabilities.
2. Building AmericaAbraham Lincoln envisioneda transcontinental railroad that wouldconnect America, contributing to theeconomic development, stability andsecurity of the nation. And along withthe development of a country, camethe growth of one of America's mostimportant companies—Union Pacific.
Union PacificFor 146 years Union Pacific has contributed to the building of a nation.Union Pacific (UP) is the largest railroad in North America and covers23 states across the western two-thirds of the United States, linking everymajor West Coast and Gulf Coast port.
Together with UP, Axon is managing a financial systems transformationwith the implementation of SAP Enterprise Resource Planning. Thisimplementation includes a complete replacement of UP’s financial systemswith new systems and processes including Core Financials, ManagementReporting, Governance, Risk and Compliance, Integrated Planningand Business Intelligence.
2
1

3. David Steiner(Business Intelligence Lead)The financial transformation includesmajor reporting and analytics capabilitiesempowering UP’s executives andoperating managers’ ability to makefaster, better decisions.
4. Freight TransportationUnion Pacific operates the largestcommercial railroad in North America,connecting with Canada’s rail systemsand serving all six major gatewaysto Mexico.
5. Benson Odighibor(Solution Architect)The financial design migrates UP awayfrom their complex General Ledgercode structure to a much more flexiblefinancial reporting framework whichallows strong financial controlsand enables comprehensive financialplanning capabilities.
09 Axon Group plcAnnual report and accounts 2007
53
4
09 Axon Group plcAnnual report and accounts 2007
10 Axon Group plcAnnual report and accounts 2007
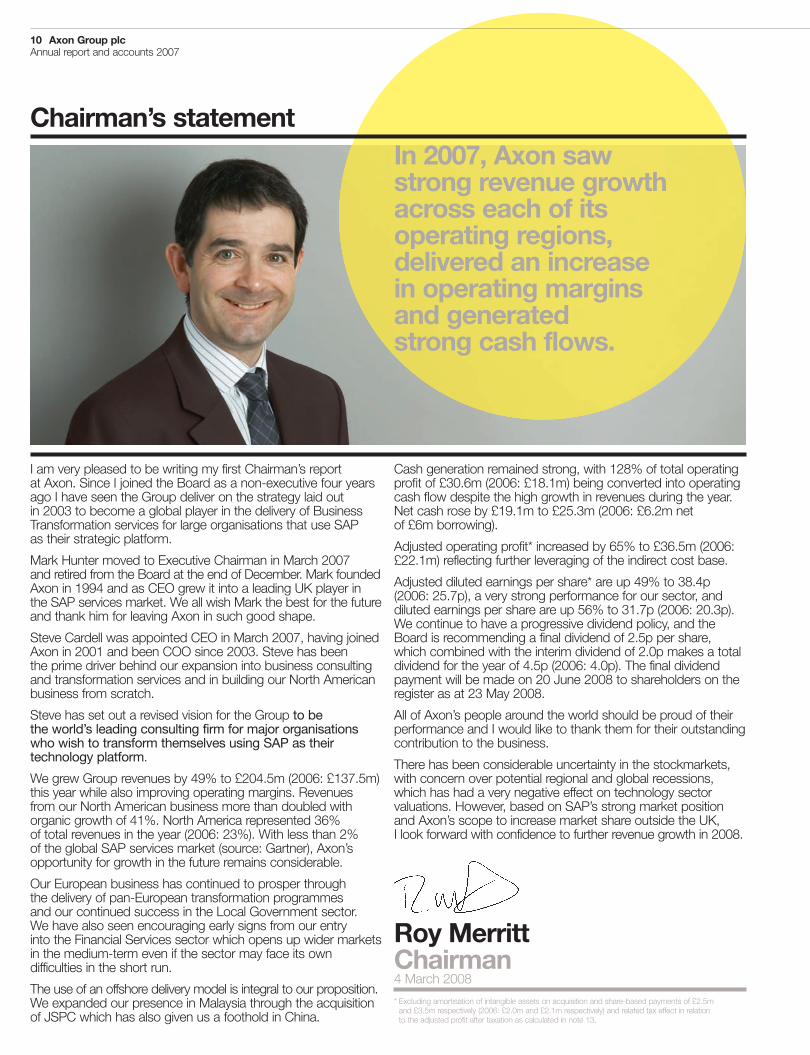
I am very pleased to be writing my first Chairman’s reportat Axon. Since I joined the Board as a non-executive four yearsago I have seen the Group deliver on the strategy laid outin 2003 to become a global player in the delivery of BusinessTransformation services for large organisations that use SAPas their strategic platform.
Mark Hunter moved to Executive Chairman in March 2007and retired from the Board at the end of December. Mark foundedAxon in 1994 and as CEO grew it into a leading UK player inthe SAP services market. We all wish Mark the best for the futureand thank him for leaving Axon in such good shape.
Steve Cardell was appointed CEO in March 2007, having joinedAxon in 2001 and been COO since 2003. Steve has beenthe prime driver behind our expansion into business consultingand transformation services and in building our North Americanbusiness from scratch.
Steve has set out a revised vision for the Group to bethe world’s leading consulting firm for major organisationswho wish to transform themselves using SAP as theirtechnology platform.
We grew Group revenues by 49% to £204.5m (2006: £137.5m)this year while also improving operating margins. Revenuesfrom our North American business more than doubled withorganic growth of 41%. North America represented 36%of total revenues in the year (2006: 23%). With less than 2%of the global SAP services market (source: Gartner), Axon’sopportunity for growth in the future remains considerable.
Our European business has continued to prosper throughthe delivery of pan-European transformation programmesand our continued success in the Local Government sector.We have also seen encouraging early signs from our entryinto the Financial Services sector which opens up wider marketsin the medium-term even if the sector may face its owndifficulties in the short run.
The use of an offshore delivery model is integral to our proposition.We expanded our presence in Malaysia through the acquisitionof JSPC which has also given us a foothold in China.
Cash generation remained strong, with 128% of total operatingprofit of £30.6m (2006: £18.1m) being converted into operatingcash flow despite the high growth in revenues during the year.Net cash rose by £19.1m to £25.3m (2006: £6.2m netof £6m borrowing).
Adjusted operating profit* increased by 65% to £36.5m (2006:£22.1m) reflecting further leveraging of the indirect cost base.
Adjusted diluted earnings per share* are up 49% to 38.4p(2006: 25.7p), a very strong performance for our sector, anddiluted earnings per share are up 56% to 31.7p (2006: 20.3p).We continue to have a progressive dividend policy, and theBoard is recommending a final dividend of 2.5p per share,which combined with the interim dividend of 2.0p makes a totaldividend for the year of 4.5p (2006: 4.0p). The final dividendpayment will be made on 20 June 2008 to shareholders on theregister as at 23 May 2008.
All of Axon’s people around the world should be proud of theirperformance and I would like to thank them for their outstandingcontribution to the business.
There has been considerable uncertainty in the stockmarkets,with concern over potential regional and global recessions,which has had a very negative effect on technology sectorvaluations. However, based on SAP’s strong market positionand Axon’s scope to increase market share outside the UK,I look forward with confidence to further revenue growth in 2008.
Roy MerrittChairman4 March 2008
* Excluding amortisation of intangible assets on acquisition and share-based payments of £2.5mand £3.5m respectively (2006: £2.0m and £2.1m respectively) and related tax effect in relationto the adjusted profit after taxation as calculated in note 13.
In 2007, Axon sawstrong revenue growthacross each of itsoperating regions,delivered an increasein operating marginsand generatedstrong cash flows.
Chairman’s statement
11 Axon Group plcAnnual report and accounts 2007
Axon delivers Business Transformationprogrammes. Globally.
Axon’s success in winning, and delivering, large BusinessTransformation programmes continues to deliver significantgrowth and has driven a 49% increase in revenues to £204.5m(2006: £137.5m).
Adjusted operating profit before tax grew by 65% to £36.5m(2006: £22.1m). On the same basis our adjusted operatingmargin grew strongly to 17.9% (2006: 16.1%). A summaryof adjusted profit is detailed below.
2005 2006 2007£’000 £’000 £’000
Operating profitfrom continuing operations 10,092 18,057 30,586
Share-based payments 1,111 2,092 3,471
Amortisation of purchasedintangible assets 523 1,991 2,458
Adjusted operating profit 11,726 22,140 36,515
Net finance costs 285 (363) (1,056)
Adjusted profit on ordinaryactivities before tax 12,011 21,777 35,459
Axon is a leader in its market
Axon is the largest consultancy in the world focused exclusivelyon the provision of SAP services and solutions for its customers.We provide large organisations with Business Transformationsolutions that encompass all elements of Business Consulting,Solutions Implementation and ongoing Applications Management.In turn, SAP is the leading player in the global enterprisesoftware market with approximately twice the share of Oracle,the number two competitor (source: AMR Research).
We have seen strong growth across all three of our geographicregions.
We are a significant player in the UK andour pan-European capability continues to grow
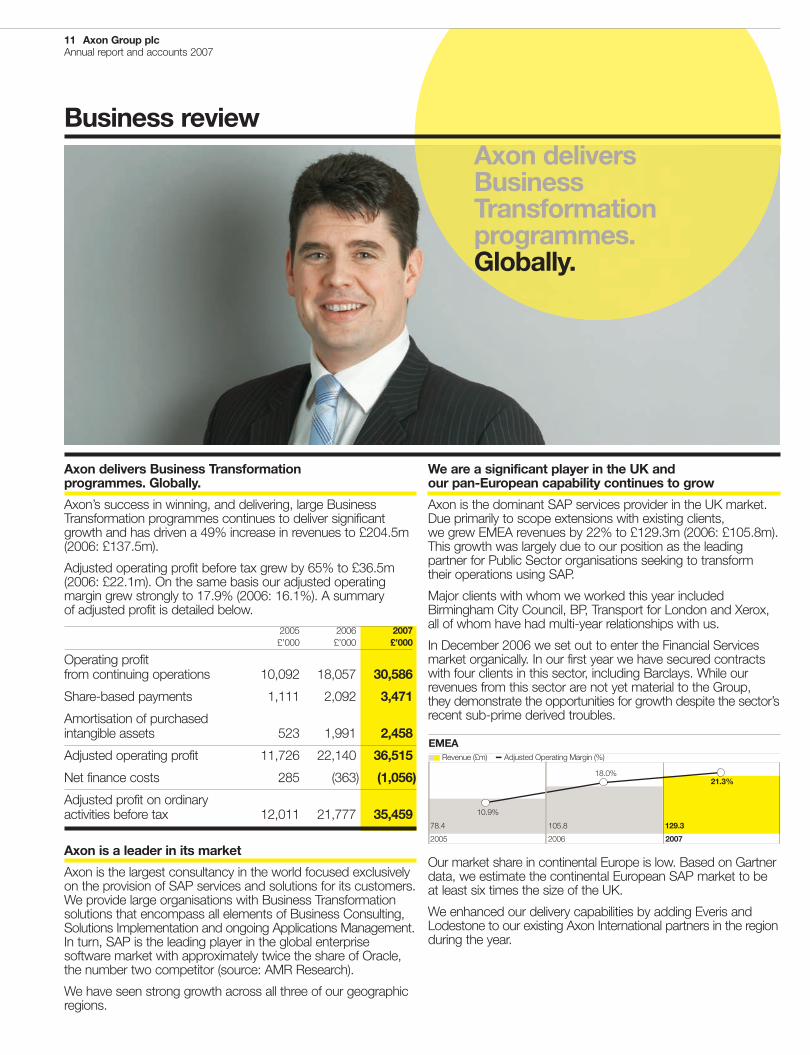
Axon is the dominant SAP services provider in the UK market.Due primarily to scope extensions with existing clients,we grew EMEA revenues by 22% to £129.3m (2006: £105.8m).This growth was largely due to our position as the leadingpartner for Public Sector organisations seeking to transformtheir operations using SAP.
Major clients with whom we worked this year includedBirmingham City Council, BP, Transport for London and Xerox,all of whom have had multi-year relationships with us.
In December 2006 we set out to enter the Financial Servicesmarket organically. In our first year we have secured contractswith four clients in this sector, including Barclays. While ourrevenues from this sector are not yet material to the Group,they demonstrate the opportunities for growth despite the sector’srecent sub-prime derived troubles.
Our market share in continental Europe is low. Based on Gartnerdata, we estimate the continental European SAP market to beat least six times the size of the UK.
We enhanced our delivery capabilities by adding Everis andLodestone to our existing Axon International partners in the regionduring the year.
Axon deliversBusinessTransformationprogrammes.Globally.
Business review
EMEA Adjusted Operating Margin (%)
10.9%
2005 2006 2007
78.4 105.8 129.3
18.0%21.3%
Revenue (£m)
12 Axon Group plcAnnual report and accounts 2007
Business review (continued)
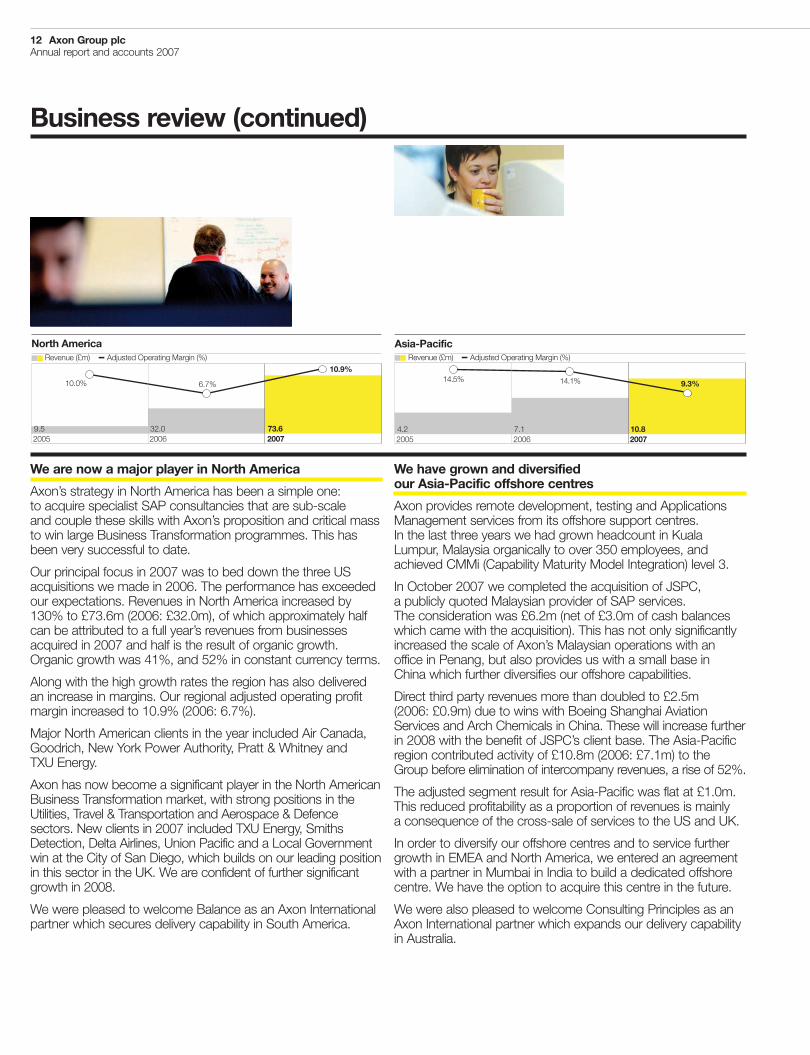
We are now a major player in North America
Axon’s strategy in North America has been a simple one:to acquire specialist SAP consultancies that are sub-scaleand couple these skills with Axon’s proposition and critical massto win large Business Transformation programmes. This hasbeen very successful to date.
Our principal focus in 2007 was to bed down the three USacquisitions we made in 2006. The performance has exceededour expectations. Revenues in North America increased by130% to £73.6m (2006: £32.0m), of which approximately halfcan be attributed to a full year’s revenues from businessesacquired in 2007 and half is the result of organic growth.Organic growth was 41%, and 52% in constant currency terms.
Along with the high growth rates the region has also deliveredan increase in margins. Our regional adjusted operating profitmargin increased to 10.9% (2006: 6.7%).
Major North American clients in the year included Air Canada,Goodrich, New York Power Authority, Pratt & Whitney andTXU Energy.
Axon has now become a significant player in the North AmericanBusiness Transformation market, with strong positions in theUtilities, Travel & Transportation and Aerospace & Defencesectors. New clients in 2007 included TXU Energy, SmithsDetection, Delta Airlines, Union Pacific and a Local Governmentwin at the City of San Diego, which builds on our leading positionin this sector in the UK. We are confident of further significantgrowth in 2008.
We were pleased to welcome Balance as an Axon Internationalpartner which secures delivery capability in South America.
We have grown and diversifiedour Asia-Pacific offshore centres
Axon provides remote development, testing and ApplicationsManagement services from its offshore support centres.In the last three years we had grown headcount in KualaLumpur, Malaysia organically to over 350 employees, andachieved CMMi (Capability Maturity Model Integration) level 3.
In October 2007 we completed the acquisition of JSPC,a publicly quoted Malaysian provider of SAP services.The consideration was £6.2m (net of £3.0m of cash balanceswhich came with the acquisition). This has not only significantlyincreased the scale of Axon’s Malaysian operations with anoffice in Penang, but also provides us with a small base inChina which further diversifies our offshore capabilities.
Direct third party revenues more than doubled to £2.5m(2006: £0.9m) due to wins with Boeing Shanghai AviationServices and Arch Chemicals in China. These will increase furtherin 2008 with the benefit of JSPC’s client base. The Asia-Pacificregion contributed activity of £10.8m (2006: £7.1m) to theGroup before elimination of intercompany revenues, a rise of 52%.
The adjusted segment result for Asia-Pacific was flat at £1.0m.This reduced profitability as a proportion of revenues is mainlya consequence of the cross-sale of services to the US and UK.
In order to diversify our offshore centres and to service furthergrowth in EMEA and North America, we entered an agreementwith a partner in Mumbai in India to build a dedicated offshorecentre. We have the option to acquire this centre in the future.
We were also pleased to welcome Consulting Principles as anAxon International partner which expands our delivery capabilityin Australia.
Adjusted Operating Margin (%)Revenue (£m)
A
North America
2005 2006 20079.5 32.0 73.6
10.0% 6.7%
10.9%
N
Asia-Pacific
2005 2006 20074.2 7.1 10.8
14.5% 14.1% 9.3%
Adjusted Operating Margin (%)Revenue (£m)
A
Business Consulting growth is drivenby Business Transformation programmes
Our Business Consulting division helps our clients to delivermore effective strategies by facilitating improvements in process,technology and people. It determines whether individual businessfunctions and systems meet the current objectives of the business;can change fast enough to meet the future needs of thebusiness; and are communicating adequately with each other.
Business Consulting revenues grew by 60% from £25.0min 2006 to £39.9m in 2007, which represents 19% of turnover(2006: 18%).
Solutions Implementationhad a strong performance in 2007
We have a reputation for rapid, innovative implementationof complex business systems. Our Solutions Implementationteam works closely with the client at all levels defining anddelivering new business processes and systems, whilst ensuringthat the people within the organisation enthusiastically embracethe changes. Once the transition to a new platform has beenmade, we ensure that the new working environment is stableprior to focusing on the delivery of quantifiable business benefits.
As anticipated, Solutions Implementation performed stronglyin 2007 and revenues grew by 59% to £141.0m (2006: £88.7m)which represents 69% of turnover (2006: 65%).
We are rebuilding our ApplicationsManagement proposition
We provide ongoing support and evolution for our clientsthat have undergone a Business Transformation programme.Our focus is on niche, high value added applicationsmanagement. We run and support critical business applicationsfor our clients 24 hours per day, 7 days a week, 365 daysa year globally. This support ensures that the working practicesand software systems enable the business to respond to anyfurther internal or external imperatives.
Applications Management revenues decreased by 1%to £23.6m (2006: £23.8m), which represents 12% of turnover(2006: 17%), in part reflecting increased use of offshore resources.
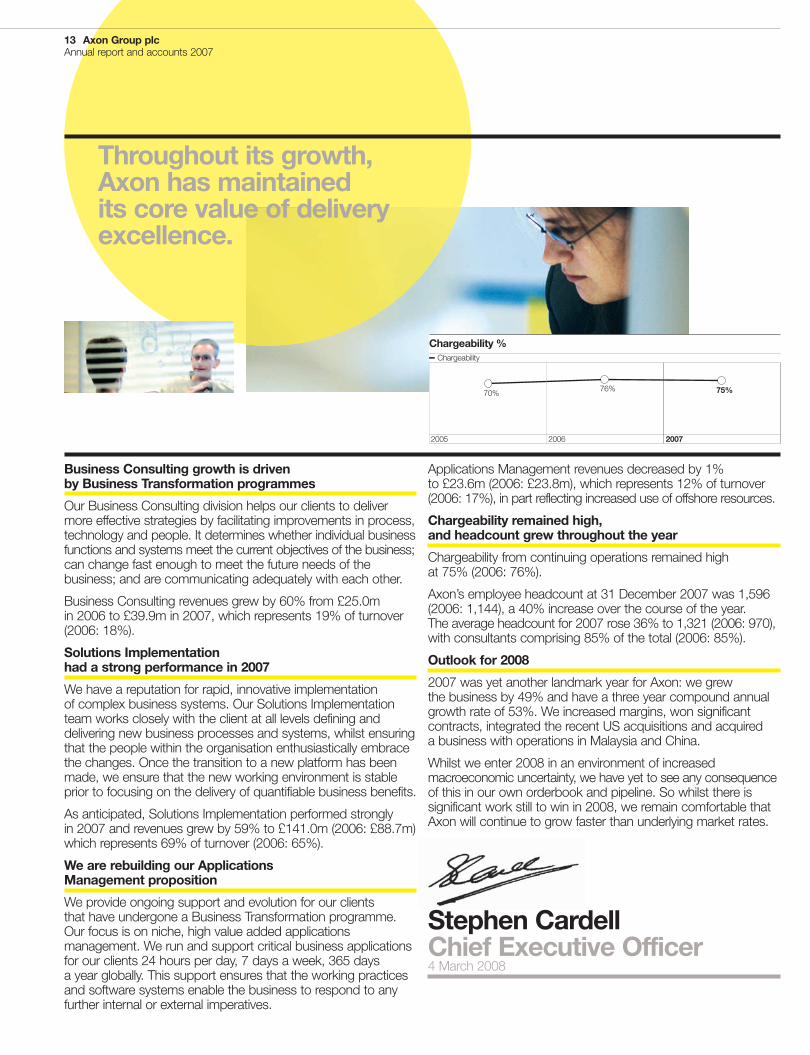
Chargeability remained high,and headcount grew throughout the year
Chargeability from continuing operations remained highat 75% (2006: 76%).
Axon’s employee headcount at 31 December 2007 was 1,596(2006: 1,144), a 40% increase over the course of the year.The average headcount for 2007 rose 36% to 1,321 (2006: 970),with consultants comprising 85% of the total (2006: 85%).
Outlook for 2008
2007 was yet another landmark year for Axon: we grewthe business by 49% and have a three year compound annualgrowth rate of 53%. We increased margins, won significantcontracts, integrated the recent US acquisitions and acquireda business with operations in Malaysia and China.
Whilst we enter 2008 in an environment of increasedmacroeconomic uncertainty, we have yet to see any consequenceof this in our own orderbook and pipeline. So whilst there issignificant work still to win in 2008, we remain comfortable thatAxon will continue to grow faster than underlying market rates.
Stephen CardellChief Executive Officer4 March 2008
Chargeability %
70%
2005 2006 2007
76% 75%
Chargeability
Throughout its growth,Axon has maintainedits core value of deliveryexcellence.
13 Axon Group plcAnnual report and accounts 2007
14 Axon Group plcAnnual report and accounts 2007
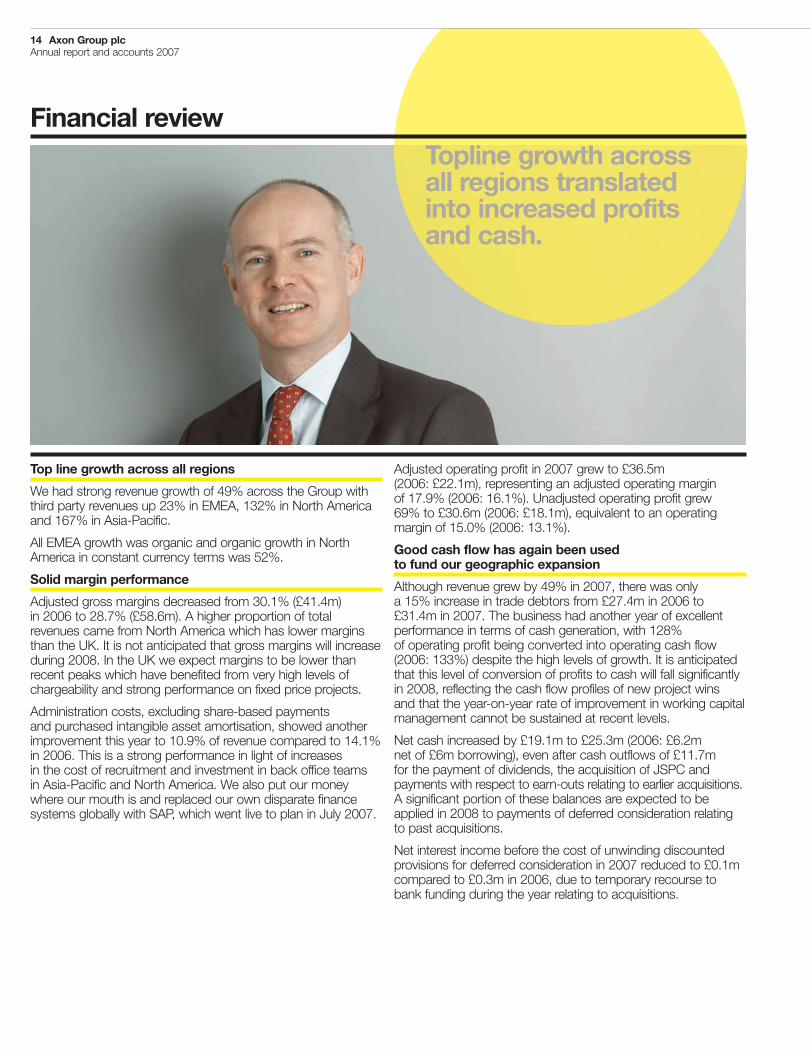
Top line growth across all regions
We had strong revenue growth of 49% across the Group withthird party revenues up 23% in EMEA, 132% in North Americaand 167% in Asia-Pacific.
All EMEA growth was organic and organic growth in NorthAmerica in constant currency terms was 52%.
Solid margin performance
Adjusted gross margins decreased from 30.1% (£41.4m)in 2006 to 28.7% (£58.6m). A higher proportion of totalrevenues came from North America which has lower marginsthan the UK. It is not anticipated that gross margins will increaseduring 2008. In the UK we expect margins to be lower thanrecent peaks which have benefited from very high levels ofchargeability and strong performance on fixed price projects.
Administration costs, excluding share-based paymentsand purchased intangible asset amortisation, showed anotherimprovement this year to 10.9% of revenue compared to 14.1%in 2006. This is a strong performance in light of increasesin the cost of recruitment and investment in back office teamsin Asia-Pacific and North America. We also put our moneywhere our mouth is and replaced our own disparate financesystems globally with SAP, which went live to plan in July 2007.
Adjusted operating profit in 2007 grew to £36.5m(2006: £22.1m), representing an adjusted operating marginof 17.9% (2006: 16.1%). Unadjusted operating profit grew69% to £30.6m (2006: £18.1m), equivalent to an operatingmargin of 15.0% (2006: 13.1%).
Good cash flow has again been usedto fund our geographic expansion
Although revenue grew by 49% in 2007, there was onlya 15% increase in trade debtors from £27.4m in 2006 to£31.4m in 2007. The business had another year of excellentperformance in terms of cash generation, with 128%of operating profit being converted into operating cash flow(2006: 133%) despite the high levels of growth. It is anticipatedthat this level of conversion of profits to cash will fall significantlyin 2008, reflecting the cash flow profiles of new project winsand that the year-on-year rate of improvement in working capitalmanagement cannot be sustained at recent levels.
Net cash increased by £19.1m to £25.3m (2006: £6.2mnet of £6m borrowing), even after cash outflows of £11.7mfor the payment of dividends, the acquisition of JSPC andpayments with respect to earn-outs relating to earlier acquisitions.A significant portion of these balances are expected to beapplied in 2008 to payments of deferred consideration relatingto past acquisitions.
Net interest income before the cost of unwinding discountedprovisions for deferred consideration in 2007 reduced to £0.1mcompared to £0.3m in 2006, due to temporary recourse tobank funding during the year relating to acquisitions.
Topline growth acrossall regions translatedinto increased profitsand cash.
Financial review
15 Axon Group plcAnnual report and accounts 2007
We have continued to invest in infrastructureto support the business
Capital expenditure increased from £1.2m in 2006 to £3.3min 2007 and the majority of investments were on internal SAPsystems, computer equipment and office infrastructure.
Taxation
The tax charge for the year of £9.3m represents an effective taxrate of 32% on continuing operations (2006: 30%). The highercharge reflects increased US profitability.
Earnings per share grew
The adjusted profit after tax was £24.5m (2006: £15.7m)resulting in adjusted earnings per share of 41.2p (2006: 27.1p).Adjusted diluted earnings per share were 38.4p (2006: 25.7p),an increase of 49%. Profit after tax from continuing operationswas £20.2m (2006: £12.4m) resulting in earnings per shareof 34.0p (2006: 21.5p). Diluted earnings per share were 31.7p(2006: 20.3p), an increase of 56%.
Iain McIntoshChief Financial Officer4 March 2008
16 Axon Group plcAnnual report and accounts 2007
Board profiles
ExecutiveDirectors
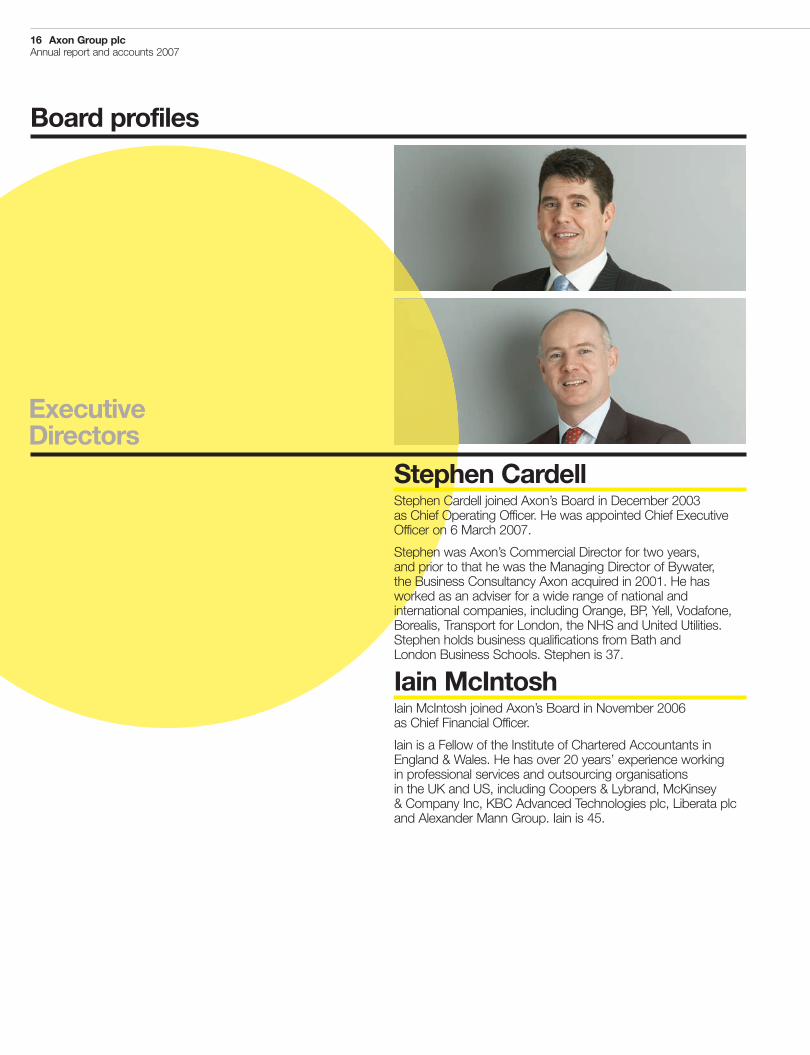
Stephen CardellStephen Cardell joined Axon’s Board in December 2003as Chief Operating Officer. He was appointed Chief ExecutiveOfficer on 6 March 2007.
Stephen was Axon’s Commercial Director for two years,and prior to that he was the Managing Director of Bywater,the Business Consultancy Axon acquired in 2001. He hasworked as an adviser for a wide range of national andinternational companies, including Orange, BP, Yell, Vodafone,Borealis, Transport for London, the NHS and United Utilities.Stephen holds business qualifications from Bath andLondon Business Schools. Stephen is 37.
Iain McIntoshIain McIntosh joined Axon’s Board in November 2006as Chief Financial Officer.
Iain is a Fellow of the Institute of Chartered Accountants inEngland & Wales. He has over 20 years’ experience workingin professional services and outsourcing organisationsin the UK and US, including Coopers & Lybrand, McKinsey& Company Inc, KBC Advanced Technologies plc, Liberata plcand Alexander Mann Group. Iain is 45.
17 Axon Group plcAnnual report and accounts 2007
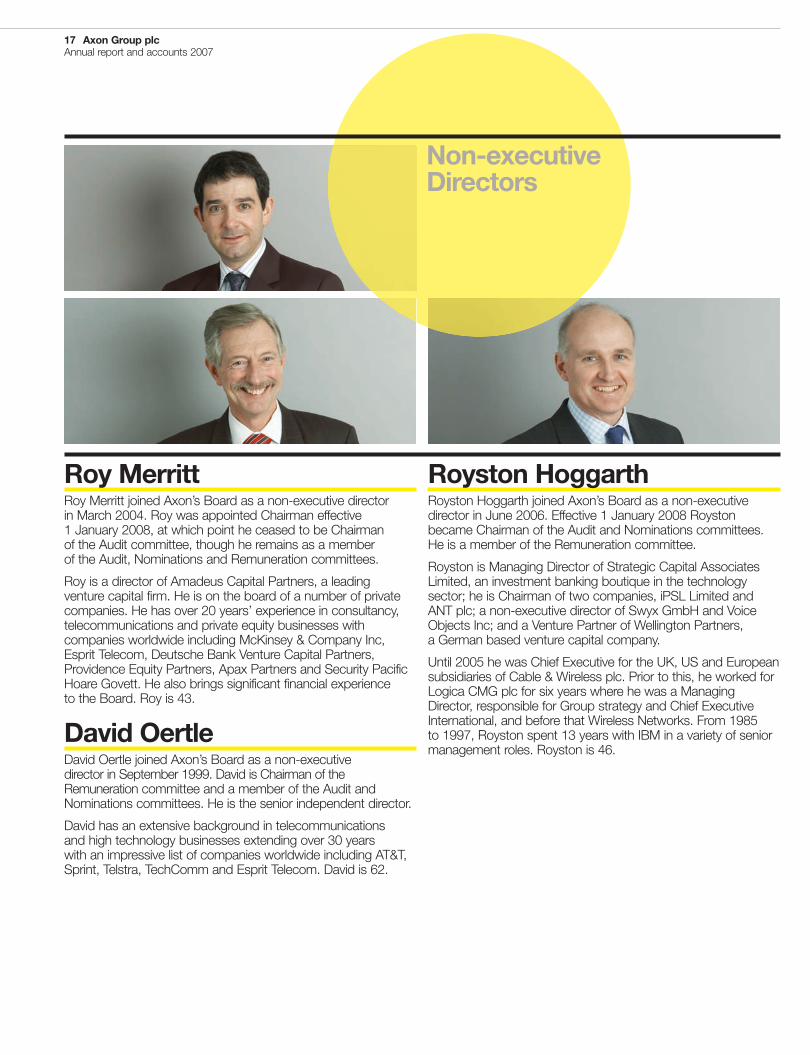
Roy MerrittRoy Merritt joined Axon’s Board as a non-executive directorin March 2004. Roy was appointed Chairman effective1 January 2008, at which point he ceased to be Chairmanof the Audit committee, though he remains as a memberof the Audit, Nominations and Remuneration committees.
Roy is a director of Amadeus Capital Partners, a leadingventure capital firm. He is on the board of a number of privatecompanies. He has over 20 years’ experience in consultancy,telecommunications and private equity businesses withcompanies worldwide including McKinsey & Company Inc,Esprit Telecom, Deutsche Bank Venture Capital Partners,Providence Equity Partners, Apax Partners and Security PacificHoare Govett. He also brings significant financial experienceto the Board. Roy is 43.
David OertleDavid Oertle joined Axon’s Board as a non-executivedirector in September 1999. David is Chairman of theRemuneration committee and a member of the Audit andNominations committees. He is the senior independent director.
David has an extensive background in telecommunicationsand high technology businesses extending over 30 yearswith an impressive list of companies worldwide including AT&T,Sprint, Telstra, TechComm and Esprit Telecom. David is 62.
Royston HoggarthRoyston Hoggarth joined Axon’s Board as a non-executivedirector in June 2006. Effective 1 January 2008 Roystonbecame Chairman of the Audit and Nominations committees.He is a member of the Remuneration committee.
Royston is Managing Director of Strategic Capital AssociatesLimited, an investment banking boutique in the technologysector; he is Chairman of two companies, iPSL Limited andANT plc; a non-executive director of Swyx GmbH and VoiceObjects Inc; and a Venture Partner of Wellington Partners,a German based venture capital company.
Until 2005 he was Chief Executive for the UK, US and Europeansubsidiaries of Cable & Wireless plc. Prior to this, he worked forLogica CMG plc for six years where he was a ManagingDirector, responsible for Group strategy and Chief ExecutiveInternational, and before that Wireless Networks. From 1985to 1997, Royston spent 13 years with IBM in a variety of seniormanagement roles. Royston is 46.
Non-executiveDirectors
18 Axon Group plcAnnual report and accounts 2007
Directors’ reportFor the year ended 31 December 2007
The directors present their annual report and the Group’s audited financial statements for the year ended 31 December 2007.
Revenue, results and dividend The financial results of the Group are shown in the income statement on page 31 and in the related notes.
Revenue from continuing operations was £204.5m (2006: £137.5m). Adjusted profit before taxation, excluding amortisation of intangibleassets on acquisition and share-based payments, from continuing operations was £35.5m (2006: £21.8m). Profit before taxation fromcontinuing operations was £29.5m (2006: £17.7m).
Profit for the year was £20.2m (2006: £11.3m). Diluted earnings per share was 31.7p (2006: 20.3p from continuing operations and 18.5p fromcontinuing and discontinued operations).
Net funds as at 31 December 2007 (being cash and cash equivalents, less borrowings) stood at £25.3m, compared to £6.2m as at31 December 2006.
The directors are recommending a final dividend of 2.5p per share, making 4.5p per share for the year (2006: 4.0p). If approved, thefinal dividend will be paid on 20 June 2008 to eligible shareholders on the Company’s Register of Members at the close of business on23 May 2008.
Principal activity and review of business The Group’s principal activity remains the provision of Business Transformation consultancyservices. The Group will continue to deepen its vertical industry penetration in the provision of these services in 2008. The operationaland financial activity of the Group is set out in more detail in the business and financial reviews on pages 11 to 15.
Branches In addition to other overseas subsidiaries, the Group operates a branch in Italy.
Board of directors and directors’ interests Details of the current directors who have served during the year are shown on pages 16 and17. Mark Hunter resigned from the Board effective 31 December 2007. In accordance with the Combined Code on Corporate Governance,which requires that all directors should be subject to re-election at intervals of no more than three years, David Oertle will be retiring andoffering himself for re-election at the forthcoming Annual General Meeting.
No director had any beneficial interest in the shares of any of the subsidiary undertakings of the Company at the balance sheet date.The beneficial interests of the directors in the shares of the Company are shown in the remuneration report on pages 25 to 29.
Interests in contracts No director had any material interest in any contract of significance to which the Company or any of its subsidiaryundertakings was a party during the financial year.
Financial risks The Board believes that the Group’s interest rate risk is minimal due to the short-term nature of current borrowings.If longer term debt funding is required in the future, the Board will introduce a policy which mitigates this risk.
The Group’s credit risk is primarily attributable to its trade receivables, as described in note 18.
Cash flow performance is monitored on an ongoing basis by the Board. Debt facilities have been established to fund future cash flowrequirements, as described in note 21.
For the most part, the Group’s exchange risk is naturally hedged with costs and revenues being incurred in the same currency. The mainexception to this is the provision of resources from Malaysia for clients in EMEA and North America, though Asia-Pacific intragroup revenuesrepresented less than 10% of Group revenues in the year.
Other risks and uncertainties Most of the Group’s revenues are undertaken under contracts which allow clients to terminate at shortnotice or allow clients to make rapid changes to the volume of work required. Loss of a major client at short notice could have a significantnegative impact on results.
Some contracts are undertaken under “fixed price” contracts whereby Axon is paid based on milestones related to the outputs delivered.In such cases there is a risk that more resources are required to achieve the milestones than was envisaged when the price was set.
In some cases clients require the provision of third party bonds to underwrite the Group’s contractual liabilities. Details of current bonds aredisclosed in note 27.
Short-term profitability is impacted significantly by the ability to secure sufficient work to ensure that consultants are highly chargeable andthat resource levels are managed to match demand.
Other important risks include not recruiting and retaining suitably skilled and experienced employees and incurring claims from clientsfor work for which they are not satisfied.
With Axon’s focus on SAP, a medium-term risk is that SAP fails to maintain a strong position in the market for software solutions for largecompanies.
Directors’ and officers’ liability insurance The Company maintains insurance cover for all directors and key personnel against liabilitieswhich may be incurred by them while carrying out their duties.
19 Axon Group plcAnnual report and accounts 2007
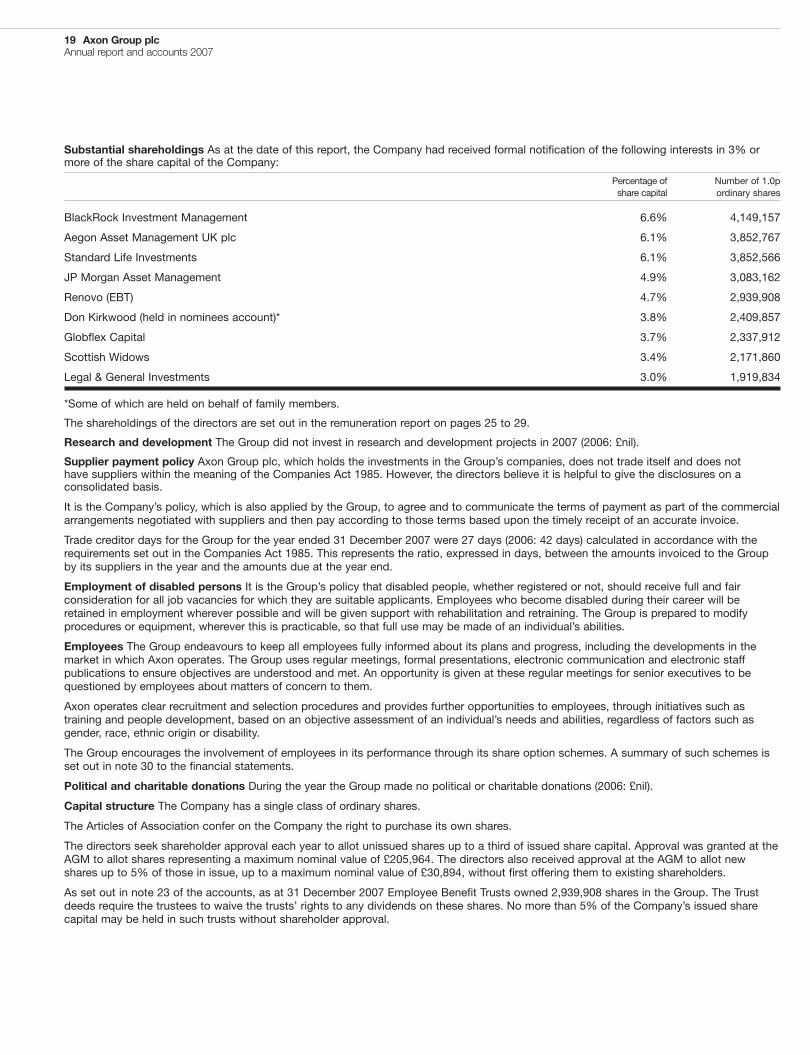
Substantial shareholdings As at the date of this report, the Company had received formal notification of the following interests in 3% ormore of the share capital of the Company:
Percentage of Number of 1.0pshare capital ordinary shares
BlackRock Investment Management 6.6% 4,149,157
Aegon Asset Management UK plc 6.1% 3,852,767
Standard Life Investments 6.1% 3,852,566
JP Morgan Asset Management 4.9% 3,083,162
Renovo (EBT) 4.7% 2,939,908
Don Kirkwood (held in nominees account)* 3.8% 2,409,857
Globflex Capital 3.7% 2,337,912
Scottish Widows 3.4% 2,171,860
Legal & General Investments 3.0% 1,919,834
*Some of which are held on behalf of family members.
The shareholdings of the directors are set out in the remuneration report on pages 25 to 29.
Research and development The Group did not invest in research and development projects in 2007 (2006: £nil).
Supplier payment policy Axon Group plc, which holds the investments in the Group’s companies, does not trade itself and does nothave suppliers within the meaning of the Companies Act 1985. However, the directors believe it is helpful to give the disclosures on aconsolidated basis.
It is the Company’s policy, which is also applied by the Group, to agree and to communicate the terms of payment as part of the commercialarrangements negotiated with suppliers and then pay according to those terms based upon the timely receipt of an accurate invoice.
Trade creditor days for the Group for the year ended 31 December 2007 were 27 days (2006: 42 days) calculated in accordance with therequirements set out in the Companies Act 1985. This represents the ratio, expressed in days, between the amounts invoiced to the Groupby its suppliers in the year and the amounts due at the year end.
Employment of disabled persons It is the Group’s policy that disabled people, whether registered or not, should receive full and fairconsideration for all job vacancies for which they are suitable applicants. Employees who become disabled during their career will beretained in employment wherever possible and will be given support with rehabilitation and retraining. The Group is prepared to modifyprocedures or equipment, wherever this is practicable, so that full use may be made of an individual’s abilities.
Employees The Group endeavours to keep all employees fully informed about its plans and progress, including the developments in themarket in which Axon operates. The Group uses regular meetings, formal presentations, electronic communication and electronic staffpublications to ensure objectives are understood and met. An opportunity is given at these regular meetings for senior executives to bequestioned by employees about matters of concern to them.
Axon operates clear recruitment and selection procedures and provides further opportunities to employees, through initiatives such astraining and people development, based on an objective assessment of an individual’s needs and abilities, regardless of factors such asgender, race, ethnic origin or disability.
The Group encourages the involvement of employees in its performance through its share option schemes. A summary of such schemes isset out in note 30 to the financial statements.
Political and charitable donations During the year the Group made no political or charitable donations (2006: £nil).
Capital structure The Company has a single class of ordinary shares.
The Articles of Association confer on the Company the right to purchase its own shares.
The directors seek shareholder approval each year to allot unissued shares up to a third of issued share capital. Approval was granted at theAGM to allot shares representing a maximum nominal value of £205,964. The directors also received approval at the AGM to allot newshares up to 5% of those in issue, up to a maximum nominal value of £30,894, without first offering them to existing shareholders.
As set out in note 23 of the accounts, as at 31 December 2007 Employee Benefit Trusts owned 2,939,908 shares in the Group. The Trustdeeds require the trustees to waive the trusts’ rights to any dividends on these shares. No more than 5% of the Company’s issued sharecapital may be held in such trusts without shareholder approval.
20 Axon Group plcAnnual report and accounts 2007
Directors’ report (continued)
Change of control provisions Significant agreements which include change of control provisions that would come into effect in the eventof a takeover of Axon Group include contracts with BP, Birmingham City Council, Transport for London and TXU Energy. In these cases theclients have the right to terminate the contracts within defined periods from the date of notification ranging from 45 days to 12 months.The financial consequences of such termination would depend on the number of consultants working on any such contract at thepoint of termination and whether there were other clients to which they could be deployed at the end of any notice period.
Under provisions of the share purchase agreement relating to the acquisition of Zytalis Inc, earn-out payments are calculated based onthe financial performance of the business acquired. If a change of control occurs prior to 31 December 2009 which has a material adverseimpact on the business, then the earn-out payments will be deemed to be set at the earn-out caps. The maximum value of earn-outpayments that would be subject to these provisions is US $10.4m.
Directors’ responsibilities The directors are responsible for preparing the Annual Report and Group financial statements in accordance withapplicable United Kingdom law and those International Financial Reporting Standards (IFRSs) as adopted by the European Union.
The directors are required to prepare the financial statements for each financial year which present fairly the financial position of the Groupand the Company and the financial performance and cash flows of the Group and the Company for that period. In preparing those Groupfinancial statements the directors are required to:
• select suitable accounting policies in accordance with IAS 8: Accounting Policies and Changes in Accounting Estimates and Errors andthen apply them consistently;
• present information including accounting policies, in a manner that provides relevant, reliable, comparable and understandable information;
• provide additional disclosures when compliance with the specific requirements in IFRSs is insufficient to enable users to understand theimpact of particular transactions, other events and conditions on the Group’s financial position and financial performance; and
• state that the Group and Company has complied with IFRSs, subject to any material departure disclosed and explained in thefinancial statements.
The directors are responsible for keeping proper accounting records which disclose with reasonable accuracy at any time the financialposition of the Group and the Company and enable them to ensure that the Group and the Company financial statements comply withthe Companies Act 1985 and Article 4 of the IAS Regulation. They are also responsible for safeguarding the assets of the Group and theCompany and hence for taking reasonable steps for the prevention and detection of fraud and other irregularities.
Directors’ statement The directors confirm that the accounts on pages 31 to 69 show a true and fair view.
The directors who were members of the Board at the time of approving the directors’ report are listed on pages 16 and 17. Having madeenquiries of fellow directors and of the Company’s auditors, each of the directors confirms that:
• to the best of each of the directors’ knowledge and belief, there is no information relevant to the preparation of their report of which theCompany’s auditors are unaware; and
• each director has taken all the steps a director might reasonably be expected to have taken to be aware of the relevant audit informationand to establish that the Company’s auditors are aware of that information.
Annual General Meeting The 2008 Annual General Meeting of the Company is to be held on Friday, 25 April 2008. The business to beconsidered at the Meeting is set out in the accompanying Notice of Meeting and explanatory notes.
Auditors A resolution for the reappointment of Ernst & Young LLP will be proposed at the forthcoming Annual General Meeting.
By order of the Board
Stephen CardellChief Executive Officer
4 March 2008
21 Axon Group plcAnnual report and accounts 2007
Report on corporate governance
The Combined Code on Corporate Governance The Board fully acknowledges that it has overall responsibility for ensuring the effectivenessand regular review of the Group’s internal control systems, as detailed below. In accordance with the Listing Rules of the UK Listing Authority, thisstatement, together with the remuneration report, set out on pages 25 to 29, explains how Axon has applied The Principles of Good Governanceset out by the Financial Services Authority in Section 1 of The Combined Code on Corporate Governance July 2006 (the “Combined Code”) andreports on the Group’s compliance with the provisions contained in the Code of Best Practice throughout the period under review.
Compliance with the Combined Code The Board is committed to high standards of corporate governance. The Board has complied withthe provisions of the Combined Code throughout the accounting period and to the date of this report, with the following exceptions:
A.2.1 & A.2.2 Mark Hunter took on the role of Chairman and Chief Executive in May 2003. From 6 March 2007, these two roles wereseparated with Stephen Cardell appointed as CEO and Mark Hunter remaining as Executive Chairman. From 1 January 2008, Roy Merrittbecame non-executive Chairman and Mark Hunter left the Board so the Board should be fully compliant in this respect for 2008.
B.2.3 The non-executive directors were present at the meeting to approve the remuneration of the non-executives. The Board will seek toavoid this situation being repeated in future.
For 2008, under C.3.1 Roy Merritt ceased to be Chairman of the Audit committee when be became non-executive Chairman effective 1 January2008. Neither of the other two Audit committee members has recent and relevant financial experience. The Combined Code recommends that theChairman not be a member of the Audit committee. Given that Roy Merritt was an independent director when he joined the Board and that hehas recent relevant financial experience, the Board believes that he should remain an Audit committee member.
The Board of directors The Board of directors comprises a non-executive Chairman, a Chief Executive Officer, a Chief Financial Officer andtwo independent non-executive directors. The profiles of the current directors are set out on pages 16 and 17. The Articles allow there to benot more than eight and not less than two directors.
The non-executive directors contribute a wide range of skills and experience, forming a strong and independent element within the Board.The non-executive directors receive a fixed fee for services rendered, have served for less than nine years and have not been employees ofthe Group at any time. Their opinions carry significant weight in the decision making process, both operational and financial, and they arefree from any business or personal relationships that could interfere with their independent judgement. The non-executive directors ensurethat some meetings are set aside during the year without the executive directors present.
David Oertle is the nominated senior independent non-executive director to whom concerns may be conveyed.
The Board meets at regular intervals throughout the year (eight times in 2007 (2006: eight)) and has reserved for its consideration mattersincluding:
• the responsibility for the overall strategy of the Group;
• acquisitions and divestments;
• significant capital expenditure projects and any major financial proposals;
• assessment of exposure to key business risks;
• environmental issues;
• health and safety; and
• employee matters (including codes of conduct) and key senior appointments.
Appropriate detailed monthly information, both operational and financial, is provided to the Board in a timely manner to enable it todischarge its duties. The Board ensures that all directors receive appropriate training and induction, as required, and that they are ableto take independent professional advice in the furtherance of their duties.
The Board may appoint a director and revoke or terminate the appointment of a director as it thinks fit. Any director so appointed shalloffer himself for reappointment at the first AGM following appointment. All directors submit themselves for re-election at least once everythree years. The shareholders may also remove a director by ordinary resolution.
Financial reporting and KPIs Management reporting packs are prepared monthly both for each regional Board for EMEA, North Americaand Asia-Pacific as well as for the Group main Board. These include information on the historic, budgeted and forecast financialperformance of the business as well as operational data such as utilisation and chargeability.
A budget is agreed by the Board annually and performance against budget is reported monthly.
Management at regional, business unit, indirect department and project levels have on-line access to financial information for their area ofresponsibility derived from the Group’s global SAP systems.
Key performance indicators include revenue growth, gross margins, adjusted operating profit margins and chargeability of consultants.KPI data has been provided in the business and financial reviews.
Chargeability is calculated based on the percentage of time charged to client projects as a proportion of the total non-weekend daysavailable for a period. Adjusted operating profit excludes any costs related to share-based payments and amortisation of intangible assetscreated on acquisitions.
Report on corporate governance (continued)
22 Axon Group plcAnnual report and accounts 2007
Board committees The Company has formally established Audit, Remuneration and Nominations committees. The current membershipof the committees is shown on pages 16 and 17. The terms of reference for each of these committees are publicly available at the Group’sregistered office.
The Audit committee comprises the three non-executive directors and is chaired by Royston Hoggarth with effect from 1 January 2008.Prior to that date it was chaired by Roy Merritt. See the separate audit committee report on page 24 for further details.
The Remuneration committee is chaired by David Oertle and comprises the non-executive directors, including the non-executiveChairman, who was considered to be independent on appointment. The committee meets when necessary during the year to:
• review Remuneration policy and to determine the remuneration packages of the executive directors and key senior management; and
• approve proposals for the granting of share options to employees of the Group.
The minutes of the Remuneration committee are circulated to, and reviewed by, the Board. The remuneration report is set out onpages 25 to 29.
The Nominations committee is chaired by Royston Hoggarth and comprises the three non-executive directors. The committee meetswhen necessary during the year to formally review the performance of the Board as well as the balance of skills. A formal evaluation of theperformance of the Board was introduced in 2005 and is updated annually. The performance evaluation is an internal process where eachdirector completes a detailed questionnaire ranking performance. The process covers the effectiveness and constitution of each of thecommittees and the directors, the performance of the Chairman, the objectives, strategy, internal and external relationships, managementinformation and governance. The committee reviews actions from this review. Two new appointments to the Board have been made sinceits establishment.
Use of external recruitment consultants and advertising are considered on a case by case basis. In the case of the appointment of RoyMerritt as Chairman, no external search firm was involved. Roy was already well known to the Board through his role as Audit committeeChairman and non-executive director.
The Business Unit Board is chaired by the CEO, and comprises the CFO and four senior managers. The committee meets monthly toconsider financial performance, review of budgets and forecasts, capital expenditure proposals and any management issues. Significantmatters arising from such meetings are reported to the Board and senior managers are invited to present at Board meetings on financial andoperating performance, new initiatives, business and employee development and planning matters, as appropriate.
A schedule of 2007 Board, Audit, Remuneration and Nominations committee meetings is included below, detailing attendance byindividual director.
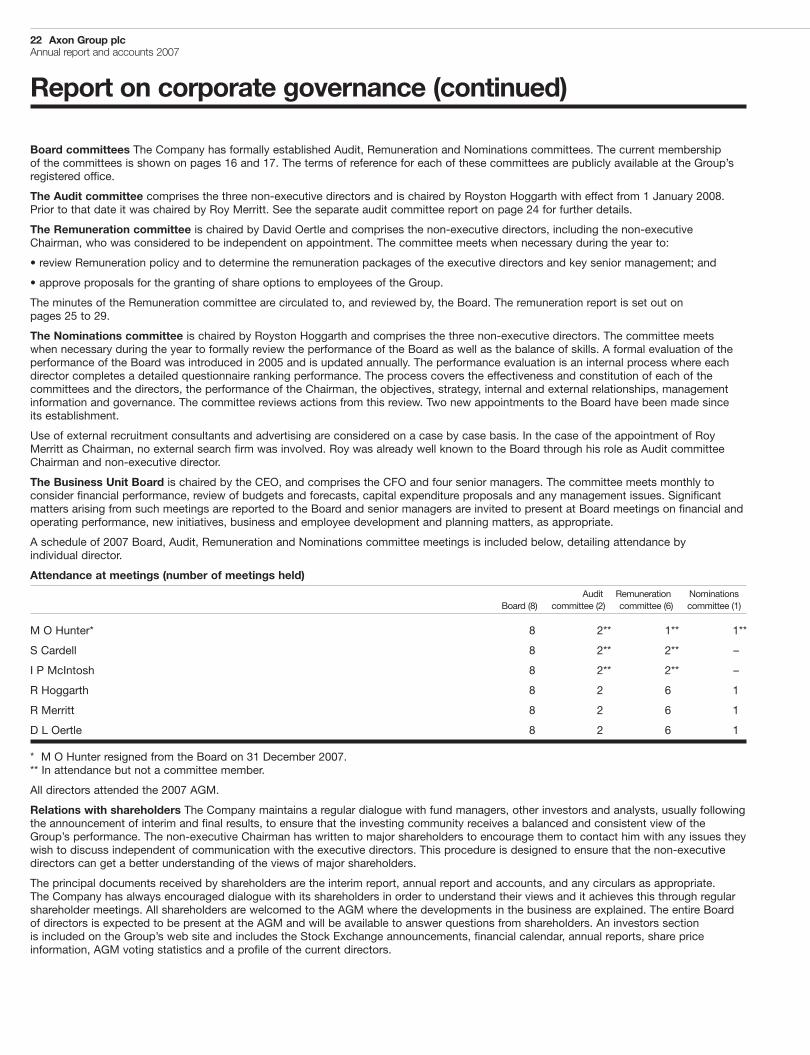
Attendance at meetings (number of meetings held)
Audit Remuneration NominationsBoard (8) committee (2) committee (6) committee (1)
M O Hunter* 8 2** 1** 1**
S Cardell 8 2** 2** –
I P McIntosh 8 2** 2** –
R Hoggarth 8 2 6 1
R Merritt 8 2 6 1
D L Oertle 8 2 6 1
* M O Hunter resigned from the Board on 31 December 2007.** In attendance but not a committee member.
All directors attended the 2007 AGM.
Relations with shareholders The Company maintains a regular dialogue with fund managers, other investors and analysts, usually followingthe announcement of interim and final results, to ensure that the investing community receives a balanced and consistent view of theGroup’s performance. The non-executive Chairman has written to major shareholders to encourage them to contact him with any issues theywish to discuss independent of communication with the executive directors. This procedure is designed to ensure that the non-executivedirectors can get a better understanding of the views of major shareholders.
The principal documents received by shareholders are the interim report, annual report and accounts, and any circulars as appropriate.The Company has always encouraged dialogue with its shareholders in order to understand their views and it achieves this through regularshareholder meetings. All shareholders are welcomed to the AGM where the developments in the business are explained. The entire Boardof directors is expected to be present at the AGM and will be available to answer questions from shareholders. An investors sectionis included on the Group’s web site and includes the Stock Exchange announcements, financial calendar, annual reports, share priceinformation, AGM voting statistics and a profile of the current directors.
23 Axon Group plcAnnual report and accounts 2007
Going concern After making enquiries, the directors have formed a judgement, at the time of approving the financial statements, that thereis a reasonable expectation that the Group and Company have adequate resources to continue in operational existence for the foreseeablefuture. For this reason the directors continue to adopt the going concern basis in preparing the financial statements.
Environmental, Social and Governance (“ESG”) matters The Board recognises the obligations that the Group has towards those withwhom it has dealings, the environment and the responsibility for ethical conduct and that such factors are increasingly relevant to financialperformance in the longer term. The Board regularly reviews the significance of social, environmental and ethical matters to the business ofthe Group and the Company. Roy Merritt is the main Board member responsible for ESG issues. The Board does not consider there to bemajor risk issues facing the business from an ESG perspective in the short-term.
Social matters Axon is a socially responsible employer and various initiatives are in place to ensure that staff are treated fairly as they arecritical to its business success. The Group is also committed to protecting and enhancing the health and safety of its employees.
Communication is critical to employee relations and the Group uses quarterly staff forums and monthly electronic newsletters toensure all employees are fully informed about its plans and progress, including the developments in the market in which Axonoperates. Quarterly offsite meetings are held for senior management and directors to review strategy implementation and keybusiness opportunities. An electronic forum is also available to employees who wish to ask directors anonymous questions.
Annual performance reviews are conducted for employees and individual training and development needs are identified to ensure staffreceive supplementary training.
The Group encourages the involvement of employees in its performance through its share option schemes. A summary of such schemesis set out in note 30 to the financial statements.
During 2004 the Group introduced a flexible benefits scheme in the UK which allows eligible employees the ability to exercise choice overcertain elements of their reward package.
It is the Group’s policy that disabled people, whether registered or not, should receive full and fair consideration for all job vacancies forwhich they are suitable applicants. Employees who become disabled during their career will be retained in employment wherever possibleand will be given support with rehabilitation and retraining. The Group is prepared to modify procedures or equipment, wherever this ispracticable, so that full use may be made of an individual’s abilities.
Environmental matters Being primarily office based, and given the nature of our business, Axon does not have a material impact on theenvironment. However, the Group and its employees try to ensure that both services and products are procured in an environmentallyfriendly manner and that waste materials are disposed of appropriately, including recycling where economically possible. The Group hasexpanded the types of recycling that it undertakes to ensure that the amount of office waste is minimised.
The Group makes extensive use of electronic communications to reduce the amount of printing waste produced. This is supported bythe use of a centralised workflow and project management tool which both clients and employees have access to. Energy consumptionis also minimised with boilers and chillers switched off at times when staff are not in the building.
Where appropriate, electronic communication methods such as email, telephone and video conference facilities are used to avoidnon-essential travel.
The Group does not offer a company car scheme to employees and encourages its employees to travel to work using public transport.
ISO 14001 is the international standard for Environmental Management Systems. I am pleased to announce that the UK operationssuccessfully secured third party certification from SGS Group, the world’s leading inspection, verification, testing and certification company,of compliance with this standard in December 2007.
Ethical conduct The Board is committed to uphold ethical conduct throughout the Group and has in place a confidential whistle blowingpolicy to give the opportunity for any staff to report matters directly to Roy Merritt.
Health and safety Axon operates a formal Health and Safety policy, which is regularly monitored and reviewed by the Board. Under thepolicy significant incidents are reported without delay to the Board. No such incidents occurred in 2007.
Royston HoggarthChairman, Audit committee
4 March 2008
24 Axon Group plcAnnual report and accounts 2007
Audit committee reportFor the year ended 31 December 2007
The Audit committee comprises the two independent non-executive directors and the non-executive Chairman and is chaired by RoystonHoggarth. The executive directors may attend meetings of the committee by invitation and the committee meets with the external auditorswithout the executive directors or managers present. The Audit committee meets at least twice during the year and has formal agendaswhich cover all areas of responsibilities. Its terms of reference are:
• to monitor the effectiveness of the Group’s internal controls;
• to review the scope of the external audit; and
• to review the interim and annual financial statements, focusing particular attention on accounting policies and financial reportingcompliance.
It meets with the external auditors to review their plan for the audit, to discuss any matters arising from their audit visits and any reports thatthey may produce. In addition, the auditors have direct access to the committee should they need to raise any concerns. The committeealso reviews the level and type of services provided to the Group by the auditors, monitors their independence and objectivity as well as thescope and results of the audit. The Chairman of the Audit committee reports to the Board on the progress of the committee meetings andminutes are circulated to and reviewed by the Board.
The Audit committee receives reports twice a year from the external auditors on key matters which affect the interim and full year financialstatements. It reviews the process for monitoring the Group’s effectiveness of internal controls at least every six months. The Auditcommittee has again considered the need for a separate internal audit function and has decided that, due to the Company’s size, one isnot required at present, but will continue to review the requirement annually.
The Board regularly assesses the independence of its external auditors, Ernst & Young LLP, by reviewing the type of non-audit workundertaken. Having considered the services provided by its auditors, Ernst & Young LLP, the Board believe that they have maintainedan appropriate level of independence during 2007. The independence of Ernst & Young LLP will continue to be monitored regularly.
Internal control The Board is responsible for the effectiveness of the Group’s system of internal controls and has established a continuousprocess for identifying, evaluating and managing significant risks faced by the Group. Key business risks are reviewed monthly by theBoard, with formal reviews of the full internal control environment performed annually. Risks facing the Group can be categorised into fivecategories: business risks, operational risks, accounting and compliance risks, technology risks and risks associated with mergers andacquisitions. Where areas of improvement are brought to the committee’s attention, steps are taken to embed internal control and riskmanagement into the operations of the business. The Board regularly reviews the process, which has been in place throughout the year andup to the date of approval of this report, and which is in accordance with Internal Control: Guidance for Directors on the Combined Code,published in July 2006. Such systems of internal control are designed to manage rather than eliminate the risks of failure to meet businessobjectives, providing a reasonable but not an absolute assurance against material loss or misstatement.
Group objectives are captured in regular reviews of corporate strategy carried out by the executive directors with the involvement ofkey senior managers and reported to the Board. The reviews of corporate strategy form the basis for the establishment of the businessobjectives of the Group, which, in turn, are reflected fully in the business strategies, and financial objectives of the senior managers andtheir teams.
Key policies, processes and control procedures are communicated throughout the Group. Non-compliance is reviewed and any areas ofweakness identified are addressed and promptly reported to the Board. Continuing actions are taken throughout the year to embed riskmanagement and internal control into the day-to-day operations of the Group.
It is Axon’s policy continually to strengthen the effectiveness of the system of internal controls by recruiting, developing and managingemployees of the highest calibre and matching their skills to the appropriate disciplines. A Chief Financial Officer joined the Group andwas appointed to the Board in November 2006.
In relation to potential acquisitions, external advisers, together with senior management within the Group, are appointed under clearlydefined scopes to carry out commercial, financial and legal due diligence. The Board is kept fully up to date with any issues arising duringsuch due diligence.
Royston HoggarthChairman, Audit committee
4 March 2008
25 Axon Group plcAnnual report and accounts 2007
Remuneration reportFor the year ended 31 December 2007
Unaudited information This report has been prepared in accordance with the Directors’ Remuneration Report Regulations 2002. The reportalso meets the relevant requirements of the Listing Rules of the Financial Services Authority and describes how the Board has applied thePrinciples of Good Governance relating to directors’ remuneration. As required by the Regulations, a resolution to approve the report will beproposed at the Annual General Meeting of the Company to which the financial statements will be presented.
Remuneration committee’s objectives The terms of reference of the Remuneration committee are:
• to agree a set of policies within which each executive director’s and senior manager’s remuneration package is agreed; and
• to assist the Board in wider aspects of remuneration policy, such as the granting of share-based incentives.
The Remuneration committee is also responsible for setting the Company Chairman’s pay and conditions (with the Chairman absent fromsuch discussions).
Remuneration policy From the establishment of Axon, the Group’s policy has been to attract, retain and motivate the best people for eacharea of the business and to align their objectives to Group performance in order to deliver and grow value to shareholders.
The Remuneration committee objectively compares the remuneration packages of an executive with that of a similar executive in the sameindustry sector and to those in other appropriate companies based on size, complexity of industry and geographical mix. Historically, theRemuneration committee has not commissioned reports specific to Axon from independent consultants but has instead reviewedindependent market research including trends in competitors and other appropriate companies’ remuneration policies. However, since theyear end, the Remuneration committee has appointed New Bridge Street Consultants LLP to advise on the remuneration policy and toundertake a review and report to the Committee on senior executive remuneration during 2008, with particular reference to the structure offuture equity incentives. The Group will engage with major shareholders and the principal shareholder representative bodies as appropriate.No executive director plays a part in the discussion of his or her own remuneration.
In setting remuneration packages for executive directors, the Remuneration committee considers how these compare with remuneration foremployees more generally. There are no pension arrangements or equity schemes in place that are designed only for executive directors.
The Remuneration committee has discretion to consider corporate performance on environmental, social and governance (“ESG”) issueswhen setting the remuneration of executive directors. The committee does not believe that ESG risks are inadvertently raised by theincentive structures currently in place.
Executive directors The Remuneration packages of executives will continue to comprise an annual base salary, cash bonus andparticipation in long-term incentive schemes. No other annual employment-related benefits are provided since the Remuneration committeebelieves that the emphasis should be on reward for Company performance. Overall performance targets relating to the cash bonus planand to the executive share option schemes are, in the opinion of the Remuneration committee, challenging. Bonuses based on Groupperformance targets form a substantial proportion (up to 60%) of total remuneration calculated on overall performance targets. The rewardsearned by the executive directors in 2007 have reflected the results of the Group.
Base salary The base salary of executive directors will be determined by the Remuneration committee at the start of each year havingregard to personal and Group performance, competitive market practice and pay levels more broadly within the Group.
Historically, Mark Hunter and Stephen Cardell have received significantly lower base salaries than similar executives in comparablecompanies. After a review of comparable companies in December 2007, the committee has decided the remuneration of the Chief ExecutiveOfficer should move towards mid-market levels.
For 2008, base salaries for Stephen Cardell and Iain McIntosh were increased to £350,000 and £195,000 respectively. The Remunerationcommittee believes these salary levels are now in line with survey data for larger UK FTSE Small Cap companies allowing for the absence ofbenefits and pension provision within these executives’ packages.
The Company reimburses the amount by which Stephen Cardell is impacted by incremental US taxes payable on his remuneration over andabove those payable in the UK.
Cash bonus The Remuneration committee sets the objectives that must be met if a cash bonus is to be paid. Cash bonuses for executivedirectors are based entirely on the financial performance of the Group and the Remuneration committee agrees a cap. For 2008 the caps areset up to a maximum of 100% and 80% of base salary for the Chief Executive Officer and Chief Financial Officer respectively, which theRemuneration committee believes to be in line with comparable sized UK listed companies.
The financial performance measure for executive directors in 2007 was year-on-year growth in revenue and adjusted profit before tax(“PBT”). These measures have been chosen as the best measures of short-term operational financial performance. Maximum bonuses arepayable in respect of 2007 as significant year-on-year revenue and adjusted PBT growth in excess of targets was achieved. Revenue andadjusted PBT growth year-on-year have been selected by the Remuneration committee as the appropriate performance measures for 2008for executive directors. The Group does not publish a profit forecast for 2008 and bonus targets cannot be disclosed prior to 31 December2008 due to commercial sensitivity. Consistent with previous financial years, the Remuneration committee has set significant year-on-yeargrowth targets which will have to be achieved for cash bonuses to be payable. Any bonuses paid by the Group are non-pensionable.
Long-term incentives The Company operates the Axon Group plc Performance Share Plan as the principal long-term incentivearrangement for executive directors, under which conditional awards are granted.
Awards granted in 2007 will vest subject to the achievement of real growth in earnings per share of 16% over a three year performanceperiod. There is no provision for retesting of this performance condition. At the time of award, the Remuneration committee believed that thetarget was sufficiently challenging in the prevailing market conditions and when compared to other companies in the Company’s sector andthat a single target was appropriate to encourage executives to exceed this level of performance.
Remuneration report (continued)
26 Axon Group plcAnnual report and accounts 2007
The operation of the Performance Share Plan will be reviewed by the Committee during the year with the assistance of its independentadvisers.
The details of the directors’ holdings are listed on pages 28 and 29 of this report. Full details of the other long-term incentive schemesoperated by the Company (in a number of which executive directors have participated in past years), including the performance conditions,are set out in note 30 to the financial statements
Pensions The Group does not contribute to any pension schemes on behalf of executive directors except for payments to the UK GroupPersonal Pension Plan made under a defined contribution salary sacrifice scheme whereby employees may elect to forgo part of their basicpay in return for pension payments made by the Group. This provides for the employee to receive the benefit of any reduction to theCompany’s National Insurance liability as a result of electing to make a pension payment. Iain McIntosh was a member of the plan in 2006and 2007 on the same basis as that available to other UK employees.
External directorships The Remuneration committee has discretion to approve whether an executive director may accept externalappointments. Stephen Cardell holds one non-executive directorship, for which he receives no remuneration, which was approved by theRemuneration committee on 23 February 2005. No other executive director currently holds any non-executive directorships.
Chairman and non-executive directors The Board determines the remuneration of non-executive directors. Their remuneration is notpensionable and they are not eligible for performance-related remuneration by way of a cash bonus or participation in any share optionscheme. Remuneration for the non-executive directors excluding the Chairman has been set at £35,000 effective 1 January 2008, with anadditional £5,000 for acting as Chairman of either the Audit or Remuneration committees. These fee levels have been set to reflect the timecommitment and responsibility of each role and are considered to be in line with levels at comparable UK listed companies.
Reflecting his appointment as non-executive Chairman from 1 January 2008, Roy Merritt’s remuneration was increased to £75,000 per annumby the Remuneration committee.
Service contracts Set out below are details of the contractual arrangements in respect of current directors of the Company:
CompensationDate of contract Notice period payable*
S Cardell 6 March 2007 12 Months Nil
D L Oertle 28 April 2000 3 Months Nil
R Merritt 1 January 2008 3 Months Nil
R Hoggarth 3 June 2006 3 Months Nil
I P McIntosh 6 November 2007 12 Months Nil
*There are no specific provisions in any of the service contracts for compensation to be paid in the event of early termination.
Directors’ contracts do not contain specific end dates, but are subject to the notice periods set out above. Contracts are available forinspection at the Group’s registered office.
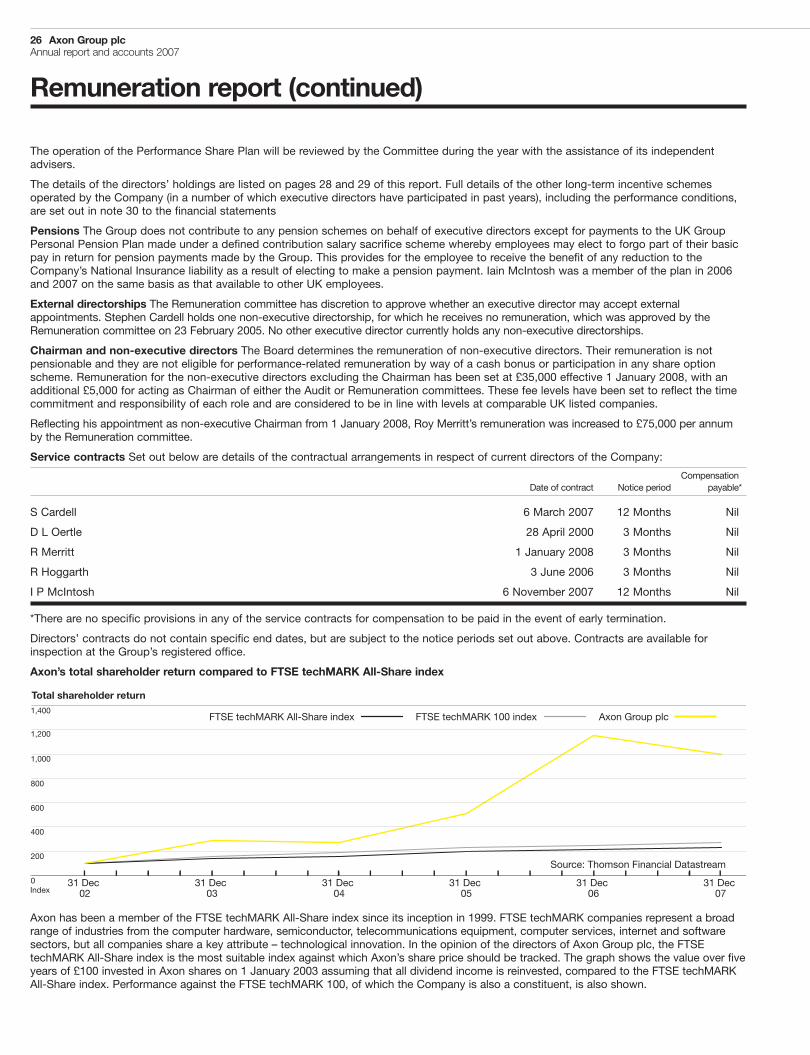
Axon’s total shareholder return compared to FTSE techMARK All-Share index
Axon has been a member of the FTSE techMARK All-Share index since its inception in 1999. FTSE techMARK companies represent a broadrange of industries from the computer hardware, semiconductor, telecommunications equipment, computer services, internet and softwaresectors, but all companies share a key attribute – technological innovation. In the opinion of the directors of Axon Group plc, the FTSEtechMARK All-Share index is the most suitable index against which Axon’s share price should be tracked. The graph shows the value over fiveyears of £100 invested in Axon shares on 1 January 2003 assuming that all dividend income is reinvested, compared to the FTSE techMARKAll-Share index. Performance against the FTSE techMARK 100, of which the Company is also a constituent, is also shown.
1,400
1,200
1,000
800
600
400
200
0
Total shareholder return
31 Dec02
31 Dec03
31 Dec04
31 Dec05
31 Dec 07
31 Dec 06
FTSE techMARK 100 indexFTSE techMARK All-Share index Axon Group plc
Source: Thomson Financial Datastream
Index
27 Axon Group plcAnnual report and accounts 2007
Audited information
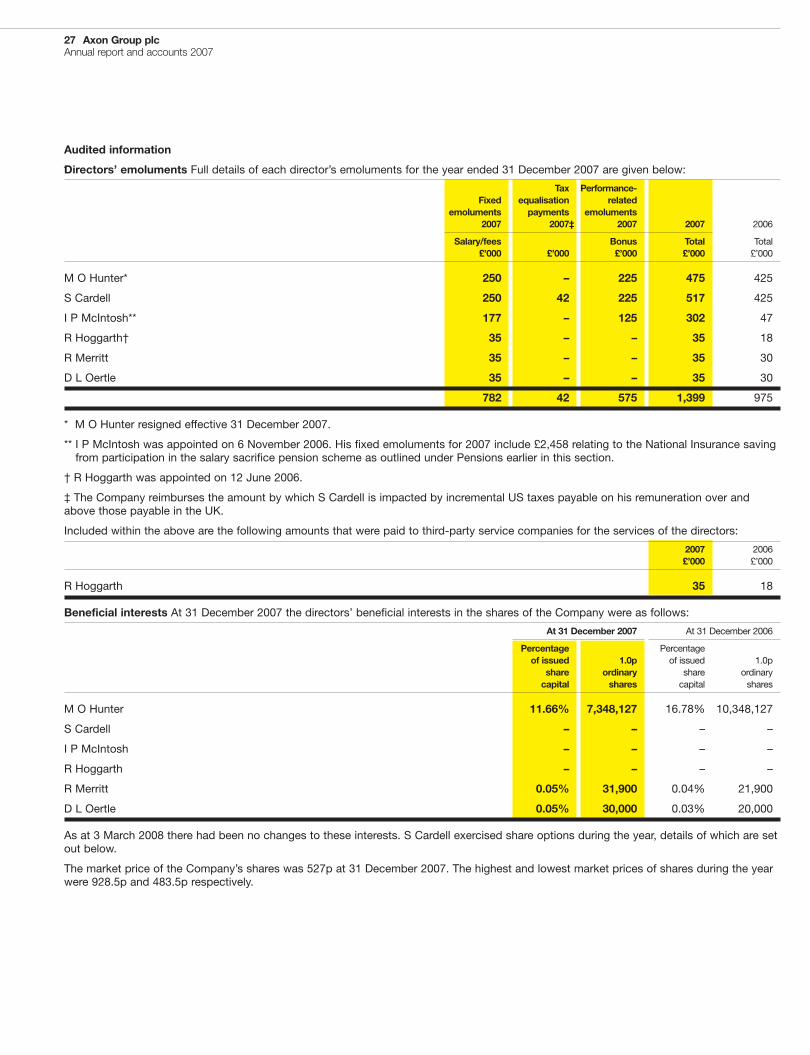
Directors’ emoluments Full details of each director’s emoluments for the year ended 31 December 2007 are given below:ˆ
Tax Performance-Fixed equalisation related
emoluments payments emoluments2007 2007‡ 2007 2007 2006
Salary/fees Bonus Total Total£’000 £’000 £’000 £’000 £’000
M O Hunter* 250 – 225 475 425
S Cardell 250 42 225 517 425
I P McIntosh** 177 – 125 302 47
R Hoggarth† 35 – – 35 18
R Merritt 35 – – 35 30
D L Oertle 35 – – 35 30
782 42 575 1,399 975
* M O Hunter resigned effective 31 December 2007.
** I P McIntosh was appointed on 6 November 2006. His fixed emoluments for 2007 include £2,458 relating to the National Insurance savingfrom participation in the salary sacrifice pension scheme as outlined under Pensions earlier in this section.
† R Hoggarth was appointed on 12 June 2006.
‡ The Company reimburses the amount by which S Cardell is impacted by incremental US taxes payable on his remuneration over andabove those payable in the UK.
Included within the above are the following amounts that were paid to third-party service companies for the services of the directors:
2007 2006£’000 £’000
R Hoggarth 35 18
Beneficial interests At 31 December 2007 the directors’ beneficial interests in the shares of the Company were as follows:
At 31 December 2007 At 31 December 2006
Percentage Percentageof issued 1.0p of issued 1.0pshare ordinary share ordinarycapital shares capital shares
M O Hunter 11.66% 7,348,127 16.78% 10,348,127
S Cardell – – – –
I P McIntosh – – – –
R Hoggarth – – – –
R Merritt 0.05% 31,900 0.04% 21,900
D L Oertle 0.05% 30,000 0.03% 20,000
As at 3 March 2008 there had been no changes to these interests. S Cardell exercised share options during the year, details of which are setout below.
The market price of the Company’s shares was 527p at 31 December 2007. The highest and lowest market prices of shares during the yearwere 928.5p and 483.5p respectively.
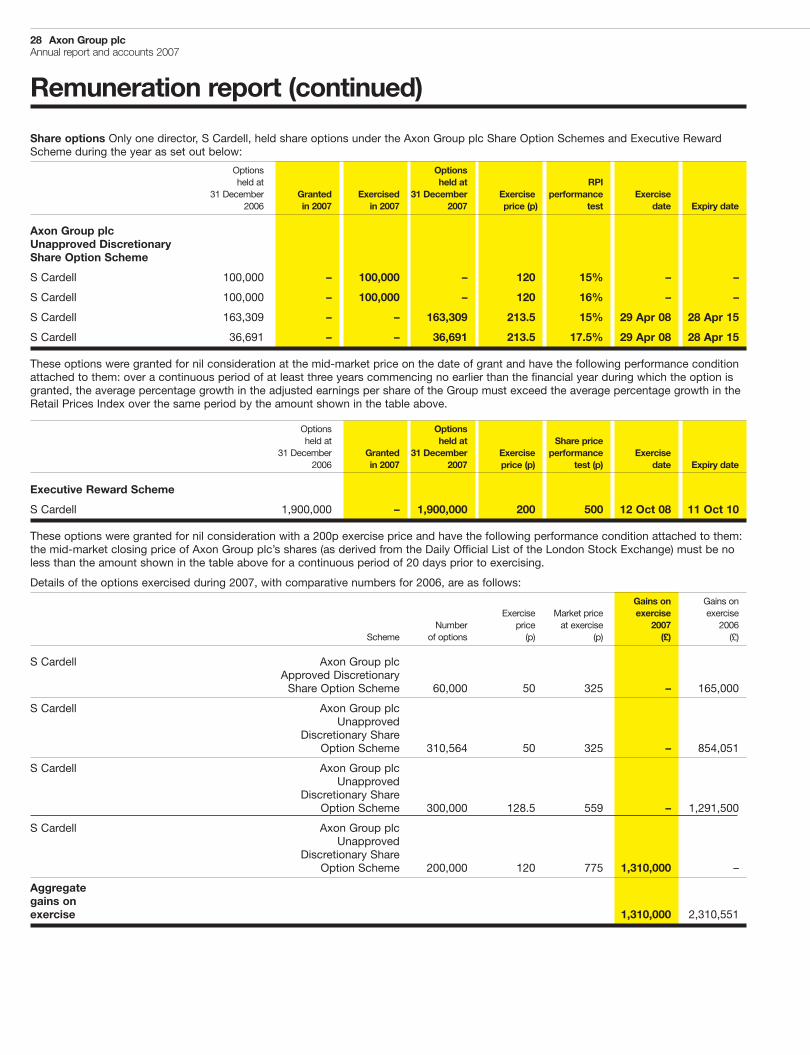
28 Axon Group plcAnnual report and accounts 2007
Share options Only one director, S Cardell, held share options under the Axon Group plc Share Option Schemes and Executive RewardScheme during the year as set out below:
Options Optionsheld at held at RPI
31 December Granted Exercised 31 December Exercise performance Exercise2006 in 2007 in 2007 2007 price (p) test date Expiry date
Axon Group plcUnapproved DiscretionaryShare Option Scheme
S Cardell 100,000 – 100,000 – 120 15% – –
S Cardell 100,000 – 100,000 – 120 16% – –
S Cardell 163,309 – – 163,309 213.5 15% 29 Apr 08 28 Apr 15
S Cardell 36,691 – – 36,691 213.5 17.5% 29 Apr 08 28 Apr 15
These options were granted for nil consideration at the mid-market price on the date of grant and have the following performance conditionattached to them: over a continuous period of at least three years commencing no earlier than the financial year during which the option isgranted, the average percentage growth in the adjusted earnings per share of the Group must exceed the average percentage growth in theRetail Prices Index over the same period by the amount shown in the table above.
Options Optionsheld at held at Share price
31 December Granted 31 December Exercise performance Exercise2006 in 2007 2007 price (p) test (p) date Expiry date
Executive Reward Scheme
S Cardell 1,900,000 – 1,900,000 200 500 12 Oct 08 11 Oct 10
These options were granted for nil consideration with a 200p exercise price and have the following performance condition attached to them:the mid-market closing price of Axon Group plc’s shares (as derived from the Daily Official List of the London Stock Exchange) must be noless than the amount shown in the table above for a continuous period of 20 days prior to exercising.
Details of the options exercised during 2007, with comparative numbers for 2006, are as follows:
Gains on Gains onExercise Market price exercise exercise
Number price at exercise 2007 2006Scheme of options (p) (p) (£) (£)
S Cardell Axon Group plcApproved DiscretionaryShare Option Scheme 60,000 50 325 – 165,000
S Cardell Axon Group plcUnapproved
Discretionary ShareOption Scheme 310,564 50 325 – 854,051
S Cardell Axon Group plcUnapproved
Discretionary ShareOption Scheme 300,000 128.5 559 – 1,291,500
S Cardell Axon Group plcUnapproved
Discretionary ShareOption Scheme 200,000 120 775 1,310,000 –
Aggregategains onexercise 1,310,000 2,310,551
Remuneration report (continued)
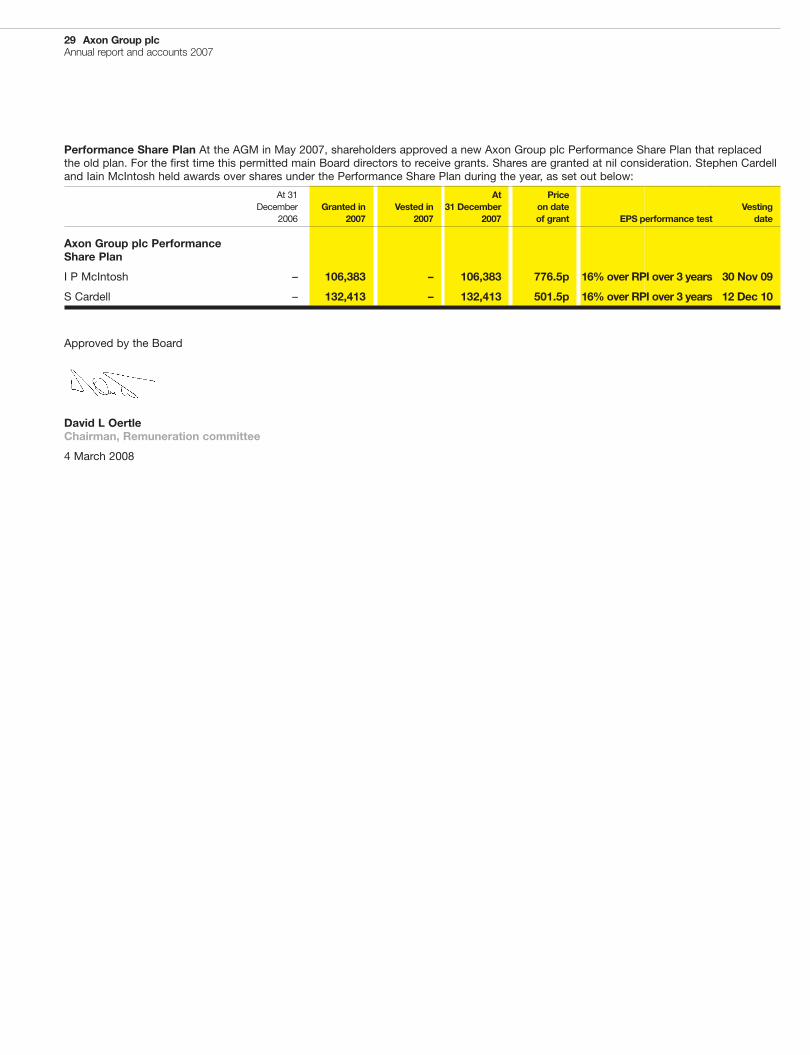
29 Axon Group plcAnnual report and accounts 2007
Performance Share Plan At the AGM in May 2007, shareholders approved a new Axon Group plc Performance Share Plan that replacedthe old plan. For the first time this permitted main Board directors to receive grants. Shares are granted at nil consideration. Stephen Cardelland Iain McIntosh held awards over shares under the Performance Share Plan during the year, as set out below:
At 31 At PriceDecember Granted in Vested in 31 December on date Vesting
2006 2007 2007 2007 of grant EPS performance test date
Axon Group plc PerformanceShare Plan
I P McIntosh – 106,383 – 106,383 776.5p 16% over RPI over 3 years 30 Nov 09
S Cardell – 132,413 – 132,413 501.5p 16% over RPI over 3 years 12 Dec 10
Approved by the Board
David L OertleChairman, Remuneration committee
4 March 2008
Independent auditors’ reportTo the members of Axon Group plc
We have audited the Group and parent Company financial statements (the “financial statements”) of Axon Group plc for the year ended31 December 2007 which comprise the Group income statement, the Group and parent Company balance sheets, the Group and parentCompany cash flow statements, the Group and parent Company statement of recognised income and expenses and the related notes 1 to34. These financial statements have been prepared under the accounting policies set out therein. We have also audited the information inthe remuneration report that is described as having been audited.
This report is made solely to the Company’s members, as a body, in accordance with Section 235 of the Companies Act 1985. Our auditwork has been undertaken so that we might state to the Company’s members those matters we are required to state to them in an auditors’report and for no other purpose. To the fullest extent permitted by law, we do not accept or assume responsibility to anyone other than theCompany and the Company's members as a body, for our audit work, for this report, or for the opinions we have formed.
Respective responsibilities of directors and auditors The directors’ responsibilities for preparing the annual report, the remunerationreport and the financial statements in accordance with applicable United Kingdom law and International Financial Reporting Standards(IFRSs) as adopted by the European Union are set out in the Statement of Directors’ Responsibilities.
Our responsibility is to audit the financial statements and the part of the remuneration report to be audited in accordance with relevant legaland regulatory requirements and International Standards on Auditing (UK and Ireland).
We report to you our opinion as to whether the financial statements give a true and fair view and whether the financial statements and thepart of the remuneration report to be audited have been properly prepared in accordance with the Companies Act 1985 and,as regards the Group financial information, Article 4 of the IAS Regulation. We also report to you whether in our opinion the informationgiven in the directors’ report is consistent with the financial statements. The information given in the directors’ report includes that specificinformation presented in the business and financial reviews that is cross referred from the business review section of the directors’ report.
In addition we report to you if, in our opinion, the Company has not kept proper accounting records, if we have not received all theinformation and explanations we require for our audit, or if information specified by law regarding directors’ remuneration and othertransactions are not disclosed.
We review whether the corporate governance statement reflects the Company’s compliance with the nine provisions of the 2006 CombinedCode specified for our review by the Listing Rules of the Financial Services Authority, and we report if it does not. We are not required toconsider whether the Board’s statements on internal control cover all risks and controls, or form an opinion on the effectiveness of theGroup’s corporate governance procedures or its risk and control procedures.
We read other information contained in the annual report and consider whether it is consistent with the audited financial statements.The other information comprises only the directors’ report, the unaudited part of the remuneration report, the Chairman’s statement, thebusiness and financial reviews and the corporate governance statement. We consider the implications for our report if we become awareof any apparent misstatements or material inconsistencies with the financial statements. Our responsibilities do not extend to anyother information.
Basis of audit opinion We conducted our audit in accordance with International Standards on Auditing (UK and Ireland) issued by theAuditing Practices Board. An audit includes examination, on a test basis, of evidence relevant to the amounts and disclosures in the financialstatements and the part of the remuneration report to be audited. It also includes an assessment of the significant estimates and judgementsmade by the directors in the preparation of the financial statements, and of whether the accounting policies are appropriate to the Group’sand Company’s circumstances, consistently applied and adequately disclosed.
We planned and performed our audit so as to obtain all the information and explanations which we considered necessary in order to provideus with sufficient evidence to give reasonable assurance that the financial statements and the part of the remuneration report to be auditedare free from material misstatement, whether caused by fraud or other irregularity or error. In forming our opinion we also evaluated theoverall adequacy of the presentation of information in the financial statements and the part of the remuneration report to be audited.
Opinion In our opinion:
• the Group financial statements give a true and fair view, in accordance with IFRSs as adopted by the European Union, of the state of theGroup’s affairs as at 31 December 2007 and of its profit for the year then ended;
• the parent Company financial statements give a true and fair view, in accordance with IFRSs as adopted by the European Union as appliedin accordance with the provisions of the Companies Act 1985, of the state of the parent Company’s affairs as at 31 December 2007;
• the financial statements and the part of the remuneration report to be audited have been properly prepared in accordance with theCompanies Act 1985 and, as regards the Group financial statements, Article 4 of the IAS Regulation; and
• the information given in the directors’ report is consistent with the financial statements.
Ernst & Young LLPRegistered Auditor, London
4 March 2008
1. The maintenance and integrity of the Axon Group plc web site is the responsibility of the directors; the work carried out by the auditors does not involve consideration of thesematters and, accordingly, the auditors accept no responsibility for any changes that may have occurred to the financial statements since they were initially presented on thewebsite.
30 Axon Group plcAnnual report and accounts 2007
12246 Axon R&A pp18_pp34:R&A2006 27/3/08 10:01 Page 30
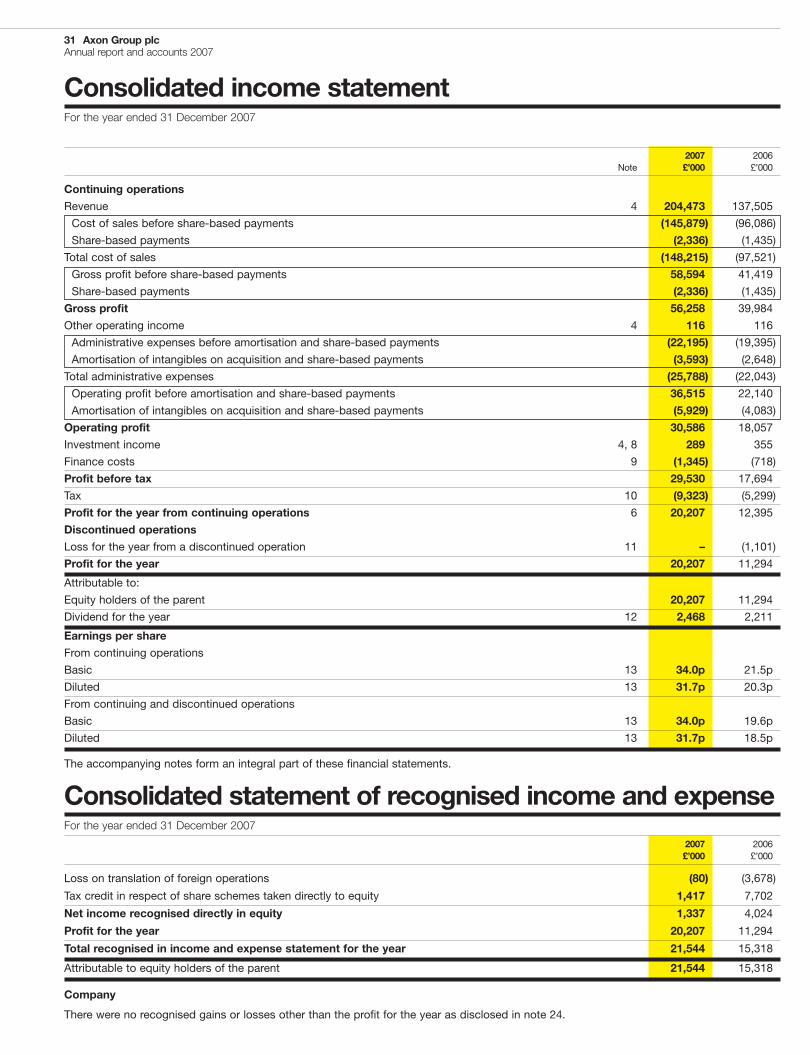
31 Axon Group plcAnnual report and accounts 2007
Consolidated income statementFor the year ended 31 December 2007
2007 2006Note £’000 £’000
Continuing operations
Revenue 4 204,473 137,505
Cost of sales before share-based payments (145,879) (96,086)
Share-based payments (2,336) (1,435)
Total cost of sales (148,215) (97,521)
Gross profit before share-based payments 58,594 41,419
Share-based payments (2,336) (1,435)
Gross profit 56,258 39,984
Other operating income 4 116 116
Administrative expenses before amortisation and share-based payments (22,195) (19,395)
Amortisation of intangibles on acquisition and share-based payments (3,593) (2,648)
Total administrative expenses (25,788) (22,043)
Operating profit before amortisation and share-based payments 36,515 22,140
Amortisation of intangibles on acquisition and share-based payments (5,929) (4,083)
Operating profit 30,586 18,057
Investment income 4, 8 289 355
Finance costs 9 (1,345) (718)
Profit before tax 29,530 17,694
Tax 10 (9,323) (5,299)
Profit for the year from continuing operations 6 20,207 12,395
Discontinued operations
Loss for the year from a discontinued operation 11 – (1,101)
Profit for the year 20,207 11,294
Attributable to:
Equity holders of the parent 20,207 11,294
Dividend for the year 12 2,468 2,211
Earnings per share
From continuing operations
Basic 13 34.0p 21.5p
Diluted 13 31.7p 20.3p
From continuing and discontinued operations
Basic 13 34.0p 19.6p
Diluted 13 31.7p 18.5p
The accompanying notes form an integral part of these financial statements.
Consolidated statement of recognised income and expenseFor the year ended 31 December 2007
2007 2006£’000 £’000
Loss on translation of foreign operations (80) (3,678)
Tax credit in respect of share schemes taken directly to equity 1,417 7,702
Net income recognised directly in equity 1,337 4,024
Profit for the year 20,207 11,294
Total recognised in income and expense statement for the year 21,544 15,318
Attributable to equity holders of the parent 21,544 15,318
Company
There were no recognised gains or losses other than the profit for the year as disclosed in note 24.
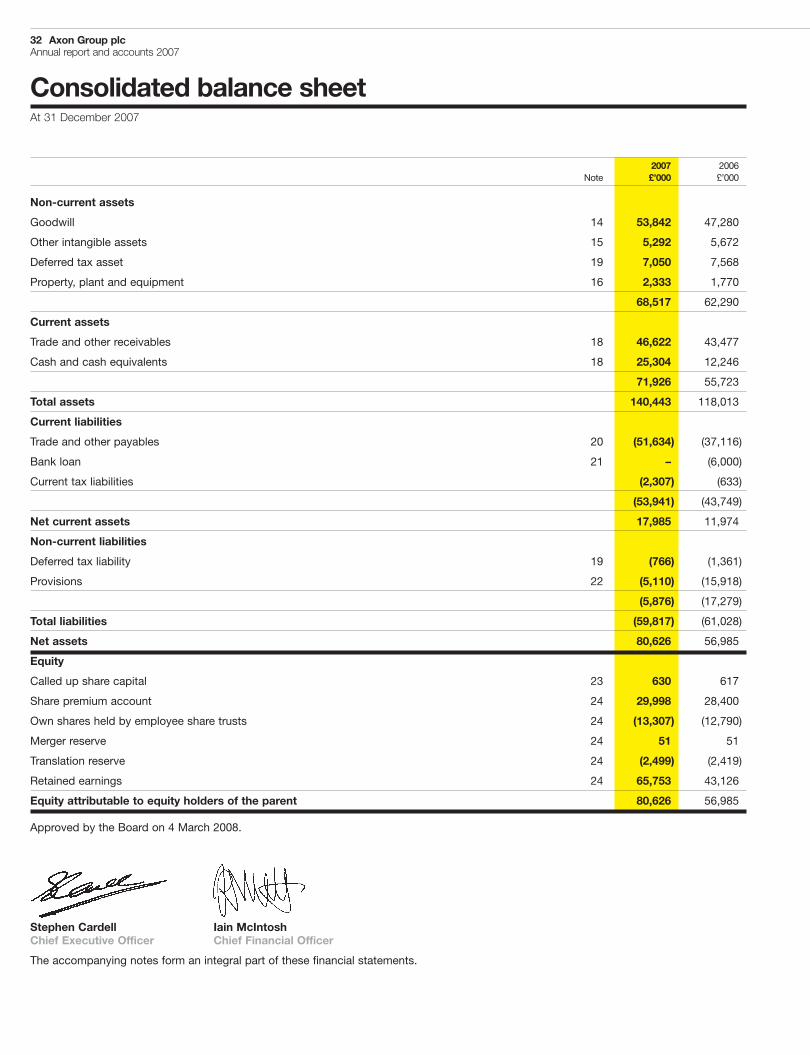
32 Axon Group plcAnnual report and accounts 2007
Consolidated balance sheetAt 31 December 2007
2007 2006Note £’000 £’000
Non-current assets
Goodwill 14 53,842 47,280
Other intangible assets 15 5,292 5,672
Deferred tax asset 19 7,050 7,568
Property, plant and equipment 16 2,333 1,770
68,517 62,290
Current assets
Trade and other receivables 18 46,622 43,477
Cash and cash equivalents 18 25,304 12,246
71,926 55,723
Total assets 140,443 118,013
Current liabilities
Trade and other payables 20 (51,634) (37,116)
Bank loan 21 – (6,000)
Current tax liabilities (2,307) (633)
(53,941) (43,749)
Net current assets 17,985 11,974
Non-current liabilities
Deferred tax liability 19 (766) (1,361)
Provisions 22 (5,110) (15,918)
(5,876) (17,279)
Total liabilities (59,817) (61,028)
Net assets 80,626 56,985
Equity
Called up share capital 23 630 617
Share premium account 24 29,998 28,400
Own shares held by employee share trusts 24 (13,307) (12,790)
Merger reserve 24 51 51
Translation reserve 24 (2,499) (2,419)
Retained earnings 24 65,753 43,126
Equity attributable to equity holders of the parent 80,626 56,985
Approved by the Board on 4 March 2008.
Stephen Cardell Iain McIntoshChief Executive Officer Chief Financial Officer
The accompanying notes form an integral part of these financial statements.
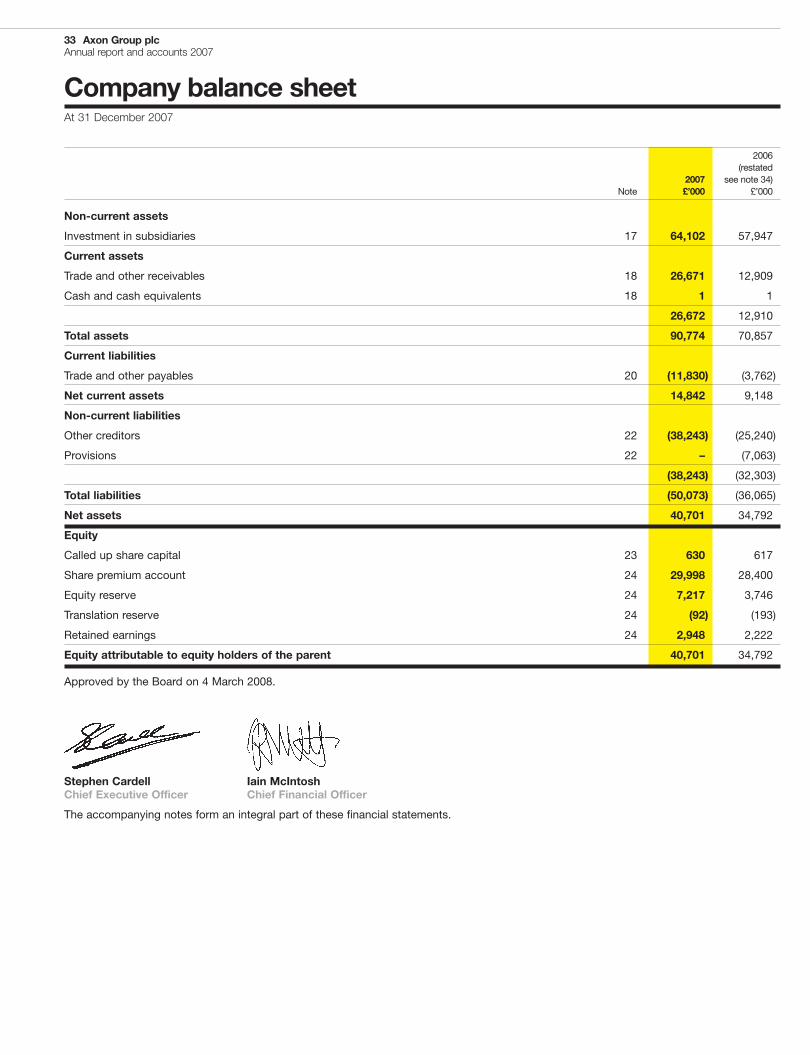
33 Axon Group plcAnnual report and accounts 2007
Company balance sheetAt 31 December 2007
2006(restated
2007 see note 34)Note £’000 £’000
Non-current assets
Investment in subsidiaries 17 64,102 57,947
Current assets
Trade and other receivables 18 26,671 12,909
Cash and cash equivalents 18 1 1
26,672 12,910
Total assets 90,774 70,857
Current liabilities
Trade and other payables 20 (11,830) (3,762)
Net current assets 14,842 9,148
Non-current liabilities
Other creditors 22 (38,243) (25,240)
Provisions 22 – (7,063)
(38,243) (32,303)
Total liabilities (50,073) (36,065)
Net assets 40,701 34,792
Equity
Called up share capital 23 630 617
Share premium account 24 29,998 28,400
Equity reserve 24 7,217 3,746
Translation reserve 24 (92) (193)
Retained earnings 24 2,948 2,222
Equity attributable to equity holders of the parent 40,701 34,792
Approved by the Board on 4 March 2008.
Stephen Cardell Iain McIntoshChief Executive Officer Chief Financial Officer
The accompanying notes form an integral part of these financial statements.
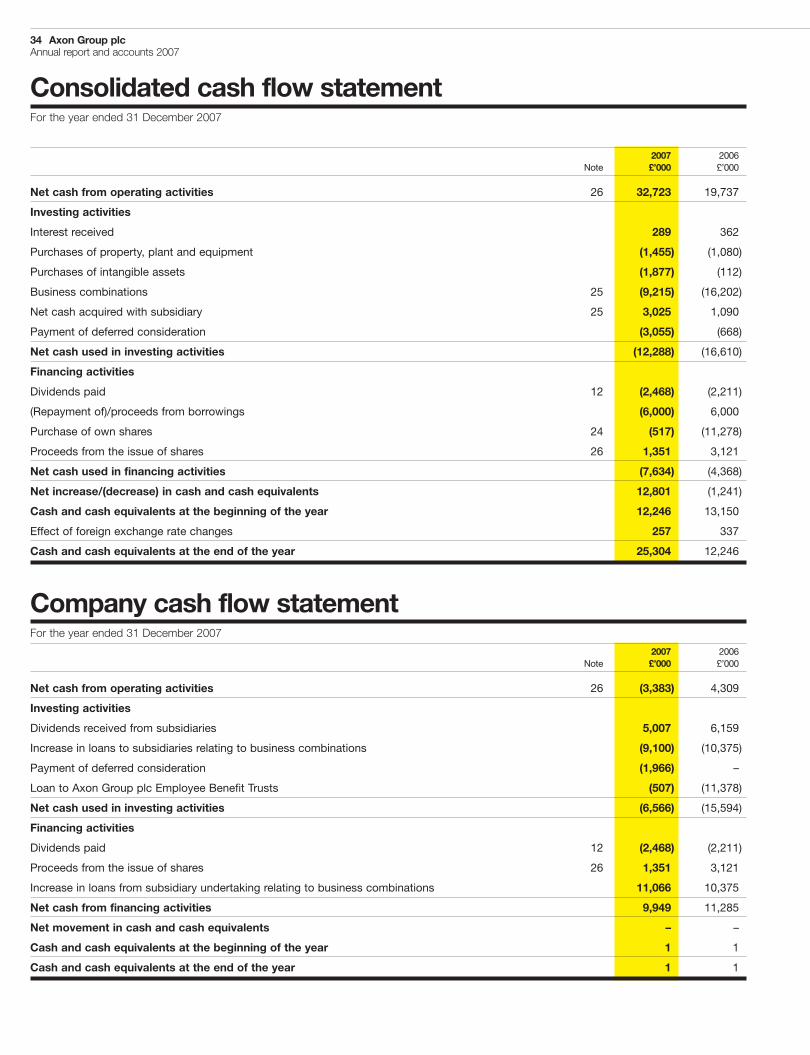
34 Axon Group plcAnnual report and accounts 2007
Consolidated cash flow statementFor the year ended 31 December 2007
2007 2006Note £’000 £’000
Net cash from operating activities 26 32,723 19,737
Investing activities
Interest received 289 362
Purchases of property, plant and equipment (1,455) (1,080)
Purchases of intangible assets (1,877) (112)
Business combinations 25 (9,215) (16,202)
Net cash acquired with subsidiary 25 3,025 1,090
Payment of deferred consideration (3,055) (668)
Net cash used in investing activities (12,288) (16,610)
Financing activities
Dividends paid 12 (2,468) (2,211)
(Repayment of)/proceeds from borrowings (6,000) 6,000
Purchase of own shares 24 (517) (11,278)
Proceeds from the issue of shares 26 1,351 3,121
Net cash used in financing activities (7,634) (4,368)
Net increase/(decrease) in cash and cash equivalents 12,801 (1,241)
Cash and cash equivalents at the beginning of the year 12,246 13,150
Effect of foreign exchange rate changes 257 337
Cash and cash equivalents at the end of the year 25,304 12,246
Company cash flow statementFor the year ended 31 December 2007
2007 2006Note £’000 £’000
Net cash from operating activities 26 (3,383) 4,309
Investing activities
Dividends received from subsidiaries 5,007 6,159
Increase in loans to subsidiaries relating to business combinations (9,100) (10,375)
Payment of deferred consideration (1,966) –
Loan to Axon Group plc Employee Benefit Trusts (507) (11,378)
Net cash used in investing activities (6,566) (15,594)
Financing activities
Dividends paid 12 (2,468) (2,211)
Proceeds from the issue of shares 26 1,351 3,121
Increase in loans from subsidiary undertaking relating to business combinations 11,066 10,375
Net cash from financing activities 9,949 11,285
Net movement in cash and cash equivalents – –
Cash and cash equivalents at the beginning of the year 1 1
Cash and cash equivalents at the end of the year 1 1
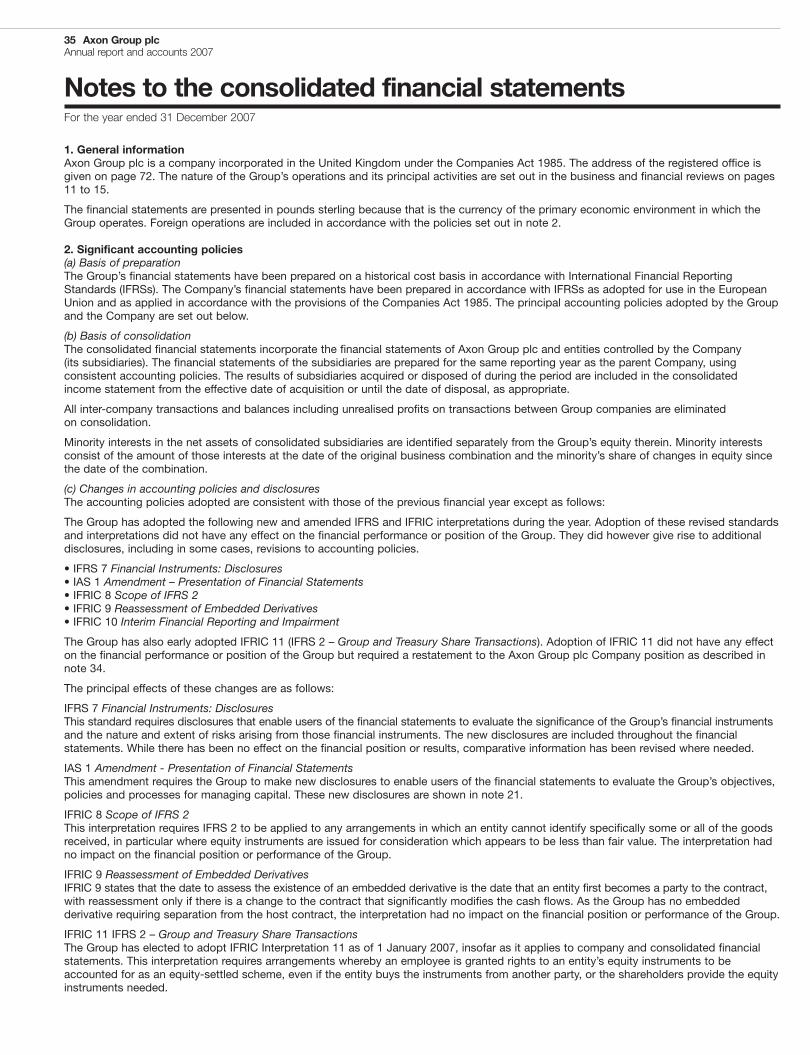
35 Axon Group plcAnnual report and accounts 2007
Notes to the consolidated financial statementsFor the year ended 31 December 2007
1. General informationAxon Group plc is a company incorporated in the United Kingdom under the Companies Act 1985. The address of the registered office isgiven on page 72. The nature of the Group’s operations and its principal activities are set out in the business and financial reviews on pages11 to 15.
The financial statements are presented in pounds sterling because that is the currency of the primary economic environment in which theGroup operates. Foreign operations are included in accordance with the policies set out in note 2.
2. Significant accounting policies(a) Basis of preparationThe Group’s financial statements have been prepared on a historical cost basis in accordance with International Financial ReportingStandards (IFRSs). The Company’s financial statements have been prepared in accordance with IFRSs as adopted for use in the EuropeanUnion and as applied in accordance with the provisions of the Companies Act 1985. The principal accounting policies adopted by the Groupand the Company are set out below.
(b) Basis of consolidationThe consolidated financial statements incorporate the financial statements of Axon Group plc and entities controlled by the Company(its subsidiaries). The financial statements of the subsidiaries are prepared for the same reporting year as the parent Company, usingconsistent accounting policies. The results of subsidiaries acquired or disposed of during the period are included in the consolidatedincome statement from the effective date of acquisition or until the date of disposal, as appropriate.
All inter-company transactions and balances including unrealised profits on transactions between Group companies are eliminatedon consolidation.
Minority interests in the net assets of consolidated subsidiaries are identified separately from the Group’s equity therein. Minority interestsconsist of the amount of those interests at the date of the original business combination and the minority’s share of changes in equity sincethe date of the combination.
(c) Changes in accounting policies and disclosuresThe accounting policies adopted are consistent with those of the previous financial year except as follows:
The Group has adopted the following new and amended IFRS and IFRIC interpretations during the year. Adoption of these revised standardsand interpretations did not have any effect on the financial performance or position of the Group. They did however give rise to additionaldisclosures, including in some cases, revisions to accounting policies.
• IFRS 7 Financial Instruments: Disclosures• IAS 1 Amendment – Presentation of Financial Statements• IFRIC 8 Scope of IFRS 2• IFRIC 9 Reassessment of Embedded Derivatives• IFRIC 10 Interim Financial Reporting and Impairment
The Group has also early adopted IFRIC 11 (IFRS 2 – Group and Treasury Share Transactions). Adoption of IFRIC 11 did not have any effecton the financial performance or position of the Group but required a restatement to the Axon Group plc Company position as described innote 34.
The principal effects of these changes are as follows:
IFRS 7 Financial Instruments: DisclosuresThis standard requires disclosures that enable users of the financial statements to evaluate the significance of the Group’s financial instrumentsand the nature and extent of risks arising from those financial instruments. The new disclosures are included throughout the financialstatements. While there has been no effect on the financial position or results, comparative information has been revised where needed.
IAS 1 Amendment - Presentation of Financial StatementsThis amendment requires the Group to make new disclosures to enable users of the financial statements to evaluate the Group’s objectives,policies and processes for managing capital. These new disclosures are shown in note 21.
IFRIC 8 Scope of IFRS 2This interpretation requires IFRS 2 to be applied to any arrangements in which an entity cannot identify specifically some or all of the goodsreceived, in particular where equity instruments are issued for consideration which appears to be less than fair value. The interpretation hadno impact on the financial position or performance of the Group.
IFRIC 9 Reassessment of Embedded DerivativesIFRIC 9 states that the date to assess the existence of an embedded derivative is the date that an entity first becomes a party to the contract,with reassessment only if there is a change to the contract that significantly modifies the cash flows. As the Group has no embeddedderivative requiring separation from the host contract, the interpretation had no impact on the financial position or performance of the Group.
IFRIC 11 IFRS 2 – Group and Treasury Share TransactionsThe Group has elected to adopt IFRIC Interpretation 11 as of 1 January 2007, insofar as it applies to company and consolidated financialstatements. This interpretation requires arrangements whereby an employee is granted rights to an entity’s equity instruments to beaccounted for as an equity-settled scheme, even if the entity buys the instruments from another party, or the shareholders provide the equityinstruments needed.
36 Axon Group plcAnnual report and accounts 2007
Notes to the consolidated financial statements (continued)For the year ended 31 December 2007
2. Significant accounting policies (continued)(d) Business combinationsThe acquisition of subsidiaries is accounted for using the purchase method. The cost of acquisition is measured at the aggregate of the fairvalues, at the date of exchange, of assets given, liabilities incurred or assumed and equity instruments issued by the Group in exchange forcontrol of the acquiree, plus any costs directly attributable to the business combination. The acquiree’s identifiable assets, liabilities andcontingent liabilities that meet the conditions for recognition under IFRS 3 are recognised at their fair value at the acquisition date.
Goodwill arising on acquisition is recognised as an asset and initially measured at cost, being the excess of the cost of the businesscombination over the Group’s interest in the net fair value of the identifiable assets, liabilities and contingent liabilities recognised.
The interest of minority shareholders in the acquiree is initially measured at the minority’s proportion of the net fair value of the assets,liabilities and contingent liabilities recognised.
(e) Goodwill and acquired intangiblesGoodwill arising on the acquisition of a subsidiary or a jointly controlled entity represents the excess of the cost of acquisition over theGroup’s interest in the net fair value of the identifiable assets and liabilities of the subsidiary or jointly controlled entity recognised at the dateof acquisition. Goodwill is initially recognised as an intangible asset at cost. Goodwill is tested at least annually for impairment and carried atcost less any accumulated impairment losses. Goodwill is tested more frequently if there is an indication of impairment.
Goodwill is allocated to cash-generating units for the purpose of impairment testing. Each of those cash-generating units represents theGroup’s investment in each geographic region of operation by each primary reporting segment.
As permitted under IFRS 1, the Group has elected to deem the UK GAAP net book value at 1 January 2004 as the IFRS cost of goodwill attransition date.
IFRS 3 requires intangible assets which are acquired with a subsidiary undertaking to be recognised separately from goodwill andamortised over their estimated economic useful life. As permitted by IFRS 1, IFRS 3 has only been applied to acquisitions made on orafter 1 January 2004.
(f) Impairment of tangible and intangible assets excluding goodwillAt each balance sheet date the Group reviews the carrying amounts of its tangible and intangible assets to determine whether there is anyindication that those assets have suffered an impairment loss. If any such indication exists the recoverable amount of the asset is estimatedin order to determine the extent of the impairment loss (if any). An impairment loss is recognised immediately as an expense where theamount by which the asset’s carrying amount exceeds its recoverable amount. The recoverable amount is the higher of an asset’s fair valueless costs to sell and value in use. In assessing value in use, the estimated future cash flows are discounted to their present value using apost-tax discount rate that reflects current market assessments of the time value of money and the risks specific to the asset for which theestimates of future cash flows have been adjusted. For the purposes of assessing impairment, assets are grouped at the lowest levels forwhich there are separately identifiable cash flows (cash-generating units).
(g) Revenue recognition and contracts in progressRevenue is measured at the fair value of the fees received or receivable and represents amounts receivable for services provided to thirdparties in the normal course of business, net of discounts, VAT and other sales related taxes. Revenue from consultancy services, installationand other services is recognised when services have been provided and the right to consideration has been earned. It excludes expensesrecharged to clients at nil margin, which are accounted for as a contribution to cost of sales. Revenue from maintenance, support andother periodically contracted services or products is recognised on a pro-rata basis over the contracted period. Amounts invoiced but notrecognised are accounted for within deferred income. Profits on fixed price contracts are taken in proportion to the cost of work performedon each contract relative to the estimated total cost of completing the contract. Provision is made for all anticipated contract losses as soonas they are identified. Profits on time and material contracts are recognised in line with the effort expended. Revenue from sales of Axonsoftware licences to end-users is recognised when the product is delivered providing there are no outstanding performance obligations.
The gross amount due from customers for contract work is included within trade and other receivables as trade debtors and amountsrecoverable on contracts and the gross amount due to suppliers is included with trade and other payables.
(h) Property, plant and equipmentProperty, plant and equipment are stated at cost less accumulated depreciation and any provision for impairment. Depreciation is chargedso as to write off the cost or valuation of assets, less estimated residual value, by equal annual instalments over their estimated useful livesof between three and five years depending on the nature of the asset.
(i) Intangible assetsAcquired computer software licences are capitalised as intangible assets on the basis of the costs incurred to acquire and bring to use thespecific software. These licences are stated at cost less accumulated amortisation and any provision for impairment. Amortisation is chargedso as to write off the cost over the estimated useful lives, which is on average three years. The amortisation period for development costsincurred on the Group’s internal system development is three years.
Research costs are expensed as incurred. An intangible asset arising from development expenditure on an individual project is recognisedonly when the Group can determine the technical feasibility of completing the intangible asset so that it will be available for use or sale, itsintention to complete and its ability to use or sell the asset, how the asset will generate future economic benefits, the availability of resourcesto complete the assets and the ability to measure reliably the expenditure during the development.
37 Axon Group plcAnnual report and accounts 2007
2. Significant accounting policies (continued)Intangible assets acquired as part of a business combination are capitalised as intangible assets and are stated at their fair value.Amortisation is charged on a straight line basis so as to write off the cost of these assets over a period consistent with the expectedeconomic benefit that the Group will derive from them (up to ten years). The periods over which the intangibles acquired to date as part ofbusiness combinations are amortised are as follows:
Customer relationships and contracts 24 to 36 months
Order backlog 3 to 13 months
Trademark/trade name 12 months
Technology/know-how 36 months
Other assets 24 to 44 months
Development costs 36 months
(j) Foreign currenciesThe individual financial statements of each Group entity are prepared in the currency of the primary economic environment in which theentity operates (its functional currency).
In preparing the financial statements, transactions in currencies other than functional currency are recorded at the rates of exchangeprevailing on the dates of the transactions. At each balance sheet date, monetary items denominated in foreign currencies are retranslatedat the rates prevailing on the balance sheet date. Non-monetary items carried at fair value that are denominated in foreign currencies aretranslated at the rates prevailing at the date when the fair value was determined. Non-monetary items that are measured in terms ofhistorical cost in a foreign company are not retranslated.
Exchange differences arising on the settlement and retranslation of monetary items are included in the profit or loss for the period. Exchangedifferences arising on the retranslation of non-monetary items carried at fair value are included in the profit or loss for the period except fordifferences arising on the retranslation of non-monetary items in respect of which gains and losses are recognised directly in equity. For suchnon-monetary items, any exchange component of that gain or loss is also recognised directly in equity.
For the purposes of presenting consolidated financial statements, the assets and liabilities of the Group’s foreign operations (includingcomparatives) are expressed in pounds sterling using exchange rates prevailing on the balance sheet date. Income and expense items(including comparatives) are translated at the average exchange rate for the period unless exchange rates fluctuated significantly during thatperiod, in which case a weighted average exchange rate for the period is used. Exchange differences arising, if any, are classified as equityand transferred to the Group’s translation reserve. Such translation differences are recognised in the profit or loss in the period in which theforeign operation is disposed of.
Goodwill and fair value adjustments arising on the acquisition of a foreign entity are treated as assets and liabilities of the foreign entity andtranslated at the closing rate.
As permitted under IFRS 1 the cumulative transitional foreign exchange difference that has been taken to reserves for foreign operationsprior to 1 January 2004 has been assumed to be zero.
(k) LeasesOperating lease rentals are charged to the income statement in equal annual amounts over the lease term.
Income from assets which are leased to third parties is accounted for on a straight-line basis over the term of the lease.
(l) TaxationIncome tax expense represents the sum of the tax currently payable and deferred tax.
The tax currently payable is based on taxable profit for the year. Taxable profit differs from profit as reported in the income statementbecause it excludes items of income and expense that are taxable or deductible in other years or are never taxable or deductible.The Group’s liability for current tax is calculated using tax rates that have been enacted or substantively enacted by the balance sheet date.
Deferred tax is recognised on differences between the carrying amounts of assets and liabilities in the financial statements and the correspondingtax bases used in the computation of taxable profit and are accounted for using the balance sheet liability method. Deferred tax liabilitiesare generally recognised for all taxable temporary differences. Deferred tax assets are generally recognised for all deductible temporarydifferences to the extent that it is probable that taxable profits will be available against which such differences can be utilised.
Such assets and liabilities are not recognised if the temporary difference arises from the initial recognition of goodwill or from the initialrecognition (other than in a business combination) of other assets and liabilities in a transaction that affects neither the tax profit nor theaccounting profit.
Deferred tax liabilities are recognised for taxable temporary differences arising on investments in subsidiaries except where the Group is ableto control the reversal of the temporary difference and it is probable that the temporary difference will not reverse in the foreseeable future.
The carrying amount of deferred tax assets is reviewed at each balance sheet date and reduced to the extent that it is no longer probablethat sufficient taxable profits will be available to allow all or part of the asset to be recovered in the foreseeable future.
Deferred tax is calculated at the tax rates which are expected to apply in the period when the liability is settled or the asset realised.Deferred tax is charged or credited to the income statement, except when it relates to items charged or credited directly to reserves, inwhich case the deferred tax is also dealt with in reserves.
38 Axon Group plcAnnual report and accounts 2007
Notes to the consolidated financial statements (continued)For the year ended 31 December 2007
2. Significant accounting policies (continued)Tax assets and liabilities are offset when there is a legally enforceable right to set off current tax assets against current tax liabilities andthe Group intends to settle its current tax assets and liabilities on a net basis.
(m) PensionsThe Group pays contributions to the defined contribution personal pension plans and 401k schemes in the US of certain employees.These costs are charged to the income statement as incurred.
On 6 July 2001 the Group introduced a stakeholder pension scheme, administered by Standard Life, for its UK employees. No employeeshave currently taken up membership of this scheme. Any costs arising from the scheme will be charged to the income statementas incurred.
(n) Share-based paymentsIn accordance with the exemption permitted under IFRS 1, IFRS 2 has only been applied to options awarded on or after 7 November 2002that had not vested at 1 January 2005.
Equity-settled share options are granted under various schemes operated by the Group to selected employees on a discretionary basis.The options are subject to a three year service vesting condition and an earnings per share based performance condition. Their fair value(which is measured using the Black-Scholes pricing model at the date of grant) is recognised as an employee benefits expense over thevesting period, based on the Group’s best estimate at each period end of the share options that will ultimately vest, with a correspondingincrease in another equity reserve.
The proceeds received net of any directly attributable transaction costs are credited to share capital (nominal value) and share premiumwhen the options are exercised.
Share options for the Executive Reward Scheme are awarded to selected employees by three private shareholders, of which one isMark Hunter, on a discretionary basis. The options are subject to a continued service vesting condition over a three year period and arealso subject to a share price target performance condition. Their fair value (which is measured using the Monte Carlo simulation model)is recognised as an employee benefits expense over the vesting period, based on the Group’s best estimate at each period end of theshare options that will ultimately vest, with a corresponding increase in another equity reserve. No proceeds are received by the Groupunder this scheme.
Awards are made under the Performance Share Plan on a discretionary basis. The awards are subject to earnings per share performanceconditions over a three year period. Their fair value is calculated as the share price on the day of award, adjusted for dividends that won’tbe received in the performance period. Their fair value is recognised as an employee benefits expense over the vesting period, based on theGroup’s best estimate at each period end of the share options that will ultimately vest, with a corresponding increase in another equity reserve.
Further details regarding each plan are included in note 30.
(o) DividendsDividend distribution to the Company’s shareholders is recognised in the period in which the dividends are approved. Dividends received bythe Company are recognised in the period in which the dividends are approved.
(p) Own shares held by employee trustsThe Axon Group plc shares owned by the employee share trusts are presented as a reduction of shareholders’ equity.
(q) Investments in subsidiariesInvestments are stated at cost less provision for impairment in value.
(r) ProvisionsProvisions are recognised when the Group has a present obligation as a result of a past event, and it is probable that the Group will berequired to settle that obligation. Provisions are measured at the directors’ best estimate of the expenditure required to settle the obligationat the balance sheet date, and are discounted to present value where the effect is material.
(s) Deferred considerationDeferred consideration is recognised when the Group has a present obligation as a result of a past acquisition, and it is probable that theGroup will be required to settle that obligation. Deferred consideration is measured at the directors’ best estimate of the expenditure requiredto settle the obligation at the balance sheet date, and is discounted to present value where the effect is material.
(t) Financial instrumentsFinancial assets and liabilities are recognised on the Group’s balance sheet when the Group becomes a party to the contractual provisionsof the instrument. Income and expenditure arising on financial instruments are recognised on an accruals basis and credited or charged tothe income statement in the financial period to which it relates.
39 Axon Group plcAnnual report and accounts 2007
2. Significant accounting policies (continued)Financial assetsFinancial assets within the scope of IAS 39 are classified as either financial assets at fair value through profit or loss, loans and receivables,held to maturity investments, and available for sale financial assets, as appropriate. When financial assets are recognised initially, they aremeasured at fair value, plus, in the case of investments not at fair value through profit or loss, directly attributable transaction costs.
A financial asset is derecognised when the rights to receive cash flows from the asset have expired.
Cash and cash equivalentsCash and cash equivalents comprise cash in hand and on demand deposits, and other short-term highly liquid investments that are readilyconvertible to a known amount of cash and are subject to an insignificant risk of changes in value.
Trade receivablesTrade receivables do not carry any interest and are stated at their nominal value as reduced by appropriate allowances for estimatedirrecoverable amounts. Gains and losses are recognised in the income statement when the loans and receivables are derecognised orimpaired, as well as through the amortisation process.
Financial liabilitiesTrade payablesTrade payables are non-interest bearing and are stated at their nominal value.
Bank borrowingsInterest-bearing bank loans and overdrafts are recorded at proceeds received, net of direct issue costs. Finance charges, includingpremiums payable on settlement or redemption and direct issue costs are accounted for on an accruals basis in the income statement usingthe effective interest rate method and are added to the carrying amount of the instrument to the extent that they are not settled in the periodin which they arise. Where the direct issue costs cannot be attributed to a particular loan within the overall facility, they are accounted for inthe income statement in the period in which they arise.
A financial liability is derecognised when the obligation under the liability is discharged or cancelled or expires.
(u) Future changes in accounting policiesDuring the year, the IASB and IFRIC have issued the following standards and interpretations with an effective date after the date of thesefinancial statements:
IAS 23 Borrowing CostsA revised IAS 23 Borrowing Costs was issued in March 2007, and becomes effective for financial years beginning on or after 1 January2009. The standard has been revised to require capitalisation of borrowing costs when such costs relate to a qualifying asset. A qualifyingasset is an asset that necessarily takes a substantial period of time to get ready for its intended use or sale. In accordance with thetransitional requirements in the Standard, the Group will adopt this as a prospective change. Accordingly, borrowing costs will be capitalisedon qualifying assets with a commencement date after 1 January 2009. No changes will be made for borrowing costs incurred to this datethat have been expensed.
IFRS 8 Operating SegmentsIFRS 8 Operating Segments was issued in November 2006 and becomes effective for annual periods beginning on or after 1 January 2009.This standard sets out requirements for disclosure of information about an entity’s operating segments and also about the entity’s productsand services, the geographical areas in which it operates, and its major customers. The adoption of this standard will give rise to additionaldisclosures but will not have any effect on the financial performance or position of the Group.
IFRIC 12 Service Concession ArrangementsIFRIC Interpretation 12 was issued in November 2006 and becomes effective for annual periods beginning on or after 1 January 2008.This interpretation applies to service concession operators and explains how to account for the obligations undertaken and rights received inservice concession arrangements. No member of the Group is an operator and hence this interpretation will have no impact on the Group.
IFRIC 13 Customer Loyalty ProgrammesIFRIC Interpretation 13 was issued in June 2007 and becomes effective for annual periods beginning on or after 1 July 2008. This interpretationrequires customer loyalty award credits to be accounted for as a separate component of the sales transaction in which they are granted andtherefore part of the fair value of the consideration received is allocated to the award credits and deferred over the period that the awardcredits are fulfilled. The Group expects that this interpretation will have no impact on the Group’s financial statements as no such schemescurrently exist.
IFRIC 14 IAS 19 – The Limit on a Defined Benefit Asset, Minimum Funding Requirements and their InteractionIFRIC Interpretation 14 was issued in July 2007 and becomes effective for annual periods beginning on or after 1 January 2008.This interpretation provides guidance on how to assess the limit on the amount of surplus in a defined benefit scheme that can berecognised as an asset under IAS 19 Employee Benefits. The Group expects that this interpretation will have no impact on the financialposition or performance of the Group as there are no defined benefit schemes currently in operation.
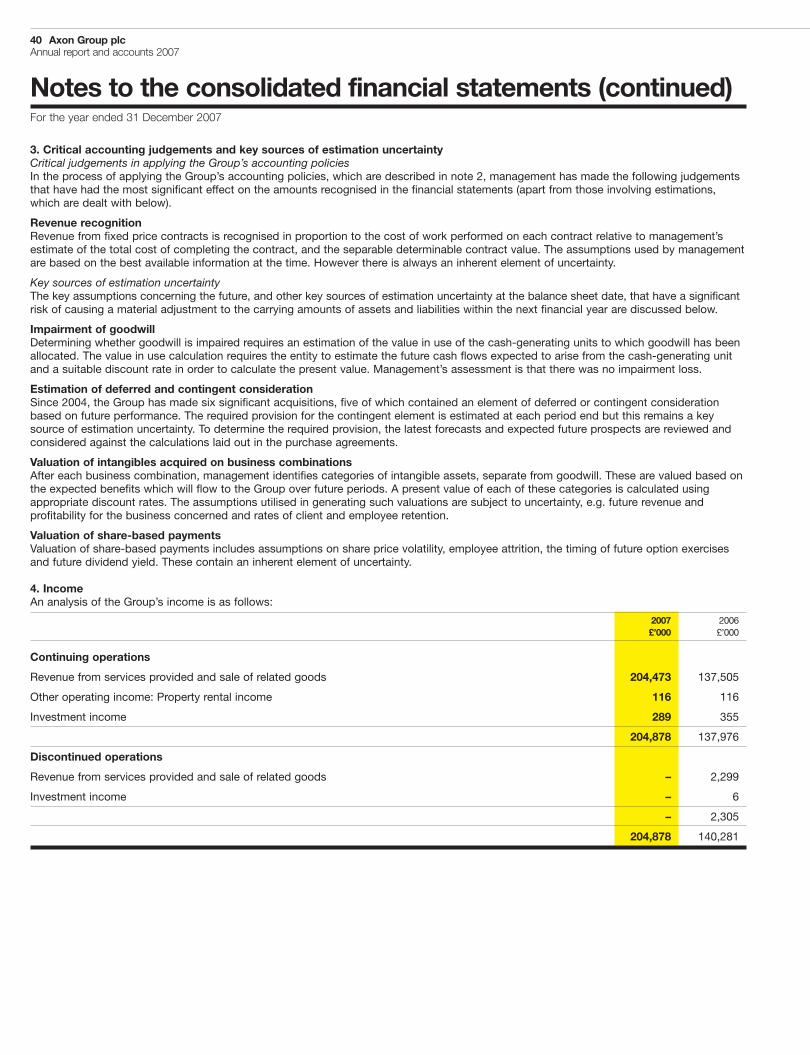
40 Axon Group plcAnnual report and accounts 2007
Notes to the consolidated financial statements (continued)For the year ended 31 December 2007
3. Critical accounting judgements and key sources of estimation uncertaintyCritical judgements in applying the Group’s accounting policiesIn the process of applying the Group’s accounting policies, which are described in note 2, management has made the following judgementsthat have had the most significant effect on the amounts recognised in the financial statements (apart from those involving estimations,which are dealt with below).
Revenue recognitionRevenue from fixed price contracts is recognised in proportion to the cost of work performed on each contract relative to management’sestimate of the total cost of completing the contract, and the separable determinable contract value. The assumptions used by managementare based on the best available information at the time. However there is always an inherent element of uncertainty.
Key sources of estimation uncertaintyThe key assumptions concerning the future, and other key sources of estimation uncertainty at the balance sheet date, that have a significantrisk of causing a material adjustment to the carrying amounts of assets and liabilities within the next financial year are discussed below.
Impairment of goodwillDetermining whether goodwill is impaired requires an estimation of the value in use of the cash-generating units to which goodwill has beenallocated. The value in use calculation requires the entity to estimate the future cash flows expected to arise from the cash-generating unitand a suitable discount rate in order to calculate the present value. Management’s assessment is that there was no impairment loss.
Estimation of deferred and contingent considerationSince 2004, the Group has made six significant acquisitions, five of which contained an element of deferred or contingent considerationbased on future performance. The required provision for the contingent element is estimated at each period end but this remains a keysource of estimation uncertainty. To determine the required provision, the latest forecasts and expected future prospects are reviewed andconsidered against the calculations laid out in the purchase agreements.
Valuation of intangibles acquired on business combinationsAfter each business combination, management identifies categories of intangible assets, separate from goodwill. These are valued based onthe expected benefits which will flow to the Group over future periods. A present value of each of these categories is calculated usingappropriate discount rates. The assumptions utilised in generating such valuations are subject to uncertainty, e.g. future revenue andprofitability for the business concerned and rates of client and employee retention.
Valuation of share-based paymentsValuation of share-based payments includes assumptions on share price volatility, employee attrition, the timing of future option exercisesand future dividend yield. These contain an inherent element of uncertainty.
4. IncomeAn analysis of the Group’s income is as follows:
2007 2006£’000 £’000
Continuing operations
Revenue from services provided and sale of related goods 204,473 137,505
Other operating income: Property rental income 116 116
Investment income 289 355
204,878 137,976
Discontinued operations
Revenue from services provided and sale of related goods – 2,299
Investment income – 6
– 2,305
204,878 140,281
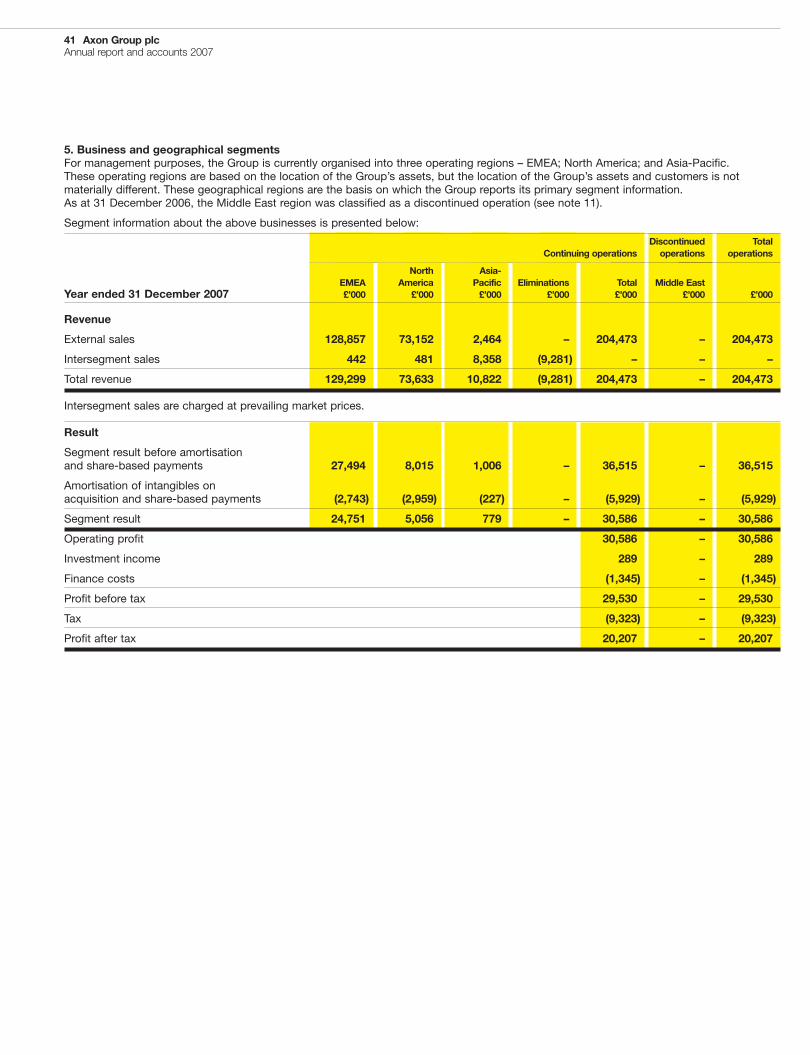
41 Axon Group plcAnnual report and accounts 2007
5. Business and geographical segmentsFor management purposes, the Group is currently organised into three operating regions – EMEA; North America; and Asia-Pacific.These operating regions are based on the location of the Group’s assets, but the location of the Group’s assets and customers is notmaterially different. These geographical regions are the basis on which the Group reports its primary segment information.As at 31 December 2006, the Middle East region was classified as a discontinued operation (see note 11).
Segment information about the above businesses is presented below:
Discontinued TotalContinuing operations operations operations
North Asia-EMEA America Pacific Eliminations Total Middle East
Year ended 31 December 2007 £’000 £’000 £’000 £’000 £’000 £’000 £’000
Revenue
External sales 128,857 73,152 2,464 – 204,473 – 204,473
Intersegment sales 442 481 8,358 (9,281) – – –
Total revenue 129,299 73,633 10,822 (9,281) 204,473 – 204,473
Intersegment sales are charged at prevailing market prices.
Result
Segment result before amortisationand share-based payments 27,494 8,015 1,006 – 36,515 – 36,515
Amortisation of intangibles onacquisition and share-based payments (2,743) (2,959) (227) – (5,929) – (5,929)
Segment result 24,751 5,056 779 – 30,586 – 30,586
Operating profit 30,586 – 30,586
Investment income 289 – 289
Finance costs (1,345) – (1,345)
Profit before tax 29,530 – 29,530
Tax (9,323) – (9,323)
Profit after tax 20,207 – 20,207
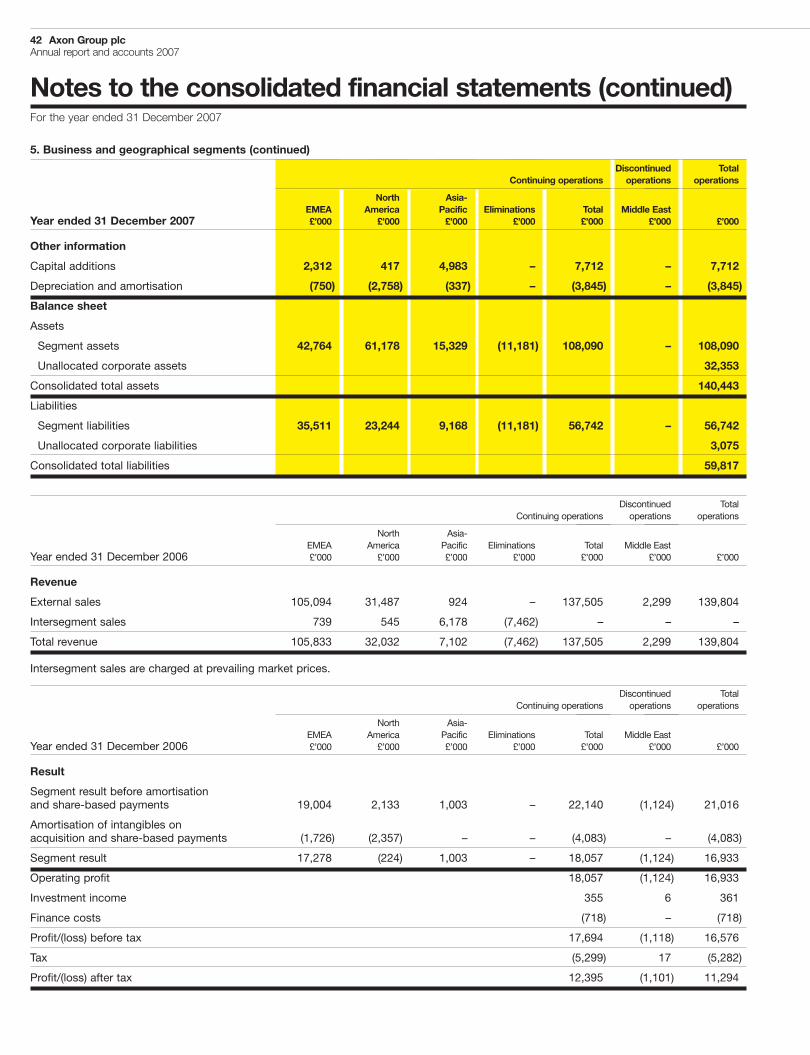
42 Axon Group plcAnnual report and accounts 2007
Notes to the consolidated financial statements (continued)For the year ended 31 December 2007
5. Business and geographical segments (continued)
Discontinued TotalContinuing operations operations operations
North Asia-EMEA America Pacific Eliminations Total Middle East
Year ended 31 December 2007 £’000 £’000 £’000 £’000 £’000 £’000 £’000
Other information
Capital additions 2,312 417 4,983 – 7,712 – 7,712
Depreciation and amortisation (750) (2,758) (337) – (3,845) – (3,845)
Balance sheet
Assets
Segment assets 42,764 61,178 15,329 (11,181) 108,090 – 108,090
Unallocated corporate assets 32,353
Consolidated total assets 140,443
Liabilities
Segment liabilities 35,511 23,244 9,168 (11,181) 56,742 – 56,742
Unallocated corporate liabilities 3,075
Consolidated total liabilities 59,817
Discontinued TotalContinuing operations operations operations
North Asia-EMEA America Pacific Eliminations Total Middle East
Year ended 31 December 2006 £’000 £’000 £’000 £’000 £’000 £’000 £’000
Revenue
External sales 105,094 31,487 924 – 137,505 2,299 139,804
Intersegment sales 739 545 6,178 (7,462) – – –
Total revenue 105,833 32,032 7,102 (7,462) 137,505 2,299 139,804
Intersegment sales are charged at prevailing market prices.
Discontinued TotalContinuing operations operations operations
North Asia-EMEA America Pacific Eliminations Total Middle East
Year ended 31 December 2006 £’000 £’000 £’000 £’000 £’000 £’000 £’000
Result
Segment result before amortisationand share-based payments 19,004 2,133 1,003 – 22,140 (1,124) 21,016
Amortisation of intangibles onacquisition and share-based payments (1,726) (2,357) – – (4,083) – (4,083)
Segment result 17,278 (224) 1,003 – 18,057 (1,124) 16,933
Operating profit 18,057 (1,124) 16,933
Investment income 355 6 361
Finance costs (718) – (718)
Profit/(loss) before tax 17,694 (1,118) 16,576
Tax (5,299) 17 (5,282)
Profit/(loss) after tax 12,395 (1,101) 11,294
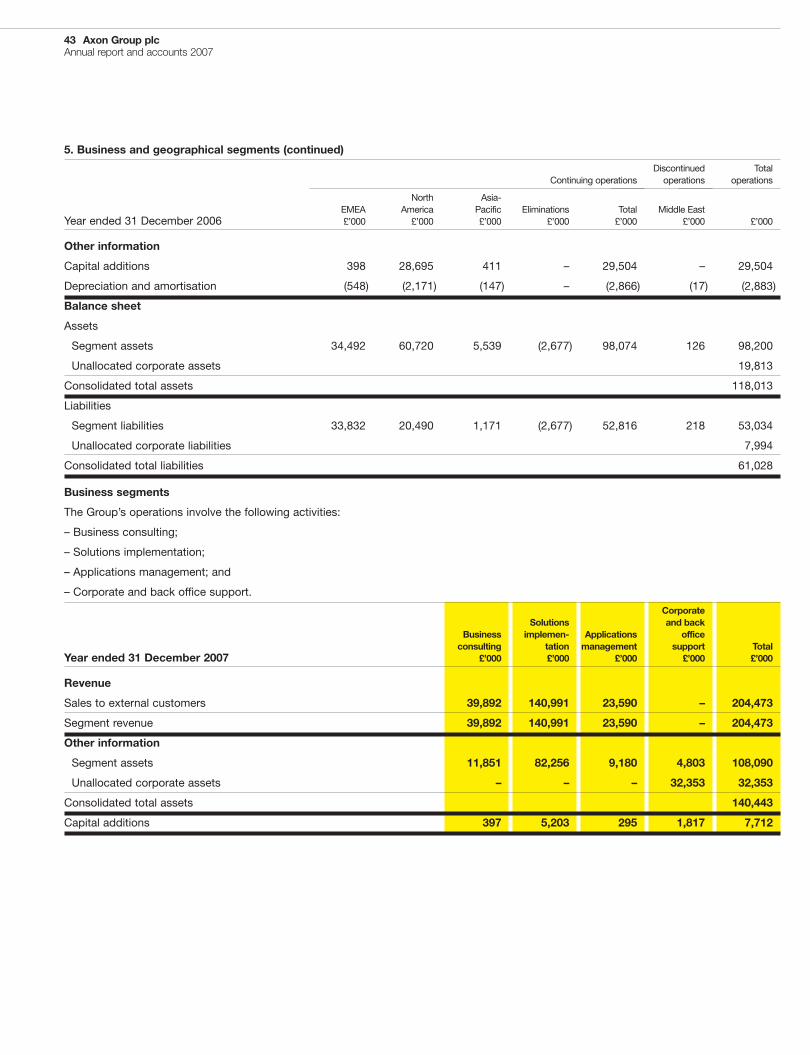
43 Axon Group plcAnnual report and accounts 2007
5. Business and geographical segments (continued)
Discontinued TotalContinuing operations operations operations
North Asia-EMEA America Pacific Eliminations Total Middle East
Year ended 31 December 2006 £’000 £’000 £’000 £’000 £’000 £’000 £’000
Other information
Capital additions 398 28,695 411 – 29,504 – 29,504
Depreciation and amortisation (548) (2,171) (147) – (2,866) (17) (2,883)
Balance sheet
Assets
Segment assets 34,492 60,720 5,539 (2,677) 98,074 126 98,200
Unallocated corporate assets 19,813
Consolidated total assets 118,013
Liabilities
Segment liabilities 33,832 20,490 1,171 (2,677) 52,816 218 53,034
Unallocated corporate liabilities 7,994
Consolidated total liabilities 61,028
Business segments
The Group’s operations involve the following activities:
– Business consulting;
– Solutions implementation;
– Applications management; and
– Corporate and back office support.
CorporateSolutions and back
Business implemen- Applications officeconsulting tation management support Total
Year ended 31 December 2007 £’000 £’000 £’000 £’000 £’000
Revenue
Sales to external customers 39,892 140,991 23,590 – 204,473
Segment revenue 39,892 140,991 23,590 – 204,473
Other information
Segment assets 11,851 82,256 9,180 4,803 108,090
Unallocated corporate assets – – – 32,353 32,353
Consolidated total assets 140,443
Capital additions 397 5,203 295 1,817 7,712
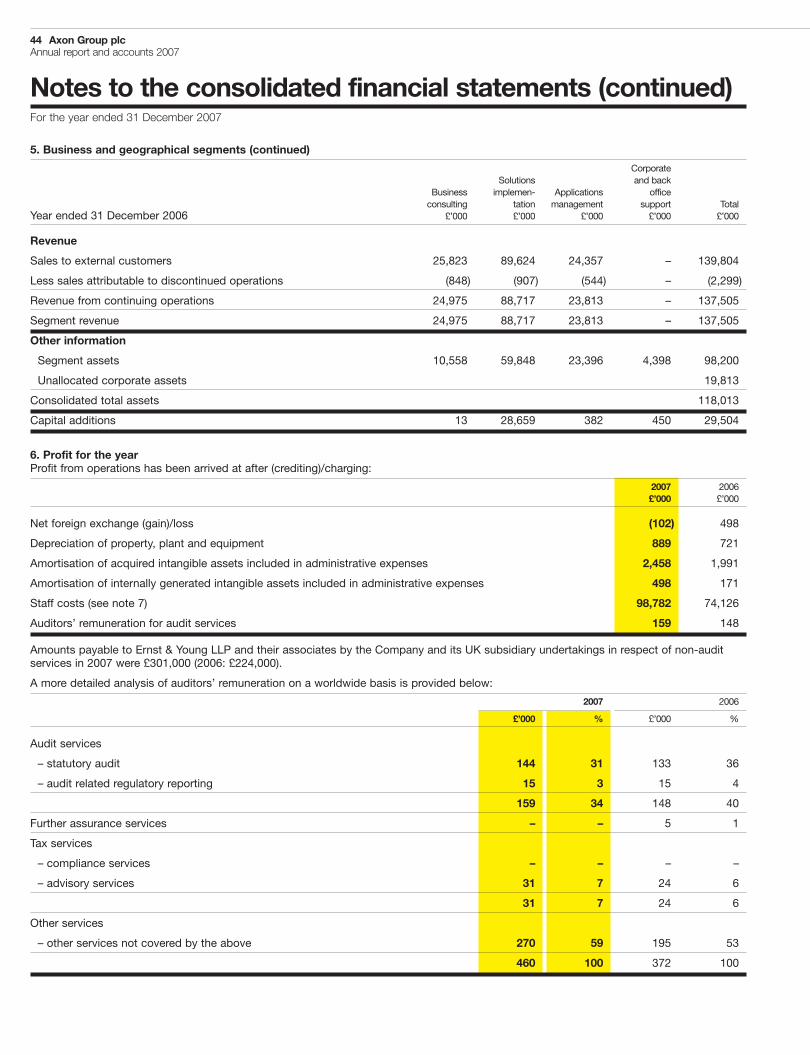
44 Axon Group plcAnnual report and accounts 2007
Notes to the consolidated financial statements (continued)For the year ended 31 December 2007
5. Business and geographical segments (continued)
CorporateSolutions and back
Business implemen- Applications officeconsulting tation management support Total
Year ended 31 December 2006 £’000 £’000 £’000 £’000 £’000
Revenue
Sales to external customers 25,823 89,624 24,357 – 139,804
Less sales attributable to discontinued operations (848) (907) (544) – (2,299)
Revenue from continuing operations 24,975 88,717 23,813 – 137,505
Segment revenue 24,975 88,717 23,813 – 137,505
Other information
Segment assets 10,558 59,848 23,396 4,398 98,200
Unallocated corporate assets 19,813
Consolidated total assets 118,013
Capital additions 13 28,659 382 450 29,504
6. Profit for the yearProfit from operations has been arrived at after (crediting)/charging:
2007 2006£’000 £’000
Net foreign exchange (gain)/loss (102) 498
Depreciation of property, plant and equipment 889 721
Amortisation of acquired intangible assets included in administrative expenses 2,458 1,991
Amortisation of internally generated intangible assets included in administrative expenses 498 171
Staff costs (see note 7) 98,782 74,126
Auditors’ remuneration for audit services 159 148
Amounts payable to Ernst & Young LLP and their associates by the Company and its UK subsidiary undertakings in respect of non-auditservices in 2007 were £301,000 (2006: £224,000).
A more detailed analysis of auditors’ remuneration on a worldwide basis is provided below:
2007 2006
£’000 % £’000 %
Audit services
– statutory audit 144 31 133 36
– audit related regulatory reporting 15 3 15 4
159 34 148 40
Further assurance services – – 5 1
Tax services
– compliance services – – – –
– advisory services 31 7 24 6
31 7 24 6
Other services
– other services not covered by the above 270 59 195 53
460 100 372 100
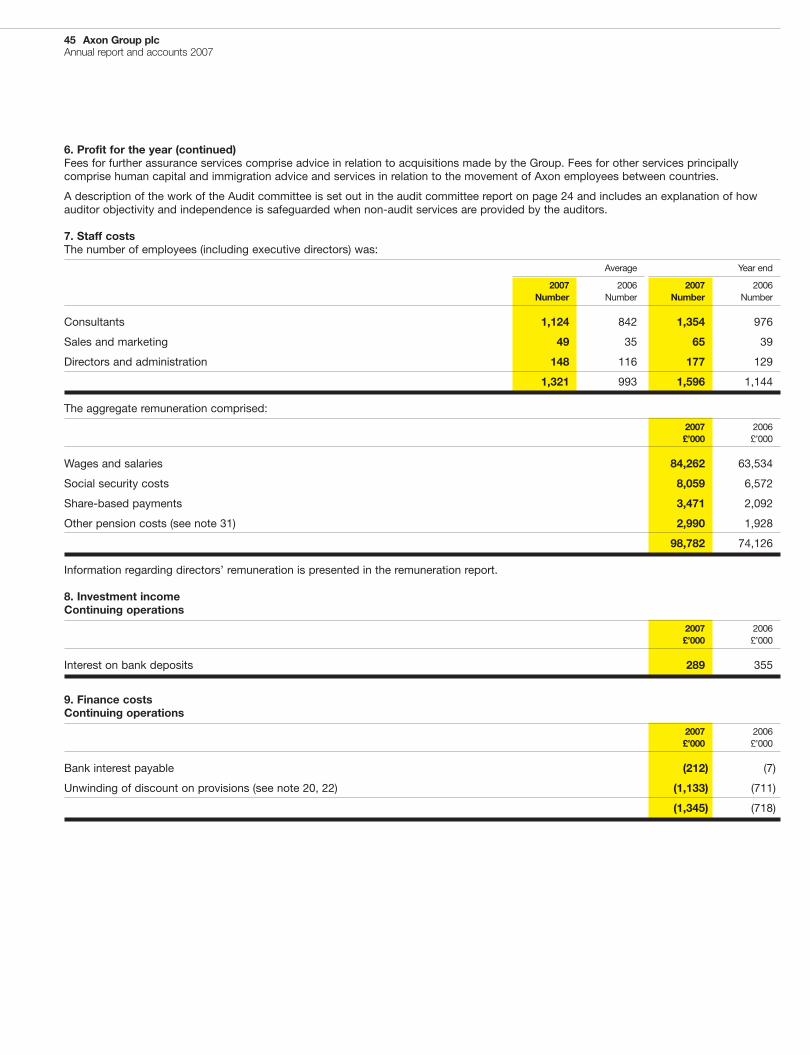
45 Axon Group plcAnnual report and accounts 2007
6. Profit for the year (continued)Fees for further assurance services comprise advice in relation to acquisitions made by the Group. Fees for other services principallycomprise human capital and immigration advice and services in relation to the movement of Axon employees between countries.
A description of the work of the Audit committee is set out in the audit committee report on page 24 and includes an explanation of howauditor objectivity and independence is safeguarded when non-audit services are provided by the auditors.
7. Staff costsThe number of employees (including executive directors) was:
Average Year end
2007 2006 2007 2006Number Number Number Number
Consultants 1,124 842 1,354 976
Sales and marketing 49 35 65 39
Directors and administration 148 116 177 129
1,321 993 1,596 1,144
The aggregate remuneration comprised:
2007 2006£’000 £’000
Wages and salaries 84,262 63,534
Social security costs 8,059 6,572
Share-based payments 3,471 2,092
Other pension costs (see note 31) 2,990 1,928
98,782 74,126
Information regarding directors’ remuneration is presented in the remuneration report.
8. Investment incomeContinuing operations
2007 2006£’000 £’000
Interest on bank deposits 289 355
9. Finance costsContinuing operations
2007 2006£’000 £’000
Bank interest payable (212) (7)
Unwinding of discount on provisions (see note 20, 22) (1,133) (711)
(1,345) (718)
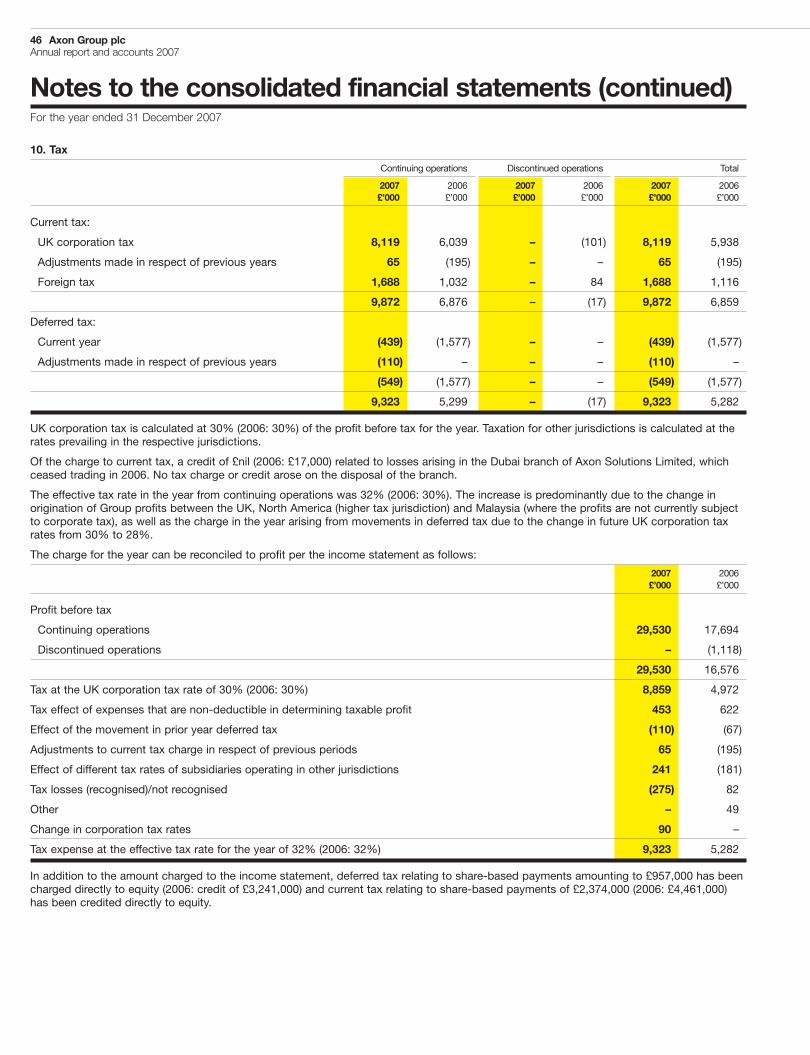
46 Axon Group plcAnnual report and accounts 2007
Notes to the consolidated financial statements (continued)For the year ended 31 December 2007
10. Tax
Continuing operations Discontinued operations Total
2007 2006 2007 2006 2007 2006£’000 £’000 £’000 £’000 £’000 £’000
Current tax:
UK corporation tax 8,119 6,039 – (101) 8,119 5,938
Adjustments made in respect of previous years 65 (195) – – 65 (195)
Foreign tax 1,688 1,032 – 84 1,688 1,116
9,872 6,876 – (17) 9,872 6,859
Deferred tax:
Current year (439) (1,577) – – (439) (1,577)
Adjustments made in respect of previous years (110) – – – (110) –
(549) (1,577) – – (549) (1,577)
9,323 5,299 – (17) 9,323 5,282
UK corporation tax is calculated at 30% (2006: 30%) of the profit before tax for the year. Taxation for other jurisdictions is calculated at therates prevailing in the respective jurisdictions.
Of the charge to current tax, a credit of £nil (2006: £17,000) related to losses arising in the Dubai branch of Axon Solutions Limited, whichceased trading in 2006. No tax charge or credit arose on the disposal of the branch.
The effective tax rate in the year from continuing operations was 32% (2006: 30%). The increase is predominantly due to the change inorigination of Group profits between the UK, North America (higher tax jurisdiction) and Malaysia (where the profits are not currently subjectto corporate tax), as well as the charge in the year arising from movements in deferred tax due to the change in future UK corporation taxrates from 30% to 28%.
The charge for the year can be reconciled to profit per the income statement as follows:
2007 2006£’000 £’000
Profit before tax
Continuing operations 29,530 17,694
Discontinued operations – (1,118)
29,530 16,576
Tax at the UK corporation tax rate of 30% (2006: 30%) 8,859 4,972
Tax effect of expenses that are non-deductible in determining taxable profit 453 622
Effect of the movement in prior year deferred tax (110) (67)
Adjustments to current tax charge in respect of previous periods 65 (195)
Effect of different tax rates of subsidiaries operating in other jurisdictions 241 (181)
Tax losses (recognised)/not recognised (275) 82
Other – 49
Change in corporation tax rates 90 –
Tax expense at the effective tax rate for the year of 32% (2006: 32%) 9,323 5,282
In addition to the amount charged to the income statement, deferred tax relating to share-based payments amounting to £957,000 has beencharged directly to equity (2006: credit of £3,241,000) and current tax relating to share-based payments of £2,374,000 (2006: £4,461,000)has been credited directly to equity.
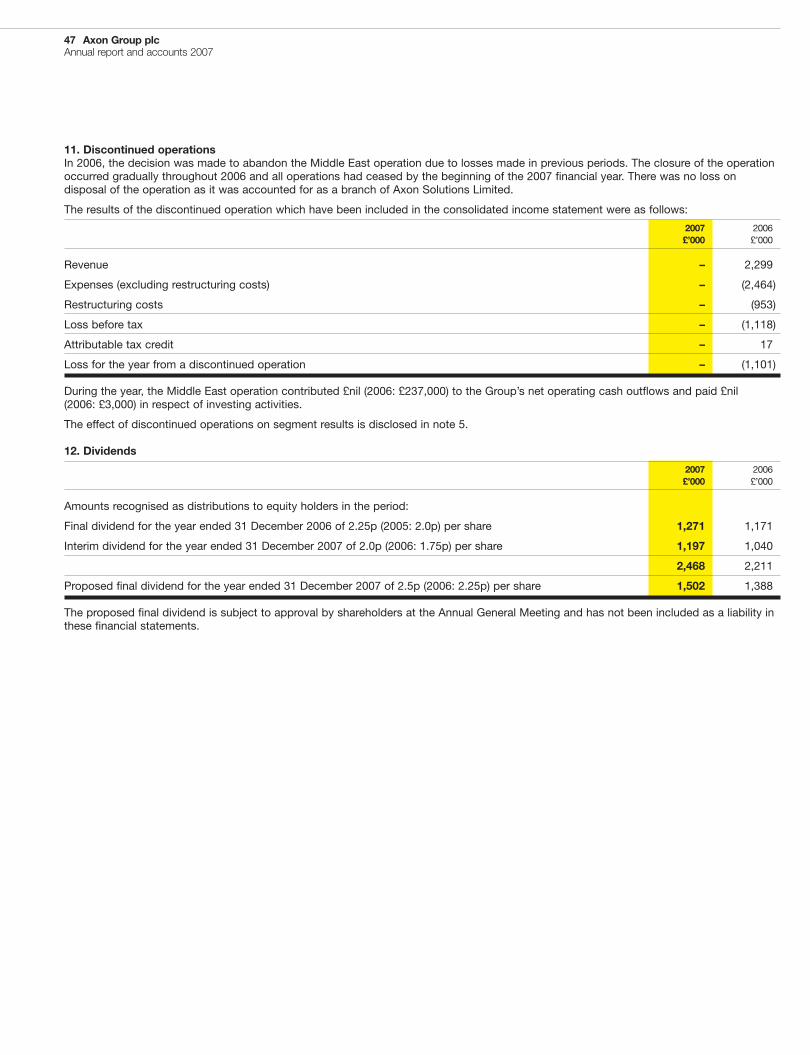
47 Axon Group plcAnnual report and accounts 2007
11. Discontinued operationsIn 2006, the decision was made to abandon the Middle East operation due to losses made in previous periods. The closure of the operationoccurred gradually throughout 2006 and all operations had ceased by the beginning of the 2007 financial year. There was no loss ondisposal of the operation as it was accounted for as a branch of Axon Solutions Limited.
The results of the discontinued operation which have been included in the consolidated income statement were as follows:
2007 2006£’000 £’000
Revenue – 2,299
Expenses (excluding restructuring costs) – (2,464)
Restructuring costs – (953)
Loss before tax – (1,118)
Attributable tax credit – 17
Loss for the year from a discontinued operation – (1,101)
During the year, the Middle East operation contributed £nil (2006: £237,000) to the Group’s net operating cash outflows and paid £nil(2006: £3,000) in respect of investing activities.
The effect of discontinued operations on segment results is disclosed in note 5.
12. Dividends
2007 2006£’000 £’000
Amounts recognised as distributions to equity holders in the period:
Final dividend for the year ended 31 December 2006 of 2.25p (2005: 2.0p) per share 1,271 1,171
Interim dividend for the year ended 31 December 2007 of 2.0p (2006: 1.75p) per share 1,197 1,040
2,468 2,211
Proposed final dividend for the year ended 31 December 2007 of 2.5p (2006: 2.25p) per share 1,502 1,388
The proposed final dividend is subject to approval by shareholders at the Annual General Meeting and has not been included as a liability inthese financial statements.
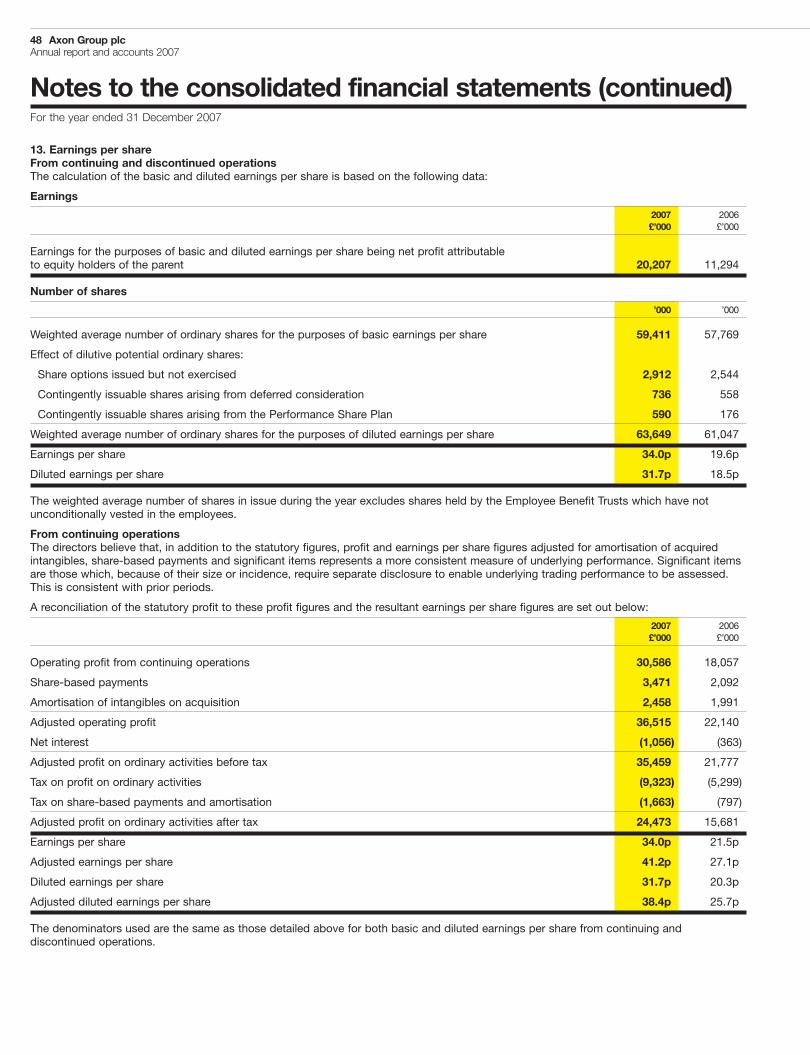
48 Axon Group plcAnnual report and accounts 2007
Notes to the consolidated financial statements (continued)For the year ended 31 December 2007
13. Earnings per shareFrom continuing and discontinued operationsThe calculation of the basic and diluted earnings per share is based on the following data:
Earnings
2007 2006£’000 £’000
Earnings for the purposes of basic and diluted earnings per share being net profit attributableto equity holders of the parent 20,207 11,294
Number of shares
’000 ’000
Weighted average number of ordinary shares for the purposes of basic earnings per share 59,411 57,769
Effect of dilutive potential ordinary shares:
Share options issued but not exercised 2,912 2,544
Contingently issuable shares arising from deferred consideration 736 558
Contingently issuable shares arising from the Performance Share Plan 590 176
Weighted average number of ordinary shares for the purposes of diluted earnings per share 63,649 61,047
Earnings per share 34.0p 19.6p
Diluted earnings per share 31.7p 18.5p
The weighted average number of shares in issue during the year excludes shares held by the Employee Benefit Trusts which have notunconditionally vested in the employees.
From continuing operationsThe directors believe that, in addition to the statutory figures, profit and earnings per share figures adjusted for amortisation of acquiredintangibles, share-based payments and significant items represents a more consistent measure of underlying performance. Significant itemsare those which, because of their size or incidence, require separate disclosure to enable underlying trading performance to be assessed.This is consistent with prior periods.
A reconciliation of the statutory profit to these profit figures and the resultant earnings per share figures are set out below:
2007 2006£’000 £’000
Operating profit from continuing operations 30,586 18,057
Share-based payments 3,471 2,092
Amortisation of intangibles on acquisition 2,458 1,991
Adjusted operating profit 36,515 22,140
Net interest (1,056) (363)
Adjusted profit on ordinary activities before tax 35,459 21,777
Tax on profit on ordinary activities (9,323) (5,299)
Tax on share-based payments and amortisation (1,663) (797)
Adjusted profit on ordinary activities after tax 24,473 15,681
Earnings per share 34.0p 21.5p
Adjusted earnings per share 41.2p 27.1p
Diluted earnings per share 31.7p 20.3p
Adjusted diluted earnings per share 38.4p 25.7p
The denominators used are the same as those detailed above for both basic and diluted earnings per share from continuing anddiscontinued operations.
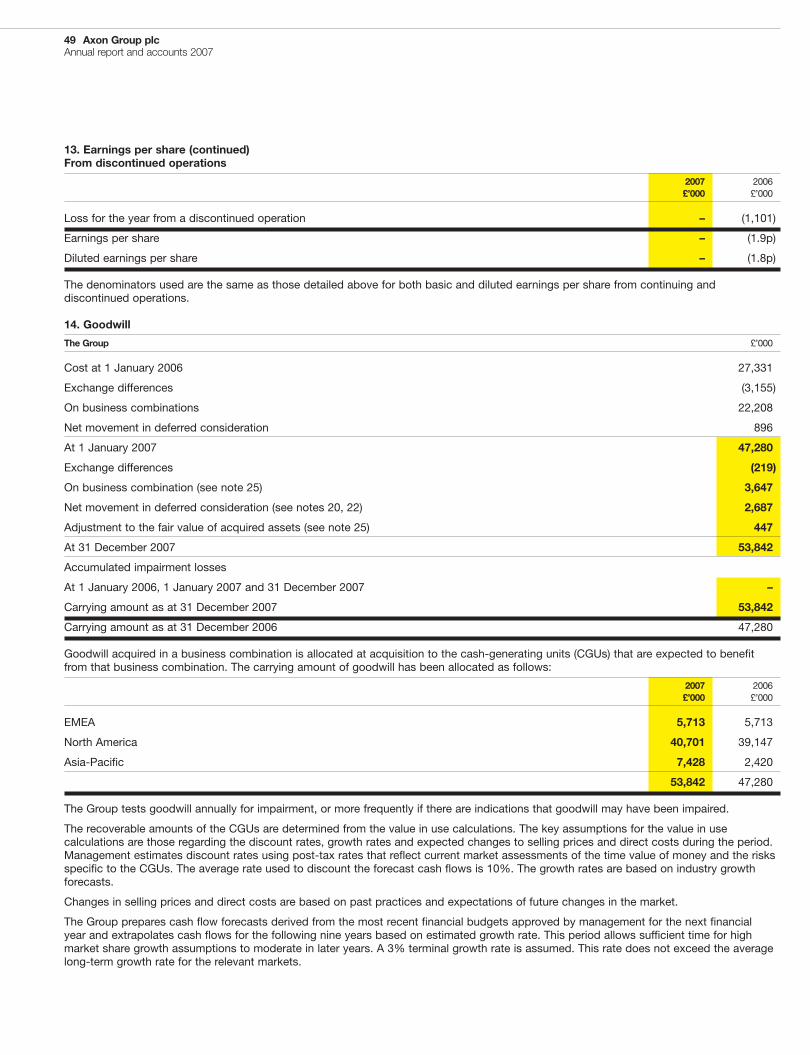
49 Axon Group plcAnnual report and accounts 2007
13. Earnings per share (continued)From discontinued operations
2007 2006£’000 £’000
Loss for the year from a discontinued operation – (1,101)
Earnings per share – (1.9p)
Diluted earnings per share – (1.8p)
The denominators used are the same as those detailed above for both basic and diluted earnings per share from continuing anddiscontinued operations.
14. Goodwill
The Group £’000
Cost at 1 January 2006 27,331
Exchange differences (3,155)
On business combinations 22,208
Net movement in deferred consideration 896
At 1 January 2007 47,280
Exchange differences (219)
On business combination (see note 25) 3,647
Net movement in deferred consideration (see notes 20, 22) 2,687
Adjustment to the fair value of acquired assets (see note 25) 447
At 31 December 2007 53,842
Accumulated impairment losses
At 1 January 2006, 1 January 2007 and 31 December 2007 –
Carrying amount as at 31 December 2007 53,842
Carrying amount as at 31 December 2006 47,280
Goodwill acquired in a business combination is allocated at acquisition to the cash-generating units (CGUs) that are expected to benefitfrom that business combination. The carrying amount of goodwill has been allocated as follows:
2007 2006£’000 £’000
EMEA 5,713 5,713
North America 40,701 39,147
Asia-Pacific 7,428 2,420
53,842 47,280
The Group tests goodwill annually for impairment, or more frequently if there are indications that goodwill may have been impaired.
The recoverable amounts of the CGUs are determined from the value in use calculations. The key assumptions for the value in usecalculations are those regarding the discount rates, growth rates and expected changes to selling prices and direct costs during the period.Management estimates discount rates using post-tax rates that reflect current market assessments of the time value of money and the risksspecific to the CGUs. The average rate used to discount the forecast cash flows is 10%. The growth rates are based on industry growthforecasts.
Changes in selling prices and direct costs are based on past practices and expectations of future changes in the market.
The Group prepares cash flow forecasts derived from the most recent financial budgets approved by management for the next financialyear and extrapolates cash flows for the following nine years based on estimated growth rate. This period allows sufficient time for highmarket share growth assumptions to moderate in later years. A 3% terminal growth rate is assumed. This rate does not exceed the averagelong-term growth rate for the relevant markets.
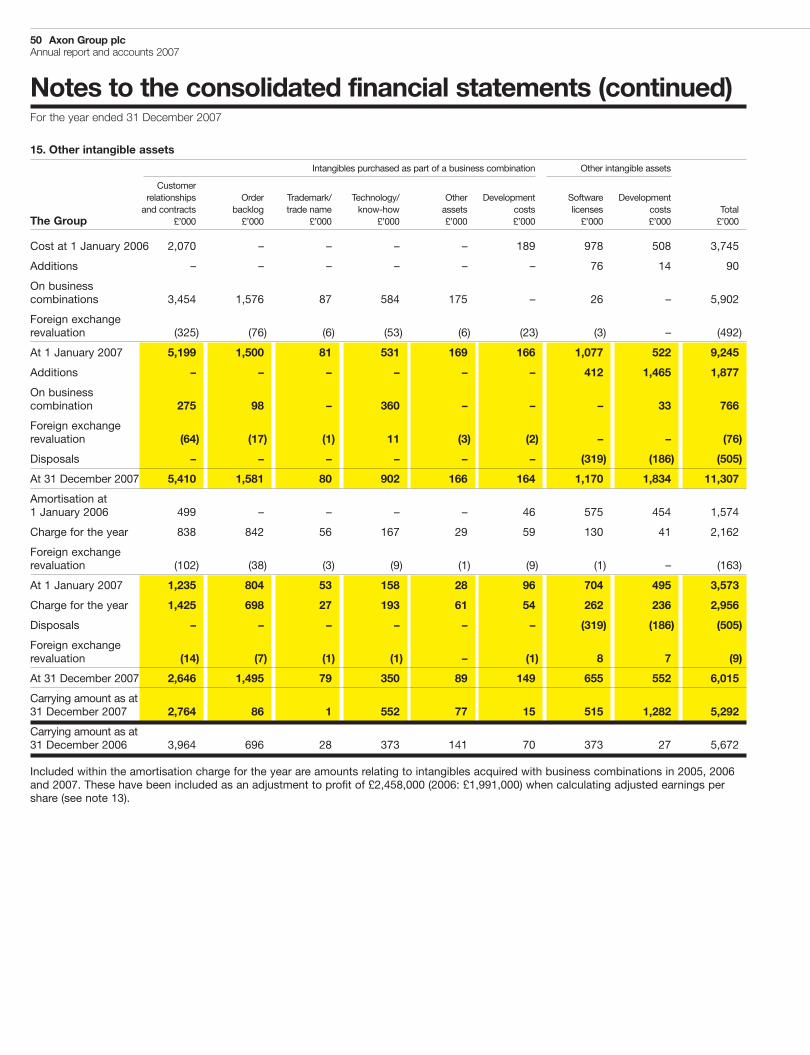
50 Axon Group plcAnnual report and accounts 2007
Notes to the consolidated financial statements (continued)For the year ended 31 December 2007
15. Other intangible assets
Intangibles purchased as part of a business combination Other intangible assets
Customerrelationships Order Trademark/ Technology/ Other Development Software Developmentand contracts backlog trade name know-how assets costs licenses costs Total
The Group £’000 £’000 £’000 £’000 £’000 £’000 £’000 £’000 £’000
Cost at 1 January 2006 2,070 – – – – 189 978 508 3,745
Additions – – – – – – 76 14 90
On businesscombinations 3,454 1,576 87 584 175 – 26 – 5,902
Foreign exchangerevaluation (325) (76) (6) (53) (6) (23) (3) – (492)
At 1 January 2007 5,199 1,500 81 531 169 166 1,077 522 9,245
Additions – – – – – – 412 1,465 1,877
On businesscombination 275 98 – 360 – – – 33 766
Foreign exchangerevaluation (64) (17) (1) 11 (3) (2) – – (76)
Disposals – – – – – – (319) (186) (505)
At 31 December 2007 5,410 1,581 80 902 166 164 1,170 1,834 11,307
Amortisation at1 January 2006 499 – – – – 46 575 454 1,574
Charge for the year 838 842 56 167 29 59 130 41 2,162
Foreign exchangerevaluation (102) (38) (3) (9) (1) (9) (1) – (163)
At 1 January 2007 1,235 804 53 158 28 96 704 495 3,573
Charge for the year 1,425 698 27 193 61 54 262 236 2,956
Disposals – – – – – – (319) (186) (505)
Foreign exchangerevaluation (14) (7) (1) (1) – (1) 8 7 (9)
At 31 December 2007 2,646 1,495 79 350 89 149 655 552 6,015
Carrying amount as at31 December 2007 2,764 86 1 552 77 15 515 1,282 5,292
Carrying amount as at31 December 2006 3,964 696 28 373 141 70 373 27 5,672
Included within the amortisation charge for the year are amounts relating to intangibles acquired with business combinations in 2005, 2006and 2007. These have been included as an adjustment to profit of £2,458,000 (2006: £1,991,000) when calculating adjusted earnings pershare (see note 13).
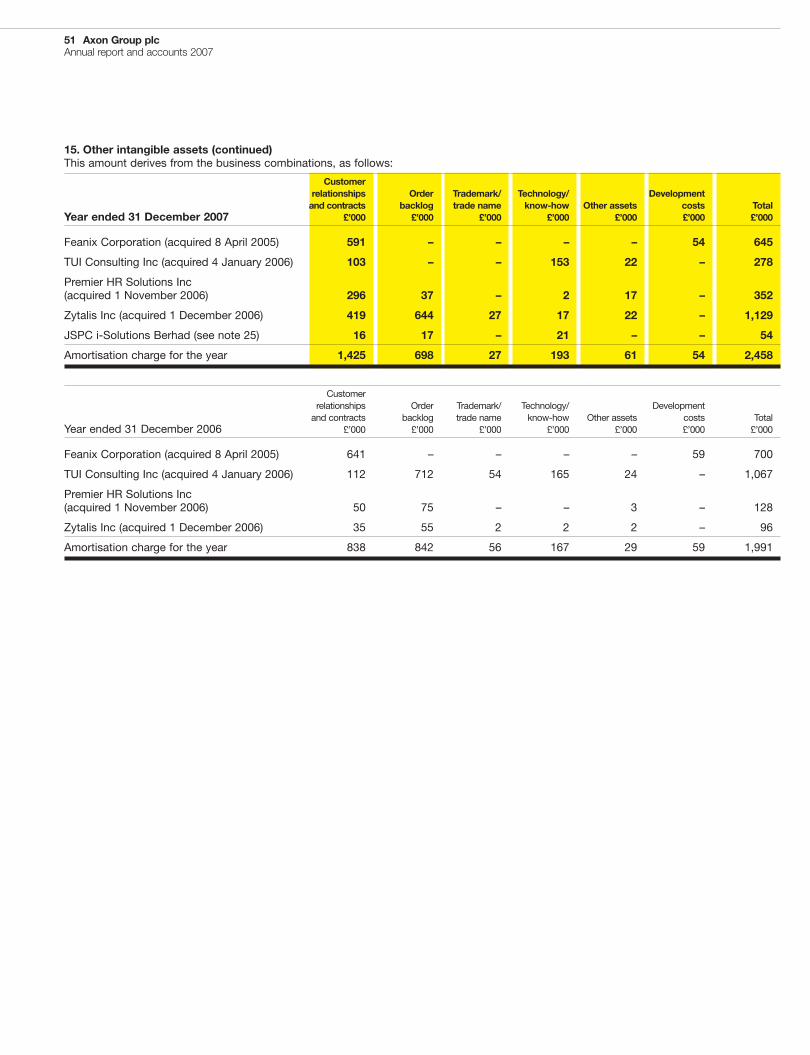
51 Axon Group plcAnnual report and accounts 2007
15. Other intangible assets (continued)This amount derives from the business combinations, as follows:
Customerrelationships Order Trademark/ Technology/ Developmentand contracts backlog trade name know-how Other assets costs Total
Year ended 31 December 2007 £’000 £’000 £’000 £’000 £’000 £’000 £’000
Feanix Corporation (acquired 8 April 2005) 591 – – – – 54 645
TUI Consulting Inc (acquired 4 January 2006) 103 – – 153 22 – 278
Premier HR Solutions Inc(acquired 1 November 2006) 296 37 – 2 17 – 352
Zytalis Inc (acquired 1 December 2006) 419 644 27 17 22 – 1,129
JSPC i-Solutions Berhad (see note 25) 16 17 – 21 – – 54
Amortisation charge for the year 1,425 698 27 193 61 54 2,458
Customerrelationships Order Trademark/ Technology/ Developmentand contracts backlog trade name know-how Other assets costs Total
Year ended 31 December 2006 £’000 £’000 £’000 £’000 £’000 £’000 £’000
Feanix Corporation (acquired 8 April 2005) 641 – – – – 59 700
TUI Consulting Inc (acquired 4 January 2006) 112 712 54 165 24 – 1,067
Premier HR Solutions Inc(acquired 1 November 2006) 50 75 – – 3 – 128
Zytalis Inc (acquired 1 December 2006) 35 55 2 2 2 – 96
Amortisation charge for the year 838 842 56 167 29 59 1,991
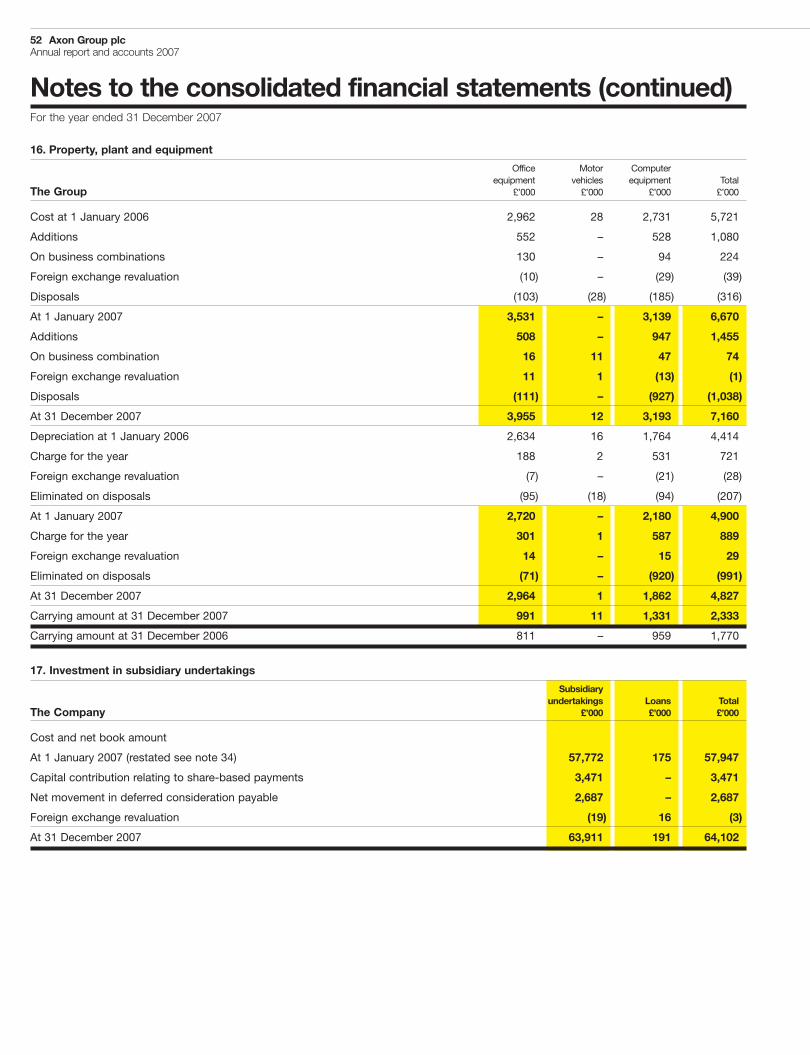
52 Axon Group plcAnnual report and accounts 2007
Notes to the consolidated financial statements (continued)For the year ended 31 December 2007
16. Property, plant and equipment
Office Motor Computerequipment vehicles equipment Total
The Group £’000 £’000 £’000 £’000
Cost at 1 January 2006 2,962 28 2,731 5,721
Additions 552 – 528 1,080
On business combinations 130 – 94 224
Foreign exchange revaluation (10) – (29) (39)
Disposals (103) (28) (185) (316)
At 1 January 2007 3,531 – 3,139 6,670
Additions 508 – 947 1,455
On business combination 16 11 47 74
Foreign exchange revaluation 11 1 (13) (1)
Disposals (111) – (927) (1,038)
At 31 December 2007 3,955 12 3,193 7,160
Depreciation at 1 January 2006 2,634 16 1,764 4,414
Charge for the year 188 2 531 721
Foreign exchange revaluation (7) – (21) (28)
Eliminated on disposals (95) (18) (94) (207)
At 1 January 2007 2,720 – 2,180 4,900
Charge for the year 301 1 587 889
Foreign exchange revaluation 14 – 15 29
Eliminated on disposals (71) – (920) (991)
At 31 December 2007 2,964 1 1,862 4,827
Carrying amount at 31 December 2007 991 11 1,331 2,333
Carrying amount at 31 December 2006 811 – 959 1,770
17. Investment in subsidiary undertakings
Subsidiaryundertakings Loans Total
The Company £’000 £’000 £’000
Cost and net book amount
At 1 January 2007 (restated see note 34) 57,772 175 57,947
Capital contribution relating to share-based payments 3,471 – 3,471
Net movement in deferred consideration payable 2,687 – 2,687
Foreign exchange revaluation (19) 16 (3)
At 31 December 2007 63,911 191 64,102
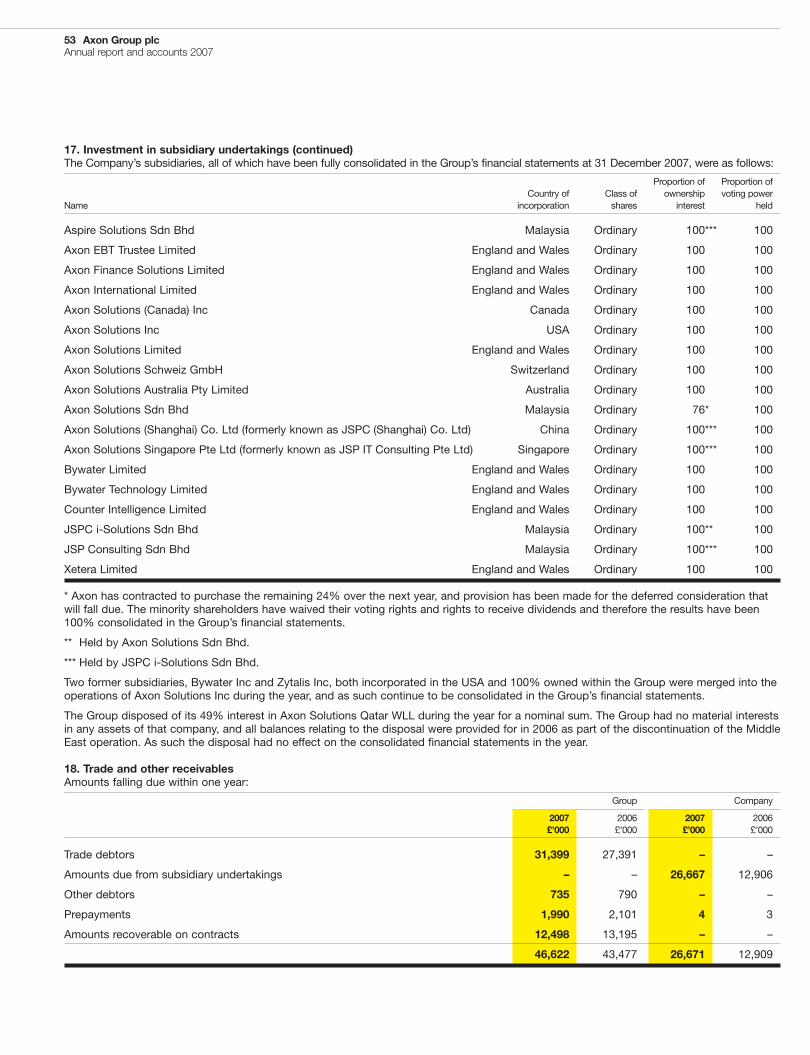
53 Axon Group plcAnnual report and accounts 2007
17. Investment in subsidiary undertakings (continued)The Company’s subsidiaries, all of which have been fully consolidated in the Group’s financial statements at 31 December 2007, were as follows:
Proportion of Proportion ofCountry of Class of ownership voting power
Name incorporation shares interest held
Aspire Solutions Sdn Bhd Malaysia Ordinary 100*** 100
Axon EBT Trustee Limited England and Wales Ordinary 100 100
Axon Finance Solutions Limited England and Wales Ordinary 100 100
Axon International Limited England and Wales Ordinary 100 100
Axon Solutions (Canada) Inc Canada Ordinary 100 100
Axon Solutions Inc USA Ordinary 100 100
Axon Solutions Limited England and Wales Ordinary 100 100
Axon Solutions Schweiz GmbH Switzerland Ordinary 100 100
Axon Solutions Australia Pty Limited Australia Ordinary 100 100
Axon Solutions Sdn Bhd Malaysia Ordinary 76* 100
Axon Solutions (Shanghai) Co. Ltd (formerly known as JSPC (Shanghai) Co. Ltd) China Ordinary 100*** 100
Axon Solutions Singapore Pte Ltd (formerly known as JSP IT Consulting Pte Ltd) Singapore Ordinary 100*** 100
Bywater Limited England and Wales Ordinary 100 100
Bywater Technology Limited England and Wales Ordinary 100 100
Counter Intelligence Limited England and Wales Ordinary 100 100
JSPC i-Solutions Sdn Bhd Malaysia Ordinary 100** 100
JSP Consulting Sdn Bhd Malaysia Ordinary 100*** 100
Xetera Limited England and Wales Ordinary 100 100
* Axon has contracted to purchase the remaining 24% over the next year, and provision has been made for the deferred consideration thatwill fall due. The minority shareholders have waived their voting rights and rights to receive dividends and therefore the results have been100% consolidated in the Group’s financial statements.
** Held by Axon Solutions Sdn Bhd.
*** Held by JSPC i-Solutions Sdn Bhd.
Two former subsidiaries, Bywater Inc and Zytalis Inc, both incorporated in the USA and 100% owned within the Group were merged into theoperations of Axon Solutions Inc during the year, and as such continue to be consolidated in the Group’s financial statements.
The Group disposed of its 49% interest in Axon Solutions Qatar WLL during the year for a nominal sum. The Group had no material interestsin any assets of that company, and all balances relating to the disposal were provided for in 2006 as part of the discontinuation of the MiddleEast operation. As such the disposal had no effect on the consolidated financial statements in the year.
18. Trade and other receivablesAmounts falling due within one year:
Group Company
2007 2006 2007 2006£’000 £’000 £’000 £’000
Trade debtors 31,399 27,391 – –
Amounts due from subsidiary undertakings – – 26,667 12,906
Other debtors 735 790 – –
Prepayments 1,990 2,101 4 3
Amounts recoverable on contracts 12,498 13,195 – –
46,622 43,477 26,671 12,909
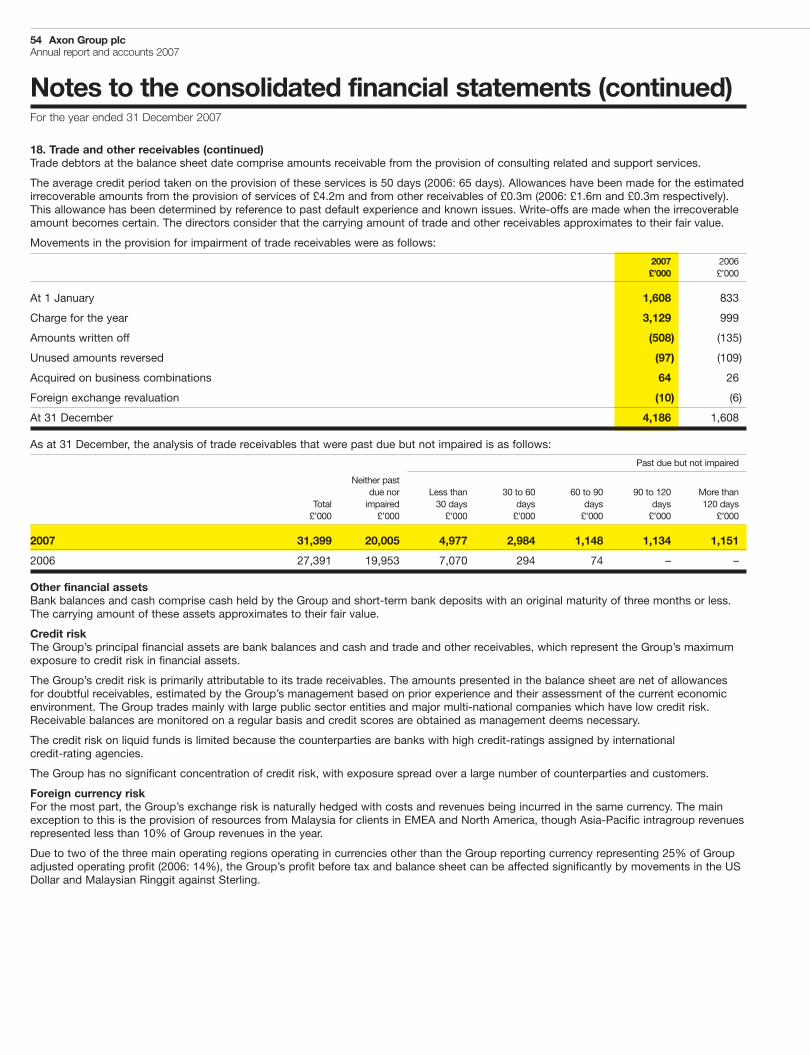
54 Axon Group plcAnnual report and accounts 2007
Notes to the consolidated financial statements (continued)For the year ended 31 December 2007
18. Trade and other receivables (continued)Trade debtors at the balance sheet date comprise amounts receivable from the provision of consulting related and support services.
The average credit period taken on the provision of these services is 50 days (2006: 65 days). Allowances have been made for the estimatedirrecoverable amounts from the provision of services of £4.2m and from other receivables of £0.3m (2006: £1.6m and £0.3m respectively).This allowance has been determined by reference to past default experience and known issues. Write-offs are made when the irrecoverableamount becomes certain. The directors consider that the carrying amount of trade and other receivables approximates to their fair value.
Movements in the provision for impairment of trade receivables were as follows:
2007 2006£’000 £’000
At 1 January 1,608 833
Charge for the year 3,129 999
Amounts written off (508) (135)
Unused amounts reversed (97) (109)
Acquired on business combinations 64 26
Foreign exchange revaluation (10) (6)
At 31 December 4,186 1,608
As at 31 December, the analysis of trade receivables that were past due but not impaired is as follows:
Past due but not impaired
Neither pastdue nor Less than 30 to 60 60 to 90 90 to 120 More than
Total impaired 30 days days days days 120 days£’000 £’000 £’000 £’000 £’000 £’000 £’000
2007 31,399 20,005 4,977 2,984 1,148 1,134 1,151
2006 27,391 19,953 7,070 294 74 – –
Other financial assetsBank balances and cash comprise cash held by the Group and short-term bank deposits with an original maturity of three months or less.The carrying amount of these assets approximates to their fair value.
Credit riskThe Group’s principal financial assets are bank balances and cash and trade and other receivables, which represent the Group’s maximumexposure to credit risk in financial assets.
The Group’s credit risk is primarily attributable to its trade receivables. The amounts presented in the balance sheet are net of allowancesfor doubtful receivables, estimated by the Group’s management based on prior experience and their assessment of the current economicenvironment. The Group trades mainly with large public sector entities and major multi-national companies which have low credit risk.Receivable balances are monitored on a regular basis and credit scores are obtained as management deems necessary.
The credit risk on liquid funds is limited because the counterparties are banks with high credit-ratings assigned by internationalcredit-rating agencies.
The Group has no significant concentration of credit risk, with exposure spread over a large number of counterparties and customers.
Foreign currency riskFor the most part, the Group’s exchange risk is naturally hedged with costs and revenues being incurred in the same currency. The mainexception to this is the provision of resources from Malaysia for clients in EMEA and North America, though Asia-Pacific intragroup revenuesrepresented less than 10% of Group revenues in the year.
Due to two of the three main operating regions operating in currencies other than the Group reporting currency representing 25% of Groupadjusted operating profit (2006: 14%), the Group’s profit before tax and balance sheet can be affected significantly by movements in the USDollar and Malaysian Ringgit against Sterling.
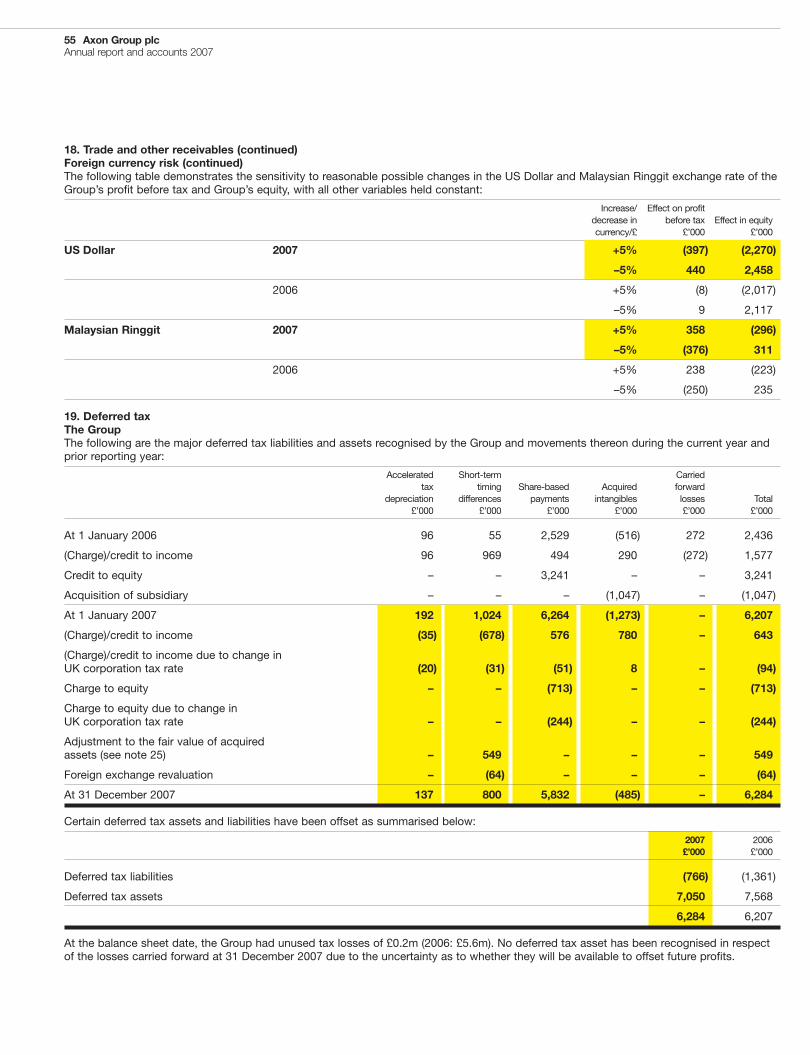
55 Axon Group plcAnnual report and accounts 2007
18. Trade and other receivables (continued)Foreign currency risk (continued)The following table demonstrates the sensitivity to reasonable possible changes in the US Dollar and Malaysian Ringgit exchange rate of theGroup’s profit before tax and Group’s equity, with all other variables held constant:
Increase/ Effect on profitdecrease in before tax Effect in equitycurrency/£ £’000 £’000
US Dollar 2007 +5% (397) (2,270)
–5% 440 2,458
2006 +5% (8) (2,017)
–5% 9 2,117
Malaysian Ringgit 2007 +5% 358 (296)
–5% (376) 311
2006 +5% 238 (223)
–5% (250) 235
19. Deferred taxThe GroupThe following are the major deferred tax liabilities and assets recognised by the Group and movements thereon during the current year andprior reporting year:
Accelerated Short-term Carriedtax timing Share-based Acquired forward
depreciation differences payments intangibles losses Total£’000 £’000 £’000 £’000 £’000 £’000
At 1 January 2006 96 55 2,529 (516) 272 2,436
(Charge)/credit to income 96 969 494 290 (272) 1,577
Credit to equity – – 3,241 – – 3,241
Acquisition of subsidiary – – – (1,047) – (1,047)
At 1 January 2007 192 1,024 6,264 (1,273) – 6,207
(Charge)/credit to income (35) (678) 576 780 – 643
(Charge)/credit to income due to change inUK corporation tax rate (20) (31) (51) 8 – (94)
Charge to equity – – (713) – – (713)
Charge to equity due to change inUK corporation tax rate – – (244) – – (244)
Adjustment to the fair value of acquiredassets (see note 25) – 549 – – – 549
Foreign exchange revaluation – (64) – – – (64)
At 31 December 2007 137 800 5,832 (485) – 6,284
Certain deferred tax assets and liabilities have been offset as summarised below:
2007 2006£’000 £’000
Deferred tax liabilities (766) (1,361)
Deferred tax assets 7,050 7,568
6,284 6,207
At the balance sheet date, the Group had unused tax losses of £0.2m (2006: £5.6m). No deferred tax asset has been recognised in respectof the losses carried forward at 31 December 2007 due to the uncertainty as to whether they will be available to offset future profits.
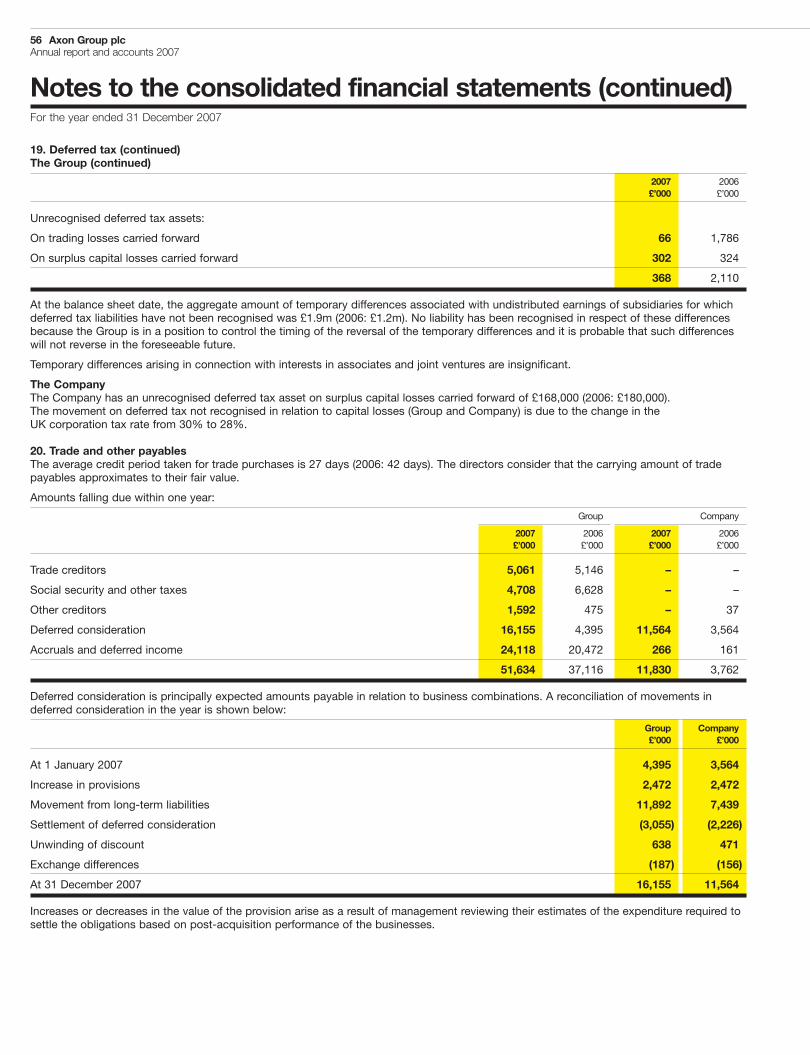
56 Axon Group plcAnnual report and accounts 2007
Notes to the consolidated financial statements (continued)For the year ended 31 December 2007
19. Deferred tax (continued)The Group (continued)
2007 2006£’000 £’000
Unrecognised deferred tax assets:
On trading losses carried forward 66 1,786
On surplus capital losses carried forward 302 324
368 2,110
At the balance sheet date, the aggregate amount of temporary differences associated with undistributed earnings of subsidiaries for whichdeferred tax liabilities have not been recognised was £1.9m (2006: £1.2m). No liability has been recognised in respect of these differencesbecause the Group is in a position to control the timing of the reversal of the temporary differences and it is probable that such differenceswill not reverse in the foreseeable future.
Temporary differences arising in connection with interests in associates and joint ventures are insignificant.
The CompanyThe Company has an unrecognised deferred tax asset on surplus capital losses carried forward of £168,000 (2006: £180,000).The movement on deferred tax not recognised in relation to capital losses (Group and Company) is due to the change in theUK corporation tax rate from 30% to 28%.
20. Trade and other payablesThe average credit period taken for trade purchases is 27 days (2006: 42 days). The directors consider that the carrying amount of tradepayables approximates to their fair value.
Amounts falling due within one year:
Group Company
2007 2006 2007 2006£’000 £’000 £’000 £’000
Trade creditors 5,061 5,146 – –
Social security and other taxes 4,708 6,628 – –
Other creditors 1,592 475 – 37
Deferred consideration 16,155 4,395 11,564 3,564
Accruals and deferred income 24,118 20,472 266 161
51,634 37,116 11,830 3,762
Deferred consideration is principally expected amounts payable in relation to business combinations. A reconciliation of movements indeferred consideration in the year is shown below:
Group Company£’000 £’000
At 1 January 2007 4,395 3,564
Increase in provisions 2,472 2,472
Movement from long-term liabilities 11,892 7,439
Settlement of deferred consideration (3,055) (2,226)
Unwinding of discount 638 471
Exchange differences (187) (156)
At 31 December 2007 16,155 11,564
Increases or decreases in the value of the provision arise as a result of management reviewing their estimates of the expenditure required tosettle the obligations based on post-acquisition performance of the businesses.
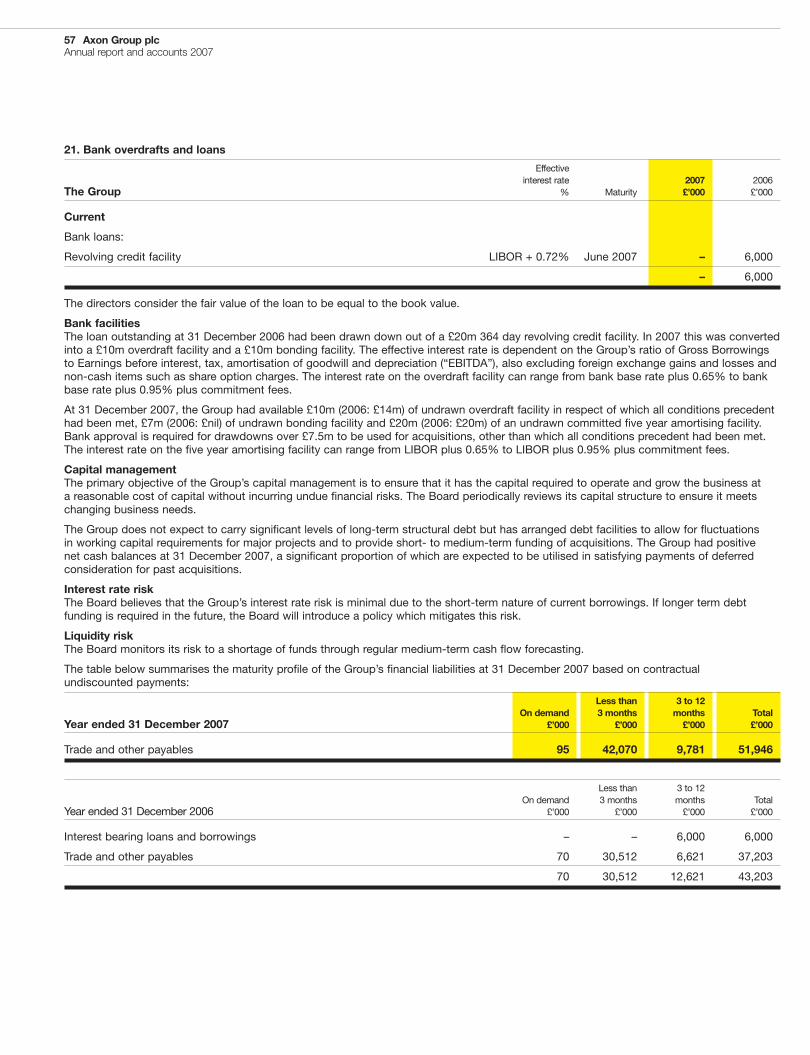
57 Axon Group plcAnnual report and accounts 2007
21. Bank overdrafts and loans
Effectiveinterest rate 2007 2006
The Group % Maturity £’000 £’000
Current
Bank loans:
Revolving credit facility LIBOR + 0.72% June 2007 – 6,000
– 6,000
The directors consider the fair value of the loan to be equal to the book value.
Bank facilitiesThe loan outstanding at 31 December 2006 had been drawn down out of a £20m 364 day revolving credit facility. In 2007 this was convertedinto a £10m overdraft facility and a £10m bonding facility. The effective interest rate is dependent on the Group’s ratio of Gross Borrowingsto Earnings before interest, tax, amortisation of goodwill and depreciation (“EBITDA”), also excluding foreign exchange gains and losses andnon-cash items such as share option charges. The interest rate on the overdraft facility can range from bank base rate plus 0.65% to bankbase rate plus 0.95% plus commitment fees.
At 31 December 2007, the Group had available £10m (2006: £14m) of undrawn overdraft facility in respect of which all conditions precedenthad been met, £7m (2006: £nil) of undrawn bonding facility and £20m (2006: £20m) of an undrawn committed five year amortising facility.Bank approval is required for drawdowns over £7.5m to be used for acquisitions, other than which all conditions precedent had been met.The interest rate on the five year amortising facility can range from LIBOR plus 0.65% to LIBOR plus 0.95% plus commitment fees.
Capital managementThe primary objective of the Group’s capital management is to ensure that it has the capital required to operate and grow the business ata reasonable cost of capital without incurring undue financial risks. The Board periodically reviews its capital structure to ensure it meetschanging business needs.
The Group does not expect to carry significant levels of long-term structural debt but has arranged debt facilities to allow for fluctuationsin working capital requirements for major projects and to provide short- to medium-term funding of acquisitions. The Group had positivenet cash balances at 31 December 2007, a significant proportion of which are expected to be utilised in satisfying payments of deferredconsideration for past acquisitions.
Interest rate riskThe Board believes that the Group’s interest rate risk is minimal due to the short-term nature of current borrowings. If longer term debtfunding is required in the future, the Board will introduce a policy which mitigates this risk.
Liquidity riskThe Board monitors its risk to a shortage of funds through regular medium-term cash flow forecasting.
The table below summarises the maturity profile of the Group’s financial liabilities at 31 December 2007 based on contractualundiscounted payments:
Less than 3 to 12On demand 3 months months Total
Year ended 31 December 2007 £’000 £’000 £’000 £’000
Trade and other payables 95 42,070 9,781 51,946
Less than 3 to 12On demand 3 months months Total
Year ended 31 December 2006 £’000 £’000 £’000 £’000
Interest bearing loans and borrowings – – 6,000 6,000
Trade and other payables 70 30,512 6,621 37,203
70 30,512 12,621 43,203
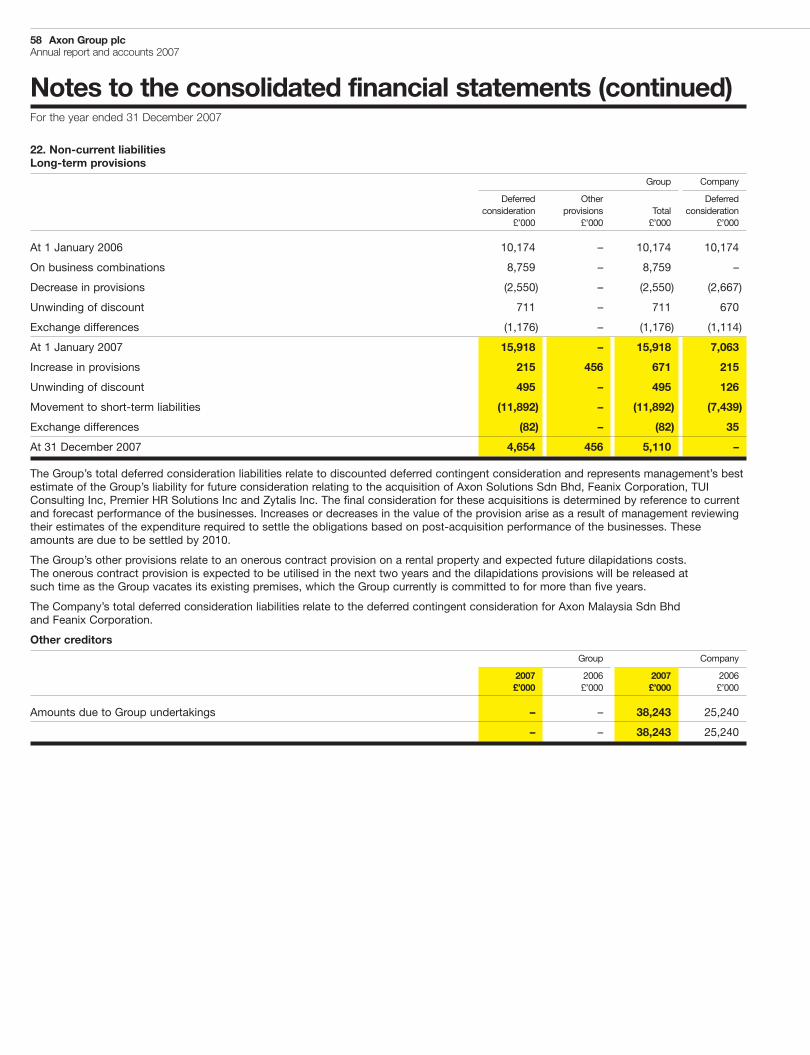
58 Axon Group plcAnnual report and accounts 2007
Notes to the consolidated financial statements (continued)For the year ended 31 December 2007
22. Non-current liabilitiesLong-term provisions
Group Company
Deferred Other Deferredconsideration provisions Total consideration
£’000 £’000 £’000 £’000
At 1 January 2006 10,174 – 10,174 10,174
On business combinations 8,759 – 8,759 –
Decrease in provisions (2,550) – (2,550) (2,667)
Unwinding of discount 711 – 711 670
Exchange differences (1,176) – (1,176) (1,114)
At 1 January 2007 15,918 – 15,918 7,063
Increase in provisions 215 456 671 215
Unwinding of discount 495 – 495 126
Movement to short-term liabilities (11,892) – (11,892) (7,439)
Exchange differences (82) – (82) 35
At 31 December 2007 4,654 456 5,110 –
The Group’s total deferred consideration liabilities relate to discounted deferred contingent consideration and represents management’s bestestimate of the Group’s liability for future consideration relating to the acquisition of Axon Solutions Sdn Bhd, Feanix Corporation, TUIConsulting Inc, Premier HR Solutions Inc and Zytalis Inc. The final consideration for these acquisitions is determined by reference to currentand forecast performance of the businesses. Increases or decreases in the value of the provision arise as a result of management reviewingtheir estimates of the expenditure required to settle the obligations based on post-acquisition performance of the businesses. Theseamounts are due to be settled by 2010.
The Group’s other provisions relate to an onerous contract provision on a rental property and expected future dilapidations costs.The onerous contract provision is expected to be utilised in the next two years and the dilapidations provisions will be released atsuch time as the Group vacates its existing premises, which the Group currently is committed to for more than five years.
The Company’s total deferred consideration liabilities relate to the deferred contingent consideration for Axon Malaysia Sdn Bhdand Feanix Corporation.
Other creditors
Group Company
2007 2006 2007 2006£’000 £’000 £’000 £’000
Amounts due to Group undertakings – – 38,243 25,240
– – 38,243 25,240
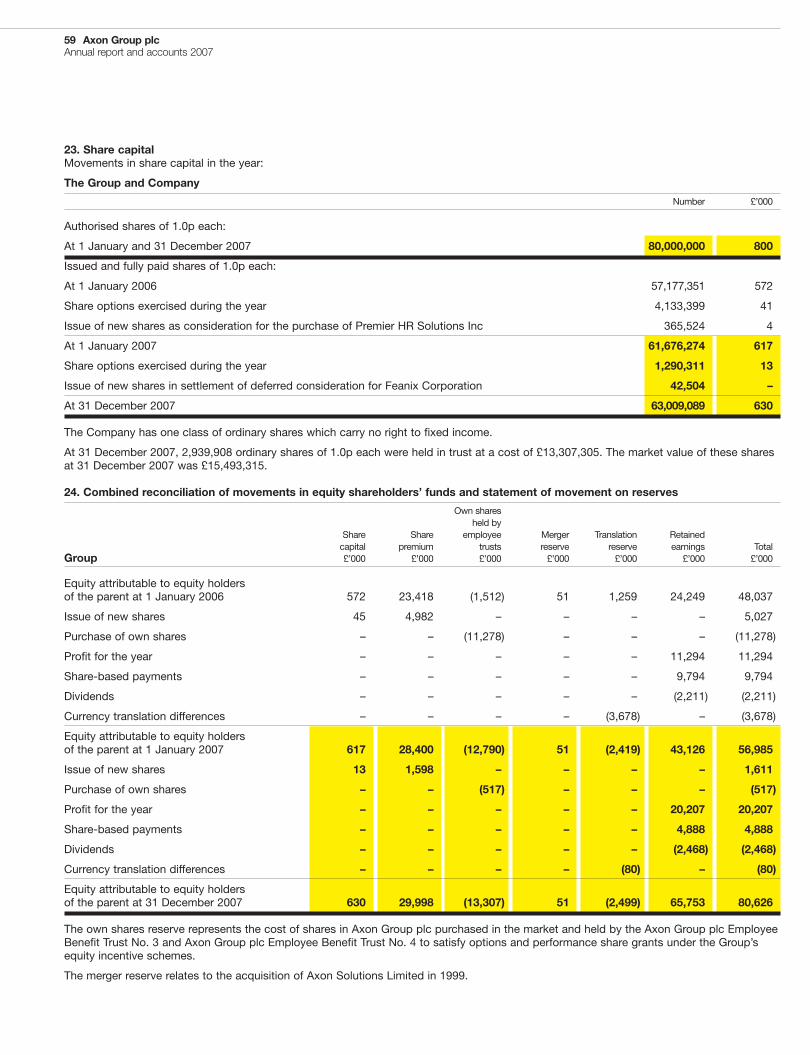
59 Axon Group plcAnnual report and accounts 2007
23. Share capitalMovements in share capital in the year:
The Group and Company
Number £’000
Authorised shares of 1.0p each:
At 1 January and 31 December 2007 80,000,000 800
Issued and fully paid shares of 1.0p each:
At 1 January 2006 57,177,351 572
Share options exercised during the year 4,133,399 41
Issue of new shares as consideration for the purchase of Premier HR Solutions Inc 365,524 4
At 1 January 2007 61,676,274 617
Share options exercised during the year 1,290,311 13
Issue of new shares in settlement of deferred consideration for Feanix Corporation 42,504 –
At 31 December 2007 63,009,089 630
The Company has one class of ordinary shares which carry no right to fixed income.
At 31 December 2007, 2,939,908 ordinary shares of 1.0p each were held in trust at a cost of £13,307,305. The market value of these sharesat 31 December 2007 was £15,493,315.
24. Combined reconciliation of movements in equity shareholders’ funds and statement of movement on reserves
Own sharesheld by
Share Share employee Merger Translation Retainedcapital premium trusts reserve reserve earnings Total
Group £’000 £’000 £’000 £’000 £’000 £’000 £’000
Equity attributable to equity holdersof the parent at 1 January 2006 572 23,418 (1,512) 51 1,259 24,249 48,037
Issue of new shares 45 4,982 – – – – 5,027
Purchase of own shares – – (11,278) – – – (11,278)
Profit for the year – – – – – 11,294 11,294
Share-based payments – – – – – 9,794 9,794
Dividends – – – – – (2,211) (2,211)
Currency translation differences – – – – (3,678) – (3,678)
Equity attributable to equity holdersof the parent at 1 January 2007 617 28,400 (12,790) 51 (2,419) 43,126 56,985
Issue of new shares 13 1,598 – – – – 1,611
Purchase of own shares – – (517) – – – (517)
Profit for the year – – – – – 20,207 20,207
Share-based payments – – – – – 4,888 4,888
Dividends – – – – – (2,468) (2,468)
Currency translation differences – – – – (80) – (80)
Equity attributable to equity holdersof the parent at 31 December 2007 630 29,998 (13,307) 51 (2,499) 65,753 80,626
The own shares reserve represents the cost of shares in Axon Group plc purchased in the market and held by the Axon Group plc EmployeeBenefit Trust No. 3 and Axon Group plc Employee Benefit Trust No. 4 to satisfy options and performance share grants under the Group’sequity incentive schemes.
The merger reserve relates to the acquisition of Axon Solutions Limited in 1999.
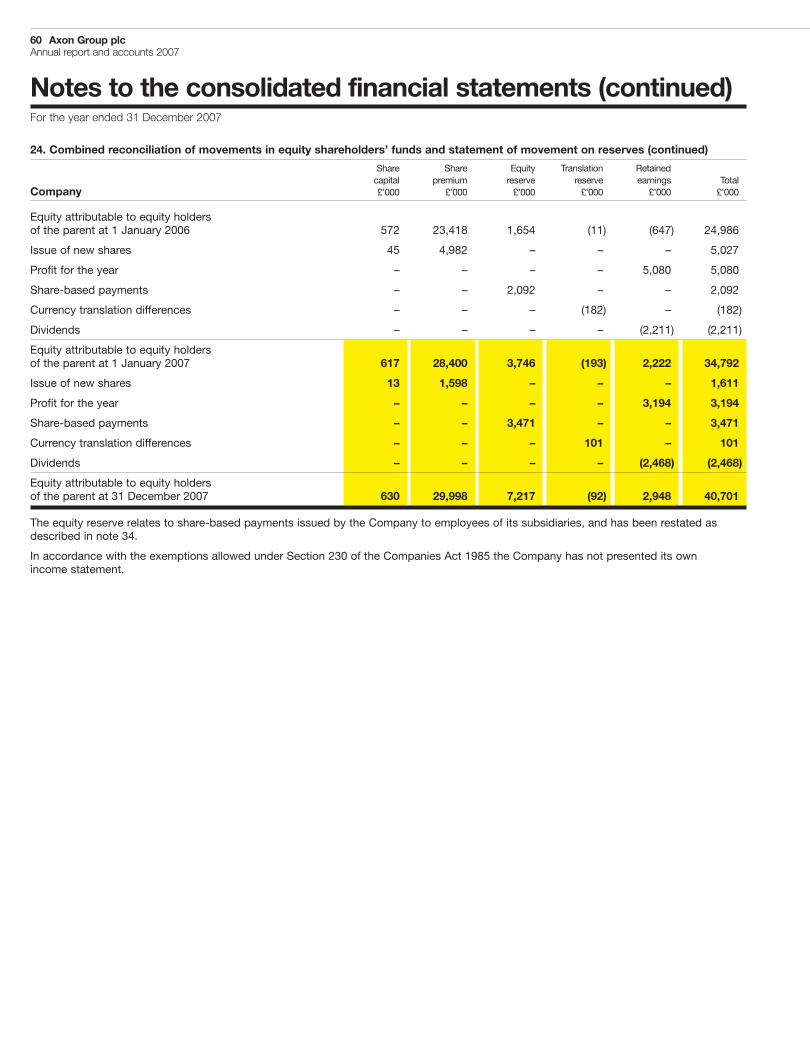
60 Axon Group plcAnnual report and accounts 2007
Notes to the consolidated financial statements (continued)For the year ended 31 December 2007
24. Combined reconciliation of movements in equity shareholders’ funds and statement of movement on reserves (continued)
Share Share Equity Translation Retainedcapital premium reserve reserve earnings Total
Company £’000 £’000 £’000 £’000 £’000 £’000
Equity attributable to equity holdersof the parent at 1 January 2006 572 23,418 1,654 (11) (647) 24,986
Issue of new shares 45 4,982 – – – 5,027
Profit for the year – – – – 5,080 5,080
Share-based payments – – 2,092 – – 2,092
Currency translation differences – – – (182) – (182)
Dividends – – – – (2,211) (2,211)
Equity attributable to equity holdersof the parent at 1 January 2007 617 28,400 3,746 (193) 2,222 34,792
Issue of new shares 13 1,598 – – – 1,611
Profit for the year – – – – 3,194 3,194
Share-based payments – – 3,471 – – 3,471
Currency translation differences – – – 101 – 101
Dividends – – – – (2,468) (2,468)
Equity attributable to equity holdersof the parent at 31 December 2007 630 29,998 7,217 (92) 2,948 40,701
The equity reserve relates to share-based payments issued by the Company to employees of its subsidiaries, and has been restated asdescribed in note 34.
In accordance with the exemptions allowed under Section 230 of the Companies Act 1985 the Company has not presented its ownincome statement.
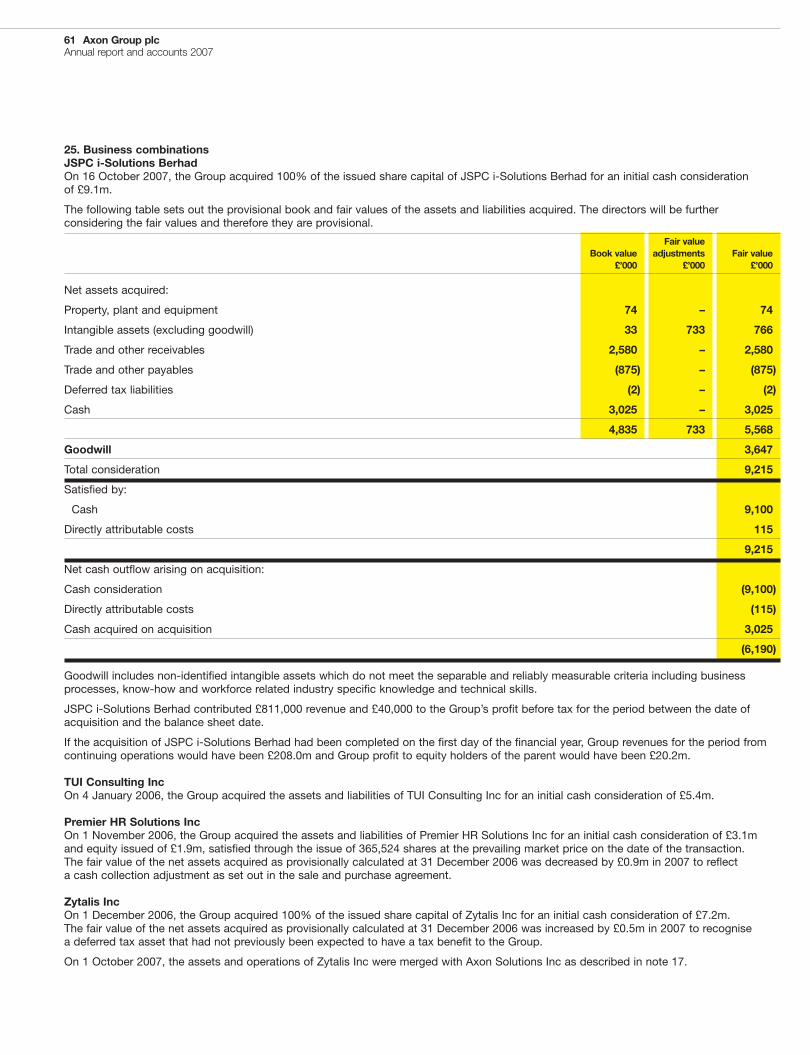
61 Axon Group plcAnnual report and accounts 2007
25. Business combinationsJSPC i-Solutions BerhadOn 16 October 2007, the Group acquired 100% of the issued share capital of JSPC i-Solutions Berhad for an initial cash considerationof £9.1m.
The following table sets out the provisional book and fair values of the assets and liabilities acquired. The directors will be furtherconsidering the fair values and therefore they are provisional.
Fair valueBook value adjustments Fair value
£’000 £’000 £’000
Net assets acquired:
Property, plant and equipment 74 – 74
Intangible assets (excluding goodwill) 33 733 766
Trade and other receivables 2,580 – 2,580
Trade and other payables (875) – (875)
Deferred tax liabilities (2) – (2)
Cash 3,025 – 3,025
4,835 733 5,568
Goodwill 3,647
Total consideration 9,215
Satisfied by:
Cash 9,100
Directly attributable costs 115
9,215
Net cash outflow arising on acquisition:
Cash consideration (9,100)
Directly attributable costs (115)
Cash acquired on acquisition 3,025
(6,190)
Goodwill includes non-identified intangible assets which do not meet the separable and reliably measurable criteria including businessprocesses, know-how and workforce related industry specific knowledge and technical skills.
JSPC i-Solutions Berhad contributed £811,000 revenue and £40,000 to the Group’s profit before tax for the period between the date ofacquisition and the balance sheet date.
If the acquisition of JSPC i-Solutions Berhad had been completed on the first day of the financial year, Group revenues for the period fromcontinuing operations would have been £208.0m and Group profit to equity holders of the parent would have been £20.2m.
TUI Consulting IncOn 4 January 2006, the Group acquired the assets and liabilities of TUI Consulting Inc for an initial cash consideration of £5.4m.
Premier HR Solutions IncOn 1 November 2006, the Group acquired the assets and liabilities of Premier HR Solutions Inc for an initial cash consideration of £3.1mand equity issued of £1.9m, satisfied through the issue of 365,524 shares at the prevailing market price on the date of the transaction.The fair value of the net assets acquired as provisionally calculated at 31 December 2006 was decreased by £0.9m in 2007 to reflecta cash collection adjustment as set out in the sale and purchase agreement.
Zytalis IncOn 1 December 2006, the Group acquired 100% of the issued share capital of Zytalis Inc for an initial cash consideration of £7.2m.The fair value of the net assets acquired as provisionally calculated at 31 December 2006 was increased by £0.5m in 2007 to recognisea deferred tax asset that had not previously been expected to have a tax benefit to the Group.
On 1 October 2007, the assets and operations of Zytalis Inc were merged with Axon Solutions Inc as described in note 17.
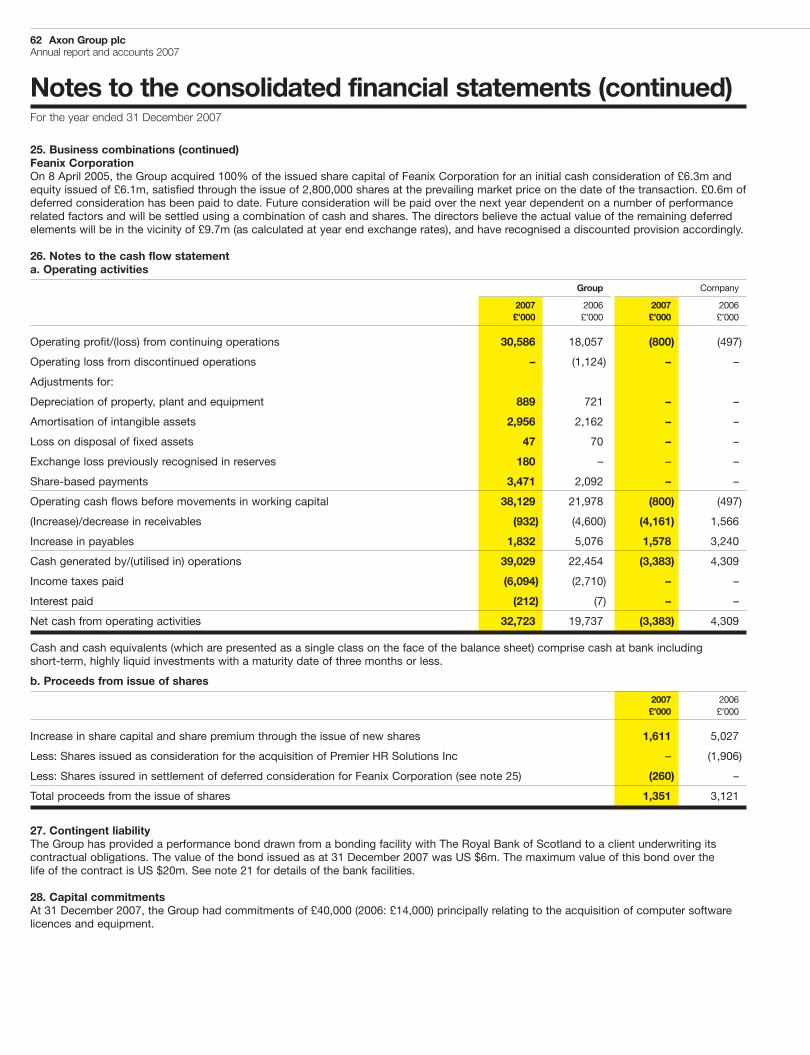
62 Axon Group plcAnnual report and accounts 2007
Notes to the consolidated financial statements (continued)For the year ended 31 December 2007
25. Business combinations (continued)Feanix CorporationOn 8 April 2005, the Group acquired 100% of the issued share capital of Feanix Corporation for an initial cash consideration of £6.3m andequity issued of £6.1m, satisfied through the issue of 2,800,000 shares at the prevailing market price on the date of the transaction. £0.6m ofdeferred consideration has been paid to date. Future consideration will be paid over the next year dependent on a number of performancerelated factors and will be settled using a combination of cash and shares. The directors believe the actual value of the remaining deferredelements will be in the vicinity of £9.7m (as calculated at year end exchange rates), and have recognised a discounted provision accordingly.
26. Notes to the cash flow statementa. Operating activities
Group Company
2007 2006 2007 2006£’000 £’000 £’000 £’000
Operating profit/(loss) from continuing operations 30,586 18,057 (800) (497)
Operating loss from discontinued operations – (1,124) – –
Adjustments for:
Depreciation of property, plant and equipment 889 721 – –
Amortisation of intangible assets 2,956 2,162 – –
Loss on disposal of fixed assets 47 70 – –
Exchange loss previously recognised in reserves 180 – – –
Share-based payments 3,471 2,092 – –
Operating cash flows before movements in working capital 38,129 21,978 (800) (497)
(Increase)/decrease in receivables (932) (4,600) (4,161) 1,566
Increase in payables 1,832 5,076 1,578 3,240
Cash generated by/(utilised in) operations 39,029 22,454 (3,383) 4,309
Income taxes paid (6,094) (2,710) – –
Interest paid (212) (7) – –
Net cash from operating activities 32,723 19,737 (3,383) 4,309
Cash and cash equivalents (which are presented as a single class on the face of the balance sheet) comprise cash at bank includingshort-term, highly liquid investments with a maturity date of three months or less.
b. Proceeds from issue of shares
2007 2006£’000 £’000
Increase in share capital and share premium through the issue of new shares 1,611 5,027
Less: Shares issued as consideration for the acquisition of Premier HR Solutions Inc – (1,906)
Less: Shares issured in settlement of deferred consideration for Feanix Corporation (see note 25) (260) –
Total proceeds from the issue of shares 1,351 3,121
27. Contingent liabilityThe Group has provided a performance bond drawn from a bonding facility with The Royal Bank of Scotland to a client underwriting itscontractual obligations. The value of the bond issued as at 31 December 2007 was US $6m. The maximum value of this bond over thelife of the contract is US $20m. See note 21 for details of the bank facilities.
28. Capital commitmentsAt 31 December 2007, the Group had commitments of £40,000 (2006: £14,000) principally relating to the acquisition of computer softwarelicences and equipment.
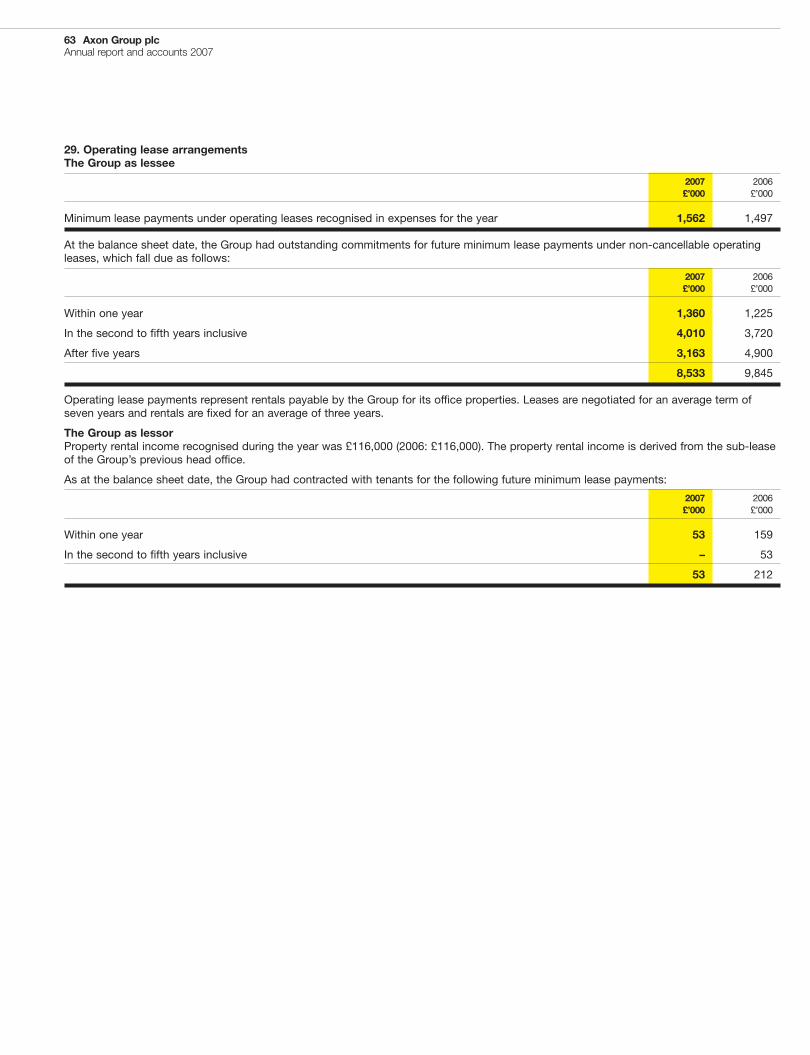
63 Axon Group plcAnnual report and accounts 2007
29. Operating lease arrangementsThe Group as lessee
2007 2006£’000 £’000
Minimum lease payments under operating leases recognised in expenses for the year 1,562 1,497
At the balance sheet date, the Group had outstanding commitments for future minimum lease payments under non-cancellable operatingleases, which fall due as follows:
2007 2006£’000 £’000
Within one year 1,360 1,225
In the second to fifth years inclusive 4,010 3,720
After five years 3,163 4,900
8,533 9,845
Operating lease payments represent rentals payable by the Group for its office properties. Leases are negotiated for an average term ofseven years and rentals are fixed for an average of three years.
The Group as lessorProperty rental income recognised during the year was £116,000 (2006: £116,000). The property rental income is derived from the sub-leaseof the Group’s previous head office.
As at the balance sheet date, the Group had contracted with tenants for the following future minimum lease payments:
2007 2006£’000 £’000
Within one year 53 159
In the second to fifth years inclusive – 53
53 212
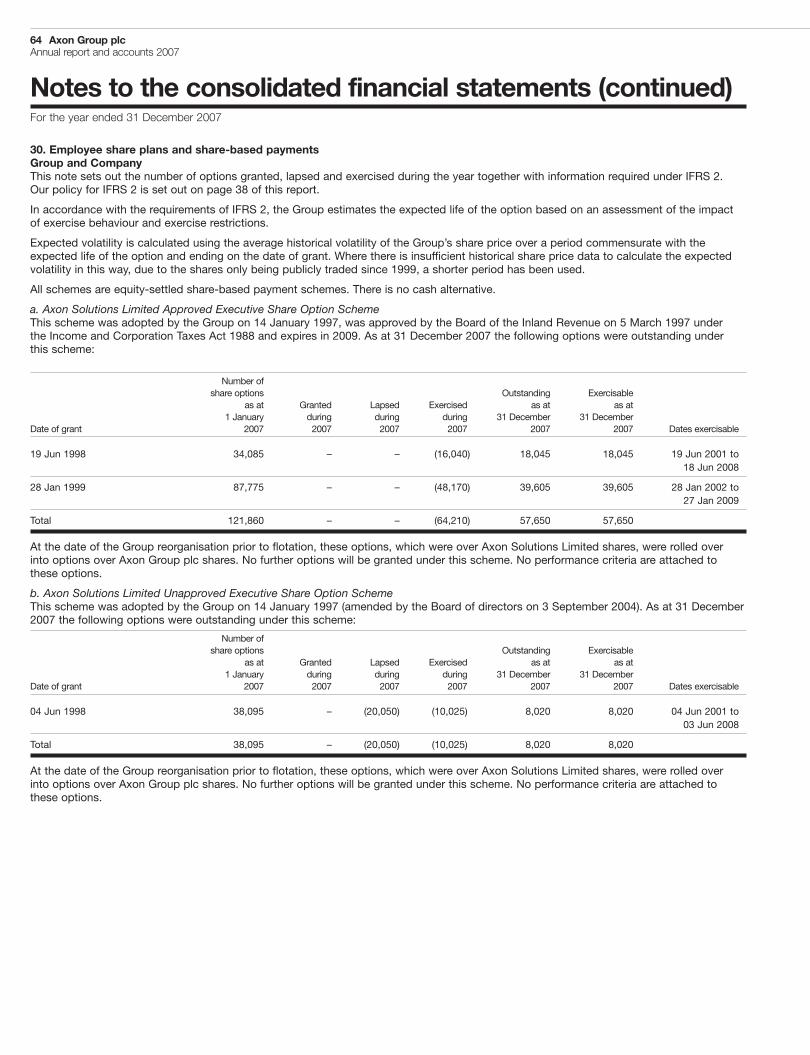
64 Axon Group plcAnnual report and accounts 2007
Notes to the consolidated financial statements (continued)For the year ended 31 December 2007
30. Employee share plans and share-based paymentsGroup and CompanyThis note sets out the number of options granted, lapsed and exercised during the year together with information required under IFRS 2.Our policy for IFRS 2 is set out on page 38 of this report.
In accordance with the requirements of IFRS 2, the Group estimates the expected life of the option based on an assessment of the impactof exercise behaviour and exercise restrictions.
Expected volatility is calculated using the average historical volatility of the Group’s share price over a period commensurate with theexpected life of the option and ending on the date of grant. Where there is insufficient historical share price data to calculate the expectedvolatility in this way, due to the shares only being publicly traded since 1999, a shorter period has been used.
All schemes are equity-settled share-based payment schemes. There is no cash alternative.
a. Axon Solutions Limited Approved Executive Share Option SchemeThis scheme was adopted by the Group on 14 January 1997, was approved by the Board of the Inland Revenue on 5 March 1997 underthe Income and Corporation Taxes Act 1988 and expires in 2009. As at 31 December 2007 the following options were outstanding underthis scheme:
Number ofshare options Outstanding Exercisable
as at Granted Lapsed Exercised as at as at1 January during during during 31 December 31 December
Date of grant 2007 2007 2007 2007 2007 2007 Dates exercisable
19 Jun 1998 34,085 – – (16,040) 18,045 18,045 19 Jun 2001 to18 Jun 2008
28 Jan 1999 87,775 – – (48,170) 39,605 39,605 28 Jan 2002 to27 Jan 2009
Total 121,860 – – (64,210) 57,650 57,650
At the date of the Group reorganisation prior to flotation, these options, which were over Axon Solutions Limited shares, were rolled overinto options over Axon Group plc shares. No further options will be granted under this scheme. No performance criteria are attached tothese options.
b. Axon Solutions Limited Unapproved Executive Share Option SchemeThis scheme was adopted by the Group on 14 January 1997 (amended by the Board of directors on 3 September 2004). As at 31 December2007 the following options were outstanding under this scheme:
Number ofshare options Outstanding Exercisable
as at Granted Lapsed Exercised as at as at1 January during during during 31 December 31 December
Date of grant 2007 2007 2007 2007 2007 2007 Dates exercisable
04 Jun 1998 38,095 – (20,050) (10,025) 8,020 8,020 04 Jun 2001 to03 Jun 2008
Total 38,095 – (20,050) (10,025) 8,020 8,020
At the date of the Group reorganisation prior to flotation, these options, which were over Axon Solutions Limited shares, were rolled overinto options over Axon Group plc shares. No further options will be granted under this scheme. No performance criteria are attached tothese options.
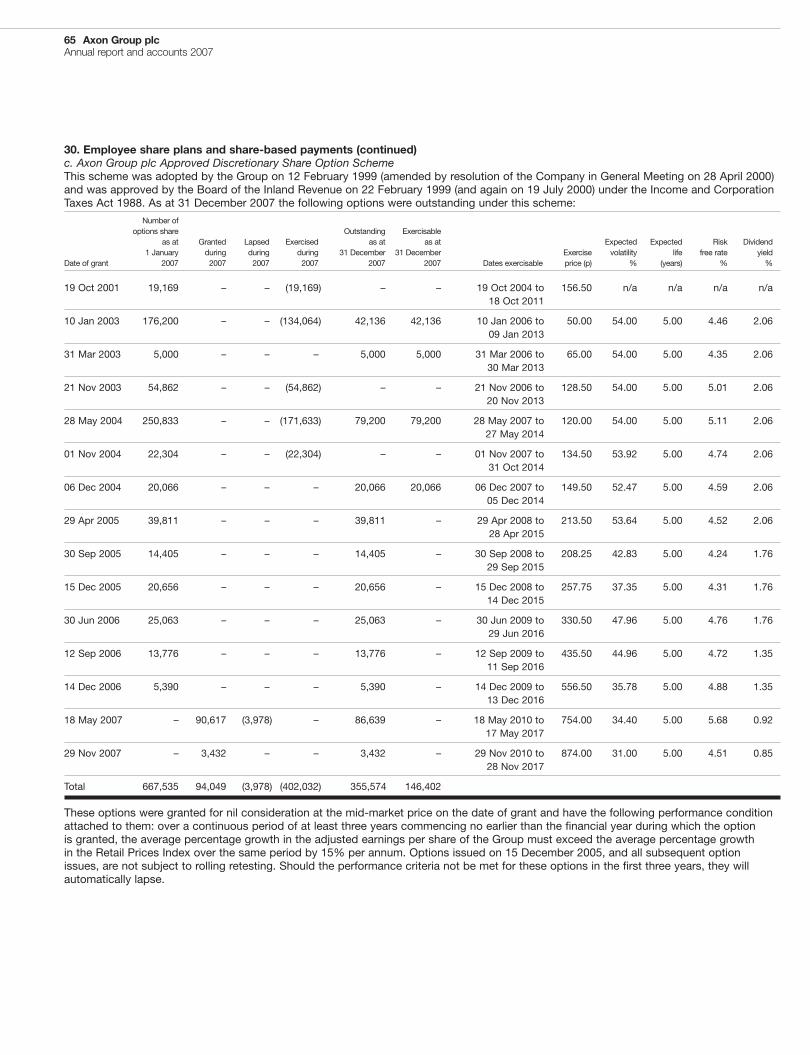
65 Axon Group plcAnnual report and accounts 2007
30. Employee share plans and share-based payments (continued)c. Axon Group plc Approved Discretionary Share Option SchemeThis scheme was adopted by the Group on 12 February 1999 (amended by resolution of the Company in General Meeting on 28 April 2000)and was approved by the Board of the Inland Revenue on 22 February 1999 (and again on 19 July 2000) under the Income and CorporationTaxes Act 1988. As at 31 December 2007 the following options were outstanding under this scheme:
Number ofoptions share Outstanding Exercisable
as at Granted Lapsed Exercised as at as at Expected Expected Risk Dividend1 January during during during 31 December 31 December Exercise volatility life free rate yield
Date of grant 2007 2007 2007 2007 2007 2007 Dates exercisable price (p) % (years) % %
19 Oct 2001 19,169 – – (19,169) – – 19 Oct 2004 to 156.50 n/a n/a n/a n/a18 Oct 2011
10 Jan 2003 176,200 – – (134,064) 42,136 42,136 10 Jan 2006 to 50.00 54.00 5.00 4.46 2.0609 Jan 2013
31 Mar 2003 5,000 – – – 5,000 5,000 31 Mar 2006 to 65.00 54.00 5.00 4.35 2.0630 Mar 2013
21 Nov 2003 54,862 – – (54,862) – – 21 Nov 2006 to 128.50 54.00 5.00 5.01 2.0620 Nov 2013
28 May 2004 250,833 – – (171,633) 79,200 79,200 28 May 2007 to 120.00 54.00 5.00 5.11 2.0627 May 2014
01 Nov 2004 22,304 – – (22,304) – – 01 Nov 2007 to 134.50 53.92 5.00 4.74 2.0631 Oct 2014
06 Dec 2004 20,066 – – – 20,066 20,066 06 Dec 2007 to 149.50 52.47 5.00 4.59 2.0605 Dec 2014
29 Apr 2005 39,811 – – – 39,811 – 29 Apr 2008 to 213.50 53.64 5.00 4.52 2.0628 Apr 2015
30 Sep 2005 14,405 – – – 14,405 – 30 Sep 2008 to 208.25 42.83 5.00 4.24 1.7629 Sep 2015
15 Dec 2005 20,656 – – – 20,656 – 15 Dec 2008 to 257.75 37.35 5.00 4.31 1.7614 Dec 2015
30 Jun 2006 25,063 – – – 25,063 – 30 Jun 2009 to 330.50 47.96 5.00 4.76 1.7629 Jun 2016
12 Sep 2006 13,776 – – – 13,776 – 12 Sep 2009 to 435.50 44.96 5.00 4.72 1.3511 Sep 2016
14 Dec 2006 5,390 – – – 5,390 – 14 Dec 2009 to 556.50 35.78 5.00 4.88 1.3513 Dec 2016
18 May 2007 – 90,617 (3,978) – 86,639 – 18 May 2010 to 754.00 34.40 5.00 5.68 0.9217 May 2017
29 Nov 2007 – 3,432 – – 3,432 – 29 Nov 2010 to 874.00 31.00 5.00 4.51 0.8528 Nov 2017
Total 667,535 94,049 (3,978) (402,032) 355,574 146,402
These options were granted for nil consideration at the mid-market price on the date of grant and have the following performance conditionattached to them: over a continuous period of at least three years commencing no earlier than the financial year during which the optionis granted, the average percentage growth in the adjusted earnings per share of the Group must exceed the average percentage growthin the Retail Prices Index over the same period by 15% per annum. Options issued on 15 December 2005, and all subsequent optionissues, are not subject to rolling retesting. Should the performance criteria not be met for these options in the first three years, they willautomatically lapse.
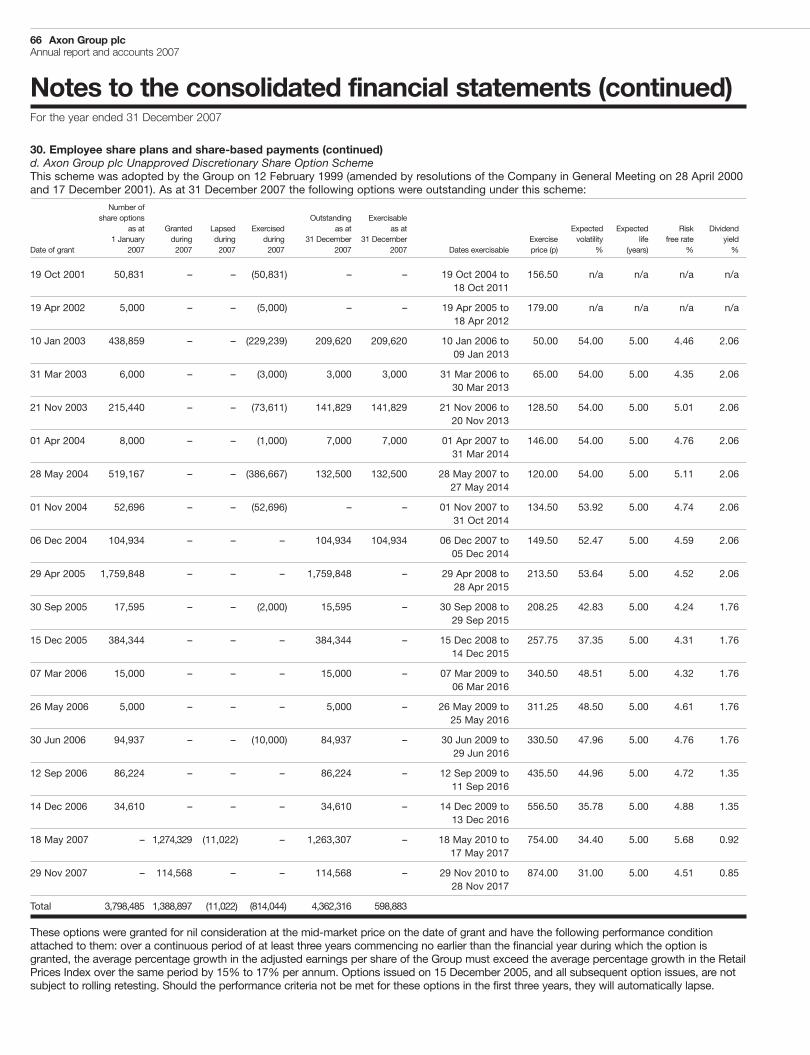
66 Axon Group plcAnnual report and accounts 2007
Notes to the consolidated financial statements (continued)For the year ended 31 December 2007
30. Employee share plans and share-based payments (continued)d. Axon Group plc Unapproved Discretionary Share Option SchemeThis scheme was adopted by the Group on 12 February 1999 (amended by resolutions of the Company in General Meeting on 28 April 2000and 17 December 2001). As at 31 December 2007 the following options were outstanding under this scheme:
Number ofshare options Outstanding Exercisable
as at Granted Lapsed Exercised as at as at Expected Expected Risk Dividend1 January during during during 31 December 31 December Exercise volatility life free rate yield
Date of grant 2007 2007 2007 2007 2007 2007 Dates exercisable price (p) % (years) % %
19 Oct 2001 50,831 – – (50,831) – – 19 Oct 2004 to 156.50 n/a n/a n/a n/a18 Oct 2011
19 Apr 2002 5,000 – – (5,000) – – 19 Apr 2005 to 179.00 n/a n/a n/a n/a18 Apr 2012
10 Jan 2003 438,859 – – (229,239) 209,620 209,620 10 Jan 2006 to 50.00 54.00 5.00 4.46 2.0609 Jan 2013
31 Mar 2003 6,000 – – (3,000) 3,000 3,000 31 Mar 2006 to 65.00 54.00 5.00 4.35 2.0630 Mar 2013
21 Nov 2003 215,440 – – (73,611) 141,829 141,829 21 Nov 2006 to 128.50 54.00 5.00 5.01 2.0620 Nov 2013
01 Apr 2004 8,000 – – (1,000) 7,000 7,000 01 Apr 2007 to 146.00 54.00 5.00 4.76 2.0631 Mar 2014
28 May 2004 519,167 – – (386,667) 132,500 132,500 28 May 2007 to 120.00 54.00 5.00 5.11 2.0627 May 2014
01 Nov 2004 52,696 – – (52,696) – – 01 Nov 2007 to 134.50 53.92 5.00 4.74 2.0631 Oct 2014
06 Dec 2004 104,934 – – – 104,934 104,934 06 Dec 2007 to 149.50 52.47 5.00 4.59 2.0605 Dec 2014
29 Apr 2005 1,759,848 – – – 1,759,848 – 29 Apr 2008 to 213.50 53.64 5.00 4.52 2.0628 Apr 2015
30 Sep 2005 17,595 – – (2,000) 15,595 – 30 Sep 2008 to 208.25 42.83 5.00 4.24 1.7629 Sep 2015
15 Dec 2005 384,344 – – – 384,344 – 15 Dec 2008 to 257.75 37.35 5.00 4.31 1.7614 Dec 2015
07 Mar 2006 15,000 – – – 15,000 – 07 Mar 2009 to 340.50 48.51 5.00 4.32 1.7606 Mar 2016
26 May 2006 5,000 – – – 5,000 – 26 May 2009 to 311.25 48.50 5.00 4.61 1.7625 May 2016
30 Jun 2006 94,937 – – (10,000) 84,937 – 30 Jun 2009 to 330.50 47.96 5.00 4.76 1.7629 Jun 2016
12 Sep 2006 86,224 – – – 86,224 – 12 Sep 2009 to 435.50 44.96 5.00 4.72 1.3511 Sep 2016
14 Dec 2006 34,610 – – – 34,610 – 14 Dec 2009 to 556.50 35.78 5.00 4.88 1.3513 Dec 2016
18 May 2007 – 1,274,329 (11,022) – 1,263,307 – 18 May 2010 to 754.00 34.40 5.00 5.68 0.9217 May 2017
29 Nov 2007 – 114,568 – – 114,568 – 29 Nov 2010 to 874.00 31.00 5.00 4.51 0.8528 Nov 2017
Total 3,798,485 1,388,897 (11,022) (814,044) 4,362,316 598,883
These options were granted for nil consideration at the mid-market price on the date of grant and have the following performance conditionattached to them: over a continuous period of at least three years commencing no earlier than the financial year during which the option isgranted, the average percentage growth in the adjusted earnings per share of the Group must exceed the average percentage growth in the RetailPrices Index over the same period by 15% to 17% per annum. Options issued on 15 December 2005, and all subsequent option issues, are notsubject to rolling retesting. Should the performance criteria not be met for these options in the first three years, they will automatically lapse.
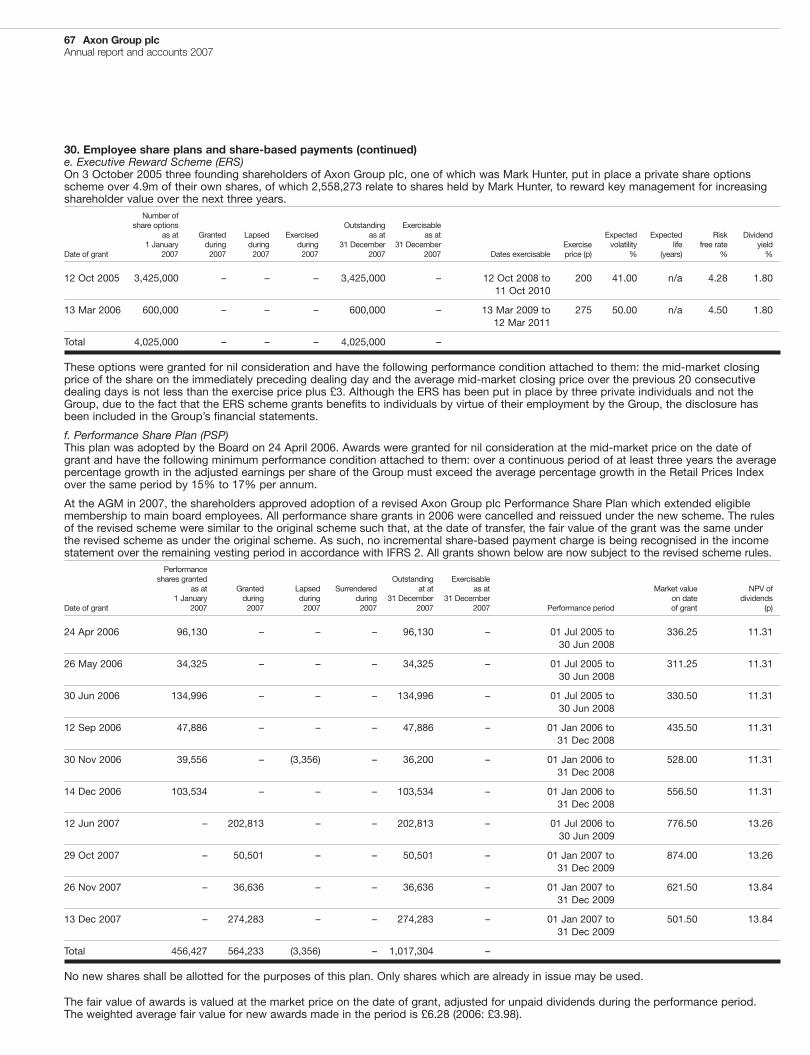
67 Axon Group plcAnnual report and accounts 2007
30. Employee share plans and share-based payments (continued)e. Executive Reward Scheme (ERS)On 3 October 2005 three founding shareholders of Axon Group plc, one of which was Mark Hunter, put in place a private share optionsscheme over 4.9m of their own shares, of which 2,558,273 relate to shares held by Mark Hunter, to reward key management for increasingshareholder value over the next three years.
Number ofshare options Outstanding Exercisable
as at Granted Lapsed Exercised as at as at Expected Expected Risk Dividend1 January during during during 31 December 31 December Exercise volatility life free rate yield
Date of grant 2007 2007 2007 2007 2007 2007 Dates exercisable price (p) % (years) % %
12 Oct 2005 3,425,000 – – – 3,425,000 – 12 Oct 2008 to 200 41.00 n/a 4.28 1.8011 Oct 2010
13 Mar 2006 600,000 – – – 600,000 – 13 Mar 2009 to 275 50.00 n/a 4.50 1.8012 Mar 2011
Total 4,025,000 – – – 4,025,000 –
These options were granted for nil consideration and have the following performance condition attached to them: the mid-market closingprice of the share on the immediately preceding dealing day and the average mid-market closing price over the previous 20 consecutivedealing days is not less than the exercise price plus £3. Although the ERS has been put in place by three private individuals and not theGroup, due to the fact that the ERS scheme grants benefits to individuals by virtue of their employment by the Group, the disclosure hasbeen included in the Group’s financial statements.
f. Performance Share Plan (PSP)This plan was adopted by the Board on 24 April 2006. Awards were granted for nil consideration at the mid-market price on the date ofgrant and have the following minimum performance condition attached to them: over a continuous period of at least three years the averagepercentage growth in the adjusted earnings per share of the Group must exceed the average percentage growth in the Retail Prices Indexover the same period by 15% to 17% per annum.
At the AGM in 2007, the shareholders approved adoption of a revised Axon Group plc Performance Share Plan which extended eligiblemembership to main board employees. All performance share grants in 2006 were cancelled and reissued under the new scheme. The rulesof the revised scheme were similar to the original scheme such that, at the date of transfer, the fair value of the grant was the same underthe revised scheme as under the original scheme. As such, no incremental share-based payment charge is being recognised in the incomestatement over the remaining vesting period in accordance with IFRS 2. All grants shown below are now subject to the revised scheme rules.
Performanceshares granted Outstanding Exercisable
as at Granted Lapsed Surrendered at at as at Market value NPV of1 January during during during 31 December 31 December on date dividends
Date of grant 2007 2007 2007 2007 2007 2007 Performance period of grant (p)
24 Apr 2006 96,130 – – – 96,130 – 01 Jul 2005 to 336.25 11.3130 Jun 2008
26 May 2006 34,325 – – – 34,325 – 01 Jul 2005 to 311.25 11.3130 Jun 2008
30 Jun 2006 134,996 – – – 134,996 – 01 Jul 2005 to 330.50 11.3130 Jun 2008
12 Sep 2006 47,886 – – – 47,886 – 01 Jan 2006 to 435.50 11.3131 Dec 2008
30 Nov 2006 39,556 – (3,356) – 36,200 – 01 Jan 2006 to 528.00 11.3131 Dec 2008
14 Dec 2006 103,534 – – – 103,534 – 01 Jan 2006 to 556.50 11.3131 Dec 2008
12 Jun 2007 – 202,813 – – 202,813 – 01 Jul 2006 to 776.50 13.2630 Jun 2009
29 Oct 2007 – 50,501 – – 50,501 – 01 Jan 2007 to 874.00 13.2631 Dec 2009
26 Nov 2007 – 36,636 – – 36,636 – 01 Jan 2007 to 621.50 13.8431 Dec 2009
13 Dec 2007 – 274,283 – – 274,283 – 01 Jan 2007 to 501.50 13.8431 Dec 2009
Total 456,427 564,233 (3,356) – 1,017,304 –
No new shares shall be allotted for the purposes of this plan. Only shares which are already in issue may be used.
The fair value of awards is valued at the market price on the date of grant, adjusted for unpaid dividends during the performance period.The weighted average fair value for new awards made in the period is £6.28 (2006: £3.98).
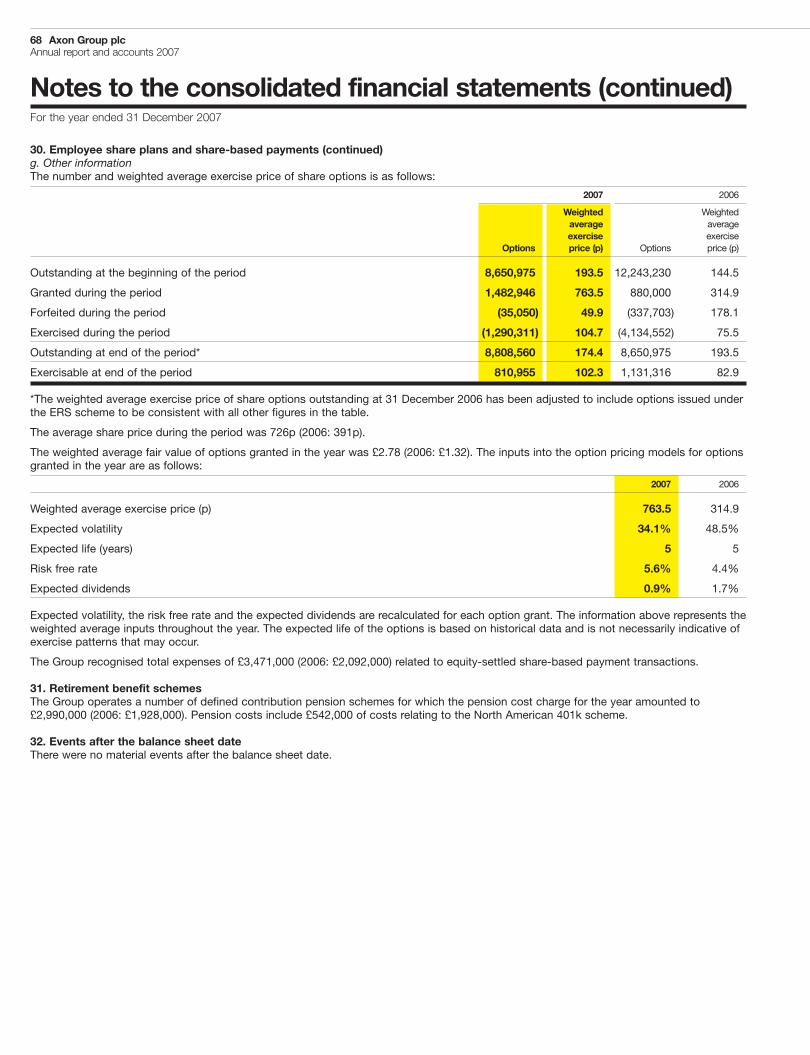
68 Axon Group plcAnnual report and accounts 2007
Notes to the consolidated financial statements (continued)For the year ended 31 December 2007
30. Employee share plans and share-based payments (continued)g. Other informationThe number and weighted average exercise price of share options is as follows:
2007 2006
Weighted Weightedaverage averageexercise exercise
Options price (p) Options price (p)
Outstanding at the beginning of the period 8,650,975 193.5 12,243,230 144.5
Granted during the period 1,482,946 763.5 880,000 314.9
Forfeited during the period (35,050) 49.9 (337,703) 178.1
Exercised during the period (1,290,311) 104.7 (4,134,552) 75.5
Outstanding at end of the period* 8,808,560 174.4 8,650,975 193.5
Exercisable at end of the period 810,955 102.3 1,131,316 82.9
*The weighted average exercise price of share options outstanding at 31 December 2006 has been adjusted to include options issued underthe ERS scheme to be consistent with all other figures in the table.
The average share price during the period was 726p (2006: 391p).
The weighted average fair value of options granted in the year was £2.78 (2006: £1.32). The inputs into the option pricing models for optionsgranted in the year are as follows:
2007 2006
Weighted average exercise price (p) 763.5 314.9
Expected volatility 34.1% 48.5%
Expected life (years) 5 5
Risk free rate 5.6% 4.4%
Expected dividends 0.9% 1.7%
Expected volatility, the risk free rate and the expected dividends are recalculated for each option grant. The information above represents theweighted average inputs throughout the year. The expected life of the options is based on historical data and is not necessarily indicative ofexercise patterns that may occur.
The Group recognised total expenses of £3,471,000 (2006: £2,092,000) related to equity-settled share-based payment transactions.
31. Retirement benefit schemesThe Group operates a number of defined contribution pension schemes for which the pension cost charge for the year amounted to£2,990,000 (2006: £1,928,000). Pension costs include £542,000 of costs relating to the North American 401k scheme.
32. Events after the balance sheet dateThere were no material events after the balance sheet date.
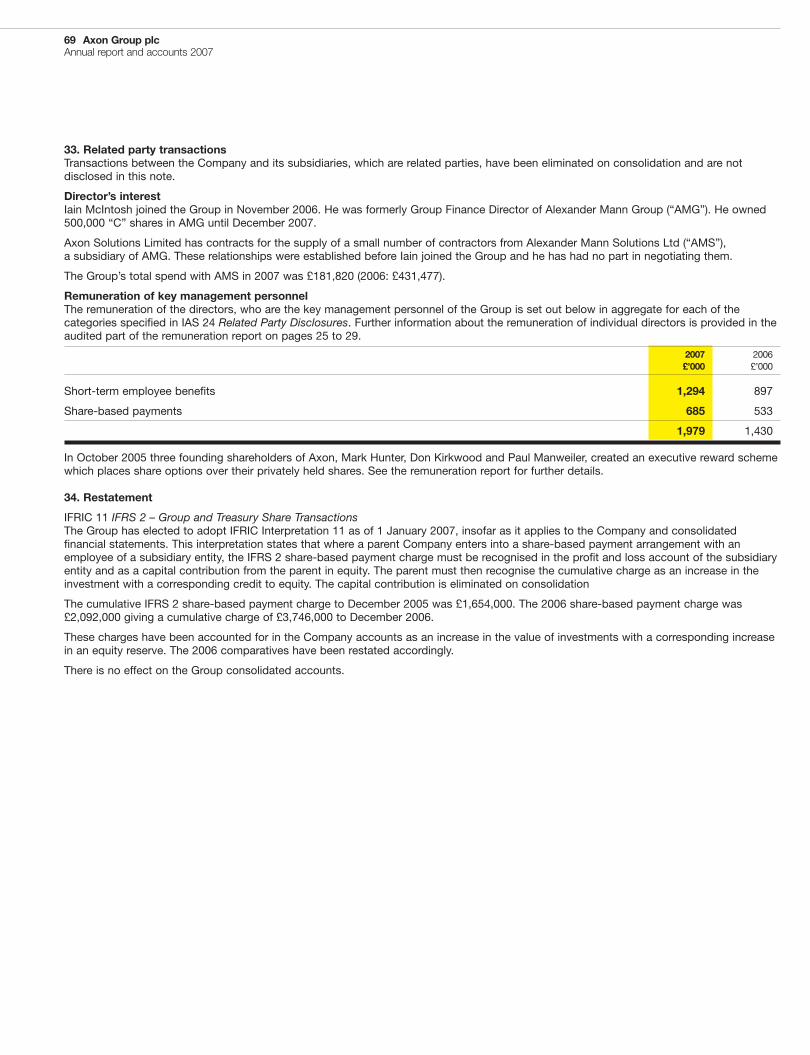
69 Axon Group plcAnnual report and accounts 2007
33. Related party transactionsTransactions between the Company and its subsidiaries, which are related parties, have been eliminated on consolidation and are notdisclosed in this note.
Director’s interestIain McIntosh joined the Group in November 2006. He was formerly Group Finance Director of Alexander Mann Group (“AMG”). He owned500,000 “C” shares in AMG until December 2007.
Axon Solutions Limited has contracts for the supply of a small number of contractors from Alexander Mann Solutions Ltd (“AMS”),a subsidiary of AMG. These relationships were established before Iain joined the Group and he has had no part in negotiating them.
The Group’s total spend with AMS in 2007 was £181,820 (2006: £431,477).
Remuneration of key management personnelThe remuneration of the directors, who are the key management personnel of the Group is set out below in aggregate for each of thecategories specified in IAS 24 Related Party Disclosures. Further information about the remuneration of individual directors is provided in theaudited part of the remuneration report on pages 25 to 29.
2007 2006£’000 £’000
Short-term employee benefits 1,294 897
Share-based payments 685 533
1,979 1,430
In October 2005 three founding shareholders of Axon, Mark Hunter, Don Kirkwood and Paul Manweiler, created an executive reward schemewhich places share options over their privately held shares. See the remuneration report for further details.
34. Restatement
IFRIC 11 IFRS 2 – Group and Treasury Share TransactionsThe Group has elected to adopt IFRIC Interpretation 11 as of 1 January 2007, insofar as it applies to the Company and consolidatedfinancial statements. This interpretation states that where a parent Company enters into a share-based payment arrangement with anemployee of a subsidiary entity, the IFRS 2 share-based payment charge must be recognised in the profit and loss account of the subsidiaryentity and as a capital contribution from the parent in equity. The parent must then recognise the cumulative charge as an increase in theinvestment with a corresponding credit to equity. The capital contribution is eliminated on consolidation
The cumulative IFRS 2 share-based payment charge to December 2005 was £1,654,000. The 2006 share-based payment charge was£2,092,000 giving a cumulative charge of £3,746,000 to December 2006.
These charges have been accounted for in the Company accounts as an increase in the value of investments with a corresponding increasein an equity reserve. The 2006 comparatives have been restated accordingly.
There is no effect on the Group consolidated accounts.
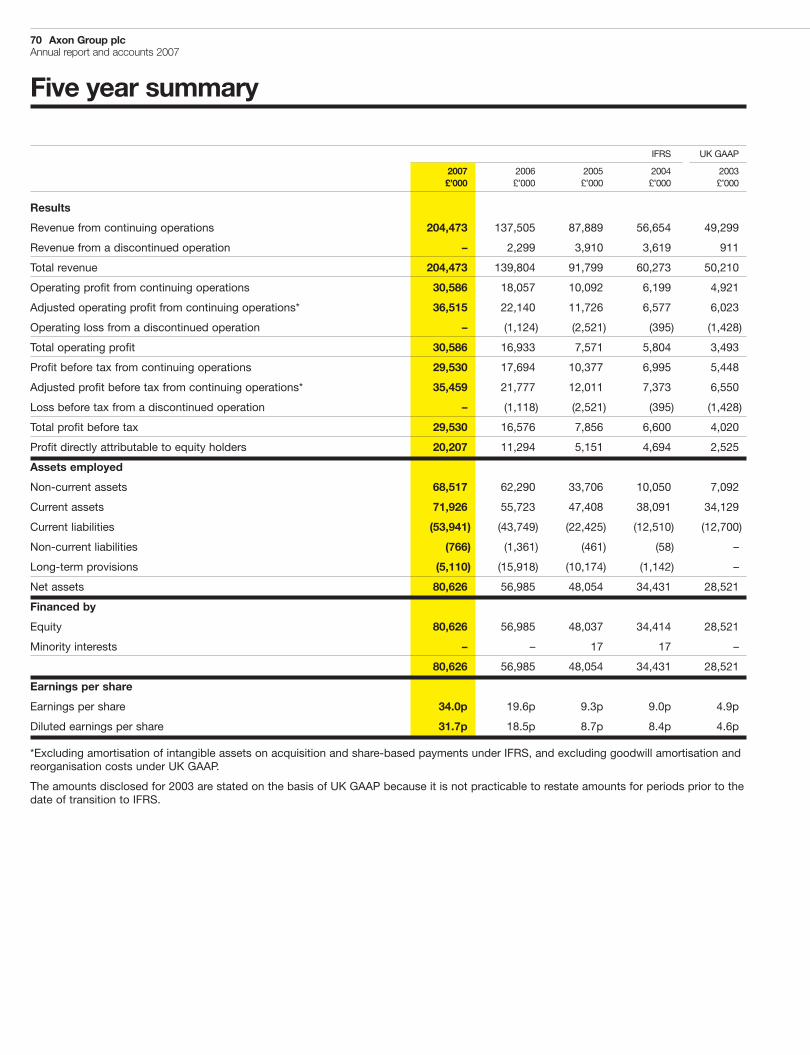
70 Axon Group plcAnnual report and accounts 2007
Five year summary
IFRS UK GAAP
2007 2006 2005 2004 2003£’000 £’000 £’000 £’000 £’000
Results
Revenue from continuing operations 204,473 137,505 87,889 56,654 49,299
Revenue from a discontinued operation – 2,299 3,910 3,619 911
Total revenue 204,473 139,804 91,799 60,273 50,210
Operating profit from continuing operations 30,586 18,057 10,092 6,199 4,921
Adjusted operating profit from continuing operations* 36,515 22,140 11,726 6,577 6,023
Operating loss from a discontinued operation – (1,124) (2,521) (395) (1,428)
Total operating profit 30,586 16,933 7,571 5,804 3,493
Profit before tax from continuing operations 29,530 17,694 10,377 6,995 5,448
Adjusted profit before tax from continuing operations* 35,459 21,777 12,011 7,373 6,550
Loss before tax from a discontinued operation – (1,118) (2,521) (395) (1,428)
Total profit before tax 29,530 16,576 7,856 6,600 4,020
Profit directly attributable to equity holders 20,207 11,294 5,151 4,694 2,525
Assets employed
Non-current assets 68,517 62,290 33,706 10,050 7,092
Current assets 71,926 55,723 47,408 38,091 34,129
Current liabilities (53,941) (43,749) (22,425) (12,510) (12,700)
Non-current liabilities (766) (1,361) (461) (58) –
Long-term provisions (5,110) (15,918) (10,174) (1,142) –
Net assets 80,626 56,985 48,054 34,431 28,521
Financed by
Equity 80,626 56,985 48,037 34,414 28,521
Minority interests – – 17 17 –
80,626 56,985 48,054 34,431 28,521
Earnings per share
Earnings per share 34.0p 19.6p 9.3p 9.0p 4.9p
Diluted earnings per share 31.7p 18.5p 8.7p 8.4p 4.6p
*Excluding amortisation of intangible assets on acquisition and share-based payments under IFRS, and excluding goodwill amortisation andreorganisation costs under UK GAAP.
The amounts disclosed for 2003 are stated on the basis of UK GAAP because it is not practicable to restate amounts for periods prior to thedate of transition to IFRS.
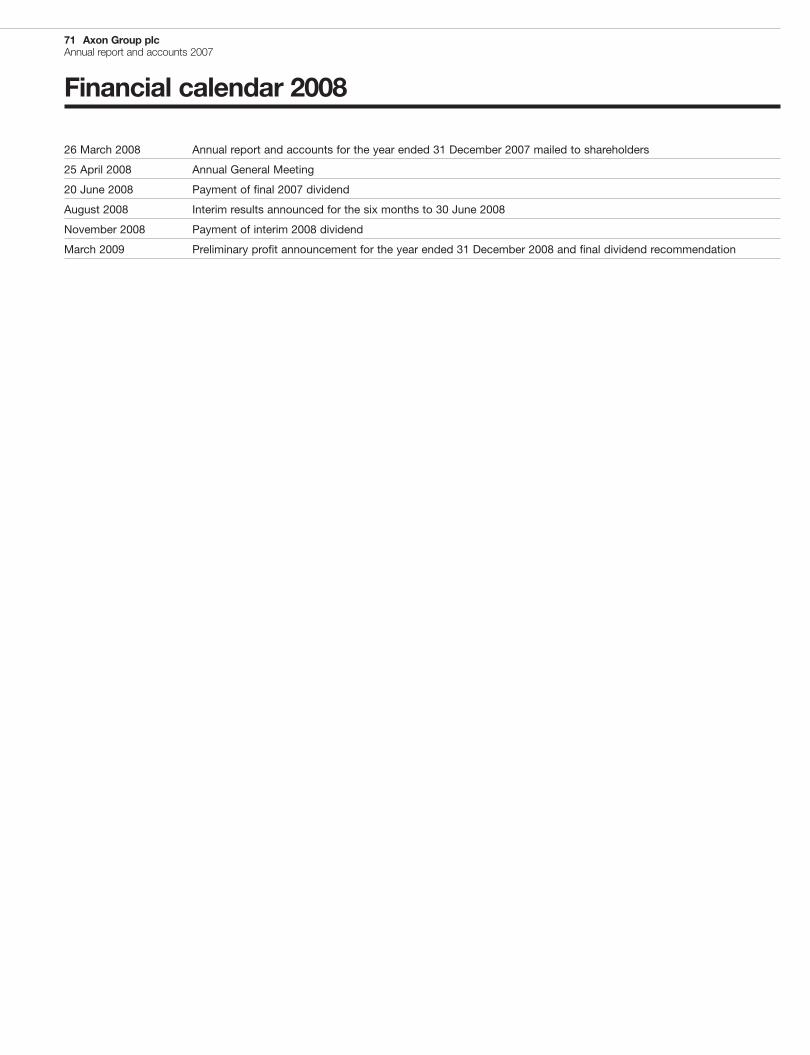
71 Axon Group plcAnnual report and accounts 2007
Financial calendar 2008
26 March 2008 Annual report and accounts for the year ended 31 December 2007 mailed to shareholders
25 April 2008 Annual General Meeting
20 June 2008 Payment of final 2007 dividend
August 2008 Interim results announced for the six months to 30 June 2008
November 2008 Payment of interim 2008 dividend
March 2009 Preliminary profit announcement for the year ended 31 December 2008 and final dividend recommendation
72 Axon Group plcAnnual report and accounts 2007
Company information and advisers
Registered officeAxonCentreChurch RoadEghamSurrey TW20 9QBTel: + 44 (0)1784 480 800Fax: + 44 (0)1784 480 900www.axonglobal.com
Company registrationnumberAxon Group plc: 3419641
Financial advisersand stockbrokersCiti Global Markets LimitedCiti Centre33 Canada Square, 12th floorCanary WharfLondon E14 5LB
Panmure Gordon & Co. plcMoorgate Hall155 MoorgateLondon EC2M 6XB
AuditorsErnst & Young LLP1 More London PlaceLondon SE1 2AF
BankersRoyal Bank of ScotlandAbbey Gardens4 Abbey StreetReadingBerkshire RG1 3BA
SolicitorsOsborne ClarkeApex PlazaForbury RoadReading RG1 1AX
RegistrarsEquinitiAspect HouseSpencer RoadLancingWest Sussex BN99 6ZL


Axon
Group
plcA
nnualreportandaccounts
2007
SAP-enabled Business TransformationAxon Group plcAnnual report and accounts 2007
www.axonglobal.com
12246 Axon R&A - cover:Layout 1 20/3/08 11:54 Page 1