Embed Size (px)
DESCRIPTION
bagus
Citation preview
BAB 5: PENGUKURAN,
KESAHAN DAN
KEBOLEHPERCAYAAN ”Dr. Ferlis Bin Bullare @ Bahari
Head (Senior Lecturer)
Psychology and Social Health Research Unit
Faculty of Psychology and Education
Tel : 016 520 2070
E-mel : [email protected];
Facebook : Ferlis Bahari
Research Method in Education (TT60104)
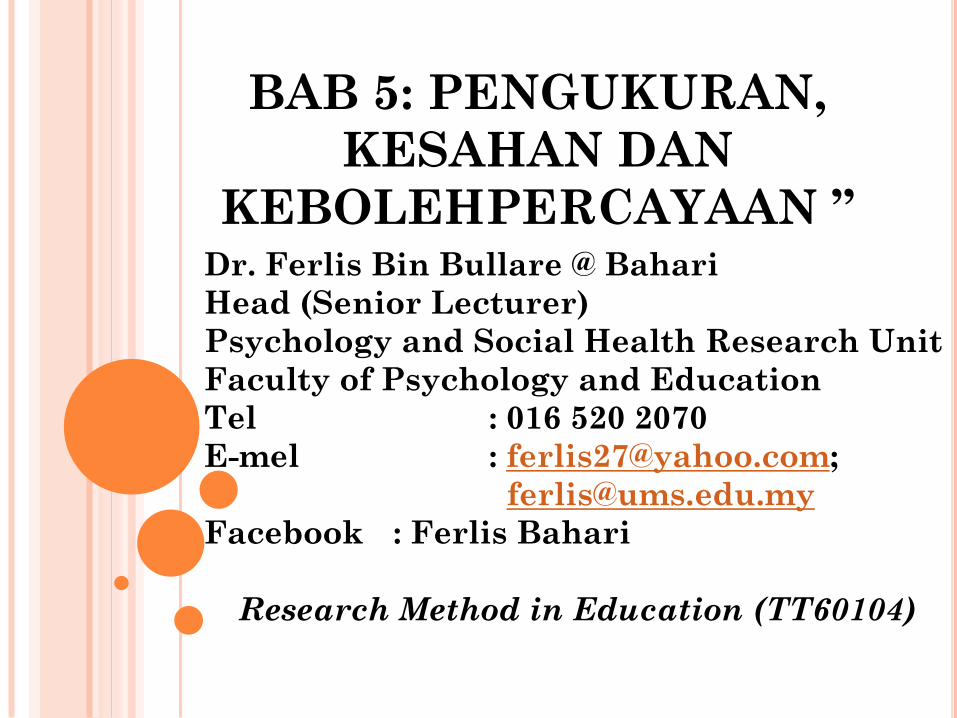
Quantitative Qualitative
Objective Subjective
"Hard" science "Soft" science
Literature review must be done early in study Literature review may be done as study progresses or afterward
Tests theory Develops theory
One reality: focus is concise and narrow Multiple realities: focus is complex and broad
Reduction, control, precision Discovery, description, understanding, shared interpretation
Measurable Interpretive
Mechanistic: parts equal the whole Organismic: whole is greater than the parts
Report statistical analysis.Basic element of analysis is numbers
Report rich narrative, individual interpretation.Basic element of analysis is words/ideas.
Researcher is separate Researcher is part of process
Subjects Participants
Context free Context dependent
Hypotheses Research questions
Reasoning is logistic & deductive Reasoning is dialectic & inductive
Establishes relationships, causation Describes meaning, discovery
Uses instruments Uses communication and observation
Strives for generalization Strives for uniqueness
Designs: descriptive, correlational, quasi-experimental, experimental
Designs: phenomenological, grounded theory, ethnographic, historical, philosophical, case study.
Sample size: 30 to 500 Sample size is not a concern; seeks "information rich" sample
"Counts the beans" Provides information as to "which beans are worth counting"
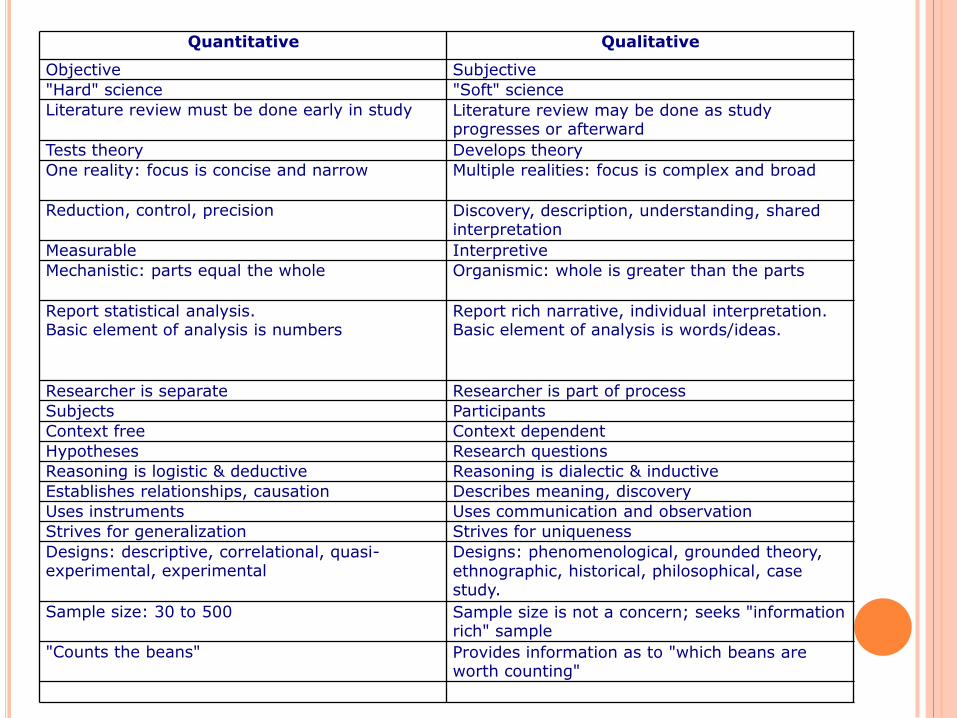
FACTOR ANALYSIS
The purpose of using factor analysis is to 1)
summarize patterns of correlations among observed
variables, 2) to reduce a large number of observed
variables to a smaller numbers of factors, and to 3)
provide an operational definition (a regression
equation) for an underlying process by using observed
variables, or 4) to test a theory about the nature of
underlying processes (Tabachnick & Fidell, 2007, p. 608).
Factor analysis can also be used to reduce a large
number of related variables to a more manageable
number, prior to using them in other analyses such as
multiple regression or multivariate analysis of
variance (Pallant, 2005).
EXPLORATORY VS. CONFIRMATORY
FACTOR ANALYSIS
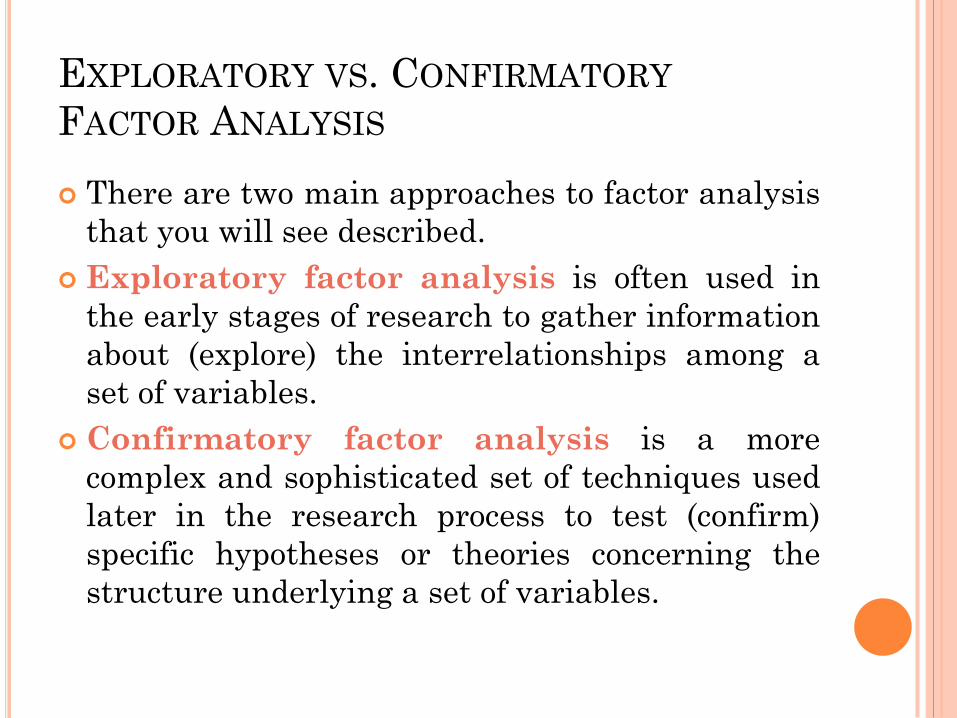
There are two main approaches to factor analysis
that you will see described.
Exploratory factor analysis is often used in
the early stages of research to gather information
about (explore) the interrelationships among a
set of variables.
Confirmatory factor analysis is a more
complex and sophisticated set of techniques used
later in the research process to test (confirm)
specific hypotheses or theories concerning the
structure underlying a set of variables.
APPROPRIATENESS OF FACTOR ANALYSIS
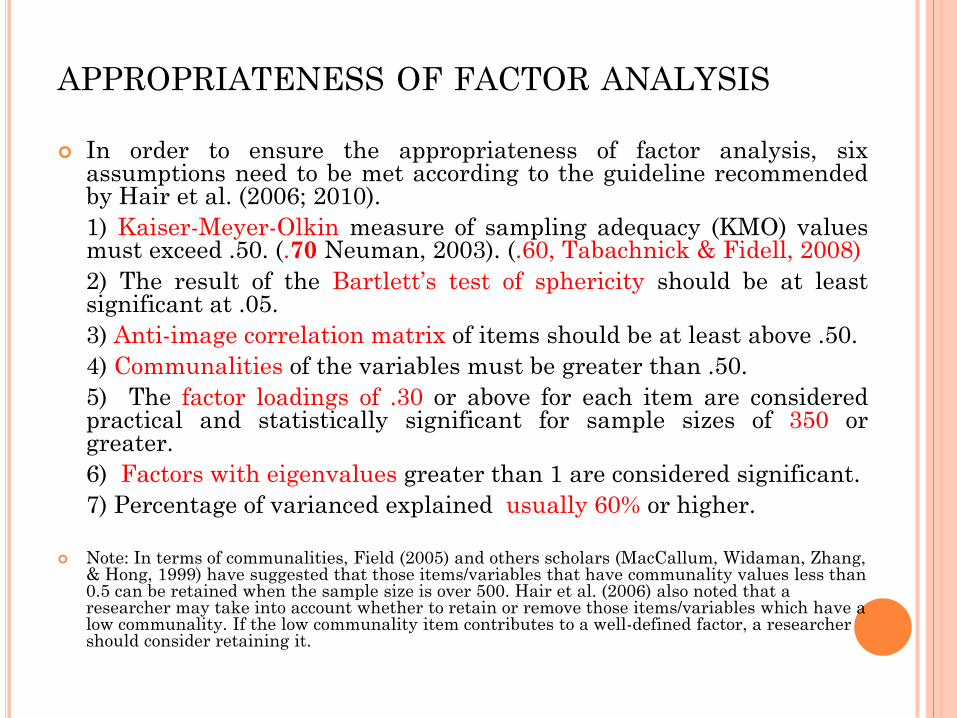
In order to ensure the appropriateness of factor analysis, sixassumptions need to be met according to the guideline recommendedby Hair et al. (2006; 2010).
1) Kaiser-Meyer-Olkin measure of sampling adequacy (KMO) valuesmust exceed .50. (.70 Neuman, 2003). (.60, Tabachnick & Fidell, 2008)
2) The result of the Bartlett’s test of sphericity should be at leastsignificant at .05.
3) Anti-image correlation matrix of items should be at least above .50.
4) Communalities of the variables must be greater than .50.
5) The factor loadings of .30 or above for each item are consideredpractical and statistically significant for sample sizes of 350 orgreater.
6) Factors with eigenvalues greater than 1 are considered significant.
7) Percentage of varianced explained usually 60% or higher.
Note: In terms of communalities, Field (2005) and others scholars (MacCallum, Widaman, Zhang, & Hong, 1999) have suggested that those items/variables that have communality values less than 0.5 can be retained when the sample size is over 500. Hair et al. (2006) also noted that a researcher may take into account whether to retain or remove those items/variables which have a low communality. If the low communality item contributes to a well-defined factor, a researcher should consider retaining it.
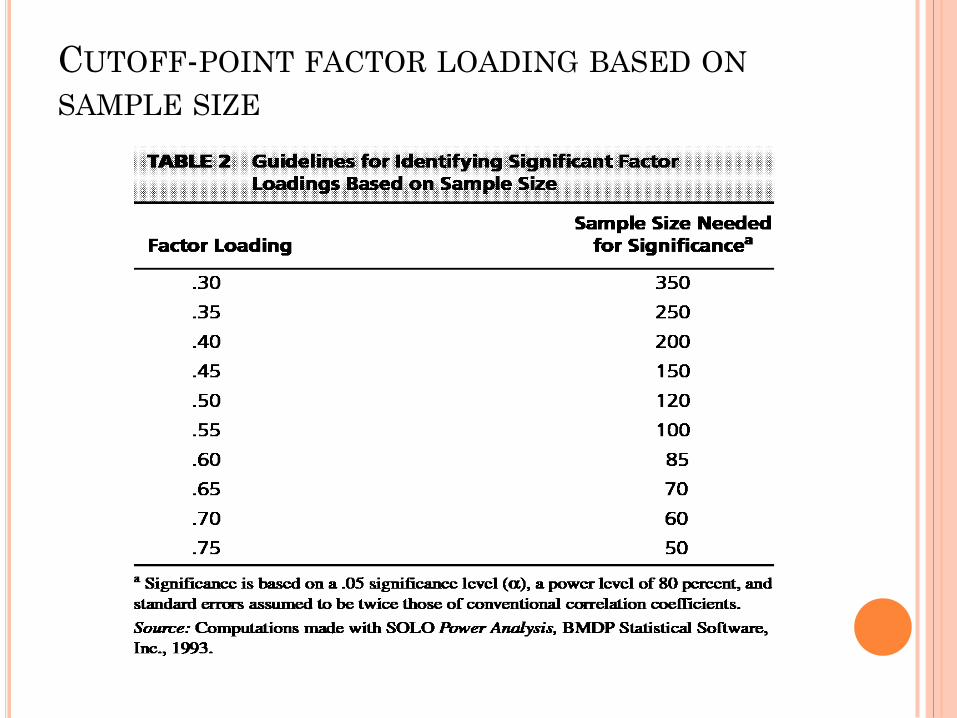
CUTOFF-POINT FACTOR LOADING BASED ON
SAMPLE SIZE
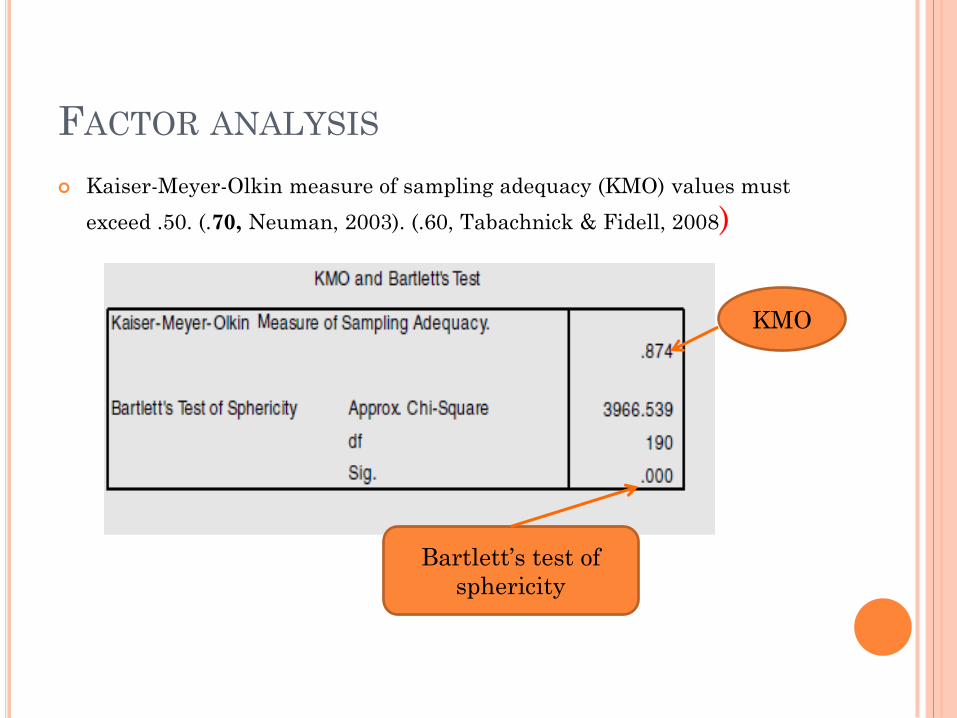
FACTOR ANALYSIS
Kaiser-Meyer-Olkin measure of sampling adequacy (KMO) values must
exceed .50. (.70, Neuman, 2003). (.60, Tabachnick & Fidell, 2008)
KMO
Bartlett’s test of
sphericity
KMO & BARTLETT’S TEST
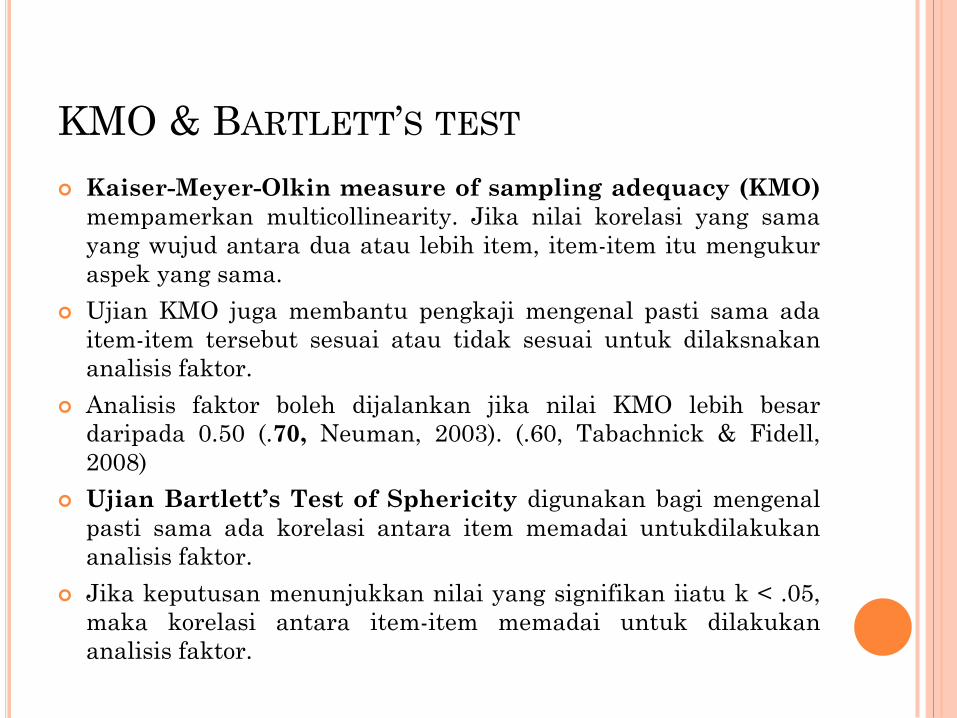
Kaiser-Meyer-Olkin measure of sampling adequacy (KMO)
mempamerkan multicollinearity. Jika nilai korelasi yang sama
yang wujud antara dua atau lebih item, item-item itu mengukur
aspek yang sama.
Ujian KMO juga membantu pengkaji mengenal pasti sama ada
item-item tersebut sesuai atau tidak sesuai untuk dilaksnakan
analisis faktor.
Analisis faktor boleh dijalankan jika nilai KMO lebih besar
daripada 0.50 (.70, Neuman, 2003). (.60, Tabachnick & Fidell,
2008)
Ujian Bartlett’s Test of Sphericity digunakan bagi mengenal
pasti sama ada korelasi antara item memadai untukdilakukan
analisis faktor.
Jika keputusan menunjukkan nilai yang signifikan iiatu k < .05,
maka korelasi antara item-item memadai untuk dilakukan
analisis faktor.
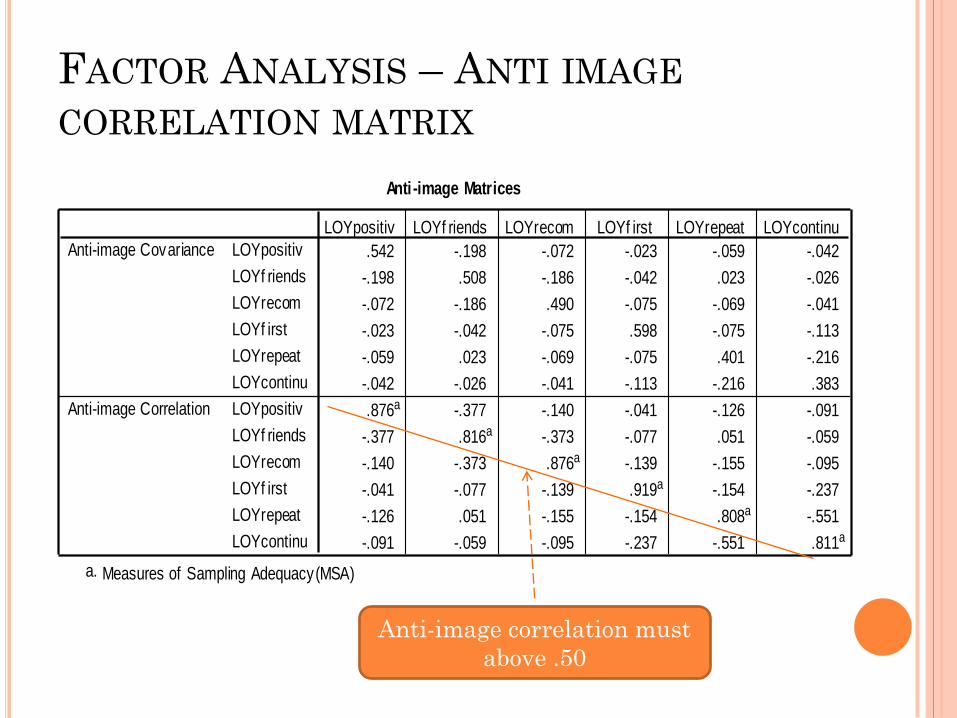
FACTOR ANALYSIS – ANTI IMAGE
CORRELATION MATRIX
Anti-image Matrices
.542 -.198 -.072 -.023 -.059 -.042
-.198 .508 -.186 -.042 .023 -.026
-.072 -.186 .490 -.075 -.069 -.041
-.023 -.042 -.075 .598 -.075 -.113
-.059 .023 -.069 -.075 .401 -.216
-.042 -.026 -.041 -.113 -.216 .383
.876a -.377 -.140 -.041 -.126 -.091
-.377 .816a -.373 -.077 .051 -.059
-.140 -.373 .876a -.139 -.155 -.095
-.041 -.077 -.139 .919a -.154 -.237
-.126 .051 -.155 -.154 .808a -.551
-.091 -.059 -.095 -.237 -.551 .811a
LOYpositiv
LOYf riends
LOYrecom
LOYf irst
LOYrepeat
LOYcontinu
LOYpositiv
LOYf riends
LOYrecom
LOYf irst
LOYrepeat
LOYcontinu
Anti-image Covariance
Anti-image Correlation
LOYpositiv LOYf riends LOYrecom LOYf irst LOYrepeat LOYcontinu
Measures of Sampling Adequacy(MSA)a.
Anti-image correlation must
above .50
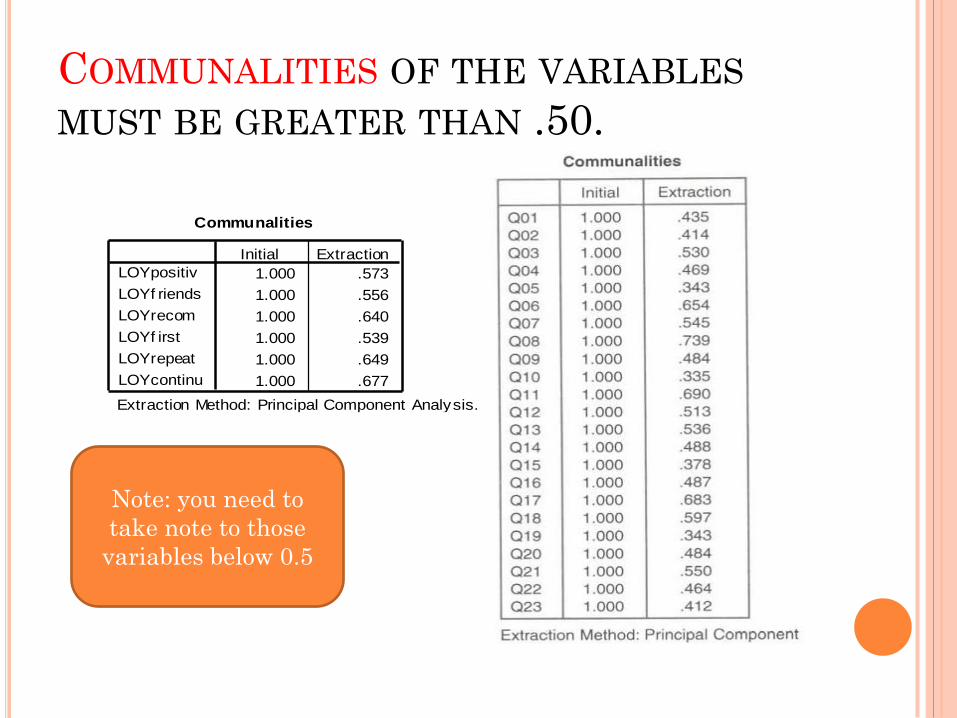
COMMUNALITIES OF THE VARIABLES
MUST BE GREATER THAN .50.
Communalities
1.000 .573
1.000 .556
1.000 .640
1.000 .539
1.000 .649
1.000 .677
LOYpositiv
LOYf riends
LOYrecom
LOYf irst
LOYrepeat
LOYcontinu
Initial Extraction
Extraction Method: Principal Component Analysis.
Note: you need to
take note to those
variables below 0.5
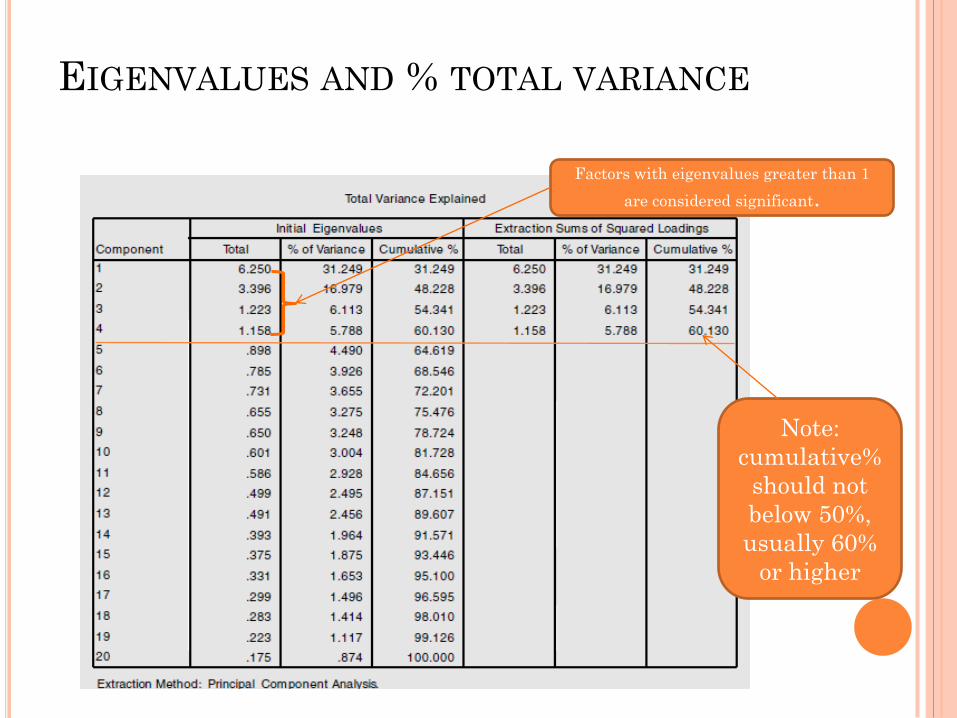
EIGENVALUES AND % TOTAL VARIANCE
Note:
cumulative%
should not
below 50%,
usually 60%
or higher
Factors with eigenvalues greater than 1
are considered significant.
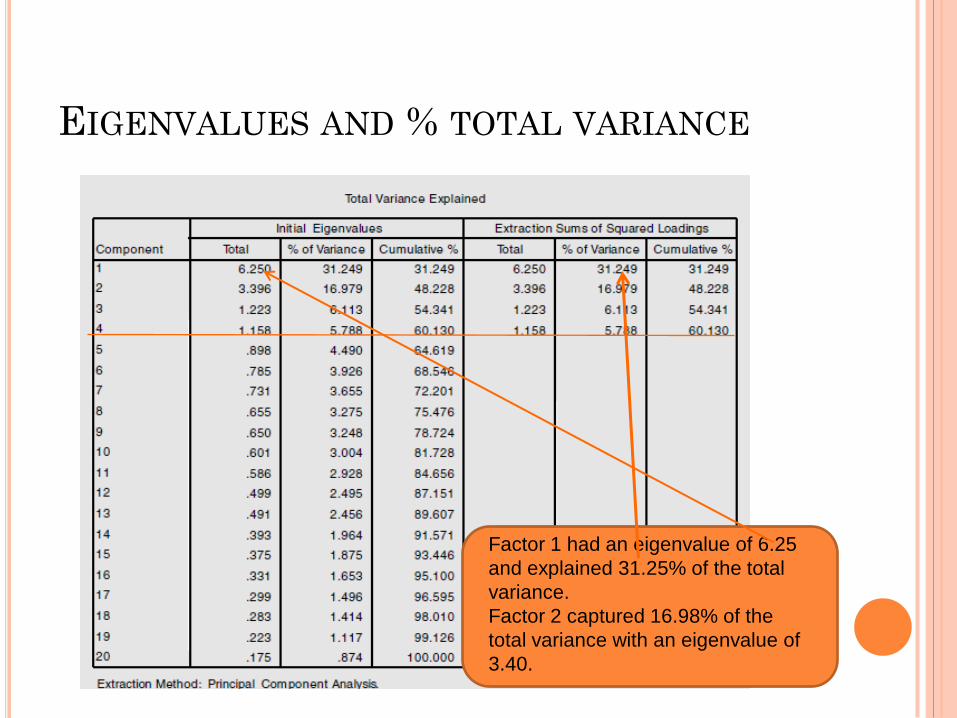
EIGENVALUES AND % TOTAL VARIANCE
Factor 1 had an eigenvalue of 6.25
and explained 31.25% of the total
variance.
Factor 2 captured 16.98% of the
total variance with an eigenvalue of
3.40.
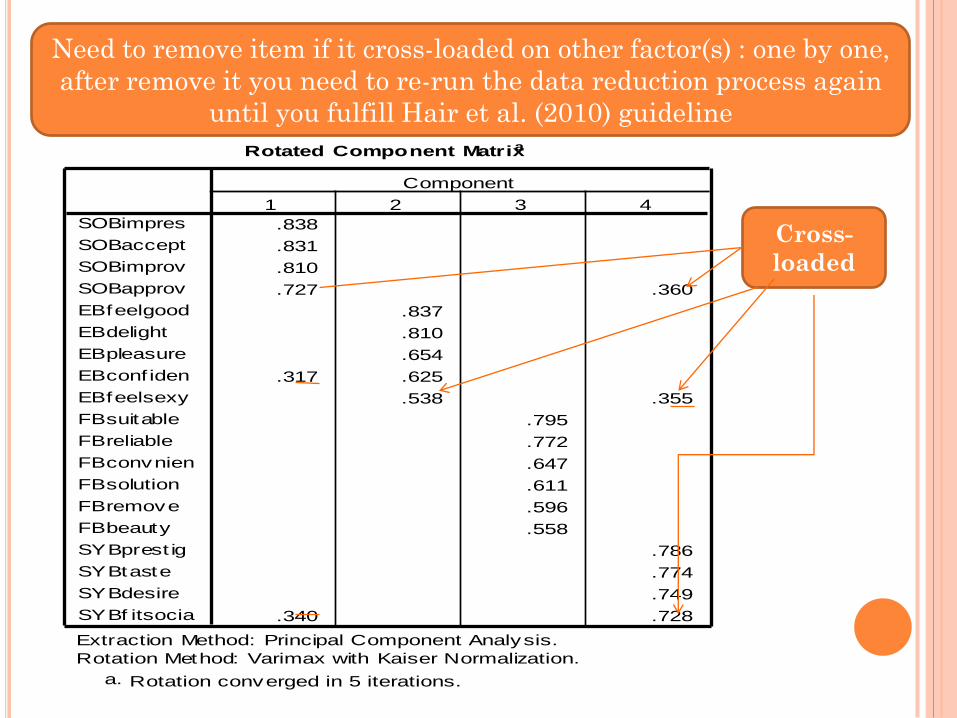
Rotated Component Matrixa
.838
.831
.810
.727 .360
.837
.810
.654
.317 .625
.538 .355
.795
.772
.647
.611
.596
.558
.786
.774
.749
.340 .728
SOBimpres
SOBaccept
SOBimprov
SOBapprov
EBfeelgood
EBdelight
EBpleasure
EBconf iden
EBfeelsexy
FBsuitable
FBreliable
FBconvnien
FBsolution
FBremove
FBbeauty
SYBprest ig
SYBtaste
SYBdesire
SYBf itsocia
1 2 3 4
Component
Extraction Method: Principal Component Analysis.
Rotation Method: Varimax with Kaiser Normalization.
Rotation converged in 5 iterations.a.
Need to remove item if it cross-loaded on other factor(s) : one by one,
after remove it you need to re-run the data reduction process again
until you fulfill Hair et al. (2010) guideline
Cross-
loaded
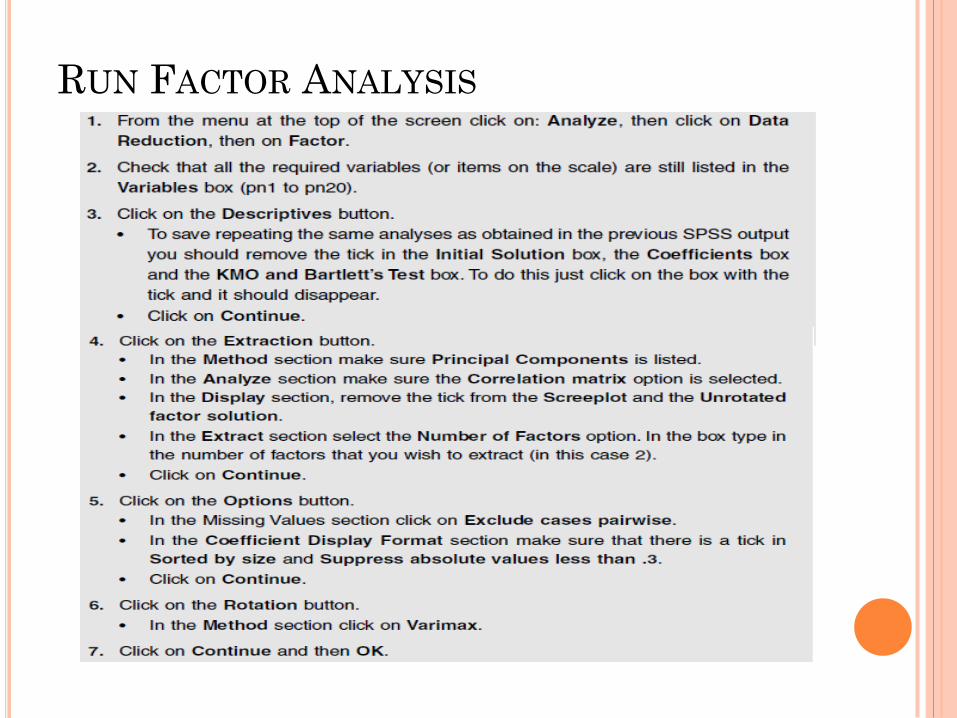
RUN FACTOR ANALYSIS
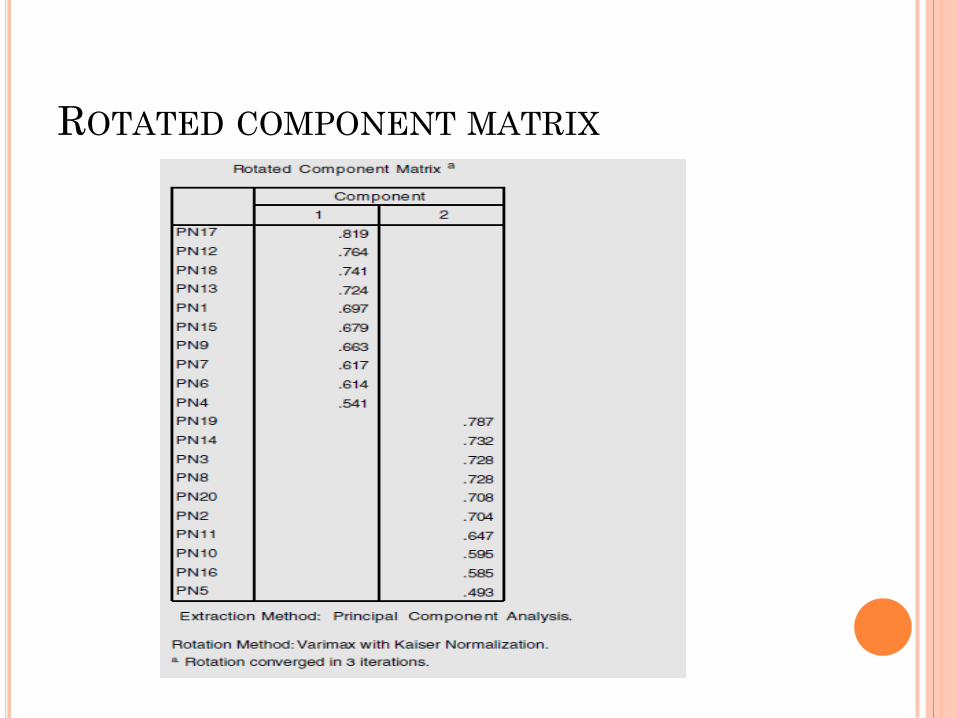
ROTATED COMPONENT MATRIX
LATIHAN 1: ANALISIS FAKTOR
SKALA IKSOKU-F
RELIABILITY TEST
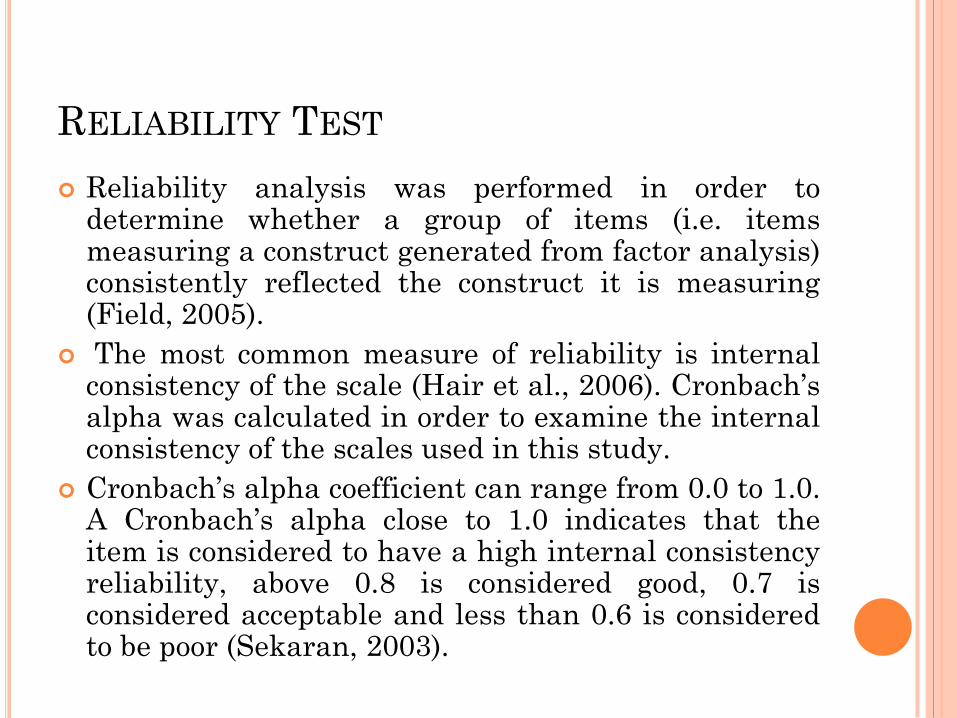
Reliability analysis was performed in order todetermine whether a group of items (i.e. itemsmeasuring a construct generated from factor analysis)consistently reflected the construct it is measuring(Field, 2005).
The most common measure of reliability is internalconsistency of the scale (Hair et al., 2006). Cronbach’salpha was calculated in order to examine the internalconsistency of the scales used in this study.
Cronbach’s alpha coefficient can range from 0.0 to 1.0.A Cronbach’s alpha close to 1.0 indicates that theitem is considered to have a high internal consistencyreliability, above 0.8 is considered good, 0.7 isconsidered acceptable and less than 0.6 is consideredto be poor (Sekaran, 2003).
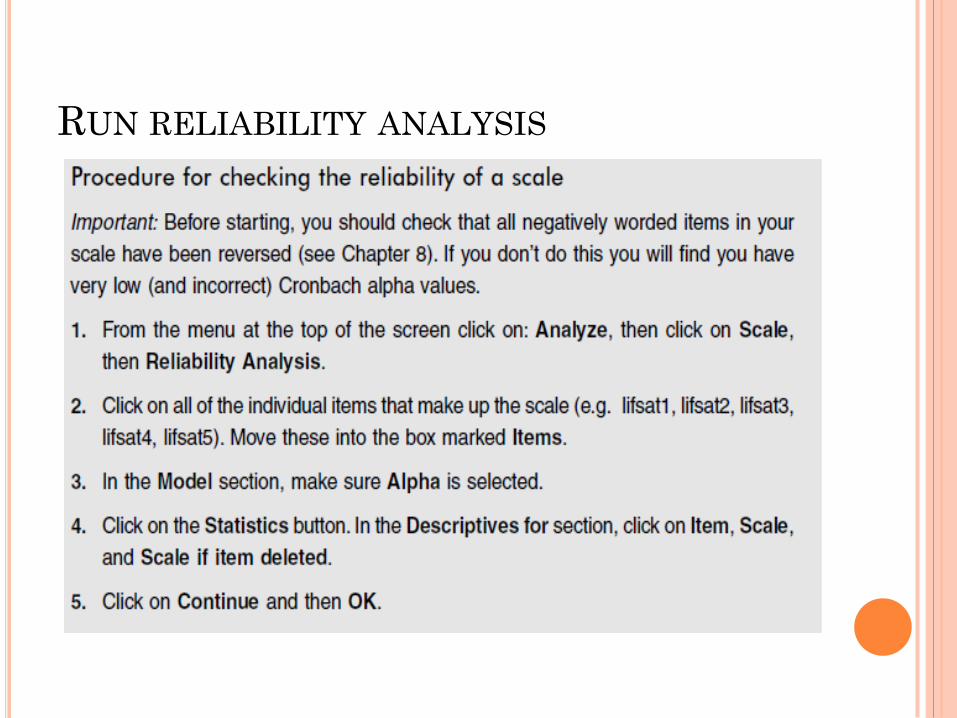
RUN RELIABILITY ANALYSIS
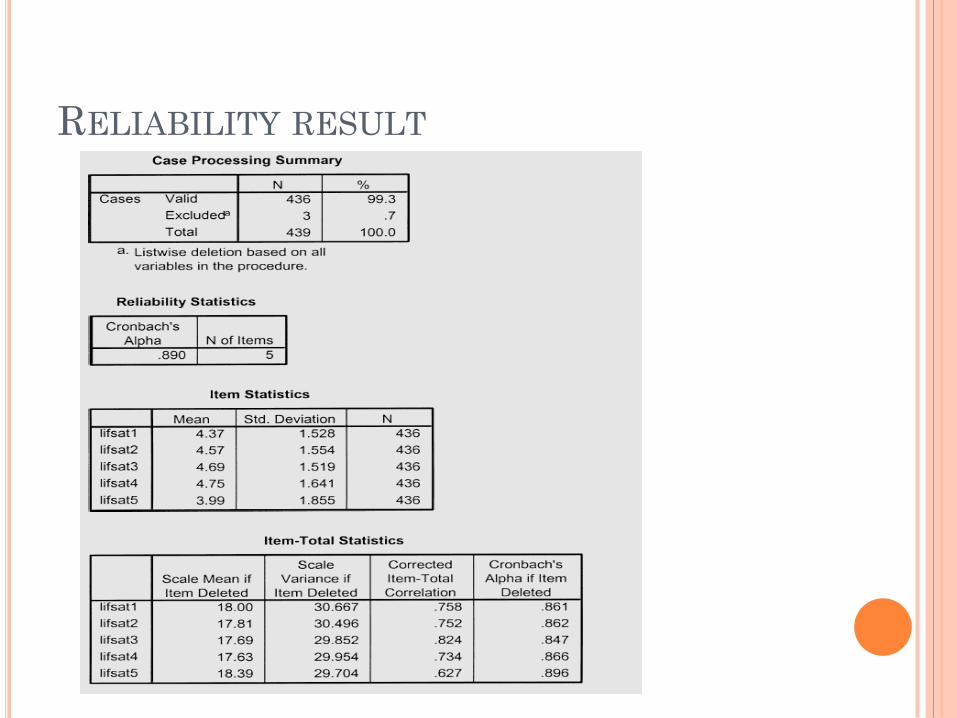
RELIABILITY RESULT
AFTER CHECKING RELIABILITY ANALYSIS
when you are satisfied with reliability analysis of
each of the dimensions and/or constructs that
was generated from the factor analysis
You need to compute the mean scores for each of
the dimensions and/or construct(s).
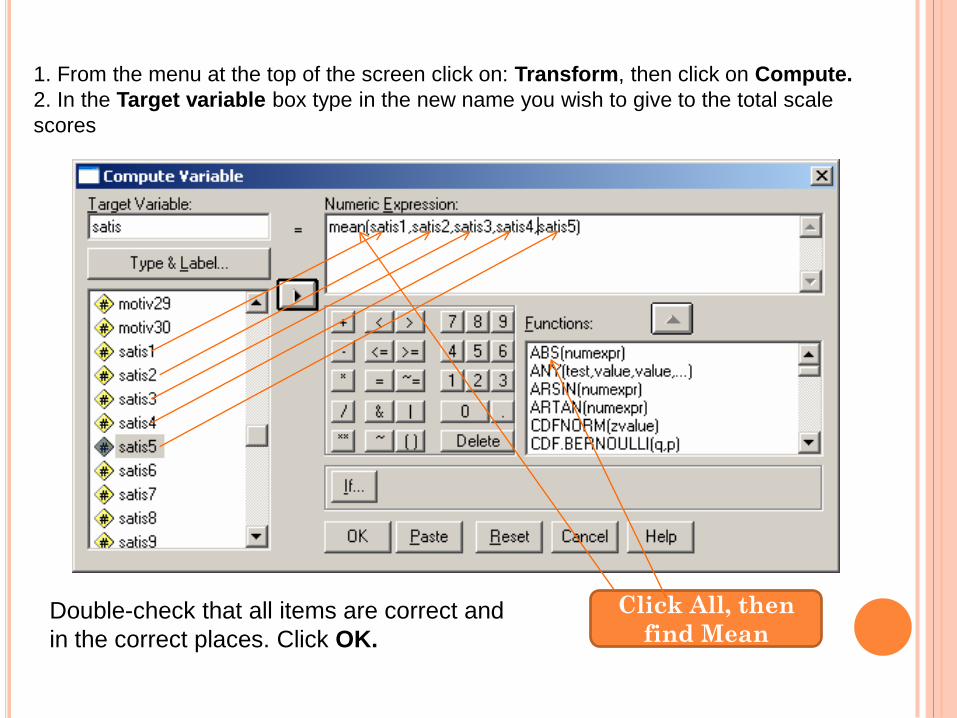
1. From the menu at the top of the screen click on: Transform, then click on Compute.
2. In the Target variable box type in the new name you wish to give to the total scale
scores
Click All, then
find MeanDouble-check that all items are correct and
in the correct places. Click OK.
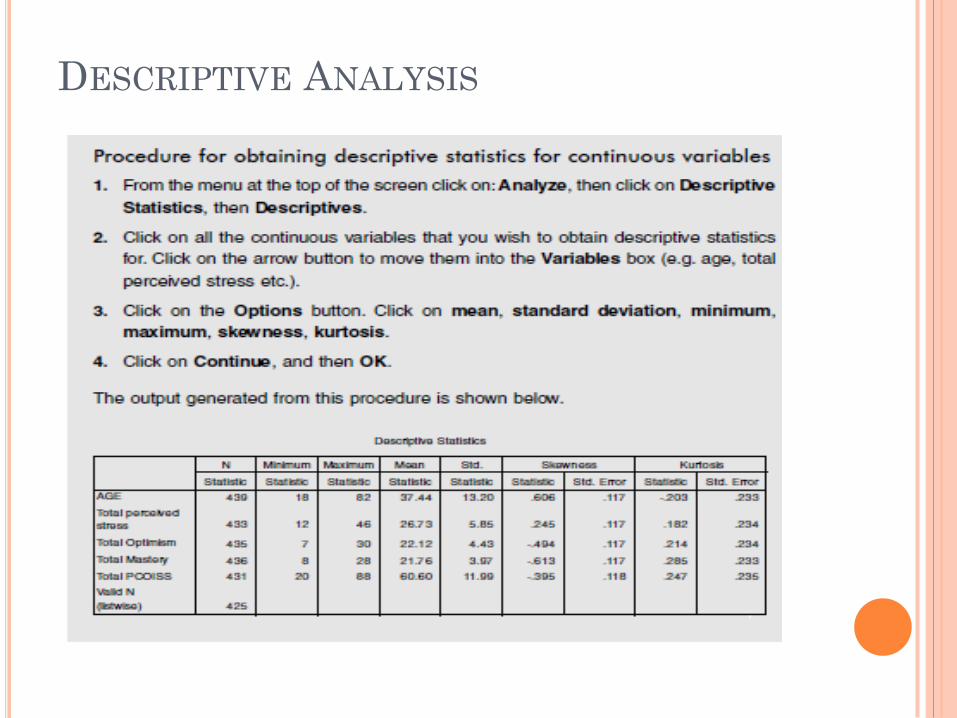
DESCRIPTIVE ANALYSIS
The mean and standard deviation values for all
of the study variables/dimension/construct.
Based upon the scale of 1 to 5, the mean scores
can be explained as:
a mean score that is less than 2 is rated as low,
a mean score between 2 to 4 is rated as average,
and
a mean score of greater 4 is rated as high.
DESCRIPTIVE ANALYSIS