Embed Size (px)
Citation preview
Cumbria County Council
Serving the people of Cumbria cumbria.gov.uk
Barrow Borough LocalPlan
Transport ModellingReport
August 2016

Barrow Borough Local Plan Transport Modelling Report
August 2016 Page i
Executive Summary
i. The Barrow Local Plan Transport Modelling Report summarises the transportmodelling study undertaken to assess the cumulative impact of the local planproposals. The results of this study inform the Barrow Transport ImprovementStudy which identifies potential transport improvements in Barrow. This reportsummarises the methodology and results of the modelling study and formspart of the evidence base for the Barrow Local Plan.
ii. The report used the Barrow transport model to assess the local planproposals. The Barrow transport model is a traffic model of the Barrow urbanarea and the surrounding district. It covers the morning and evening weekdaypeak periods and was updated in 2015 to consider the impact of BAESystems development in Barrow.
iii. The model was amended to include changes to the highway network, whichinclude proposed site accesses for the development sites. The trafficgeneration and distribution of future developments was also estimated andincluded within the model.
iv. The report considers future year of 2031 in line with the plan period. Trafficgrowth was applied to the base traffic demand to take account of forecastchanges in traffic demand in line with guidance from the Department ofTransport.
v. The results of the forecast scenarios were then analysed to assess the impactof the local plan proposals. The model outputs include traffic flows, queues,delays and the ratio of flow to capacity, which is a measure of congestion.
vi. The results show that congestion and journey times are forecast to increaseon key routes from 2014 to 2031 as a result of the local plan proposals.
vii. As part of this report the transport improvements identified in the BarrowTransport Improvement Study have also been tested in the Barrow transportmodel to assess their cumulative impact. The results of the assessment showthat the improvements would help to mitigate the transport impacts of the localplan. With the local plan and sustainable transport improvements, the numberof junction operating above the capacity would reduce significantly.
viii. Further details on the nature and cost of improvements proposed to supportthe Barrow Local Plan are provided in the Barrow Transport ImprovementsStudy report. The improvements study report forms part of the evidence basefor the local plan.
Barrow Borough Local Plan Transport Modelling Report
August 2016 Page ii
Contents
1 Introduction ........................................................................................................ 11.1 Introduction .......................................................................................................... 11.2 Contents .............................................................................................................. 1
2 Methodology ...................................................................................................... 22.1 Overview .............................................................................................................. 22.2 Barrow transport model ........................................................................................ 22.3 Forecasting .......................................................................................................... 3
3 Development scenarios .................................................................................... 43.1 Introduction .......................................................................................................... 43.2 Scenario 1: 2031 Base ......................................................................................... 53.3 Scenario 2: 2031 Local Plan ................................................................................ 63.4 Trip distribution .................................................................................................... 73.5 Summary of development scenarios .................................................................... 7
4 Traffic growth ..................................................................................................... 94.1 Introduction .......................................................................................................... 94.2 Forecast traffic demand ....................................................................................... 9
5 Results .............................................................................................................. 115.1 Introduction ........................................................................................................ 115.2 Scenario 1: 2031 Base results ........................................................................... 125.3 Scenario 2: 2031 Local Plan results ................................................................... 135.4 Improvement Schemes ...................................................................................... 145.5 Impact of junction Improvement ......................................................................... 155.6 Sustainable transport measures ........................................................................ 165.7 Network Statistics Comparison .......................................................................... 17
6 Summary .......................................................................................................... 20
7 Conclusion ....................................................................................................... 227.1 Summary ........................................................................................................... 22
Barrow Borough Local Plan Transport Modelling Report
August 2016 Page iii
Appendix
Appendix A:Figure A1: 2031 Base developmentFigure A2: 2031 Local Plan developmentSite details and trip generationTrip rates and TRICS output
Appendix B:Traffic growth factors
Appendix C:Figure C1: Forecast junction performance – Base NetworkFigure C2: Forecast junction performance – Local Plan NetworkFigure C3: Forecast junction performance – Local Plan Improvement NetworkFigure C4: Forecast junction performance – Local Plan Sustainable TransportNetwork
Appendix D Barrow Transport Improvements Study Report
Barrow Borough Local Plan Transport Modelling Report
August 2016 Page iv
List of Tables
Table 3.1: Scenario 1: 2031 Base trip generations .................................................... 5Table 3.2: Scenario 2: 2031 Local Plan trip generation .............................................. 6Table 3.3: Forecast development sites traffic demand ............................................... 8Table 4.1: Forecast traffic demand excluding specific development sites ................ 10Table 4.2: Forecast traffic demand including specific development sites ................. 10Table 5.1: Scenario 1 2031 Base: junction performance results .............................. 12Table 5.2: Scenario 1 2031 Base: journey time summary results............................. 12Table 5.3: Scenario 2 2031 Local Plan: junction performance results ...................... 13Table 5.4: Scenario 2 2031 Local Plan: journey time summary results .................... 13Table 5.5: Junctions Identified for Highway Improvement ........................................ 15Table 5.6: Scenario 2 2031 Local Plan: junction performance results ...................... 15Table 5.5: Local Plan Network Improvement: journey time summary results ........... 16Table 5.8: Sustainable Transport Improvement results ............................................ 17Table 5.9: Local Plan Sustainable Transport Improvement: journey time summaryresults ....................................................................................................................... 17Table 5.10: 2031 Barrow local plan network statistics .............................................. 18Table 6.1: Summary of over capacity junction performance results ......................... 20Table 6.2: Average speed across Barrow (kph) ....................................................... 20

Barrow Borough Local Plan Transport Modelling Report
August 2016 Page v
Barrow Borough Local Plan Transport Modelling Report
August 2016 Page 1
1 Introduction
1.1 Introduction
1.1.1 Cumbria County Council has undertaken a transport modelling report to helpsupport the development of Barrow Borough Council’s Local Plan. The plan isthe Barrow Borough Council’s strategy for growth from 2016 to 2031. TheBorough Council has a statutory duty to prepare a local plan, which will beused to guide development and inform planning decisions once adopted.
1.1.2 The purpose of the modelling report is to assess the cumulative transportimpact of the local plan proposals. The study identifies locations on thehighway network which are forecast to suffer increased delays as a result ofthe proposals.
1.1.3 This report summarises the methodology and results of the modelling reportfor the Barrow Borough Local Plan. A separate note on the modelling aspectswill be prepared for the National Grid North West Coastal Connectivity(NWCC) development.
1.1.4 The results of this report are used in further work to help identify potentialtransport improvements in the Barrow Transport Improvements Study. ThisStudy forms part of the evidence base for the Barrow Borough Local Plan.
1.2 Contents
1.2.1 The report includes the following information:
· The methodology of the transport study
· The assumptions used for forecasting future travel demand
· A summary of the key results
· Conclusions and recommendations
Barrow Borough Local Plan Transport Modelling Report
August 2016 Page 2
2 Methodology
2.1 Overview
2.1.1 The transport modelling report has been undertaken using Cumbria CountyCouncil’s Barrow transport model.
2.1.2 The methodology used was based on information available in the Departmentfor Transport’s Transport Analysis Guidance (TAG) and the Planning PracticalGuidance document Transport evidence bases in plan making .
2.2 Barrow transport model
2.2.1 The Barrow-in-Furness transport model has been used to assess the impactof the local plan development proposals on the highway network. The modelis a SATURN traffic model of the morning and evening weekday peak periods.The model was originally constructed with a base year of 2009 and wasupdated in 2012. The SATURN model was subsequently updated in 2015 totest the BAE Systems development proposal.
2.2.2 Further information on the Barrow-in-Furness transport model can be found inthe following reports:
· Traffic Data Report, Capita Symonds, December 2009;
· Local Model Validation Report, Capita Symonds, February 2010;
· 2012 Traffic Model Update, Cumbria County Council, March 2012; and
· BAE Systems, Barrow Transport Modelling Methodology and Results,November 2015
2.2.3 The 2015 update of the model included updating both the highway networkand the travel demand within the model. Following the update, the modeloutputs were compared against actual traffic data to validate the results of themodel.
Model Coverage
2.2.4 The Barrow-in-Furness transport model has been used to assess the impactof the local plan development proposals on the highway network. The Barrowtransport model is a strategic SATURN traffic model of the Barrow urban areaand surrounding district.
Peak Periods
2.2.5 The model covers the morning and evening weekday period periods of 8–9amand 4–5pm.
Vehicle and User Classes
Barrow Borough Local Plan Transport Modelling Report
August 2016 Page 3
2.2.6 The model considers car, light goods vehicle (van) and heavy goods vehicletrips. The car trips are segmented by 5 following trip purpose
i. Commuteii. Businessiii. Othersiv. LGVv. HGV
2.3 Forecasting
2.3.1 The report considered future years of 2031 in line with the plan period. Thesefuture year scenarios contained various assumptions relating to potentialchanges to the highway network and traffic demand.
2.3.2 The future year scenarios considered in this study are shown below. Moredetail on each scenario is provided in Section 3.
i. 2031 Base
ii. 2031 Local Plan
2.3.3 Traffic growth was applied to the base model to account for forecast changesin traffic demand. The growth was calculated based on best practice guidanceand future housing targets.
2.3.4 Committed changes to the highway network were included the model. Thesegenerally took the form of site accesses for specific sites. Highway networkchanges associated with the BAE Systems development are also included inthe model.
2.3.5 The traffic demand related to specific development sites were added to themodel. This involved estimating the traffic demand of each development, anddistributing these trips across the model.
2.3.6 The model outputs were used to assess the impact of these scenarios. Themodel outputs include traffic flows, forecast junction capacity, queues anddelays.
2.3.7 The outputs from the model have been used to inform a further study whichidentifies potential transport improvements in Barrow. The improvementsstudy identifies potential measures and costs and assesses theireffectiveness using detailed junction modelling software like ARCADY,PICADY and LinSIG.
2.3.8 Further details on the nature and cost of improvements proposed to supportthe Barrow Local Plan will be provided in the Barrow Transport ImprovementsStudy report by WSP.
Barrow Borough Local Plan Transport Modelling Report
August 2016 Page 4
3 Development scenarios
3.1 Introduction
3.1.1 A number of future year demand scenarios were considered as part of thestudy. The future year demand scenarios are summarised below:
1. 2031 Base:
2. 2031 Local Plan: includes the Local Plan proposals for housing,employment, retail and leisure.
3. Local Plan and the major development impacts associated with the NorthWest Coastal Connection project (peak construction) is also consideredthough not included in this report. A separate technical note is preparedwhich deals with the impact of NWCC development.
3.1.2 Scenario 1, 2031 Base, is the reference case scenario. It includesdevelopments which have planning permission and live applications with thepotential to gain permission soon. Other developments that are likely to gainplanning permission and be constructed by 2031 will be included whereinformation is available; this will include the proposals at BAE and theextension to Walney Windfarm. This is not meant to be prejudicial to theplanning process and is based on guidance on uncertainty as defined byTable A2 in TAG Unit M4 forecasting and uncertainty .
3.1.3 Scenario 2, 2031 Local Plan, is the local plan scenario. As well as thedevelopment in Scenario 1, it includes all local plan proposals for housing,employment and leisure.
3.1.4 Scenario 3 considers the cumulative impact of the local plan developmentsand the other major development impacts on the highway network in Barrow.Impacts associated with the North West Coastal Connections and 2026Moorside developments (peak construction) are considered in this scenario.
3.1.5 The modelling report will provide results for the all scenarios except scenario3. This is because scenario 3 is a National Significance Important Scheme(NSIP). The transport modelling for scenario 3 is undertaken separately and adetailed modelling report will be prepared.
Traffic Generation
3.1.6 The estimated traffic demand for all developments in these scenarios wasestimated using the industry standard TRICS database. TRICS is a databaseof traffic and person surveys from different development sites throughout theUK. TRICS is used to estimate the trip generation of a proposed developmentby selecting surveys from similar sites in the database based on use class,size and location. The output of TRICS includes a trip rate which estimatesthe traffic or person trip generation per unit of the proposed development.
Barrow Borough Local Plan Transport Modelling Report
August 2016 Page 5
3.1.7 A separate TRICS analysis was undertaken for each development typeincluded in the future year scenarios. More details on the developmentassumptions and trip generation in each scenario is provided in the followingsections. The trip rates and overall trip generation are provided in theappendix.
3.2 Scenario 1: 2031 Base
3.2.1 Scenario 1 consists of the following assumptions
· Developments which have been completed between October 2014 andApril 2016
· Developments which have been granted planning permission
· Developments where planning application has been outlined as of April2016 which have not yet been determined but are likely to receiveplanning permission.
3.2.2 Scenario 1 includes a mix of development types, and included residential,offices, health, light industrial and warehousing.
3.2.3 The development included in Scenario 1 includes the following:
· 711 residential dwellings
· BAE Logistic facility
· Mixed/other developments, including:o GP's Primary Care, Ambulance base and a pharmacyo Relocation of Furness College
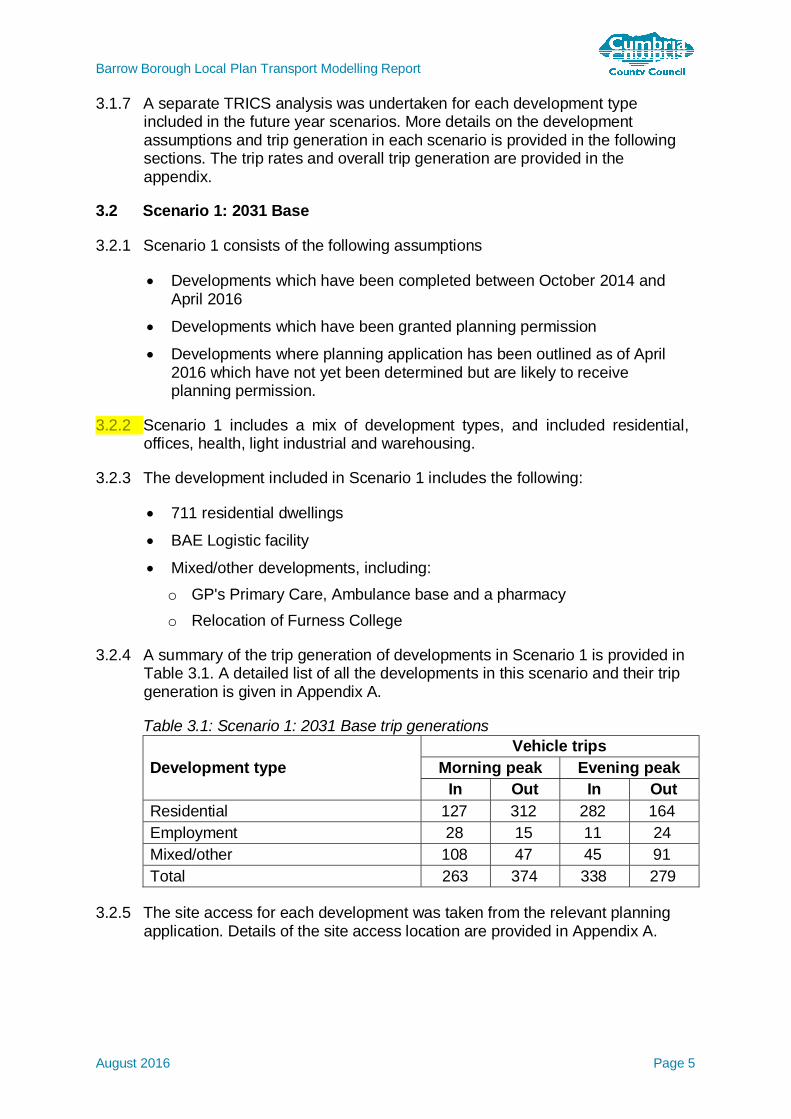
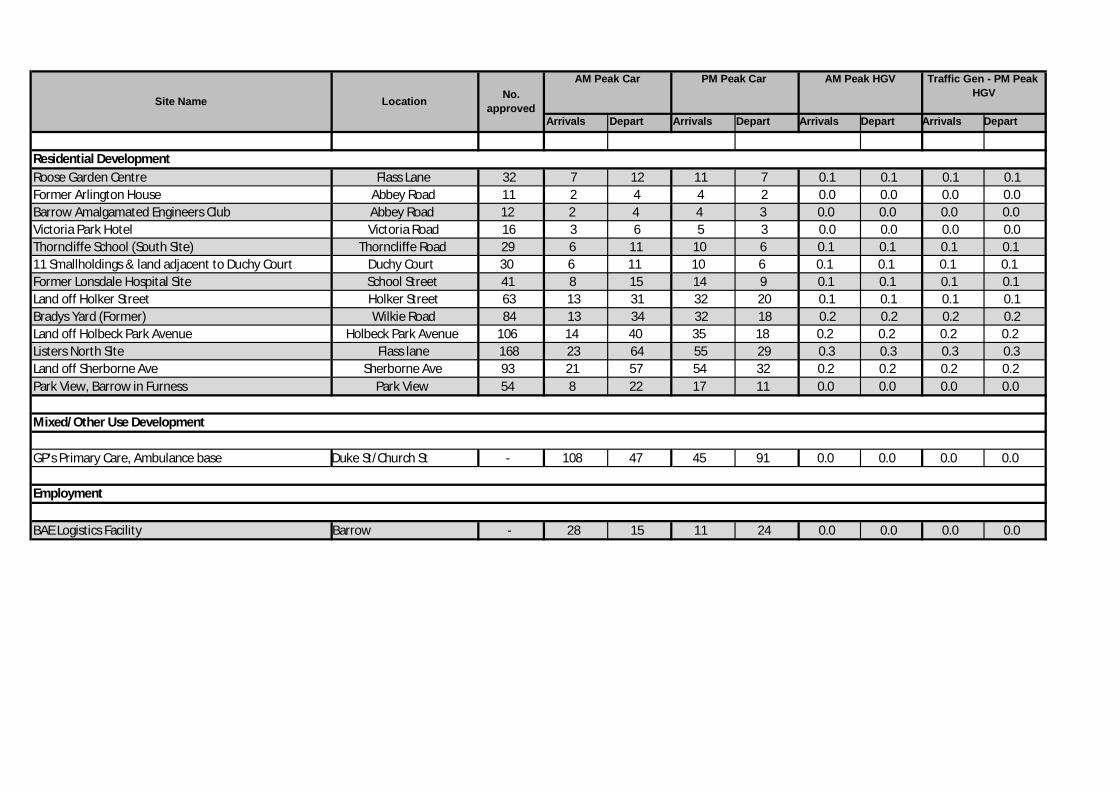
3.2.4 A summary of the trip generation of developments in Scenario 1 is provided inTable 3.1. A detailed list of all the developments in this scenario and their tripgeneration is given in Appendix A.
Table 3.1: Scenario 1: 2031 Base trip generations
Development typeVehicle trips
Morning peak Evening peakIn Out In Out
Residential 127 312 282 164Employment 28 15 11 24Mixed/other 108 47 45 91Total 263 374 338 279
3.2.5 The site access for each development was taken from the relevant planningapplication. Details of the site access location are provided in Appendix A.
Barrow Borough Local Plan Transport Modelling Report
August 2016 Page 6
3.3 Scenario 2: 2031 Local Plan
3.3.1 Scenario 2 considers specific development sites identified in the local plan upto 2031. Similar to Scenario 1, it includes a mix of development types. A planshowing the location of development sites in Scenario 2 is provided in theappendix as Figure A2 in Appendix A.
3.3.2 The development included in Scenario 2 includes the following:
· Residential dwellings, including:o 1,382 residential dwellings in Barrow including 600 residential units for
Marina Village;o 338 residential dwellings in Dalton;o 124 residential units in Askam and Irleth;o 36 residential dwellings in Lindal; ando 107 residential units at other broad locations within the Barrow-in-
Furness local authority.
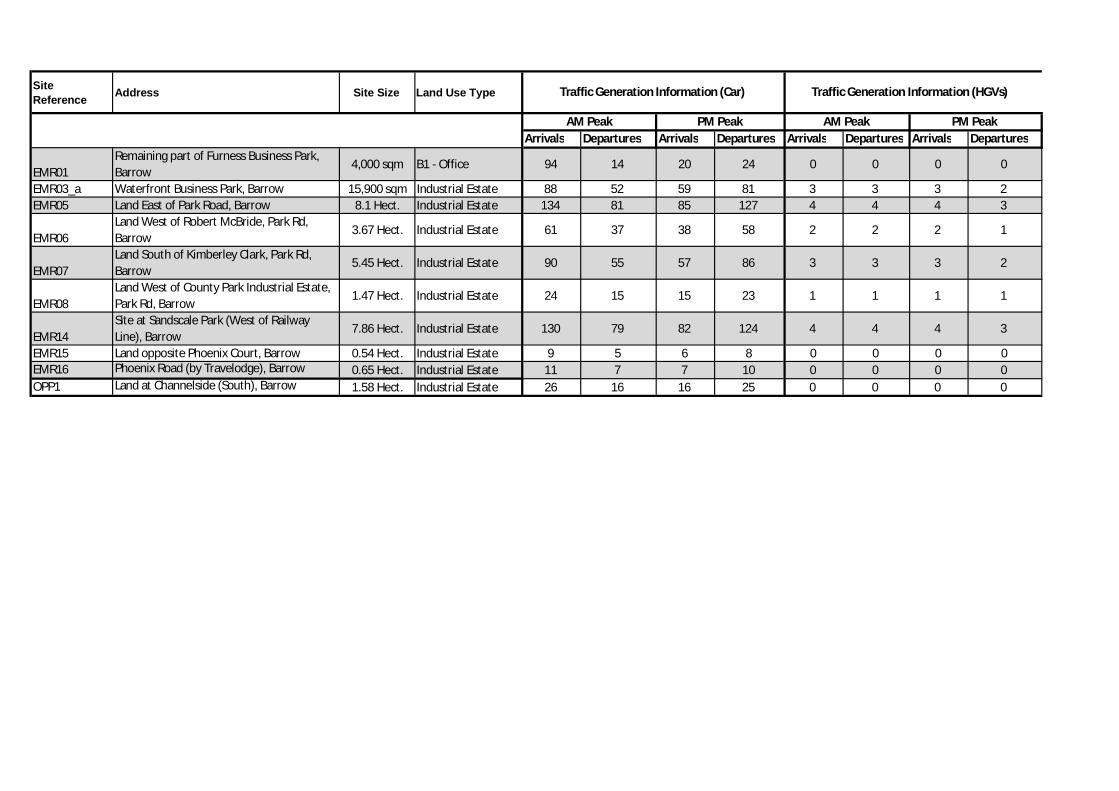
· Employment/mixed use development, including:
o 29.3 hectors of B1, B2 and B8 employment land around Barrow;
o 15,900 sqm of strategic employment site in Furness Business Park,Barrow; and
o 4,000 sqm of B1 – office.
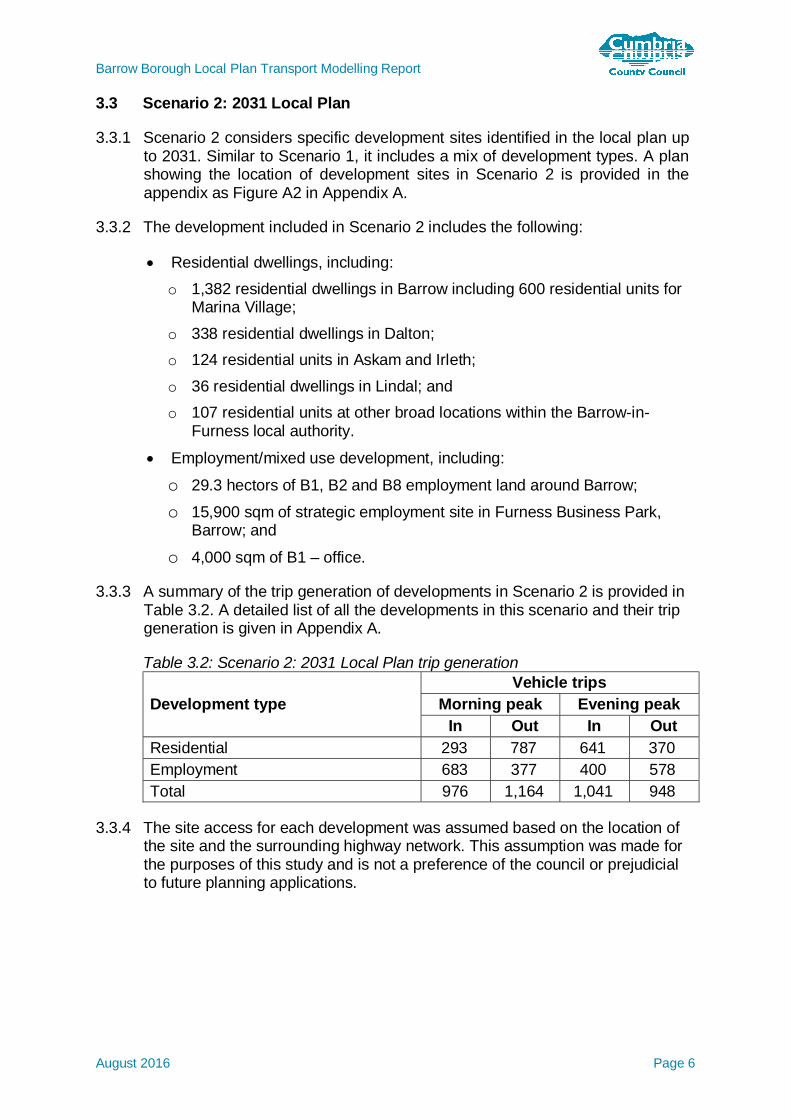
3.3.3 A summary of the trip generation of developments in Scenario 2 is provided inTable 3.2. A detailed list of all the developments in this scenario and their tripgeneration is given in Appendix A.
Table 3.2: Scenario 2: 2031 Local Plan trip generation
Development typeVehicle trips
Morning peak Evening peakIn Out In Out
Residential 293 787 641 370Employment 683 377 400 578Total 976 1,164 1,041 948
3.3.4 The site access for each development was assumed based on the location ofthe site and the surrounding highway network. This assumption was made forthe purposes of this study and is not a preference of the council or prejudicialto future planning applications.
Barrow Borough Local Plan Transport Modelling Report
August 2016 Page 7
3.4 Trip distribution
3.4.1 The trips generated by each new development were distributed across themodel using a synthetic gravity model. A gravity model distributes trips basedon an assumed relationship between the length of a trip and the number oftrips made. Traffic is therefore distributed based on the total forecast trafficgeneration and the cost of travel between origins and destinations in themodel.
3.4.2 The cost of travel varies depending on trip purpose, so a separate model wasused for each trip purpose. The trips were disaggregated by purpose usingdata from NTEM.
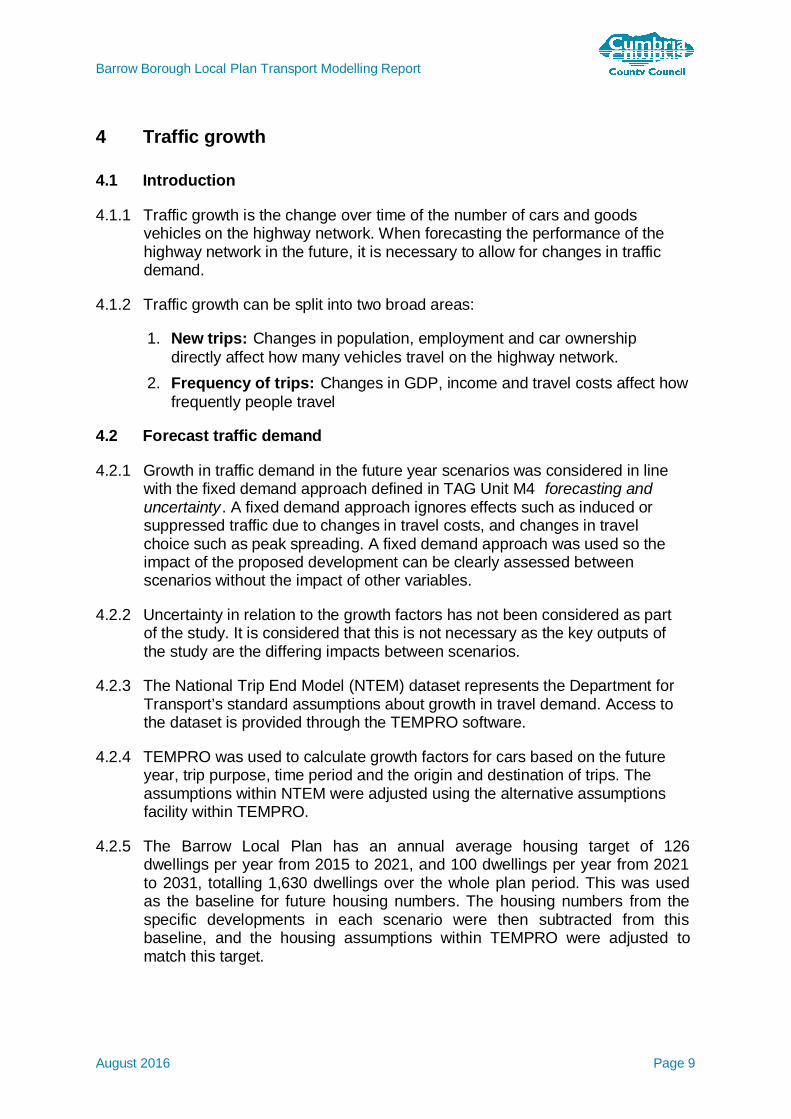
3.4.3 The gravity model used for trip distribution in this study was of the form
= ൫൯ (1)ܦߙ
where is the number of trips between origin and destination , is a ߙproportionality factor, is the total number of trips starting at origin , is theܦtotal number of trips ending at destination and ( ) is a generalisedfunction of travel costs known as the deterrence function.
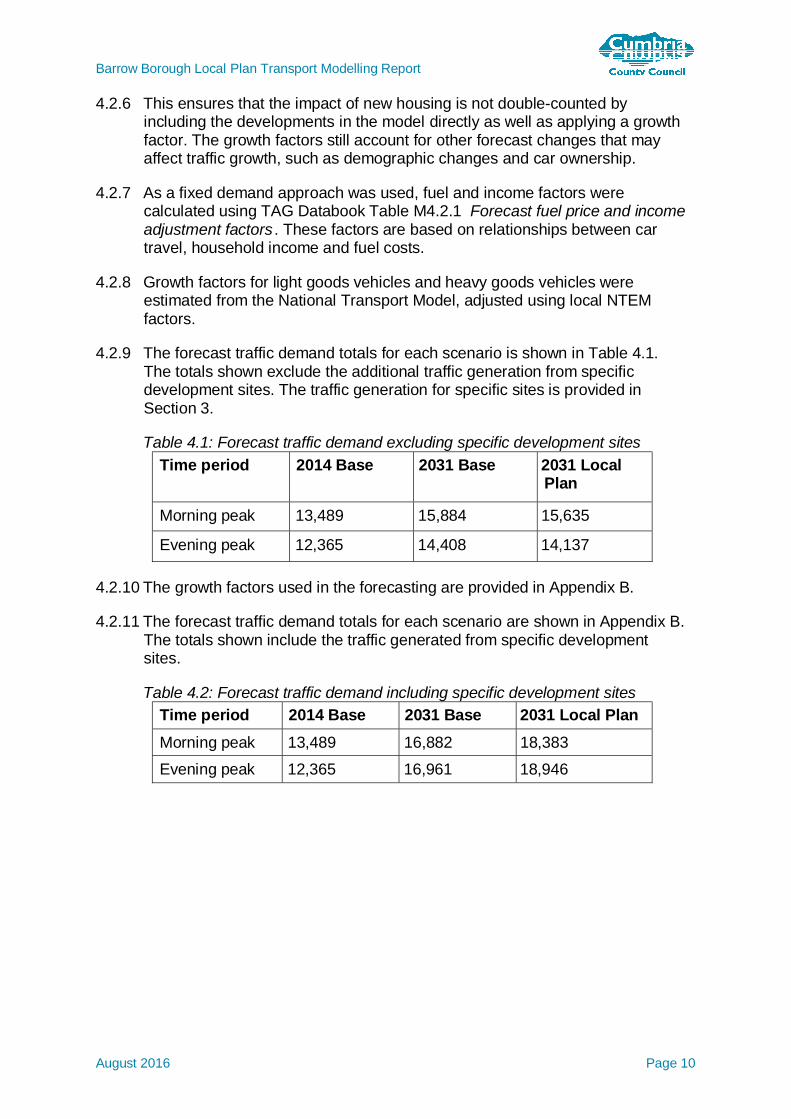
3.4.4 The deterrence function used was of the form
൫൯ = ఉೕ (2)
where is the cost of travel between origin and destination and are ߚ,parameters to be defined.
3.4.5 Finally, the furness procedure was applied to the future year matrix to ensurethe trip totals for each development are correct.
3.4.6 It should be noted that the assumptions regarding the highway network andtraffic demand in small rural settlements included in the model are simplistic.The network only includes key routes and traffic demand is aggregated intobroad locations. This means that the costs used within the gravity model areoften inaccurate for new trips that could potentially stay within the ruralsettlements. The result of this is that trips generated by new developments inrural locations are all external to that settlement. This represents a pessimisticassessment of trip generation on the wider highway network that is likely to bean overestimate.
3.5 Summary of development scenarios
3.5.1 The forecast traffic demand from development sites is shown in Table 3.3.The totals are cumulative, so the 2031 Local Plan totals include trafficdemand from the 2031 Base scenario.

Barrow Borough Local Plan Transport Modelling Report
August 2016 Page 8
Table 3.3: Forecast development sites traffic demandTime period 2014 Base 2031 Base 2031 Local
PlanMorning peak 0 998 2,747
Evening peak 0 2,553 4,809
Barrow Borough Local Plan Transport Modelling Report
August 2016 Page 9
4 Traffic growth
4.1 Introduction
4.1.1 Traffic growth is the change over time of the number of cars and goodsvehicles on the highway network. When forecasting the performance of thehighway network in the future, it is necessary to allow for changes in trafficdemand.
4.1.2 Traffic growth can be split into two broad areas:
1. New trips: Changes in population, employment and car ownershipdirectly affect how many vehicles travel on the highway network.
2. Frequency of trips: Changes in GDP, income and travel costs affect howfrequently people travel
4.2 Forecast traffic demand
4.2.1 Growth in traffic demand in the future year scenarios was considered in linewith the fixed demand approach defined in TAG Unit M4 forecasting anduncertainty. A fixed demand approach ignores effects such as induced orsuppressed traffic due to changes in travel costs, and changes in travelchoice such as peak spreading. A fixed demand approach was used so theimpact of the proposed development can be clearly assessed betweenscenarios without the impact of other variables.
4.2.2 Uncertainty in relation to the growth factors has not been considered as partof the study. It is considered that this is not necessary as the key outputs ofthe study are the differing impacts between scenarios.
4.2.3 The National Trip End Model (NTEM) dataset represents the Department forTransport’s standard assumptions about growth in travel demand. Access tothe dataset is provided through the TEMPRO software.
4.2.4 TEMPRO was used to calculate growth factors for cars based on the futureyear, trip purpose, time period and the origin and destination of trips. Theassumptions within NTEM were adjusted using the alternative assumptionsfacility within TEMPRO.
4.2.5 The Barrow Local Plan has an annual average housing target of 126dwellings per year from 2015 to 2021, and 100 dwellings per year from 2021to 2031, totalling 1,630 dwellings over the whole plan period. This was usedas the baseline for future housing numbers. The housing numbers from thespecific developments in each scenario were then subtracted from thisbaseline, and the housing assumptions within TEMPRO were adjusted tomatch this target.
Barrow Borough Local Plan Transport Modelling Report
August 2016 Page 10
4.2.6 This ensures that the impact of new housing is not double-counted byincluding the developments in the model directly as well as applying a growthfactor. The growth factors still account for other forecast changes that mayaffect traffic growth, such as demographic changes and car ownership.
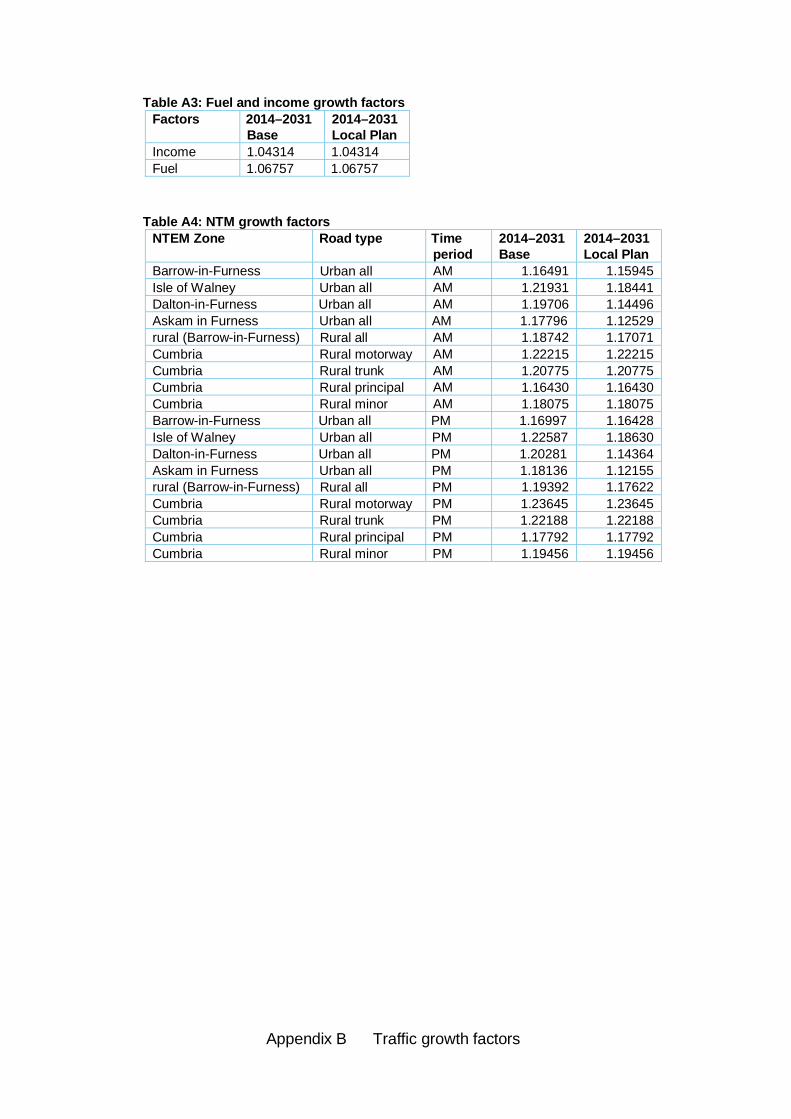
4.2.7 As a fixed demand approach was used, fuel and income factors werecalculated using TAG Databook Table M4.2.1 Forecast fuel price and incomeadjustment factors . These factors are based on relationships between cartravel, household income and fuel costs.
4.2.8 Growth factors for light goods vehicles and heavy goods vehicles wereestimated from the National Transport Model, adjusted using local NTEMfactors.
4.2.9 The forecast traffic demand totals for each scenario is shown in Table 4.1.The totals shown exclude the additional traffic generation from specificdevelopment sites. The traffic generation for specific sites is provided inSection 3.
Table 4.1: Forecast traffic demand excluding specific development sitesTime period 2014 Base 2031 Base 2031 Local
Plan
Morning peak 13,489 15,884 15,635
Evening peak 12,365 14,408 14,137
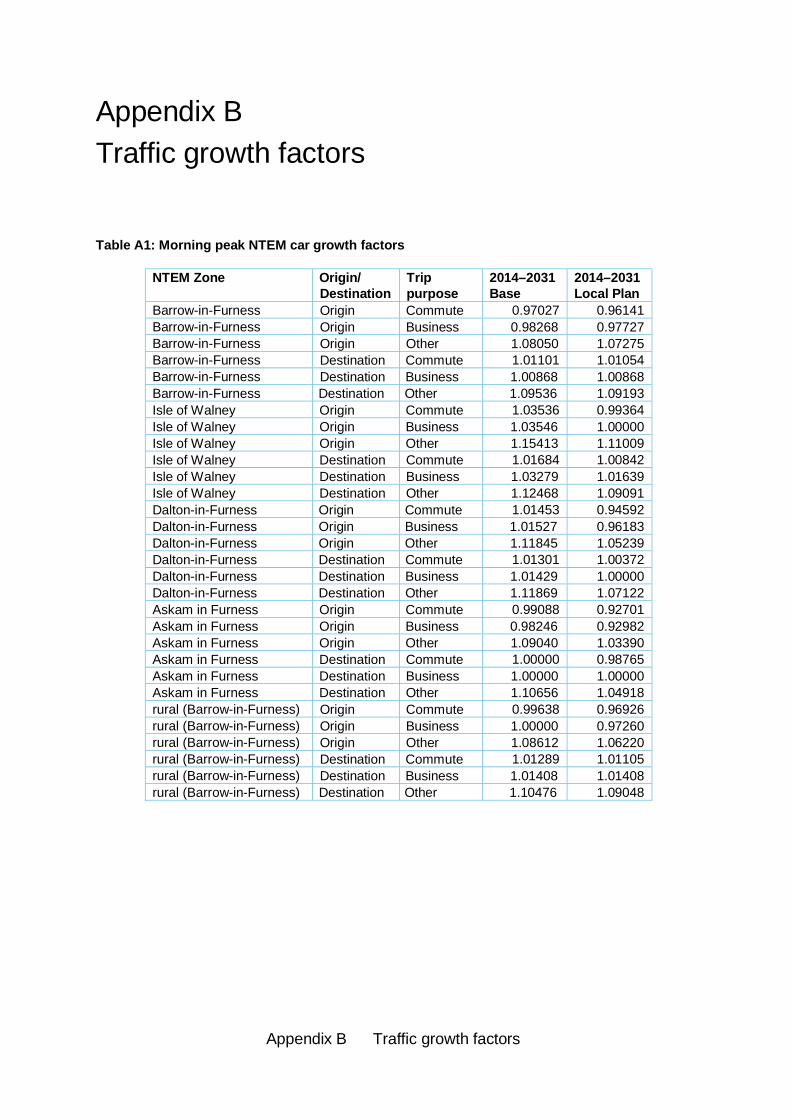
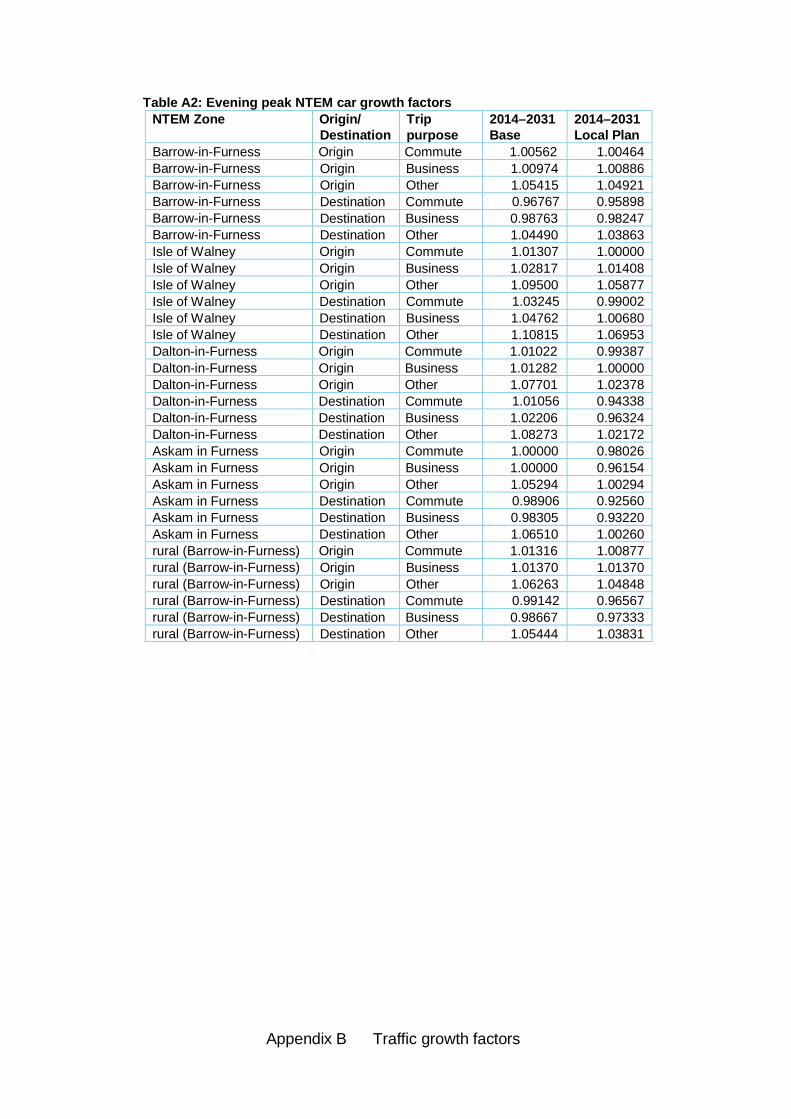
4.2.10 The growth factors used in the forecasting are provided in Appendix B.
4.2.11 The forecast traffic demand totals for each scenario are shown in Appendix B.The totals shown include the traffic generated from specific developmentsites.
Table 4.2: Forecast traffic demand including specific development sitesTime period 2014 Base 2031 Base 2031 Local PlanMorning peak 13,489 16,882 18,383
Evening peak 12,365 16,961 18,946
Barrow Borough Local Plan Transport Modelling Report
August 2016 Page 11
5 Results
5.1 Introduction
5.1.1 The forecast scenarios were created by amending the network to include newaccesses, applying traffic growth and including additional development trafficto the validated base model.
5.1.2 The measures identified in the improvements report have also been tested inthe strategic model as part of this study to assess their cumulative impact.This is important as improvements to capacity in one location may havefurther impacts at other locations.
5.1.3 The forecast scenarios also included a traffic signal optimising procedure. Thesignal timings contained within the model are fixed, and changes in traffic flowdue to developments may result in the original timings becominginappropriate. The majority of signalised junctions within Barrow operate on asystem which coordinates signal timings, so junction capacity at theselocations may be underestimated without optimisation.
5.1.4 The results of the forecast scenarios were then analysed. The model outputsinclude traffic flows, queues, delays, and the Ratio of Flow to Capacity (RFC)for junctions and links in the model.
5.1.5 The RFC of a movement at a junction is a measure of the congestion of thatmovement. A movement with a capacity of 1,000 vehicles per hour and atraffic demand of 900 vehicles per hour has an RFC of 0.9.
5.1.6 The maximum ideal junction performance is when all movements have anRFC of around 0.85–0.9. A junction is defined as operating over capacity if ithas a movement with an RFC greater than one. Over capacity junctionsexperience an increased sensitivity to variations in traffic flow which manifestin unreliable journey times and an increase in queuing.
5.1.7 The RFC results for key junctions in the model are included as Table C1 andFigures C1–C3 in Appendix C 1. This details the maximum RFC for anymovement at each junction for each forecast scenario. This also details theresults for the tested improvement schemes.
5.1.8 The RFC of a junction can be an abstract concept as it is not easy to relate towhen travelling along a road. To counter this, the impact of development canalso be assessed by using journey times. Seven routes along key corridorshave been selected for journey time analysis, with separate journey timescalculated for each direction of travel. These routes are presented below.
1 The RFCs presented in the appendix vary slightly when compared to those in the Barrow TransportImprovements Study. This is due to minor amendments to the model to correct errors identified duringthe infrastructure study. These small variations do not alter the conclusions of either study.
Barrow Borough Local Plan Transport Modelling Report
August 2016 Page 12
· Bridge Road to Park Road northbound
· Abbey Road (John Whinnerah Roundabout) to Park Road
· Leece Lane, Roose to Hindpool Rd
· Bank Lane to Friars Lane/Roose Rd
· Crossmill Road to A5087/ Leece Lane/ Roose Rd
· Ulverston Rd/Urswick Rd junction to Abbey Road/Long Lane viaMarket St. Dalton
5.1.9 Finally, it should be noted that these results are average results for the wholepeak hour and represent what is forecast to typically occur. As junctionoperation approaches capacity junction performance becomes more sensitiveto variations in traffic flow. This means that small changes in traffic flow canresult in large increases in queuing and delay throughout the peak hour.
5.1.10 The following sections summarise the RFC and journey time results from themodel for each scenario. The RFC figure for each peak period is from themovement with the highest RFC value.
5.2 Scenario 1: 2031 Base results
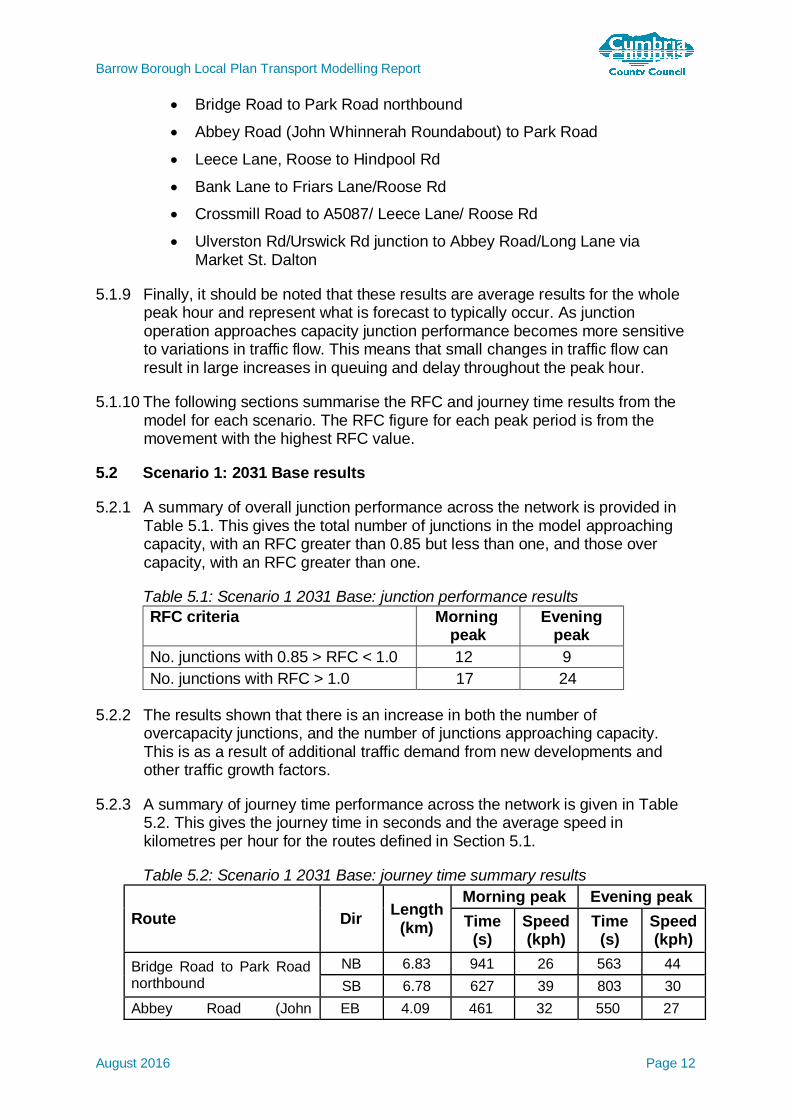
5.2.1 A summary of overall junction performance across the network is provided inTable 5.1. This gives the total number of junctions in the model approachingcapacity, with an RFC greater than 0.85 but less than one, and those overcapacity, with an RFC greater than one.
Table 5.1: Scenario 1 2031 Base: junction performance resultsRFC criteria Morning
peakEvening
peakNo. junctions with 0.85 > RFC < 1.0 12 9No. junctions with RFC > 1.0 17 24
5.2.2 The results shown that there is an increase in both the number ofovercapacity junctions, and the number of junctions approaching capacity.This is as a result of additional traffic demand from new developments andother traffic growth factors.
5.2.3 A summary of journey time performance across the network is given in Table5.2. This gives the journey time in seconds and the average speed inkilometres per hour for the routes defined in Section 5.1.
Table 5.2: Scenario 1 2031 Base: journey time summary results
Route Dir Length(km)
Morning peak Evening peakTime
(s)Speed(kph)
Time(s)
Speed(kph)
Bridge Road to Park Roadnorthbound
NB 6.83 941 26 563 44SB 6.78 627 39 803 30
Abbey Road (John EB 4.09 461 32 550 27
Barrow Borough Local Plan Transport Modelling Report
August 2016 Page 13
Route Dir Length(km)
Morning peak Evening peakTime
(s)Speed(kph)
Time(s)
Speed(kph)
Whinnerah Roundabout) toPark Road WB 4.09 462 32 506 29
Leece Lane, Roose toHindpool Road
EB 3.31 353 34 483.3 25WB 3.31 397 30 355 34
Bank Lane to NB 3.95 333 43 350 41Friars Lane/Roose Road SB 3.95 381 37 421 34
Crossmill Road to A5087/Leece Lane/ Roose Road
EB 3.43 383 31 509 24WB 3.43 466 26 425 30
Ulverston Road/UrswickRoad junction to AbbeyRoad/Long Lane via MarketStreet Dalton
NB 2.89 364 28 280 37
SB 2.89 270 38 269 39
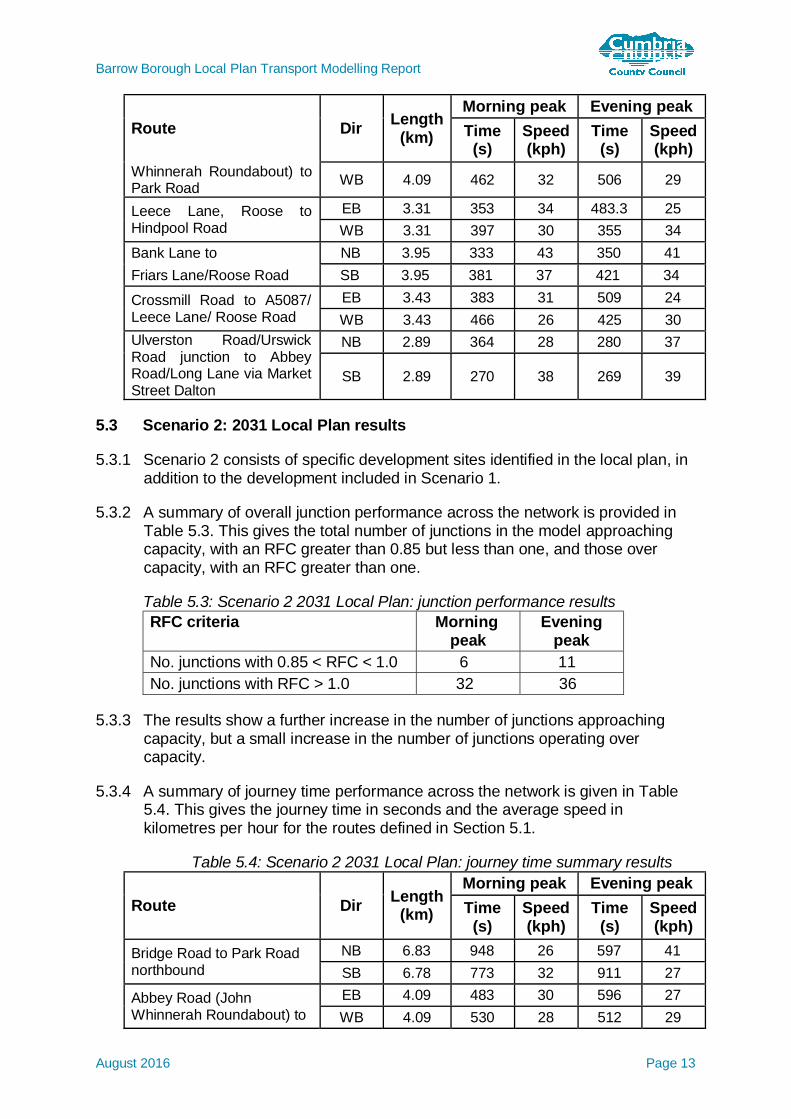
5.3 Scenario 2: 2031 Local Plan results
5.3.1 Scenario 2 consists of specific development sites identified in the local plan, inaddition to the development included in Scenario 1.
5.3.2 A summary of overall junction performance across the network is provided inTable 5.3. This gives the total number of junctions in the model approachingcapacity, with an RFC greater than 0.85 but less than one, and those overcapacity, with an RFC greater than one.
Table 5.3: Scenario 2 2031 Local Plan: junction performance resultsRFC criteria Morning
peakEvening
peakNo. junctions with 0.85 < RFC < 1.0 6 11No. junctions with RFC > 1.0 32 36
5.3.3 The results show a further increase in the number of junctions approachingcapacity, but a small increase in the number of junctions operating overcapacity.
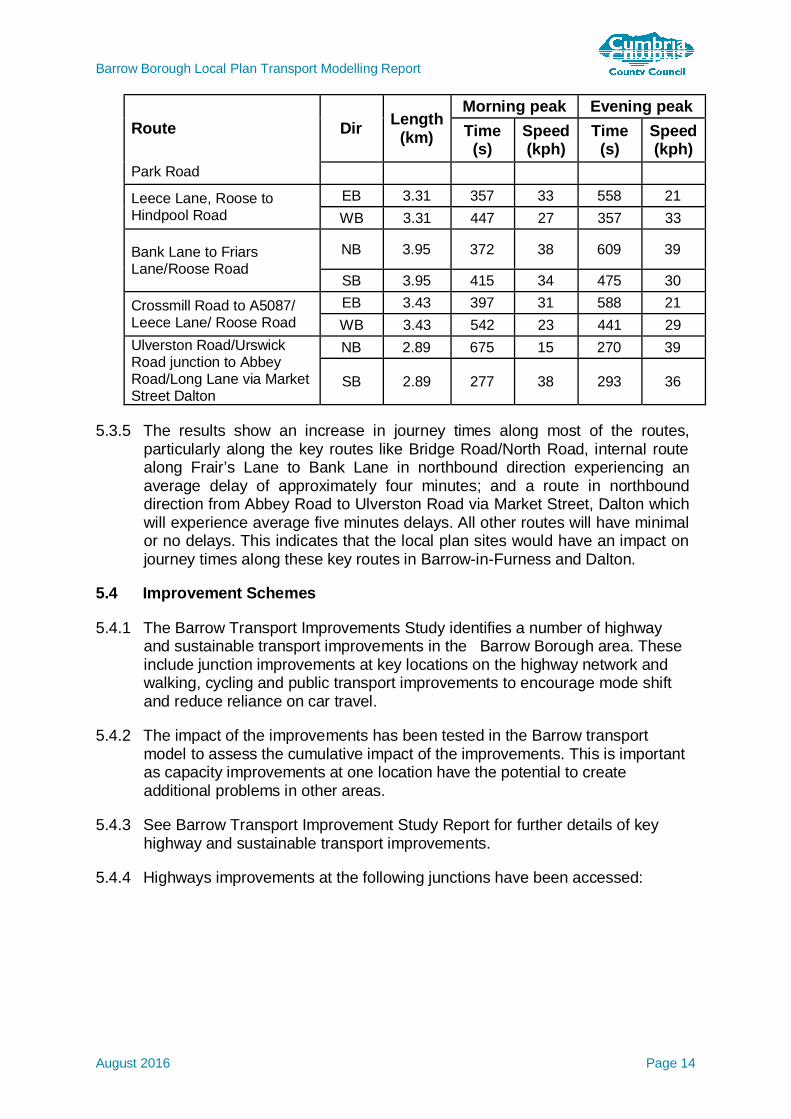
5.3.4 A summary of journey time performance across the network is given in Table5.4. This gives the journey time in seconds and the average speed inkilometres per hour for the routes defined in Section 5.1.
Table 5.4: Scenario 2 2031 Local Plan: journey time summary results
Route Dir Length(km)
Morning peak Evening peakTime
(s)Speed(kph)
Time(s)
Speed(kph)
Bridge Road to Park Roadnorthbound
NB 6.83 948 26 597 41SB 6.78 773 32 911 27
Abbey Road (JohnWhinnerah Roundabout) to
EB 4.09 483 30 596 27WB 4.09 530 28 512 29
Barrow Borough Local Plan Transport Modelling Report
August 2016 Page 14
Route Dir Length(km)
Morning peak Evening peakTime
(s)Speed(kph)
Time(s)
Speed(kph)
Park Road
Leece Lane, Roose toHindpool Road
EB 3.31 357 33 558 21WB 3.31 447 27 357 33
Bank Lane to FriarsLane/Roose Road
NB 3.95 372 38 609 39
SB 3.95 415 34 475 30
Crossmill Road to A5087/Leece Lane/ Roose Road
EB 3.43 397 31 588 21WB 3.43 542 23 441 29
Ulverston Road/UrswickRoad junction to AbbeyRoad/Long Lane via MarketStreet Dalton
NB 2.89 675 15 270 39
SB 2.89 277 38 293 36
5.3.5 The results show an increase in journey times along most of the routes,particularly along the key routes like Bridge Road/North Road, internal routealong Frair’s Lane to Bank Lane in northbound direction experiencing anaverage delay of approximately four minutes; and a route in northbounddirection from Abbey Road to Ulverston Road via Market Street, Dalton whichwill experience average five minutes delays. All other routes will have minimalor no delays. This indicates that the local plan sites would have an impact onjourney times along these key routes in Barrow-in-Furness and Dalton.
5.4 Improvement Schemes
5.4.1 The Barrow Transport Improvements Study identifies a number of highwayand sustainable transport improvements in the Barrow Borough area. Theseinclude junction improvements at key locations on the highway network andwalking, cycling and public transport improvements to encourage mode shiftand reduce reliance on car travel.
5.4.2 The impact of the improvements has been tested in the Barrow transportmodel to assess the cumulative impact of the improvements. This is importantas capacity improvements at one location have the potential to createadditional problems in other areas.
5.4.3 See Barrow Transport Improvement Study Report for further details of keyhighway and sustainable transport improvements.
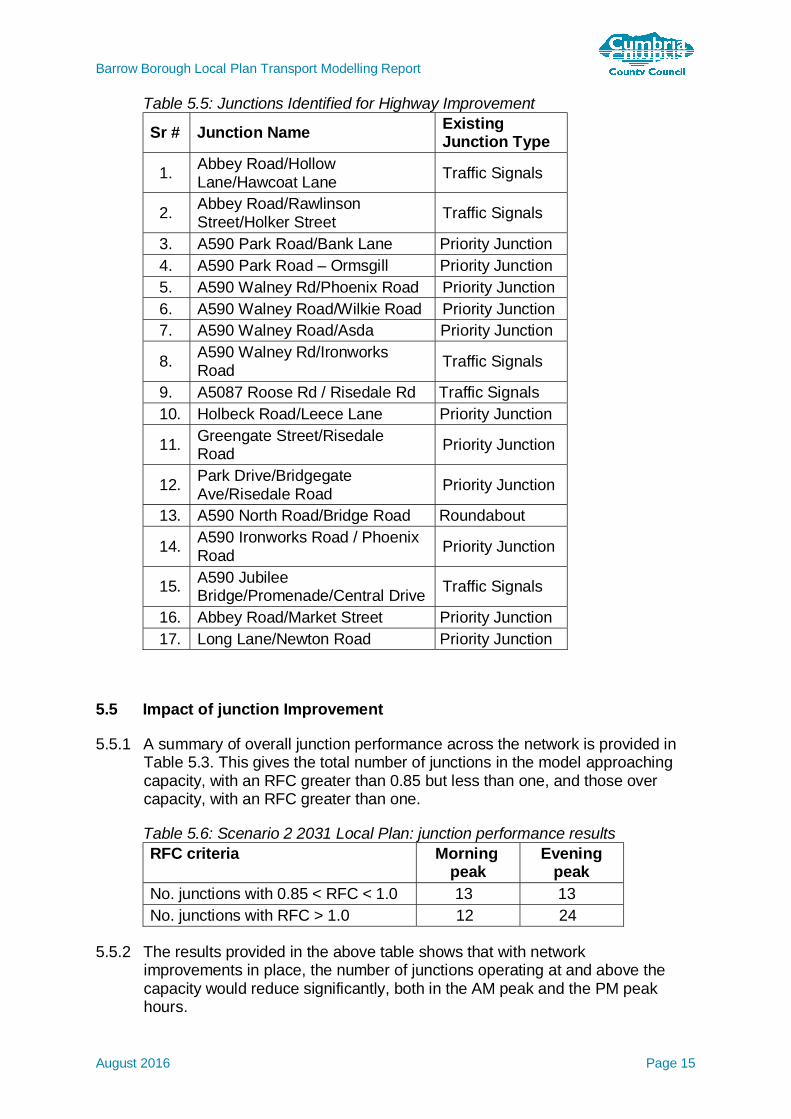
5.4.4 Highways improvements at the following junctions have been accessed:
Barrow Borough Local Plan Transport Modelling Report
August 2016 Page 15
Table 5.5: Junctions Identified for Highway Improvement
Sr # Junction Name ExistingJunction Type
1. Abbey Road/HollowLane/Hawcoat Lane Traffic Signals
2. Abbey Road/RawlinsonStreet/Holker Street Traffic Signals
3. A590 Park Road/Bank Lane Priority Junction4. A590 Park Road – Ormsgill Priority Junction5. A590 Walney Rd/Phoenix Road Priority Junction6. A590 Walney Road/Wilkie Road Priority Junction7. A590 Walney Road/Asda Priority Junction
8. A590 Walney Rd/IronworksRoad Traffic Signals
9. A5087 Roose Rd / Risedale Rd Traffic Signals10. Holbeck Road/Leece Lane Priority Junction
11. Greengate Street/RisedaleRoad Priority Junction
12. Park Drive/BridgegateAve/Risedale Road Priority Junction
13. A590 North Road/Bridge Road Roundabout
14. A590 Ironworks Road / PhoenixRoad Priority Junction
15. A590 JubileeBridge/Promenade/Central Drive Traffic Signals
16. Abbey Road/Market Street Priority Junction17. Long Lane/Newton Road Priority Junction
5.5 Impact of junction Improvement
5.5.1 A summary of overall junction performance across the network is provided inTable 5.3. This gives the total number of junctions in the model approachingcapacity, with an RFC greater than 0.85 but less than one, and those overcapacity, with an RFC greater than one.
Table 5.6: Scenario 2 2031 Local Plan: junction performance resultsRFC criteria Morning
peakEvening
peakNo. junctions with 0.85 < RFC < 1.0 13 13No. junctions with RFC > 1.0 12 24
5.5.2 The results provided in the above table shows that with networkimprovements in place, the number of junctions operating at and above thecapacity would reduce significantly, both in the AM peak and the PM peakhours.
Barrow Borough Local Plan Transport Modelling Report
August 2016 Page 16
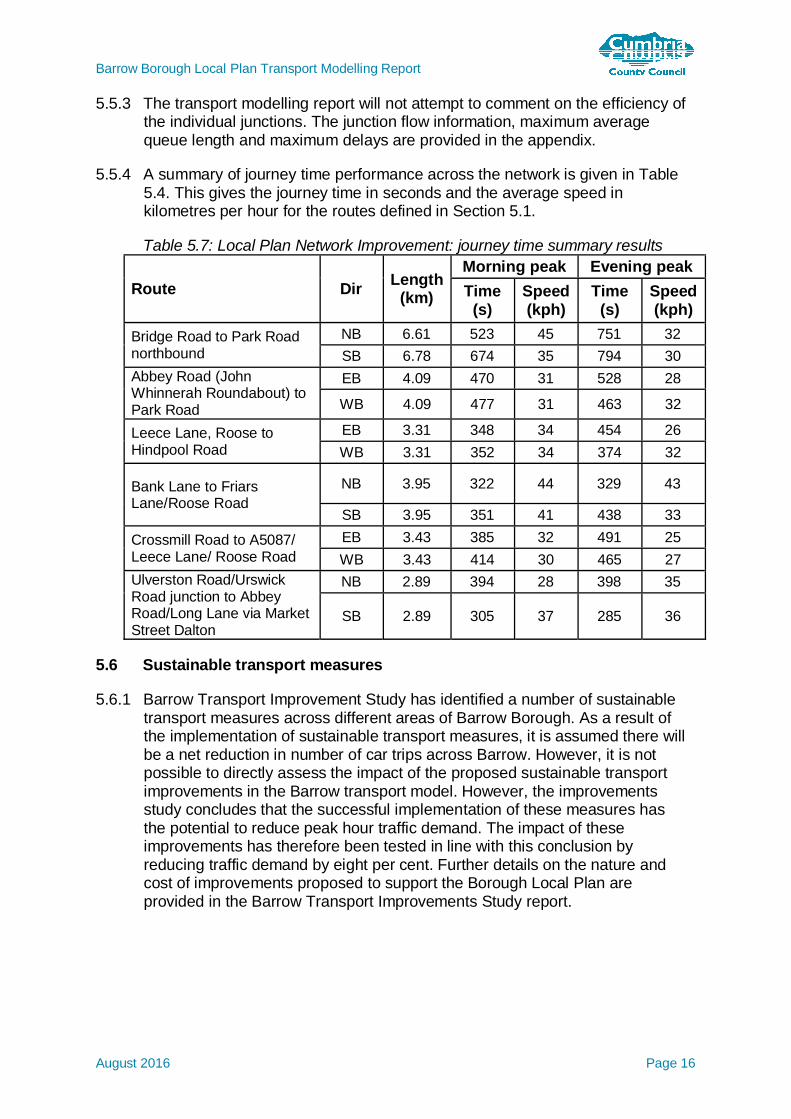
5.5.3 The transport modelling report will not attempt to comment on the efficiency ofthe individual junctions. The junction flow information, maximum averagequeue length and maximum delays are provided in the appendix.
5.5.4 A summary of journey time performance across the network is given in Table5.4. This gives the journey time in seconds and the average speed inkilometres per hour for the routes defined in Section 5.1.
Table 5.7: Local Plan Network Improvement: journey time summary results
Route Dir Length(km)
Morning peak Evening peakTime
(s)Speed(kph)
Time(s)
Speed(kph)
Bridge Road to Park Roadnorthbound
NB 6.61 523 45 751 32SB 6.78 674 35 794 30
Abbey Road (JohnWhinnerah Roundabout) toPark Road
EB 4.09 470 31 528 28
WB 4.09 477 31 463 32
Leece Lane, Roose toHindpool Road
EB 3.31 348 34 454 26WB 3.31 352 34 374 32
Bank Lane to FriarsLane/Roose Road
NB 3.95 322 44 329 43
SB 3.95 351 41 438 33
Crossmill Road to A5087/Leece Lane/ Roose Road
EB 3.43 385 32 491 25WB 3.43 414 30 465 27
Ulverston Road/UrswickRoad junction to AbbeyRoad/Long Lane via MarketStreet Dalton
NB 2.89 394 28 398 35
SB 2.89 305 37 285 36
5.6 Sustainable transport measures
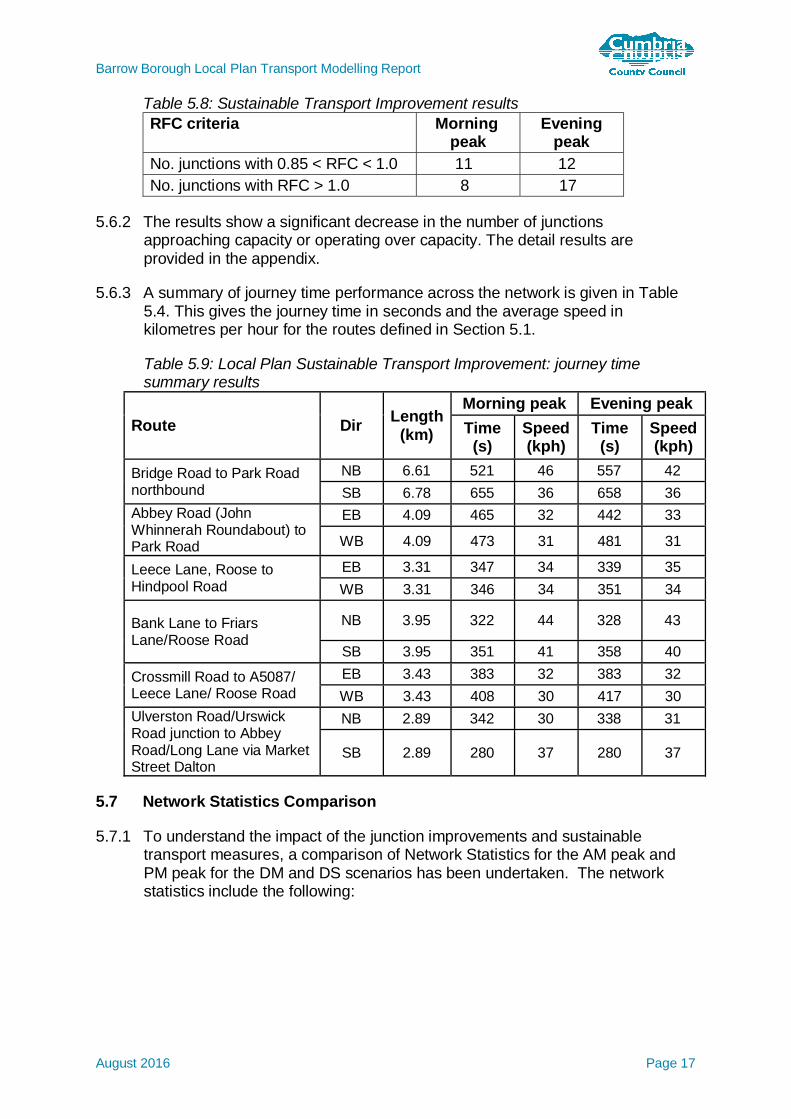
5.6.1 Barrow Transport Improvement Study has identified a number of sustainabletransport measures across different areas of Barrow Borough. As a result ofthe implementation of sustainable transport measures, it is assumed there willbe a net reduction in number of car trips across Barrow. However, it is notpossible to directly assess the impact of the proposed sustainable transportimprovements in the Barrow transport model. However, the improvementsstudy concludes that the successful implementation of these measures hasthe potential to reduce peak hour traffic demand. The impact of theseimprovements has therefore been tested in line with this conclusion byreducing traffic demand by eight per cent. Further details on the nature andcost of improvements proposed to support the Borough Local Plan areprovided in the Barrow Transport Improvements Study report.
Barrow Borough Local Plan Transport Modelling Report
August 2016 Page 17
Table 5.8: Sustainable Transport Improvement resultsRFC criteria Morning
peakEvening
peakNo. junctions with 0.85 < RFC < 1.0 11 12No. junctions with RFC > 1.0 8 17
5.6.2 The results show a significant decrease in the number of junctionsapproaching capacity or operating over capacity. The detail results areprovided in the appendix.
5.6.3 A summary of journey time performance across the network is given in Table5.4. This gives the journey time in seconds and the average speed inkilometres per hour for the routes defined in Section 5.1.
Table 5.9: Local Plan Sustainable Transport Improvement: journey timesummary results
Route Dir Length(km)
Morning peak Evening peakTime
(s)Speed(kph)
Time(s)
Speed(kph)
Bridge Road to Park Roadnorthbound
NB 6.61 521 46 557 42SB 6.78 655 36 658 36
Abbey Road (JohnWhinnerah Roundabout) toPark Road
EB 4.09 465 32 442 33
WB 4.09 473 31 481 31
Leece Lane, Roose toHindpool Road
EB 3.31 347 34 339 35WB 3.31 346 34 351 34
Bank Lane to FriarsLane/Roose Road
NB 3.95 322 44 328 43
SB 3.95 351 41 358 40
Crossmill Road to A5087/Leece Lane/ Roose Road
EB 3.43 383 32 383 32WB 3.43 408 30 417 30
Ulverston Road/UrswickRoad junction to AbbeyRoad/Long Lane via MarketStreet Dalton
NB 2.89 342 30 338 31
SB 2.89 280 37 280 37
5.7 Network Statistics Comparison
5.7.1 To understand the impact of the junction improvements and sustainabletransport measures, a comparison of Network Statistics for the AM peak andPM peak for the DM and DS scenarios has been undertaken. The networkstatistics include the following:
Barrow Borough Local Plan Transport Modelling Report
August 2016 Page 18
· Transient queues: the sum of time spent queuing at junctions by allvehicles in PCU-hours;
· Over-capacity queues: the sum of time spent queuing at junctions by allvehicles due to them operating in excess of capacity in PCU-hours;
· Link cruise time: the sum of time spend travelling along roads in PCU-hours;
· Total travel time: the sum of the above three times/delays in PCU-hours;
· Travel distance: the sum of total distance travelled by all vehicles acrossthe network in PCU-kilometres; and
· Overall average speed: average speed of all PCUs on network inkilometres per hour.
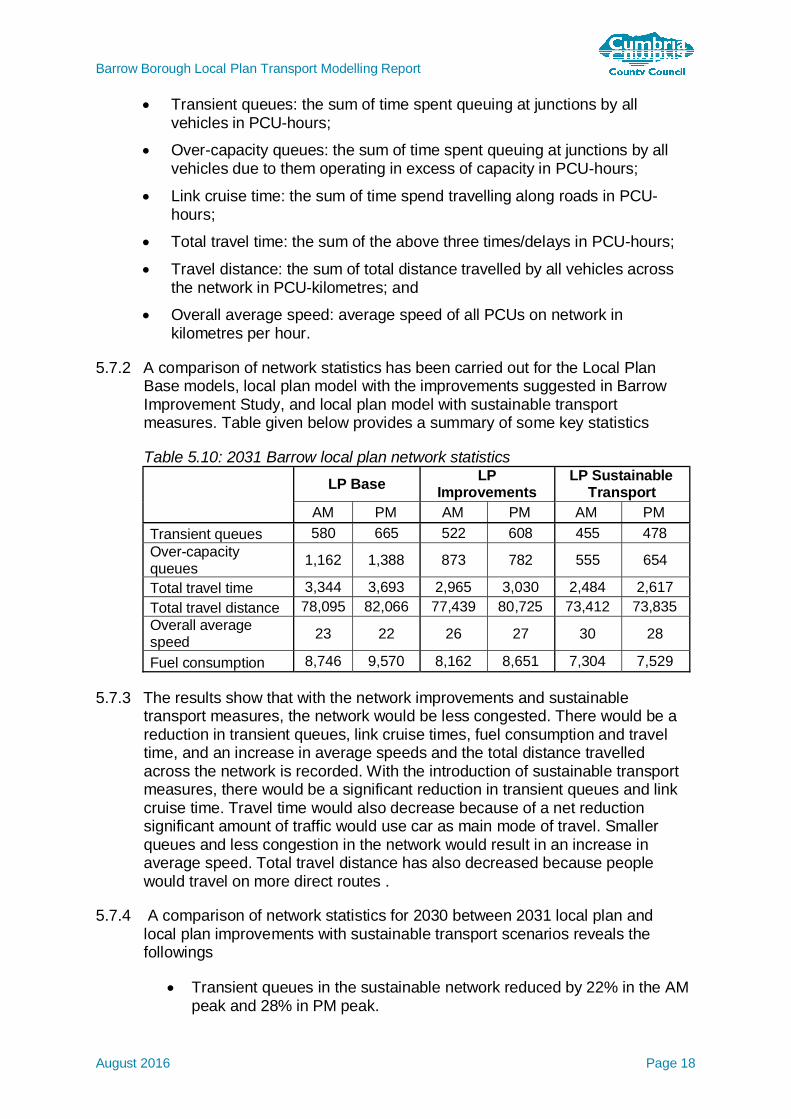
5.7.2 A comparison of network statistics has been carried out for the Local PlanBase models, local plan model with the improvements suggested in BarrowImprovement Study, and local plan model with sustainable transportmeasures. Table given below provides a summary of some key statistics
Table 5.10: 2031 Barrow local plan network statistics
LP Base LPImprovements
LP SustainableTransport
AM PM AM PM AM PMTransient queues 580 665 522 608 455 478Over-capacityqueues 1,162 1,388 873 782 555 654
Total travel time 3,344 3,693 2,965 3,030 2,484 2,617Total travel distance 78,095 82,066 77,439 80,725 73,412 73,835Overall averagespeed 23 22 26 27 30 28
Fuel consumption 8,746 9,570 8,162 8,651 7,304 7,529
5.7.3 The results show that with the network improvements and sustainabletransport measures, the network would be less congested. There would be areduction in transient queues, link cruise times, fuel consumption and traveltime, and an increase in average speeds and the total distance travelledacross the network is recorded. With the introduction of sustainable transportmeasures, there would be a significant reduction in transient queues and linkcruise time. Travel time would also decrease because of a net reductionsignificant amount of traffic would use car as main mode of travel. Smallerqueues and less congestion in the network would result in an increase inaverage speed. Total travel distance has also decreased because peoplewould travel on more direct routes .
5.7.4 A comparison of network statistics for 2030 between 2031 local plan andlocal plan improvements with sustainable transport scenarios reveals thefollowings
· Transient queues in the sustainable network reduced by 22% in the AMpeak and 28% in PM peak.

Barrow Borough Local Plan Transport Modelling Report
August 2016 Page 19
· Approximately 52% reduction is recorded in over-capacity queues inboth peak periods.
· Increased journey time reliability across the network as total link traveltime would reduce by 26% and 29 in the AM and the PM peakrespectively.
· Overall reduction in distance to 6% in the AM peak and 10% in the PM.
· Average speed is forecast to increase from 23 km/h to 30 km/h in theAM peak and in the PM peak it would also increase from 22 km/h to 28km/h.
Barrow Borough Local Plan Transport Modelling Report
August 2016 Page 20
6 Summary
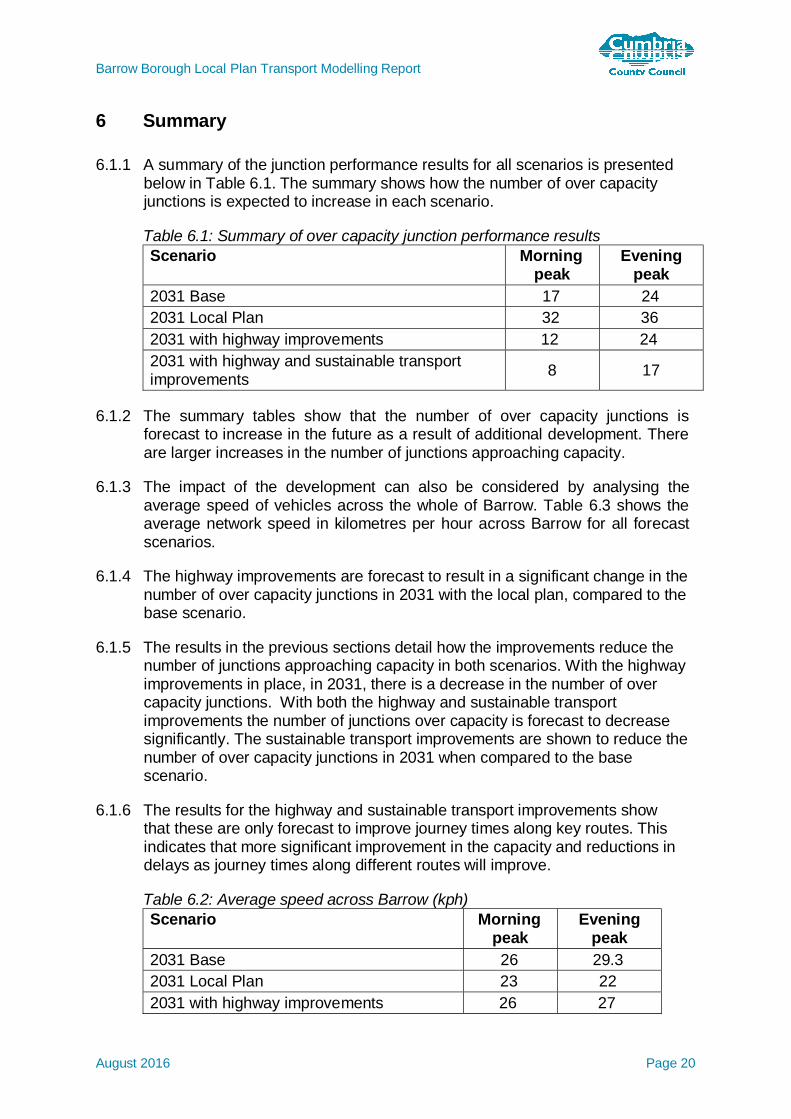
6.1.1 A summary of the junction performance results for all scenarios is presentedbelow in Table 6.1. The summary shows how the number of over capacityjunctions is expected to increase in each scenario.
Table 6.1: Summary of over capacity junction performance resultsScenario Morning
peakEvening
peak2031 Base 17 242031 Local Plan 32 362031 with highway improvements 12 242031 with highway and sustainable transportimprovements 8 17
6.1.2 The summary tables show that the number of over capacity junctions isforecast to increase in the future as a result of additional development. Thereare larger increases in the number of junctions approaching capacity.
6.1.3 The impact of the development can also be considered by analysing theaverage speed of vehicles across the whole of Barrow. Table 6.3 shows theaverage network speed in kilometres per hour across Barrow for all forecastscenarios.
6.1.4 The highway improvements are forecast to result in a significant change in thenumber of over capacity junctions in 2031 with the local plan, compared to thebase scenario.
6.1.5 The results in the previous sections detail how the improvements reduce thenumber of junctions approaching capacity in both scenarios. With the highwayimprovements in place, in 2031, there is a decrease in the number of overcapacity junctions. With both the highway and sustainable transportimprovements the number of junctions over capacity is forecast to decreasesignificantly. The sustainable transport improvements are shown to reduce thenumber of over capacity junctions in 2031 when compared to the basescenario.
6.1.6 The results for the highway and sustainable transport improvements showthat these are only forecast to improve journey times along key routes. Thisindicates that more significant improvement in the capacity and reductions indelays as journey times along different routes will improve.
Table 6.2: Average speed across Barrow (kph)Scenario Morning
peakEvening
peak2031 Base 26 29.32031 Local Plan 23 222031 with highway improvements 26 27
Barrow Borough Local Plan Transport Modelling Report
August 2016 Page 21
2031 with highway and sustainabletransport improvements 30 28
6.1.7 Table 6.2 shows the average network speed in kilometres per hour acrossBarrow for all forecast scenarios and improvement options. The averagespeed in 2031 is shown to be 30 kph in the morning and 28 kph in the eveningpeak.
6.1.8 The results for the forecast scenarios show that the average speed isexpected to increase in the future with the junction and sustainable transportimprovement .This increase generally correlates with the journey time results.
6.1.9 It should also be reiterated that these results are average results for the wholepeak hour and represent what is forecast to typically occur. Small changes intraffic flow can result in large variations in queuing and delay throughout thepeak hour, and certain traffic effects are not included in the transport model.
Barrow Borough Local Plan Transport Modelling Report
August 2016 Page 22
7 Conclusion
7.1 Summary
7.1.1 The results of the forecast scenarios have been analysed to assess theimpact of the local plan proposals. This included assessing the number ofjunctions forecast to operate over capacity and the journey times along keyroutes within Barrow.
7.1.2 The results forecast that the Barrow Local Plan proposals would lead to anincrease in congestion in Barrow, based on the maximum RFC of junctions,compared to the base scenario. Journey times are forecast to increase on keyroutes in the city, particularly on routes where a large proportion ofdevelopment is located.
7.1.3 The outputs from the model have been used to identify areas of Barrow whichare forecast to experience increased queuing and delay with the local planproposals.
7.1.4 The outputs from the model have been used to identify areas of Barrow whichare forecast to experience increased queuing and delay with the local planproposals. This information is used in further work to help identify potentialhighway improvements in Barrow and the cost of delivering theseimprovements. This improvements study also includes measures to increasethe use of walking, cycling and public transport, along with indicative costs.
7.1.5 The impact of the measures proposed in the improvements study has alsobeen assessed in the transport model. The results of this assessment showthat the highway improvements and successful implementation of thesustainable transport improvements would help mitigate the transport impactsof the local plan.
7.1.6 Further details on the nature and cost of improvements proposed to supportthe Barrow Local Plan are provided in the Barrow Transport ImprovementsStudy report by PB|WSP. A summary of this study which details the keythemes and findings is also available. The improvements study will informBarrow Borough Council’s Infrastructure Delivery Plan, which forms part of theevidence base for the local plan.
Arrivals Depart Arrivals Depart Arrivals Depart Arrivals Depart
Roose Garden Centre Flass Lane 32 7 12 11 7 0.1 0.1 0.1 0.1Former Arlington House Abbey Road 11 2 4 4 2 0.0 0.0 0.0 0.0Barrow Amalgamated Engineers Club Abbey Road 12 2 4 4 3 0.0 0.0 0.0 0.0Victoria Park Hotel Victoria Road 16 3 6 5 3 0.0 0.0 0.0 0.0Thorncliffe School (South Site) Thorncliffe Road 29 6 11 10 6 0.1 0.1 0.1 0.111 Smallholdings & land adjacent to Duchy Court Duchy Court 30 6 11 10 6 0.1 0.1 0.1 0.1Former Lonsdale Hospital Site School Street 41 8 15 14 9 0.1 0.1 0.1 0.1Land off Holker Street Holker Street 63 13 31 32 20 0.1 0.1 0.1 0.1Bradys Yard (Former) Wilkie Road 84 13 34 32 18 0.2 0.2 0.2 0.2Land off Holbeck Park Avenue Holbeck Park Avenue 106 14 40 35 18 0.2 0.2 0.2 0.2Listers North Site Flass lane 168 23 64 55 29 0.3 0.3 0.3 0.3Land off Sherborne Ave Sherborne Ave 93 21 57 54 32 0.2 0.2 0.2 0.2Park View, Barrow in Furness Park View 54 8 22 17 11 0.0 0.0 0.0 0.0
GP's Primary Care, Ambulance base Duke St/Church St - 108 47 45 91 0.0 0.0 0.0 0.0
BAE Logistics Facility Barrow - 28 15 11 24 0.0 0.0 0.0 0.0
Employment
Residential Development
Site Name Location No.approved
Mixed/Other Use Development
AM Peak HGV Traffic Gen - PM PeakHGV
AM Peak Car PM Peak Car
SiteReference Address Site Size Land Use Type
Arrivals Departures Arrivals Departures Arrivals Departures Arrivals Departures
EMR01Remaining part of Furness Business Park,Barrow
4,000 sqm B1 - Office 94 14 20 24 0 0 0 0
EMR03_a Waterfront Business Park, Barrow 15,900 sqm Industrial Estate 88 52 59 81 3 3 3 2EMR05 Land East of Park Road, Barrow 8.1 Hect. Industrial Estate 134 81 85 127 4 4 4 3
EMR06Land West of Robert McBride, Park Rd,Barrow
3.67 Hect. Industrial Estate 61 37 38 58 2 2 2 1
EMR07Land South of Kimberley Clark, Park Rd,Barrow
5.45 Hect. Industrial Estate 90 55 57 86 3 3 3 2
EMR08Land West of County Park Industrial Estate,Park Rd, Barrow
1.47 Hect. Industrial Estate 24 15 15 23 1 1 1 1
EMR14Site at Sandscale Park (West of RailwayLine), Barrow
7.86 Hect. Industrial Estate 130 79 82 124 4 4 4 3
EMR15 Land opposite Phoenix Court, Barrow 0.54 Hect. Industrial Estate 9 5 6 8 0 0 0 0EMR16 Phoenix Road (by Travelodge), Barrow 0.65 Hect. Industrial Estate 11 7 7 10 0 0 0 0OPP1 Land at Channelside (South), Barrow 1.58 Hect. Industrial Estate 26 16 16 25 0 0 0 0
AM Peak PM Peak AM Peak PM Peak
Traffic Generation Information (Car) Traffic Generation Information (HGVs)
Appendix B Traffic growth factors
Appendix BTraffic growth factors
Table A1: Morning peak NTEM car growth factors
NTEM Zone Origin/Destination
Trippurpose
2014–2031Base
2014–2031Local Plan
Barrow-in-Furness Origin Commute 0.97027 0.96141Barrow-in-Furness Origin Business 0.98268 0.97727Barrow-in-Furness Origin Other 1.08050 1.07275Barrow-in-Furness Destination Commute 1.01101 1.01054Barrow-in-Furness Destination Business 1.00868 1.00868Barrow-in-Furness Destination Other 1.09536 1.09193Isle of Walney Origin Commute 1.03536 0.99364Isle of Walney Origin Business 1.03546 1.00000Isle of Walney Origin Other 1.15413 1.11009Isle of Walney Destination Commute 1.01684 1.00842Isle of Walney Destination Business 1.03279 1.01639Isle of Walney Destination Other 1.12468 1.09091Dalton-in-Furness Origin Commute 1.01453 0.94592Dalton-in-Furness Origin Business 1.01527 0.96183Dalton-in-Furness Origin Other 1.11845 1.05239Dalton-in-Furness Destination Commute 1.01301 1.00372Dalton-in-Furness Destination Business 1.01429 1.00000Dalton-in-Furness Destination Other 1.11869 1.07122Askam in Furness Origin Commute 0.99088 0.92701Askam in Furness Origin Business 0.98246 0.92982Askam in Furness Origin Other 1.09040 1.03390Askam in Furness Destination Commute 1.00000 0.98765Askam in Furness Destination Business 1.00000 1.00000Askam in Furness Destination Other 1.10656 1.04918rural (Barrow-in-Furness) Origin Commute 0.99638 0.96926rural (Barrow-in-Furness) Origin Business 1.00000 0.97260rural (Barrow-in-Furness) Origin Other 1.08612 1.06220rural (Barrow-in-Furness) Destination Commute 1.01289 1.01105rural (Barrow-in-Furness) Destination Business 1.01408 1.01408rural (Barrow-in-Furness) Destination Other 1.10476 1.09048
Appendix B Traffic growth factors
Table A2: Evening peak NTEM car growth factorsNTEM Zone Origin/
DestinationTrippurpose
2014–2031Base
2014–2031Local Plan
Barrow-in-Furness Origin Commute 1.00562 1.00464Barrow-in-Furness Origin Business 1.00974 1.00886Barrow-in-Furness Origin Other 1.05415 1.04921Barrow-in-Furness Destination Commute 0.96767 0.95898Barrow-in-Furness Destination Business 0.98763 0.98247Barrow-in-Furness Destination Other 1.04490 1.03863Isle of Walney Origin Commute 1.01307 1.00000Isle of Walney Origin Business 1.02817 1.01408Isle of Walney Origin Other 1.09500 1.05877Isle of Walney Destination Commute 1.03245 0.99002Isle of Walney Destination Business 1.04762 1.00680Isle of Walney Destination Other 1.10815 1.06953Dalton-in-Furness Origin Commute 1.01022 0.99387Dalton-in-Furness Origin Business 1.01282 1.00000Dalton-in-Furness Origin Other 1.07701 1.02378Dalton-in-Furness Destination Commute 1.01056 0.94338Dalton-in-Furness Destination Business 1.02206 0.96324Dalton-in-Furness Destination Other 1.08273 1.02172Askam in Furness Origin Commute 1.00000 0.98026Askam in Furness Origin Business 1.00000 0.96154Askam in Furness Origin Other 1.05294 1.00294Askam in Furness Destination Commute 0.98906 0.92560Askam in Furness Destination Business 0.98305 0.93220Askam in Furness Destination Other 1.06510 1.00260rural (Barrow-in-Furness) Origin Commute 1.01316 1.00877rural (Barrow-in-Furness) Origin Business 1.01370 1.01370rural (Barrow-in-Furness) Origin Other 1.06263 1.04848rural (Barrow-in-Furness) Destination Commute 0.99142 0.96567rural (Barrow-in-Furness) Destination Business 0.98667 0.97333rural (Barrow-in-Furness) Destination Other 1.05444 1.03831
Appendix B Traffic growth factors
Table A3: Fuel and income growth factorsFactors 2014–2031
Base2014–2031Local Plan
Income 1.04314 1.04314Fuel 1.06757 1.06757
Table A4: NTM growth factorsNTEM Zone Road type Time
period2014–2031Base
2014–2031Local Plan
Barrow-in-Furness Urban all AM 1.16491 1.15945Isle of Walney Urban all AM 1.21931 1.18441Dalton-in-Furness Urban all AM 1.19706 1.14496Askam in Furness Urban all AM 1.17796 1.12529rural (Barrow-in-Furness) Rural all AM 1.18742 1.17071Cumbria Rural motorway AM 1.22215 1.22215Cumbria Rural trunk AM 1.20775 1.20775Cumbria Rural principal AM 1.16430 1.16430Cumbria Rural minor AM 1.18075 1.18075Barrow-in-Furness Urban all PM 1.16997 1.16428Isle of Walney Urban all PM 1.22587 1.18630Dalton-in-Furness Urban all PM 1.20281 1.14364Askam in Furness Urban all PM 1.18136 1.12155rural (Barrow-in-Furness) Rural all PM 1.19392 1.17622Cumbria Rural motorway PM 1.23645 1.23645Cumbria Rural trunk PM 1.22188 1.22188Cumbria Rural principal PM 1.17792 1.17792Cumbria Rural minor PM 1.19456 1.19456
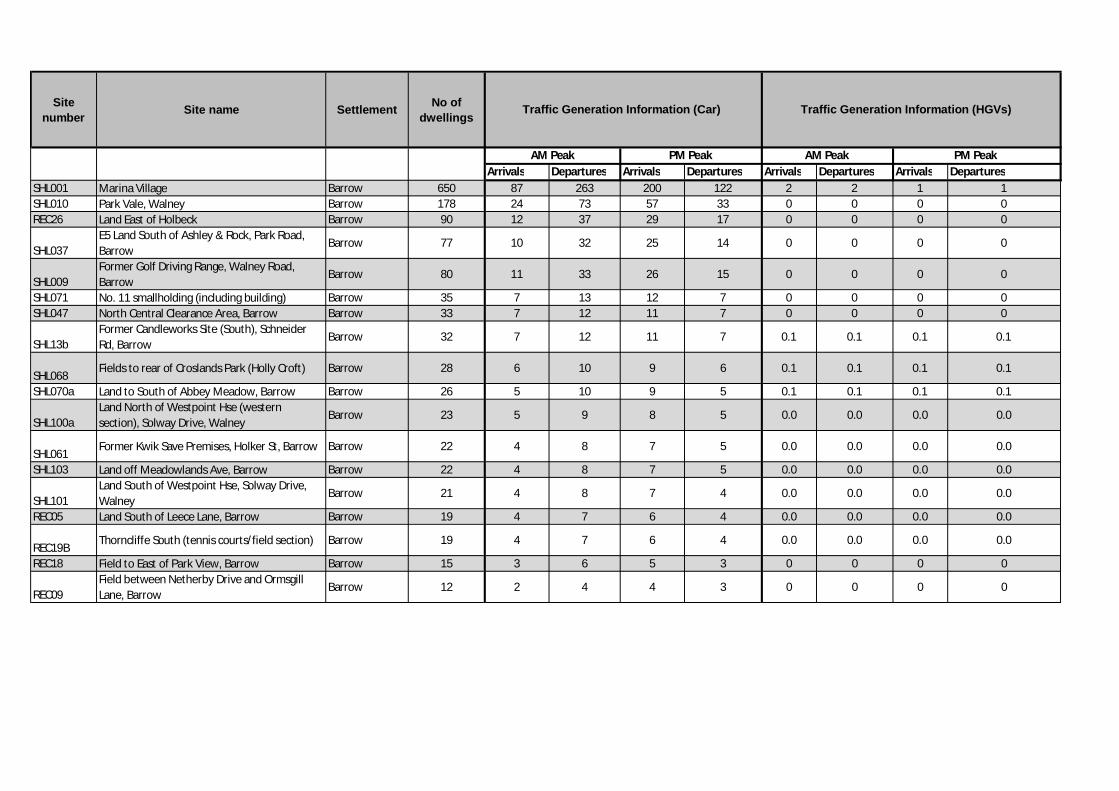
Sitenumber Site name Settlement No of
dwellings
Arrivals Departures Arrivals Departures Arrivals Departures Arrivals DeparturesSHL001 Marina Village Barrow 650 87 263 200 122 2 2 1 1SHL010 Park Vale, Walney Barrow 178 24 73 57 33 0 0 0 0REC26 Land East of Holbeck Barrow 90 12 37 29 17 0 0 0 0
SHL037E5 Land South of Ashley & Rock, Park Road,Barrow
Barrow 77 10 32 25 14 0 0 0 0
SHL009Former Golf Driving Range, Walney Road,Barrow
Barrow 80 11 33 26 15 0 0 0 0
SHL071 No. 11 smallholding (including building) Barrow 35 7 13 12 7 0 0 0 0SHL047 North Central Clearance Area, Barrow Barrow 33 7 12 11 7 0 0 0 0
SHL13bFormer Candleworks Site (South), SchneiderRd, Barrow
Barrow 32 7 12 11 7 0.1 0.1 0.1 0.1
SHL068Fields to rear of Croslands Park (Holly Croft) Barrow 28 6 10 9 6 0.1 0.1 0.1 0.1
SHL070a Land to South of Abbey Meadow, Barrow Barrow 26 5 10 9 5 0.1 0.1 0.1 0.1
SHL100aLand North of Westpoint Hse (westernsection), Solway Drive, Walney
Barrow 23 5 9 8 5 0.0 0.0 0.0 0.0
SHL061Former Kwik Save Premises, Holker St, Barrow Barrow 22 4 8 7 5 0.0 0.0 0.0 0.0
SHL103 Land off Meadowlands Ave, Barrow Barrow 22 4 8 7 5 0.0 0.0 0.0 0.0
SHL101Land South of Westpoint Hse, Solway Drive,Walney
Barrow 21 4 8 7 4 0.0 0.0 0.0 0.0
REC05 Land South of Leece Lane, Barrow Barrow 19 4 7 6 4 0.0 0.0 0.0 0.0
REC19BThorncliffe South (tennis courts/field section) Barrow 19 4 7 6 4 0.0 0.0 0.0 0.0
REC18 Field to East of Park View, Barrow Barrow 15 3 6 5 3 0 0 0 0
REC09Field between Netherby Drive and OrmsgillLane, Barrow
Barrow 12 2 4 4 3 0 0 0 0
Traffic Generation Information (Car) Traffic Generation Information (HGVs)
AM Peak PM Peak AM Peak PM Peak
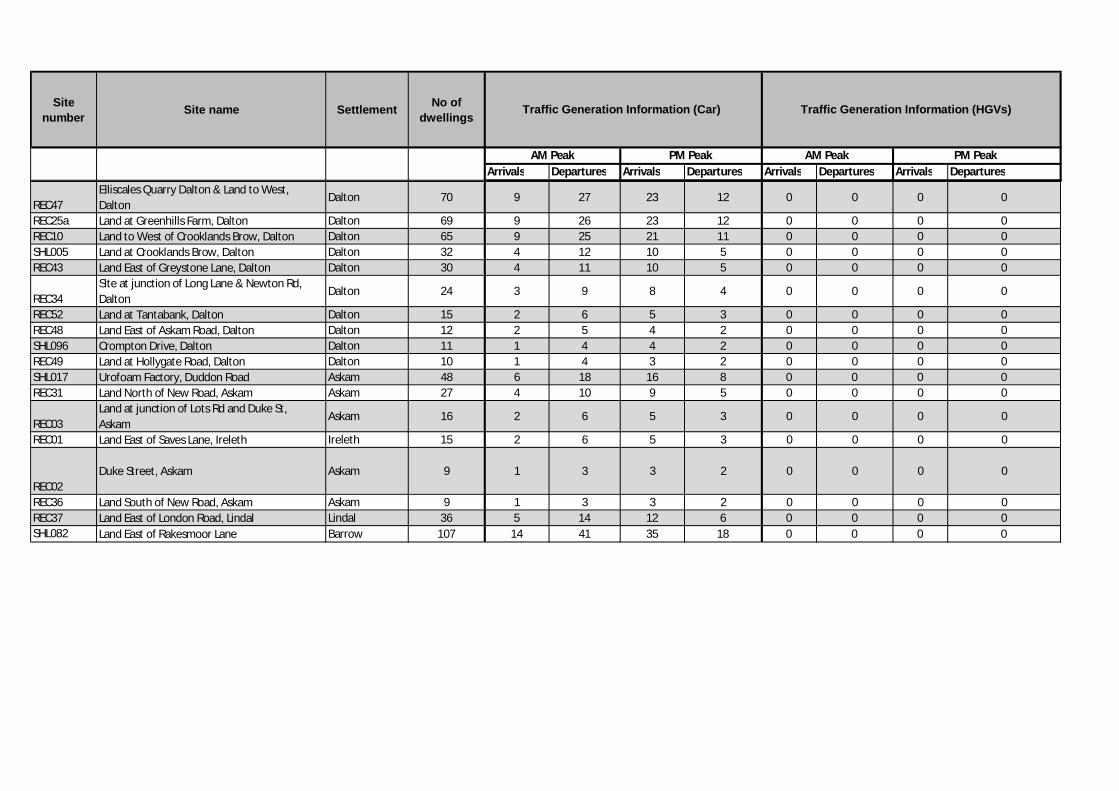
Sitenumber Site name Settlement No of
dwellings
Arrivals Departures Arrivals Departures Arrivals Departures Arrivals Departures
Traffic Generation Information (Car) Traffic Generation Information (HGVs)
AM Peak PM Peak AM Peak PM Peak
REC47Elliscales Quarry Dalton & Land to West,Dalton
Dalton 70 9 27 23 12 0 0 0 0
REC25a Land at Greenhills Farm, Dalton Dalton 69 9 26 23 12 0 0 0 0REC10 Land to West of Crooklands Brow, Dalton Dalton 65 9 25 21 11 0 0 0 0SHL005 Land at Crooklands Brow, Dalton Dalton 32 4 12 10 5 0 0 0 0REC43 Land East of Greystone Lane, Dalton Dalton 30 4 11 10 5 0 0 0 0
REC34Site at junction of Long Lane & Newton Rd,Dalton
Dalton 24 3 9 8 4 0 0 0 0
REC52 Land at Tantabank, Dalton Dalton 15 2 6 5 3 0 0 0 0REC48 Land East of Askam Road, Dalton Dalton 12 2 5 4 2 0 0 0 0SHL096 Crompton Drive, Dalton Dalton 11 1 4 4 2 0 0 0 0REC49 Land at Hollygate Road, Dalton Dalton 10 1 4 3 2 0 0 0 0SHL017 Urofoam Factory, Duddon Road Askam 48 6 18 16 8 0 0 0 0REC31 Land North of New Road, Askam Askam 27 4 10 9 5 0 0 0 0
REC03Land at junction of Lots Rd and Duke St,Askam
Askam 16 2 6 5 3 0 0 0 0
REC01 Land East of Saves Lane, Ireleth Ireleth 15 2 6 5 3 0 0 0 0
REC02Duke Street, Askam Askam 9 1 3 3 2 0 0 0 0
REC36 Land South of New Road, Askam Askam 9 1 3 3 2 0 0 0 0REC37 Land East of London Road, Lindal Lindal 36 5 14 12 6 0 0 0 0SHL082 Land East of Rakesmoor Lane Barrow 107 14 41 35 18 0 0 0 0