Embed Size (px)
Citation preview
1440 VOLUME 12 | NUMBER 11 | NOVEMBER 2009 nature neurOSCIenCe
a r t I C l e S
Neuromodulatory circuits are essential for regulating the behavioral state of an animal1–4. In particular, the basal forebrain cholinergic sys-tem originating from the nucleus basalis projects diffusely throughout the neocortex5, and it has been implicated in vital brain functions such as arousal, attention6–8 and experience-dependent cortical plasticity9–11. The cholinergic neurons in nucleus basalis are active during waking and REM sleep, but not during slow-wave sleep12,13, and recent studies in awake animals have shown that nucleus basalis activity varies in a task-dependent manner14,15. Because sensory perception can be markedly enhanced by arousal and attention, the state-dependent nucleus basalis activation suggests that the basal forebrain circuit may be important in dynamic modulation of sensory processing. However, the causal relationship between nucleus basalis activation and enhanced sensory processing has not yet been demonstrated.
Sensory processing in the cortex is known to be affected by the intrinsic dynamics of the cortical network16–20. Because neuromodulators such as acetylcholine (ACh) can alter neuronal excit-ability21–23 and synaptic efficacy24–27, they may rapidly regulate circuit dynamics21,28 and sensory processing29. Indeed, local iontophoretic application of ACh has been shown to affect the contrast gain30, ori-entation and direction selectivity31–34, and attentional modulation35 of visual cortical neurons. However, these local changes may not fully reflect the effects of basal forebrain activation, as the nucleus basalis projection to the cortex is highly diffuse and its activation is known to affect the global pattern of brain activity21,36. Thus, to understand the role of the basal forebrain neuromodulatory circuit in sensory percep-tion, it is important to test the effect of nucleus basalis activation on the sensory responses of a population of cortical neurons.
Using multi-electrode recording in rat visual cortex, we found two prominent effects of nucleus basalis activation on cortical responses
to natural stimuli. Brief nucleus basalis stimulation caused a strong decorrelation between cortical neurons and a marked increase in the reliability of visually evoked responses. Furthermore, we found that these two effects are mediated by distinct mechanisms and that they contribute to improved visual coding in a complementary manner. These findings provide a direct demonstration that a neuromodulatory circuit can dynamically regulate cortical coding of sensory inputs.
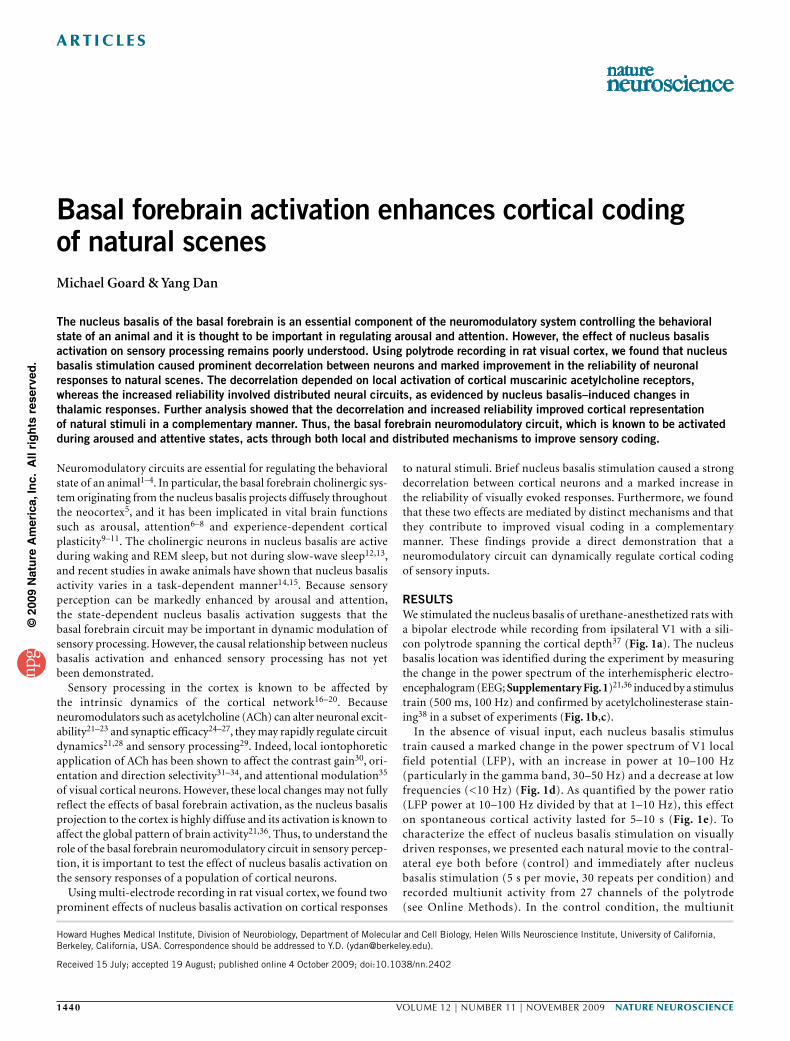
RESULTSWe stimulated the nucleus basalis of urethane-anesthetized rats with a bipolar electrode while recording from ipsilateral V1 with a sili-con polytrode spanning the cortical depth37 (Fig. 1a). The nucleus basalis location was identified during the experiment by measuring the change in the power spectrum of the interhemispheric electro-encephalogram (EEG; Supplementary Fig. 1)21,36 induced by a stimulus train (500 ms, 100 Hz) and confirmed by acetylcholinesterase stain-ing38 in a subset of experiments (Fig. 1b,c).
In the absence of visual input, each nucleus basalis stimulus train caused a marked change in the power spectrum of V1 local field potential (LFP), with an increase in power at 10–100 Hz (particularly in the gamma band, 30–50 Hz) and a decrease at low frequencies (<10 Hz) (Fig. 1d). As quantified by the power ratio (LFP power at 10–100 Hz divided by that at 1–10 Hz), this effect on spontaneous cortical activity lasted for 5–10 s (Fig. 1e). To characterize the effect of nucleus basalis stimulation on visually driven responses, we presented each natural movie to the contral-ateral eye both before (control) and immediately after nucleus basalis stimulation (5 s per movie, 30 repeats per condition) and recorded multiunit activity from 27 channels of the polytrode (see Online Methods). In the control condition, the multiunit
Howard Hughes Medical Institute, Division of Neurobiology, Department of Molecular and Cell Biology, Helen Wills Neuroscience Institute, University of California, Berkeley, California, USA. Correspondence should be addressed to Y.D. ([email protected]).
Received 15 July; accepted 19 August; published online 4 October 2009; doi:10.1038/nn.2402
Basal forebrain activation enhances cortical coding of natural scenesMichael Goard & Yang Dan
The nucleus basalis of the basal forebrain is an essential component of the neuromodulatory system controlling the behavioral state of an animal and it is thought to be important in regulating arousal and attention. However, the effect of nucleus basalis activation on sensory processing remains poorly understood. Using polytrode recording in rat visual cortex, we found that nucleus basalis stimulation caused prominent decorrelation between neurons and marked improvement in the reliability of neuronal responses to natural scenes. The decorrelation depended on local activation of cortical muscarinic acetylcholine receptors, whereas the increased reliability involved distributed neural circuits, as evidenced by nucleus basalis–induced changes in thalamic responses. Further analysis showed that the decorrelation and increased reliability improved cortical representation of natural stimuli in a complementary manner. Thus, the basal forebrain neuromodulatory circuit, which is known to be activated during aroused and attentive states, acts through both local and distributed mechanisms to improve sensory coding.
©20
09 N
atu
re A
mer
ica,
Inc.
All
rig
hts
res
erve
d.
nature neurOSCIenCe VOLUME 12 | NUMBER 11 | NOVEMBER 2009 1441
a r t I C l e S
activity was highly correlated among the channels throughout the cortical column, but poorly time-locked to the stimulus (Fig. 2). Following nucleus basalis stimulation, however, the activity was less correlated among channels, but appeared to be more time-locked to the movie.
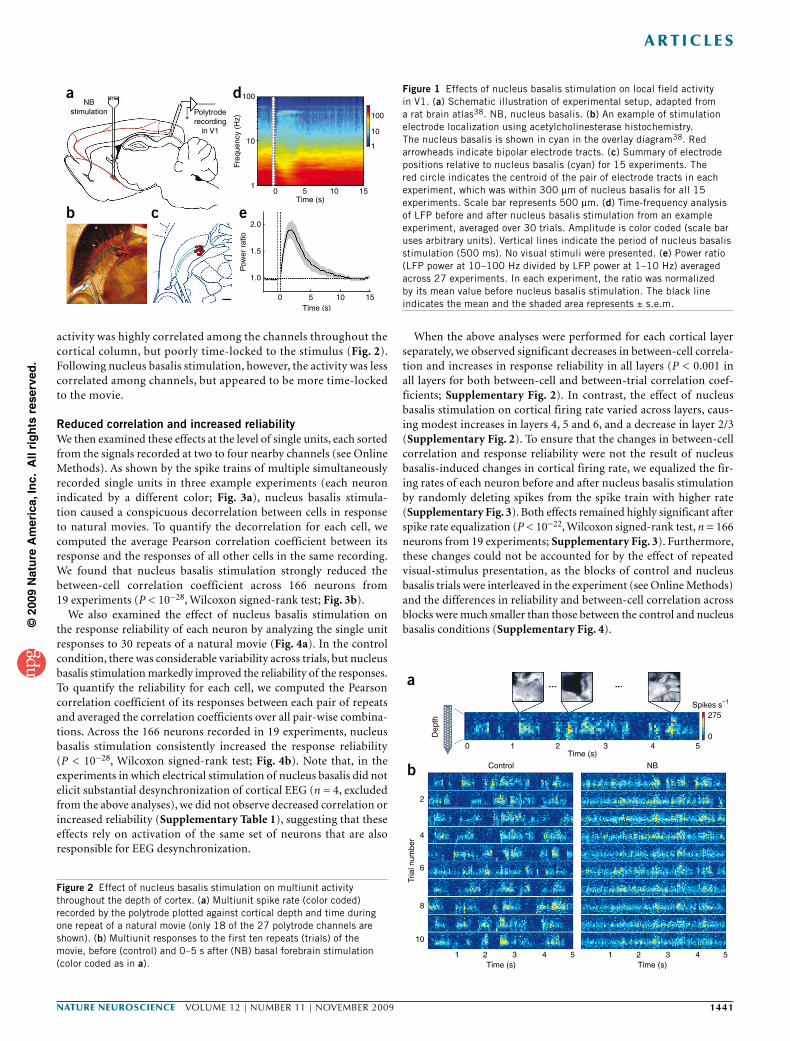
Reduced correlation and increased reliabilityWe then examined these effects at the level of single units, each sorted from the signals recorded at two to four nearby channels (see Online Methods). As shown by the spike trains of multiple simultaneously recorded single units in three example experiments (each neuron indicated by a different color; Fig. 3a), nucleus basalis stimula-tion caused a conspicuous decorrelation between cells in response to natural movies. To quantify the decorrelation for each cell, we computed the average Pearson correlation coefficient between its response and the responses of all other cells in the same recording. We found that nucleus basalis stimulation strongly reduced the between-cell correlation coefficient across 166 neurons from 19 experiments (P < 10−28, Wilcoxon signed-rank test; Fig. 3b).
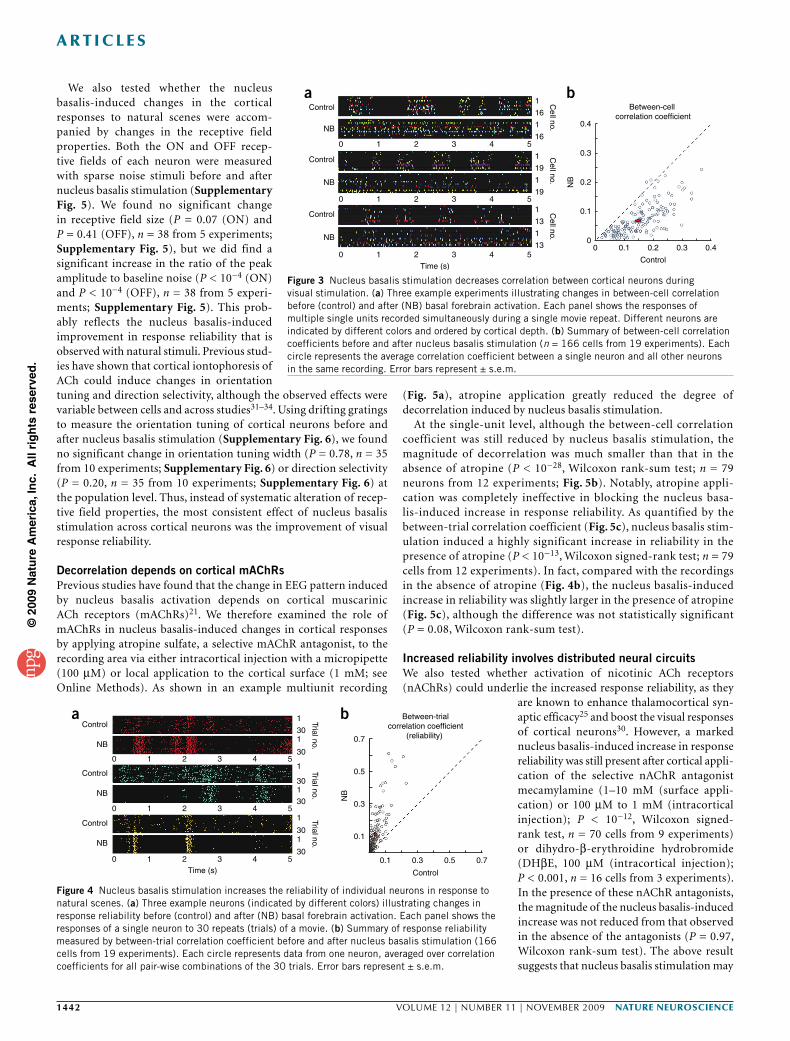
We also examined the effect of nucleus basalis stimulation on the response reliability of each neuron by analyzing the single unit responses to 30 repeats of a natural movie (Fig. 4a). In the control condition, there was considerable variability across trials, but nucleus basalis stimulation markedly improved the reliability of the responses. To quantify the reliability for each cell, we computed the Pearson correlation coefficient of its responses between each pair of repeats and averaged the correlation coefficients over all pair-wise combina-tions. Across the 166 neurons recorded in 19 experiments, nucleus basalis stimulation consistently increased the response reliability (P < 10−28, Wilcoxon signed-rank test; Fig. 4b). Note that, in the experiments in which electrical stimulation of nucleus basalis did not elicit substantial desynchronization of cortical EEG (n = 4, excluded from the above analyses), we did not observe decreased correlation or increased reliability (Supplementary Table 1), suggesting that these effects rely on activation of the same set of neurons that are also responsible for EEG desynchronization.
When the above analyses were performed for each cortical layer separately, we observed significant decreases in between-cell correla-tion and increases in response reliability in all layers (P < 0.001 in all layers for both between-cell and between-trial correlation coef-ficients; Supplementary Fig. 2). In contrast, the effect of nucleus basalis stimulation on cortical firing rate varied across layers, caus-ing modest increases in layers 4, 5 and 6, and a decrease in layer 2/3 (Supplementary Fig. 2). To ensure that the changes in between-cell correlation and response reliability were not the result of nucleus basalis-induced changes in cortical firing rate, we equalized the fir-ing rates of each neuron before and after nucleus basalis stimulation by randomly deleting spikes from the spike train with higher rate (Supplementary Fig. 3). Both effects remained highly significant after spike rate equalization (P < 10−22, Wilcoxon signed-rank test, n = 166 neurons from 19 experiments; Supplementary Fig. 3). Furthermore, these changes could not be accounted for by the effect of repeated visual-stimulus presentation, as the blocks of control and nucleus basalis trials were interleaved in the experiment (see Online Methods) and the differences in reliability and between-cell correlation across blocks were much smaller than those between the control and nucleus basalis conditions (Supplementary Fig. 4).
NBstimulation
a d
b c e
Polytroderecording
in V1
100
2.0
1.5
1.0
100
1010
1
1
0 5 10Time (s)
15
0 5 10Time (s)
15
Freq
uenc
y (H
z)P
ower
rat
io
Figure 1 Effects of nucleus basalis stimulation on local field activity in V1. (a) Schematic illustration of experimental setup, adapted from a rat brain atlas38. NB, nucleus basalis. (b) An example of stimulation electrode localization using acetylcholinesterase histochemistry. The nucleus basalis is shown in cyan in the overlay diagram38. Red arrowheads indicate bipolar electrode tracts. (c) Summary of electrode positions relative to nucleus basalis (cyan) for 15 experiments. The red circle indicates the centroid of the pair of electrode tracts in each experiment, which was within 300 µm of nucleus basalis for all 15 experiments. Scale bar represents 500 µm. (d) Time-frequency analysis of LFP before and after nucleus basalis stimulation from an example experiment, averaged over 30 trials. Amplitude is color coded (scale bar uses arbitrary units). Vertical lines indicate the period of nucleus basalis stimulation (500 ms). No visual stimuli were presented. (e) Power ratio (LFP power at 10–100 Hz divided by LFP power at 1–10 Hz) averaged across 27 experiments. In each experiment, the ratio was normalized by its mean value before nucleus basalis stimulation. The black line indicates the mean and the shaded area represents ± s.e.m.
Dep
th
Control
0
2
4
Tria
l num
ber
6
8
10
1 2 3 4 5
1 2 3Time (s)
Time (s)1 2 3 4 5
Time (s)
NB
Spikes s–1
4 5
275
0
a
b
Figure 2 Effect of nucleus basalis stimulation on multiunit activity throughout the depth of cortex. (a) Multiunit spike rate (color coded) recorded by the polytrode plotted against cortical depth and time during one repeat of a natural movie (only 18 of the 27 polytrode channels are shown). (b) Multiunit responses to the first ten repeats (trials) of the movie, before (control) and 0–5 s after (NB) basal forebrain stimulation (color coded as in a).
©20
09 N
atu
re A
mer
ica,
Inc.
All
rig
hts
res
erve
d.
1442 VOLUME 12 | NUMBER 11 | NOVEMBER 2009 nature neurOSCIenCe
a r t I C l e S
We also tested whether the nucleus basalis-induced changes in the cortical responses to natural scenes were accom-panied by changes in the receptive field properties. Both the ON and OFF recep-tive fields of each neuron were measured with sparse noise stimuli before and after nucleus basalis stimulation (Supplementary Fig. 5). We found no significant change in receptive field size (P = 0.07 (ON) and P = 0.41 (OFF), n = 38 from 5 experiments; Supplementary Fig. 5), but we did find a significant increase in the ratio of the peak amplitude to baseline noise (P < 10−4 (ON) and P < 10−4 (OFF), n = 38 from 5 experi-ments; Supplementary Fig. 5). This prob-ably reflects the nucleus basalis-induced improvement in response reliability that is observed with natural stimuli. Previous stud-ies have shown that cortical iontophoresis of ACh could induce changes in orientation tuning and direction selectivity, although the observed effects were variable between cells and across studies31–34. Using drifting gratings to measure the orientation tuning of cortical neurons before and after nucleus basalis stimulation (Supplementary Fig. 6), we found no significant change in orientation tuning width (P = 0.78, n = 35 from 10 experiments; Supplementary Fig. 6) or direction selectivity (P = 0.20, n = 35 from 10 experiments; Supplementary Fig. 6) at the population level. Thus, instead of systematic alteration of recep-tive field properties, the most consistent effect of nucleus basalis stimulation across cortical neurons was the improvement of visual response reliability.
Decorrelation depends on cortical mAChRs Previous studies have found that the change in EEG pattern induced by nucleus basalis activation depends on cortical muscarinic ACh receptors (mAChRs)21. We therefore examined the role of mAChRs in nucleus basalis-induced changes in cortical responses by applying atropine sulfate, a selective mAChR antagonist, to the recording area via either intracortical injection with a micropipette (100 µM) or local application to the cortical surface (1 mM; see Online Methods). As shown in an example multiunit recording
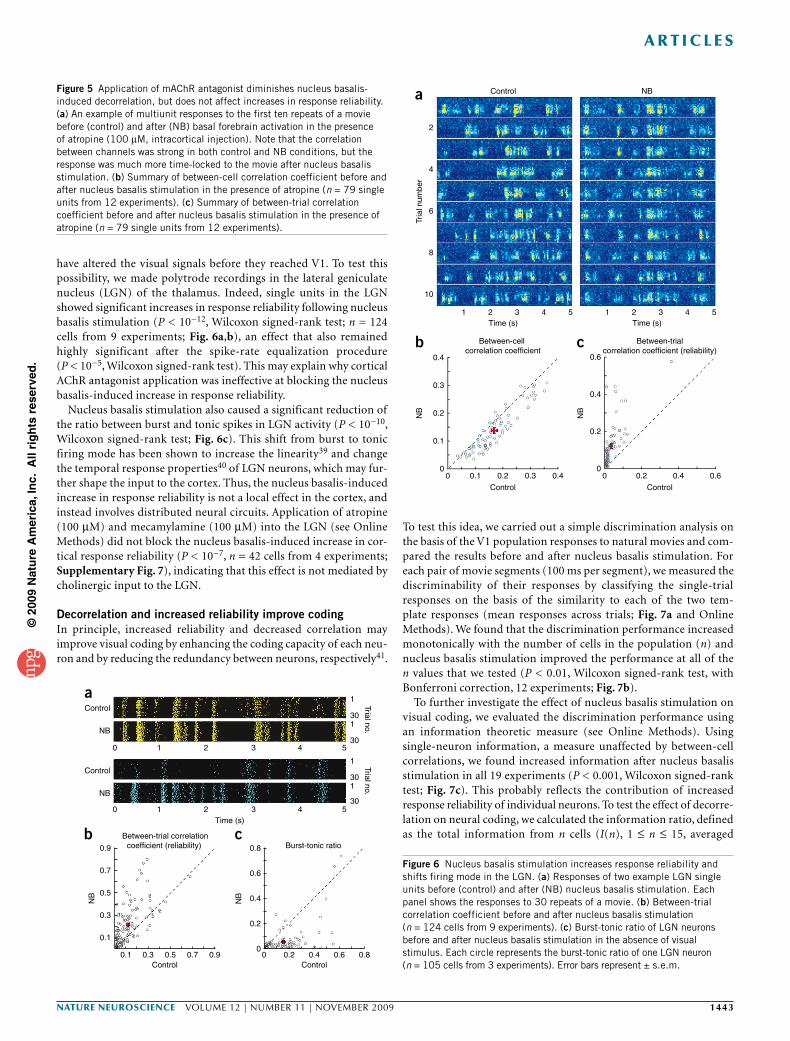
(Fig. 5a), atropine application greatly reduced the degree of decorrelation induced by nucleus basalis stimulation.
At the single-unit level, although the between-cell correlation coefficient was still reduced by nucleus basalis stimulation, the magnitude of decorrelation was much smaller than that in the absence of atropine (P < 10−28, Wilcoxon rank-sum test; n = 79 neurons from 12 experiments; Fig. 5b). Notably, atropine appli-cation was completely ineffective in blocking the nucleus basa-lis-induced increase in response reliability. As quantified by the between-trial correlation coefficient (Fig. 5c), nucleus basalis stim-ulation induced a highly significant increase in reliability in the presence of atropine (P < 10−13, Wilcoxon signed-rank test; n = 79 cells from 12 experiments). In fact, compared with the recordings in the absence of atropine (Fig. 4b), the nucleus basalis-induced increase in reliability was slightly larger in the presence of atropine (Fig. 5c), although the difference was not statistically significant (P = 0.08, Wilcoxon rank-sum test).
Increased reliability involves distributed neural circuitsWe also tested whether activation of nicotinic ACh receptors (nAChRs) could underlie the increased response reliability, as they
are known to enhance thalamocortical syn-aptic efficacy25 and boost the visual responses of cortical neurons30. However, a marked nucleus basalis-induced increase in response reliability was still present after cortical appli-cation of the selective nAChR antagonist mecamylamine (1–10 mM (surface appli-cation) or 100 µM to 1 mM (intracortical injection); P < 10−12, Wilcoxon signed-rank test, n = 70 cells from 9 experiments) or dihydro-β-erythroidine hydrobromide (DHβE, 100 µM (intracortical injection); P < 0.001, n = 16 cells from 3 experiments). In the presence of these nAChR antagonists, the magnitude of the nucleus basalis-induced increase was not reduced from that observed in the absence of the antagonists (P = 0.97, Wilcoxon rank-sum test). The above result suggests that nucleus basalis stimulation may
Figure 3 Nucleus basalis stimulation decreases correlation between cortical neurons during visual stimulation. (a) Three example experiments illustrating changes in between-cell correlation before (control) and after (NB) basal forebrain activation. Each panel shows the responses of multiple single units recorded simultaneously during a single movie repeat. Different neurons are indicated by different colors and ordered by cortical depth. (b) Summary of between-cell correlation coefficients before and after nucleus basalis stimulation (n = 166 cells from 19 experiments). Each circle represents the average correlation coefficient between a single neuron and all other neurons in the same recording. Error bars represent ± s.e.m.
Figure 4 Nucleus basalis stimulation increases the reliability of individual neurons in response to natural scenes. (a) Three example neurons (indicated by different colors) illustrating changes in response reliability before (control) and after (NB) basal forebrain activation. Each panel shows the responses of a single neuron to 30 repeats (trials) of a movie. (b) Summary of response reliability measured by between-trial correlation coefficient before and after nucleus basalis stimulation (166 cells from 19 experiments). Each circle represents data from one neuron, averaged over correlation coefficients for all pair-wise combinations of the 30 trials. Error bars represent ± s.e.m.
Control
Control
Control
a b
NB
0 1 2 3 4 5
1
1
160.4
0.3
0.2NB
0.1
0C
ell no.C
ell no.C
ell no.
16
1
1
19
19
1
1
13
13
0 1 2 3 4 5
0 1 2 3
Time (s)
4 50 0.1 0.2
Control
0.3 0.4
NB
NB
Between-cell correlation coefficient
Control1
300.7
Between-trialcorrelation coefficient
(reliability)
0.5
0.1 0.3
Control
0.5 0.7
0.3
0.1
1
30
1
301
30
1
301
30
NB
0 1 2 3
Trial no.Trial no. N
B
Trial no.
4 5
0 1 2 3 4 5
0 1 2 3Time (s)
4 5
Control
NB
Control
NB
a b
©20
09 N
atu
re A
mer
ica,
Inc.
All
rig
hts
res
erve
d.
nature neurOSCIenCe VOLUME 12 | NUMBER 11 | NOVEMBER 2009 1443
a r t I C l e S
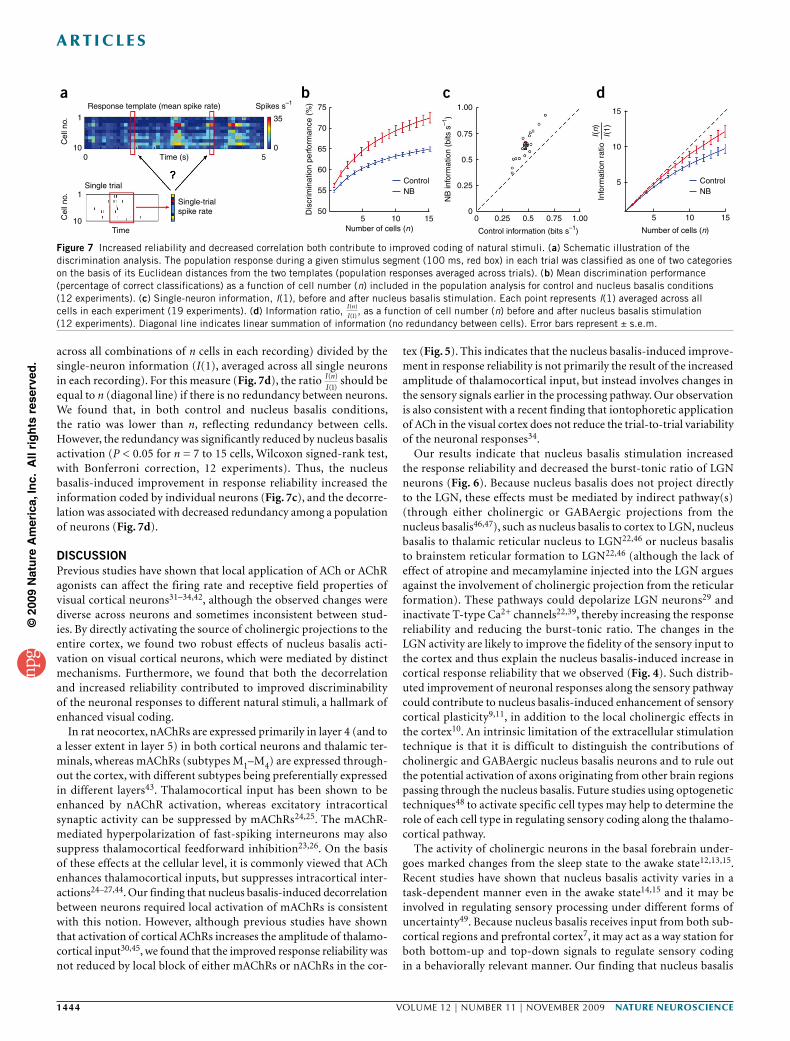
have altered the visual signals before they reached V1. To test this possibility, we made polytrode recordings in the lateral geniculate nucleus (LGN) of the thalamus. Indeed, single units in the LGN showed significant increases in response reliability following nucleus basalis stimulation (P < 10−12, Wilcoxon signed-rank test; n = 124 cells from 9 experiments; Fig. 6a,b), an effect that also remained highly significant after the spike-rate equalization procedure (P < 10−5, Wilcoxon signed-rank test). This may explain why cortical AChR antagonist application was ineffective at blocking the nucleus basalis-induced increase in response reliability.
Nucleus basalis stimulation also caused a significant reduction of the ratio between burst and tonic spikes in LGN activity (P < 10−10, Wilcoxon signed-rank test; Fig. 6c). This shift from burst to tonic firing mode has been shown to increase the linearity39 and change the temporal response properties40 of LGN neurons, which may fur-ther shape the input to the cortex. Thus, the nucleus basalis-induced increase in response reliability is not a local effect in the cortex, and instead involves distributed neural circuits. Application of atropine (100 µM) and mecamylamine (100 µM) into the LGN (see Online Methods) did not block the nucleus basalis-induced increase in cor-tical response reliability (P < 10−7, n = 42 cells from 4 experiments; Supplementary Fig. 7), indicating that this effect is not mediated by cholinergic input to the LGN.
Decorrelation and increased reliability improve codingIn principle, increased reliability and decreased correlation may improve visual coding by enhancing the coding capacity of each neu-ron and by reducing the redundancy between neurons, respectively41.
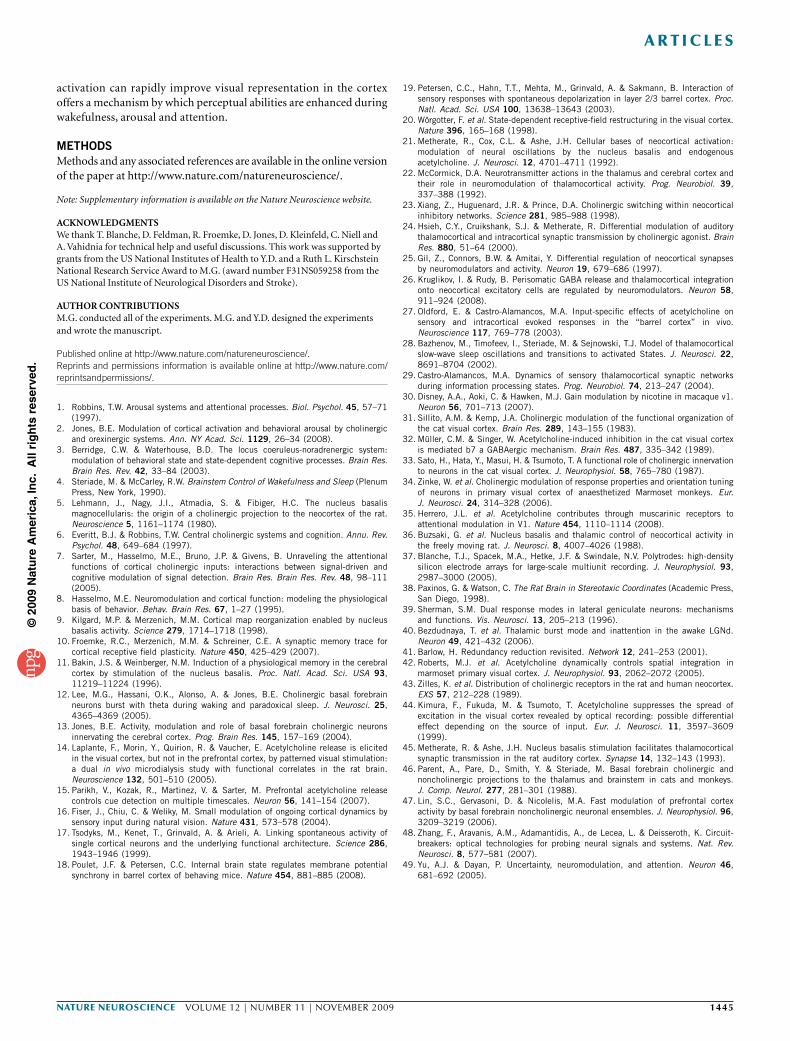
To test this idea, we carried out a simple discrimination analysis on the basis of the V1 population responses to natural movies and com-pared the results before and after nucleus basalis stimulation. For each pair of movie segments (100 ms per segment), we measured the discriminability of their responses by classifying the single-trial responses on the basis of the similarity to each of the two tem-plate responses (mean responses across trials; Fig. 7a and Online Methods). We found that the discrimination performance increased monotonically with the number of cells in the population (n) and nucleus basalis stimulation improved the performance at all of the n values that we tested (P < 0.01, Wilcoxon signed-rank test, with Bonferroni correction, 12 experiments; Fig. 7b).
To further investigate the effect of nucleus basalis stimulation on visual coding, we evaluated the discrimination performance using an information theoretic measure (see Online Methods). Using single-neuron information, a measure unaffected by between-cell correlations, we found increased information after nucleus basalis stimulation in all 19 experiments (P < 0.001, Wilcoxon signed-rank test; Fig. 7c). This probably reflects the contribution of increased response reliability of individual neurons. To test the effect of decorre-lation on neural coding, we calculated the information ratio, defined as the total information from n cells (I(n), 1 ≤ n ≤ 15, averaged
Control
2
4
Tria
l num
ber
6
8
10
1 2 3Time (s) Time (s)
4 5 1 2 3 4 5
NBa
b cBetween-cell correlation coefficient
Between-trialcorrelation coefficient (reliability)
NB
Control
0 0.1 0.2
0.4
0.3
0.2
0.1
00.3 0.4
NB
Control
0.6
0.4
0.2
00 0.2 0.4 0.6
Figure 5 Application of mAChR antagonist diminishes nucleus basalis-induced decorrelation, but does not affect increases in response reliability. (a) An example of multiunit responses to the first ten repeats of a movie before (control) and after (NB) basal forebrain activation in the presence of atropine (100 µM, intracortical injection). Note that the correlation between channels was strong in both control and NB conditions, but the response was much more time-locked to the movie after nucleus basalis stimulation. (b) Summary of between-cell correlation coefficient before and after nucleus basalis stimulation in the presence of atropine (n = 79 single units from 12 experiments). (c) Summary of between-trial correlation coefficient before and after nucleus basalis stimulation in the presence of atropine (n = 79 single units from 12 experiments).
Figure 6 Nucleus basalis stimulation increases response reliability and shifts firing mode in the LGN. (a) Responses of two example LGN single units before (control) and after (NB) nucleus basalis stimulation. Each panel shows the responses to 30 repeats of a movie. (b) Between-trial correlation coefficient before and after nucleus basalis stimulation (n = 124 cells from 9 experiments). (c) Burst-tonic ratio of LGN neurons before and after nucleus basalis stimulation in the absence of visual stimulus. Each circle represents the burst-tonic ratio of one LGN neuron (n = 105 cells from 3 experiments). Error bars represent ± s.e.m.
0.9c
a
b
0.7
NB
NB0.5
0.3
0.8
1
301
300 1 2 3 4 5
0 1 2Time (s)
Control
NB
Control
NB
3 4 5
1
301
30
0.6
0.4
0.2
00.1 0.3 0.5
Control
Burst-tonic ratio
Trial no.Trial no.
0.7 0.80.60.4Control
0.200.9
0.1
Between-trial correlationcoefficient (reliability)
©20
09 N
atu
re A
mer
ica,
Inc.
All
rig
hts
res
erve
d.
1444 VOLUME 12 | NUMBER 11 | NOVEMBER 2009 nature neurOSCIenCe
a r t I C l e S
across all combinations of n cells in each recording) divided by the single-neuron information (I(1), averaged across all single neurons in each recording). For this measure (Fig. 7d), the ratio I n
I
( )
( )1 should be
equal to n (diagonal line) if there is no redundancy between neurons. We found that, in both control and nucleus basalis conditions, the ratio was lower than n, reflecting redundancy between cells. However, the redundancy was significantly reduced by nucleus basalis activation (P < 0.05 for n = 7 to 15 cells, Wilcoxon signed-rank test, with Bonferroni correction, 12 experiments). Thus, the nucleus basalis-induced improvement in response reliability increased the information coded by individual neurons (Fig. 7c), and the decorre-lation was associated with decreased redundancy among a population of neurons (Fig. 7d).
DISCUSSIONPrevious studies have shown that local application of ACh or AChR agonists can affect the firing rate and receptive field properties of visual cortical neurons31–34,42, although the observed changes were diverse across neurons and sometimes inconsistent between stud-ies. By directly activating the source of cholinergic projections to the entire cortex, we found two robust effects of nucleus basalis acti-vation on visual cortical neurons, which were mediated by distinct mechanisms. Furthermore, we found that both the decorrelation and increased reliability contributed to improved discriminability of the neuronal responses to different natural stimuli, a hallmark of enhanced visual coding.
In rat neocortex, nAChRs are expressed primarily in layer 4 (and to a lesser extent in layer 5) in both cortical neurons and thalamic ter-minals, whereas mAChRs (subtypes M1–M4) are expressed through-out the cortex, with different subtypes being preferentially expressed in different layers43. Thalamocortical input has been shown to be enhanced by nAChR activation, whereas excitatory intracortical synaptic activity can be suppressed by mAChRs24,25. The mAChR-mediated hyperpolarization of fast-spiking interneurons may also suppress thalamocortical feedforward inhibition23,26. On the basis of these effects at the cellular level, it is commonly viewed that ACh enhances thalamocortical inputs, but suppresses intracortical inter-actions24–27,44. Our finding that nucleus basalis-induced decorrelation between neurons required local activation of mAChRs is consistent with this notion. However, although previous studies have shown that activation of cortical AChRs increases the amplitude of thalamo-cortical input30,45, we found that the improved response reliability was not reduced by local block of either mAChRs or nAChRs in the cor-
tex (Fig. 5). This indicates that the nucleus basalis-induced improve-ment in response reliability is not primarily the result of the increased amplitude of thalamocortical input, but instead involves changes in the sensory signals earlier in the processing pathway. Our observation is also consistent with a recent finding that iontophoretic application of ACh in the visual cortex does not reduce the trial-to-trial variability of the neuronal responses34.
Our results indicate that nucleus basalis stimulation increased the response reliability and decreased the burst-tonic ratio of LGN neurons (Fig. 6). Because nucleus basalis does not project directly to the LGN, these effects must be mediated by indirect pathway(s) (through either cholinergic or GABAergic projections from the nucleus basalis46,47), such as nucleus basalis to cortex to LGN, nucleus basalis to thalamic reticular nucleus to LGN22,46 or nucleus basalis to brainstem reticular formation to LGN22,46 (although the lack of effect of atropine and mecamylamine injected into the LGN argues against the involvement of cholinergic projection from the reticular formation). These pathways could depolarize LGN neurons29 and inactivate T-type Ca2+ channels22,39, thereby increasing the response reliability and reducing the burst-tonic ratio. The changes in the LGN activity are likely to improve the fidelity of the sensory input to the cortex and thus explain the nucleus basalis-induced increase in cortical response reliability that we observed (Fig. 4). Such distrib-uted improvement of neuronal responses along the sensory pathway could contribute to nucleus basalis-induced enhancement of sensory cortical plasticity9,11, in addition to the local cholinergic effects in the cortex10. An intrinsic limitation of the extracellular stimulation technique is that it is difficult to distinguish the contributions of cholinergic and GABAergic nucleus basalis neurons and to rule out the potential activation of axons originating from other brain regions passing through the nucleus basalis. Future studies using optogenetic techniques48 to activate specific cell types may help to determine the role of each cell type in regulating sensory coding along the thalamo-cortical pathway.
The activity of cholinergic neurons in the basal forebrain under-goes marked changes from the sleep state to the awake state12,13,15. Recent studies have shown that nucleus basalis activity varies in a task-dependent manner even in the awake state14,15 and it may be involved in regulating sensory processing under different forms of uncertainty49. Because nucleus basalis receives input from both sub-cortical regions and prefrontal cortex7, it may act as a way station for both bottom-up and top-down signals to regulate sensory coding in a behaviorally relevant manner. Our finding that nucleus basalis
Response template (mean spike rate)
1
10
1
10
75 1.00 15
10
5
0.75
0.5
0.25
0
70
Dis
crim
inat
ion
perf
orm
ance
(%
)
NB
info
rmat
ion
(bits
s–1
)
65
60
55
505 10
ControlNB
15 0 0.25 0.5 0.75 1.00 5 10
ControlNB
Number of cells (n)
15Number of cells (n) Control information (bits s–1)
0 50
35
Spikes s–1
Single-trialspike rate
Time (s)
Single trial
Time
Cel
l no.
Cel
l no. In
form
atio
n ra
tioI(n)
I(1)
a b c d
Figure 7 Increased reliability and decreased correlation both contribute to improved coding of natural stimuli. (a) Schematic illustration of the discrimination analysis. The population response during a given stimulus segment (100 ms, red box) in each trial was classified as one of two categories on the basis of its Euclidean distances from the two templates (population responses averaged across trials). (b) Mean discrimination performance (percentage of correct classifications) as a function of cell number (n) included in the population analysis for control and nucleus basalis conditions (12 experiments). (c) Single-neuron information, I(1), before and after nucleus basalis stimulation. Each point represents I(1) averaged across all cells in each experiment (19 experiments). (d) Information ratio, I n
I
( )
( )1, as a function of cell number (n) before and after nucleus basalis stimulation
(12 experiments). Diagonal line indicates linear summation of information (no redundancy between cells). Error bars represent ± s.e.m.
©20
09 N
atu
re A
mer
ica,
Inc.
All
rig
hts
res
erve
d.
nature neurOSCIenCe VOLUME 12 | NUMBER 11 | NOVEMBER 2009 1445
a r t I C l e S
activation can rapidly improve visual representation in the cortex offers a mechanism by which perceptual abilities are enhanced during wakefulness, arousal and attention.
METHODSMethods and any associated references are available in the online version of the paper at http://www.nature.com/natureneuroscience/.
Note: Supplementary information is available on the Nature Neuroscience website.
AcknowledgmenTSWe thank T. Blanche, D. Feldman, R. Froemke, D. Jones, D. Kleinfeld, C. Niell and A. Vahidnia for technical help and useful discussions. This work was supported by grants from the US National Institutes of Health to Y.D. and a Ruth L. Kirschstein National Research Service Award to M.G. (award number F31NS059258 from the US National Institute of Neurological Disorders and Stroke).
AUTHoR conTRIBUTIonSM.G. conducted all of the experiments. M.G. and Y.D. designed the experiments and wrote the manuscript.
Published online at http://www.nature.com/natureneuroscience/. Reprints and permissions information is available online at http://www.nature.com/reprintsandpermissions/.
1. Robbins, T.W. Arousal systems and attentional processes. Biol. Psychol. 45, 57–71 (1997).
2. Jones, B.E. Modulation of cortical activation and behavioral arousal by cholinergic and orexinergic systems. Ann. NY Acad. Sci. 1129, 26–34 (2008).
3. Berridge, C.W. & Waterhouse, B.D. The locus coeruleus-noradrenergic system: modulation of behavioral state and state-dependent cognitive processes. Brain Res. Brain Res. Rev. 42, 33–84 (2003).
4. Steriade, M. & McCarley, R.W. Brainstem Control of Wakefulness and Sleep (Plenum Press, New York, 1990).
5. Lehmann, J., Nagy, J.I., Atmadia, S. & Fibiger, H.C. The nucleus basalis magnocellularis: the origin of a cholinergic projection to the neocortex of the rat. Neuroscience 5, 1161–1174 (1980).
6. Everitt, B.J. & Robbins, T.W. Central cholinergic systems and cognition. Annu. Rev. Psychol. 48, 649–684 (1997).
7. Sarter, M., Hasselmo, M.E., Bruno, J.P. & Givens, B. Unraveling the attentional functions of cortical cholinergic inputs: interactions between signal-driven and cognitive modulation of signal detection. Brain Res. Brain Res. Rev. 48, 98–111 (2005).
8. Hasselmo, M.E. Neuromodulation and cortical function: modeling the physiological basis of behavior. Behav. Brain Res. 67, 1–27 (1995).
9. Kilgard, M.P. & Merzenich, M.M. Cortical map reorganization enabled by nucleus basalis activity. Science 279, 1714–1718 (1998).
10. Froemke, R.C., Merzenich, M.M. & Schreiner, C.E. A synaptic memory trace for cortical receptive field plasticity. Nature 450, 425–429 (2007).
11. Bakin, J.S. & Weinberger, N.M. Induction of a physiological memory in the cerebral cortex by stimulation of the nucleus basalis. Proc. Natl. Acad. Sci. USA 93, 11219–11224 (1996).
12. Lee, M.G., Hassani, O.K., Alonso, A. & Jones, B.E. Cholinergic basal forebrain neurons burst with theta during waking and paradoxical sleep. J. Neurosci. 25, 4365–4369 (2005).
13. Jones, B.E. Activity, modulation and role of basal forebrain cholinergic neurons innervating the cerebral cortex. Prog. Brain Res. 145, 157–169 (2004).
14. Laplante, F., Morin, Y., Quirion, R. & Vaucher, E. Acetylcholine release is elicited in the visual cortex, but not in the prefrontal cortex, by patterned visual stimulation: a dual in vivo microdialysis study with functional correlates in the rat brain. Neuroscience 132, 501–510 (2005).
15. Parikh, V., Kozak, R., Martinez, V. & Sarter, M. Prefrontal acetylcholine release controls cue detection on multiple timescales. Neuron 56, 141–154 (2007).
16. Fiser, J., Chiu, C. & Weliky, M. Small modulation of ongoing cortical dynamics by sensory input during natural vision. Nature 431, 573–578 (2004).
17. Tsodyks, M., Kenet, T., Grinvald, A. & Arieli, A. Linking spontaneous activity of single cortical neurons and the underlying functional architecture. Science 286, 1943–1946 (1999).
18. Poulet, J.F. & Petersen, C.C. Internal brain state regulates membrane potential synchrony in barrel cortex of behaving mice. Nature 454, 881–885 (2008).
19. Petersen, C.C., Hahn, T.T., Mehta, M., Grinvald, A. & Sakmann, B. Interaction of sensory responses with spontaneous depolarization in layer 2/3 barrel cortex. Proc. Natl. Acad. Sci. USA 100, 13638–13643 (2003).
20. Wörgotter, F. et al. State-dependent receptive-field restructuring in the visual cortex. Nature 396, 165–168 (1998).
21. Metherate, R., Cox, C.L. & Ashe, J.H. Cellular bases of neocortical activation: modulation of neural oscillations by the nucleus basalis and endogenous acetylcholine. J. Neurosci. 12, 4701–4711 (1992).
22. McCormick, D.A. Neurotransmitter actions in the thalamus and cerebral cortex and their role in neuromodulation of thalamocortical activity. Prog. Neurobiol. 39, 337–388 (1992).
23. Xiang, Z., Huguenard, J.R. & Prince, D.A. Cholinergic switching within neocortical inhibitory networks. Science 281, 985–988 (1998).
24. Hsieh, C.Y., Cruikshank, S.J. & Metherate, R. Differential modulation of auditory thalamocortical and intracortical synaptic transmission by cholinergic agonist. Brain Res. 880, 51–64 (2000).
25. Gil, Z., Connors, B.W. & Amitai, Y. Differential regulation of neocortical synapses by neuromodulators and activity. Neuron 19, 679–686 (1997).
26. Kruglikov, I. & Rudy, B. Perisomatic GABA release and thalamocortical integration onto neocortical excitatory cells are regulated by neuromodulators. Neuron 58, 911–924 (2008).
27. Oldford, E. & Castro-Alamancos, M.A. Input-specific effects of acetylcholine on sensory and intracortical evoked responses in the “barrel cortex” in vivo. Neuroscience 117, 769–778 (2003).
28. Bazhenov, M., Timofeev, I., Steriade, M. & Sejnowski, T.J. Model of thalamocortical slow-wave sleep oscillations and transitions to activated States. J. Neurosci. 22, 8691–8704 (2002).
29. Castro-Alamancos, M.A. Dynamics of sensory thalamocortical synaptic networks during information processing states. Prog. Neurobiol. 74, 213–247 (2004).
30. Disney, A.A., Aoki, C. & Hawken, M.J. Gain modulation by nicotine in macaque v1. Neuron 56, 701–713 (2007).
31. Sillito, A.M. & Kemp, J.A. Cholinergic modulation of the functional organization of the cat visual cortex. Brain Res. 289, 143–155 (1983).
32. Müller, C.M. & Singer, W. Acetylcholine-induced inhibition in the cat visual cortex is mediated b7 a GABAergic mechanism. Brain Res. 487, 335–342 (1989).
33. Sato, H., Hata, Y., Masui, H. & Tsumoto, T. A functional role of cholinergic innervation to neurons in the cat visual cortex. J. Neurophysiol. 58, 765–780 (1987).
34. Zinke, W. et al. Cholinergic modulation of response properties and orientation tuning of neurons in primary visual cortex of anaesthetized Marmoset monkeys. Eur. J. Neurosci. 24, 314–328 (2006).
35. Herrero, J.L. et al. Acetylcholine contributes through muscarinic receptors to attentional modulation in V1. Nature 454, 1110–1114 (2008).
36. Buzsaki, G. et al. Nucleus basalis and thalamic control of neocortical activity in the freely moving rat. J. Neurosci. 8, 4007–4026 (1988).
37. Blanche, T.J., Spacek, M.A., Hetke, J.F. & Swindale, N.V. Polytrodes: high-density silicon electrode arrays for large-scale multiunit recording. J. Neurophysiol. 93, 2987–3000 (2005).
38. Paxinos, G. & Watson, C. The Rat Brain in Stereotaxic Coordinates (Academic Press, San Diego, 1998).
39. Sherman, S.M. Dual response modes in lateral geniculate neurons: mechanisms and functions. Vis. Neurosci. 13, 205–213 (1996).
40. Bezdudnaya, T. et al. Thalamic burst mode and inattention in the awake LGNd. Neuron 49, 421–432 (2006).
41. Barlow, H. Redundancy reduction revisited. Network 12, 241–253 (2001).42. Roberts, M.J. et al. Acetylcholine dynamically controls spatial integration in
marmoset primary visual cortex. J. Neurophysiol. 93, 2062–2072 (2005).43. Zilles, K. et al. Distribution of cholinergic receptors in the rat and human neocortex.
EXS 57, 212–228 (1989).44. Kimura, F., Fukuda, M. & Tsumoto, T. Acetylcholine suppresses the spread of
excitation in the visual cortex revealed by optical recording: possible differential effect depending on the source of input. Eur. J. Neurosci. 11, 3597–3609 (1999).
45. Metherate, R. & Ashe, J.H. Nucleus basalis stimulation facilitates thalamocortical synaptic transmission in the rat auditory cortex. Synapse 14, 132–143 (1993).
46. Parent, A., Pare, D., Smith, Y. & Steriade, M. Basal forebrain cholinergic and noncholinergic projections to the thalamus and brainstem in cats and monkeys. J. Comp. Neurol. 277, 281–301 (1988).
47. Lin, S.C., Gervasoni, D. & Nicolelis, M.A. Fast modulation of prefrontal cortex activity by basal forebrain noncholinergic neuronal ensembles. J. Neurophysiol. 96, 3209–3219 (2006).
48. Zhang, F., Aravanis, A.M., Adamantidis, A., de Lecea, L. & Deisseroth, K. Circuit-breakers: optical technologies for probing neural signals and systems. Nat. Rev. Neurosci. 8, 577–581 (2007).
49. Yu, A.J. & Dayan, P. Uncertainty, neuromodulation, and attention. Neuron 46, 681–692 (2005).
©20
09 N
atu
re A
mer
ica,
Inc.
All
rig
hts
res
erve
d.
nature neurOSCIenCe doi:10.1038/nn.2402
ONLINE METHODSSurgery. All experimental procedures were approved by the Animal Care and Use Committee at the University of California, Berkeley. Adult male Long-Evans rats (250–350 g) were anesthetized with urethane (intraperitoneal, 1.45 g per kg of body weight). Rats were restrained in a stereotaxic apparatus (David Kopf Instruments) and their body temperature was maintained at 37.5 °C via a heating pad. Bipolar stimulating electrodes were stereotaxically implanted in the left nucleus basalis and the nucleus basalis was stimulated with trains of 50 pulses (0.1 ms per pulse) at 100 Hz. A craniotomy (~1-mm diameter) was made either above the monocular region of left V1 or above the left LGN. A small portion of the dura was removed to allow the insertion of a silicon polytrode (27 active channels separated by 50 µm, NeuroNexus Technologies). Signals were recorded with the Cheetah 32-channel acquisition system (Neuralynx) at 30 kHz. The right eye was fixed with a metal ring to prevent eye movement and irrigated with sterile saline. Following the experiment, the rats were killed with an overdose of isoflurane. A total of 49 rats were used in this study.
Histochemistry. For histochemistry experiments, the rats were deeply anesthe-tized with urethane and immediately perfused with chilled 4% paraformaldehyde (wt/vol) in 0.1 M PBS. The brain was removed and fixed in 4% paraformaldehyde in PBS solution overnight at 4 °C. After fixation, the brain was sectioned into 150-µm horizontal slices using a vibratome (Serial 1000 Tissue Sectioning System, Ted Pella). For acetylcholinesterase histochemistry, slices were incubated in 4 mM acetylcholine iodide, 4 mM copper sulfate and 16 mM glycine in a 50 mM sodium acetate solution (pH 5.0) for 15 h at 23 °C and developed in 1% sodium sulfide solution (wt/vol, pH 7.0) for 10 min at 23 °C. This procedure was performed in 15 of the 49 experiments included in this study.
Pharmacology. For topical drug application, a microwell was made by gluing a plastic ring to the skull surrounding the craniotomy. During application, antago-nists to mAChRs (atropine, 1 mM) or nAChR (mecamylamine, 1–10 mM) were loaded into the microwell 15 min before recording. For intracortical injection, a glass micropipette (tip size, ~10 µm) was fixed to the front of the polytrode such that the tip was close to the center of the polytrode recording sites (layer 4 or 5). Pharmacological antagonists to mAChRs (atropine, 100 µM) or nAChRs (mecamylamine, 100 µM to 1 mM; DHβE, 100 µM) were injected at a rate of 15 nl min−1 using a Hamilton syringe and a syringe pump, starting 15 min before and continuing throughout the recording period (total volume of ~500 nl). Topical and intracortical pharmacology experiments were combined, as results were very similar for both methods.
To block LGN nAChRs and mAChRs (Supplementary Fig. 7), a mixture of 100 µM atropine and 100 µM mecamylamine was injected at 15 nl min−1 start-ing 15 min before and continuing throughout the recording. The volume of injection (~500 nl) was determined in pilot experiments using dye injections to achieve coverage of most of the LGN without going much beyond its borders. To further ensure that the LGN neurons projecting to the recorded region of V1 were well exposed to the antagonists, we bonded a tungsten electrode to the injection pipette and mapped the LGN multiunit receptive field as closely as possible to the V1 multiunit receptive field.
Visual stimuli. Visual stimuli were generated with a PC computer contain-ing a NVIDIA GeForce 6600 graphics board and presented with a XENARC 700V LCD monitor (19.7 cm × 12.1 cm, 960 × 600 pixels, 75-Hz refresh rate, 300-cd m−2 maximum luminance, gamma corrected with custom software) located 14 cm from the right eye, positioned such that the receptive fields of the recorded neurons were at the center of the monitor. For natural stimuli, three 5-s clips were selected from the van Hateren natural movie database. Each image (64 × 64 pixels, 36° × 36°, mean contrast of 43%) was updated every three refresh frames, corre-sponding to an effective frame rate of 25 Hz. To avoid onset and offset transients, we displayed the first frame for 1 s before the movie and displayed the last frame for 1 s following the movie.
Each experiment consisted of six blocks and each block consisted of five repeats of the three movies under control and five repeats under nucleus basalis condi-tions (Supplementary Fig. 4). Under the control condition, the movies were repeated five times with 2 s of static image before each movie. Under the nucleus basalis condition, the movies were repeated five times as in the control condition, and nucleus basalis stimulation was administered from 1,000 ms to 500 ms before
the start of each movie. To ensure that the effect of nucleus basalis stimulation had diminished before the start of control trials, we showed the rats a blank frame for 30 s following each block. Each experiment consisted of 30 movie repeats under control and 30 repeats under nucleus basalis conditions. In blocks 1–3, the control repeats preceded the nucleus basalis repeats, and in blocks 4–6, the sequence was reversed to further eliminate the potential effect of stimulus history on cortical responses.
For measuring receptive fields (Supplementary Fig. 5), sparse noise consisting of random flashes of white and black pixels (100% contrast, 4.5° per pixel, 100 ms per flash) on a gray background was used. For measuring orientation tuning and direction selectivity (Supplementary Fig. 6), drifting gratings (100% contrast, 2 Hz, 0.04 cycles per deg) were used.
Analyses. LFP analysis was carried out using Gabor/Morlet wavelet decomposi-tion (http://dxjones.com/matlab/timefreq/). For single-unit isolation, polytrode contact sites (channels) were separated into groups (2–4 channels per group) and spike waveforms were sorted using NeuroScope (http://neuroscope.sourceforge.net), NDManager (http://ndmanager.sourceforge.net) and Klusters (http://klus-ters.sourceforge.net)50. In some instances, a single neuron was picked up by more than one electrode group. To ensure that duplicate neurons were not included in the subsequent analyses, we calculated pair-wise between-neuron correlation coefficients (binned at 1,000 Hz) following clustering; for any pair with a correla-tion coefficient greater than 0.1, the cell with the lower firing rate was discarded. For the remaining single units, only those with firing rates greater than 0.5 spikes per s were included in further analyses, performed in MATLAB (Mathworks).
For calculation of between-cell and between-trial correlation coefficients (Figs. 2 and 3), firing rates were binned at 10 Hz (although results were similar for binning from 5–25 Hz). To determine whether a given cell was visually driven, we compared the average between-trial correlation coefficient within movies and between movies. Only cells that had significantly higher within-movie correlation coefficients (threshold α = 0.01, Wilcoxon signed-rank test) were included in further analyses. The burst-tonic ratio was calculated by measuring the number of burst spikes (two or more spikes occurring with interspike interval less than 4 ms following an absence of spiking for more than 100 ms) relative to the number of tonic spikes (all spikes not meeting the burst criteria).
To quantify the ON and OFF receptive fields measured with sparse noise (Supplementary Fig. 5), we fitted each receptive field with a two-dimensional Gaussian function
R x y a ae
x x y y
M m( , )
( ) ( )
= +−
−+
−
02 2
02
20
2
2s s
where R(x,y) is the response at pixel position (x,y), a0 is the baseline component, a is the receptive field peak amplitude, (x0,y0) is the receptive field center, and σM and σm are the s.d. along the major and minor axes. The receptive field size is measured by πσMσm and the amplitude/baseline ratio is measured by a
a0
a
a0
a
a0 .To measure orientation tuning and direction selectivity (Supplementary
Fig. 6), we fitted firing rate as a function of orientation as the sum of two Gaussians with peaks 180° apart
R a a e a e( )
( ) ( )
q
q q
s
q q
s= + +
− − − − +
0 12
2
180
2
02
20
2
2
where R(θ) is the response at orientation θ, a0 is the baseline component, a1 and a2 are the amplitudes of the two Gaussians, θ0 is the preferred orientation, and σ is the s.d. Tuning width is measured by σ and direction selectivity is measured by
R R
R R
( ) ( )
( ) ( ).
q qq q
0 0
0 0
180
180
− + °+ + °
For the discrimination analysis (Fig. 7), the responses were also binned at 10 Hz. For each discrimination, the single-trial response in a given bin (Ai, where i is the trial number) was compared with the mean responses (averaged across trials) in the same bin (<A>) and in a different bin (<B>) on the basis of the Euclidian distances d(Ai, <A>) and d(Ai, <B>). The classification was considered correct if d(Ai, <A>) < d(Ai, <B>), and incorrect if d(Ai, <A>) > d(Ai, <B>). Discrimination
©20
09 N
atu
re A
mer
ica,
Inc.
All
rig
hts
res
erve
d.
nature neurOSCIenCedoi:10.1038/nn.2402
performance was assessed by the percentage of correct classifications for all the trials. Because the discrimination performance is expected to increase non-linearly with the number of neurons, it is difficult to measure the redundancy between neurons. We therefore converted the discrimination performance into a measure of information as I p p p p= + + − −1 1 12 2( )log ( ) ( )log ( ), where p is the discrimination performance (note that when discrimination is at chance level, p = 50%, I = 0). This definition of I represents the mutual information between the actual stimulus and the stimulus decoded from the neuronal response by the ideal observer in the discrimination analysis. I(n) is computed as the aver-age information across all combinations of n simultaneously recorded cells in each experiment and it should increase linearly with n if there is no redundancy
between neurons. Downward deviation from the diagonal line in Figure 7d thus reflects the degree of redundancy. For population analyses (Fig. 7b,d), only experiments with ≥15 simultaneously recorded single units were included (12 out of 19 experiments).
To test statistical significance, Wilcoxon signed-rank test was used for paired samples and Wilcoxon rank-sum test was used for unpaired samples; multiple comparisons were corrected with the Bonferroni method.
50. Hazan, L., Zugaro, M. & Buzsaki, G. Klusters, NeuroScope, NDManager: a free software suite for neurophysiological data processing and visualization. J. Neurosci. Methods 155, 207–216 (2006).
©20
09 N
atu
re A
mer
ica,
Inc.
All
rig
hts
res
erve
d.