Embed Size (px)
Citation preview
Kyoto University, Graduate School of Economics Discussion Paper Series
Behavioral Study of Personalized Automated Demand Response in Workplaces
Takanori Ida , Naoya Motegi , and Yoshiaki Ushifusa
Discussion Paper No. E-16-010
Graduate School of Economics Kyoto University
Yoshida-Hommachi, Sakyo-ku Kyoto City, 606-8501, Japan
November, 2016 Revised August, 2017

1
Behavioral Study of Personalized Automated Demand Response in Workplaces
Takanori Ida*, Naoya Motegi†, and Yoshiaki Ushifusa‡
This version: August 4, 2017
Abstract
This study conducts a quasi-randomized controlled trial in a workplace with personalized lighting control and investigates the impact of automated demand responses on employees. To meet this objective, we set up four treatment groups: opt-in performance incentive, opt-in fixed incentive, opt-out performance incentive, and opt-out fixed incentive. Subsequently, we estimate the average treatment effects (intent-to-treat and treatment-on-treated) of the demand response. The results reveal a significant reduction in electricity consumption during peak hours for all four treatment groups.
JEL classification: C23, C93, D03, Q41
Keywords: Field Experiment, Behavioral Economics, Default Effect
* Graduate School of Economics, Kyoto University, Kyoto 606-8501, Japan† Environmental Engineering, Engineering Department, Takenaka Corporation, Tokyo136-0075, Japan‡ Faculty of Economics and Business Administration, The University of Kitakyushu,Fukuoka 802-8577, Japan

2
1. Introduction
The 2011 Great East Japan Earthquake resulted in various nuclear power plants’ closure, placing considerable pressure on electric power supply and demand. This in turn led to increasing focus on demand response (DR). Consequently, electric power suppliers began requesting users to save electricity or raising electricity rates when an electrical grid is destabilized or supply had to be increased in response to demand. In Japan, randomized control trials (RCT) have been used to conduct DR field experiments in Yokohama City, Toyota City, Kyoto Prefecture, and Kitakyushu City by dividing households into treatment groups and a control group on the basis of electricity prices to estimate electricity-saving effects (Ito et al., 2015). Similarly, numerous DR field experiments have also been conducted for households in the United States (Faruqui and Sergici, 2010; Wolak, 2011; SMUD, 2014).
However, these experiments measure manual DR, that is, the extent to which ordinary household users manually control their electrical equipment, and suggest that the electricity-saving effects of manual DR are limited. In commercial areas (e.g., offices), where energy consumption is significantly higher than that of households, DR-based electricity saving contributes to the stabilization of electric power grids. Despite this, DR field tests for commercial facilities have been rare and small in scale.
While many field experiments on household manual DR have been performed, this study designs and executes a field experiment using automated DR (ADR) and focuses on commercial spaces, particularly offices. ADR is a system that automatically transmits DR requests or notifications of change in electricity rates to users and controls the usage of household appliances and machines (i.e., the temperature of air conditioners or turning them on and off or reducing the intensity of lights; Piette et al., 2009; Krioukov et al.,2011). A DR field test can also be directed toward business facilities and many technical trials have been performed to verify energy conservation and electricity-saving effects. However, past studies on business facilities have found it difficult to ensure an adequate number of DR participants (Siero et al., 1996; Jain et al., 2012; Krioukov et al.,2011; Brown et al., 2013). To the best of our knowledge, no field experiment has examined the energy conservation and electricity-saving actions of individual employees using RCT or quasi-randomized controlled trial (QRCT).
Moreover, under which conditions and environments, it has been clarified through household DR field experiments can save electricity. For example, the DR participation rate significantly varies by whether the DR participation condition is an opt-in (default condition is non-participation and people who wish to participate, do so) or opt-out (default condition is participation and people who do not wish to participate, drop out) and opt-out has a higher participation rate than opt-in (SMUD, 2014; Ida and Wang, 2015).1 However, implementing DR socially can be difficult, given the potential bias in maintaining status quo when one electric power contract ends and a new one takes effect (Hartman et al., 1991). This study also verifies the conditions under which a business facility employee participates in DR to save electricity. We offered two types of incentive 1 The results suggest that people’s actions are influenced by the default condition: a result similar to that for the choice to donate one’s organs (Spital, 1995; Johnson and Goldstein, 2003; Thaler and Sunstein; 2008).

3
for DR participation: performance-based coffee coupons and fixed quantities, regardless of performance.
For this study, employees in an office building were divided into four treatment groups and a control group to quantitatively determine whether participation rate varies by DR participation condition for the treatment groups and electricity-saving effects (the amount of electric power consumed by each employee’s task light). The four treatment groups are opt-in performance incentive, opt-in fixed incentive, opt-out performance incentive, and opt-out fixed incentive group. A QRCT was conducted to implement DR in the office building with a building energy management system (BEMS) compatible with ADR.
The key findings of this study are as follows. First, the highest DR participation rate was found for opt-out fixed incentive, followed by opt-out performance incentive, opt-in performance incentive, and opt-in fixed inventive. Subsequently, to estimate each treatment group’s electricity-saving effects (average treatment effects [ATE]), the overall electricity-saving effects of each treatment group (intent-to-treat [ITT]) and those of employees’ DR participation for each treatment group (treatment-on-treated [TOT]) were measured. Second, the ATE of ITT was largest for opt-out performance incentive, followed by opt-in performance incentive, opt-out fixed incentive, and opt-in fixed incentive. Third, the ATE of TOT was the highest for opt-in performance incentive, followed by opt-in fixed inventive, opt-out performance incentive, and opt-out fixed incentive. Since electricity-saving effects of the opt-in groups are higher than those of opt-out groups, workers who willingly participated in the DR are more conscious about saving electricity. In addition, the electricity-saving effects of the performance incentive groups are higher than those of the fixed ones. The remainder of this paper is organized as follows. Section 2 describes the details of our experimental design and data. Section 3 presents the main results of our study, including treatment effect estimation strategies and ITT/TOT results. We conclude in Section 4.
2. Research Design and Data 2.1 Experiment Overview We first outline the experiment. The project was initiated in 2013 by Takenaka Corporation, a large-scale general contractor, and Kyoto University. The experiment was conducted from July 14 to August 1, 2014, (excluding Saturdays and holidays) in Takenaka Corporation’s Tokyo headquarter building (fifth and seventh floors). The request period to save electricity (DR request) was between 13:30 and 15:30 on six mid-summer days (July 16, 18, 23, 24, and 30 and August 1, 2014), which generally have the highest electric power supply and demand. The DR event was directed at employees in the treatment groups (Table 1).
(Table 1: Experiment Outline)

4
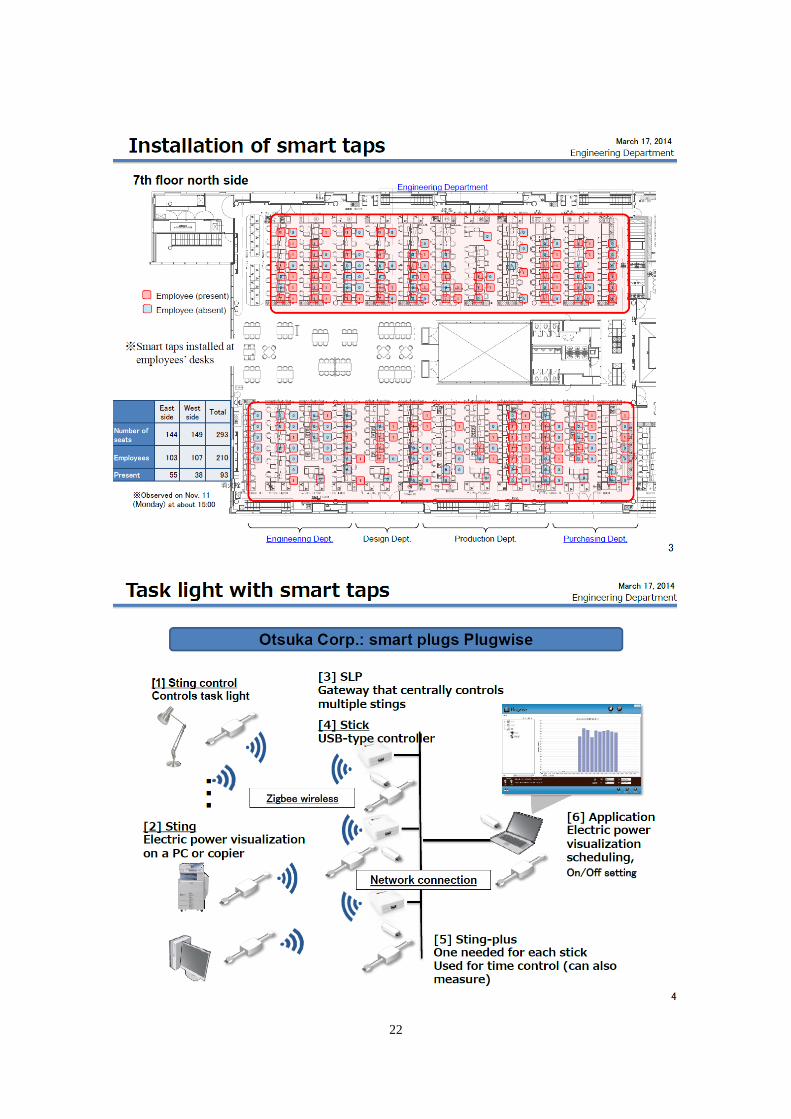
Next, we discuss the characteristic of ADR. We conducted a DR event in workspaces equipped with personal lighting control. The task lights were connected to smart outlets and thus, it was possible to remotely shut off the power and measure the quantity of power consumed. On each day that the DR was implemented, requests were sent to employees via e-mail using the BEMS. Each worker was required to mention “participate” or “not participate” in their response to the email. At 13:30, only the task lights of employees who mentioned “participate” were turned off using the BEMS and turned back on at 15:30 (Figure 1).
(Figure 1: ADR Experiment) QRCT was used to divide employees at Takenaka Corporation’s Tokyo headquarter into the following groups: a control group that did not receive DR requests (66 employees on the fifth floor) and a treatment group that received DR requests (211 employees on the seventh floor). The treatment group was further divided into four groups based on DR participation conditions (Table 2). Both the control group on the fifth floor and treatment groups on the seventh primarily engaged in desk work and operated personal computers and thus, were selected for the experiment. Details for each sub-group are as follows.
(Table 2: Group Outlines) 1. Opt-in performance incentive group (T1) (48 members) The default condition for this group is non-participation in the DR. In response to the DR notification, each employee declared whether he/she would participate. Those who participated had their task light automatically turned off during the DR period and were incentivized as per the degree of their participation. 2. Opt-in fixed incentive group (T2) (51 members) The default condition for this group is non-participation in the DR. In response to the DR notification, each employee declared whether he/she would participate. Those who participated had their task light automatically turned off during the DR period and received a fixed incentive for participation. 3. Opt-out performance incentive group (T3) (58 members) The default condition for this group is DR participation. In response to the DR notification, each employee declared whether he/she would participate. If an employee did not respond to the notification, DR was automatically executed. If employees participated, they were incentivized as per their participation. 4. Opt-out fixed incentive group (T4) (54 members) The default condition for this the group is DR participation. In response to the DR notification, each employee declared whether he/she would participate. If an employee did not respond to the notification, DR was automatically executed and each employee would receive a fixed incentive.

5
As stated, two types of incentives were offered to employees in the treatment groups: performance and fixed incentive. In the case of a performance incentive, employees were given a coffee coupon worth 500 yen (1 cup) each time they participated in a DR. If employees participated on all six days, they received coffee coupons worth 3,000 yen. In the case of a fixed incentive, employees were given coffee coupons worth 1,000 yen (2 cups) irrespective of their participation through the six days. The two types of incentives (reward) and the opt-in and opt-out performance types were combined to design four treatment groups. Because it is necessary to operate ceiling lights in block units, the seventh floor was
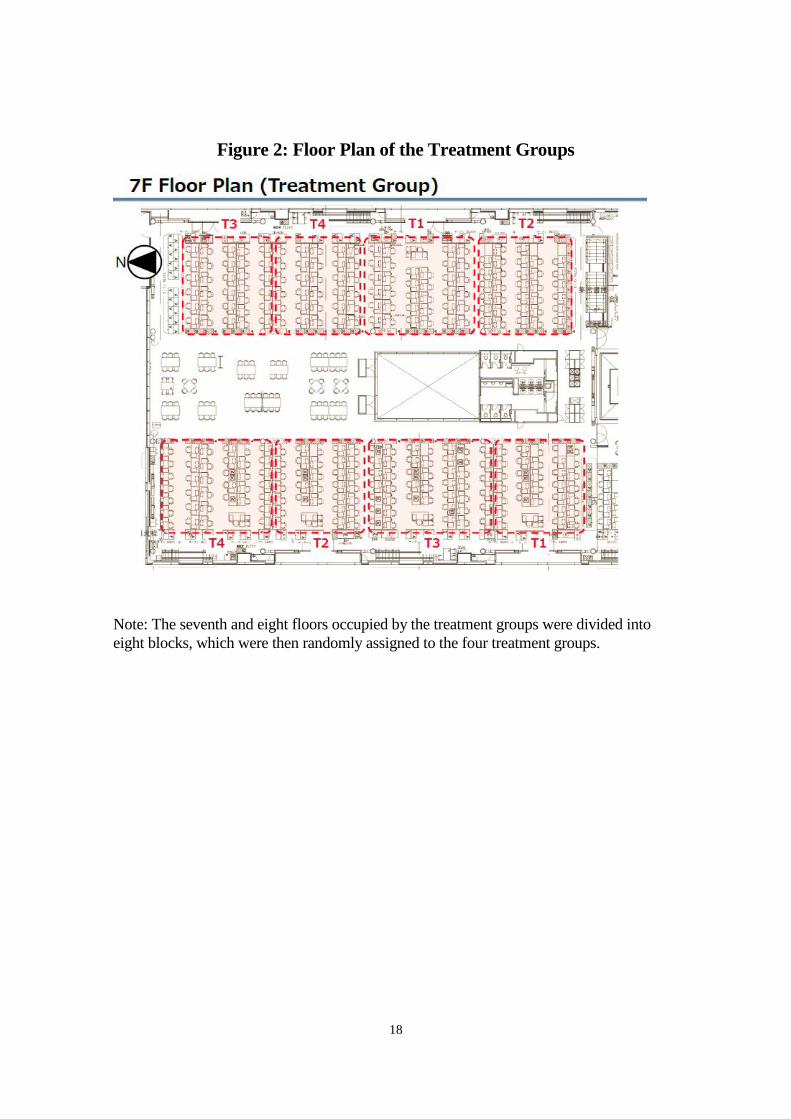
divided into eight blocks and the four treatment groups were randomly distributed among the block units (Figure 2). Therefore, for this experiment, employees were quasi-randomly (“as if” randomly) divided among the block units and not completely randomly distributed. To check the internal validity of the experiment, we use pre-experiment task light consumption data by each group (the bottom row in Table 2). A comparison across the groups indicates statistical balance in electricity use because of quasi random assignment of the groups [ F(3, 4868) = 2.64 , p < 0.05 ].
(Figure 2: Floor Plan for the Treatment Groups) The following two research questions were quantitatively analyzed in terms of
employees’ response to the DR event using the above verification design. First, “Does the DR participation rate of employees in each treatment group vary by DR participation condition?” The remaining question is “Do local and gross average treatment effects in each treatment group vary by DR participation condition?” 2.2 Experiment data The Data were for the quantity of electric power consumed by each employee’s task light during the experiment period (collected at five-minute intervals; unit = W×5 min), and the panel data were for DR participation and non-participation responses on each event day. The DR participation rate of each treatment group was calculated by converting each employee’s DR participation or non-participation into a dummy variable. The electricity-saving effects of each treatment group were estimated using the above data. The quantity of electric power consumed in the morning on each event day before the DR requests were treated as the baseline. Accordingly, we estimated the “difference” between this figure and the quantity of electricity consumed during the DR request period for both the treatment groups and control group, as well the “difference-in-difference” to measure the treatment effects.
3. Main Results 3.1 DR Participation Rate for Each Treatment Group The experiment clarified the differences in participation rates and quantity of electricity

6
consumed for the treatment groups on the basis of DR request participation conditions. Accordingly, we can identify the conditions under which employees will participate in DR. If the participation or non-participation of employees in the DR request is considered as the explained variable and the treatment group to which an employee belongs is the explanatory variable, it is possible to establish a linear probability model. Consequently, the estimation formula for the linear probability model, that is, the employee’s DR participation action model, can be formulated as
𝑌𝑌𝑖𝑖𝑖𝑖 = � 𝛿𝛿𝑔𝑔 ∙𝑔𝑔∈(𝑇𝑇1,𝑇𝑇2,𝑇𝑇3,𝑇𝑇4)
𝐷𝐷𝑖𝑖𝑔𝑔 + 𝜐𝜐𝑖𝑖𝑖𝑖 , (1)
where 𝑌𝑌𝑖𝑖𝑖𝑖 takes the value of one if employee i of a treatment group participates in DR
for t period (here, each DR event day) and 0 if the employee does not participate and 𝐷𝐷𝑖𝑖𝑔𝑔
takes the value of 1 if employee i is in the treatment group 𝑔𝑔, where 𝑔𝑔 ∈ (𝑇𝑇1, 𝑇𝑇2,𝑇𝑇3,𝑇𝑇4). Here, T1 is the opt-in performance incentive group, T2 is the opt-in fixed incentive group, T3 is the opt-out performance incentive group, and T4 is the opt-out fixed incentive group. 𝛿𝛿𝑔𝑔 is the coefficient for each treatment group and 𝜐𝜐𝑖𝑖𝑖𝑖 is the error term.
Then, using the linear probability model, we can estimate the DR participation action model for the employees (Table 3).
(Table 3: Linear Probability Model)
As shown in Table 3, the participation probability is the highest for the opt-out fixed incentive group (T4), followed by the opt-out performance incentive group (T3), opt-in performance incentive group (T1), and opt-in fixed performance incentive group (T2). Note that the difference in participation probability between the opt-out performance (T3) and opt-out fixed (T4) incentive group based on the p-values (T3 = T4) is not statistically significant (Table 3). Figure 3 plots the participation probability for each treatment group.
(Figure 3: DR Participation Rates of Employees in Each Group)
Dividing and comparing the two opt-in groups (T1 and T2) and two opt-out groups
(T3 and T4) in Figure 3 shows that the DR participation rates for the latter are higher. Here, DR participation is the default for “opt-out.” In other words, if DR participation is the default, few employees will choose to not participate. These findings are similar to those obtained using the field experiment for the DR participation rate of ordinary homes on the basis of the differences between opt-in and opt-out.
Next, a comparison of the opt-in groups reveals that the performance incentive group (T1) has a higher DR participation rate than the fixed incentive group (T2). This suggests that even among opt-in groups, a performance incentive motivates employees to save electricity by participating in DR and achieves a higher DR participation rate, whereas a fixed incentive that rewards employees even for non-participation lowers participation rate.

7
A comparison of the opt-out groups, on the other hand, shows that the fixed incentive group (T4) has a higher DR participation rate than the performance incentive group (T3). This result can be interpreted as follows. Unlike in the opt-in group, many employees in the opt-out group chose to participate, albeit not always eagerly. It is believed that if such employees receive a fixed incentive, even though they do not make a particularly vigorous effort to save electricity, they might decide to not opt out. However, as shown in Table 3, the gap in the participation rates between T3 and T4 is small, and thus, not statistically significant. 3.2 Estimation Results for Average Treatment Effects The quantity of electricity consumed by the four treatment groups varies by condition of DR request participation, where the control group is treated as the base. There are two types of treatment effects: total treatment effect of each group (ATE or ITT) and treatment effect of employees who participated in DR for each group (local ATE among the compliers or TOT). We first measure ITT and then TOT to estimate the treatment effect of the quantity of electricity consumed. To estimate ITT, which is the gross treatment effect of each treatment group, a panel data analysis that controls for individual effects and time effects for each employee is conducted. Following is the estimation method:
𝑦𝑦𝑖𝑖𝑖𝑖 = � 𝛽𝛽𝐼𝐼𝑇𝑇𝑇𝑇𝑔𝑔
𝑔𝑔∈(𝑇𝑇1,𝑇𝑇2,𝑇𝑇3,𝑇𝑇4)
∙ 𝐷𝐷𝑖𝑖𝑖𝑖𝑔𝑔 + 𝜃𝜃𝑖𝑖 + 𝜆𝜆𝑖𝑖 + 𝜀𝜀𝑖𝑖𝑖𝑖 , (2)
where 𝑦𝑦𝑖𝑖𝑖𝑖 is the quantity of electricity used by task lights for five minutes in time period
t by employee i; 𝛽𝛽𝐼𝐼𝑇𝑇𝑇𝑇𝑔𝑔 is the overall average treatment effects of treatment group 𝑔𝑔; and
𝐷𝐷𝑖𝑖𝑖𝑖𝑔𝑔 is a treatment index, which takes the value of 1 if a group employee i belongs to any
one of the four treatment groups and a time period that includes the DR request in time period t (in this case, 13:30–15:30 for each DR event day) and 0 in all other cases. T1 is the opt-in performance incentive group, T2 is the opt-in fixed incentive group, T3 is the opt-out performance incentive group, and T4 is the opt-out fixed incentive group. θi is the individual fixed effects of employee i and λt is the fixed effects of time. 𝜀𝜀𝑖𝑖𝑖𝑖 is the error term. The baseline used to estimate the average treatment effects of ITT and TOT is 9:00–11:00 on each DR event day. The estimation of TOT, which is the local average treatment effect, considers the following points. Employees assigned to each treatment group also include those who rejected the DR requests and therefore, the actual acceptance rate of the DR requests creates endogeneity through self-selection. In this case, the ordinary least squares method does not satisfy conformity. To overcome this endogeneity problem, the treatment group to which the employee is assigned is treated as an instrumental variable and a two-stage least squares estimation is performed to calculate the TOT of each treatment group
8
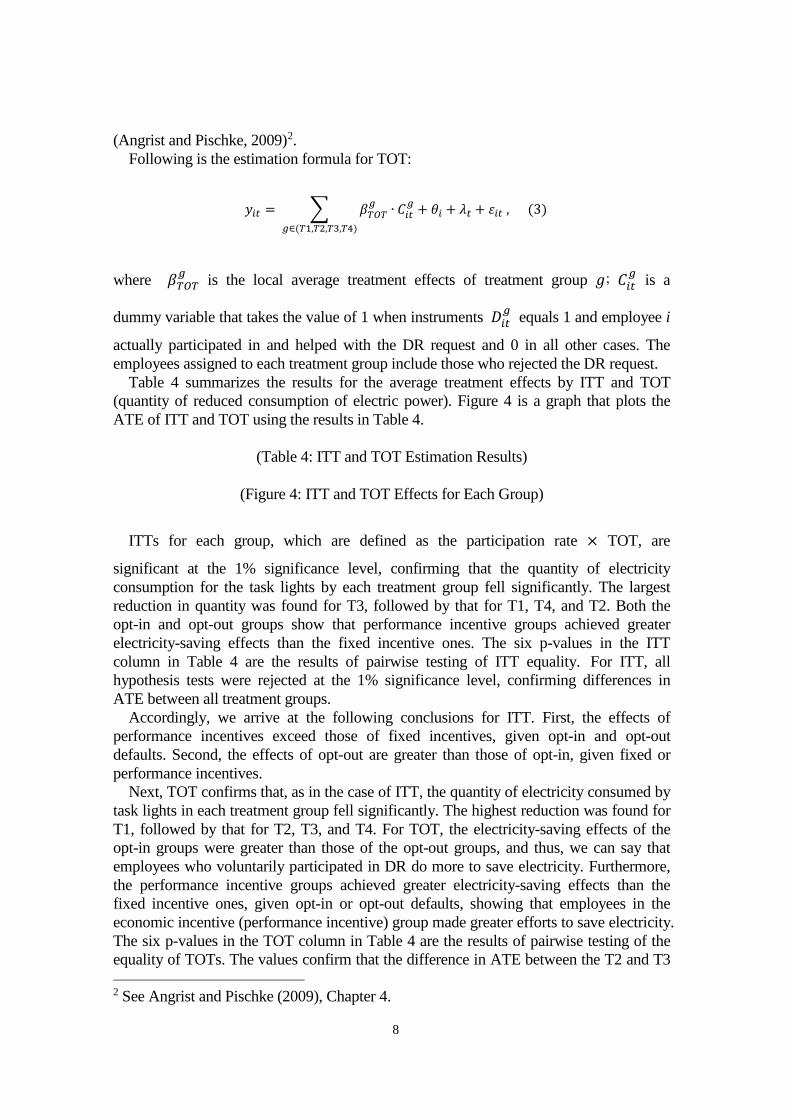
(Angrist and Pischke, 2009)2. Following is the estimation formula for TOT:
𝑦𝑦𝑖𝑖𝑖𝑖 = � 𝛽𝛽𝑇𝑇𝑇𝑇𝑇𝑇𝑔𝑔
𝑔𝑔∈(𝑇𝑇1,𝑇𝑇2,𝑇𝑇3,𝑇𝑇4)
∙ 𝐶𝐶𝑖𝑖𝑖𝑖𝑔𝑔 + 𝜃𝜃𝑖𝑖 + 𝜆𝜆𝑖𝑖 + 𝜀𝜀𝑖𝑖𝑖𝑖 , (3)
where 𝛽𝛽𝑇𝑇𝑇𝑇𝑇𝑇𝑔𝑔 is the local average treatment effects of treatment group 𝑔𝑔; 𝐶𝐶𝑖𝑖𝑖𝑖
𝑔𝑔 is a
dummy variable that takes the value of 1 when instruments 𝐷𝐷𝑖𝑖𝑖𝑖𝑔𝑔 equals 1 and employee i
actually participated in and helped with the DR request and 0 in all other cases. The employees assigned to each treatment group include those who rejected the DR request.
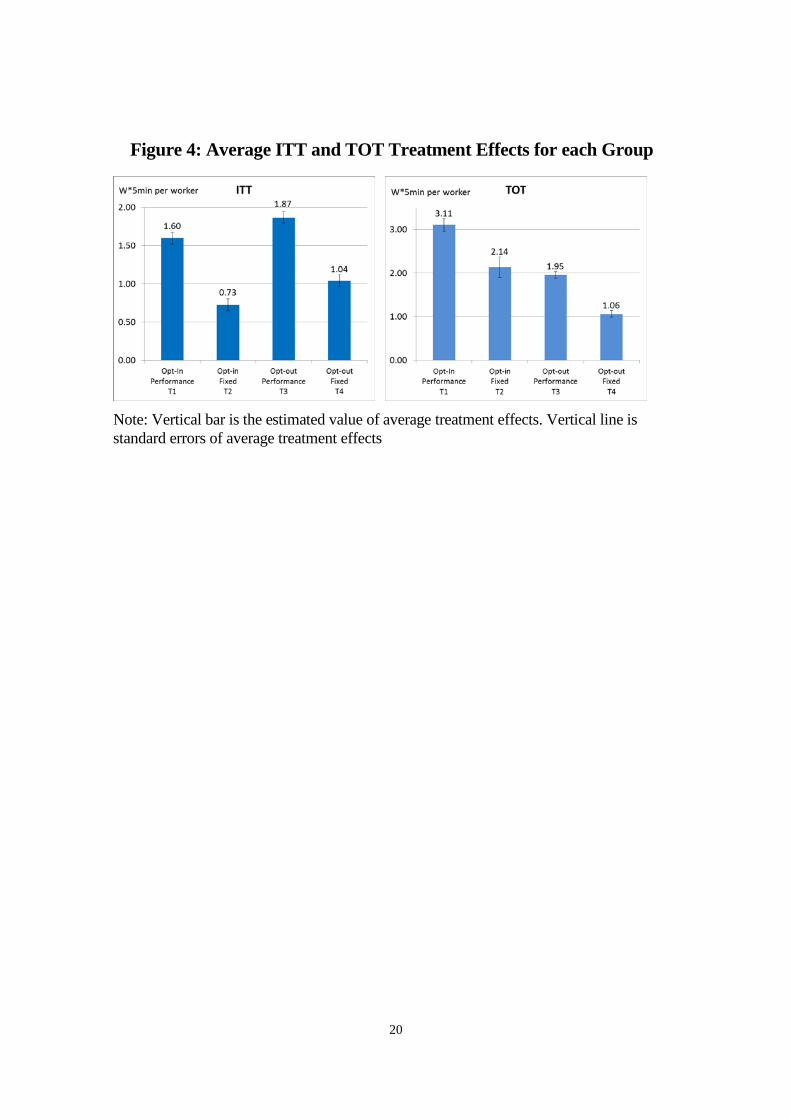
Table 4 summarizes the results for the average treatment effects by ITT and TOT (quantity of reduced consumption of electric power). Figure 4 is a graph that plots the ATE of ITT and TOT using the results in Table 4.
(Table 4: ITT and TOT Estimation Results)
(Figure 4: ITT and TOT Effects for Each Group)
ITTs for each group, which are defined as the participation rate × TOT, are
significant at the 1% significance level, confirming that the quantity of electricity consumption for the task lights by each treatment group fell significantly. The largest reduction in quantity was found for T3, followed by that for T1, T4, and T2. Both the opt-in and opt-out groups show that performance incentive groups achieved greater electricity-saving effects than the fixed incentive ones. The six p-values in the ITT column in Table 4 are the results of pairwise testing of ITT equality. For ITT, all hypothesis tests were rejected at the 1% significance level, confirming differences in ATE between all treatment groups.
Accordingly, we arrive at the following conclusions for ITT. First, the effects of performance incentives exceed those of fixed incentives, given opt-in and opt-out defaults. Second, the effects of opt-out are greater than those of opt-in, given fixed or performance incentives.
Next, TOT confirms that, as in the case of ITT, the quantity of electricity consumed by task lights in each treatment group fell significantly. The highest reduction was found for T1, followed by that for T2, T3, and T4. For TOT, the electricity-saving effects of the opt-in groups were greater than those of the opt-out groups, and thus, we can say that employees who voluntarily participated in DR do more to save electricity. Furthermore, the performance incentive groups achieved greater electricity-saving effects than the fixed incentive ones, given opt-in or opt-out defaults, showing that employees in the economic incentive (performance incentive) group made greater efforts to save electricity. The six p-values in the TOT column in Table 4 are the results of pairwise testing of the equality of TOTs. The values confirm that the difference in ATE between the T2 and T3 2 See Angrist and Pischke (2009), Chapter 4.

9
is not statistically significant, but that between the other treatment groups is. Consequently, the following conclusions about TOT can be made. First, the effects of
opt-in exceed those of opt-out, given fixed or performance incentives. Second, the effects of the performance incentives are larger than those of fixed incentives, given opt-in or opt-out defaults.
4. Discussions and Conclusions
This study presented the design and execution of a DR field experiment performed in an office building equipped with a BEMS, a kind of ADR techniques, using QRCT to divide employees based on DR participation conditions. The experiment quantitatively analyzed the following two research questions concerning trends in employees’ actions in a DR event. The first question was a verification of the difference in DR participation rate due to differences in DR participation conditions. The remaining questions were based on the local treatment effects of employees in each treatment group who participated in the DR (the effect of DR on TOT) and the gross treatment effects of each treatment group (the effect of DR on ITT). Verifying these hypotheses clarifies the factors motivating employees to support DR and the type of environment that should be provided for DR in business facilities.
The DR participation rate of employees in each treatment group was highest for the opt-out fixed incentive group, followed by the opt-out performance, opt-in performance, and opt-in fixed incentive groups. This suggests that, in the opt-out cases, fewer employees declared non-participation. An analysis of DR participation rates for opt-in and opt-out showed that the participation rate is higher in the former for performance incentives, but in the latter, it is higher for fixed incentives. Employees in the opt-out fixed incentive group received a fixed reward even if they did not make an effort to save electricity, and thus, it is possible that they decided it would be better to not opt-out.
Subsequently, we estimated the electricity-saving effects of the four treatment groups (ITT) and only employees in each group who participated in electricity saving (TOT). ITT was statistically significant, confirming the electricity-saving effects of each group. The electricity-saving effect of ITT was largest for the opt-out performance incentive, followed by the opt-in performance, opt-out fixed, and opt-in fixed incentives. This confirms that performance incentives make a larger contribution to saving electricity than fixed incentives. TOT was also statistically significant for each group. In terms of TOT, the electricity saving effect was largest for opt-in performance incentive, followed by opt-in fixed, opt-out performance, and opt-out fixed incentives. This clarifies that employees who voluntarily participated and received incentives based on their efforts made greater efforts to save electricity.
The above evidence supports the following three points. First, the participation rates for opt-out groups are considerably higher than those for opt-in ones. Among the opt-in groups, the participation rate for performance incentive is higher than that for fixed incentive. Second, in the analysis of TOT, the local average treatment effects for the opt-in groups are higher than those for the opt-out ones, and, furthermore, for both opt-in and opt-out, those for performance incentives are higher than those for fixed incentives.

10
Third, the total average treatment effects for the four treatment groups are divided into the upper two groups for performance incentives and the lower two ones for the fixed incentives. For both performance and fixed incentives, the total average treatment effects for opt-out are higher than those for opt-in.
Finally, we conclude this section with two limitations of this study. First is the funding performance incentive. We found that greater electricity-saving effects resulted from performance incentives rather than fixed incentives, and thus, it is presumed that the former is a more effective method to motivate employees towards DR participation. However, to implement this approach, it is essential to first explore the methods of obtaining funds for incentives and set performance incentive values accordingly. For a business to introduce DR, it is necessary to consider DR-based benefits (saving electricity expenses by saving electricity) and costs (costs of introducing and conducting DR). The second limitation is regarding equipment for DR field experiments other than lighting systems. This study used ADR technologies to automatically control lighting equipment, although it is also necessary to examine the design and implementation of field experiments that control (or reduce) the electric power use of air conditioners and electric motors, which consume more electricity than lighting equipment. Future studies on the designing and implementation of DR in business facilities must consider these factors (Piette, 2015).
Acknowledgements
The authors are grateful for the financial support from Core Research for Evolutional Science and Technology (CREST) Program “Creation of Fundamental Theory and Technology to Establish a Cooperative Distributed Energy Management System and Integration of Technologies Across Broad Disciplines Toward Social Application” of Japan Science and Technology Agency (JST). JST CREST Grant Number is JPMJCR15K2.

11
References
[1] Abadie, A. & Gay, S(2006): “The impact of presumed consent legislation on
cadaveric organ donation: A cross-country study,” Journal of Health Economics, 25(4), 599-620.
[2] Angrist, J. D., & Pischke, J.-S.(2009): Mostly Harmless Econometrics: An Empiricist’s Companion. Princeton University Press.
[3] Brown, Z., Johnstone, N., Haščič, I., Vong, L. & Barascud, F.(2013): “Testing the effect of defaults on the thermostat settings of OECD employees,” Energy Economics, 39, 128-134.
[4] Faruqui, A. & Sergici, S.(2010): “Household response to dynamic pricing of electricity: A survey of 15 experiments,” Journal of Regulatory Economics, 38(2), 193-225.
[5] Hartman, R. H., Doane, M. J. & Woo, C.-K. (1991): “Consumer rationality and the status quo,” The Quarterly Journal of Economics, 106(1), 141-162.
[6] Ida, T. & Wang, W.(2015): “A Field Experiment on Dynamic Electricity Pricing in Los Alamos: Opt-in Versus Opt-out,” Kyoto University Discussion Paper, No. E-14-010.
[7] Ito, K., Ida, T. & Tanaka, M. (2017): “Moral Suasion and Economic Incentives: Field Experimental Evidence from Energy Demand,” American Economic Journal: Economic Policy (Forthcoming).
[8] Jain, R.K., Taylor, J.E. & Peschiera, G. (2012): “Assessing eco-feedback interface usage and design to drive energy efficiency in buildings,” Energy and Buildings, 48, 8-17.
[9] Johnson, E. J. & Goldstein, D. (2003): “Do defaults save lives?” Science, 302(5649), 1338-1339.
[10] Krioukov, A., Dawson-Haggerty, S., Lee, L., Rehmane, O. & Culler, D. (2011): “A Living Laboratory Study in Personalized Automated Lighting Controls. 3rd ACM Workshop On Embedded Sensing Systems for Energy-Efficiency in Buildings,” Seattle, WA; http://local.cs.berkeley.edu/main/files/publications/local/a_living_laboratory_study.pdf
[11] Piette, M.A., Ghatikar, G., Kiliccote, S. & Watson, D. (2009): “Design and operation of an open, interoperable automated demand response infrastructure for commercial buildings,” Journal of Computing Science and Information Engineering, 9(2), 021004-1-021004-9.
[12] Piette, M.A., Schetrit, O., Killacotte, S., Cheung, I. & Li, B.Z. (2015): “Costs to Automate Demand Response – Taxonomy and Results from Field Studies and Programs,” Lawrence Berkeley National Laboratory Report, LBNL Report Number 1003924.
[13] Sacramento Municipal Utility District (SMUD) Smart Pricing Options Final Evaluation: The final report on pilot design, implementation, and evaluation of the Sacramento Municipal Utility District’s Consumer Behavior Study (2014); https://smartgrid.gov/sites/default/files/doc/files/SMUD-CBS_Final_Evaluation_Su

12
bmitted_DOE_9_9_2014.pdf [14] Siero, F.W., Bakker, A.B., Dekker, G.B. & Van Den Burg, M.T.C. (1996):
“Changing organizational energy consumption behavior through comparative feedback,” Journal of Environmental Psychology, 16, 235-246.
[15] Spital, A. (1995): “Mandated choice: a plan to increase public commitment to organ donation,” Journal of the American Medical Association, 273(6), 504-506.
[16] Thaler, R. H. & Sunstein, C. R. (2008): Nudge: Improving Decisions About Health, Wealth, and Happiness, Yale University Press.
[17] Wolak, F. A. (2011): “Do residential customers respond to hourly prices? Evidence from a dynamic pricing experiment,” The American Economic Review, 101(3), 83-87.

13
Table 1: Experiment Outline
Field Building Office (Koto-ku, Tokyo)
Area About 1,000 m2 (excluding common space and toilets)
Experiment Period From July 14, 2014 (Mon.) to August 1, 2014 (Fri.) DR Event Day* July 16, 18, 23, 24, 30 and August 1 DR Notice Time 8:30 current day
DR Event Time 13:30-5:30 (2 hours)
* The ADR system does not inform workers of the DR day in advance, but on the morning of DR day.

14
Table 2: Outline of the Groups
Group Control Group
Treatment Group T1 T2 T3 T4
Participation Type - Opt-in Opt-in Opt-out Opt-out
Incentive - Performance Fixed Performance Fixed
No. of Participants 66 48 51 58 54 Note: In the case of a performance incentive, employees were given a coffee coupon worth 500 yen (1 cup) each time they participated in a DR. If employees participated on all six days, they received coffee coupons worth 3,000 yen. In the case of a fixed incentive, employees were given coffee coupons worth 1,000 yen (2 cups) irrespective of their participation through the six days. The two types of incentives (reward) and the opt-in and opt-out types were combined to design four treatment groups.

15
Table 3: Linear Probability Model
Note: The participation rates for the treatment groups by DR participation condition were estimated using a linear probability model. The participation probability of the treatment groups was highest for the opt-out fixed incentive group (T4), followed by opt-out performance (T3), opt-in performance (T1), and opt-in fixed (T2) incentive groups. Note that, according to the p-value (T3 = T4), the difference in participation probability between the opt-out performance (T3) and opt-out fixed (T4) incentive groups is not statistically significant.

16
Table 4: ITT and TOT Estimation Results
Note: The results of estimating the treatment effects for ITT and TOT (quantity of reduction of electric power consumed by task lights) and the statistical significance of the difference between the treatment effects of each group was verified. For both ITT and TOT, the average treatment effects of each group were significant at the 1% level, confirming that the quantity of electric power consumed by task lights of each treatment group significantly reduced. In the ITT case, the quantity of reduction was highest for opt-out performance incentive group (T3), followed by opt-in performance incentive group (T1), opt-out fixed incentive group (T4), and opt-in fixed incentive group (T2). In the TOT case, the highest was for opt-in performance incentive group (T1), followed by opt-in fixed incentive group (T2), opt-out performance incentive group (T3), and opt-out fixed incentive group (T4).

17
Figure 1: ADR Experiment
Notes: [1] During the morning of each DR event day, the ADR system sends a DR request via
e-mail to each employee (treatment groups). [2] Each employee replies indicating whether he/she will participate in the DR. [3] At the DR event time (13:30), the task lights of employees who chose to participate
are automatically turned off and then back on when the event ends (15:30). Because this study is an electricity-saving field experiment for task lights, window
blinds are closed during the period to remove the effects of brightness depending on the weather.
18
Figure 2: Floor Plan of the Treatment Groups
Note: The seventh and eight floors occupied by the treatment groups were divided into eight blocks, which were then randomly assigned to the four treatment groups.

19
Figure 3: DR Participation Rate of Employees in Each Group
Note: Vertical bar is the estimated value of average treatment effects. Vertical line is standard errors of average treatment effects.
20
Figure 4: Average ITT and TOT Treatment Effects for each Group
Note: Vertical bar is the estimated value of average treatment effects. Vertical line is standard errors of average treatment effects
21
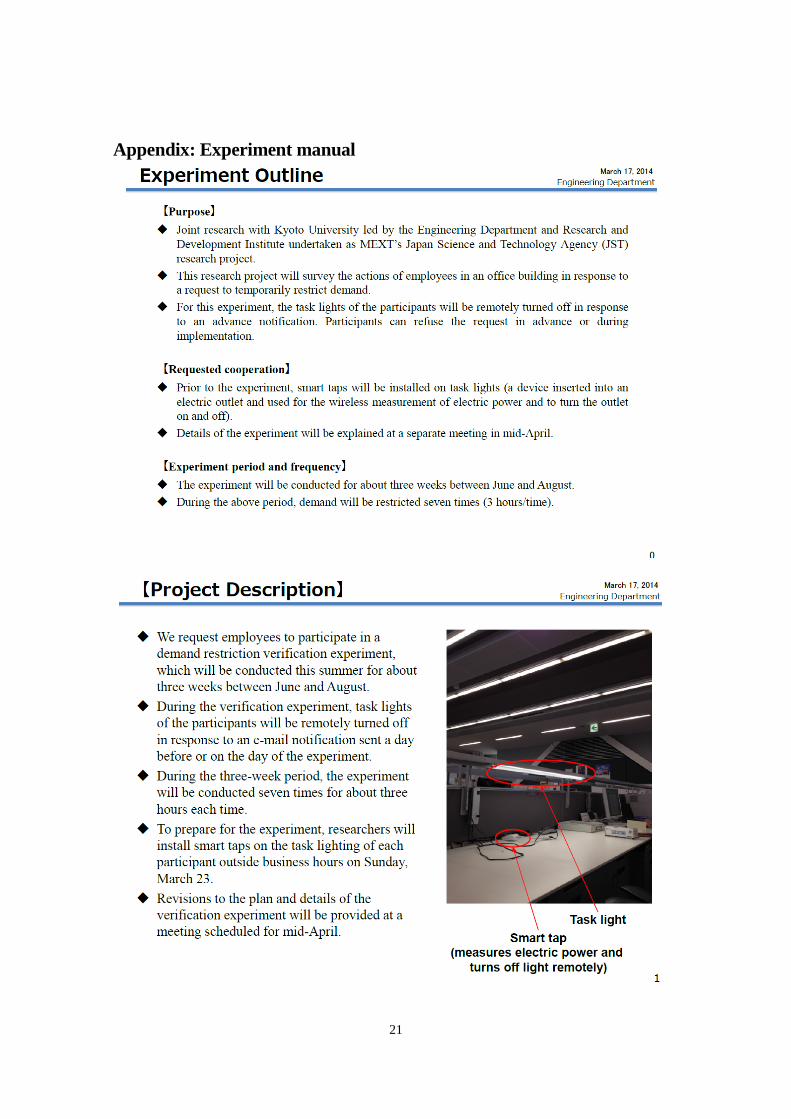
Appendix: Experiment manual
22


![Automated and Personalized Privacy Policy Extraction under ...nsec.sjtu.edu.cn/publications/2019/Automated and... · pose [12,14,21]. To secure users’ privacy, one of the critical](https://img.pdfslide.net/doc/110x75/5f38d43e44611620d30651be/automated-and-personalized-privacy-policy-extraction-under-nsecsjtueducnpublications2019automated.jpg)


![Advances in Behavioral Science Using Automated Facial ...jeffcohn/biblio/CohnAFAS.pdf · IEEE SIGNAL PROCESSING MAGAZINE [129] NOVEMBER 2010 (referred to as coding in behavioral sci-ence),](https://img.pdfslide.net/doc/110x75/5b3dd88b7f8b9a0e628e8413/advances-in-behavioral-science-using-automated-facial-jeffcohnbiblio-.jpg)