Embed Size (px)
Citation preview
Benthic Macro-invertebrate Sampling and Analysis of Lake Simcoe
Final Report
Project No. 160940032 March 2006
Prepared for: Lake Simcoe Region Conservation Authority
Prepared by:
Stantec Consulting Ltd. 1505 Laperriere Avenue Ottawa, Ontario K1Z 7T1

BENTHIC MACRO-INVERTEBRATE SAMPLING AND ANALYSIS OF LAKE SIMCOE
Executive Summary This report describes a whole-lake study of benthic macroinvertebrates of Lake Simcoe, conducted in October of 2005. The study was conducted as a component of the Assimilative Capacity Study of the lake, and provides a baseline of information for future monitoring efforts. The sampling program was designed to characterize benthos throughout the lake, with sampling stratified across water depths and areas differing in water quality. Relationships between indices of benthic community composition were explored in an attempt to understand how local water quality influences the benthic community, and how lake-wide management of nutrient concentrations may lead to improvements in habitat quality for benthos.
The benthic community of Lake Simcoe demonstrated several attributes indicative of good habitat quality. First, this 2005 survey of the benthic community produced 138 distinct taxa including representative species of relatively sensitive groups including beetles (water pennies like Ectopria and Psephenus) mayflies (e.g., Ephemerella, Hexagenia, Caenis) and caddisflies (e.g., Helicopsyche borealis) in the nearshore environment. The deeper profundal benthos was additionally relatively diverse with representative fingernail clams (Pisidium sp.), some snails, chironomids, amphipods and oligochaete worms. The presence of sphaeriid clams, amphipods and infrequent zebra mussels in the profundal environment clearly suggested that water quality has recently been in relatively good condition in the hypolimnion of the lake.
Some of the physical and chemical data collected as part of this survey indicated a relatively challenging environment for benthic invertebrates. For example, total organic carbon content of the sediments exceeded severe effect levels (10%) in the profundal (49 to 62% TOC), littoral (4 to 65% TOC), and shoreline areas (1 to 30% TOC). Total Kjeldahl Nitrogen and Phosphorus concentrations in sediments also frequently exceeded low effect levels in littoral and profundal zones. Water column concentrations of phosphorus generally exceeded 0.020 mg/L, generally indicating eutrophic lake conditions.
Though benthic communities were in good condition in 2005, comparison to the historical data demonstrated significant changes from 1926. Amphipods were clearly more abundant in the shoreline samples in 2005 (~ 63%) than in 1926 (~ 7%), while the relative abundance of chironomid larvae was generally lower at all three depths in 2005 than in 1926. Chironomid larvae were almost absent from one station (3) in 2005, which is very unusual. The percentage of the fauna as fingernail clams (Sphaeriidae) was lower in the littoral (9% in 1926 and 1% in 2005), but higher in the profundal (6% in 1926 and 16% in 2005). The change in the littoral zone may be attributable to the presence of zebra mussels which accounted for about 32% of the fauna in the littoral samples. Chaoborid larvae were absent in 2005, but present in the 1926 survey.
Water depth was the single largest influence on benthic community composition of the lake, as expected. The second most important variable was sediment total organic carbon content. Higher TOC tended to coincide with lower relative abundances of mayflies and caddisflies in the littoral environment, implying a negative association with the benthos.
One of the more interesting findings of this study was the occurrence of the introduced amphipod Echinogammarus ischnus. This species was found at the majority of the shoreline
hh c:\bk\h projects\active\1609 40032 lake simcoe\report\final report\160940032 final report.doc 1.2
Benthic Macro-invertebrate Sampling and Analysis of Lake Simcoe Table of Contents March 2006
stations with the exception of stations in Cook’s Bay, Sibbald Point Provincial Park and at the far end of Kempenfelt Bay. Most of the stations lacking Echinogammarus are located at the south end of Lake Simcoe. Where these organisms were found they were also generally in large numbers. This spatial distribution and abundance was indicative of a newly introduced species. It is very likely that this is the first reported occurrence of Echinogammarus in an inland lake in Ontario.
This 2005 survey of the benthos of Lake Simcoe provides a useful inventory of existing conditions, and presents a baseline against which to judge future changes in habitat quality. The sampling scheme presented here involving shoreline, littoral and profundal sampling addresses potential impacts in three fundamental zones in the lake. The shoreline sweeps address potential on-shore impacts resulting from local activities such as septic beds, marinas and other point- and non-point discharges. An inventory of the discharges to the lake should be overlaid with the benthic sampling locations to identify gaps in the design and opportunities for additional future monitoring.
The littoral samples were collected at a depth that was just above the typical thermocline, and represented a zone of high abundance and thus high biological activity for this lake. There was no obvious concordance between samples collected in the littoral and samples collected near shore, indicating that the littoral samples provide unique information about habitat quality. Sampling should be continued within the littoral sampling zone.
Samples from the profundal zone provide information on overall lake water quality. Profundal samples, being below the thermocline, represent worst-case conditions. Continued sampling of profundal sampling locations is recommended.
Precision estimates indicated that less sampling could be done at each station, while still providing a reasonable amount of precision for estimating indices of composition.
Stations were situated throughout the lake to characterize benthic communities in each of the three major basins, and across the gradient of nutrient concentrations that exists in the lake. One expectation was that water-borne nutrient concentrations would relate to indices of benthic community composition, and that relationships between nutrient concentrations and benthic metrics could be used to identify critical nutrient concentrations corresponding with healthy or impaired benthic communities. The data from this 2005 survey clearly did not demonstrate relationships between benthos and water-borne nutrient concentrations. These 2005 data, however, provide a baseline against which future inventories of the lake can be compared. Lake-wide changes in benthic community composition over time can provide a biologically relevant measure of habitat quality. Concurrent measurements of surface water quality, sediment quality and benthic invertebrates over time will thus provide the Lake Simcoe Region Conservation Authority, and other agencies, the data required to know whether lake-wide nutrient management has biological implication.
hh c:\bk\h projects\active\1609 40032 lake simcoe\report\final report\160940032 final report.doc 1.3

BENTHIC MACRO-INVERTEBRATE SAMPLING AND ANALYSIS OF LAKE SIMCOE
Table of Contents
1.0 INTRODUCTION ................................................................................................................1.1 1.1 STUDY AREA.....................................................................................................................1.1 1.2 OBJECTIVE........................................................................................................................1.2 1.3 BACKGROUND INFORMATION ........................................................................................1.2
2.0 METHODOLOGY ...............................................................................................................2.1 2.1 SAMPLE LOCATION..........................................................................................................2.1 2.2 WATER QUALITY...............................................................................................................2.1 2.3 SUBSTRATE CHARACTERISTICS AND SEDIMENT QUALITY.......................................2.1 2.4 BENTHIC INVERTEBRATE SAMPLING ............................................................................2.2
2.4.1 Sample Collection ................................................................................................2.2 2.4.2 Invertebrate Sorting and Identification, and QA/QC.............................................2.2 2.4.3 Benthic Community Summaries...........................................................................2.4 2.4.4 Environmental Gradients in Lake Simcoe............................................................2.5 2.4.5 Sample Sizes .......................................................................................................2.6 2.4.6 Benthos Environment Associations .....................................................................2.7
3.0 RESULTS ...........................................................................................................................3.1 3.1 WATER CHEMISTRY.........................................................................................................3.1
3.1.1 In situ Parameters................................................................................................3.1 3.1.2 Laboratory Analyses ............................................................................................3.1
3.2 SUBSTRATE CHARACTERISTICS AND SEDIMENT QUALITY.......................................3.1 3.2.1 Grain Size ............................................................................................................3.1 3.2.2 Sediment Chemistry.............................................................................................3.1
3.3 ENVIRONMENTAL GRADIENTS.......................................................................................3.2 3.4 BENTHIC INVERTEBRATE COMMUNITY ........................................................................3.2
3.4.1 General Description .............................................................................................3.2 3.4.2 Shoreline Benthos................................................................................................3.3 3.4.3 Littoral Benthos ....................................................................................................3.4 3.4.4 Profundal Benthos ...............................................................................................3.4
3.5 BENTHOS-ENVIRONMENT ASSOCIATIONS...................................................................3.4 3.6 WITHIN-SITE VARIABILITY ...............................................................................................3.5 3.7 HISTORICAL CHANGES IN COMPOSITION ....................................................................3.5
3.7.1 Shoreline Zone.....................................................................................................3.5 3.7.2 Littoral Zone.........................................................................................................3.6 3.7.3 Profundal Zone ....................................................................................................3.6
4.0 DISCUSSION......................................................................................................................4.1
5.0 RECOMMENDATIONS FOR FUTURE SAMPLING ..........................................................5.1
6.0 CLOSURE ..........................................................................................................................6.2
7.0 REFERENCES ...................................................................................................................7.1
hh c:\bk\h projects\active\1609 40032 lake simcoe\report\final report\160940032 final report.doc 1.1

Benthic Macro-invertebrate Sampling and Analysis of Lake Simcoe Table of Contents March 2006
List of Appendices
Appendix A Figures
Appendix B Tables
Appendix C Benthic Invertebrate Community
Appendix D Shoreline Photo Log
Appendix E Laboratory Reports
List of Figures
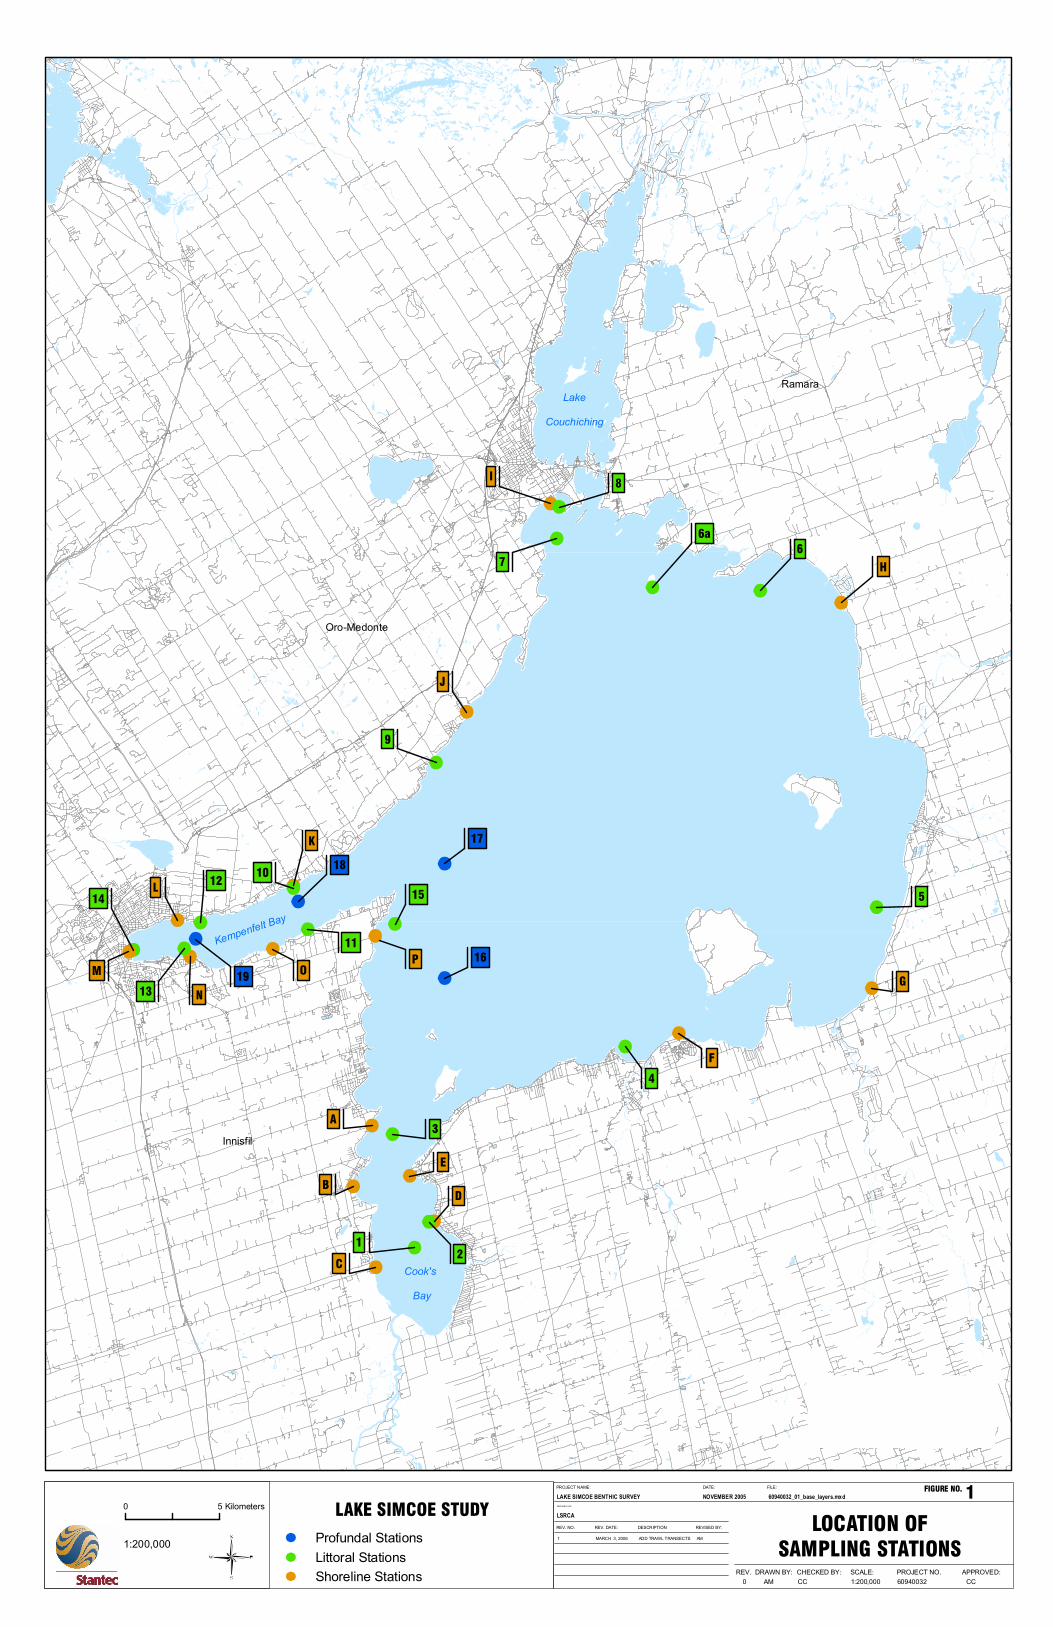
Figure 1 Location of Sampling Stations Figure 2. Scatterplots of Correspondence Analysis (CA) axis scores. Samples close
together in (a) have similar benthic communities. In (b) taxa close together tended to be found at the same sites.
Figure 3 Scatterplots of Significant Relationships Derived Through Correspondence Analysis (CA) (a) Relationship Between Sediment TP and Benthic Invertebrate Abundance (b) Relationship Between Ordination Axis 2 and TOC (c) Relationship Between Sediment TP and %ET.
List of Tables
Table 1 Station location and sampling method Lake Simcoe benthic invertebrate survey; October 2005.
Table 2 Sampling details for shoreline stations Lake Simcoe benthic invertebrate survey; October 2005.
Table 3 In situ water chemistry data for shoreline stations Lake Simcoe benthic invertebrate survey; October 2005.
Table 4 In situ water chemistry data for littoral and profundal stations Lake Simcoe benthic invertebrate survey; October 2005.
Table 5 Results of laboratory analysis of water samples collected during Lake Simcoe benthic invertebrate survey; October 2005
hh c:\bk\h projects\active\1609 40032 lake simcoe\report\final report\160940032 final report.doc 1.2

Benthic Macro-invertebrate Sampling and Analysis of Lake Simcoe Table of Contents March 2006
Table 6 Substrate characteristics and grain size for all benthic sampling stations Lake Simcoe, October 2005
Table 7 Results of laboratory analysis of sediment nutrient samples Lake Simcoe benthic invertebrate survey; October 2005
Table 8 Principal components analysis of physical data and nutrient concentrations Lake Simcoe benthic invertebrate survey; October 2005.
Table 9 Relative abundance of benthic invertebrate taxa and indices for shoreline stations, Lake Simcoe benthic invertebrate survey; October 2005
Table 10 Relative abundance of benthic invertebrate taxa and indices for littoral stations, Lake Simcoe benthic invertebrate survey; October 2005
Table 11 Relative abundance of benthic invertebrate taxa and indices for profundal stations, Lake Simcoe benthic invertebrate survey; October 2005
Table 12 Correlations among community descriptors and selected environmental variables Lake Simcoe benthic invertebrate survey; October 2005
Table 13 Within station variability Lake Simcoe benthic invertebrate survey; October 2005. Table 14 Relative abundance of benthic invertebrate taxa in Lake Simcoe collected in
1926 and 2005.
hh c:\bk\h projects\active\1609 40032 lake simcoe\report\final report\160940032 final report.doc 1.3

BENTHIC MACRO-INVERTEBRATE SAMPLING AND ANALYSIS OF LAKE SIMCOE
1.0 Introduction
1.1 STUDY AREA
Lake Simcoe is the largest lake in southern Ontario, with the exception of the Great Lakes. It is a dimictic, hardwater lake connected to the Trent-Severn Waterway, which drains into Georgian Bay. The fish community is diverse with some 55 species including lake trout (Salvelinus namaycush), lake whitefish (Coregonus clupeaformis) and lake herring (Coregonus artedii). These coldwater fishes, along with northern pike (Esox lucius), yellow perch (Perca flavescens) and smallmouth bass (Micropterus dolomieu) are of major social and economical importance for the area.
The Lake Simcoe watershed has been influenced by human activities for over 200 years (Evans et al., 1996). Forty-three percent of the 3572 km2 of terrestrial area in the basin is agricultural (Eimers et al. 2005). This land use is concentrated along the Holland River and includes a large area of cultivated marsh that empties into Cook’s Bay at the south end of Lake Simcoe. While only 5% of the catchment area is urban, the population has doubled in the past two decades and projections suggest further growth (Eimers et al, 2005).
Johnson and Nicholls (1989) estimated pre-European-settlement phosphorus (P) loads to Lake Simcoe at approximately 30 tonnes/year while current rates have more than tripled due to anthropogenic activities including agriculture and population growth, to approximately 102 tonnes/year (LSRCA, 2005). These elevated P inputs and subsequent eutrophication of the lake has been attributed as the major cause of the decline in lake trout, lake whitefish and lake herring during the mid to latter part of the last century (Evans et al, 1996). Lake trout and lake whitefish are now supplemented by stocking of hatchery-reared fish and lake herring is at an all time low (LSEMS, 2003).
As a response to the loss of the coldwater fishery, Lake Simcoe Environmental Management Strategy (LSEMS) studies were initiated in 1981. The LSMES is a joint effort led by the Lake Simcoe Region Conservation Authority (LSRCA) and includes provincial government agencies, municipal governments and First Nations communities. Studies, including water quality monitoring conducted by the Ontario Ministry of the Environment (MOE) concluded that increased urban growth and poor agricultural practices were causing eutrophication in Lake Simcoe, leading to reduced oxygen levels and low recruitment of coldwater fish species. The main goal of the LSEMS program is to restore a natural, self-sustaining coldwater fishery by improving water quality (LSEMS, 2003)
Despite a large increase in human population in the watershed since the 1980s, water quality parameters including TP improved throughout most of the lake in the period between 2000 and 2003 compared to the period between 1980 and 1983 (Eimers et al, 2005). There, however, remain concerns that continued rapid urbanization will increase nutrient loads to Lake Simcoe. Thus, Phase III of the LSEMS Implementation Program involves completing an Assimilative Capacity Study of Lake Simcoe to help determine the capability of the lake to resist the effects of landscape disturbance without impairment to water quality. Through this effort a total maximum daily load (TMDL) for phosphorus and other parameters may be developed.
hh c:\bk\h projects\active\1609 40032 lake simcoe\report\final report\160940032 final report.doc 1.1

Benthic Macro-invertebrate Sampling and Analysis of Lake Simcoe Introduction March 2006
1.2 OBJECTIVE
This report describes a whole-lake study of benthic macroinvertebrates conducted in October of 2005. The study was conducted as a component of the Assimilative Capacity Study (ACS) of Lake Simcoe, and provides a baseline of information for future monitoring efforts. The sampling program was designed to characterize benthos throughout the lake, with sampling stratified across water depths and areas differing in water quality. Relationships between indices of benthic community composition and water quality (i.e., nutrient concentrations) were explored in an attempt to understand how local water quality influences the benthic community, and how lake-wide management of nutrient concentrations may lead to improvements in habitat quality for benthos. Changes over time (i.e., year to year) may also correlate with year to year variations in water quality and thus lead to an improved understanding of the linkage between these two sets of indicators.
1.3 BACKGROUND INFORMATION
There have been few comprehensive studies of benthic macro-invertebrates of Lake Simcoe. Rawson (1930) provided the first detailed description of the ecology of Lake Simcoe, based on inventories of fish and benthos carried out between 1926 and 1928. Surveys of benthos occurred over the period of May to October 1926, and including collections from a variety of depths and substrates, as per this present 2005 study. The Ontario Ministry of the Environment (MOE, 1975) completed a benthic survey on Lake Simcoe in 1975. Similar to the Rawson study sampling was conducted throughout the summer. The Lake Simcoe Fisheries Assessment Unit (LSFAU) conducted a less comprehensive benthic community study in August 1983 (OMNR, 1991), with samples collected along five transects in the main basin of Lake Simcoe at depths of 10, 15, 20, 25 and 30 m. The LSRCA has also collected benthic invertebrate samples from the main tributaries flowing into Lake Simcoe as part of the LSEMS program. Kilgour et al. (1999) reported on inventories of nearby Lake Couchiching by the Ontario Ministry of the Environment.
hh c:\bk\h projects\active\1609 40032 lake simcoe\report\final report\160940032 final report.doc 1.2
BENTHIC MACRO-INVERTEBRATE SAMPLING AND ANALYSIS OF LAKE SIMCOE
2.0 Methodology
2.1 SAMPLE LOCATION
The distribution of sample locations in Lake Simcoe is illustrated in Figure 1. Sampling locations were stratified by depth and included shoreline, littoral (shallower than the average depth to the thermocline) and profundal habitats. Some littoral stations were situated in relative close proximity to the MOE water quality monitoring locations to ensure some coordination with the assimilative capacity study. Shoreline sampling locations were chosen to provide relatively even coverage of the whole shoreline, but also on the basis that they were accessible by road. Access by boat was considered infeasible because high winds and shallow water would have made shoreline areas hazardous for the boat.
Samples were also stratified by basin, with sampling concentrated in Cook’s Bay and Kempenfelt Bay because these are the major sources of nutrient loads. The objective of the sampling design was to sample benthos across a gradient of nutrient concentrations within the lake. Sampling was comprised of 16 stations for shoreline sweeps, 16 mid-depth littoral stations, and 4 profundal stations as per Figure 1. Station identifications and locations are summarized in Table 1.
2.2 WATER QUALITY
Standard water quality measurements including water temperature, dissolved oxygen, conductivity and pH were recorded at each of the sampling stations using a Hydro-Lab multi-probe water quality meter. Readings were taken from 1-m below the water surface for all stations and measurements were also recorded 1 m from the bottom (to a maximum of 24 m the total length of the Hydro-Lab cord) for the littoral and profundal stations. At the profundal stations that were > 24-m deep an YSI with a longer cord was used to measure water temperature at 1m intervals to determine depth of the hypolimnion.
For nutrient analysis, water samples were also collected at all stations. A Van Dorn sampler was used to grab samples from 0.5 m off bottom. Samples were kept cold and shipped to Maxxam Analytical Laboratory and analysed for total phosphorus (TP), total Kjeldhal nitrogen (TKN), nitrite (NO2) and nitrate (NO3).
2.3 SUBSTRATE CHARACTERISTICS AND SEDIMENT QUALITY
A sediment sample was collected from each of the stations where fine sediments could be found, to describe sediment type and chemistry. At the littoral and profundal stations sediment was collected using a petite Ponar dredge and a shovel was used at the littoral stations. Sediments samples were placed in wide-mouth glass jars and kept cold until shipment to Maxxam Analytical Laboratory for analysis of particle size, total organic carbon (TOC), nitrogen and phosphorus.
hh c:\bk\h projects\active\1609 40032 lake simcoe\report\final report\160940032 final report.doc 2.1
Benthic Macro-invertebrate Sampling and Analysis of Lake Simcoe Methodology March 2006
2.4 BENTHIC INVERTEBRATE SAMPLING
2.4.1 Sample Collection
Benthic invertebrate sampling occurred between October 24 and 28, 2005. Samples were taken from three different depth regimes, shoreline (0 and 1 m), littoral (4 to 9 m) and profundal (>24 m). Triplicate benthic community samples were collected at each of the 36 stations (16 shoreline, 16 littoral and 4 profundal) to provide a measure of statistical variability.
The shoreline samples were collected with a 500-μm mesh D-net using the kick and sweep methodology following MOE’s most recent Ontario benthic biomonitoring network (OBBN) protocols (Jones et al., 2005). Sampling was conducted along transects from shore to the 1 m depth. The length of transects, and the time required to travel a transect were recorded (Table 2). A photo log of most of the shoreline stations is presented in Appendix D.
Both the littoral and profundal stations were sampled using a petite Ponar dredge (0.023m2). Samples were sieved in the field using a 500-μm mesh sieve box.
Each washed sample containing invertebrates was transferred to a 1.5-L wide-mouth plastic jar and preserved in 10% buffered formalin. Sample jars were labelled both externally (permanent marker) and internally (waterproof paper) with the following information: project number, station number, date, replicate number and number of jars in the sample. General visual observations on substrate and aquatic habitat characteristics were also recorded.
All benthic samples were submitted to an independent benthic invertebrate taxonomist for preparation and identification (Mr. William Morton of Guelph, Ontario).
2.4.2 Invertebrate Sorting and Identification, and QA/QC
2.4.2.1 Sample sorting and sub-sampling
Each sample from the littoral and profundal stations was placed into a geological sieve with a 425-μm mesh to remove the field preservative. This preservative was set aside and used to re-preserve the sediments once sorting was completed. The samples were then rinsed with tap water to remove any excess preservative. The material retained on the sieve was washed into a clean 2-L container for processing. The sediments were then washed through a stacked series of sieves consisting of 4-mm mesh over a 1-mm mesh over a 500-μm mesh. This helped separate the fine particles from the coarse and facilitated sorting. Sediments from each sieve were then washed into smaller containers for further processing. The Sorting process required the rinsing of small amounts of the debris into gridded Petri-dishes and searching through the sediments and removing any invertebrates with the assistance of a dissecting microscope at 6-10 x power. Once sorted, the sediments were collected into a 2-L container. This step was repeated until all the sediments were searched. After completion the sorted sediments were placed into the original sample container and re-preserved with the field preservative. All containers, dishes and sieves were completely scrubbed after each sample was processed to help prevent specimen contamination between samples.
hh c:\bk\h projects\active\1609 40032 lake simcoe\report\final report\160940032 final report.doc 2.2

Benthic Macro-invertebrate Sampling and Analysis of Lake Simcoe Methodology March 2006
An effort was made to sort 100% of the sediments for each of the littoral and profundal samples. Unfortunately some of the samples had very high volumes of organic matter and some sub-sampling was required. For these large samples the sediment was evenly distributed on the 500-μm mesh sieve then divided in half. Half was removed and saved while the other half was either processed or sub-sampled further. A sub-sample was then processed as usual. All invertebrate were picked from each sub-sample once started. An effort was made to sort a minimum of 25% of a sample and pick out at least 100 specimens, in a 3-4 hr time span, whenever possible.
Many of the samples had high abundances of amphipods and zebra mussels. Representative specimens of these two taxa were picked, 50 for amphipods and 30 zebras, and saved, for reference, while the remaining specimens were only counted. This saved a considerable amount of time and allowed more of the sample sediments to be sorted without adversely affecting the results. All other taxa were removed from the sample debris and preserved, as encountered.
We initially intended to identify only the first 100 animals from each of the three replicate shoreline sweep samples, as per the OBBN methodology. Being dominated by zebra mussels and/or amphipods, we anticipated that a 100-animal count from samples would under-represent diversity of the benthic assemblage. We, therefore, chose to sort and identify a larger volume-based fraction of the samples to ensure that the full taxonomic diversity was observed. An attempt was made to process a volume of material that would provide at least 100 organisms other than the dominant two taxa.
2.4.2.2 Identification
Invertebrates were sorted into like groups and identified to the lowest practical level, species if possible. Oligochaeta (worms), and representatives chironomids were slide mounted in CMC-10 (Masters Co., IL) prior to allow identification. Once identified the specimens were placed into labeled shell vials with neoprene stoppers and re-preserved in 75% ethanol. Dr. Gerry Mackie, University of Guelph, verified Gastropoda (snails) specimens and identified all the Sphaeriidae (fingernail clams) for this project. A reference collection containing representatives of all taxa was also made. A list of the taxonomic keys and references used for invertebrate identification is in Appendix C. Data were tabulated in an Excel spreadsheet to facilitate data analysis, interpretation and presentation. All identified specimens as well as sorted and unsorted sediments were also submitted to LSRCA (c/o Rob Baldwin) for long-term storage.
2.4.2.3 QA/QC
The three samples from littoral station 13 were accidentally not preserved in the field. They were found in an advanced stage of decomposition and not processed. This meant that only 105 samples were processed for this study.
The error associated with sample sorting has been assessed and is part of the QA/QC process for the invertebrate community survey. Percent recovery, or sorting efficiency, was determined for 10 (9.5%) of the 105 samples collected. Re-examining the sample debris following initial sorting of organisms did this. Any additional organisms found were identified, counted, and
hh c:\bk\h projects\active\1609 40032 lake simcoe\report\final report\160940032 final report.doc 2.3
Benthic Macro-invertebrate Sampling and Analysis of Lake Simcoe Methodology March 2006
added to the dataset. If pieces of organisms were found, only heads were counted as representing one organism. Percent recovery was calculated using the original number of organisms found and the revised total (following re-sorting).
2.4.3 Benthic Community Summaries
Benthic community structure is often dependent on water and sediment quality. Because each sample may contain hundreds of individuals and numerous different taxa, biotic indices that incorporate various community attributes have been developed to compare data between sites. The indices that were used to interpret the benthic invertebrate data from this survey are listed and described below:
Total number of taxa (richness)
Total Abundance (total number of individuals per sample, or per 0.023 m2)
%ET
Abundances and proportion of major groups (e.g., Chironomidae, Plecoptera)
Simpson’s D Diversity
All of the above indices were calculated for each station.
Organism abundance and taxa richness are used as general indicators of habitat quality. Extremely low invertebrate densities may indicate poor habitat quality, whereas excessively high densities may indicate nutrient enrichment. Abundances from grab samples in the littoral and profundal stations are expressed on a per unit area basis. Abundances from shoreline sweeps are expressed on a per sample (number per minute sweep) basis. Taxa richness is a measure of community diversity, with “healthier” communities typically having more taxa.
Percent ET for each replicate was calculated as the number of organisms within the orders Ephemeroptera and Trichoptera, divided by the total number of organisms in a sample. Members of the orders Ephemeroptera and Trichoptera are among the most sensitive to anthropogenic environmental stressors. As an aquatic environment becomes impacted, the number of Ephemeroptera and Trichoptera taxa tends to decrease.
The relative abundance (%) of major groups of invertebrates was also compared between stations, to evaluate differences in the overall structure of each of the benthic communities. Because some groups are more tolerant than others to disturbance and nutrient enrichment, dominance by a single species or group can be indicative of a stressed community. For example, chironomids and oligochaetes tend to be very tolerant of nutrient enrichment or polluted conditions. At highly contaminated sites, these two taxa are often the only remaining invertebrates (Pinder, 1986). Conversely, the presence of sensitive taxa was also considered.
Simpson’s Diversity (D) is measure of diversity. It is the probability that two organisms, selected at random, are from a different group or species (range: 0 to 1, with larger values indicative of
hh c:\bk\h projects\active\1609 40032 lake simcoe\report\final report\160940032 final report.doc 2.4
Benthic Macro-invertebrate Sampling and Analysis of Lake Simcoe Methodology March 2006
more diverse communities). Simpson’s D is influenced by the numerically dominant taxa. The formula for D is given in Environment Canada (2002):
∑=
−=s
iipD
1
2)(1 [1]
where s is the number of taxa and pi is the proportional abundance of each taxon.
In addition to the indices (above), we also used correspondence analysis (CA) to summarize variations in benthic community composition. Correspondence analysis is a common method used in ecology. It is also more convenient than most other ordination methods because it automatically ordinates both the samples and the taxa. The CA ordination procedure is designed to calculate a set of theoretical (synthetic) variables (axes) along which taxa and samples are scored, and thus “ordering” according to similarities in composition (samples) or co-occurrence (taxa). Calculation of sample and taxa scores on the first ordination axis is done by iteratively estimating the weighted average sample scores and the weighted average taxa scores. For the first iteration, axis scores are arbitrarily assigned to each taxon. For each sample, the procedure determines the weighted average axis score, which is the average of the taxa scores weighted by the abundances of each taxon. The next iteration produces new weighted average axis scores for the taxa, calculated from the sample scores. The iterative procedure continues until there is little change in the sample and taxa scores. Estimation of second and third ordination axes follows a similar routine, except that the sample scores of additional axes are made orthogonal (uncorrelated) with the first and other axes. Sample scores in CA are usually scaled to have a mean of zero and standard deviation of 1 (ter Braak, 1992). The distribution of samples in a CA diagram indicates the relative similarities and differences in composition based on taxa abundances. Samples with similar scores will have taxa in similar proportions, while samples with different scores will have taxa in different proportions. The scatter diagram for taxa portrays the dispersion of taxa along the theoretical variables (axes). Thus, a sample with an axis-1 score of 2 would be dominated by those taxa that also had axis-1 scores close to 2. With CA, the configuration of ordination diagrams tends to be sensitive to rare taxa (Gauch, 1982). Therefore, only those taxa found in 10 or more samples were retained for the analysis. Taxa abundances were log-transformed prior to analysis. The CA was conducted using an EXCEL® add-in (BiPlot).
2.4.4 Environmental Gradients in Lake Simcoe
Prior to testing for associations between benthic community descriptors and physical and chemical attributes of Lake Simcoe, an analysis of the supporting environmental variables was conducted to determine which supporting environmental variables were correlated, and which variables provided unique information. A PCA was performed using SYSTAT® 10 for Windows® with many of the measured environmental variables. When samples are collected across an environmental gradient (like distance from an effluent outfall), many of the measured environmental variables will be correlated. Using a PCA, one can explore the associations
hh c:\bk\h projects\active\1609 40032 lake simcoe\report\final report\160940032 final report.doc 2.5

Benthic Macro-invertebrate Sampling and Analysis of Lake Simcoe Methodology March 2006
among variables and determine how many unique sets of variables there are. In a PCA, the first component (or axis) describes the major environmental gradient. Secondary environmental gradients may be indicated by secondary principal components. PCA therefore results in a number of derived components (axes) that can be used as surrogate measures of environmental characteristics. These components can also indicate the number of unique sets of variables.
With any PCA, the number of principal components is the same as the number of variables. In most cases, only a limited number of components reflect real environmental gradients (Jackson, 1993). In this analysis, any component with an eigenvalue > 1 was retained and interpreted because such components summarize more information than any single original variable (Cliff, 1988). Although this is the most common method of interpreting significant components in PCA, some caution in interpretation of axes should be used since even random data can produce eigenvalues in excess of 1 (Jackson, 1993). Both PCA axis scores and original variables were used in correlation analysis described below.
Correlation analysis was used in the next stage of the analysis to determine if the environmental descriptors identified in the PCA (above) were associated with descriptors of benthic community composition.
2.4.5 Sample Sizes
Modification of the study design used here, and the design of future benthic community surveys of Lake Simcoe will involve choosing the number of sampling locations and the number of samples to collect at each location. The number of samples per location can be based on within-site precision. Elliott (1977) and Environment Canada (2002) recommend collecting enough samples to produce an estimated mean index value that is within 20% of the true value for the site. The precision of within-station estimates can be estimated as:
xnsP = [2]
where s is the within-station standard deviation, n is the number of replicate (field) sub-samples, and x is the estimated mean of the community descriptor. This equation can be re-arranged to solve for the number of replicate samples required to achieve the desired precision (P) of 0.2 (i.e., 20%):
22
2
xPsn = [3]
The standard deviation can be estimated for each station separately, resulting in an estimated number of samples required to achieve the desired precision for the next study. When there are many sampling locations, like in this study, a more practical approach uses the pooled estimate of the within-stations standard deviation. This pooled estimator can be used in [2] above to estimate required sample sizes per station, and assuming that x is some value. This was the
hh c:\bk\h projects\active\1609 40032 lake simcoe\report\final report\160940032 final report.doc 2.6
Benthic Macro-invertebrate Sampling and Analysis of Lake Simcoe Methodology March 2006
approach taken here to evaluate precision, and to make recommendations about within-station sample sizes for future studies of Lake Simcoe.
2.4.6 Benthos Environment Associations
Associations between benthos and environmental features involved simple correlation analysis and the production of scatterplots of indices of composition with environmental variables. Those variables with significant (p<0.05) correlations with indices of composition were discussed.
hh c:\bk\h projects\active\1609 40032 lake simcoe\report\final report\160940032 final report.doc 2.7

BENTHIC MACRO-INVERTEBRATE SAMPLING AND ANALYSIS OF LAKE SIMCOE
3.0 Results
3.1 WATER CHEMISTRY
3.1.1 In situ Parameters
Water quality profiles for each station are presented in Tables 3 and 4. Temperature profiles where also recorded at 1-m intervals for the three profundal stations with depths greater than 24 m. The hypolimnion (cool-water environment) was detected at approximately 34 m during this survey in October 2005. Water temperature was consistently 11 to 12ºC to about that depth, then declined to about 8 to 9ºC. The DO function on the YSI would not zero correctly therefore precise DO measurements could not be obtained. However, relative measurements also displayed a drop off in DO at that depth.
3.1.2 Laboratory Analyses
Water samples for nutrient analysis were also collected at 0.5 m off bottom at all stations. Results are summarized in Table 5 and original laboratory reports are provided in Appendix E. Nitrite and nitrate were both at non-detectable concentrations throughout the lake during the sampling period. Total Kjeldahl nitrogen levels were consistent in the lake with the exception of Stations B and C in Cook’s Bay, where results for TKN were double the average found in the rest of Lake Simcoe (0.8 and 1.1 mg/L respectively vs. an average of 0.4 mg/L). Total phosphorus levels displayed similar results with higher levels detected in Cook’s Bay (maximum value 0.237 mg/L, Station C) (Table 5). Total Phosphorus concentrations were as high as 0.031 mg/L in littoral stations (Cook’s Bay Station 1) and as high as 0.022 mg/L in the profundal (off Kempenfelt Bay, Station 17). Almost half the stations exceeded the TP PWQO of 0.02 mg/L to prevent nuisance growths of algae, and almost all exceeded the PWQO of 0.01 mg/L to protect cold-water biota (Table 5). In general TP concentrations are higher at stations located on the west side of the lake.
hh c:\bk\h projects\active\1609 40032 lake simcoe\report\final report\160940032 final report.doc 3.1
BENTHIC MACRO-INVERTEBRATE SAMPLING AND ANALYSIS OF LAKE SIMCOE
3.2 SUBSTRATE CHARACTERISTICS AND SEDIMENT QUALITY
3.2.1 Grain Size
Results of sediment particle size analysis and substrate characteristics are presented in Table 6 and original laboratory reports are provided in Appendix E.
Shoreline stations were dominated either by rock (cobble, gravel, and boulder with sand), or sand alone (Table 6). The grain size data are misleading because the sediment samples reflected only the fine-grained sediments, and ignored the course cobble/boulder materials. It was frequently difficult to obtain an adequate volume of fine sediments for a sample. In fact no sediments could be collected at Station G (towards Pefferlaw on the southwest shoreline).
The dominant substrate at the littoral stations was sand, although six stations had high amounts of (greater than 50%) of silt and clay. Two of these, Stations 1 and 2 were at the south end of Cook’s Bay closest to the mouth of the Holland River. Station 14 was at the western tip of Kempenfelt Bay and Stations 7 and 8 were located in a back bay near the outflow to Lake Couchiching. Deposition would be expected at these locations. The grain size analysis also reported a significant gravel component in several littoral samples. Sampling efforts often had to be moved at this stratification due to hard substrates that could not be sampled with a petite Ponar. Therefore some larger particles were sampled at these stations, but this gravel component more likely represents zebra mussel shells, which were very abundant in the samples. It is possible that some of the sand particles may also have been crushed shells as they were very abundant. Many of the sediment samples had a rotting odour from the decaying mussels.
The substrate at the profundal stations was silt with some sand.
3.2.2 Sediment Chemistry
Results of sediment nutrient analysis are presented in Table 7. Nitrate, nitrite and phosphate–P were all at non-detectable concentrations, with the exception of phosphate–P at Station F off Sibbald Point Provincial Park (Table 7). TKN concentrations varied throughout the lake with higher concentrations in the depositional areas with finer sediments, such as the profundal stations. A similar pattern occurred with TP and TOC concentrations.
Sediment chemistry results were compared to the Provincial Sediment Quality Guidelines (PSQG; OMOE, 1993). Total organ carbon concentrations exceeded the PSQG lowest effect level (LEL) of 1% at all but two (Stations L and M near Barrie), and exceeded the severe effect level (SEL) of 10% at about half the locations including all of the profundal stations (Table 7). As suspected the highest TOC concentrations occurred in the areas where there was the greatest deposition of fine sediments; i.e. the profundal stations, the south end of Cook’s Bay closest to the mouth of the Holland River and the west end of Kempenfelt Bay near Barrie.
Sediment TKN concentrations exceeded the LEL at the majority of the littoral stations and all of the profundal stations (Table 7). Only three stations exceeded the SEL: Stations 18 and 19, the
hh c:\bk\h projects\active\1609 40032 lake simcoe\report\final report\160940032 final report.doc 3.1
Benthic Macro-invertebrate Sampling and Analysis of Lake Simcoe Discussion March 2006
profundal stations in Kempenfelt Bay and Station 2 a littoral station along the east shore of Cook’s Bay.
Total phosphorus concentrations exceeded the LEL at 16 of the 36 sampling stations, including the four profundal stations. Aside from the high TP levels at the profundal stations no particular pattern of sediment TP concentrations was evident based on the samples collected during the benthic survey. There were no exceedances of the TP SEL of 2000 μg/L.
3.3 ENVIRONMENTAL GRADIENTS
Analysis of the sediment and water chemistry and water depth using Principal Components Analysis (PCA) indicated two general gradients in environmental conditions. The first principal gradient in the lake was depth related (Table 8) with sediments being finer and with higher concentrations of total organic carbon and nutrients (TKN, TP) in deeper water. A second gradient, that explained much less variation, contrasted sites with high gravel content and low total phosphorus concentrations against sites with less gravel content and higher total phosphorus concentrations. Relationships between indices of benthic community composition focused on variables associated with sediment-borne nutrients (i.e., Axis 1 of the PCA) and on percent gravel (Axis 2 of the PCA).
3.4 BENTHIC INVERTEBRATE COMMUNITY
3.4.1 General Description
The 2005 Lake Simcoe benthic survey found 138 distinct taxa (Appendix C). There was a good variety of Oligochaeta (20 taxa + 2 immature groups), Chironomidae (27 taxa), Trichoptera (17 taxa) and Molluscs (24 taxa, including 8 species of Sphaeriidae) throughout. Amphipods and zebra mussels (Dreissena polymorpha) generally dominated samples, but other taxa such as Isopoda, Gastropoda and occasionally Caenis mayflies (Ephemeroptera) were also frequently numerically abundant. Two species of crayfish (Orconectes propinquus, Orconectes virilis) were found, though not in reported fractions of sorted samples. These species were reported at the end of the detailed taxonomic table (Appendix C) for completeness but were not part of the analysis. The introduced spiny waterflea, Bythotrephes longimanus, was reported at the bottom of the table as well, not because it is benthic, but because its presence may be of interest. Another record of special interest was the amphipod Echinogammarus ischnus. This species has not been previously reported, to our knowledge, in an inland lake: this represents a potentially significant range extension.
Forty-four of the 105 samples required some degree of sub-sampling. The required sub-sampling by station is recorded on the taxonomic list in Appendix C. QA/QC results for sample sorting efficiency are also included in Appendix C. Percent recovery was 99.9% for the ten samples chosen at random for re-sorting, greater than the 90% level of recovery recommended in the Environmental Effects Monitoring Guidance Document (Environment Canada, 2002).
Mean values for the calculated benthic community indices, are summarized in Tables 9 to 11. The ordination of the benthic community is provided in Figure 2. The profundal benthic
hh c:\bk\h projects\active\1609 40032 lake simcoe\report\final report\160940032 final report.doc 3.2
Benthic Macro-invertebrate Sampling and Analysis of Lake Simcoe Discussion March 2006
community was not included in the ordination because it was distinctive, and inclusion in the procedure caused considerable distortion. Shoreline communities were distinct from littoral communities, with shoreline communities being generally more diverse and including a broader assemblage of larger insects such as mayflies and caddisflies. The littoral community was more dominated by groups preferring softer substrata including clams, ostracods and nematodes. More specific differences in the fauna are described below. The first CA Axis represented the overall differences in community composition between shoreline and littoral zones in the lake. Within both shoreline and littoral habitats, the second CA axis contrasted sites with containing a broad diversity of benthic fauna including larger insects, midges, worms and Crustacea (amphipods, isopods), to sites with less diversity (midges, clams). The CA biplot did not demonstrate any significant clustering of sites according to spatial orientation in the lake: that is samples from Kempenfelt Bay, Cook's Bay and the main body of lake did not produce distinct clusters.
3.4.2 Shoreline Benthos
Ten of the 16 shoreline stations were dominated by Amphipoda (> 60% of total numbers). The amphipod component was largely attributable to Gammarus lacustris for Stations A through F located at the south end of Lake Simcoe including Cook’s Bay, with some stations also containing Hyalella azteca. Echinogammarus ischnus was found at all stations with the exception of those in Cook’s Bay, and Station F near Sibbald Point. The only two shoreline stations not dominated by amphipods were Stations L and M near the town of Orillia, which were dominated by the bivalve Pisidium casertanum and immature tubificid worms (Oligochaeta), respectively (Table 9). However, both of these species occurred at other stations. A variety of Chironomidae species were also abundant at Stations L and M and present throughout all of the shoreline stations.
Zebra mussels (Dreissena polymorpha) were found at all of the shoreline stations in variable abundance; Stations L and M having the lowest density with only one specimen at Station L, and 4 at Station M. The benthic communities at stations B, C, E, H and P were similar in having fewer zebra mussels and higher relative abundances of sphaeriid clams (Pisidium casertanum, Pisidium compressum), ceratopogonids (sand flies), and immature worms (Figure 2; Table 9).
Taxa richness was highest at the shoreline stations, which would be expected due to the diversity of available habitat, including coarse substrates, which are generally inhabited by a larger proportion of species. Mean number of taxa at the shoreline stations ranged from 14 at Station M, which is a sandy beach in Centennial Park, to 38 at Station N, which has a rocky shoreline (Table 9).
The mean total abundance was also significantly greater at the shoreline stations (976 to 7793 per three-minute kick sample) with the exception of Stations L (54) and M (155), both of which are sandy public beaches. A lower diversity and density would be expected in sandy substrates especially in a shoreline erosional habitat.
Similar to taxa richness and abundance the shoreline stations generally had higher mean percent ET (Ephemeroptera-Trichoptera) values ranging from 0 to 24% with Station F (Sibbald
hh c:\bk\h projects\active\1609 40032 lake simcoe\report\final report\160940032 final report.doc 3.3

Benthic Macro-invertebrate Sampling and Analysis of Lake Simcoe Discussion March 2006
Point) having the greatest percentage of these organisms, and with the mayfly Caenis puncata and the caddisfly Helicopsyche borealis dominating those groups.
Simpson’s Diversity Index values were lower in the shoreline areas, ranging between 0.26 and 0.80, compared to ranges of 0.7 to 0.85 for the littoral and ~ 0.8 for the profundal stations. Dominance of shoreline benthos by amphipods and zebra mussels caused the lower diversity, despite there being an overall higher number of taxa in shoreline samples (Table 9).
3.4.3 Littoral Benthos
Littoral benthos were dominated by Amphipoda, Chironomidae and Bivalvia (Sphaeriidae, Dreissenidae) (Table 10). Oligochaeta, Isopoda, Ostracoda, Gastropoda and Platyhelminthes were variably abundant. Ephemeroptera, Trichoptera and Hirudinea were present, though sporadically. None of the littoral stations were excessively dominated by any one taxonomic group, unlike the littoral stations. Taxa richness ranged from 9 to 30 taxa at the littoral stations and abundance ranged from 39 to 632 organisms per sample (Table 10). Ephemeroptera and Trichoptera taxa were present in low numbers in most littoral stations with the exception of Stations 1, 2 and 14. Station 5 had a relatively high %ET (19%), comprised largely of Hexagenia limbata. This same species was found at a number of other stations and at similar numbers. Simpson’s D values were fairly consistent within the littoral stations ranging from 0.67 to 0.85 (Table 10).
3.4.4 Profundal Benthos
Profundal benthos were dominated by four types of benthos: immature tubificid worms (Oligochaeta), Ostracoda, Chironomidae (four taxa), and Sphaeriidae (seven species). Sites contained between 9 and 11 taxa, had < 50 organisms per sample (< 2,000 per m2), and had high Simpson’s Diversity (generally > 0.8). There were no Ephemeroptera or Trichoptera in the profundal stations (Table 11).
3.5 BENTHOS-ENVIRONMENT ASSOCIATIONS
Of the variables listed in Table 12, all but water depth and water total phosphorus concentrations were highly correlated (Table 8). Sediment variables including TKN concentration, sediment moisture content, sediment TP and percent sand were related, and so correlations with indices of benthic community composition tended to co-occur, especially for littoral benthos (Table 12). The principal factor influencing the composition of the benthic community was water depth, as detailed in Sections 3.4.2 through 3.4.4.
Water-borne total phosphorus was uncorrelated with any of the indices of benthic community composition in either shoreline or littoral environments. Indicators of sediment quality (TKN, TOC and TP) in the littoral stations tended to strongly correlate with the second CA axis within the littoral zone reflecting an increase in the more pollution tolerant taxa such as the worm Limnodrilus hoffmeisteri and the midge Chironomus in sites with high organic carbon content. Figure 3b shows high CA Axis 2 scores corresponding with high TOC content, while Figure 2
hh c:\bk\h projects\active\1609 40032 lake simcoe\report\final report\160940032 final report.doc 3.4
Benthic Macro-invertebrate Sampling and Analysis of Lake Simcoe Discussion March 2006
shows that high Axis 2 scores corresponded with benthic communities dominated by worms and chironomids.
TP in sediments in the shoreline stations also correlated strongly and positively with the percent of the benthic community comprised of Ephemeroptera and Trichoptera (Figure 3c). High TP would normally be associated with a loss of those kinds of benthos because of associated oxygen depletion at the sediment-water interface. Observed TP concentrations were above the low-effect level of 600 μg/g, but well below the severe effect level of 2,000 μg/g, so there is only modest expectation that severe effects on any index of benthic community composition would be observed. The relationship between %ET and TP was largely driven by Station F, which had a substrate of sand over clay, with cobble and gravel near shore (Table 6). It is more likely that the observed relationship was determined by substrate, not sediment TP. Future inventories may confirm the relationship.
The negative relationship between sediment TP and abundance (Figure 3a) was more consistent with a negative effect related to high nutrient concentrations, but as above TP concentrations were well below the severe effect level. Further, abundances in the shoreline stations were based on sweep samples, and should be considered qualitative rather than fully quantitative.
3.6 WITHIN-SITE VARIABILITY
Within-station variability is summarized in Table 13 for each of the three major habitat types. Collecting three samples was generally adequate to ensure that estimated mean index values were within ±20% of the true value. In several instances, the collection of a single replicate was adequate. Future surveys of Lake Simcoe would be justified in using a reduced number of samples to characterize indices of composition at stations, potentially providing an opportunity to increase the number of stations at which samples are collected.
3.7 HISTORICAL CHANGES IN COMPOSITION
Means of percent abundances of major groups of benthic organisms are summarized in Table 14, illustrating potential differences between the surveys conducted in 1926 and the present 2005 survey. Differences need to be interpreted cautiously because the 1926 data are averages over the entire sampling season (about a three-month period), while the present data are for the survey in October only. The 1926 survey also did not employ the use of microscopes for sorting samples, so the total abundances and percent abundances of smaller taxa would be quite different from what is reported here for 2005. There remain significant shifts in composition, even taking those issues into consideration.
3.7.1 Shoreline Zone
Zebra mussels are now a significant fraction of the benthic community in the shoreline environment: they were absent until 1995. Relative abundances of amphipods has increased about 9 times, while relative abundances of chironomids has decreased about 5 times and gastropods have decreased about 4 times (Table 14).
hh c:\bk\h projects\active\1609 40032 lake simcoe\report\final report\160940032 final report.doc 3.5
Benthic Macro-invertebrate Sampling and Analysis of Lake Simcoe Discussion March 2006
3.7.2 Littoral Zone
The invasive zebra mussel now dominates the littoral benthic invertebrate community in Lake Simcoe (Table 14). This is a significant difference from 1926, when this habitat zone was dominated by chironomids (Table 14). Chironomids are still present at all stations and the most abundant at some littoral stations where finer sediments exist. Other changes in species composition since 1926 are a decrease in the relative abundance of molluscs, including both Sphaeriidae and Gastropoda.
Two other studies completed by the MOE in 1975 and the LSFAU in 1983 have sampled benthos within the littoral depth range as defined in this study. Original data for the 1975 study were not obtained, however secondary reports indicate that tubificid worms dominated Lake Simcoe samples. Tubificid worms were present in all other studies but were not dominant.
The LSFAU sampled 5 stations at a 10-m depth and found that the dominant taxa differed across these stations and was ostracods, nematodes, chironomids or oligochaetes. Very large numbers of ostracods were collected at some stations. In 1926 (Rawson, 1930) ostracods were grouped into a ‘miscellaneous’ category as they were only found in small numbers and in 1975 (LSFAU, 1991) the MOE did not report any ostracods. In the current survey they were found at the majority of the littoral and profundal stations and were the dominant taxa at one station (Station 7). It appears that ostracods have always been present in Lake Simcoe but perhaps different sampling times and methods have affected the relative abundance collected.
3.7.3 Profundal Zone
The profundal zone in Lake Simcoe was dominated by four major taxa; chironomids, tubificid worms, ostracods, and fingernail clams. This composition is similar to that observed by Rawson in 1926 (Table 14). There has been a slight decline in the relative proportion of chironomids and an increase in ostracods, oligochaetes and Sphaeriidae. Chaoborid larvae (phantom midges), which comprised 7% of the profundal organisms in 1926, were not found in this 2005 survey.
The LSFAU (1991) also collected samples at a 30-m depth within Lake Simcoe. They found that ostracods and then nematodes were the dominant taxa. No nematodes were collected from the profundal stations in this 2005 survey.
hh c:\bk\h projects\active\1609 40032 lake simcoe\report\final report\160940032 final report.doc 3.6
BENTHIC MACRO-INVERTEBRATE SAMPLING AND ANALYSIS OF LAKE SIMCOE
4.0 Discussion
This 2005 survey of the benthic fauna of Lake Simcoe was the first comprehensive, whole-lake survey since the first one by Rawson in 1926. This survey has demonstrated that the benthic fauna of the lake is in relatively good condition, despite there being significant changes in the fauna since that first 1926 survey. Spatial patterns in the lake in 2005 were strongly influenced by water depth, as expected, and secondarily by nutrient concentrations in the sediments. There were no significant associations between indices of benthic community composition and measured water-borne nutrient concentrations. These aspects of the benthic community are discussed in detail below.
The benthic community of Lake Simcoe demonstrated several attributes indicative of good habitat quality. First, this 2005 survey of the benthic community produced 138 distinct taxa including representative species of relatively sensitive groups including beetles (water pennies like Ectopria and Psephenus) mayflies (e.g., Ephemerella, Hexagenia, Caenis) and caddisflies (e.g., Helicopsyche borealis) in the nearshore environment. The deeper profundal benthos was additionally relatively diverse with representative fingernail clams (Pisidium sp.), some snails, chironomids, amphipods and oligochaete worms. Profundal environments that are oxygen limited will typically contain only worms and chironomids (Brinkhurst, 1974). The presence of sphaeriid clams, amphipods and infrequent zebra mussels in the profundal environment (Table 14) clearly suggested that water quality has recently been in relatively good condition in the hypolimnion of the lake.
Some of the physical and chemical data collected as part of this survey indicated a relatively challenging environment for benthic invertebrates. For example, total organic carbon content of the sediments exceeded severe effect levels (10%) in the profundal (49 to 62% TOC), littoral (4 to 65 % TOC), and shoreline areas (1 to 30 TOC) (Table 7). Total Kjeldahl Nitrogen and Phosphorus concentrations in sediments also frequently exceeded low effect levels in littoral and profundal zones (Table 7). Water column concentrations of phosphorus generally exceeded 0.020 mg/L (Table 5), generally indicating eutrophic lake conditions.
Despite the high nutrient concentrations, dissolved oxygen concentrations were high, in excess of about 10 mg/L throughout the water column. Those high concentrations were probably a function of the lake having experienced fall turnover, and being relatively fully mixed from surface to bottom (note surface and bottom temperatures in Table 4).
Though benthic communities were in good condition in 2005, comparison to the historical data demonstrated significant changes from 1926. It was difficult to determine if the numbers of animals were similar from the previous large survey to the present one because of differences in sampling methodologies. In 1926, sorting would have been by unaided eye in a white tray (possibly). In 2005, sorting was assisted by a dissecting microscope and pigment dyes. Amphipods were clearly more abundant in the shoreline samples in 2005 (~ 63%) than in 1926 (~ 7%), while the relative abundance of chironomid larvae was generally lower at all three depths in 2005 than in 1926. Chironomid larvae were almost absent from one station (3) in
hh c:\bk\h projects\active\1609 40032 lake simcoe\report\final report\160940032 final report.doc 4.1
Benthic Macro-invertebrate Sampling and Analysis of Lake Simcoe Discussion March 2006
2005, which is very unusual. Chironomids should comprise a significant fraction (say 10 to 20% minimum) of the fauna at any site. The percentage of the fauna as fingernail clams (Sphaeriidae) was lower in the littoral (9% in 1926 and 1% in 2005), but higher in profundal (6% in 1926 and 16% in 2005). The change in the littoral zone may be attributable to the presence of zebra mussels that accounted for about 32% of the fauna in the littoral samples (Table 14). The increase in the relative abundance of sphaeriids in the profundal was probably a trade-off with the lower numbers of chironomids, though the specific cause can only be speculated. The absence of chaoborid larvae in 2005 was interesting even though it is difficult to speculate why. The presence/absence of Chaborus in lakes is typically associated with fish communities, and whether fish species that actively feed on these larvae are present (von Elde, 1979).
Water depth was the single largest influence on benthic community composition of the lake, as expected. Water depth should be the largest influence on distributions because of its role in influencing water temperatures and dissolved oxygen levels (Brinkhurst, 1974). The second most important variable was sediment total organic carbon content. Higher TOC tended to coincide with lower relative abundances of mayflies and caddisflies, implying a negative association with the benthos. Higher TOC should reduce oxygen levels in sediments and at the sediment-water interface, and thus reduce the abundances of those taxa like mayflies and caddisflies that have a higher requirement for oxygen than worms, chironomids and clams (Hilsenhoff, 1987). Other unmeasured variables (e.g., metals, macrophyte distributions) may have influenced the distributions of benthos in the shoreline and littoral environments of Lake Simcoe.
One of the more interesting findings of this study was the occurrence of the introduced amphipod Echinogammarus ischnus. This species was found at the majority of the shoreline stations with the exception of stations in Cook’s Bay (A-E), Sibbald Point Provincial Park (F) and at the far end of Kempenfelt Bay (M). Most of the stations lacking Echinogammarus were located at the south end of Lake Simcoe. Where these organisms were found they were also generally in large numbers. This spatial distribution and abundance was indicative of a newly introduced species. It is very likely that this is the first reported occurrence of Echinogammarus in an inland lake in Ontario. Echinogammarus ischnus is a native of the Ponto-Caspian Basin and it was first reported in the Detroit River in 1995 (Witt et al., 1997). Colin et al. (2003) states that it was possibly introducted into Lake Erie as early as 1993 and since then Echinogammarus has spread rapidly throughout all of the Great Lakes and the St. Lawrence River. They also noted that in Lake Erie Echinogammarus has largely displaced the native Gammarus fasciatus in Dreissenia-encrusted substrates.
Stations were situated throughout the lake to characterize benthic communities in each of the three major basins, and across the gradient of nutrient concentrations that exists in the lake. One expectation was that water-borne nutrient concentrations would relate to indices of benthic community composition, and that relationships between nutrient concentrations and benthic metrics could be used to identify critical nutrient concentrations corresponding with healthy or impaired benthic communities. The data from this 2005 survey clearly did not demonstrate relationships between benthos and water-borne nutrient concentrations. These 2005 data, however, provide a baseline against which future inventories of the lake can be compared.
hh c:\bk\h projects\active\1609 40032 lake simcoe\report\final report\160940032 final report.doc 4.2

Benthic Macro-invertebrate Sampling and Analysis of Lake Simcoe Discussion March 2006
Lake-wide changes in benthic community composition over time can provide a biologically relevant measure of habitat quality. The condition of benthic macroinvertebrates covaries well with the health and condition of fish communities and fish populations (Kilgour and Barton, 1999; Jackson, 1993). Concurrent measurements of surface water quality, sediment quality and benthic invertebrates over time will thus provide the Lake Simcoe Region Conservation Authority, and other agencies, the data required to know whether lake-wide nutrient management has biological implication.
hh c:\bk\h projects\active\1609 40032 lake simcoe\report\final report\160940032 final report.doc 4.3
BENTHIC MACRO-INVERTEBRATE SAMPLING AND ANALYSIS OF LAKE SIMCOE
5.0 Recommendations for Future Sampling
This 2005 survey of the benthos of Lake Simcoe provides a useful inventory of existing conditions, and presents a baseline against which to judge future changes in habitat quality. The sampling scheme presented here involving shoreline, littoral and profundal sampling addresses potential impacts in three fundamental zones in the lake. The shoreline sweeps address potential on-shore impacts resulting from local activities such as septic beds, marinas and other point- and non-point discharges. An inventory of the discharges to the lake should be overlaid with the benthic sampling locations to identify gaps in the design and opportunities for additional future monitoring.
The littoral samples were collected at a depth that was just above the typical thermocline, and represented a zone of high abundance and thus high biological activity for this lake (see discussion in Rawson, 1930). There was no obvious concordance of indices of community composition between samples collected in the littoral and samples collected near shore, indicating that the littoral samples provide unique information about habitat quality. Sampling should be continued within the littoral and shoreline sampling zones to address the unique spatial patterns in each depth stratum.
Samples from the profundal zone provide information on overall lake water quality. Profundal samples, being below the thermocline, represent worst-case conditions (Brinkhurst, 1974). Continued sampling of profundal sampling locations is recommended.
Precision estimates indicated that less sampling could be done at each station, while still providing a reasonable amount of precision for estimating indices of composition at a specific location (station). Reducing sampling effort at the station level, would allow for an increase in the number of stations for future fixed budgets. Shoreline samples were kick samples according to the methodology promoted by the Ontario Benthic Biomonitoring Network (OBBN), producing many times the required number of organisms for a sample to be considered valid. Two samples would provide as much resolution at the station level, while the number of stations could be increased to improve the lake-wide characterization.
Sampling of the shoreline zone in this 2005 survey was dependent on access via roads. Access by boat was considered infeasible because of heavy wave action and the potential for damage to the boat in shallow water. Because of the requirement for road access, many of the sampling locations were adjacent to villages, towns, cities and marinas, or otherwise developed areas. Some provision for sampling less developed areas should be made for future surveys, to provide a contrast for areas close to more developed locations.
The measurement of additional “explanatory” variables would assist in the interpretation of the potential causes of spatial and temporal variations in indices of benthic community composition. Additional variables could include representative metals, indicators of contamination by hydrocarbons, and macrophyte biomass.
hh c:\bk\h projects\active\1609 40032 lake simcoe\report\final report\160940032 final report.doc 5.1
Benthic Macro-invertebrate Sampling and Analysis of Lake Simcoe Discussion March 2006
6.0 Closure
Stantec Consulting Ltd., under contract to the Lake Simcoe Region Conservation Authority (Rob Baldwin) produced this final report on benthic communities of Lake Simcoe. Charity Clarkin led the field program, with assistance from Michael Ryan, Rob Wilson, Eric Szokokan, Lawrence Skinner and Mark Ledlie. Charity Clarkin and Bruce Kilgour co-authored this document. Rachel Fletcher, Catherine Eimers and Chris Jones of the Ontario Ministry of the Environment, and Sybell von Kursell of the Ontario Ministry of Municipal Affairs and Housing provided comments on an earlier draft report.
STANTEC CONSULTING LTD
Charity Clarkin, BSc Bruce Kilgour, PhD Project Scientist Project Director
hh c:\bk\h projects\active\1609 40032 lake simcoe\report\final report\160940032 final report.doc 6.2
BENTHIC MACRO-INVERTEBRATE SAMPLING AND ANALYSIS OF LAKE SIMCOE
7.0 References
Brinkhurst, R.O. 1974. The Benthos of Lakes. The Blackburn Press.
Cliff, N. 1988. The eigenvalues-greater-than-one rule and the reliability of components. Psychological Bulletin, 103:276-279.
Eimers, M.C., Winter, J.G., Scheider, W.A., Watmough, S.A., and Nicholls, K.H. 2005. Recent changes and patterns in the water chemistry of Lake Simcoe. J. Great Lakes Res. 31:322-332.
Environment Canada, 2002. Metal Mining Guidance Document for Aquatic Environmental Effects Monitoring. June 2002.
Evens, D.O., Nicholls, K.H., Allen, Y.C., and McMurty, M.J. 1996. Historical land use, phosphorus loading, and loss of fish habitat in Lake Simcoe, Canada. Can. J. Fish. Aquat. Sci. 53(Suppl. 1):194-218.
Gauch, H.G. Jr. 1982. Multivariate Analyses in Community Ecology. Cambridge University Press, London. 298 pp.
Griffiths, R.W. 1998. Sampling and Evaluating the Water Quality of Streams in Southern Ontario – A How to Manual. Prepared for the Ministry of Municipal Affairs and Housing. 33 pp + Appendices.
Hilsenhoff, W.L. 1987. An improved biotic index of organic stream pollution. Great Lakes Entomologist, 20:31-39.
Jackson, D.A. 1993. Stopping rules in principal components analysis: a comparison of heuristic and statistical approaches. Ecology, 74:2204-2214.
Jackson, D.A. and H.H. Harvey. 1993. Fish and benthic invertebrates: community concordance and community-environment relationships. Canadian Journal of Fisheries and Aquatic Sciences, 50:2641-2651.
Johnson, M.G., and Nicholls, K.H. 1989. Temporal and spatial variability in sediment and phosphorus loads to Lake SImcoe, Ontario. Journal of Great Lakes Research. 5(2):265-282.
Jones, C. K.M. Somers, B. Craig, and T. Reynoldson. 2004. Ontario Benthos Biomonitoring Network Protocol Manual, Version 1.0. Ontario Ministry of Environment.
Kilgour, B., Hawkins, B., Westwood, J., Kauss, P. and Gemza, A. 1999. Lake Couchiching Environmental Quality – 1997 Volume 1 – Main Findings. ISBN 0-7778-8497-6 + Appendices. Queen’s Printer for Ontario, Toronto.
hh c:\bk\h projects\active\1609 40032 lake simcoe\report\final report\160940032 final report.doc 7.1
Benthic Macro-invertebrate Sampling and Analysis of Lake Simcoe References March 16, 2006
Kilgour, B.W. and D.R. Barton. 1999. Associations between stream fish and benthos across environmental gradients in southern Ontario, Canada. Freshwater Biology, 41:553-566.
Lake Simcoe Environmental Management Strategy (LSEMS). 2005. Implementation Program: Lake Simcoe water quality update 2000 – 2003. Technical Report Imp. B.20.
Lake Simcoe Environmental Management Strategy (LSEMS). 2003. State of the Lake Simcoe Watershed Lake Simcoe Region Conservation Authority, Newmarket, ON.
Lake Simcoe Fisheries Assessment Unit (LSFAU). 1991. A study of the benthic community in Lake Simcoe, 1983. (Internal Report) File Report: 1991-12.
Merritt R.W. and C.W. Cummins. 1988. An introduction to the aquatic insects of North America 2nd Edition. Kendall/Hunt Publishing, Dubuque, Iowa.
Ontario Ministry of Environment and Energy (OMOE). 1994. Water Management, Policies, Guidelines, Provincial Water Quality Objectives of the Ministry of Environment and Energy. ISBN 0-7778-8473-9 rev. 19 pp. + Appendices. Queen’s Printer for Ontario, Toronto.
Ontario Ministry of Environment and Energy (OMOE). 1993. Guidelines for the protection and management of the aquatic sediment quality in Ontario. ISBN 0-7729-9248-7. 23 pp. Queen’s Printer for Ontario, Toronto.
Pinder L.C.V. 1986. Biology of Freshwater Chironomidae, p. 1-23. In Mittler T.E., Radovsky F.J., Resh V.H. (eds.), Annual Review of Entomology 31. Annual Reviews, Inc., Palo Alto, CA.
Rawson, D.S. 1930. The bottom fauna of Lake SImcoe and its role in the ecology of the lake. University of Toronto Press. Publication of the Ontario Fisheries Research Laboratory No. 40.
ter Braak, C.J.F. 1992. CANOCO - a FORTRAN Program for Canonical Community Ordination. Microcomputer Power, Ithaca, NY
von Elde, C.N. 1979. Fish predation, interspecific predation, and the distribution of two Chaoborus species. Ecology, 60:119-128.
hh c:\bk\h projects\active\1609 40032 lake simcoe\report\final report\160940032 final report.doc 7.2

Appendix A
Figures
8
7
I
6a6
J
F4
15
17
9
16
Innisfil
11
18K
10
ON
19
12
13
L14
A 3
BE
D
21C
G
5
H
Ramara
Oro-Medonte
M P
Cook's Bay
Kempenfelt Bay
LakeCouchiching
0 5 Kilometers
1:200,000LOCATION OFSAMPLING STATIONS
NOVEMBER 2005 FIGURE NO.FILE:60940032_01_base_layers.mxd
DATE:
DRAWN BY: CHECKED BY: SCALE: PROJECT NO. APPROVED:
PROJECT NAME:
PREPARED FOR:
REV. NO. REV. DATE: DESCRIPTION REVISED BY:
0 AM CC 60940032 CC
LAKE SIMCOE BENTHIC SURVEYLSRCA
- - - -
REV.
LAKE SIMCOE STUDY 1Profundal StationsLittoral StationsShoreline Stations 1:200,000
1 MARCH 3, 2006 ADD TRAWL TRANSECTS AM

igure 2. Scatterplots of Correspondence Analysis (CA) axis scores. a
-3 -2 -1 0 1 2CA Axis 1
-3
-2
-1
0
1
2C
A A
xis
2
6
38
915
11
12
147
10
4
1
5
6a
2
JG
OK
H
P
NFDA
E
L
I
C
B
M
-3 -2 -1 0 1 2CA Axis 1
-3
-2
-1
0
1
2
CA
Axi
s 2
Procladius
Chironomus
Ostracoda
L. hoffmeisteri
T. jucundum
P. exacuous
Tanytarsus
A. pigueti
Limnesia
Nematoda
V. tricarina
C. racovitza
A. heteroclita
S. herringianus
Stictochironomus
D. polymorpha
Imm - hairs
P. compressum
L. lineata
H. azteca
Microtendipes
Cryptochironomus
Imm + hairs
A. limosaHydra
Pseudochironomus
Micrasema
E. ischnus
Antocha
E. nervosa
TriaenodesS. crenataHemerodromia
S. Interpunctatum
H. borealisLebertia
D. quadrinot
Polycentropus
Cricotopus
C. punctata
Conchapelopia
H. anceps
Prostoma
G. circumstriatus
P. fallax
P. gyrina
A. walkeri
P. castertanum
Cladotanytarsus
Oecetis
DicrotendipesSialis
Polypedilum
Ceratopogonidae
G. lacustris
ShoreLittorala
b
FSamples close together in (a) have similar benthic communities. In (b) taxclose together tended to be found at the same sites.
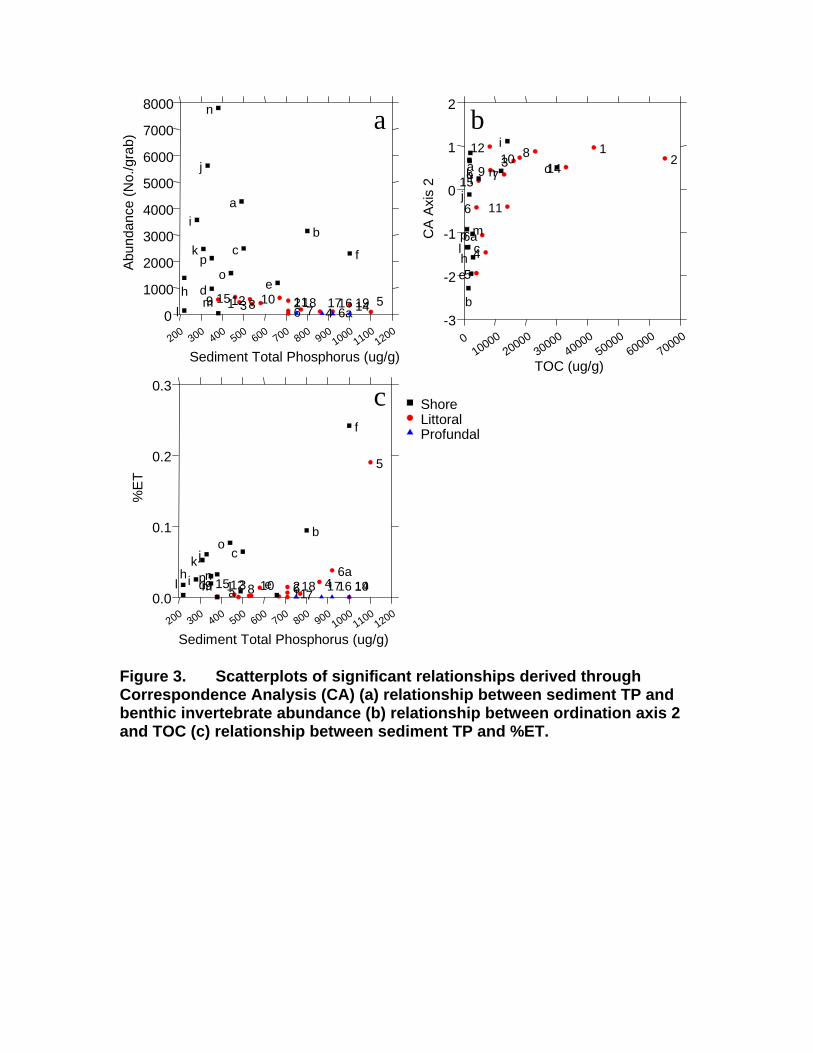
-3
-2
200 300 400 500 600 700 800 9001000
11001200
Sediment Total Phosphorus (ug/g)
0
1000
2000
3000
4000
5000
6000
7000
8000
Abu
ndan
ce (N
o./g
rab)
5146a471126
1083121159 19161718lh
i
k f
b
e
c
a
o
m
n
d
p
j
010000
2000030000
4000050000
6000070000
TOC (ug/g)
-1
0
1
2
CA
Axi
s 2
21
148103
11
79
12
46a
15
5
6
lmc
b
d
i
nf
h
p
e
ao
j
k
200 300 400 500 600 700 800 9001000
11001200
Sediment Total Phosphorus (ug/g)
0.0
0.1
0.2
0.3
%E
T
5
146a
4711261083121159 19161718l
hik
f
b
e
c
a
o
mn
dp
j
Shore
ProfundalLittoral
ba
c
igure 3. Scatterplots of significant relationships derived through de nd
FCorrespon nce Analysis (CA) (a) relationship between sediment TP abenthic invertebrate abundance (b) relationship between ordination axis 2 and TOC (c) relationship between sediment TP and %ET.

Appendix B
Tables
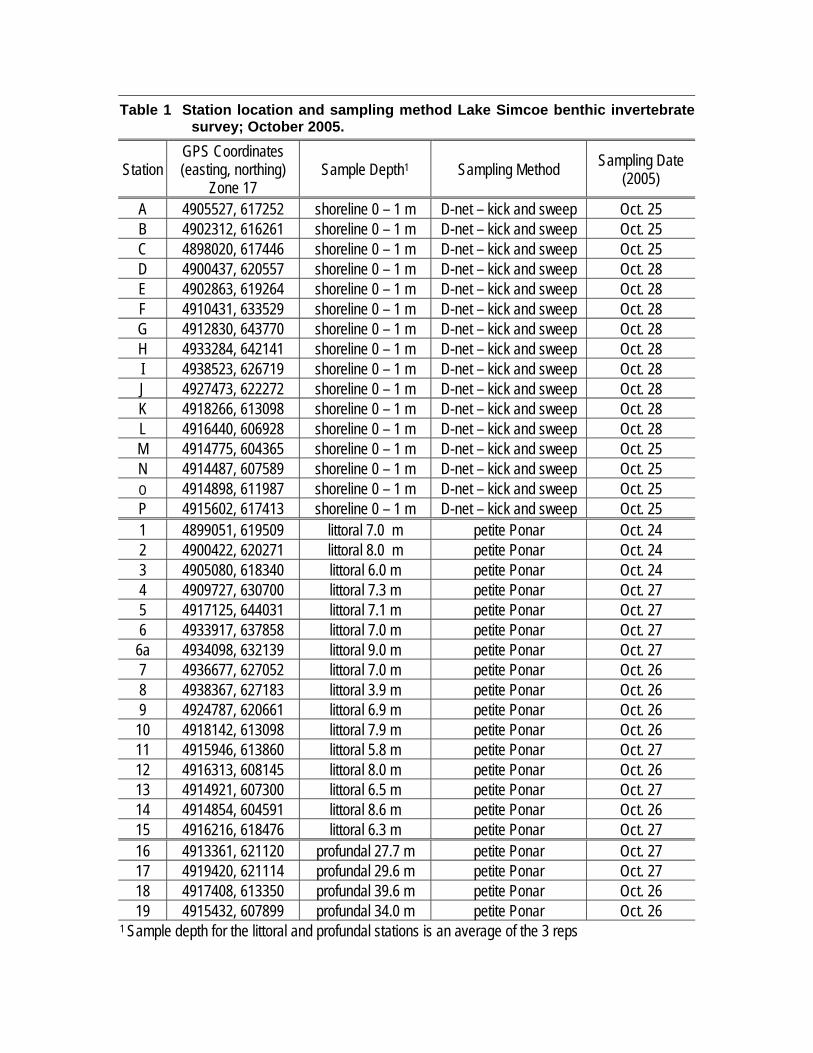
Table 1 Station location and sampling method Lake Simcoe benthic invertebrate survey; October 2005.
Station GPS Coordinates (easting, northing)
Zone 17 Sample Depth1 Sampling Method Sampling Date
(2005)
A 4905527, 617252 shoreline 0 – 1 m D-net – kick and sweep Oct. 25 B 4902312, 616261 shoreline 0 – 1 m D-net – kick and sweep Oct. 25 C 4898020, 617446 shoreline 0 – 1 m D-net – kick and sweep Oct. 25 D 4900437, 620557 shoreline 0 – 1 m D-net – kick and sweep Oct. 28 E 4902863, 619264 shoreline 0 – 1 m D-net – kick and sweep Oct. 28 F 4910431, 633529 shoreline 0 – 1 m D-net – kick and sweep Oct. 28 G 4912830, 643770 shoreline 0 – 1 m D-net – kick and sweep Oct. 28 H 4933284, 642141 shoreline 0 – 1 m D-net – kick and sweep Oct. 28 I 4938523, 626719 shoreline 0 – 1 m D-net – kick and sweep Oct. 28 J 4927473, 622272 shoreline 0 – 1 m D-net – kick and sweep Oct. 28 K 4918266, 613098 shoreline 0 – 1 m D-net – kick and sweep Oct. 28 L 4916440, 606928 shoreline 0 – 1 m D-net – kick and sweep Oct. 28 M 4914775, 604365 shoreline 0 – 1 m D-net – kick and sweep Oct. 25 N 4914487, 607589 shoreline 0 – 1 m D-net – kick and sweep Oct. 25 O 4914898, 611987 shoreline 0 – 1 m D-net – kick and sweep Oct. 25 P 4915602, 617413 shoreline 0 – 1 m D-net – kick and sweep Oct. 25 1 4899051, 619509 littoral 7.0 m petite Ponar Oct. 24 2 4900422, 620271 littoral 8.0 m petite Ponar Oct. 24 3 4905080, 618340 littoral 6.0 m petite Ponar Oct. 24 4 4909727, 630700 littoral 7.3 m petite Ponar Oct. 27 5 4917125, 644031 littoral 7.1 m petite Ponar Oct. 27 6 4933917, 637858 littoral 7.0 m petite Ponar Oct. 27
6a 4934098, 632139 littoral 9.0 m petite Ponar Oct. 27 7 4936677, 627052 littoral 7.0 m petite Ponar Oct. 26 8 4938367, 627183 littoral 3.9 m petite Ponar Oct. 26 9 4924787, 620661 littoral 6.9 m petite Ponar Oct. 26
10 4918142, 613098 littoral 7.9 m petite Ponar Oct. 26 11 4915946, 613860 littoral 5.8 m petite Ponar Oct. 27 12 4916313, 608145 littoral 8.0 m petite Ponar Oct. 26 13 4914921, 607300 littoral 6.5 m petite Ponar Oct. 27 14 4914854, 604591 littoral 8.6 m petite Ponar Oct. 26 15 4916216, 618476 littoral 6.3 m petite Ponar Oct. 27 16 4913361, 621120 profundal 27.7 m petite Ponar Oct. 27 17 4919420, 621114 profundal 29.6 m petite Ponar Oct. 27 18 4917408, 613350 profundal 39.6 m petite Ponar Oct. 26 19 4915432, 607899 profundal 34.0 m petite Ponar Oct. 26
1 Sample depth for the littoral and profundal stations is an average of the 3 reps
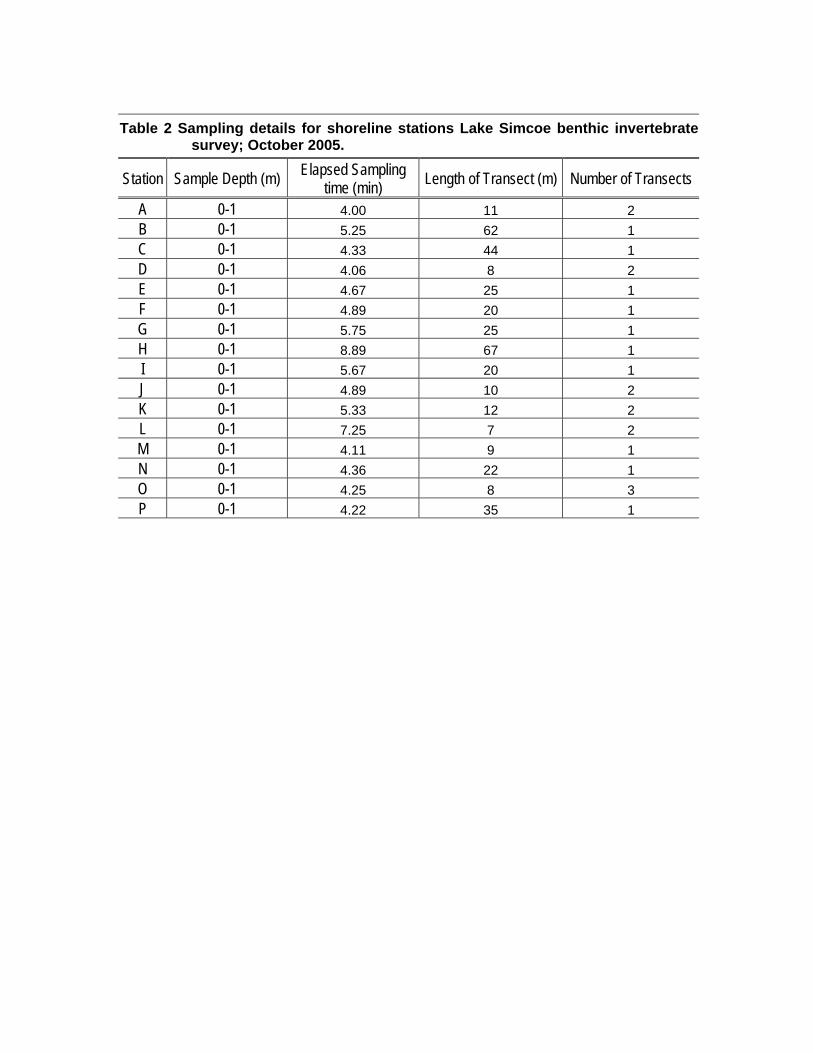
Table 2 Sampling details for shoreline stations Lake Simcoe benthic invertebrate
survey; October 2005.
Station Sample Depth (m) Elapsed Sampling time (min) Length of Transect (m) Number of Transects
A 0-1 4.00 11 2 B 0-1 5.25 62 1 C 0-1 4.33 44 1 D 0-1 4.06 8 2 E 0-1 4.67 25 1 F 0-1 4.89 20 1 G 0-1 5.75 25 1 H 0-1 8.89 67 1 I 0-1 5.67 20 1 J 0-1 4.89 10 2 K 0-1 5.33 12 2 L 0-1 7.25 7 2 M 0-1 4.11 9 1 N 0-1 4.36 22 1 O 0-1 4.25 8 3 P 0-1 4.22 35 1

Table 3 In situ water chemistry data for shoreline stations Lake Simcoe
benthic invertebrate survey; October 2005.
Station Date Temperature (°C)
Conductivity (uS/cm)
Dissolved Oxygen (mg/L) pH
Shoreline – D-net stations A 25/10/2005 10.5 388 12.0 8.2 B 25/10/2005 8.9 390 12.2 8.2 C 25/10/2005 7.0 400 12.5 8.1 D 28/10/2005 10.0 387 16.2 8.8 E 28/10/2005 10.1 396 12.5 8.3 F 28/10/2005 9.3 385 15.3 8.7 G 28/10/2005 9.1 382 16.0 8.6 H 28/10/2005 9.1 390 13.1 8.3 I 28/10/2005 9.1 393 15.3 8.5 J 28/10/2005 10.2 390 12.3 8.3 K 28/10/2005 10.9 392 11.6 8.0 L 28/10/2005 11.8 393 11.1 8.2 M 25/10/2005 11.9 404 10.3 8.1 N 25/10/2005 11.5 389 12.8 8.4 O 25/10/2005 11.5 391 12.1 8.3 P 25/10/2005 10.4 390 12.4 8.3

Table 4 In situ water chemistry data for littoral and profundal stations Lake
Simcoe benthic invertebrate survey; October 2005.
Station Date Temperature (°C)
Conductivity (uS/cm)
Dissolved Oxygen (mg/L) pH
surface bottom* surface bottom surface bottom surface bottom
Littoral – ponar stations 1 24/10/2005 11.5 11.5 389 390 16.5 11.0 8.3 8.3 2 24/10/2005 11.5 11.3 390 391 10.8 10.4 8.3 8.2 3 24/10/2005 12.4 12.4 388 388 10.7 10.4 8.2 8.3 4 27/10/2005 9.8 9.6 390 392 12.2 11.8 8.3 8.3 5 27/10/2005 10.5 10.5 389 390 11.5 11.4 8.3 8.3 6 27/10/2005 10.6 10.4 388 390 11.7 11.3 8.3 8.3 6a 27/10/2005 11.3 10.7 389 392 10.8 10.9 8.2 8.2 7 26/10/2005 11.6 11.6 389 391 11.4 10.9 8.2 8.2 8 26/10/2005 9.7 9.7 394 393 12.3 11.8 8.3 8.3 9 26/10/2005 11.9 11.9 390 391 10.2 9.9 8.2 8.2 10 26/10/2005 12.2 12.1 390 391 9.8 9.5 8.2 8.2 11 27/10/2005 12.0 11.9 390 391 10.9 10.7 8.3 8.2 12 26/10/2005 12.3 12.3 388 391 10.3 10.5 8.3 8.3 13 27/10/2005 12.1 12.0 390 392 11.2 10.8 8.3 8.3 14 26/10/2005 12.0 12.0 392 396 11.7 10.9 8.2 8.2 15 27/10/2005 11.7 11.6 390 391 11.9 10.8 8.2 8.2
Profundal – ponar stations 16 27/10/2005 11.4 11.4 389 391 11.7 10.9 8.3 8.3 17 27/10/2005 11.3 11.1 391 390 11.4 11.1 8.2 8.3 18 26/10/2005 12.1 12.1 389 391 11.2 10.3 8.2 8.2 19 26/10/2005 12.3 12.2 390 392 11.3 10.6 8.2 8.2
* bottom depth for the profundal stations is 24 m which is the maximum length of the Hydrolab cord
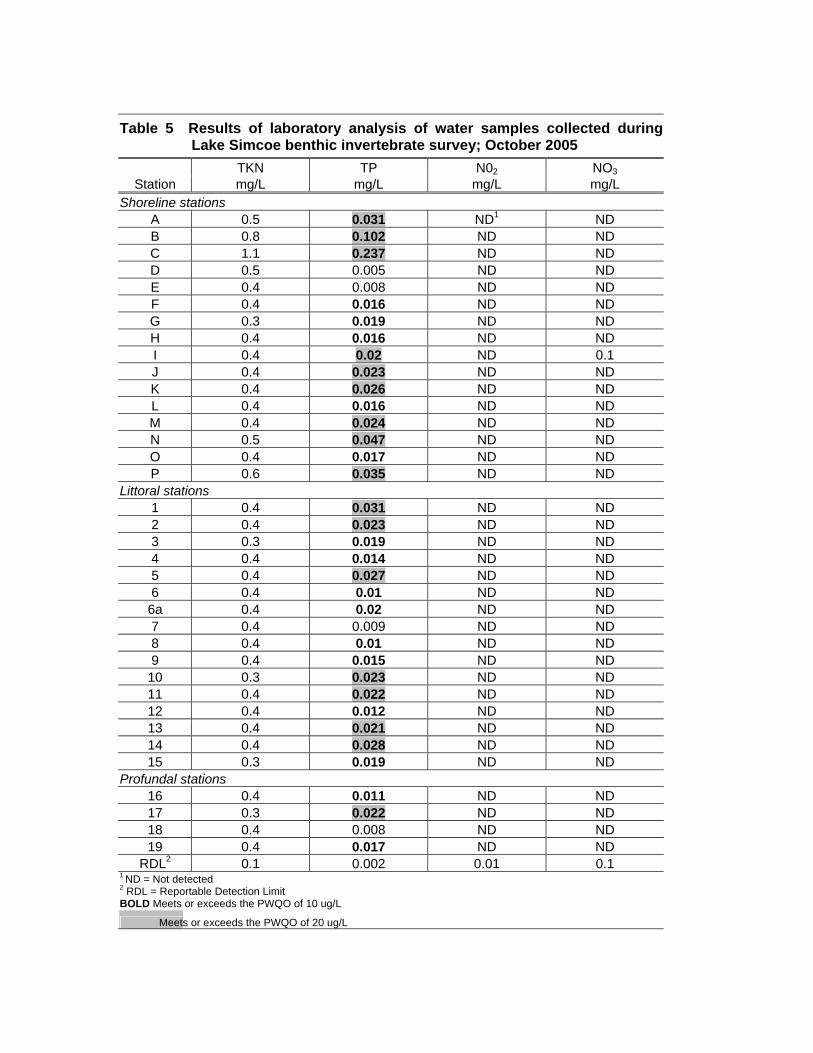
Table 5 Results of laboratory analysis of water samples collected during
Lake Simcoe benthic invertebrate survey; October 2005 TKN TP N02 NO3
Station mg/L mg/L mg/L mg/L Shoreline stations
A 0.5 0.031 ND1 ND B 0.8 0.102 ND ND C 1.1 0.237 ND ND D 0.5 0.005 ND ND E 0.4 0.008 ND ND F 0.4 0.016 ND ND G 0.3 0.019 ND ND H 0.4 0.016 ND ND I 0.4 0.02 ND 0.1 J 0.4 0.023 ND ND K 0.4 0.026 ND ND L 0.4 0.016 ND ND M 0.4 0.024 ND ND N 0.5 0.047 ND ND O 0.4 0.017 ND ND P 0.6 0.035 ND ND
Littoral stations 1 0.4 0.031 ND ND 2 0.4 0.023 ND ND 3 0.3 0.019 ND ND 4 0.4 0.014 ND ND 5 0.4 0.027 ND ND 6 0.4 0.01 ND ND 6a 0.4 0.02 ND ND 7 0.4 0.009 ND ND 8 0.4 0.01 ND ND 9 0.4 0.015 ND ND 10 0.3 0.023 ND ND 11 0.4 0.022 ND ND 12 0.4 0.012 ND ND 13 0.4 0.021 ND ND 14 0.4 0.028 ND ND 15 0.3 0.019 ND ND
Profundal stations 16 0.4 0.011 ND ND 17 0.3 0.022 ND ND 18 0.4 0.008 ND ND 19 0.4 0.017 ND ND
RDL2 0.1 0.002 0.01 0.1 1 ND = Not detected 2 RDL = Reportable Detection Limit BOLD Meets or exceeds the PWQO of 10 ug/L
Meets or exceeds the PWQO of 20 ug/L

Table 6 Substrate characteristics and grain size for all benthic sampling stations Lake Simcoe, October 2005
Gravel Sand Silt and Clay Observed Substrate Station % % % Characteristics
Shoreline stations A 4.17 94.45 1.43 Cobble, gravel, boulder and sand B 0 51.94 48.1 Sand and silt underlain with clay C 0 97.46 2.54 Sand and some silt D 15.5 83.78 0.73 Cobble, gravel, boulder and sand E 7.84 90.94 1.16 Sand, gravel and cobble
F 0.02 41.48 58.5 Sand underlain with packed clay with cobble and gravel near shore
G - - - Cobble, gravel, boulder (no sample collected) H 0 98.58 1.41 Sand with some gravel and cobble near shore I 55.1 43 2.01 Cobble, gravel, boulder and sand J 0 98.12 1.93 Cobble and gravel near shore (2m) then sand K 0 98.06 1.98 Sand L 0 99.32 0.72 Sand M 0 98.06 11.3 Sand N 59.5 39.59 0.84 Cobble, gravel, boulder and sand O 0 98.8 1.22 Cobble, gravel, boulder and sand P 0.44 97.08 2.45 Sand
Littoral stations 1 0 16.47 83.6 Silt 2 0 14.09 85.9 Silt 3 48.2 41.9 9.9 Zebra mussels, fine sand and silt 4 13.3 61.26 25.5 Sand and silt with some clay 5 2.17 15.04 82.8 Silt and clay 6 0 91.16 8.82 Sand with some gravel and zebra mussels 6a 20.3 63.71 15.9 Sand and silt 7 0.03 49.06 50.9 Silt and clay with zebra mussels 8 0 20.71 79.3 Silt 9 21.9 69.5 8.67 Sand, silt and zebra mussels 10 12.4 51.91 35.7 Sand, silt and zebra mussels 11 14.8 68.26 17 Sand, silt and zebra mussels 12 27.7 61.03 11.3 Silt and zebra mussels 13 26.5 64.11 9.41 Sand, silt and zebra mussels 14 0.08 13.04 86.9 Silt 15 24.5 72.57 2.9 Sand and zebra mussels
Profundal stations 16 0 18.48 81.5 Silt 17 0 13.11 81.5 Silt with some clay 18 0 10.53 89.5 Silt with some clay 19 0 9.21 90.8 Silt
Grain size (mm)
>4.75 0.075 - <4.75
<0.075
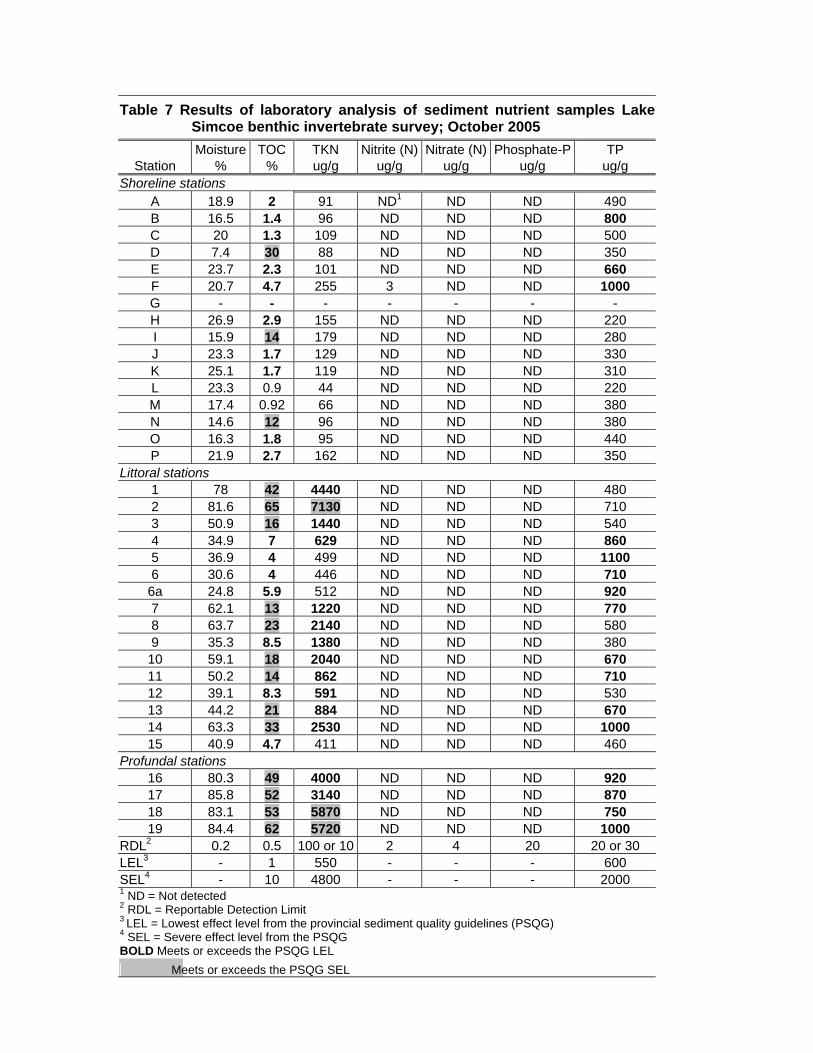
Table 7 Results of laboratory analysis of sediment nutrient samples Lake Simcoe benthic invertebrate survey; October 2005
Moisture TOC TKN Nitrite (N) Nitrate (N) Phosphate-P TP Station % % ug/g ug/g ug/g ug/g ug/g
Shoreline stations A 18.9 2 91 ND1 ND ND 490 B 16.5 1.4 96 ND ND ND 800 C 20 1.3 109 ND ND ND 500 D 7.4 30 88 ND ND ND 350 E 23.7 2.3 101 ND ND ND 660 F 20.7 4.7 255 3 ND ND 1000 G - - - - - - - H 26.9 2.9 155 ND ND ND 220 I 15.9 14 179 ND ND ND 280 J 23.3 1.7 129 ND ND ND 330 K 25.1 1.7 119 ND ND ND 310 L 23.3 0.9 44 ND ND ND 220 M 17.4 0.92 66 ND ND ND 380 N 14.6 12 96 ND ND ND 380 O 16.3 1.8 95 ND ND ND 440 P 21.9 2.7 162 ND ND ND 350
Littoral stations 1 78 42 4440 ND ND ND 480 2 81.6 65 7130 ND ND ND 710 3 50.9 16 1440 ND ND ND 540 4 34.9 7 629 ND ND ND 860 5 36.9 4 499 ND ND ND 1100 6 30.6 4 446 ND ND ND 710 6a 24.8 5.9 512 ND ND ND 920 7 62.1 13 1220 ND ND ND 770 8 63.7 23 2140 ND ND ND 580 9 35.3 8.5 1380 ND ND ND 380 10 59.1 18 2040 ND ND ND 670 11 50.2 14 862 ND ND ND 710 12 39.1 8.3 591 ND ND ND 530 13 44.2 21 884 ND ND ND 670 14 63.3 33 2530 ND ND ND 1000 15 40.9 4.7 411 ND ND ND 460
Profundal stations 16 80.3 49 4000 ND ND ND 920 17 85.8 52 3140 ND ND ND 870 18 83.1 53 5870 ND ND ND 750 19 84.4 62 5720 ND ND ND 1000
RDL2 0.2 0.5 100 or 10 2 4 20 20 or 30 LEL3 - 1 550 - - - 600 SEL4 - 10 4800 - - - 2000 1 ND = Not detected
2 RDL = Reportable Detection Limit 3 LEL = Lowest effect level from the provincial sediment quality guidelines (PSQG) 4 SEL = Severe effect level from the PSQG BOLD Meets or exceeds the PSQG LEL Meets or exceeds the PSQG SEL
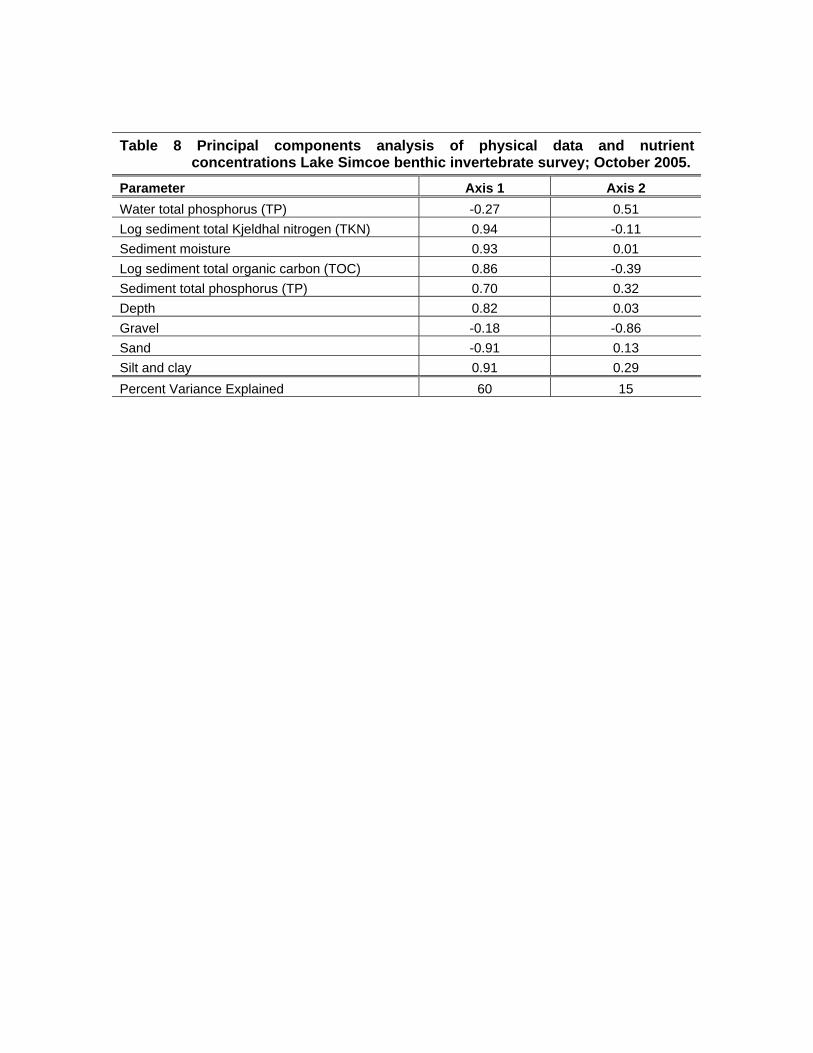
Table 8 Principal components analysis of physical data and nutrient
concentrations Lake Simcoe benthic invertebrate survey; October 2005.
Parameter Axis 1 Axis 2 Water total phosphorus (TP) -0.27 0.51 Log sediment total Kjeldhal nitrogen (TKN) 0.94 -0.11 Sediment moisture 0.93 0.01 Log sediment total organic carbon (TOC) 0.86 -0.39 Sediment total phosphorus (TP) 0.70 0.32 Depth 0.82 0.03 Gravel -0.18 -0.86 Sand -0.91 0.13 Silt and clay 0.91 0.29 Percent Variance Explained 60 15
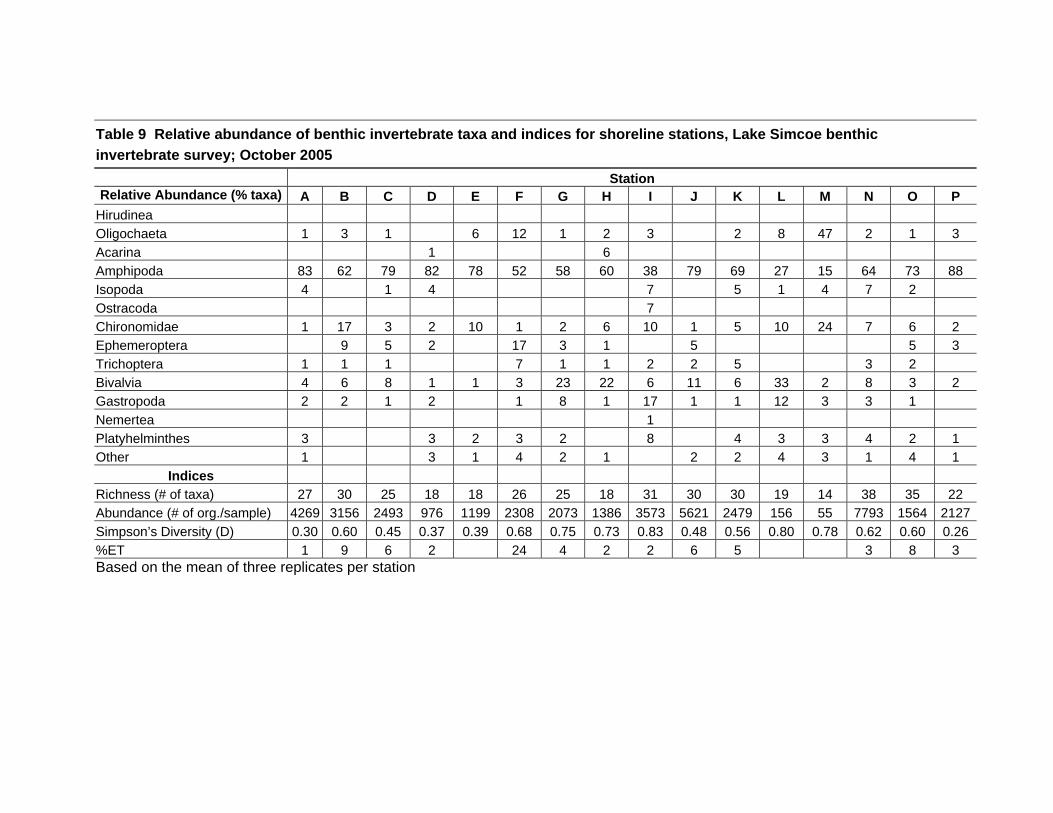
Table 9 Relative abundance of benthic invertebrate taxa and indices for shoreline stations, Lake Simcoe benthic invertebrate survey; October 2005
Station Relative Abundance (% taxa) A B C D E F G H I J K L M N O P
Hirudinea Oligochaeta 1 3 1 6 12 1 2 3 2 8 47 2 1 3 Acarina 1 6 Amphipoda 83 62 79 82 78 52 58 60 38 79 69 27 15 64 73 88 Isopoda 4 1 4 7 5 1 4 7 2 Ostracoda 7 Chironomidae 1 17 3 2 10 1 2 6 10 1 5 10 24 7 6 2 Ephemeroptera 9 5 2 17 3 1 5 5 3 Trichoptera 1 1 1 7 1 1 2 2 5 3 2 Bivalvia 4 6 8 1 1 3 23 22 6 11 6 33 2 8 3 2 Gastropoda 2 2 1 2 1 8 1 17 1 1 12 3 3 1 Nemertea 1 Platyhelminthes 3 3 2 3 2 8 4 3 3 4 2 1 Other 1 3 1 4 2 1 2 2 4 3 1 4 1
Indices Richness (# of taxa) 27 30 25 18 18 26 25 18 31 30 30 19 14 38 35 22 Abundance (# of org./sample) 4269 3156 2493 976 1199 2308 2073 1386 3573 5621 2479 156 55 7793 1564 2127Simpson’s Diversity (D) 0.30 0.60 0.45 0.37 0.39 0.68 0.75 0.73 0.83 0.48 0.56 0.80 0.78 0.62 0.60 0.26 %ET 1 9 6 2 24 4 2 2 6 5 3 8 3 Based on the mean of three replicates per station

Table 10 Relative abundance of benthic invertebrate taxa and indices for littoral stations, Lake Simcoe benthic invertebrate survey; October 2005
Station Relative Abundance (% taxa) 1 2 3 4 5 6 6A 7 8 9 10 11 12 14 15 Hirudinea <1 1 1 1 1 Oligochaeta 3 17 17 4 7 4 3 8 8 19 9 13 15 16 Acar ina Amphipoda 8 9 12 16 7 16 20 16 13 6 7 6 4 9 17 Isopoda 10 1 10 1 1 6 2 12 14 28 15 14 7 Ostracoda 21 31 22 20 2 2 0 4 1 Chironomidae 2 33 <1 50 19 14 31 14 45 6 9 24 2 3 9 Ephemeroptera 1 18 1 4 1 Trichoptera 1 1 1 Bivalvia 47 4 46 16 37 42 18 19 16 48 41 27 53 42 42 Gastropoda 3 7 14 9 14 8 6 1 3 1 Nemer tea Platyhelminthes 5 5 14 2 3 9 1 5 1 14 6 4 7 9 6 Other 1 1 1 4 Indices Richness (# of taxa) 18 9 12 17 12 18 14 19 30 20 19 23 21 22 21 Abundance (# of org./sample) 468 39 396 113 99 140 118 190 435 568 632 523 580 365 661 Simpson’s Diversity (D) 0.68 0.76 0.72 0.84 0.67 0.77 0.82 0.85 0.85 0.72 0.72 0.82 0.68 0.77 0.63 %ET 2 19 1 4 1 1 Based on the mean of three replicates per station
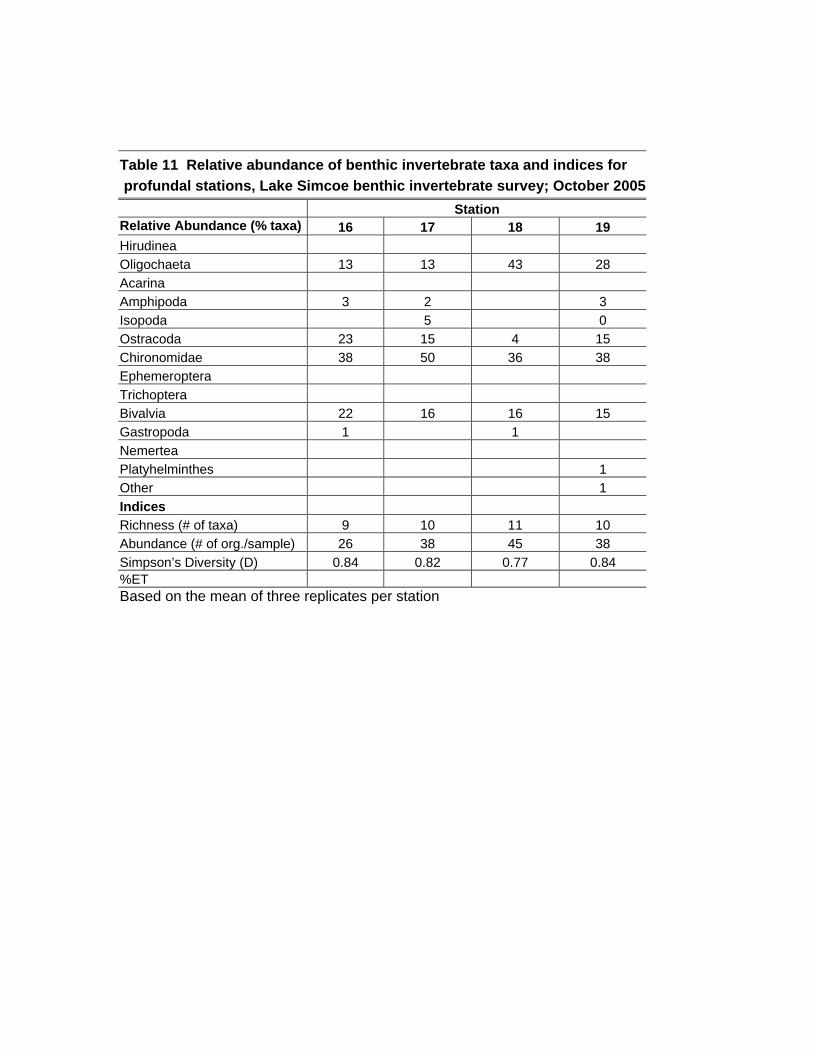
Table 11 Relative abundance of benthic invertebrate taxa and indices for profundal stations, Lake Simcoe benthic invertebrate survey; October 2005
Station Relative Abundance (% taxa) 16 17 18 19 Hirudinea Oligochaeta 13 13 43 28 Acarina Amphipoda 3 2 3 Isopoda 5 0 Ostracoda 23 15 4 15 Chironomidae 38 50 36 38 Ephemeroptera Trichoptera Bivalvia 22 16 16 15 Gastropoda 1 1 Nemertea Platyhelminthes 1 Other 1 Indices Richness (# of taxa) 9 10 11 10 Abundance (# of org./sample) 26 38 45 38 Simpson’s Diversity (D) 0.84 0.82 0.77 0.84 %ET Based on the mean of three replicates per station
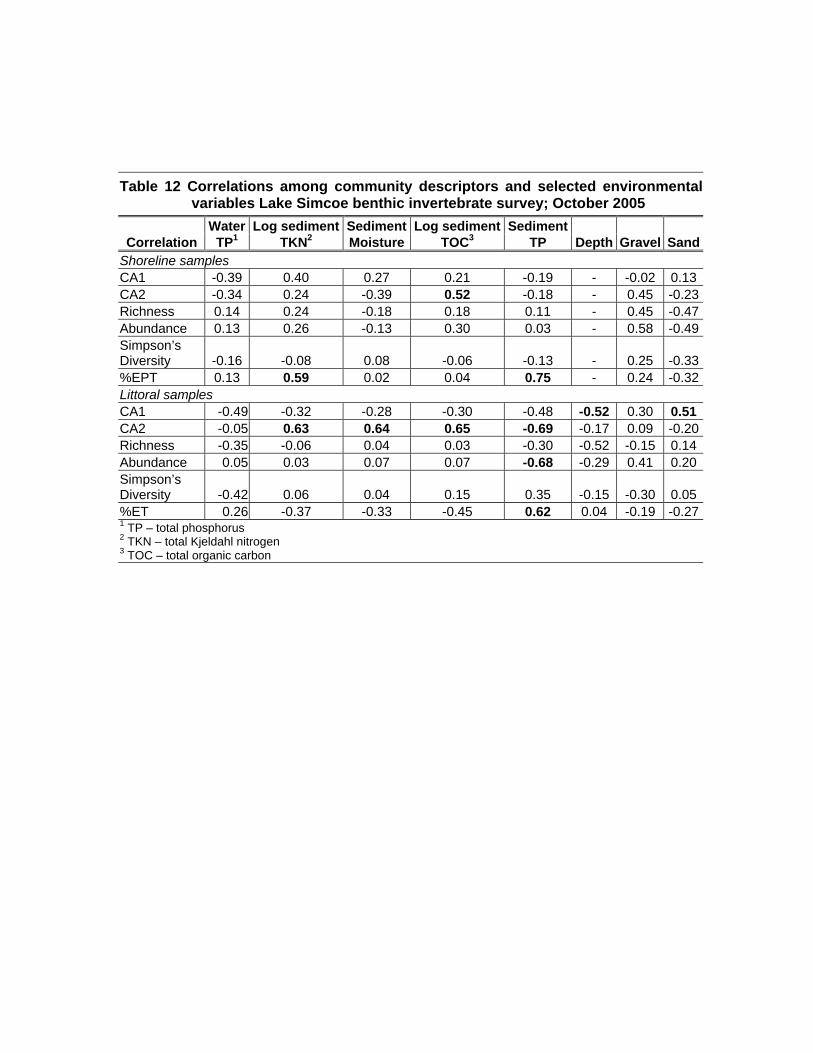
Table 12 Correlations among community descriptors and selected environmental variables Lake Simcoe benthic invertebrate survey; October 2005
Water Log sediment Sediment Log sediment Sediment Correlation TP1 TKN2 Moisture TOC3 TP Depth Gravel Sand
Shoreline samples CA1 -0.39 0.40 0.27 0.21 -0.19 - -0.02 0.13CA2 -0.34 0.24 -0.39 0.52 -0.18 - 0.45 -0.23Richness 0.14 0.24 -0.18 0.18 0.11 - 0.45 -0.47Abundance 0.13 0.26 -0.13 0.30 0.03 - 0.58 -0.49Simpson’s Diversity -0.16 -0.08 0.08 -0.06 -0.13 - 0.25 -0.33%EPT 0.13 0.59 0.02 0.04 0.75 - 0.24 -0.32Littoral samples CA1 -0.49 -0.32 -0.28 -0.30 -0.48 -0.52 0.30 0.51CA2 -0.05 0.63 0.64 0.65 -0.69 -0.17 0.09 -0.20Richness -0.35 -0.06 0.04 0.03 -0.30 -0.52 -0.15 0.14Abundance 0.05 0.03 0.07 0.07 -0.68 -0.29 0.41 0.20Simpson’s Diversity -0.42 0.06 0.04 0.15 0.35 -0.15 -0.30 0.05%ET 0.26 -0.37 -0.33 -0.45 0.62 0.04 -0.19 -0.271 TP – total phosphorus 2 TKN – total Kjeldahl nitrogen 3 TOC – total organic carbon
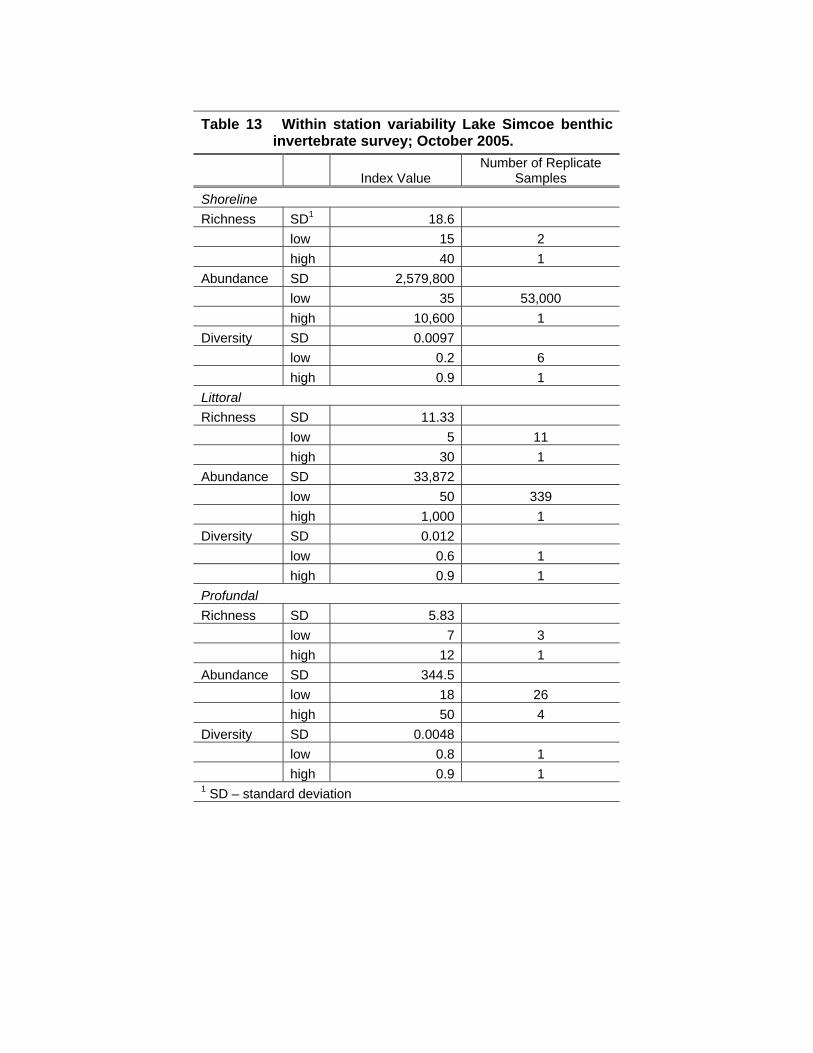
Table 13 Within station variability Lake Simcoe benthic
invertebrate survey; October 2005.
Index Value Number of Replicate
Samples Shoreline Richness SD1 18.6 low 15 2 high 40 1 Abundance SD 2,579,800 low 35 53,000 high 10,600 1 Diversity SD 0.0097 low 0.2 6 high 0.9 1 Littoral Richness SD 11.33 low 5 11 high 30 1 Abundance SD 33,872 low 50 339 high 1,000 1 Diversity SD 0.012 low 0.6 1 high 0.9 1 Profundal Richness SD 5.83 low 7 3 high 12 1 Abundance SD 344.5 low 18 26 high 50 4 Diversity SD 0.0048 low 0.8 1 high 0.9 1 1 SD – standard deviation
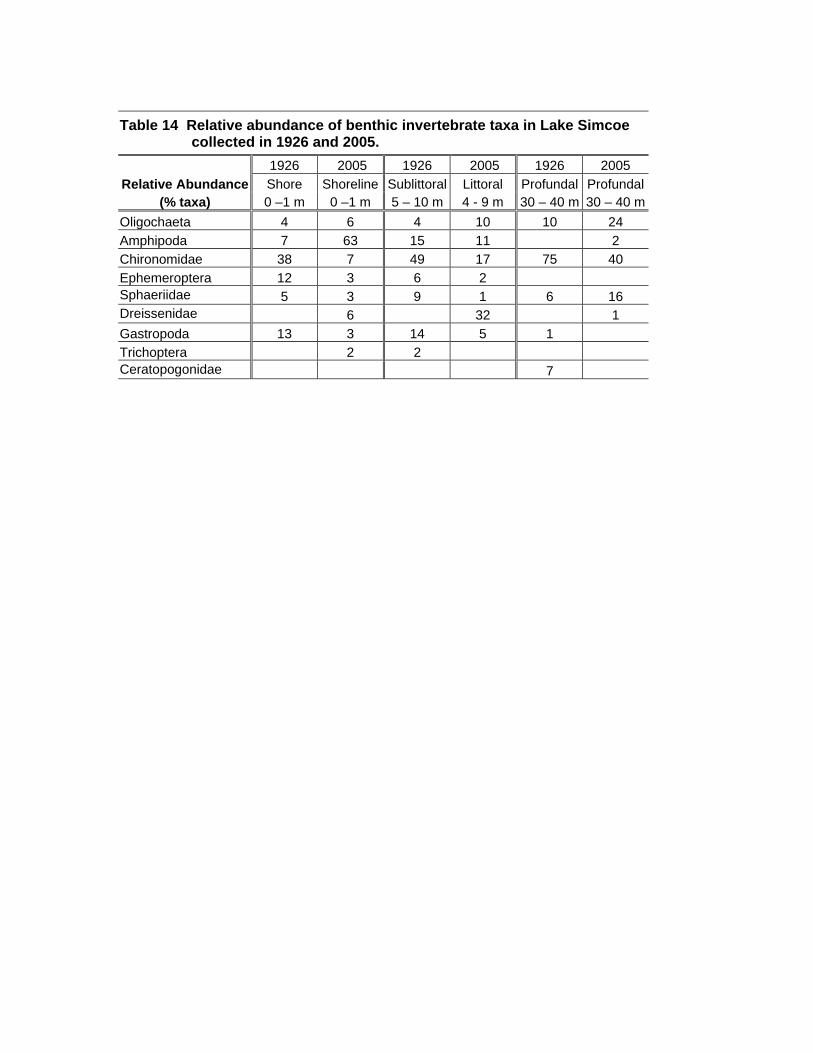
Table 14 Relative abundance of benthic invertebrate taxa in Lake Simcoe collected in 1926 and 2005.
1926 2005 1926 2005 1926 2005 Relative Abundance Shore Shoreline Sublittoral Littoral Profundal Profundal
(% taxa) 0 –1 m 0 –1 m 5 – 10 m 4 - 9 m 30 – 40 m 30 – 40 m Oligochaeta 4 6 4 10 10 24 Amphipoda 7 63 15 11 2 Chironomidae 38 7 49 17 75 40 Ephemeroptera 12 3 6 2 Sphaeriidae 5 3 9 1 6 16 Dreissenidae 6 32 1 Gastropoda 13 3 14 5 1 Trichoptera 2 2 Ceratopogonidae 7

Appendix C
Benthic Invertebrate Community
Raw Data Calculated Index Values for Each Replicate
QA/QC Data for Sorting Efficiency

Stantec, Ottawa: Lake Simcoe Benthic Invertebrate Identifications 2005 (project 160940032): Calculated Total Numbers (CTN)
Site 1 2 3 4 5 6Replicate 1 2 3 1 2 3 1 2 3 1 2 3 1 2 3 1 2 3
DATE 05.10.28 05.10.28 05.10.28 05.10.28 05.10.28 05.10.28 05.10.28 05.10.28 05.10.28 05.10.28 05.10.28 05.10.28 05.10.28 05.10.28 05.10.28 05.10.28 05.10.28 05.10.28Original % Subsampled 50 50 50 100 100 100 50 50 50 100 100 100 100 100 100 100 100 100
TAXA
ANNELIDA:HIRUDINEA:ERPOBDELLIDAE:(juvenile)GLOSSIPHONIIDAE:Alboglossiphonia heteroclita 2 2Gloiobdella elongata 2 1 2 2Helobdella stagnalis 2Helobdella triserialis
ANNELIDA:OLIGOCHAETAENCHYTRAEIDAE:LUMBRICULIDAE:Lumbriculus variegatusStylodrilus herringianusNAIDIDAE:Chaetogaster diaphanusDero furcatusNais bretscheriNais communisNais simplexNais variabilisStylaria lacustrisUncinais uncinata 3 4 1Vejdovskyella intermediaSPARGANOPHILIDAE:Sparganophilus eiseni 2 1TUBIFICIDAE:Immature Without Hairs 8 6 12 1 2 76 54 38 4 3 6 2 7 12 2Immature With HairsAulodrilus pigueti 4 2 4 2 7 30Aulodrilus plurisetaLimnodrilus hoffmeisteri 2 10 2 2 1Potamothrix vejdovskyellaPsammoryctides californianusQuistadrilus multisetosusSpirosperma ferox 2Tubifex tubifex
ACARINA:HYGROBATIDAE:HygrobatesLEBERTIIDAE:LebertiaLIMNESIIDAE:Limnesia 2PIONIDAE:
CRUSTACEAAMPHIPODA:CRANGONYCTIDAE:Crangonyx
WIlliam B. Morton2006.02.23 1
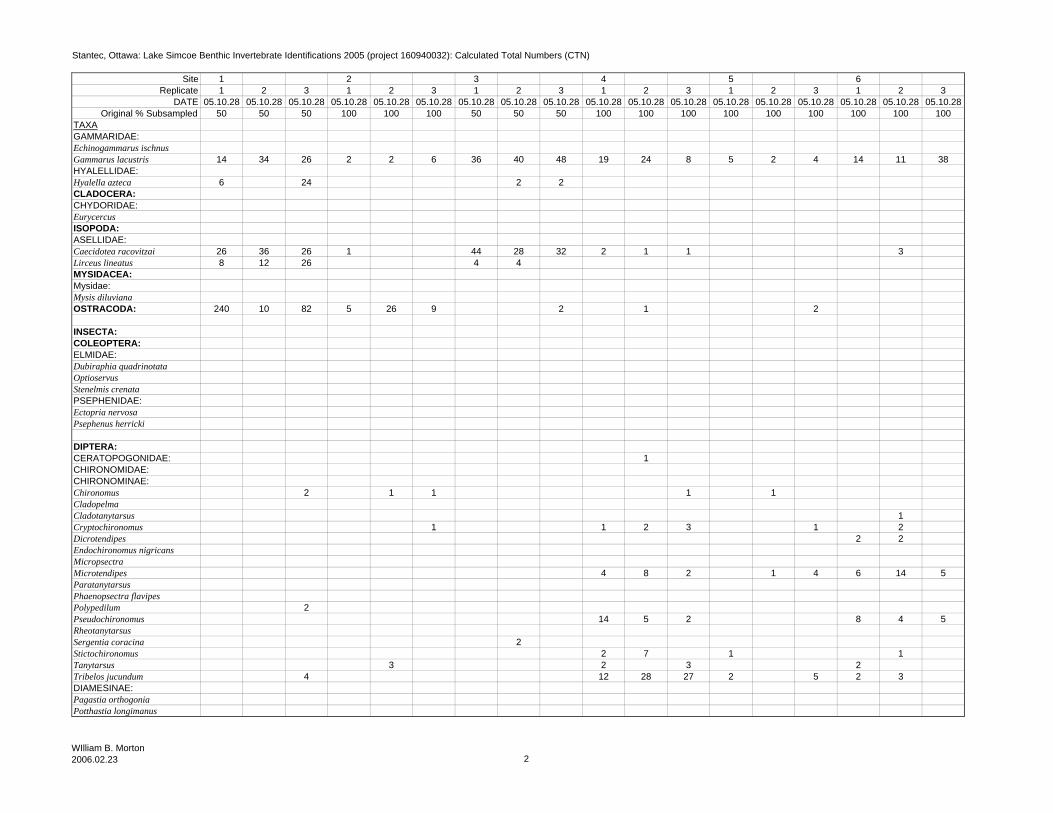
Stantec, Ottawa: Lake Simcoe Benthic Invertebrate Identifications 2005 (project 160940032): Calculated Total Numbers (CTN)
Site 1 2 3 4 5 6Replicate 1 2 3 1 2 3 1 2 3 1 2 3 1 2 3 1 2 3
DATE 05.10.28 05.10.28 05.10.28 05.10.28 05.10.28 05.10.28 05.10.28 05.10.28 05.10.28 05.10.28 05.10.28 05.10.28 05.10.28 05.10.28 05.10.28 05.10.28 05.10.28 05.10.28Original % Subsampled 50 50 50 100 100 100 50 50 50 100 100 100 100 100 100 100 100 100
TAXAGAMMARIDAE:Echinogammarus ischnusGammarus lacustris 14 34 26 2 2 6 36 40 48 19 24 8 5 2 4 14 11 38HYALELLIDAE:Hyalella azteca 6 24 2 2CLADOCERA:CHYDORIDAE:EurycercusISOPODA:ASELLIDAE:Caecidotea racovitzai 26 36 26 1 44 28 32 2 1 1 3Lirceus lineatus 8 12 26 4 4MYSIDACEA:Mysidae:Mysis diluvianaOSTRACODA: 240 10 82 5 26 9 2 1 2
INSECTA:COLEOPTERA:ELMIDAE:Dubiraphia quadrinotataOptioservusStenelmis crenataPSEPHENIDAE:Ectopria nervosaPsephenus herricki
DIPTERA:CERATOPOGONIDAE: 1CHIRONOMIDAE:CHIRONOMINAE:Chironomus 2 1 1 1 1CladopelmaCladotanytarsus 1Cryptochironomus 1 1 2 3 1 2Dicrotendipes 2 2Endochironomus nigricansMicropsectraMicrotendipes 4 8 2 1 4 6 14 5ParatanytarsusPhaenopsectra flavipesPolypedilum 2Pseudochironomus 14 5 2 8 4 5RheotanytarsusSergentia coracina 2Stictochironomus 2 7 1 1Tanytarsus 3 2 3 2Tribelos jucundum 4 12 28 27 2 5 2 3DIAMESINAE:Pagastia orthogoniaPotthastia longimanus
WIlliam B. Morton2006.02.23 2
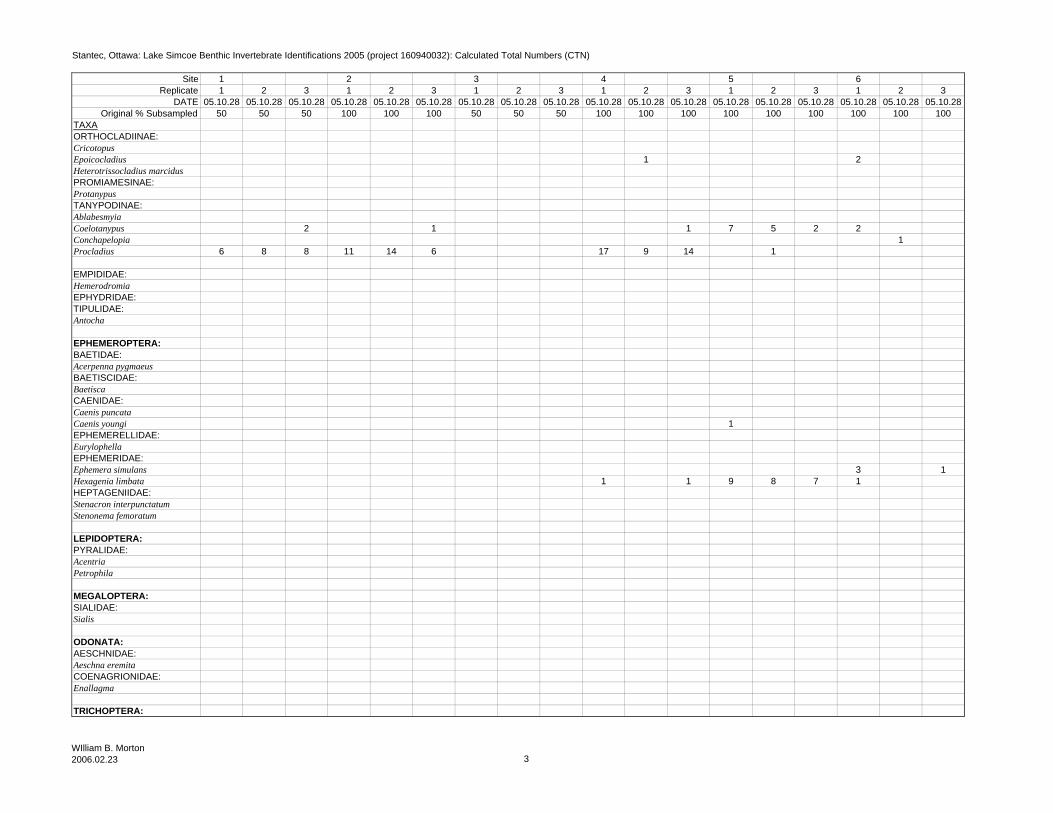
Stantec, Ottawa: Lake Simcoe Benthic Invertebrate Identifications 2005 (project 160940032): Calculated Total Numbers (CTN)
Site 1 2 3 4 5 6Replicate 1 2 3 1 2 3 1 2 3 1 2 3 1 2 3 1 2 3
DATE 05.10.28 05.10.28 05.10.28 05.10.28 05.10.28 05.10.28 05.10.28 05.10.28 05.10.28 05.10.28 05.10.28 05.10.28 05.10.28 05.10.28 05.10.28 05.10.28 05.10.28 05.10.28Original % Subsampled 50 50 50 100 100 100 50 50 50 100 100 100 100 100 100 100 100 100
TAXAORTHOCLADIINAE:CricotopusEpoicocladius 1 2Heterotrissocladius marcidusPROMIAMESINAE:ProtanypusTANYPODINAE:AblabesmyiaCoelotanypus 2 1 1 7 5 2 2Conchapelopia 1Procladius 6 8 8 11 14 6 17 9 14 1
EMPIDIDAE:HemerodromiaEPHYDRIDAE:TIPULIDAE:Antocha
EPHEMEROPTERA:BAETIDAE:Acerpenna pygmaeusBAETISCIDAE:BaetiscaCAENIDAE:Caenis puncataCaenis youngi 1EPHEMERELLIDAE:EurylophellaEPHEMERIDAE:Ephemera simulans 3 1Hexagenia limbata 1 1 9 8 7 1HEPTAGENIIDAE:Stenacron interpunctatumStenonema femoratum
LEPIDOPTERA:PYRALIDAE:AcentriaPetrophila
MEGALOPTERA:SIALIDAE:Sialis
ODONATA:AESCHNIDAE:Aeschna eremitaCOENAGRIONIDAE:Enallagma
TRICHOPTERA:
WIlliam B. Morton2006.02.23 3
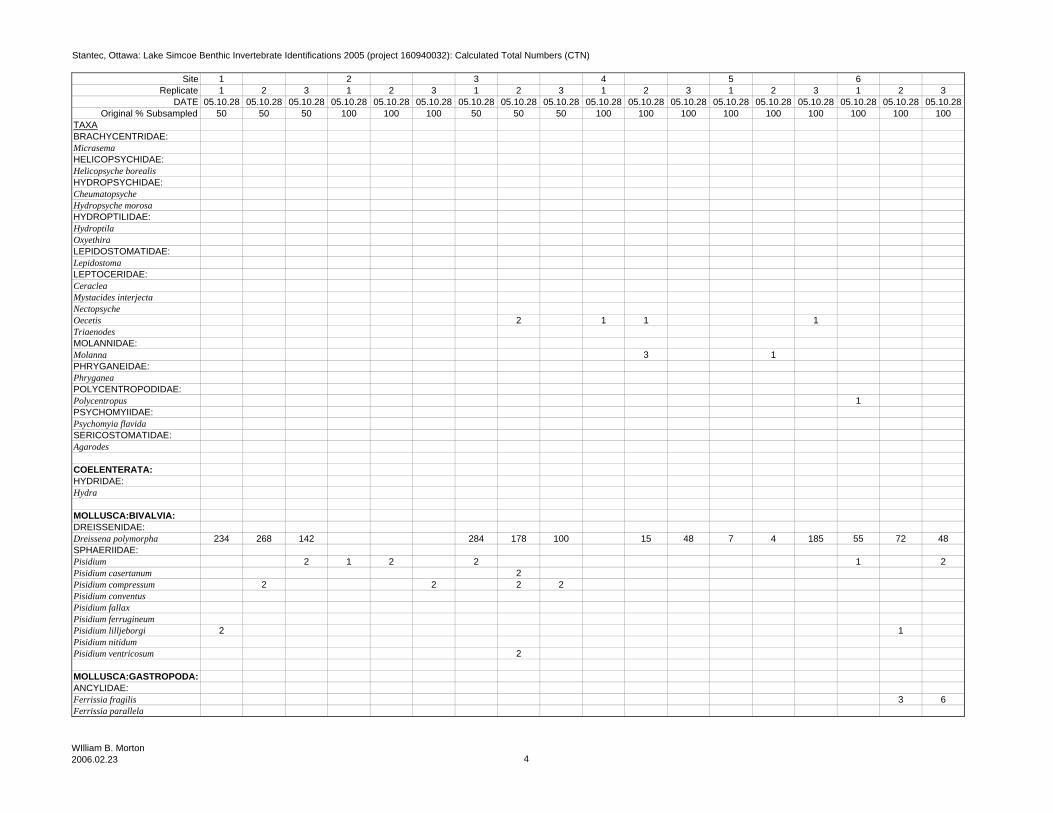
Stantec, Ottawa: Lake Simcoe Benthic Invertebrate Identifications 2005 (project 160940032): Calculated Total Numbers (CTN)
Site 1 2 3 4 5 6Replicate 1 2 3 1 2 3 1 2 3 1 2 3 1 2 3 1 2 3
DATE 05.10.28 05.10.28 05.10.28 05.10.28 05.10.28 05.10.28 05.10.28 05.10.28 05.10.28 05.10.28 05.10.28 05.10.28 05.10.28 05.10.28 05.10.28 05.10.28 05.10.28 05.10.28Original % Subsampled 50 50 50 100 100 100 50 50 50 100 100 100 100 100 100 100 100 100
TAXABRACHYCENTRIDAE:MicrasemaHELICOPSYCHIDAE:Helicopsyche borealisHYDROPSYCHIDAE:CheumatopsycheHydropsyche morosaHYDROPTILIDAE:HydroptilaOxyethiraLEPIDOSTOMATIDAE:Lepidostoma LEPTOCERIDAE:CeracleaMystacides interjectaNectopsycheOecetis 2 1 1 1TriaenodesMOLANNIDAE:Molanna 3 1PHRYGANEIDAE:PhryganeaPOLYCENTROPODIDAE:Polycentropus 1PSYCHOMYIIDAE:Psychomyia flavidaSERICOSTOMATIDAE:Agarodes
COELENTERATA:HYDRIDAE:Hydra
MOLLUSCA:BIVALVIA:DREISSENIDAE:Dreissena polymorpha 234 268 142 284 178 100 15 48 7 4 185 55 72 48SPHAERIIDAE:Pisidium 2 1 2 2 1 2Pisidium casertanum 2Pisidium compressum 2 2 2 2Pisidium conventusPisidium fallaxPisidium ferrugineumPisidium lilljeborgi 2 1Pisidium nitidumPisidium ventricosum 2
MOLLUSCA:GASTROPODA:ANCYLIDAE:Ferrissia fragilis 3 6Ferrissia parallela
WIlliam B. Morton2006.02.23 4

Stantec, Ottawa: Lake Simcoe Benthic Invertebrate Identifications 2005 (project 160940032): Calculated Total Numbers (CTN)
Site 1 2 3 4 5 6Replicate 1 2 3 1 2 3 1 2 3 1 2 3 1 2 3 1 2 3
DATE 05.10.28 05.10.28 05.10.28 05.10.28 05.10.28 05.10.28 05.10.28 05.10.28 05.10.28 05.10.28 05.10.28 05.10.28 05.10.28 05.10.28 05.10.28 05.10.28 05.10.28 05.10.28Original % Subsampled 50 50 50 100 100 100 50 50 50 100 100 100 100 100 100 100 100 100
TAXAHYDROBIIDAE:Amnicola limosa 2 4 3 10 4 1 1 8 6 4Amnicola walkeri 8 2LUMNAEIDAE:Fossaria exiguaPHYSIDAE:Physella gyrina 1PLANORBIDAE:Armiger cristaGyraulus circumstriatusGyraulus parvus 10 2 2Helisoma anceps 4Promenetus exacuous 2 2 2PLEUROCERCIDAE:Pleurocerca acuta 1 1VALVATIDAE:Valvata lewisiValvata sincera 8 5 7Valvata tricarinata 14 1 8
NEMATODA: 2 1
NEMERTEA:Prostoma
PLATYHELMINTHES:PLAGIOSTOMATIDAE:Hydrolimax griseus 6 8 14 3 1 2 8 2 1 1 2 1 2 2 3PLANARIIDAE: 2 14 14 40 56 52 3 1 19 9 4
Total number of taxa 18 15 20 7 9 11 10 17 10 14 18 18 9 11 16 21 20 12Total number of specimens 588 408 408 27 52 38 520 388 280 84 123 132 41 31 226 148 154 119
Taxa in 100% of sampleDECAOPODA:CAMBARIDAE:Orconectes propinquusOrconectes virilisEPHEMEROPTERA:Ephemera simulans
Introduced zooplanktonfor "presence" purposesBythotrephes longimanus 1 1 1
WIlliam B. Morton2006.02.23 5

Stantec, Ottawa: Lake Simcoe Benthic Invertebrate Identifications 2005 (project 160940032): Calculated Total Numbers (CTN)
SiteReplicate
DATEOriginal % Subsampled
TAXA
ANNELIDA:HIRUDINEA:ERPOBDELLIDAE:(juvenile)GLOSSIPHONIIDAE:Alboglossiphonia heteroclitaGloiobdella elongataHelobdella stagnalisHelobdella triserialis
ANNELIDA:OLIGOCHAETAENCHYTRAEIDAE:LUMBRICULIDAE:Lumbriculus variegatusStylodrilus herringianusNAIDIDAE:Chaetogaster diaphanusDero furcatusNais bretscheriNais communisNais simplexNais variabilisStylaria lacustrisUncinais uncinataVejdovskyella intermediaSPARGANOPHILIDAE:Sparganophilus eiseniTUBIFICIDAE:Immature Without HairsImmature With HairsAulodrilus piguetiAulodrilus plurisetaLimnodrilus hoffmeisteriPotamothrix vejdovskyellaPsammoryctides californianusQuistadrilus multisetosusSpirosperma feroxTubifex tubifex
ACARINA:HYGROBATIDAE:HygrobatesLEBERTIIDAE:LebertiaLIMNESIIDAE:LimnesiaPIONIDAE:
CRUSTACEAAMPHIPODA:CRANGONYCTIDAE:Crangonyx
6A 7 8 9 10 111 2 3 1 2 3 1 2 3 1 2 3 1 2 3 1 2 3
05.10.28 05.10.28 05.10.28 05.10.28 05.10.28 05.10.28 05.10.28 05.10.28 05.10.28 05.10.28 05.10.28 05.10.28 05.10.28 05.10.28 05.10.28 05.10.28 05.10.28 05.10.28100 100 100 100 100 100 100 100 100 100 100 100 100 100 100 100 100 100
1 2 1 2 2 31
12
1
1
2 5 10
1
4 6 2 4 7 5 12 58 30 56 9 45 193 24 23 49 2310 22 10
3 1 1 1 6 1
1 10 4 3 3 38 5 20 86 10
2
1
2 1 1 1 2 1 2 11 2
WIlliam B. Morton2006.02.23 6
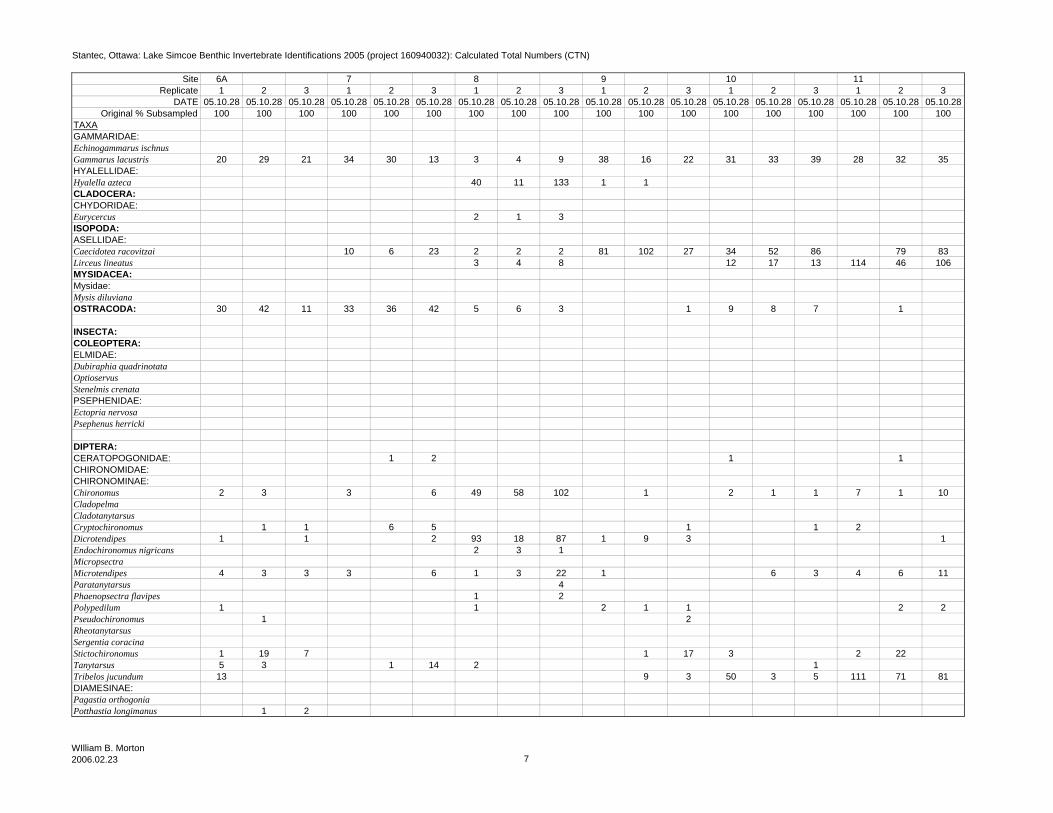
Stantec, Ottawa: Lake Simcoe Benthic Invertebrate Identifications 2005 (project 160940032): Calculated Total Numbers (CTN)
SiteReplicate
DATEOriginal % Subsampled
TAXAGAMMARIDAE:Echinogammarus ischnusGammarus lacustrisHYALELLIDAE:Hyalella aztecaCLADOCERA:CHYDORIDAE:EurycercusISOPODA:ASELLIDAE:Caecidotea racovitzaiLirceus lineatusMYSIDACEA:Mysidae:Mysis diluvianaOSTRACODA:
INSECTA:COLEOPTERA:ELMIDAE:Dubiraphia quadrinotataOptioservusStenelmis crenataPSEPHENIDAE:Ectopria nervosaPsephenus herricki
DIPTERA:CERATOPOGONIDAE:CHIRONOMIDAE:CHIRONOMINAE:ChironomusCladopelmaCladotanytarsusCryptochironomusDicrotendipesEndochironomus nigricansMicropsectraMicrotendipesParatanytarsusPhaenopsectra flavipesPolypedilumPseudochironomusRheotanytarsusSergentia coracinaStictochironomusTanytarsusTribelos jucundumDIAMESINAE:Pagastia orthogoniaPotthastia longimanus
6A 7 8 9 10 111 2 3 1 2 3 1 2 3 1 2 3 1 2 3 1 2 3
05.10.28 05.10.28 05.10.28 05.10.28 05.10.28 05.10.28 05.10.28 05.10.28 05.10.28 05.10.28 05.10.28 05.10.28 05.10.28 05.10.28 05.10.28 05.10.28 05.10.28 05.10.28100 100 100 100 100 100 100 100 100 100 100 100 100 100 100 100 100 100
20 29 21 34 30 13 3 4 9 38 16 22 31 33 39 28 32 35
40 11 133 1 1
2 1 3
10 6 23 2 2 2 81 102 27 34 52 86 79 833 4 8 12 17 13 114 46 106
30 42 11 33 36 42 5 6 3 1 9 8 7 1
1 2 1 1
2 3 3 6 49 58 102 1 2 1 1 7 1 10
1 1 6 5 1 1 21 1 2 93 18 87 1 9 3 1
2 3 1
4 3 3 3 6 1 3 22 1 6 3 4 6 114
1 21 1 2 1 1 2 2
1 2
1 19 7 1 17 3 2 225 3 1 14 2 113 9 3 50 3 5 111 71 81
1 2
WIlliam B. Morton2006.02.23 7

Stantec, Ottawa: Lake Simcoe Benthic Invertebrate Identifications 2005 (project 160940032): Calculated Total Numbers (CTN)
SiteReplicate
DATEOriginal % Subsampled
TAXAORTHOCLADIINAE:CricotopusEpoicocladiusHeterotrissocladius marcidusPROMIAMESINAE:ProtanypusTANYPODINAE:AblabesmyiaCoelotanypusConchapelopiaProcladius
EMPIDIDAE:HemerodromiaEPHYDRIDAE:TIPULIDAE:Antocha
EPHEMEROPTERA:BAETIDAE:Acerpenna pygmaeusBAETISCIDAE:BaetiscaCAENIDAE:Caenis puncataCaenis youngiEPHEMERELLIDAE:EurylophellaEPHEMERIDAE:Ephemera simulansHexagenia limbataHEPTAGENIIDAE:Stenacron interpunctatumStenonema femoratum
LEPIDOPTERA:PYRALIDAE:AcentriaPetrophila
MEGALOPTERA:SIALIDAE:Sialis
ODONATA:AESCHNIDAE:Aeschna eremitaCOENAGRIONIDAE:Enallagma
TRICHOPTERA:
6A 7 8 9 10 111 2 3 1 2 3 1 2 3 1 2 3 1 2 3 1 2 3
05.10.28 05.10.28 05.10.28 05.10.28 05.10.28 05.10.28 05.10.28 05.10.28 05.10.28 05.10.28 05.10.28 05.10.28 05.10.28 05.10.28 05.10.28 05.10.28 05.10.28 05.10.28100 100 100 100 100 100 100 100 100 100 100 100 100 100 100 100 100 100
1 1 31 1 47 1 1 1 2
2 1 314 17 8 11 7 23 1 8 2 3 8 10 5 12 6
1 14
14 7 1 1 3 1
1 1 4
WIlliam B. Morton2006.02.23 8

Stantec, Ottawa: Lake Simcoe Benthic Invertebrate Identifications 2005 (project 160940032): Calculated Total Numbers (CTN)
SiteReplicate
DATEOriginal % Subsampled
TAXABRACHYCENTRIDAE:MicrasemaHELICOPSYCHIDAE:Helicopsyche borealisHYDROPSYCHIDAE:CheumatopsycheHydropsyche morosaHYDROPTILIDAE:HydroptilaOxyethiraLEPIDOSTOMATIDAE:Lepidostoma LEPTOCERIDAE:CeracleaMystacides interjectaNectopsycheOecetisTriaenodesMOLANNIDAE:MolannaPHRYGANEIDAE:PhryganeaPOLYCENTROPODIDAE:PolycentropusPSYCHOMYIIDAE:Psychomyia flavidaSERICOSTOMATIDAE:Agarodes
COELENTERATA:HYDRIDAE:Hydra
MOLLUSCA:BIVALVIA:DREISSENIDAE:Dreissena polymorphaSPHAERIIDAE:PisidiumPisidium casertanumPisidium compressumPisidium conventusPisidium fallaxPisidium ferrugineumPisidium lilljeborgiPisidium nitidumPisidium ventricosum
MOLLUSCA:GASTROPODA:ANCYLIDAE:Ferrissia fragilisFerrissia parallela
6A 7 8 9 10 111 2 3 1 2 3 1 2 3 1 2 3 1 2 3 1 2 3
05.10.28 05.10.28 05.10.28 05.10.28 05.10.28 05.10.28 05.10.28 05.10.28 05.10.28 05.10.28 05.10.28 05.10.28 05.10.28 05.10.28 05.10.28 05.10.28 05.10.28 05.10.28100 100 100 100 100 100 100 100 100 100 100 100 100 100 100 100 100 100
11
1
2 2 3 1 1 2 1 11 1
1
1
1
1 4 3 2 1 1 4
23 33 15 14 99 77 13 158 451 351 79 30 552 356 90 215 134
1
1
WIlliam B. Morton2006.02.23 9
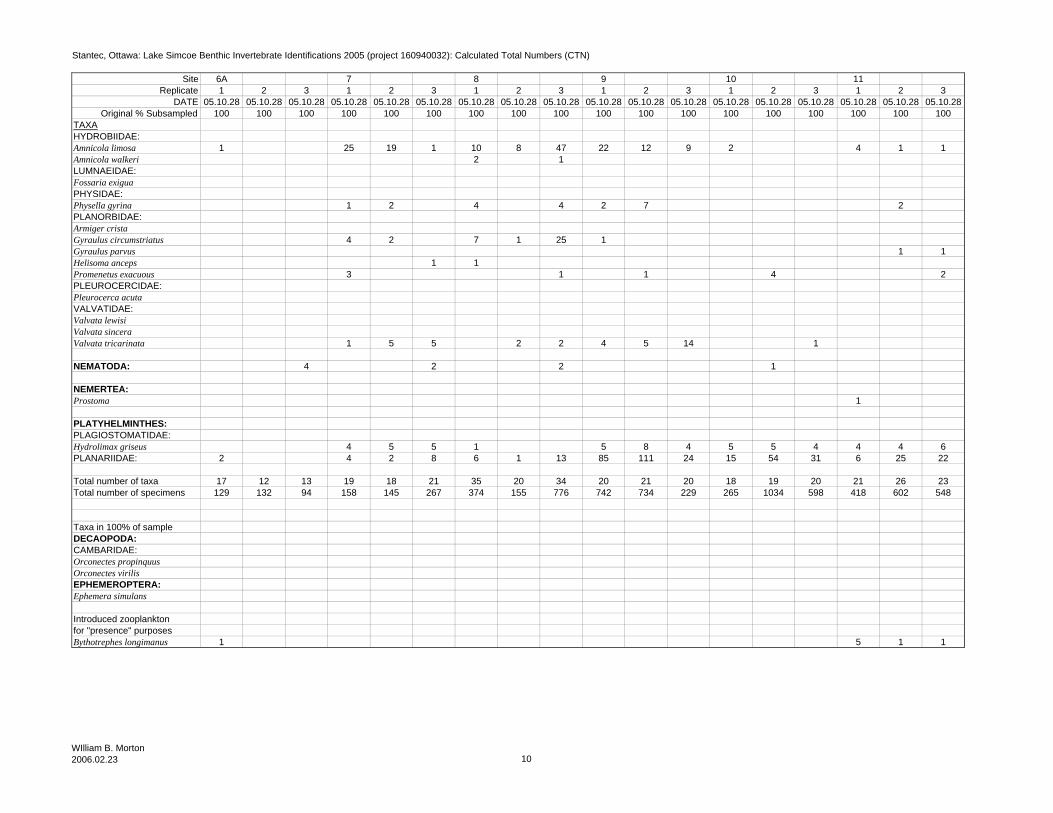
Stantec, Ottawa: Lake Simcoe Benthic Invertebrate Identifications 2005 (project 160940032): Calculated Total Numbers (CTN)
SiteReplicate
DATEOriginal % Subsampled
TAXAHYDROBIIDAE:Amnicola limosaAmnicola walkeriLUMNAEIDAE:Fossaria exiguaPHYSIDAE:Physella gyrinaPLANORBIDAE:Armiger cristaGyraulus circumstriatusGyraulus parvusHelisoma ancepsPromenetus exacuousPLEUROCERCIDAE:Pleurocerca acutaVALVATIDAE:Valvata lewisiValvata sinceraValvata tricarinata
NEMATODA:
NEMERTEA:Prostoma
PLATYHELMINTHES:PLAGIOSTOMATIDAE:Hydrolimax griseusPLANARIIDAE:
Total number of taxaTotal number of specimens
Taxa in 100% of sampleDECAOPODA:CAMBARIDAE:Orconectes propinquusOrconectes virilisEPHEMEROPTERA:Ephemera simulans
Introduced zooplanktonfor "presence" purposesBythotrephes longimanus
6A 7 8 9 10 111 2 3 1 2 3 1 2 3 1 2 3 1 2 3 1 2 3
05.10.28 05.10.28 05.10.28 05.10.28 05.10.28 05.10.28 05.10.28 05.10.28 05.10.28 05.10.28 05.10.28 05.10.28 05.10.28 05.10.28 05.10.28 05.10.28 05.10.28 05.10.28100 100 100 100 100 100 100 100 100 100 100 100 100 100 100 100 100 100
1 25 19 1 10 8 47 22 12 9 2 4 1 12 1
1 2 4 4 2 7 2
4 2 7 1 25 11 1
1 13 1 1 4 2
1 5 5 2 2 4 5 14 1
4 2 2 1
1
4 5 5 1 5 8 4 5 5 4 4 4 62 4 2 8 6 1 13 85 111 24 15 54 31 6 25 22
17 12 13 19 18 21 35 20 34 20 21 20 18 19 20 21 26 23129 132 94 158 145 267 374 155 776 742 734 229 265 1034 598 418 602 548
1 5 1 1
WIlliam B. Morton2006.02.23 10
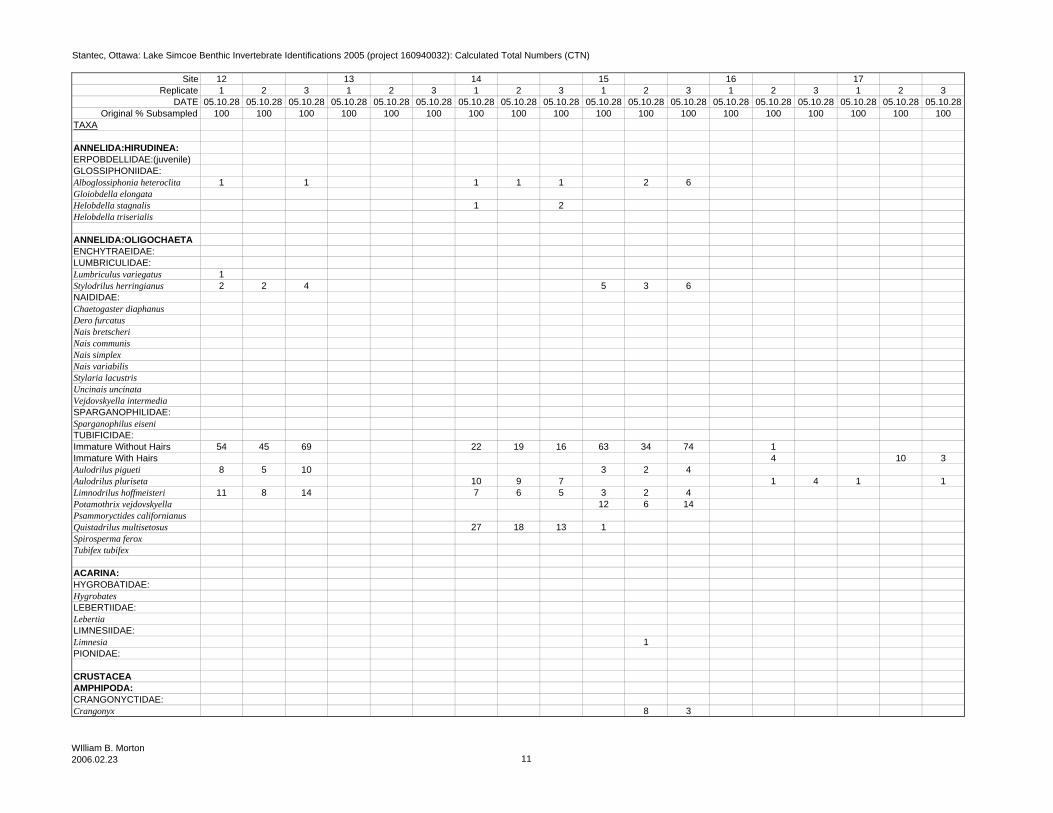
Stantec, Ottawa: Lake Simcoe Benthic Invertebrate Identifications 2005 (project 160940032): Calculated Total Numbers (CTN)
SiteReplicate
DATEOriginal % Subsampled
TAXA
ANNELIDA:HIRUDINEA:ERPOBDELLIDAE:(juvenile)GLOSSIPHONIIDAE:Alboglossiphonia heteroclitaGloiobdella elongataHelobdella stagnalisHelobdella triserialis
ANNELIDA:OLIGOCHAETAENCHYTRAEIDAE:LUMBRICULIDAE:Lumbriculus variegatusStylodrilus herringianusNAIDIDAE:Chaetogaster diaphanusDero furcatusNais bretscheriNais communisNais simplexNais variabilisStylaria lacustrisUncinais uncinataVejdovskyella intermediaSPARGANOPHILIDAE:Sparganophilus eiseniTUBIFICIDAE:Immature Without HairsImmature With HairsAulodrilus piguetiAulodrilus plurisetaLimnodrilus hoffmeisteriPotamothrix vejdovskyellaPsammoryctides californianusQuistadrilus multisetosusSpirosperma feroxTubifex tubifex
ACARINA:HYGROBATIDAE:HygrobatesLEBERTIIDAE:LebertiaLIMNESIIDAE:LimnesiaPIONIDAE:
CRUSTACEAAMPHIPODA:CRANGONYCTIDAE:Crangonyx
12 13 14 15 16 171 2 3 1 2 3 1 2 3 1 2 3 1 2 3 1 2 3
05.10.28 05.10.28 05.10.28 05.10.28 05.10.28 05.10.28 05.10.28 05.10.28 05.10.28 05.10.28 05.10.28 05.10.28 05.10.28 05.10.28 05.10.28 05.10.28 05.10.28 05.10.28100 100 100 100 100 100 100 100 100 100 100 100 100 100 100 100 100 100
1 1 1 1 1 2 6
1 2
12 2 4 5 3 6
54 45 69 22 19 16 63 34 74 14 10 3
8 5 10 3 2 410 9 7 1 4 1 1
11 8 14 7 6 5 3 2 412 6 14
27 18 13 1
1
8 3
WIlliam B. Morton2006.02.23 11
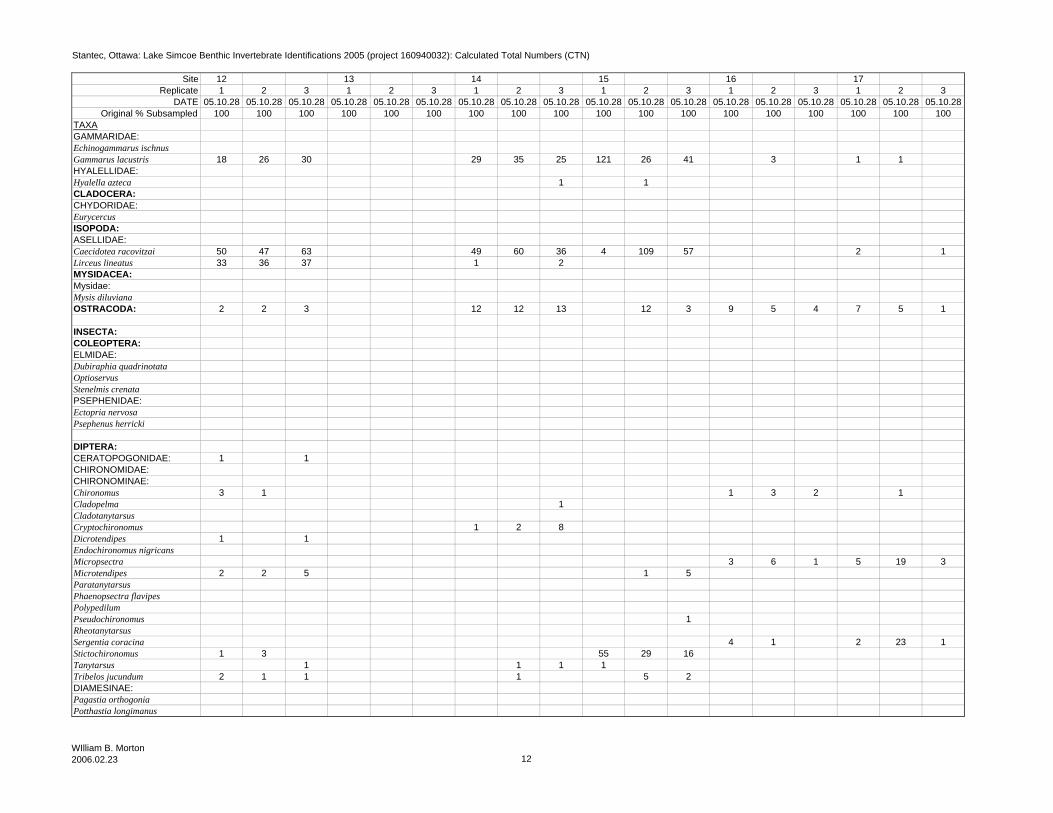
Stantec, Ottawa: Lake Simcoe Benthic Invertebrate Identifications 2005 (project 160940032): Calculated Total Numbers (CTN)
SiteReplicate
DATEOriginal % Subsampled
TAXAGAMMARIDAE:Echinogammarus ischnusGammarus lacustrisHYALELLIDAE:Hyalella aztecaCLADOCERA:CHYDORIDAE:EurycercusISOPODA:ASELLIDAE:Caecidotea racovitzaiLirceus lineatusMYSIDACEA:Mysidae:Mysis diluvianaOSTRACODA:
INSECTA:COLEOPTERA:ELMIDAE:Dubiraphia quadrinotataOptioservusStenelmis crenataPSEPHENIDAE:Ectopria nervosaPsephenus herricki
DIPTERA:CERATOPOGONIDAE:CHIRONOMIDAE:CHIRONOMINAE:ChironomusCladopelmaCladotanytarsusCryptochironomusDicrotendipesEndochironomus nigricansMicropsectraMicrotendipesParatanytarsusPhaenopsectra flavipesPolypedilumPseudochironomusRheotanytarsusSergentia coracinaStictochironomusTanytarsusTribelos jucundumDIAMESINAE:Pagastia orthogoniaPotthastia longimanus
12 13 14 15 16 171 2 3 1 2 3 1 2 3 1 2 3 1 2 3 1 2 3
05.10.28 05.10.28 05.10.28 05.10.28 05.10.28 05.10.28 05.10.28 05.10.28 05.10.28 05.10.28 05.10.28 05.10.28 05.10.28 05.10.28 05.10.28 05.10.28 05.10.28 05.10.28100 100 100 100 100 100 100 100 100 100 100 100 100 100 100 100 100 100
18 26 30 29 35 25 121 26 41 3 1 1
1 1
50 47 63 49 60 36 4 109 57 2 133 36 37 1 2
2 2 3 12 12 13 12 3 9 5 4 7 5 1
1 1
3 1 1 3 2 11
1 2 81 1
3 6 1 5 19 32 2 5 1 5
1
4 1 2 23 11 3 55 29 16
1 1 1 12 1 1 1 5 2
WIlliam B. Morton2006.02.23 12
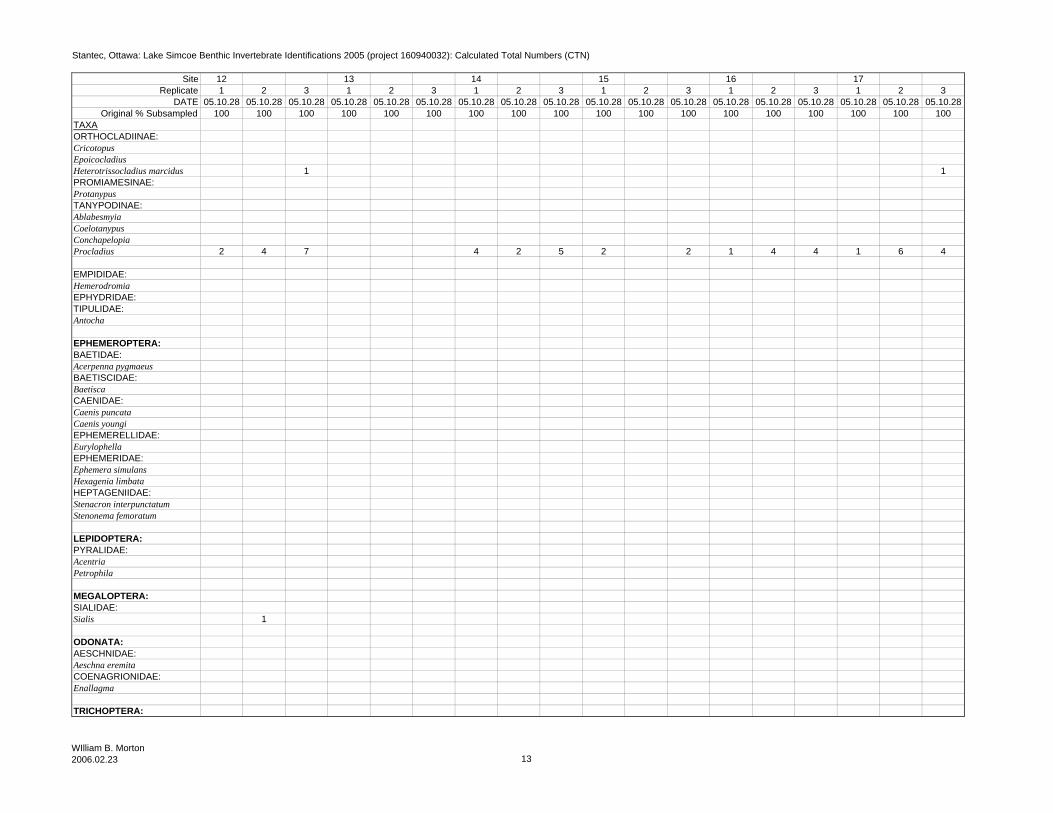
Stantec, Ottawa: Lake Simcoe Benthic Invertebrate Identifications 2005 (project 160940032): Calculated Total Numbers (CTN)
SiteReplicate
DATEOriginal % Subsampled
TAXAORTHOCLADIINAE:CricotopusEpoicocladiusHeterotrissocladius marcidusPROMIAMESINAE:ProtanypusTANYPODINAE:AblabesmyiaCoelotanypusConchapelopiaProcladius
EMPIDIDAE:HemerodromiaEPHYDRIDAE:TIPULIDAE:Antocha
EPHEMEROPTERA:BAETIDAE:Acerpenna pygmaeusBAETISCIDAE:BaetiscaCAENIDAE:Caenis puncataCaenis youngiEPHEMERELLIDAE:EurylophellaEPHEMERIDAE:Ephemera simulansHexagenia limbataHEPTAGENIIDAE:Stenacron interpunctatumStenonema femoratum
LEPIDOPTERA:PYRALIDAE:AcentriaPetrophila
MEGALOPTERA:SIALIDAE:Sialis
ODONATA:AESCHNIDAE:Aeschna eremitaCOENAGRIONIDAE:Enallagma
TRICHOPTERA:
12 13 14 15 16 171 2 3 1 2 3 1 2 3 1 2 3 1 2 3 1 2 3
05.10.28 05.10.28 05.10.28 05.10.28 05.10.28 05.10.28 05.10.28 05.10.28 05.10.28 05.10.28 05.10.28 05.10.28 05.10.28 05.10.28 05.10.28 05.10.28 05.10.28 05.10.28100 100 100 100 100 100 100 100 100 100 100 100 100 100 100 100 100 100
1 1
2 4 7 4 2 5 2 2 1 4 4 1 6 4
1
WIlliam B. Morton2006.02.23 13
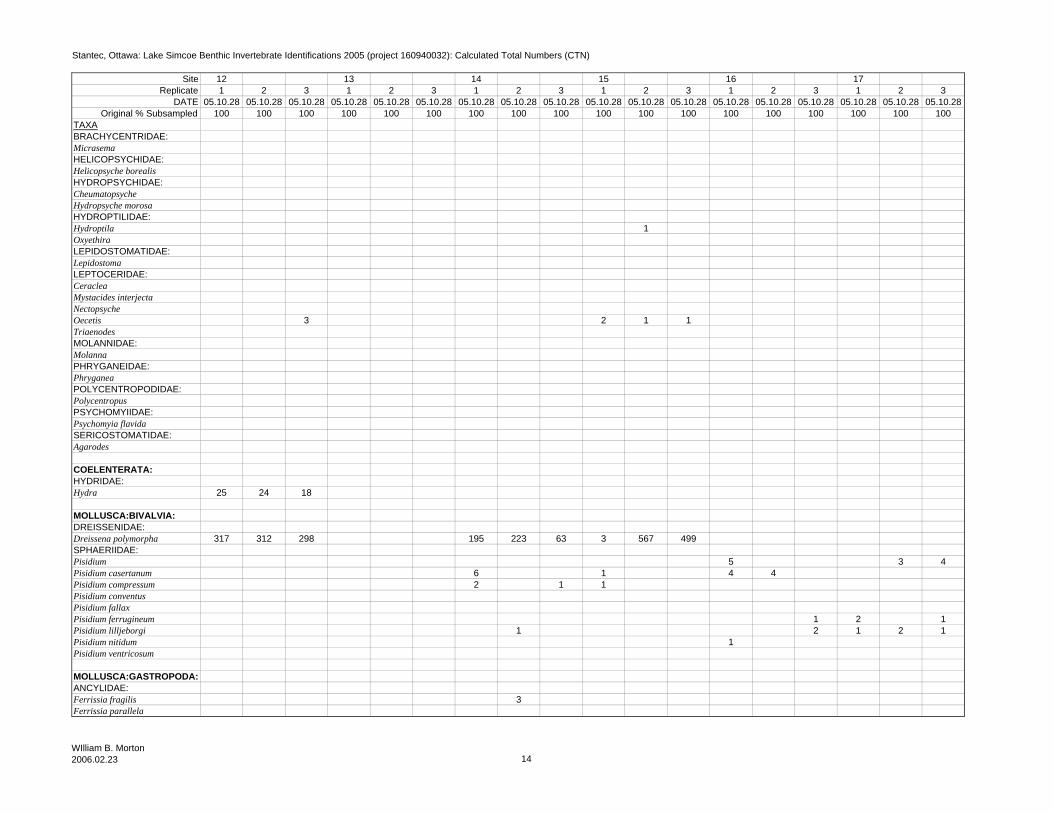
Stantec, Ottawa: Lake Simcoe Benthic Invertebrate Identifications 2005 (project 160940032): Calculated Total Numbers (CTN)
SiteReplicate
DATEOriginal % Subsampled
TAXABRACHYCENTRIDAE:MicrasemaHELICOPSYCHIDAE:Helicopsyche borealisHYDROPSYCHIDAE:CheumatopsycheHydropsyche morosaHYDROPTILIDAE:HydroptilaOxyethiraLEPIDOSTOMATIDAE:Lepidostoma LEPTOCERIDAE:CeracleaMystacides interjectaNectopsycheOecetisTriaenodesMOLANNIDAE:MolannaPHRYGANEIDAE:PhryganeaPOLYCENTROPODIDAE:PolycentropusPSYCHOMYIIDAE:Psychomyia flavidaSERICOSTOMATIDAE:Agarodes
COELENTERATA:HYDRIDAE:Hydra
MOLLUSCA:BIVALVIA:DREISSENIDAE:Dreissena polymorphaSPHAERIIDAE:PisidiumPisidium casertanumPisidium compressumPisidium conventusPisidium fallaxPisidium ferrugineumPisidium lilljeborgiPisidium nitidumPisidium ventricosum
MOLLUSCA:GASTROPODA:ANCYLIDAE:Ferrissia fragilisFerrissia parallela
12 13 14 15 16 171 2 3 1 2 3 1 2 3 1 2 3 1 2 3 1 2 3
05.10.28 05.10.28 05.10.28 05.10.28 05.10.28 05.10.28 05.10.28 05.10.28 05.10.28 05.10.28 05.10.28 05.10.28 05.10.28 05.10.28 05.10.28 05.10.28 05.10.28 05.10.28100 100 100 100 100 100 100 100 100 100 100 100 100 100 100 100 100 100
1
3 2 1 1
25 24 18
317 312 298 195 223 63 3 567 499
5 3 46 1 4 42 1 1
1 2 11 2 1 2 1
1
3
WIlliam B. Morton2006.02.23 14
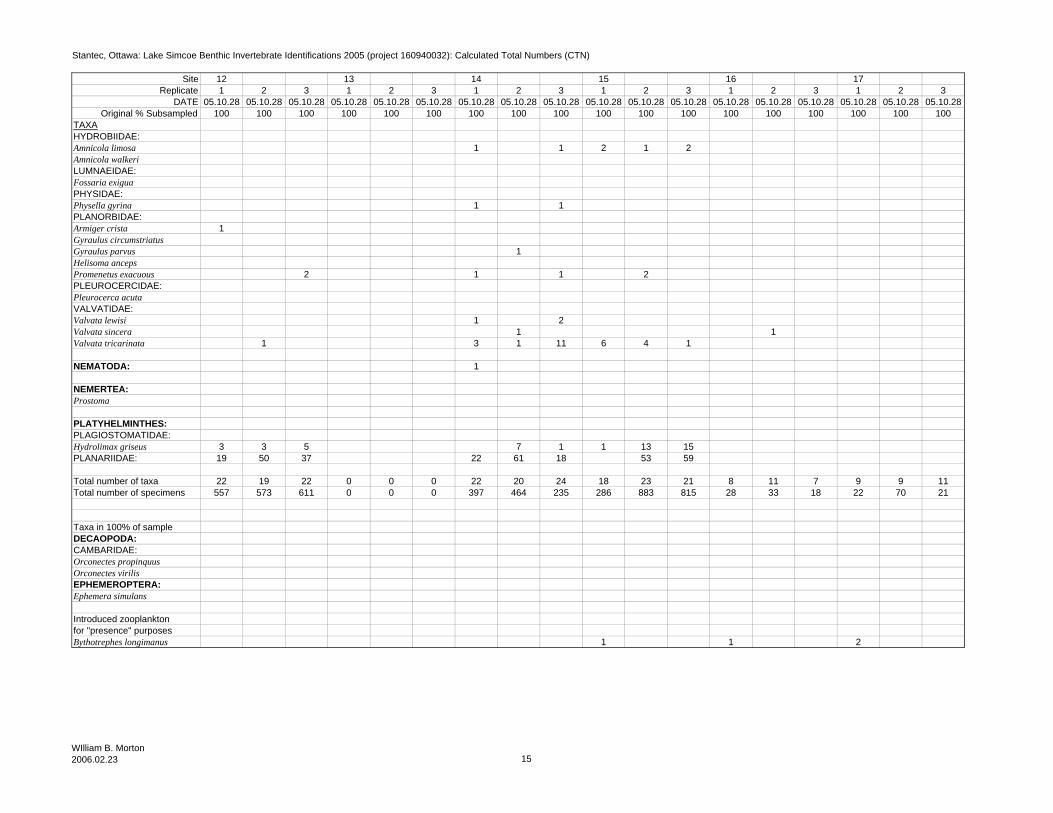
Stantec, Ottawa: Lake Simcoe Benthic Invertebrate Identifications 2005 (project 160940032): Calculated Total Numbers (CTN)
SiteReplicate
DATEOriginal % Subsampled
TAXAHYDROBIIDAE:Amnicola limosaAmnicola walkeriLUMNAEIDAE:Fossaria exiguaPHYSIDAE:Physella gyrinaPLANORBIDAE:Armiger cristaGyraulus circumstriatusGyraulus parvusHelisoma ancepsPromenetus exacuousPLEUROCERCIDAE:Pleurocerca acutaVALVATIDAE:Valvata lewisiValvata sinceraValvata tricarinata
NEMATODA:
NEMERTEA:Prostoma
PLATYHELMINTHES:PLAGIOSTOMATIDAE:Hydrolimax griseusPLANARIIDAE:
Total number of taxaTotal number of specimens
Taxa in 100% of sampleDECAOPODA:CAMBARIDAE:Orconectes propinquusOrconectes virilisEPHEMEROPTERA:Ephemera simulans
Introduced zooplanktonfor "presence" purposesBythotrephes longimanus
12 13 14 15 16 171 2 3 1 2 3 1 2 3 1 2 3 1 2 3 1 2 3
05.10.28 05.10.28 05.10.28 05.10.28 05.10.28 05.10.28 05.10.28 05.10.28 05.10.28 05.10.28 05.10.28 05.10.28 05.10.28 05.10.28 05.10.28 05.10.28 05.10.28 05.10.28100 100 100 100 100 100 100 100 100 100 100 100 100 100 100 100 100 100
1 1 2 1 2
1 1
1
1
2 1 1 2
1 21 1
1 3 1 11 6 4 1
1
3 3 5 7 1 1 13 1519 50 37 22 61 18 53 59
22 19 22 0 0 0 22 20 24 18 23 21 8 11 7 9 9 11557 573 611 0 0 0 397 464 235 286 883 815 28 33 18 22 70 21
1 1 2
WIlliam B. Morton2006.02.23 15

Stantec, Ottawa: Lake Simcoe Benthic Invertebrate Identifications 2005 (project 160940032): Calculated Total Numbers (CTN)
SiteReplicate
DATEOriginal % Subsampled
TAXA
ANNELIDA:HIRUDINEA:ERPOBDELLIDAE:(juvenile)GLOSSIPHONIIDAE:Alboglossiphonia heteroclitaGloiobdella elongataHelobdella stagnalisHelobdella triserialis
ANNELIDA:OLIGOCHAETAENCHYTRAEIDAE:LUMBRICULIDAE:Lumbriculus variegatusStylodrilus herringianusNAIDIDAE:Chaetogaster diaphanusDero furcatusNais bretscheriNais communisNais simplexNais variabilisStylaria lacustrisUncinais uncinataVejdovskyella intermediaSPARGANOPHILIDAE:Sparganophilus eiseniTUBIFICIDAE:Immature Without HairsImmature With HairsAulodrilus piguetiAulodrilus plurisetaLimnodrilus hoffmeisteriPotamothrix vejdovskyellaPsammoryctides californianusQuistadrilus multisetosusSpirosperma feroxTubifex tubifex
ACARINA:HYGROBATIDAE:HygrobatesLEBERTIIDAE:LebertiaLIMNESIIDAE:LimnesiaPIONIDAE:
CRUSTACEAAMPHIPODA:CRANGONYCTIDAE:Crangonyx
18 19 a b c d1 2 3 1 2 3 1 2 3 1 2 3 1 2 3 1 2 3
05.10.28 05.10.28 05.10.28 05.10.28 05.10.28 05.10.28 05.10.28 05.10.28 05.10.28 05.10.28 05.10.28 05.10.28 05.10.28 05.10.28 05.10.28 05.10.28 05.10.28 05.10.28100 100 100 100 100 100 25 25 25 100 25 25 25 25 25 25 25 25
4 4
4
41 4 4
4 4
1
41
2 1 3 2 2 24 36 22 80 104 32 16 24 1212 28 13 12 10 2 4 8 4
1
2
4 4 4 12 4
48
WIlliam B. Morton2006.02.23 16
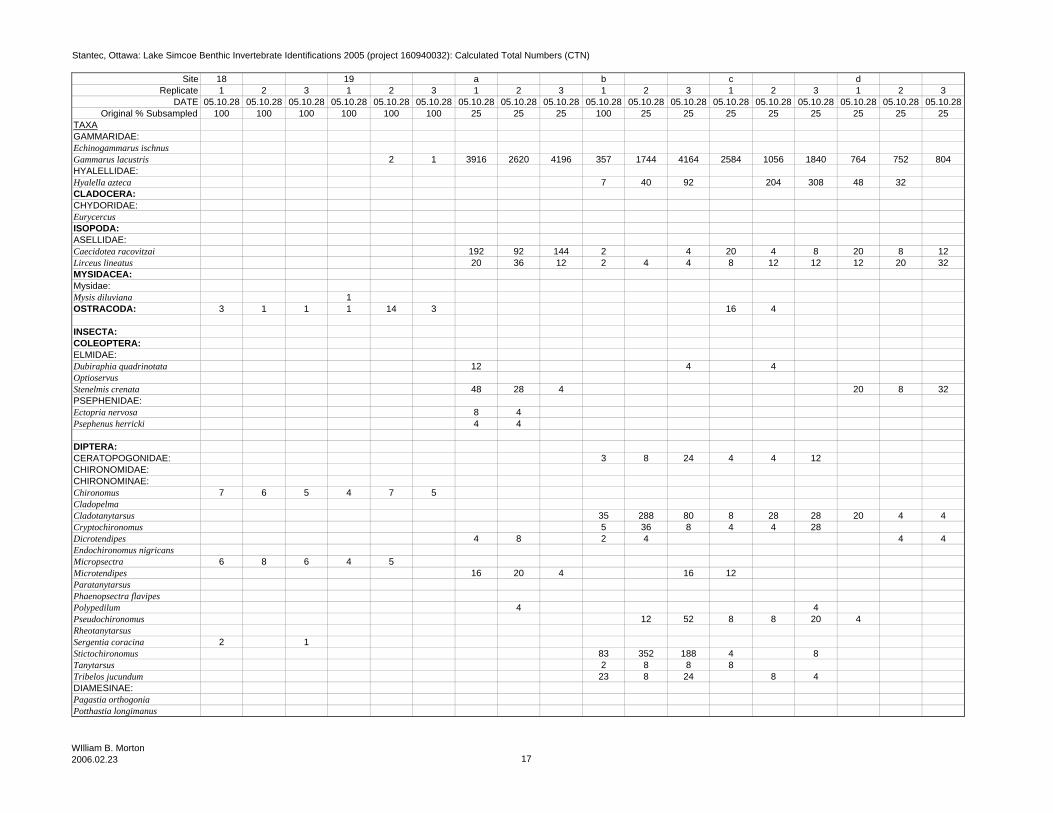
Stantec, Ottawa: Lake Simcoe Benthic Invertebrate Identifications 2005 (project 160940032): Calculated Total Numbers (CTN)
SiteReplicate
DATEOriginal % Subsampled
TAXAGAMMARIDAE:Echinogammarus ischnusGammarus lacustrisHYALELLIDAE:Hyalella aztecaCLADOCERA:CHYDORIDAE:EurycercusISOPODA:ASELLIDAE:Caecidotea racovitzaiLirceus lineatusMYSIDACEA:Mysidae:Mysis diluvianaOSTRACODA:
INSECTA:COLEOPTERA:ELMIDAE:Dubiraphia quadrinotataOptioservusStenelmis crenataPSEPHENIDAE:Ectopria nervosaPsephenus herricki
DIPTERA:CERATOPOGONIDAE:CHIRONOMIDAE:CHIRONOMINAE:ChironomusCladopelmaCladotanytarsusCryptochironomusDicrotendipesEndochironomus nigricansMicropsectraMicrotendipesParatanytarsusPhaenopsectra flavipesPolypedilumPseudochironomusRheotanytarsusSergentia coracinaStictochironomusTanytarsusTribelos jucundumDIAMESINAE:Pagastia orthogoniaPotthastia longimanus
18 19 a b c d1 2 3 1 2 3 1 2 3 1 2 3 1 2 3 1 2 3
05.10.28 05.10.28 05.10.28 05.10.28 05.10.28 05.10.28 05.10.28 05.10.28 05.10.28 05.10.28 05.10.28 05.10.28 05.10.28 05.10.28 05.10.28 05.10.28 05.10.28 05.10.28100 100 100 100 100 100 25 25 25 100 25 25 25 25 25 25 25 25
2 1 3916 2620 4196 357 1744 4164 2584 1056 1840 764 752 804
7 40 92 204 308 48 32
192 92 144 2 4 20 4 8 20 8 1220 36 12 2 4 4 8 12 12 12 20 32
13 1 1 1 14 3 16 4
12 4 4
48 28 4 20 8 32
8 44 4
3 8 24 4 4 12
7 6 5 4 7 5
35 288 80 8 28 28 20 4 45 36 8 4 4 28
4 8 2 4 4 4
6 8 6 4 516 20 4 16 12
4 412 52 8 8 20 4
2 183 352 188 4 82 8 8 823 8 24 8 4
WIlliam B. Morton2006.02.23 17

Stantec, Ottawa: Lake Simcoe Benthic Invertebrate Identifications 2005 (project 160940032): Calculated Total Numbers (CTN)
SiteReplicate
DATEOriginal % Subsampled
TAXAORTHOCLADIINAE:CricotopusEpoicocladiusHeterotrissocladius marcidusPROMIAMESINAE:ProtanypusTANYPODINAE:AblabesmyiaCoelotanypusConchapelopiaProcladius
EMPIDIDAE:HemerodromiaEPHYDRIDAE:TIPULIDAE:Antocha
EPHEMEROPTERA:BAETIDAE:Acerpenna pygmaeusBAETISCIDAE:BaetiscaCAENIDAE:Caenis puncataCaenis youngiEPHEMERELLIDAE:EurylophellaEPHEMERIDAE:Ephemera simulansHexagenia limbataHEPTAGENIIDAE:Stenacron interpunctatumStenonema femoratum
LEPIDOPTERA:PYRALIDAE:AcentriaPetrophila
MEGALOPTERA:SIALIDAE:Sialis
ODONATA:AESCHNIDAE:Aeschna eremitaCOENAGRIONIDAE:Enallagma
TRICHOPTERA:
18 19 a b c d1 2 3 1 2 3 1 2 3 1 2 3 1 2 3 1 2 3
05.10.28 05.10.28 05.10.28 05.10.28 05.10.28 05.10.28 05.10.28 05.10.28 05.10.28 05.10.28 05.10.28 05.10.28 05.10.28 05.10.28 05.10.28 05.10.28 05.10.28 05.10.28100 100 100 100 100 100 25 25 25 100 25 25 25 25 25 25 25 25
20 8 20 1 4 8 8
1 1
4 8 8 44 3 1 4 6 3 12 4
4 4
16 20
49 328 496 128 76 180 4 4
12
8 8 8 16 20
4 4
4
1 4
WIlliam B. Morton2006.02.23 18
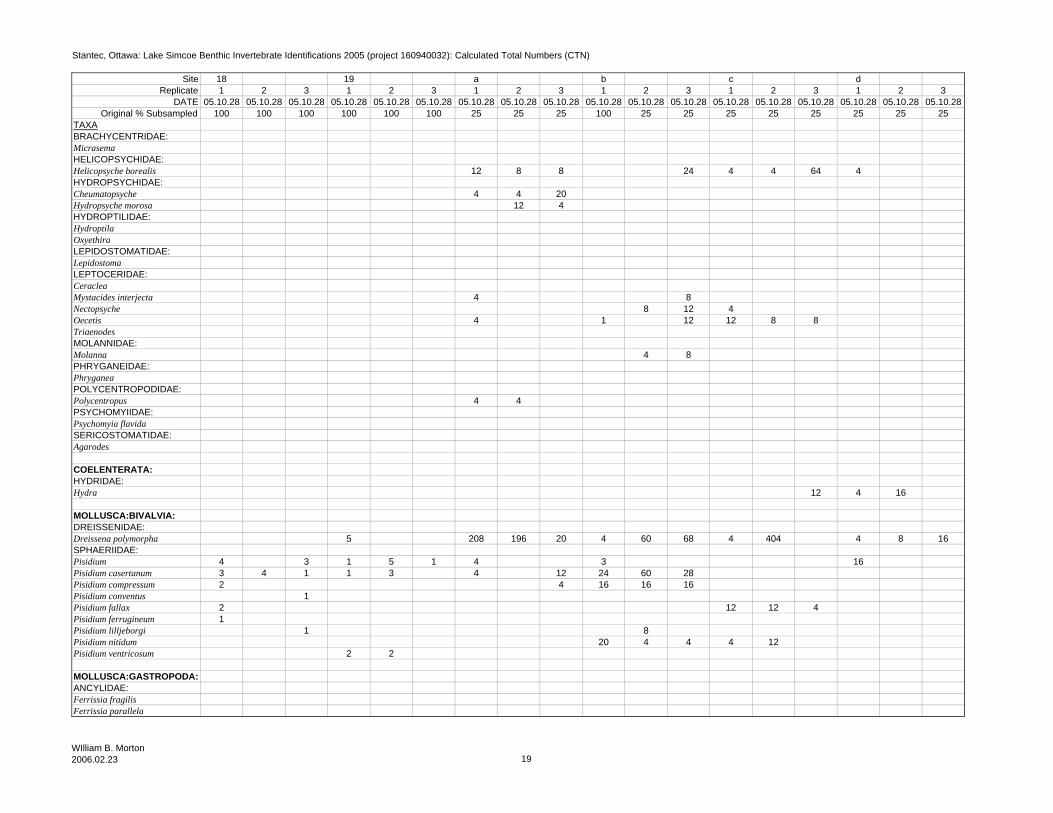
Stantec, Ottawa: Lake Simcoe Benthic Invertebrate Identifications 2005 (project 160940032): Calculated Total Numbers (CTN)
SiteReplicate
DATEOriginal % Subsampled
TAXABRACHYCENTRIDAE:MicrasemaHELICOPSYCHIDAE:Helicopsyche borealisHYDROPSYCHIDAE:CheumatopsycheHydropsyche morosaHYDROPTILIDAE:HydroptilaOxyethiraLEPIDOSTOMATIDAE:Lepidostoma LEPTOCERIDAE:CeracleaMystacides interjectaNectopsycheOecetisTriaenodesMOLANNIDAE:MolannaPHRYGANEIDAE:PhryganeaPOLYCENTROPODIDAE:PolycentropusPSYCHOMYIIDAE:Psychomyia flavidaSERICOSTOMATIDAE:Agarodes
COELENTERATA:HYDRIDAE:Hydra
MOLLUSCA:BIVALVIA:DREISSENIDAE:Dreissena polymorphaSPHAERIIDAE:PisidiumPisidium casertanumPisidium compressumPisidium conventusPisidium fallaxPisidium ferrugineumPisidium lilljeborgiPisidium nitidumPisidium ventricosum
MOLLUSCA:GASTROPODA:ANCYLIDAE:Ferrissia fragilisFerrissia parallela
18 19 a b c d1 2 3 1 2 3 1 2 3 1 2 3 1 2 3 1 2 3
05.10.28 05.10.28 05.10.28 05.10.28 05.10.28 05.10.28 05.10.28 05.10.28 05.10.28 05.10.28 05.10.28 05.10.28 05.10.28 05.10.28 05.10.28 05.10.28 05.10.28 05.10.28100 100 100 100 100 100 25 25 25 100 25 25 25 25 25 25 25 25
12 8 8 24 4 4 64 4
4 4 2012 4
4 88 12 4
4 1 12 12 8 8
4 8
4 4
12 4 16
5 208 196 20 4 60 68 4 404 4 8 16
4 3 1 5 1 4 3 163 4 1 1 3 4 12 24 60 282 4 16 16 16
12 12 12 41
1 820 4 4 4 12
2 2
WIlliam B. Morton2006.02.23 19

Stantec, Ottawa: Lake Simcoe Benthic Invertebrate Identifications 2005 (project 160940032): Calculated Total Numbers (CTN)
SiteReplicate
DATEOriginal % Subsampled
TAXAHYDROBIIDAE:Amnicola limosaAmnicola walkeriLUMNAEIDAE:Fossaria exiguaPHYSIDAE:Physella gyrinaPLANORBIDAE:Armiger cristaGyraulus circumstriatusGyraulus parvusHelisoma ancepsPromenetus exacuousPLEUROCERCIDAE:Pleurocerca acutaVALVATIDAE:Valvata lewisiValvata sinceraValvata tricarinata
NEMATODA:
NEMERTEA:Prostoma
PLATYHELMINTHES:PLAGIOSTOMATIDAE:Hydrolimax griseusPLANARIIDAE:
Total number of taxaTotal number of specimens
Taxa in 100% of sampleDECAOPODA:CAMBARIDAE:Orconectes propinquusOrconectes virilisEPHEMEROPTERA:Ephemera simulans
Introduced zooplanktonfor "presence" purposesBythotrephes longimanus
18 19 a b c d1 2 3 1 2 3 1 2 3 1 2 3 1 2 3 1 2 3
05.10.28 05.10.28 05.10.28 05.10.28 05.10.28 05.10.28 05.10.28 05.10.28 05.10.28 05.10.28 05.10.28 05.10.28 05.10.28 05.10.28 05.10.28 05.10.28 05.10.28 05.10.28100 100 100 100 100 100 25 25 25 100 25 25 25 25 25 25 25 25
48 100 40 11 116 24 8 8 83 16 40
4 4
1 4 12 4 4 8
4 8 4 4 4 16 44 8
44 4 4
36 12
4 4 4 20
4
8 8
1 72 32 76 4 8 16 4 4 8 864 72 68 16 16 28 28 16
14 8 10 12 12 7 34 25 23 26 28 36 26 23 26 20 18 1551 52 33 39 58 17 4792 3308 4708 679 3220 5568 2928 1904 2648 996 960 972
1 1 8 1 2 1 2
WIlliam B. Morton2006.02.23 20

Stantec, Ottawa: Lake Simcoe Benthic Invertebrate Identifications 2005 (project 160940032): Calculated Total Numbers (CTN)
SiteReplicate
DATEOriginal % Subsampled
TAXA
ANNELIDA:HIRUDINEA:ERPOBDELLIDAE:(juvenile)GLOSSIPHONIIDAE:Alboglossiphonia heteroclitaGloiobdella elongataHelobdella stagnalisHelobdella triserialis
ANNELIDA:OLIGOCHAETAENCHYTRAEIDAE:LUMBRICULIDAE:Lumbriculus variegatusStylodrilus herringianusNAIDIDAE:Chaetogaster diaphanusDero furcatusNais bretscheriNais communisNais simplexNais variabilisStylaria lacustrisUncinais uncinataVejdovskyella intermediaSPARGANOPHILIDAE:Sparganophilus eiseniTUBIFICIDAE:Immature Without HairsImmature With HairsAulodrilus piguetiAulodrilus plurisetaLimnodrilus hoffmeisteriPotamothrix vejdovskyellaPsammoryctides californianusQuistadrilus multisetosusSpirosperma feroxTubifex tubifex
ACARINA:HYGROBATIDAE:HygrobatesLEBERTIIDAE:LebertiaLIMNESIIDAE:LimnesiaPIONIDAE:
CRUSTACEAAMPHIPODA:CRANGONYCTIDAE:Crangonyx
e f g h I j1 2 3 1 2 3 1 2 3 1 2 3 1 2 3 1 2 3
05.10.28 05.10.28 05.10.28 05.10.28 05.10.28 05.10.28 05.10.28 05.10.28 05.10.28 05.10.28 05.10.28 05.10.28 05.10.28 05.10.28 05.10.28 05.10.28 05.10.28 05.10.2850 25 50 25 25 25 25 25 25 25 100 100 25 12.5 12.5 25 25 25
8 8 44 4
44 8
8 16
4 8
4100 7212
48 409 4
4 4
32 64 114 244 8 24 4 12 24 12 1 1 16 16 8 4 20 364 8 4
492 72 68
8
2 4 2 4 4 76 30 15 8 8 8 12 12 16
4
20 36 32
WIlliam B. Morton2006.02.23 21
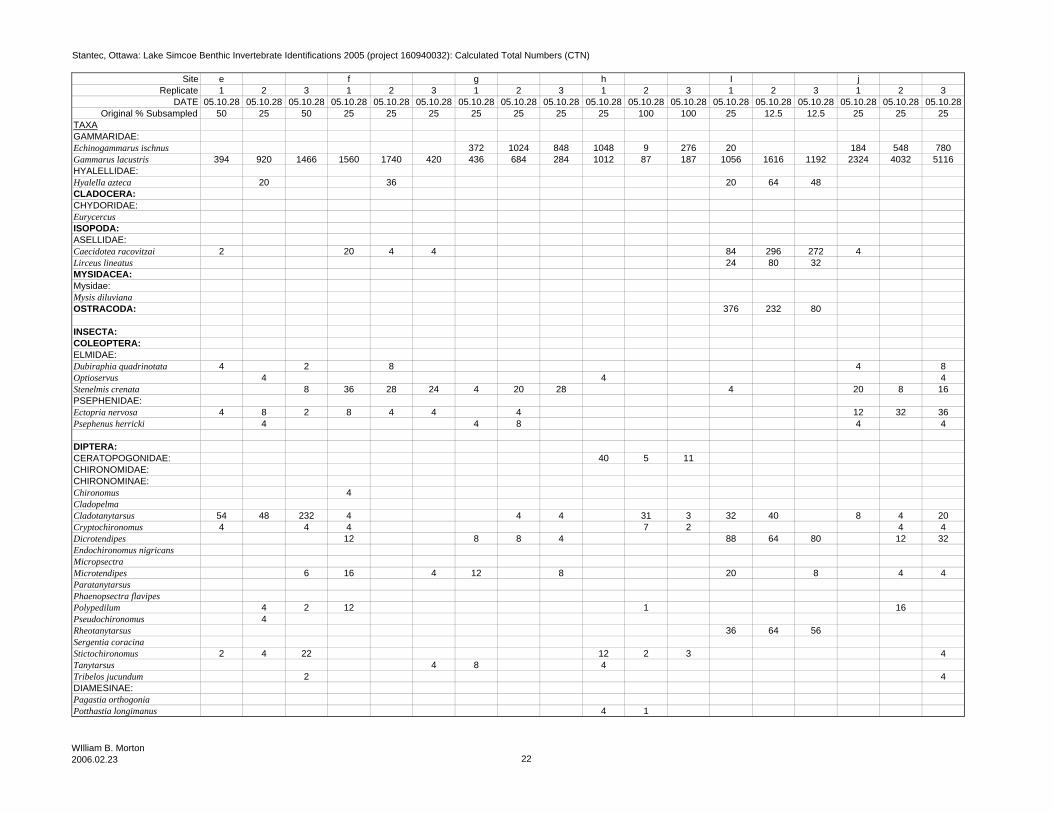
Stantec, Ottawa: Lake Simcoe Benthic Invertebrate Identifications 2005 (project 160940032): Calculated Total Numbers (CTN)
SiteReplicate
DATEOriginal % Subsampled
TAXAGAMMARIDAE:Echinogammarus ischnusGammarus lacustrisHYALELLIDAE:Hyalella aztecaCLADOCERA:CHYDORIDAE:EurycercusISOPODA:ASELLIDAE:Caecidotea racovitzaiLirceus lineatusMYSIDACEA:Mysidae:Mysis diluvianaOSTRACODA:
INSECTA:COLEOPTERA:ELMIDAE:Dubiraphia quadrinotataOptioservusStenelmis crenataPSEPHENIDAE:Ectopria nervosaPsephenus herricki
DIPTERA:CERATOPOGONIDAE:CHIRONOMIDAE:CHIRONOMINAE:ChironomusCladopelmaCladotanytarsusCryptochironomusDicrotendipesEndochironomus nigricansMicropsectraMicrotendipesParatanytarsusPhaenopsectra flavipesPolypedilumPseudochironomusRheotanytarsusSergentia coracinaStictochironomusTanytarsusTribelos jucundumDIAMESINAE:Pagastia orthogoniaPotthastia longimanus
e f g h I j1 2 3 1 2 3 1 2 3 1 2 3 1 2 3 1 2 3
05.10.28 05.10.28 05.10.28 05.10.28 05.10.28 05.10.28 05.10.28 05.10.28 05.10.28 05.10.28 05.10.28 05.10.28 05.10.28 05.10.28 05.10.28 05.10.28 05.10.28 05.10.2850 25 50 25 25 25 25 25 25 25 100 100 25 12.5 12.5 25 25 25
372 1024 848 1048 9 276 20 184 548 780394 920 1466 1560 1740 420 436 684 284 1012 87 187 1056 1616 1192 2324 4032 5116
20 36 20 64 48
2 20 4 4 84 296 272 424 80 32
376 232 80
4 2 8 4 84 4 4
8 36 28 24 4 20 28 4 20 8 16
4 8 2 8 4 4 4 12 32 364 4 8 4 4
40 5 11
4
54 48 232 4 4 4 31 3 32 40 8 4 204 4 4 7 2 4 4
12 8 8 4 88 64 80 12 32
6 16 4 12 8 20 8 4 4
4 2 12 1 164
36 64 56
2 4 22 12 2 3 44 8 4
2 4
4 1
WIlliam B. Morton2006.02.23 22
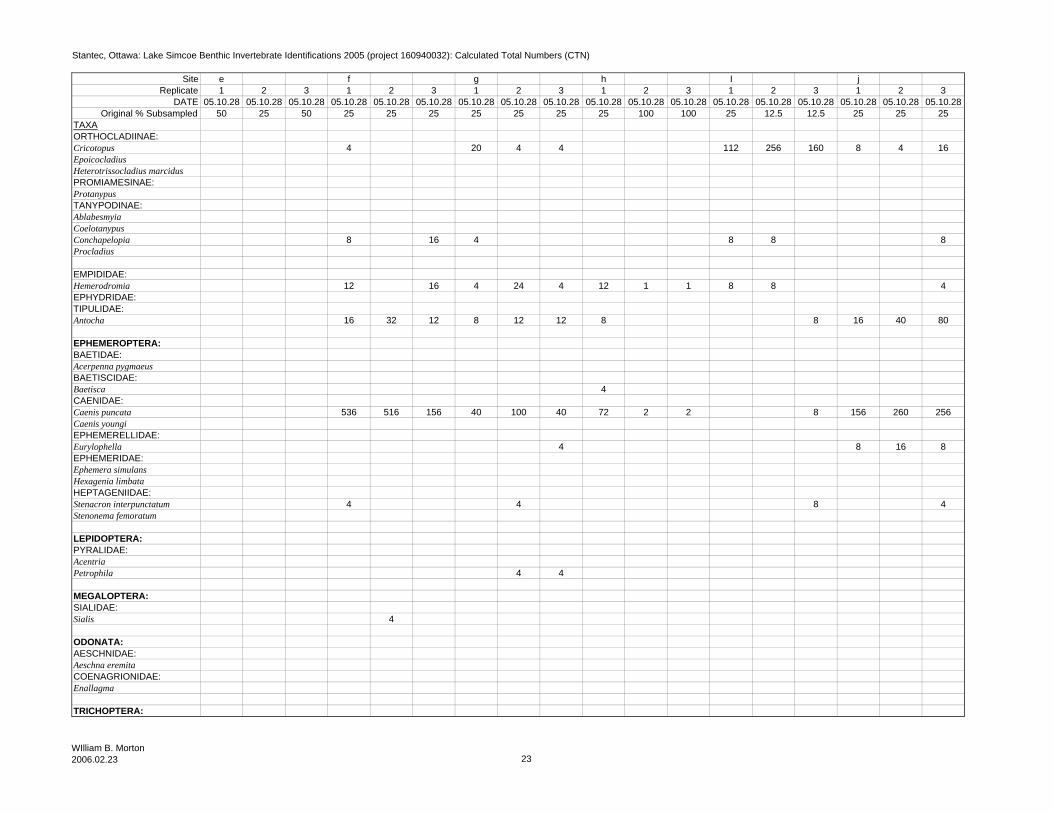
Stantec, Ottawa: Lake Simcoe Benthic Invertebrate Identifications 2005 (project 160940032): Calculated Total Numbers (CTN)
SiteReplicate
DATEOriginal % Subsampled
TAXAORTHOCLADIINAE:CricotopusEpoicocladiusHeterotrissocladius marcidusPROMIAMESINAE:ProtanypusTANYPODINAE:AblabesmyiaCoelotanypusConchapelopiaProcladius
EMPIDIDAE:HemerodromiaEPHYDRIDAE:TIPULIDAE:Antocha
EPHEMEROPTERA:BAETIDAE:Acerpenna pygmaeusBAETISCIDAE:BaetiscaCAENIDAE:Caenis puncataCaenis youngiEPHEMERELLIDAE:EurylophellaEPHEMERIDAE:Ephemera simulansHexagenia limbataHEPTAGENIIDAE:Stenacron interpunctatumStenonema femoratum
LEPIDOPTERA:PYRALIDAE:AcentriaPetrophila
MEGALOPTERA:SIALIDAE:Sialis
ODONATA:AESCHNIDAE:Aeschna eremitaCOENAGRIONIDAE:Enallagma
TRICHOPTERA:
e f g h I j1 2 3 1 2 3 1 2 3 1 2 3 1 2 3 1 2 3
05.10.28 05.10.28 05.10.28 05.10.28 05.10.28 05.10.28 05.10.28 05.10.28 05.10.28 05.10.28 05.10.28 05.10.28 05.10.28 05.10.28 05.10.28 05.10.28 05.10.28 05.10.2850 25 50 25 25 25 25 25 25 25 100 100 25 12.5 12.5 25 25 25
4 20 4 4 112 256 160 8 4 16
8 16 4 8 8 8
12 16 4 24 4 12 1 1 8 8 4
16 32 12 8 12 12 8 8 16 40 80
4
536 516 156 40 100 40 72 2 2 8 156 260 256
4 8 16 8
4 4 8 4
4 4
4
WIlliam B. Morton2006.02.23 23
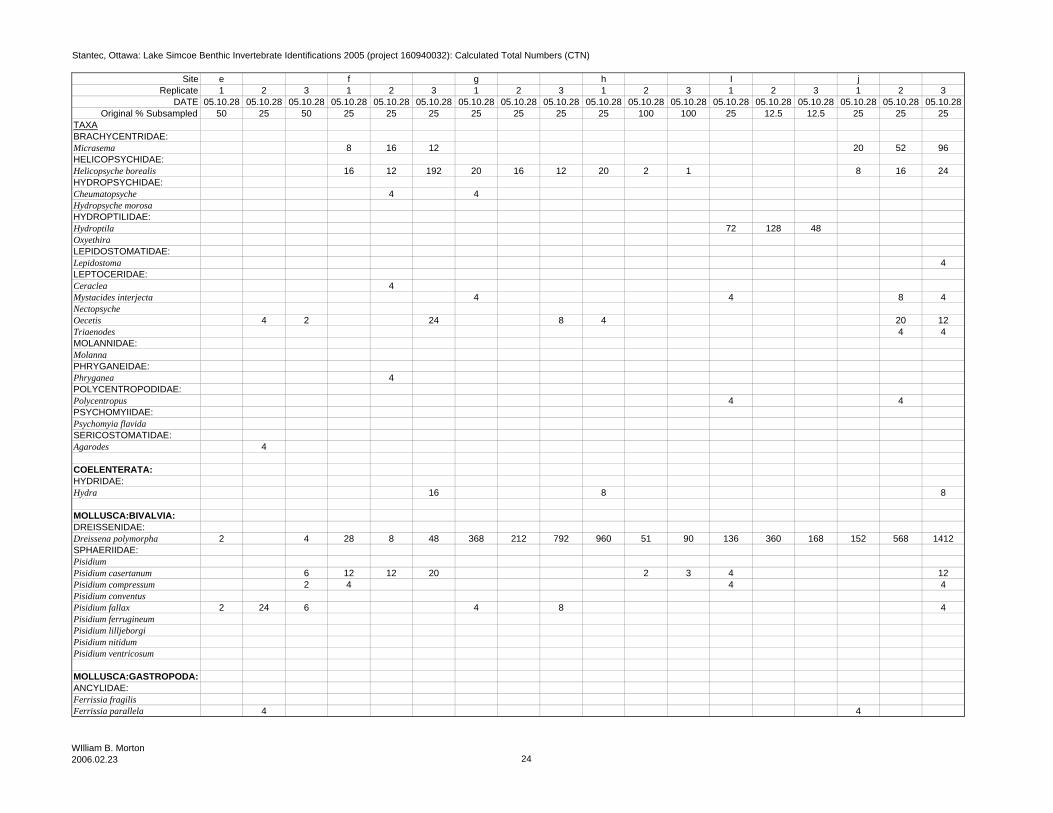
Stantec, Ottawa: Lake Simcoe Benthic Invertebrate Identifications 2005 (project 160940032): Calculated Total Numbers (CTN)
SiteReplicate
DATEOriginal % Subsampled
TAXABRACHYCENTRIDAE:MicrasemaHELICOPSYCHIDAE:Helicopsyche borealisHYDROPSYCHIDAE:CheumatopsycheHydropsyche morosaHYDROPTILIDAE:HydroptilaOxyethiraLEPIDOSTOMATIDAE:Lepidostoma LEPTOCERIDAE:CeracleaMystacides interjectaNectopsycheOecetisTriaenodesMOLANNIDAE:MolannaPHRYGANEIDAE:PhryganeaPOLYCENTROPODIDAE:PolycentropusPSYCHOMYIIDAE:Psychomyia flavidaSERICOSTOMATIDAE:Agarodes
COELENTERATA:HYDRIDAE:Hydra
MOLLUSCA:BIVALVIA:DREISSENIDAE:Dreissena polymorphaSPHAERIIDAE:PisidiumPisidium casertanumPisidium compressumPisidium conventusPisidium fallaxPisidium ferrugineumPisidium lilljeborgiPisidium nitidumPisidium ventricosum
MOLLUSCA:GASTROPODA:ANCYLIDAE:Ferrissia fragilisFerrissia parallela
e f g h I j1 2 3 1 2 3 1 2 3 1 2 3 1 2 3 1 2 3
05.10.28 05.10.28 05.10.28 05.10.28 05.10.28 05.10.28 05.10.28 05.10.28 05.10.28 05.10.28 05.10.28 05.10.28 05.10.28 05.10.28 05.10.28 05.10.28 05.10.28 05.10.2850 25 50 25 25 25 25 25 25 25 100 100 25 12.5 12.5 25 25 25
8 16 12 20 52 96
16 12 192 20 16 12 20 2 1 8 16 24
4 4
72 128 48
4
44 4 8 4
4 2 24 8 4 20 124 4
4
4 4
4
16 8 8
2 4 28 8 48 368 212 792 960 51 90 136 360 168 152 568 1412
6 12 12 20 2 3 4 122 4 4 4
2 24 6 4 8 4
4 4
WIlliam B. Morton2006.02.23 24

Stantec, Ottawa: Lake Simcoe Benthic Invertebrate Identifications 2005 (project 160940032): Calculated Total Numbers (CTN)
SiteReplicate
DATEOriginal % Subsampled
TAXAHYDROBIIDAE:Amnicola limosaAmnicola walkeriLUMNAEIDAE:Fossaria exiguaPHYSIDAE:Physella gyrinaPLANORBIDAE:Armiger cristaGyraulus circumstriatusGyraulus parvusHelisoma ancepsPromenetus exacuousPLEUROCERCIDAE:Pleurocerca acutaVALVATIDAE:Valvata lewisiValvata sinceraValvata tricarinata
NEMATODA:
NEMERTEA:Prostoma
PLATYHELMINTHES:PLAGIOSTOMATIDAE:Hydrolimax griseusPLANARIIDAE:
Total number of taxaTotal number of specimens
Taxa in 100% of sampleDECAOPODA:CAMBARIDAE:Orconectes propinquusOrconectes virilisEPHEMEROPTERA:Ephemera simulans
Introduced zooplanktonfor "presence" purposesBythotrephes longimanus
e f g h I j1 2 3 1 2 3 1 2 3 1 2 3 1 2 3 1 2 3
05.10.28 05.10.28 05.10.28 05.10.28 05.10.28 05.10.28 05.10.28 05.10.28 05.10.28 05.10.28 05.10.28 05.10.28 05.10.28 05.10.28 05.10.28 05.10.28 05.10.28 05.10.2850 25 50 25 25 25 25 25 25 25 100 100 25 12.5 12.5 25 25 25
8 12 12 16 12 8 60 96 48 44 76 148 88 12 3 80 136 120
4
20 20 20 8 16 16
4 12 28 44 1 264 504 224 40 4048 4 4 4 8
1 84 120 56
4 12 32 16
1 4
2 4 8 4 40 16
4 20 6 24 44 16 12 12 16 1 164 120 88 4 88 4 8 16 48 28 36 48 24 144 176 176 4 8 16
15 20 20 28 24 26 27 25 23 19 19 15 36 29 28 23 26 41520 1176 1900 3116 2660 1148 1512 2420 2288 3316 246 597 3080 4648 2992 2968 5752 8144
11
1
1 5 14 3
WIlliam B. Morton2006.02.23 25

Stantec, Ottawa: Lake Simcoe Benthic Invertebrate Identifications 2005 (project 160940032): Calculated Total Numbers (CTN)
SiteReplicate
DATEOriginal % Subsampled
TAXA
ANNELIDA:HIRUDINEA:ERPOBDELLIDAE:(juvenile)GLOSSIPHONIIDAE:Alboglossiphonia heteroclitaGloiobdella elongataHelobdella stagnalisHelobdella triserialis
ANNELIDA:OLIGOCHAETAENCHYTRAEIDAE:LUMBRICULIDAE:Lumbriculus variegatusStylodrilus herringianusNAIDIDAE:Chaetogaster diaphanusDero furcatusNais bretscheriNais communisNais simplexNais variabilisStylaria lacustrisUncinais uncinataVejdovskyella intermediaSPARGANOPHILIDAE:Sparganophilus eiseniTUBIFICIDAE:Immature Without HairsImmature With HairsAulodrilus piguetiAulodrilus plurisetaLimnodrilus hoffmeisteriPotamothrix vejdovskyellaPsammoryctides californianusQuistadrilus multisetosusSpirosperma feroxTubifex tubifex
ACARINA:HYGROBATIDAE:HygrobatesLEBERTIIDAE:LebertiaLIMNESIIDAE:LimnesiaPIONIDAE:
CRUSTACEAAMPHIPODA:CRANGONYCTIDAE:Crangonyx
k l m n o p1 2 3 1 2 3 1 2 3 1 2 3 1 2 3 1 2 3
05.10.28 05.10.28 05.10.28 05.10.28 05.10.28 05.10.28 05.10.28 05.10.28 05.10.28 05.10.28 05.10.28 05.10.28 05.10.28 05.10.28 05.10.28 05.10.28 05.10.28 05.10.2825 25 25 100 100 100 100 100 100 25 25 12.5 100 50 25 25 50 25
1 8
1 4 16 1 2
2 4
4
11 2
4
4 8 8
32 16 72 11 7 11 8 18 46 32 128 192 2 16 24 80 10 1084 5 5 4 4 4
1 2 4
4
8 16 8
4 4 20 48 1 8 2 4
4
2
WIlliam B. Morton2006.02.23 26
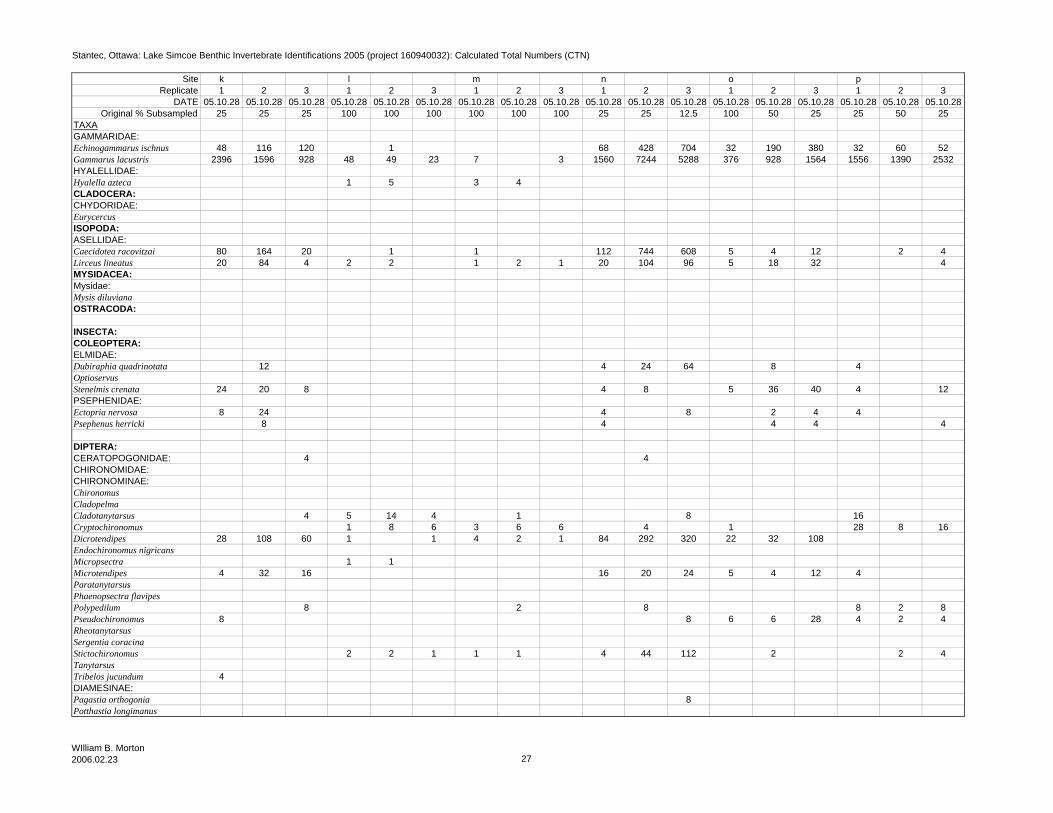
Stantec, Ottawa: Lake Simcoe Benthic Invertebrate Identifications 2005 (project 160940032): Calculated Total Numbers (CTN)
SiteReplicate
DATEOriginal % Subsampled
TAXAGAMMARIDAE:Echinogammarus ischnusGammarus lacustrisHYALELLIDAE:Hyalella aztecaCLADOCERA:CHYDORIDAE:EurycercusISOPODA:ASELLIDAE:Caecidotea racovitzaiLirceus lineatusMYSIDACEA:Mysidae:Mysis diluvianaOSTRACODA:
INSECTA:COLEOPTERA:ELMIDAE:Dubiraphia quadrinotataOptioservusStenelmis crenataPSEPHENIDAE:Ectopria nervosaPsephenus herricki
DIPTERA:CERATOPOGONIDAE:CHIRONOMIDAE:CHIRONOMINAE:ChironomusCladopelmaCladotanytarsusCryptochironomusDicrotendipesEndochironomus nigricansMicropsectraMicrotendipesParatanytarsusPhaenopsectra flavipesPolypedilumPseudochironomusRheotanytarsusSergentia coracinaStictochironomusTanytarsusTribelos jucundumDIAMESINAE:Pagastia orthogoniaPotthastia longimanus
k l m n o p1 2 3 1 2 3 1 2 3 1 2 3 1 2 3 1 2 3
05.10.28 05.10.28 05.10.28 05.10.28 05.10.28 05.10.28 05.10.28 05.10.28 05.10.28 05.10.28 05.10.28 05.10.28 05.10.28 05.10.28 05.10.28 05.10.28 05.10.28 05.10.2825 25 25 100 100 100 100 100 100 25 25 12.5 100 50 25 25 50 25
48 116 120 1 68 428 704 32 190 380 32 60 522396 1596 928 48 49 23 7 3 1560 7244 5288 376 928 1564 1556 1390 2532
1 5 3 4
80 164 20 1 1 112 744 608 5 4 12 2 420 84 4 2 2 1 2 1 20 104 96 5 18 32 4
12 4 24 64 8 4
24 20 8 4 8 5 36 40 4 12
8 24 4 8 2 4 48 4 4 4 4
4 4
4 5 14 4 1 8 161 8 6 3 6 6 4 1 28 8 16
28 108 60 1 1 4 2 1 84 292 320 22 32 108
1 14 32 16 16 20 24 5 4 12 4
8 2 8 8 2 88 8 6 6 28 4 2 4
2 2 1 1 1 4 44 112 2 2 4
4
8
WIlliam B. Morton2006.02.23 27
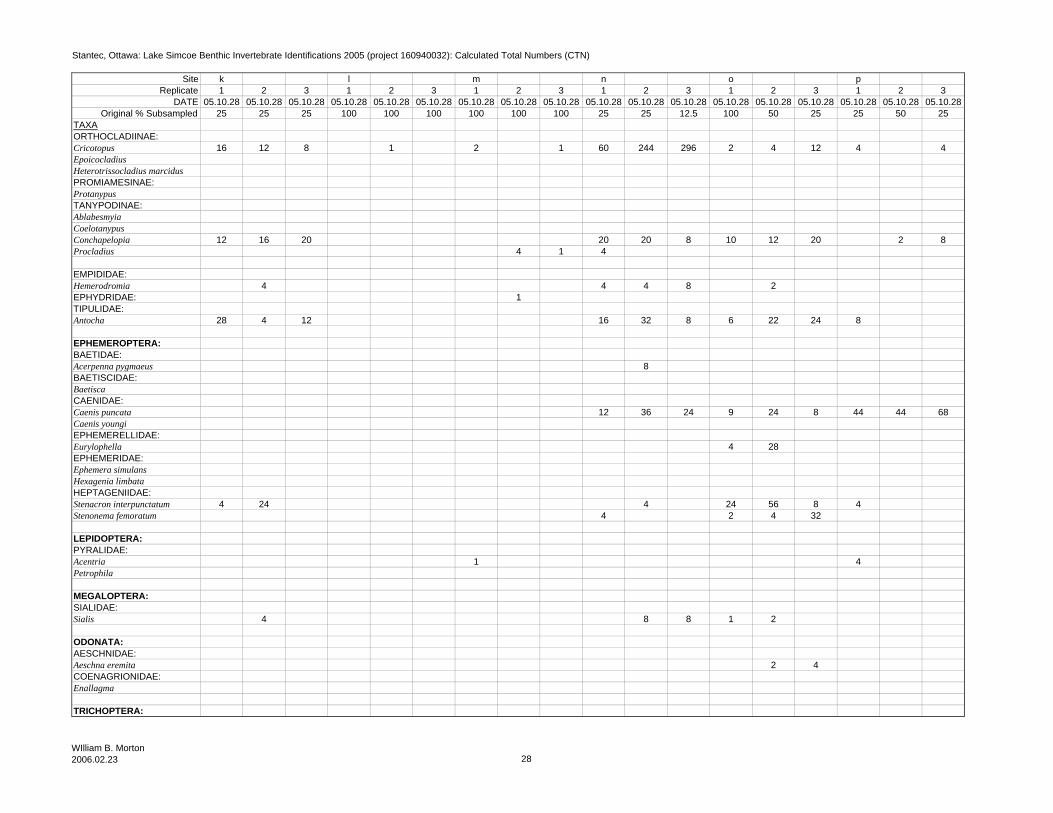
Stantec, Ottawa: Lake Simcoe Benthic Invertebrate Identifications 2005 (project 160940032): Calculated Total Numbers (CTN)
SiteReplicate
DATEOriginal % Subsampled
TAXAORTHOCLADIINAE:CricotopusEpoicocladiusHeterotrissocladius marcidusPROMIAMESINAE:ProtanypusTANYPODINAE:AblabesmyiaCoelotanypusConchapelopiaProcladius
EMPIDIDAE:HemerodromiaEPHYDRIDAE:TIPULIDAE:Antocha
EPHEMEROPTERA:BAETIDAE:Acerpenna pygmaeusBAETISCIDAE:BaetiscaCAENIDAE:Caenis puncataCaenis youngiEPHEMERELLIDAE:EurylophellaEPHEMERIDAE:Ephemera simulansHexagenia limbataHEPTAGENIIDAE:Stenacron interpunctatumStenonema femoratum
LEPIDOPTERA:PYRALIDAE:AcentriaPetrophila
MEGALOPTERA:SIALIDAE:Sialis
ODONATA:AESCHNIDAE:Aeschna eremitaCOENAGRIONIDAE:Enallagma
TRICHOPTERA:
k l m n o p1 2 3 1 2 3 1 2 3 1 2 3 1 2 3 1 2 3
05.10.28 05.10.28 05.10.28 05.10.28 05.10.28 05.10.28 05.10.28 05.10.28 05.10.28 05.10.28 05.10.28 05.10.28 05.10.28 05.10.28 05.10.28 05.10.28 05.10.28 05.10.2825 25 25 100 100 100 100 100 100 25 25 12.5 100 50 25 25 50 25
16 12 8 1 2 1 60 244 296 2 4 12 4 4
12 16 20 20 20 8 10 12 20 2 84 1 4
4 4 4 8 21
28 4 12 16 32 8 6 22 24 8
8
12 36 24 9 24 8 44 44 68
4 28
4 24 4 24 56 8 44 2 4 32
1 4
4 8 8 1 2
2 4
WIlliam B. Morton2006.02.23 28
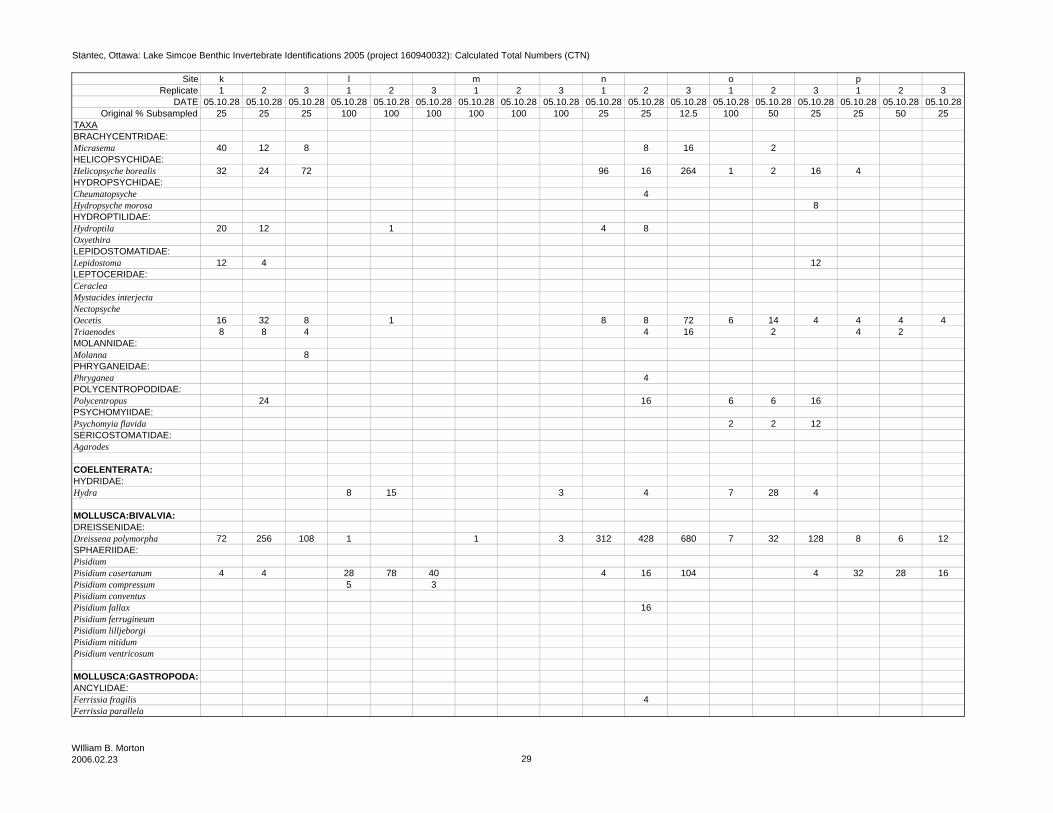
Stantec, Ottawa: Lake Simcoe Benthic Invertebrate Identifications 2005 (project 160940032): Calculated Total Numbers (CTN)
SiteReplicate
DATEOriginal % Subsampled
TAXABRACHYCENTRIDAE:MicrasemaHELICOPSYCHIDAE:Helicopsyche borealisHYDROPSYCHIDAE:CheumatopsycheHydropsyche morosaHYDROPTILIDAE:HydroptilaOxyethiraLEPIDOSTOMATIDAE:Lepidostoma LEPTOCERIDAE:CeracleaMystacides interjectaNectopsycheOecetisTriaenodesMOLANNIDAE:MolannaPHRYGANEIDAE:PhryganeaPOLYCENTROPODIDAE:PolycentropusPSYCHOMYIIDAE:Psychomyia flavidaSERICOSTOMATIDAE:Agarodes
COELENTERATA:HYDRIDAE:Hydra
MOLLUSCA:BIVALVIA:DREISSENIDAE:Dreissena polymorphaSPHAERIIDAE:PisidiumPisidium casertanumPisidium compressumPisidium conventusPisidium fallaxPisidium ferrugineumPisidium lilljeborgiPisidium nitidumPisidium ventricosum
MOLLUSCA:GASTROPODA:ANCYLIDAE:Ferrissia fragilisFerrissia parallela
k l m n o p1 2 3 1 2 3 1 2 3 1 2 3 1 2 3 1 2 3
05.10.28 05.10.28 05.10.28 05.10.28 05.10.28 05.10.28 05.10.28 05.10.28 05.10.28 05.10.28 05.10.28 05.10.28 05.10.28 05.10.28 05.10.28 05.10.28 05.10.28 05.10.2825 25 25 100 100 100 100 100 100 25 25 12.5 100 50 25 25 50 25
40 12 8 8 16 2
32 24 72 96 16 264 1 2 16 4
48
20 12 1 4 8
12 4 12
16 32 8 1 8 8 72 6 14 4 4 4 48 8 4 4 16 2 4 2
8
4
24 16 6 6 16
2 2 12
8 15 3 4 7 28 4
72 256 108 1 1 3 312 428 680 7 32 128 8 6 12
4 4 28 78 40 4 16 104 4 32 28 165 3
16
4
WIlliam B. Morton2006.02.23 29
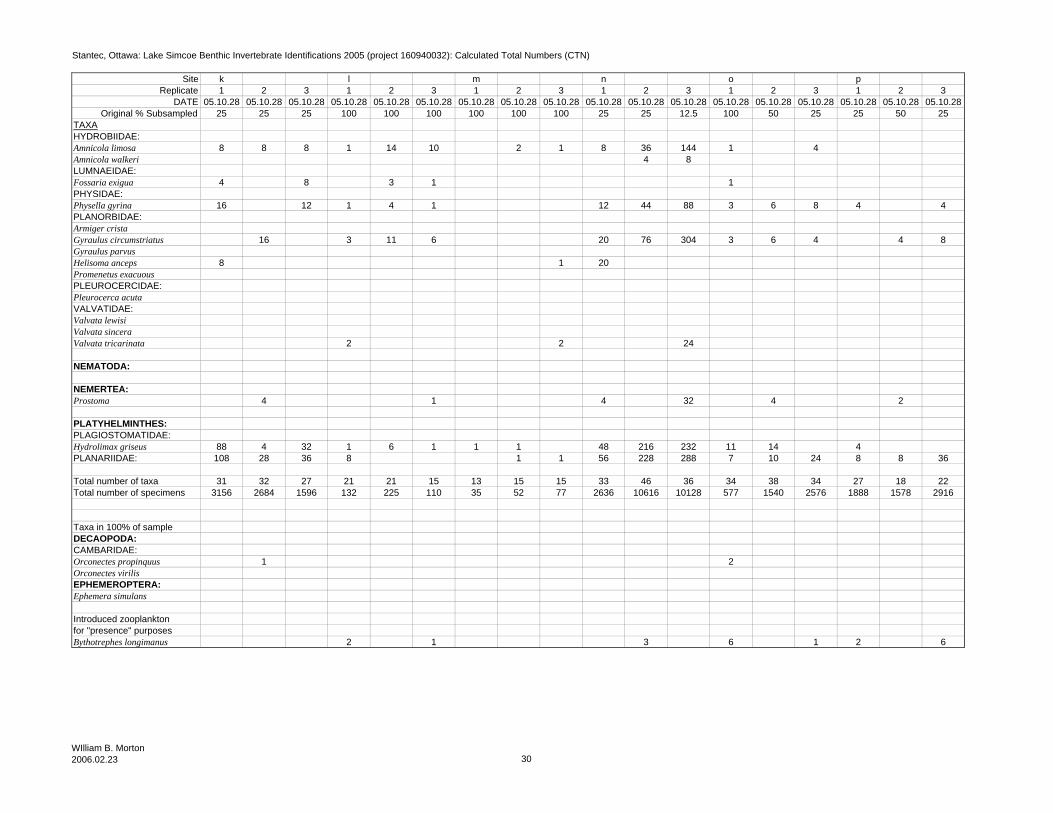
Stantec, Ottawa: Lake Simcoe Benthic Invertebrate Identifications 2005 (project 160940032): Calculated Total Numbers (CTN)
SiteReplicate
DATEOriginal % Subsampled
TAXAHYDROBIIDAE:Amnicola limosaAmnicola walkeriLUMNAEIDAE:Fossaria exiguaPHYSIDAE:Physella gyrinaPLANORBIDAE:Armiger cristaGyraulus circumstriatusGyraulus parvusHelisoma ancepsPromenetus exacuousPLEUROCERCIDAE:Pleurocerca acutaVALVATIDAE:Valvata lewisiValvata sinceraValvata tricarinata
NEMATODA:
NEMERTEA:Prostoma
PLATYHELMINTHES:PLAGIOSTOMATIDAE:Hydrolimax griseusPLANARIIDAE:
Total number of taxaTotal number of specimens
Taxa in 100% of sampleDECAOPODA:CAMBARIDAE:Orconectes propinquusOrconectes virilisEPHEMEROPTERA:Ephemera simulans
Introduced zooplanktonfor "presence" purposesBythotrephes longimanus
k l m n o p1 2 3 1 2 3 1 2 3 1 2 3 1 2 3 1 2 3
05.10.28 05.10.28 05.10.28 05.10.28 05.10.28 05.10.28 05.10.28 05.10.28 05.10.28 05.10.28 05.10.28 05.10.28 05.10.28 05.10.28 05.10.28 05.10.28 05.10.28 05.10.2825 25 25 100 100 100 100 100 100 25 25 12.5 100 50 25 25 50 25
8 8 8 1 14 10 2 1 8 36 144 1 44 8
4 8 3 1 1
16 12 1 4 1 12 44 88 3 6 8 4 4
16 3 11 6 20 76 304 3 6 4 4 8
8 1 20
2 2 24
4 1 4 32 4 2
88 4 32 1 6 1 1 1 48 216 232 11 14 4108 28 36 8 1 1 56 228 288 7 10 24 8 8 36
31 32 27 21 21 15 13 15 15 33 46 36 34 38 34 27 18 223156 2684 1596 132 225 110 35 52 77 2636 10616 10128 577 1540 2576 1888 1578 2916
1 2
2 1 3 6 1 2 6
WIlliam B. Morton2006.02.23 30

Calculated index values for each replicate
Station repl Total number of taxa
Total number of specimens
%ET Simpsons D Evenness CA1 CA2 CA 1 CA2 Taxon
1 1 18 588 0 0.67 0.67 2.25 -2.21 1.16 -1.31 Nematoda1 2 15 408 0 0.55 0.55 1.15 -2.28 0.15 -0.24 Sialis1 3 20 408 0 0.82 0.82 1.76 -1.86 -0.27 0.21 Polycentropus2 1 7 27 0 0.76 0.79 4.47 0.10 0.13 0.76 Pisidium fallax2 2 9 52 0 0.67 0.68 5.01 -0.65 -0.38 0.18 Psephenus herricki2 3 11 38 0 0.85 0.87 2.57 -0.46 3.61 -3.79 Hexagenia limbata3 1 10 520 0 0.66 0.66 0.90 -1.95 -0.46 0.39 Micrasema3 2 17 388 1 0.73 0.73 0.82 -1.92 -0.25 0.20 Triaenodes3 3 10 280 0 0.78 0.78 0.70 -1.63 0.05 -0.37 Helisoma anceps4 1 14 84 2 0.85 0.86 2.29 -0.61 0.59 -1.21 Stylodrilus herringianus4 2 18 123 3 0.87 0.88 1.73 -1.36 1.40 -1.50 Limnesia4 3 18 132 1 0.80 0.81 2.41 -2.26 24.32 18.24 Micropsectra5 1 9 41 24 0.84 0.86 2.47 -3.24 -0.34 0.31 Dubiraphia quadrinotata5 2 11 31 29 0.85 0.88 3.28 -3.09 1.34 -1.95 Promenetus exacuous5 3 16 226 4 0.33 0.33 1.33 -2.89 0.00 -0.10 Prostoma6 1 21 148 3 0.82 0.83 0.90 -1.61 -0.48 0.56 Stenacron interpunctatum6 2 20 154 0 0.75 0.76 0.88 -1.86 9.96 6.79 Pisidium6 3 12 119 1 0.73 0.73 0.69 -0.93 -0.08 -0.25 CERATOPOGONIDAE:
6a 1 17 129 4 0.86 0.87 2.71 -1.62 -0.17 -0.26 Hemerodromia6a 2 12 132 5 0.81 0.81 2.74 -0.79 0.51 0.86 Pisidium compressum6a 3 13 94 2 0.80 0.81 1.64 -1.29 0.19 -0.86 Amnicola walkeri7 1 19 158 0 0.86 0.87 1.80 -0.89 -0.44 0.43 Ectopria nervosa7 2 18 145 1 0.86 0.87 1.58 -0.88 -0.22 0.58 Aulodrilus pigueti7 3 21 267 0 0.81 0.82 2.21 -1.76 -0.01 0.31 Polypedilum8 1 35 374 2 0.86 0.86 2.04 -0.96 1.50 -0.97 Tanytarsus8 2 20 155 0 0.82 0.83 4.13 -0.42 -0.19 -0.56 Echinogammarus ischnus8 3 34 776 2 0.88 0.88 1.94 -0.80 -0.42 0.29 Antocha9 1 20 742 0 0.60 0.60 1.00 -2.25 0.59 -0.95 Hydra9 2 21 734 0 0.72 0.72 1.08 -2.37 0.77 -1.13 Alboglossiphonia heteroclita9 3 20 229 0 0.83 0.84 0.91 -1.68 12.41 8.32 Immature With Hairs
10 1 18 265 0 0.88 0.88 1.58 -2.19 0.05 0.33 Pseudochironomus10 2 19 1034 0 0.67 0.67 1.24 -2.54 -0.28 0.21 Conchapelopia10 3 20 598 0 0.62 0.62 1.15 -2.30 -0.19 -0.24 Lebertia11 1 21 418 0 0.80 0.80 2.42 -2.06 0.39 0.17 Hyalella azteca11 2 26 602 1 0.82 0.82 2.06 -1.59 -0.45 0.49 Stenelmis crenata11 3 23 548 0 0.85 0.85 1.92 -1.87 1.90 -3.49 Limnodrilus hoffmeisteri12 1 22 557 0 0.65 0.65 1.12 -2.33 -0.34 0.98 Cladotanytarsus12 2 19 573 0 0.67 0.68 1.07 -2.26 -0.34 0.27 Helicopsyche borealis12 3 22 611 0 0.73 0.73 1.08 -2.18 0.99 -1.24 Valvata tricarinata
2.51 -2.55 Tribelos jucundum0.00 -0.17 Cricotopus5.93 0.57 Chironomus
14 1 22 397 0 0.73 0.73 1.11 -2.13 -0.51 0.81 Caenis puncata14 2 20 464 0 0.72 0.73 1.00 -2.16 0.00 -0.12 Physella gyrina14 3 24 235 0 0.87 0.87 1.17 -1.71 0.26 -0.45 Gyraulus circumstriatus15 1 18 286 1 0.73 0.73 0.14 0.03 0.61 1.31 Pisidium casertanum15 2 23 883 0 0.56 0.57 1.01 -2.34 0.29 0.42 Cryptochironomus15 3 21 815 0 0.60 0.60 0.97 -2.25 -0.01 0.44 Stictochironomus16 1 8 28 0 0.81 0.84 10.40 6.02 -0.17 0.09 Oecetis16 2 11 33 0 0.88 0.91 12.49 7.95 0.29 -0.19 Dicrotendipes16 3 7 18 0 0.82 0.87 9.24 2.14 2.52 -1.20 OSTRACODA:17 1 9 22 0 0.81 0.85 13.63 8.42 0.99 -1.23 Lirceus lineatus17 2 9 70 0 0.78 0.79 22.26 16.37 5.33 -0.08 Procladius17 3 11 21 0 0.87 0.91 16.39 10.80 0.62 -0.68 Microtendipes18 1 14 51 0 0.88 0.90 13.69 8.91 0.38 -0.19 Amnicola limosa18 2 8 52 0 0.66 0.68 17.33 12.27 0.45 -0.94 Caecidotea racovitzai18 3 10 33 0 0.78 0.80 18.81 13.30 0.46 -1.08 PLANARIIDAE:19 1 12 39 0 0.85 0.87 13.33 8.06 0.10 -0.20 Hydrolimax griseus19 2 12 58 0 0.87 0.88 11.12 5.97 0.77 -1.79 Dreissena polymorpha19 3 7 17 0 0.82 0.87 7.87 2.07 0.65 -0.80 Immature Without Hairsa 1 34 4792 1 0.33 0.33 -0.35 0.48 -0.39 0.51 Gammarus lacustrisa 2 25 3308 1 0.37 0.37 -0.33 0.38a 3 23 4708 1 0.20 0.20 -0.47 0.65b 1 26 679 7 0.70 0.70 -0.07 0.66b 2 28 3220 11 0.67 0.67 -0.28 0.80b 3 36 5568 10 0.43 0.43 -0.42 0.74c 1 26 2928 5 0.22 0.22 -0.46 0.75c 2 23 1904 5 0.63 0.63 0.02 -0.12c 3 26 2648 10 0.50 0.50 -0.36 0.67d 1 20 996 2 0.41 0.41 -0.13 0.76d 2 18 960 2 0.38 0.38 -0.37 0.52d 3 15 972 2 0.31 0.31 -0.43 0.58e 1 15 520 0 0.41 0.41 -0.28 0.80e 2 20 1176 1 0.38 0.38 -0.29 0.80e 3 20 1900 0 0.39 0.39 -0.40 0.80f 1 28 3116 18 0.69 0.69 -0.38 0.68f 2 24 2660 21 0.53 0.53 -0.54 0.83f 3 26 1148 33 0.81 0.81 -0.33 0.45

Calculated index values for each replicate
Station repl Total number of taxa
Total number of specimens
%ET Simpsons D Evenness CA1 CA2 CA 1 CA2 Taxon
g 1 27 1512 4 0.79 0.79 0.08 -0.82g 2 25 2420 5 0.73 0.73 -0.19 -0.49g 3 23 2288 3 0.72 0.72 0.24 -1.33h 1 19 3316 3 0.72 0.72 0.05 -0.89h 2 19 246 2 0.80 0.80 -0.06 -0.19h 3 15 597 1 0.66 0.67 -0.15 -0.60i 1 36 3080 3 0.85 0.85 0.52 -0.43i 2 29 4648 3 0.85 0.85 0.30 -0.46i 3 28 2992 2 0.81 0.81 0.15 -0.34j 1 23 2968 6 0.38 0.38 -0.47 0.53j 2 26 5752 7 0.49 0.49 -0.37 0.27j 3 41 8144 5 0.56 0.56 -0.23 -0.02k 1 31 3156 4 0.42 0.42 -0.35 0.46k 2 32 2684 5 0.63 0.63 -0.15 0.00k 3 27 1596 6 0.64 0.64 -0.23 0.10l 1 21 132 0 0.80 0.81 0.54 0.69l 2 21 225 1 0.81 0.82 0.52 0.99l 3 15 110 0 0.80 0.80 0.44 0.85
m 1 13 35 0 0.87 0.89 0.52 -0.63m 2 15 52 0 0.84 0.85 3.13 0.93m 3 15 77 0 0.63 0.63 2.13 -0.12n 1 33 2636 5 0.63 0.63 -0.14 -0.02n 2 46 10616 1 0.52 0.52 -0.26 0.21n 3 36 10128 4 0.71 0.71 -0.13 -0.03o 1 34 577 9 0.57 0.57 -0.38 0.44o 2 38 1540 9 0.62 0.62 -0.38 0.33o 3 34 2576 5 0.60 0.60 -0.28 0.21p 1 27 1888 3 0.32 0.32 -0.41 0.73p 2 18 1578 3 0.22 0.22 -0.51 0.75p 3 22 2916 2 0.24 0.24 -0.45 0.69

STANTEC, Ottawa: Lake Simcoe Benthic Survey 2005: Sample Sorting Efficiency
Station 6 9 11 12 14 16 18 e f oReplicate 2 1 1 3 3 3 3 1 2 1
TAXA
HIRUDINEA 1OLIGOCHAETA 2 2 1 3 1ACARINAAMPHIPODAISOPODA 4 1OSTRACODADIPTERA:CHIRONOMIDAE 1 2 6 2EPHEMEROPTERA 19 2MEGALOPTERA 1TRICHOPTERA 13 3MOLLUSCA:BIVALVIADREISSENIDAE 3SPHAERIIDAE 1MOLLUSCA:GASTOPODA 1 3 3 2 2 2NEMERTEAPLATYHELMINTHES 2 1 1 1 1 1
No. in resort(A) 2 11 3 7 7 0 1 8 40 9
No. in original sample(B) 154 742 418 611 235 18 33 260 665 577
Total specimens(A+B) 156 753 421 618 242 18 34 268 705 586
% Sorting Efficiency 99.9 99.9 99.9 99.9 99.9 100 99.9 99.9 99.9 99.9 99.9[1-(A/A+B)] x 100 average
% samples resorted: 10/105 = 9.5%Original Techician: J. Reid, R. DolsonQuality Control Technician: A. Baetz
2006.02.23

Appendix D
Shoreline Photo Log

Station A
Station B
Filename: 60940032_01_photos.cdr Page 1 of 6

Station C
Station DStation E no photo taken
Filename: 60940032_01_photos.cdr Page 2 of 6
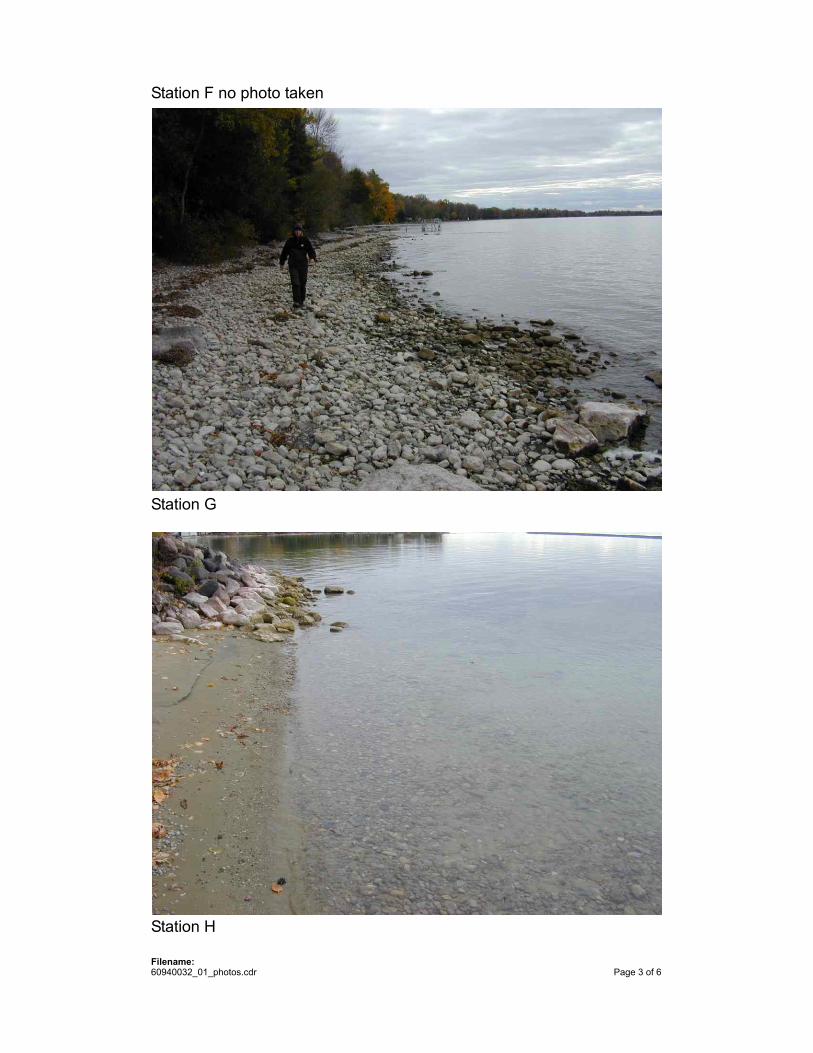
Station G
Station H
Filename: 60940032_01_photos.cdr Page 3 of 6
Station F no photo taken
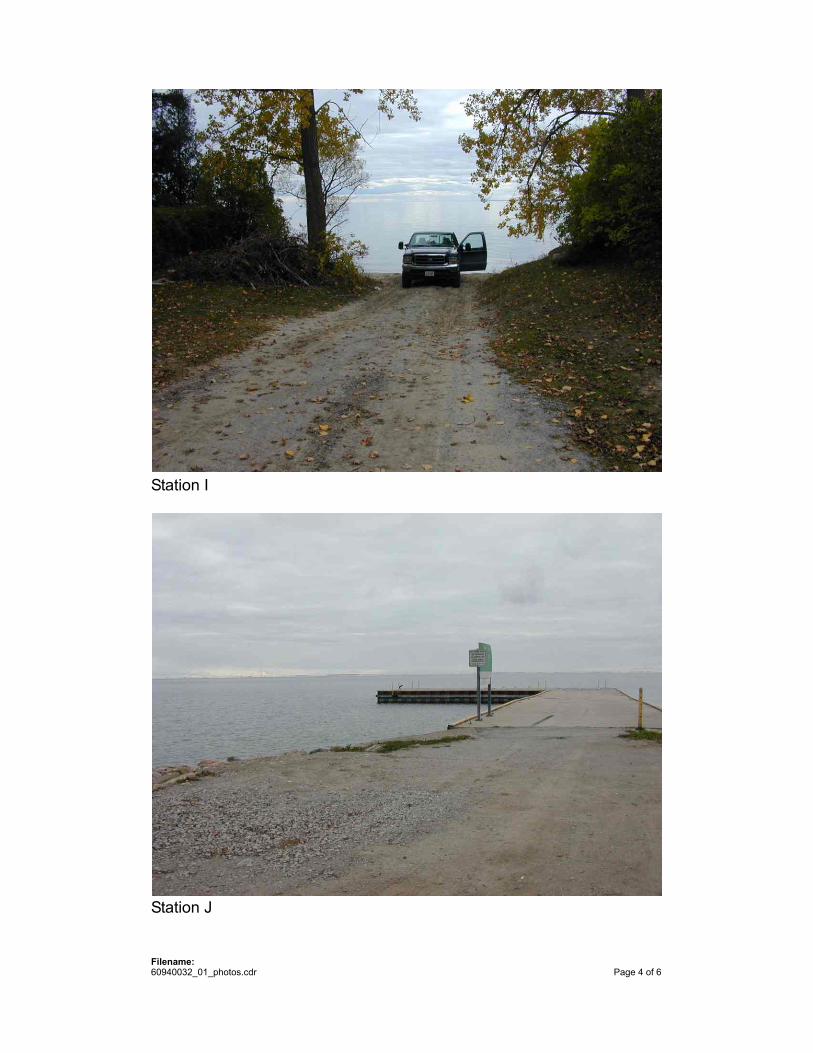
Station I
Station J
Filename: 60940032_01_photos.cdr Page 4 of 6

Station KStation L no photo taken
Station MStation N no photo taken
Filename: 60940032_01_photos.cdr Page 5 of 6
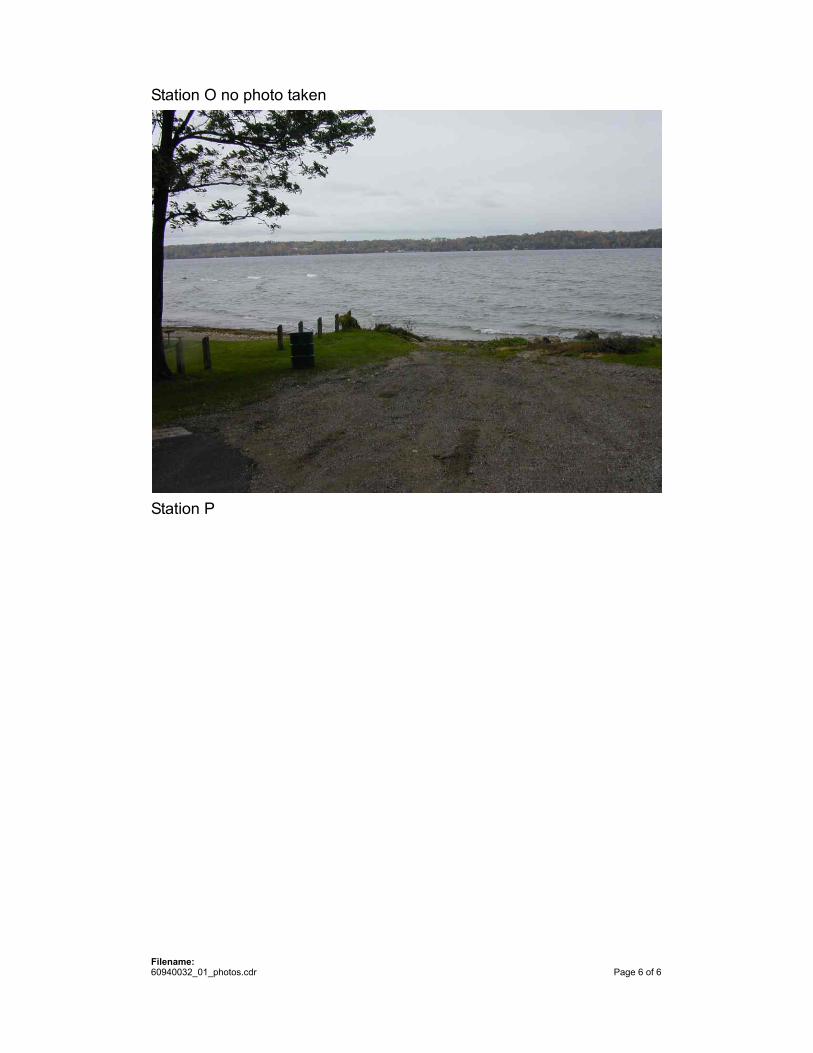
Station O no photo taken
Station P
Filename: 60940032_01_photos.cdr Page 6 of 6

Appendix E
Laboratory Reports
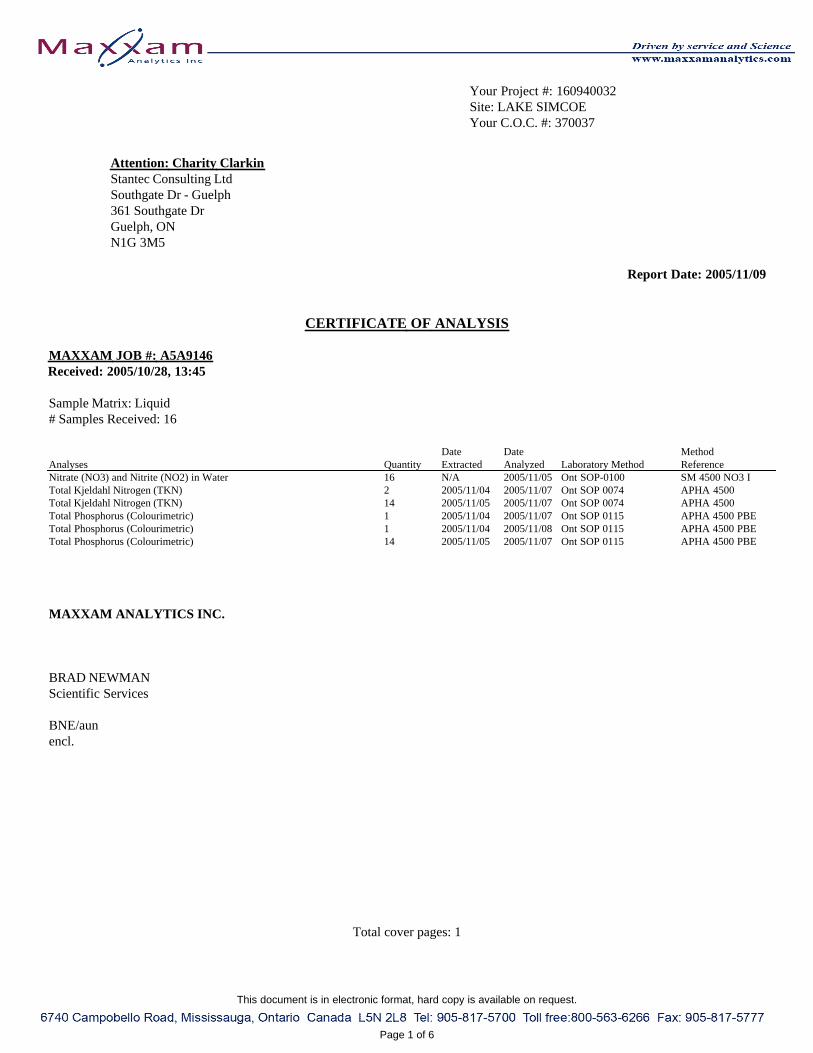
Your Project #: 160940032 Site: LAKE SIMCOE Your C.O.C. #: 370037
Attention: Charity ClarkinStantec Consulting LtdSouthgate Dr - Guelph361 Southgate DrGuelph, ONN1G 3M5
Report Date: 2005/11/09
CERTIFICATE OF ANALYSIS
MAXXAM JOB #: A5A9146Received: 2005/10/28, 13:45
Sample Matrix: Liquid# Samples Received: 16
Date Date MethodAnalyses Quantity Extracted Analyzed Laboratory Method ReferenceNitrate (NO3) and Nitrite (NO2) in Water 16 N/A 2005/11/05 Ont SOP-0100 SM 4500 NO3 I Total Kjeldahl Nitrogen (TKN) 2 2005/11/04 2005/11/07 Ont SOP 0074 APHA 4500 Total Kjeldahl Nitrogen (TKN) 14 2005/11/05 2005/11/07 Ont SOP 0074 APHA 4500 Total Phosphorus (Colourimetric) 1 2005/11/04 2005/11/07 Ont SOP 0115 APHA 4500 PBE Total Phosphorus (Colourimetric) 1 2005/11/04 2005/11/08 Ont SOP 0115 APHA 4500 PBE Total Phosphorus (Colourimetric) 14 2005/11/05 2005/11/07 Ont SOP 0115 APHA 4500 PBE
MAXXAM ANALYTICS INC.
BRAD NEWMANScientific Services
BNE/aunencl.
Total cover pages: 1
This document is in electronic format, hard copy is available on request.
Page 1 of 6

Stantec Consulting LtdMaxxam Job #: A5A9146 Client Project #: 160940032Report Date: 2005/11/09 Project name: LAKE SIMCOE
Sampler Initials:
RESULTS OF ANALYSES OF LIQUID
Maxxam ID J 0 6 3 1 7 J 0 6 3 1 8 J 0 6 3 1 9Sampling Date 2005/10/24 2005/10/24 2005/10/24COC Number 370037 370037 370037 Units STN1 QC Batch STN2 QC Batch STN3 RDL QC Batch
INORGANICS
Total Kjeldahl Nitrogen (TKN) mg/L 0.4 859175 0.4 859175 0.3 0.1 859175
Total Phosphorus mg/L 0.031 859167 0.023 859167 0.019 0.002 859167
Nitrite (N) mg/L ND 857929 ND 857850 ND 0.01 857927
Nitrate (N) mg/L ND 857929 ND 857850 ND 0.1 857927
ND = Not detectedRDL = Reportable Detection LimitQC Batch = Quality Control Batch
Maxxam ID J 0 6 3 2 0 J 0 6 3 2 1 J 0 6 3 2 2Sampling Date 2005/10/26 2005/10/26 2005/10/26COC Number 370037 370037 370037 Units STN7 QC Batch STN9 QC Batch STN10 RDL QC Batch
INORGANICS
Total Kjeldahl Nitrogen (TKN) mg/L 0.4 858667 0.4 859175 0.4 0.1 859175
Total Phosphorus mg/L 0.009 858630 0.015 859167 0.022 0.002 859167
Nitrite (N) mg/L ND 857850 ND 857927 ND 0.01 857850
Nitrate (N) mg/L ND 857850 ND 857927 ND 0.1 857850
ND = Not detectedRDL = Reportable Detection LimitQC Batch = Quality Control Batch
Maxxam ID J 0 6 3 2 3 J 0 6 3 2 4 J 0 6 3 2 5Sampling Date 2005/10/26 2005/10/26 2005/10/26COC Number 370037 370037 370037 Units STN12 QC Batch STN14 QC Batch STN18 RDL QC Batch
INORGANICS
Total Kjeldahl Nitrogen (TKN) mg/L 0.4 858667 0.4 859175 0.4 0.1 859175
Total Phosphorus mg/L 0.012 858653 0.028 859167 0.008 0.002 859167
Nitrite (N) mg/L ND 857927 ND 857757 ND 0.01 857850
Nitrate (N) mg/L ND 857927 ND 857757 ND 0.1 857850
ND = Not detectedRDL = Reportable Detection LimitQC Batch = Quality Control Batch
Page 2 of 6
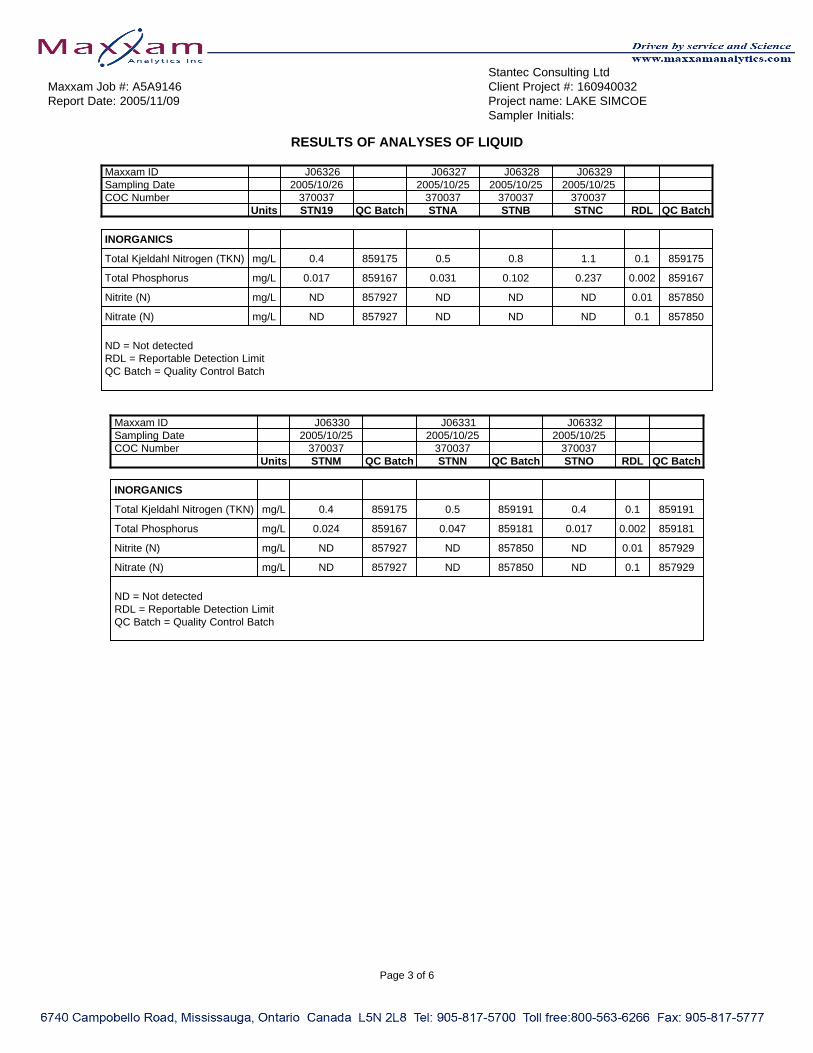
Stantec Consulting LtdMaxxam Job #: A5A9146 Client Project #: 160940032Report Date: 2005/11/09 Project name: LAKE SIMCOE
Sampler Initials:
RESULTS OF ANALYSES OF LIQUID
Maxxam ID J 0 6 3 2 6 J 0 6 3 2 7 J 0 6 3 2 8 J 0 6 3 2 9Sampling Date 2005/10/26 2005/10/25 2005/10/25 2005/10/25COC Number 370037 370037 370037 370037 Units STN19 QC Batch STNA STNB STNC RDL QC Batch
INORGANICS
Total Kjeldahl Nitrogen (TKN) mg/L 0.4 859175 0.5 0.8 1.1 0.1 859175
Total Phosphorus mg/L 0.017 859167 0.031 0.102 0.237 0.002 859167
Nitrite (N) mg/L ND 857927 ND ND ND 0.01 857850
Nitrate (N) mg/L ND 857927 ND ND ND 0.1 857850
ND = Not detectedRDL = Reportable Detection LimitQC Batch = Quality Control Batch
Maxxam ID J 0 6 3 3 0 J 0 6 3 3 1 J 0 6 3 3 2Sampling Date 2005/10/25 2005/10/25 2005/10/25COC Number 370037 370037 370037 Units STNM QC Batch STNN QC Batch STNO RDL QC Batch
INORGANICS
Total Kjeldahl Nitrogen (TKN) mg/L 0.4 859175 0.5 859191 0.4 0.1 859191
Total Phosphorus mg/L 0.024 859167 0.047 859181 0.017 0.002 859181
Nitrite (N) mg/L ND 857927 ND 857850 ND 0.01 857929
Nitrate (N) mg/L ND 857927 ND 857850 ND 0.1 857929
ND = Not detectedRDL = Reportable Detection LimitQC Batch = Quality Control Batch
Page 3 of 6

Stantec Consulting LtdMaxxam Job #: A5A9146 Client Project #: 160940032Report Date: 2005/11/09 Project name: LAKE SIMCOE
Sampler Initials:
GENERAL COMMENTS
Results relate only to the items tested.
Page 4 of 6

Stantec Consulting LtdAttention: Charity Clarkin Client Project #: 160940032P.O. #: Project name: LAKE SIMCOE
Quality Assurance ReportMaxxam Job Number: MA5A9146
QA/QC DateBatch Analyzed
Num Init QC Type Parameter yyyy/mm/dd Value Recovery Units QC Limits857757 AHA MATRIX SPIKE Nitrite (N) 2005/11/05 108 % 75 - 125
Nitrate (N) 2005/11/05 77 % 75 - 125Spiked Blank Nitrite (N) 2005/11/05 96 % 85 - 115
Nitrate (N) 2005/11/05 96 % 85 - 117Method Blank Nitrite (N) 2005/11/05 ND, DL=0.01 mg/L
Nitrate (N) 2005/11/05 ND, DL=0.1 mg/LRPD Nitrite (N) 2005/11/05 NC % 25
Nitrate (N) 2005/11/05 4.7 % 25857850 AHA MATRIX SPIKE
[J06328-02] Nitrite (N) 2005/11/05 100 % 75 - 125Nitrate (N) 2005/11/05 96 % 75 - 125
Spiked Blank Nitrite (N) 2005/11/05 102 % 85 - 115Nitrate (N) 2005/11/05 100 % 85 - 117
Method Blank Nitrite (N) 2005/11/05 ND, DL=0.01 mg/LNitrate (N) 2005/11/05 ND, DL=0.1 mg/L
RPD [ J 0 6 3 2 8 - 0 2 ] Nitrite (N) 2005/11/05 NC % 25Nitrate (N) 2005/11/05 NC % 25
857927 AHA MATRIX SPIKE Nitrite (N) 2005/11/05 98 % 75 - 125Nitrate (N) 2005/11/05 95 % 75 - 125
Spiked Blank Nitrite (N) 2005/11/05 100 % 85 - 115Nitrate (N) 2005/11/05 99 % 85 - 117
Method Blank Nitrite (N) 2005/11/05 ND, DL=0.01 mg/LNitrate (N) 2005/11/05 ND, DL=0.1 mg/L
RPD Nitrate (N) 2005/11/05 NC % 25857929 AHA MATRIX SPIKE Nitrite (N) 2005/11/05 102 % 75 - 125
Nitrate (N) 2005/11/05 100 % 75 - 125Spiked Blank Nitrite (N) 2005/11/05 97 % 85 - 115
Nitrate (N) 2005/11/05 97 % 85 - 117Method Blank Nitrite (N) 2005/11/05 ND, DL=0.01 mg/L
Nitrate (N) 2005/11/05 ND, DL=0.1 mg/LRPD Nitrite (N) 2005/11/05 NC % 25
Nitrate (N) 2005/11/05 NC % 25858630 CN MATRIX SPIKE
[J06320-02] Total Phosphorus 2005/11/07 108 % 75 - 125QC STANDARD Total Phosphorus 2005/11/07 91 % 85 - 115Spiked Blank Total Phosphorus 2005/11/07 85 % 75 - 125Method Blank Total Phosphorus 2005/11/07 ND, DL=0.002 mg/LRPD [ J 0 6 3 2 0 - 0 2 ] Total Phosphorus 2005/11/07 NC % 25
858653 LHA MATRIX SPIKE Total Phosphorus 2005/11/08 90 % 75 - 125QC STANDARD Total Phosphorus 2005/11/08 87 % 85 - 115Method Blank Total Phosphorus 2005/11/08 ND, DL=0.002 mg/LRPD Total Phosphorus 2005/11/08 NC % 25
858667 SBU MATRIX SPIKE[J06320-02] Total Kjeldahl Nitrogen (TKN) 2005/11/07 90 % 75 - 125QC STANDARD Total Kjeldahl Nitrogen (TKN) 2005/11/07 88 % 85 - 115Spiked Blank Total Kjeldahl Nitrogen (TKN) 2005/11/07 85 % 75 - 125Method Blank Total Kjeldahl Nitrogen (TKN) 2005/11/07 ND, DL=0.1 mg/LRPD [ J 0 6 3 2 0 - 0 2 ] Total Kjeldahl Nitrogen (TKN) 2005/11/07 NC % 25
859167 CN MATRIX SPIKE[J06326-01] Total Phosphorus 2005/11/07 87 % 75 - 125QC STANDARD Total Phosphorus 2005/11/07 98 % 85 - 115Spiked Blank Total Phosphorus 2005/11/07 98 % 75 - 125Method Blank Total Phosphorus 2005/11/07 0.003, DL=0.002 mg/LRPD [ J 0 6 3 2 6 - 0 1 ] Total Phosphorus 2005/11/07 12.5 % 25
859175 SBU MATRIX SPIKE[J06326-01] Total Kjeldahl Nitrogen (TKN) 2005/11/07 92 % 75 - 125
This document is in electronic format, hard copy is available on request.
Page 5 of 6

Stantec Consulting LtdAttention: Charity Clarkin Client Project #: 160940032P.O. #: Project name: LAKE SIMCOE
Quality Assurance Report (Continued)Maxxam Job Number: MA5A9146
QA/QC DateBatch Analyzed
Num Init QC Type Parameter yyyy/mm/dd Value Recovery Units QC Limits859175 SBU QC STANDARD Total Kjeldahl Nitrogen (TKN) 2005/11/07 86 % 85 - 115
Spiked Blank Total Kjeldahl Nitrogen (TKN) 2005/11/07 90 % 75 - 125Method Blank Total Kjeldahl Nitrogen (TKN) 2005/11/07 ND, DL=0.1 mg/LRPD [ J 0 6 3 2 6 - 0 1 ] Total Kjeldahl Nitrogen (TKN) 2005/11/07 NC % 25
859181 CN MATRIX SPIKE Total Phosphorus 2005/11/07 103 % 75 - 125QC STANDARD Total Phosphorus 2005/11/07 94 % 85 - 115Spiked Blank Total Phosphorus 2005/11/07 90 % 75 - 125Method Blank Total Phosphorus 2005/11/07 0.004, DL=0.002 mg/LRPD Total Phosphorus 2005/11/07 10.0 % 25
859191 SBU MATRIX SPIKE Total Kjeldahl Nitrogen (TKN) 2005/11/07 98 % 75 - 125QC STANDARD Total Kjeldahl Nitrogen (TKN) 2005/11/07 90 % 85 - 115Spiked Blank Total Kjeldahl Nitrogen (TKN) 2005/11/07 90 % 75 - 125Method Blank Total Kjeldahl Nitrogen (TKN) 2005/11/07 ND, DL=0.1 mg/LRPD Total Kjeldahl Nitrogen (TKN) 2005/11/07 NC % 25
ND = Not detectedNC = Non-calculableRPD = Relative Percent DifferenceQC Standard = Quality Control StandardSPIKE = Fortified sample
This document is in electronic format, hard copy is available on request.
Page 6 of 6
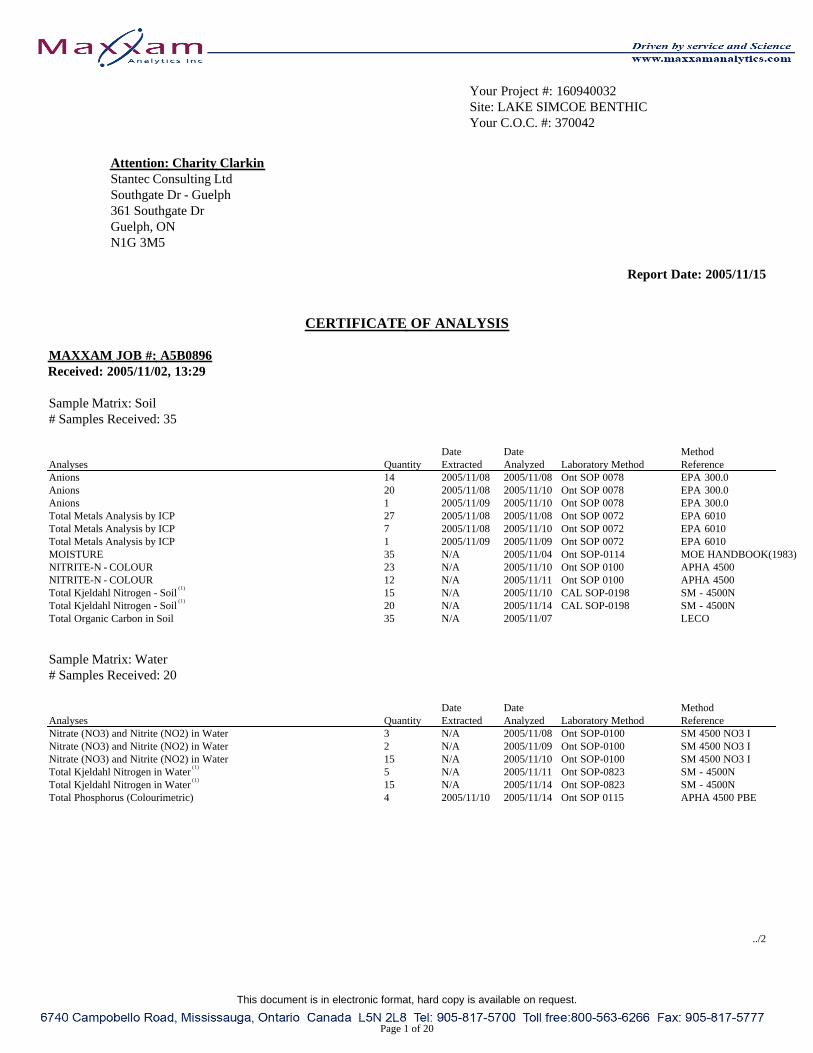
Your Project #: 160940032 Site: LAKE SIMCOE BENTHIC Your C.O.C. #: 370042
Attention: Charity ClarkinStantec Consulting LtdSouthgate Dr - Guelph361 Southgate DrGuelph, ONN1G 3M5
Report Date: 2005/11/15
CERTIFICATE OF ANALYSIS
MAXXAM JOB #: A5B0896Received: 2005/11/02, 13:29
Sample Matrix: Soil# Samples Received: 35
Date Date MethodAnalyses Quantity Extracted Analyzed Laboratory Method ReferenceAnions 14 2005/11/08 2005/11/08 Ont SOP 0078 EPA 300.0 Anions 20 2005/11/08 2005/11/10 Ont SOP 0078 EPA 300.0 Anions 1 2005/11/09 2005/11/10 Ont SOP 0078 EPA 300.0 Total Metals Analysis by ICP 27 2005/11/08 2005/11/08 Ont SOP 0072 EPA 6010 Total Metals Analysis by ICP 7 2005/11/08 2005/11/10 Ont SOP 0072 EPA 6010 Total Metals Analysis by ICP 1 2005/11/09 2005/11/09 Ont SOP 0072 EPA 6010 MOISTURE 35 N/A 2005/11/04 Ont SOP-0114 MOE HANDBOOK(1983) NITRITE-N - COLOUR 23 N/A 2005/11/10 Ont SOP 0100 APHA 4500 NITRITE-N - COLOUR 12 N/A 2005/11/11 Ont SOP 0100 APHA 4500 Total Kjeldahl Nitrogen - Soil
( 1 )15 N/A 2005/11/10 CAL SOP-0198 SM - 4500N
Total Kjeldahl Nitrogen - Soil ( 1 )
20 N/A 2005/11/14 CAL SOP-0198 SM - 4500N Total Organic Carbon in Soil 35 N/A 2005/11/07 L E C O
Sample Matrix: Water# Samples Received: 20
Date Date MethodAnalyses Quantity Extracted Analyzed Laboratory Method ReferenceNitrate (NO3) and Nitrite (NO2) in Water 3 N/A 2005/11/08 Ont SOP-0100 SM 4500 NO3 I Nitrate (NO3) and Nitrite (NO2) in Water 2 N/A 2005/11/09 Ont SOP-0100 SM 4500 NO3 I Nitrate (NO3) and Nitrite (NO2) in Water 15 N/A 2005/11/10 Ont SOP-0100 SM 4500 NO3 I Total Kjeldahl Nitrogen in Water
( 1 )5 N/A 2005/11/11 Ont SOP-0823 SM - 4500N
Total Kjeldahl Nitrogen in Water ( 1 )
15 N/A 2005/11/14 Ont SOP-0823 SM - 4500N Total Phosphorus (Colourimetric) 4 2005/11/10 2005/11/14 Ont SOP 0115 APHA 4500 PBE
../2
This document is in electronic format, hard copy is available on request.
Page 1 of 20

Your Project #: 160940032 Site: LAKE SIMCOE BENTHIC Your C.O.C. #: 370042
Attention: Charity ClarkinStantec Consulting LtdSouthgate Dr - Guelph361 Southgate DrGuelph, ONN1G 3M5
Report Date: 2005/11/15
CERTIFICATE OF ANALYSIS-2-
Sample Matrix: Water# Samples Received: 20
Date Date MethodAnalyses Quantity Extracted Analyzed Laboratory Method ReferenceTotal Phosphorus (Colourimetric) 16 2005/11/11 2005/11/14 Ont SOP 0115 APHA 4500 PBE
(1) SCC/CAEAL
MAXXAM ANALYTICS INC.
BRAD NEWMANScientific Services
BNE/lsaencl.
Total cover pages: 2
This document is in electronic format, hard copy is available on request.
Page 2 of 20

Stantec Consulting LtdMaxxam Job #: A5B0896 Client Project #: 160940032Report Date: 2005/11/15 Project name: LAKE SIMCOE BENTHIC
Sampler Initials:
RESULTS OF ANALYSES OF SOIL
Maxxam ID J 1 5 2 3 6 J 1 5 2 3 7 J 1 5 2 3 8Sampling Date 2005/10/24 2005/10/24 2005/10/24COC Number 370042 370042 370042 Units STN 1 QC Batch STN 2 STN 3 RDL QC Batch
INORGANICS
Total Kjeldahl Nitrogen ug/g 4440 864239 7130 1440 100 864239
INORGANICS
Moisture % 78.0 859007 81.6 50.9 0.2 859007
Nitrite (N) ug/g ND 859687 ND ND 2 859687
Total Organic Carbon mg/kg 42000 860242 65000 16000 500 860242
Nitrate (N) ug/g ND 860757 ND ND 4 860730
Phosphate-P ug/g ND 860757 ND ND 20 860730
ND = Not detectedRDL = Reportable Detection LimitQC Batch = Quality Control Batch
Maxxam ID J 1 5 2 3 9 J 1 5 2 4 0 J 1 5 2 4 1Sampling Date 2005/10/27 2005/10/27 2005/10/27COC Number 370042 370042 370042 Units STN 4 QC Batch STN 5 QC Batch STN 6 RDL QC Batch
INORGANICS
Total Kjeldahl Nitrogen ug/g 629 864346 499 864239 446 10 864346
INORGANICS
Moisture % 34.9 859007 36.9 859007 30.6 0.2 859007
Nitrite (N) ug/g ND 860511 ND 859685 ND 2 860511
Total Organic Carbon mg/kg 7000 860242 4000 860242 4000 500 860242
Nitrate (N) ug/g ND 860730 ND 860730 ND 4 860730
Phosphate-P ug/g ND 860730 ND 860730 ND 20 860730
ND = Not detectedRDL = Reportable Detection LimitQC Batch = Quality Control Batch
Page 3 of 20
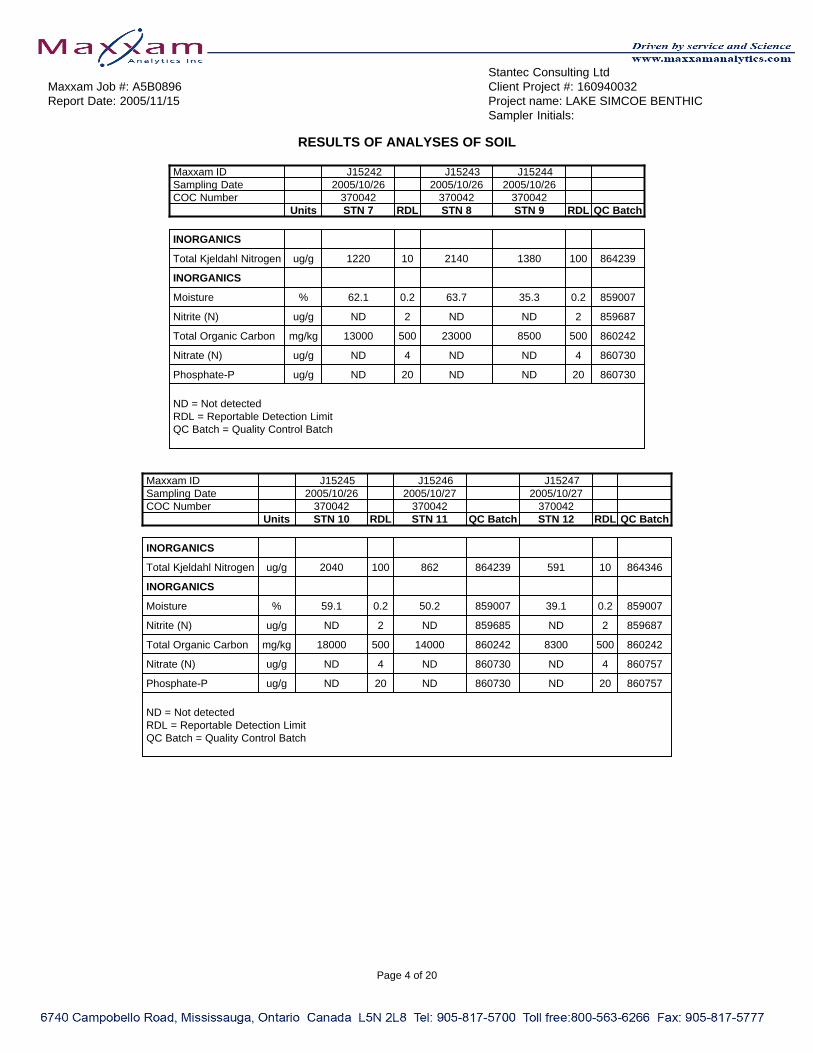
Stantec Consulting LtdMaxxam Job #: A5B0896 Client Project #: 160940032Report Date: 2005/11/15 Project name: LAKE SIMCOE BENTHIC
Sampler Initials:
RESULTS OF ANALYSES OF SOIL
Maxxam ID J 1 5 2 4 2 J 1 5 2 4 3 J 1 5 2 4 4Sampling Date 2005/10/26 2005/10/26 2005/10/26COC Number 370042 370042 370042 Units STN 7 RDL STN 8 STN 9 RDL QC Batch
INORGANICS
Total Kjeldahl Nitrogen ug/g 1220 10 2140 1380 100 864239
INORGANICS
Moisture % 62.1 0.2 63.7 35.3 0.2 859007
Nitrite (N) ug/g ND 2 ND ND 2 859687
Total Organic Carbon mg/kg 13000 500 23000 8500 500 860242
Nitrate (N) ug/g ND 4 ND ND 4 860730
Phosphate-P ug/g ND 20 ND ND 20 860730
ND = Not detectedRDL = Reportable Detection LimitQC Batch = Quality Control Batch
Maxxam ID J 1 5 2 4 5 J 1 5 2 4 6 J 1 5 2 4 7Sampling Date 2005/10/26 2005/10/27 2005/10/27COC Number 370042 370042 370042 Units STN 10 RDL STN 11 QC Batch STN 12 RDL QC Batch
INORGANICS
Total Kjeldahl Nitrogen ug/g 2040 100 862 864239 591 10 864346
INORGANICS
Moisture % 59.1 0.2 50.2 859007 39.1 0.2 859007
Nitrite (N) ug/g ND 2 ND 859685 ND 2 859687
Total Organic Carbon mg/kg 18000 500 14000 860242 8300 500 860242
Nitrate (N) ug/g ND 4 ND 860730 ND 4 860757
Phosphate-P ug/g ND 20 ND 860730 ND 20 860757
ND = Not detectedRDL = Reportable Detection LimitQC Batch = Quality Control Batch
Page 4 of 20
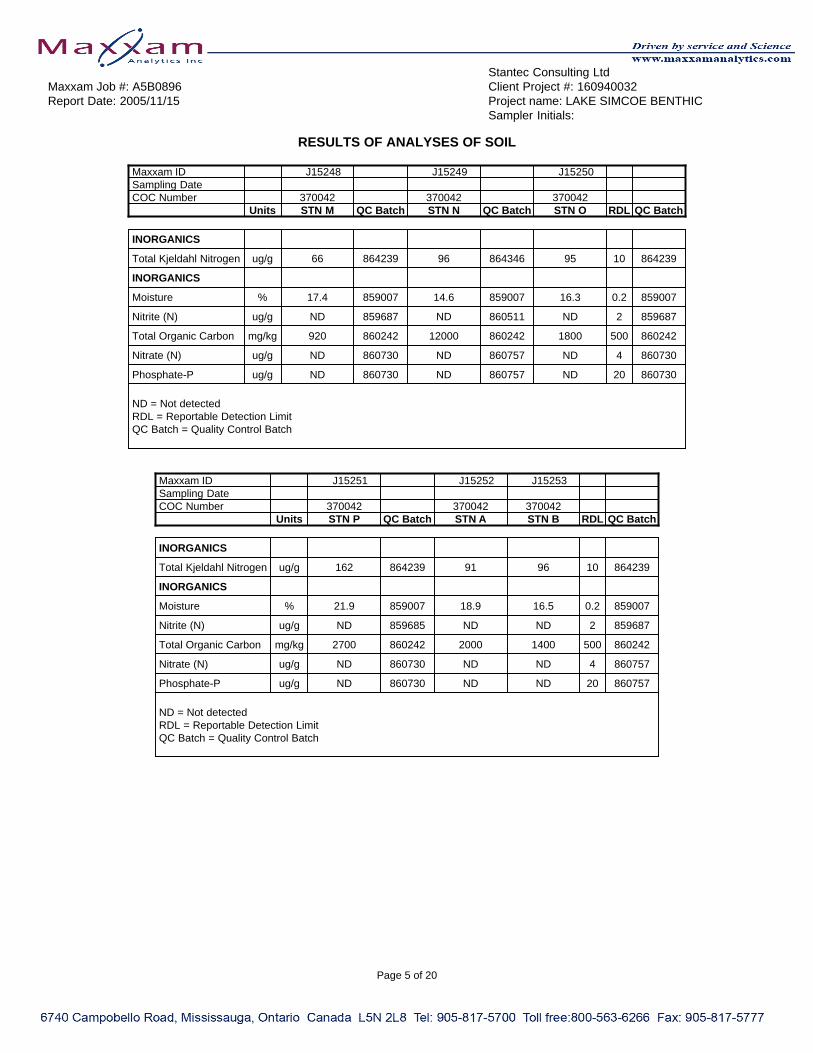
Stantec Consulting LtdMaxxam Job #: A5B0896 Client Project #: 160940032Report Date: 2005/11/15 Project name: LAKE SIMCOE BENTHIC
Sampler Initials:
RESULTS OF ANALYSES OF SOIL
Maxxam ID J 1 5 2 4 8 J 1 5 2 4 9 J 1 5 2 5 0Sampling DateCOC Number 370042 370042 370042 Units STN M QC Batch STN N QC Batch STN O RDL QC Batch
INORGANICS
Total Kjeldahl Nitrogen ug/g 66 864239 96 864346 95 10 864239
INORGANICS
Moisture % 17.4 859007 14.6 859007 16.3 0.2 859007
Nitrite (N) ug/g ND 859687 ND 860511 ND 2 859687
Total Organic Carbon mg/kg 920 860242 12000 860242 1800 500 860242
Nitrate (N) ug/g ND 860730 ND 860757 ND 4 860730
Phosphate-P ug/g ND 860730 ND 860757 ND 20 860730
ND = Not detectedRDL = Reportable Detection LimitQC Batch = Quality Control Batch
Maxxam ID J 1 5 2 5 1 J 1 5 2 5 2 J 1 5 2 5 3Sampling DateCOC Number 370042 370042 370042 Units STN P QC Batch STN A STN B RDL QC Batch
INORGANICS
Total Kjeldahl Nitrogen ug/g 162 864239 91 96 10 864239
INORGANICS
Moisture % 21.9 859007 18.9 16.5 0.2 859007
Nitrite (N) ug/g ND 859685 ND ND 2 859687
Total Organic Carbon mg/kg 2700 860242 2000 1400 500 860242
Nitrate (N) ug/g ND 860730 ND ND 4 860757
Phosphate-P ug/g ND 860730 ND ND 20 860757
ND = Not detectedRDL = Reportable Detection LimitQC Batch = Quality Control Batch
Page 5 of 20
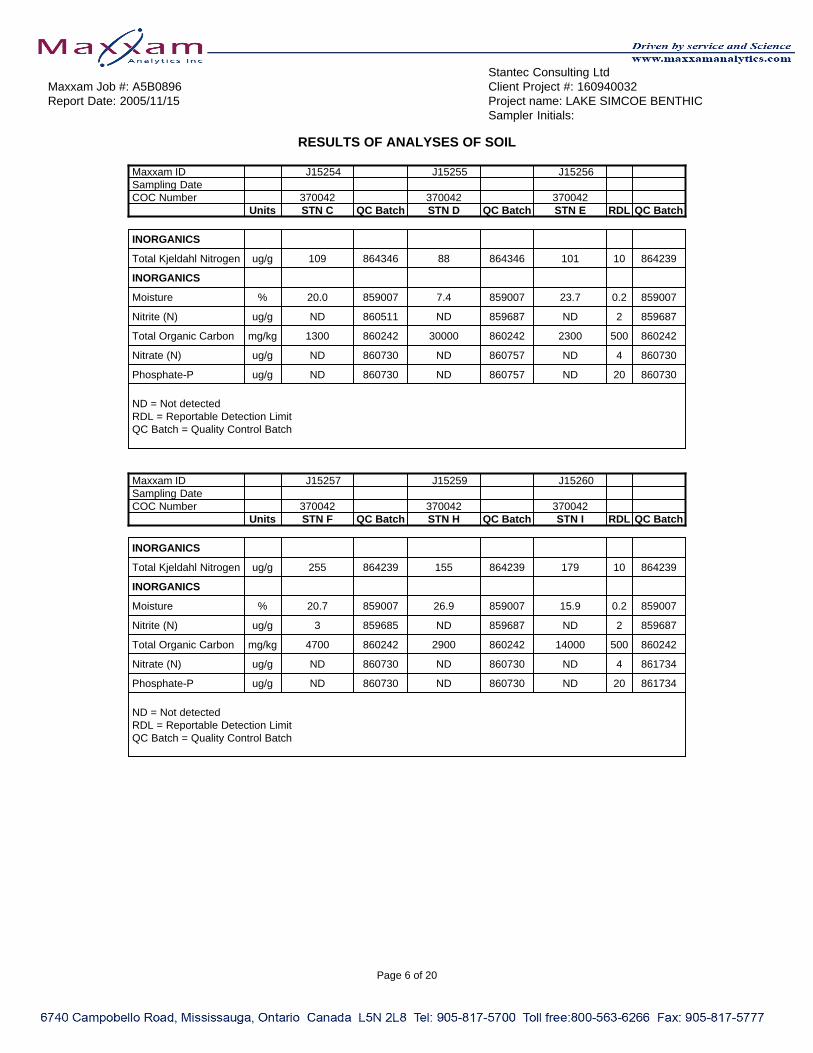
Stantec Consulting LtdMaxxam Job #: A5B0896 Client Project #: 160940032Report Date: 2005/11/15 Project name: LAKE SIMCOE BENTHIC
Sampler Initials:
RESULTS OF ANALYSES OF SOIL
Maxxam ID J 1 5 2 5 4 J 1 5 2 5 5 J 1 5 2 5 6Sampling DateCOC Number 370042 370042 370042 Units STN C QC Batch STN D QC Batch STN E RDL QC Batch
INORGANICS
Total Kjeldahl Nitrogen ug/g 109 864346 88 864346 101 10 864239
INORGANICS
Moisture % 20.0 859007 7.4 859007 23.7 0.2 859007
Nitrite (N) ug/g ND 860511 ND 859687 ND 2 859687
Total Organic Carbon mg/kg 1300 860242 30000 860242 2300 500 860242
Nitrate (N) ug/g ND 860730 ND 860757 ND 4 860730
Phosphate-P ug/g ND 860730 ND 860757 ND 20 860730
ND = Not detectedRDL = Reportable Detection LimitQC Batch = Quality Control Batch
Maxxam ID J 1 5 2 5 7 J 1 5 2 5 9 J 1 5 2 6 0Sampling DateCOC Number 370042 370042 370042 Units STN F QC Batch STN H QC Batch STN I RDL QC Batch
INORGANICS
Total Kjeldahl Nitrogen ug/g 255 864239 155 864239 179 10 864239
INORGANICS
Moisture % 20.7 859007 26.9 859007 15.9 0.2 859007
Nitrite (N) ug/g 3 859685 ND 859687 ND 2 859687
Total Organic Carbon mg/kg 4700 860242 2900 860242 14000 500 860242
Nitrate (N) ug/g ND 860730 ND 860730 ND 4 861734
Phosphate-P ug/g ND 860730 ND 860730 ND 20 861734
ND = Not detectedRDL = Reportable Detection LimitQC Batch = Quality Control Batch
Page 6 of 20

Stantec Consulting LtdMaxxam Job #: A5B0896 Client Project #: 160940032Report Date: 2005/11/15 Project name: LAKE SIMCOE BENTHIC
Sampler Initials:
RESULTS OF ANALYSES OF SOIL
Maxxam ID J 1 5 2 6 1 J 1 5 2 6 2 J 1 5 2 6 3 J 1 5 2 6 4Sampling Date 2005/10/27 2005/10/26COC Number 370042 370042 370042 370042 Units STN J QC Batch STN K STN L STN 13 RDL QC Batch
INORGANICS
Total Kjeldahl Nitrogen ug/g 129 864239 119 44 884 10 864346
INORGANICS
Moisture % 23.3 859007 25.1 23.3 44.2 0.2 859007
Nitrite (N) ug/g ND 859687 ND ND ND 2 860511
Total Organic Carbon mg/kg 1700 860242 1700 900 21000 500 860242
Nitrate (N) ug/g ND 860730 ND ND ND 4 860757
Phosphate-P ug/g ND 860730 ND ND ND 20 860757
ND = Not detectedRDL = Reportable Detection LimitQC Batch = Quality Control Batch
Maxxam ID J 1 5 2 6 5 J 1 5 2 6 6Sampling Date 2005/10/26 2005/10/27COC Number 370042 370042 Units STN 14 RDL QC Batch STN 15 RDL QC Batch
INORGANICS
Total Kjeldahl Nitrogen ug/g 2530 100 864239 411 10 864346
INORGANICS
Moisture % 63.3 0.2 859007 40.9 0.2 859007
Nitrite (N) ug/g ND 2 859687 ND 2 859687
Total Organic Carbon mg/kg 33000 500 860242 4700 500 860242
Nitrate (N) ug/g ND 4 860730 ND 4 860757
Phosphate-P ug/g ND 20 860730 ND 20 860757
ND = Not detectedRDL = Reportable Detection LimitQC Batch = Quality Control Batch
Page 7 of 20

Stantec Consulting LtdMaxxam Job #: A5B0896 Client Project #: 160940032Report Date: 2005/11/15 Project name: LAKE SIMCOE BENTHIC
Sampler Initials:
RESULTS OF ANALYSES OF SOIL
Maxxam ID J 1 5 2 6 7 J 1 5 2 6 8 J 1 5 2 6 9Sampling Date 2005/10/27 2005/10/26 2005/10/26COC Number 370042 370042 370042 Units STN 16 RDL STN 17 STN 18 RDL QC Batch
INORGANICS
Total Kjeldahl Nitrogen ug/g 4000 100 3140 5870 10 864346
INORGANICS
Moisture % 80.3 0.2 85.8 83.1 0.2 859007
Nitrite (N) ug/g ND 2 ND ND 2 860511
Total Organic Carbon mg/kg 49000 500 52000 53000 500 860242
Nitrate (N) ug/g ND 4 ND ND 4 860757
Phosphate-P ug/g ND 20 ND ND 20 860757
ND = Not detectedRDL = Reportable Detection LimitQC Batch = Quality Control Batch
Maxxam ID J 1 5 2 7 0 J 1 5 2 7 1Sampling Date 2005/10/27 2005/10/27COC Number 370042 370042 Units STN 19 RDL QC Batch STN 6A RDL QC Batch
INORGANICS
Total Kjeldahl Nitrogen ug/g 5720 100 864346 512 10 864346
INORGANICS
Moisture % 84.4 0.2 859007 24.8 0.2 859007
Nitrite (N) ug/g ND 2 860511 ND 2 860511
Total Organic Carbon mg/kg 62000 500 860242 5900 500 860242
Nitrate (N) ug/g ND 4 860757 ND 4 860730
Phosphate-P ug/g ND 20 860757 ND 20 860730
ND = Not detectedRDL = Reportable Detection LimitQC Batch = Quality Control Batch
Page 8 of 20
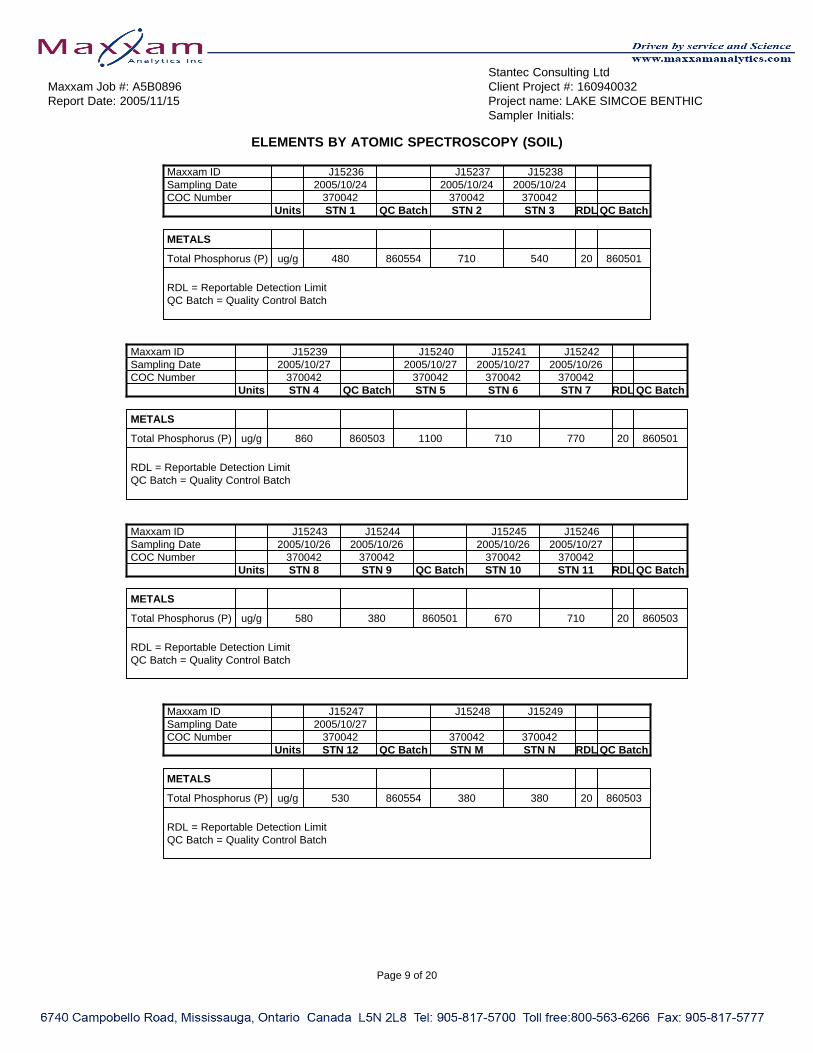
Stantec Consulting LtdMaxxam Job #: A5B0896 Client Project #: 160940032Report Date: 2005/11/15 Project name: LAKE SIMCOE BENTHIC
Sampler Initials:
ELEMENTS BY ATOMIC SPECTROSCOPY (SOIL)
Maxxam ID J 1 5 2 3 6 J 1 5 2 3 7 J 1 5 2 3 8Sampling Date 2005/10/24 2005/10/24 2005/10/24COC Number 370042 370042 370042 Units STN 1 QC Batch STN 2 STN 3 RDL QC Batch
METALS
Total Phosphorus (P) ug/g 480 860554 710 540 20 860501
RDL = Reportable Detection LimitQC Batch = Quality Control Batch
Maxxam ID J 1 5 2 3 9 J 1 5 2 4 0 J 1 5 2 4 1 J 1 5 2 4 2Sampling Date 2005/10/27 2005/10/27 2005/10/27 2005/10/26COC Number 370042 370042 370042 370042 Units STN 4 QC Batch STN 5 STN 6 STN 7 RDL QC Batch
METALS
Total Phosphorus (P) ug/g 860 860503 1100 710 770 20 860501
RDL = Reportable Detection LimitQC Batch = Quality Control Batch
Maxxam ID J 1 5 2 4 3 J 1 5 2 4 4 J 1 5 2 4 5 J 1 5 2 4 6Sampling Date 2005/10/26 2005/10/26 2005/10/26 2005/10/27COC Number 370042 370042 370042 370042 Units STN 8 STN 9 QC Batch STN 10 STN 11 RDL QC Batch
METALS
Total Phosphorus (P) ug/g 580 380 860501 670 710 20 860503
RDL = Reportable Detection LimitQC Batch = Quality Control Batch
Maxxam ID J 1 5 2 4 7 J 1 5 2 4 8 J 1 5 2 4 9Sampling Date 2005/10/27COC Number 370042 370042 370042 Units STN 12 QC Batch STN M STN N RDL QC Batch
METALS
Total Phosphorus (P) ug/g 530 860554 380 380 20 860503
RDL = Reportable Detection LimitQC Batch = Quality Control Batch
Page 9 of 20

Stantec Consulting LtdMaxxam Job #: A5B0896 Client Project #: 160940032Report Date: 2005/11/15 Project name: LAKE SIMCOE BENTHIC
Sampler Initials:
ELEMENTS BY ATOMIC SPECTROSCOPY (SOIL)
Maxxam ID J 1 5 2 5 0 J 1 5 2 5 1 J 1 5 2 5 2 J 1 5 2 5 3Sampling DateCOC Number 370042 370042 370042 370042 Units STN O STN P QC Batch STN A STN B RDL QC Batch
METALS
Total Phosphorus (P) ug/g 440 350 860501 490 800 20 860554
RDL = Reportable Detection LimitQC Batch = Quality Control Batch
Maxxam ID J 1 5 2 5 4 J 1 5 2 5 5 J 1 5 2 5 6Sampling DateCOC Number 370042 370042 370042 Units STN C QC Batch STN D QC Batch STN E RDL QC Batch
METALS
Total Phosphorus (P) ug/g 500 860501 350 860503 660 20 860501
RDL = Reportable Detection LimitQC Batch = Quality Control Batch
Maxxam ID J 1 5 2 5 7 J 1 5 2 5 9 J 1 5 2 6 0Sampling DateCOC Number 370042 370042 370042 Units STN F QC Batch STN H QC Batch STN I RDL QC Batch
METALS
Total Phosphorus (P) ug/g 1000 860503 220 860501 280 20 861742
RDL = Reportable Detection LimitQC Batch = Quality Control Batch
Maxxam ID J 1 5 2 6 1 J 1 5 2 6 2 J 1 5 2 6 3Sampling Date 2005/10/27COC Number 370042 370042 370042 Units STN J QC Batch STN K QC Batch STN L RDL QC Batch
METALS
Total Phosphorus (P) ug/g 330 860501 310 860700 220 20 860554
RDL = Reportable Detection LimitQC Batch = Quality Control Batch
Page 10 of 20

Stantec Consulting LtdMaxxam Job #: A5B0896 Client Project #: 160940032Report Date: 2005/11/15 Project name: LAKE SIMCOE BENTHIC
Sampler Initials:
ELEMENTS BY ATOMIC SPECTROSCOPY (SOIL)
Maxxam ID J 1 5 2 6 4 J 1 5 2 6 5 J 1 5 2 6 6Sampling Date 2005/10/26 2005/10/26 2005/10/27COC Number 370042 370042 370042 Units STN 13 QC Batch STN 14 QC Batch STN 15 RDL QC Batch
METALS
Total Phosphorus (P) ug/g 670 860554 1000 860501 460 20 860554
RDL = Reportable Detection LimitQC Batch = Quality Control Batch
Maxxam ID J 1 5 2 6 7 J 1 5 2 6 8 J 1 5 2 6 9 J 1 5 2 7 0Sampling Date 2005/10/27 2005/10/26 2005/10/26 2005/10/27COC Number 370042 370042 370042 370042 Units STN 16 RDL STN 17 STN 18 STN 19 RDL QC Batch
METALS
Total Phosphorus (P) ug/g 920 30 870 750 1000 20 860554
RDL = Reportable Detection LimitQC Batch = Quality Control Batch
Maxxam ID J 1 5 2 7 1Sampling Date 2005/10/27COC Number 370042 Units STN 6A RDL QC Batch
METALS
Total Phosphorus (P) ug/g 920 20 860501
RDL = Reportable Detection LimitQC Batch = Quality Control Batch
Page 11 of 20

Stantec Consulting LtdMaxxam Job #: A5B0896 Client Project #: 160940032Report Date: 2005/11/15 Project name: LAKE SIMCOE BENTHIC
Sampler Initials:
RESULTS OF ANALYSES OF WATER
Maxxam ID J 1 5 2 1 7 J 1 5 2 1 8 J 1 5 2 1 9Sampling Date 2005/10/27 2005/10/27 2005/10/27COC Number 370042 370042 370042 Units STN 4 QC Batch STN 5 STN 6 RDL QC Batch
CONVENTIONALS
Total Kjeldahl Nitrogen (TKN) mg/L 0.4 863827 0.4 0.4 0.1 863806
INORGANICS
Total Phosphorus mg/L 0.014 863964 0.027 0.010 0.002 863930
Nitrite (N) mg/L ND 859244 ND ND 0.01 859244
Nitrate (N) mg/L ND 859244 ND ND 0.1 859244
ND = Not detectedRDL = Reportable Detection LimitQC Batch = Quality Control Batch
Maxxam ID J 1 5 2 2 0 J 1 5 2 2 1Sampling Date 2005/10/27 2005/10/26COC Number 370042 370042 Units STN 6A QC Batch STN 8 RDL QC Batch
CONVENTIONALS
Total Kjeldahl Nitrogen (TKN) mg/L 0.4 863151 0.4 0.1 863806
INORGANICS
Total Phosphorus mg/L 0.020 863170 0.010 0.002 863930
Nitrite (N) mg/L ND 859244 ND 0.01 859244
Nitrate (N) mg/L ND 859244 ND 0.1 859244
ND = Not detectedRDL = Reportable Detection LimitQC Batch = Quality Control Batch
Page 12 of 20

Stantec Consulting LtdMaxxam Job #: A5B0896 Client Project #: 160940032Report Date: 2005/11/15 Project name: LAKE SIMCOE BENTHIC
Sampler Initials:
RESULTS OF ANALYSES OF WATER
Maxxam ID J 1 5 2 2 2 J 1 5 2 2 3Sampling Date 2005/10/27 2005/10/27COC Number 370042 370042 Units STN 11 QC Batch STN 13 RDL QC Batch
CONVENTIONALS
Total Kjeldahl Nitrogen (TKN) mg/L 0.3 863151 0.4 0.1 863827
INORGANICS
Total Phosphorus mg/L 0.023 863170 0.021 0.002 863964
Nitrite (N) mg/L ND 859244 ND 0.01 859244
Nitrate (N) mg/L ND 859244 ND 0.1 859244
ND = Not detectedRDL = Reportable Detection LimitQC Batch = Quality Control Batch
Maxxam ID J 1 5 2 2 4 J 1 5 2 2 5Sampling Date 2005/10/27 2005/10/27COC Number 370042 370042 Units STN 15 QC Batch STN 16 RDL QC Batch
CONVENTIONALS
Total Kjeldahl Nitrogen (TKN) mg/L 0.3 863151 0.4 0.1 864065
INORGANICS
Total Phosphorus mg/L 0.019 863964 0.011 0.002 864083
Nitrite (N) mg/L ND 859254 ND 0.01 859244
Nitrate (N) mg/L ND 859254 ND 0.1 859244
ND = Not detectedRDL = Reportable Detection LimitQC Batch = Quality Control Batch
Page 13 of 20
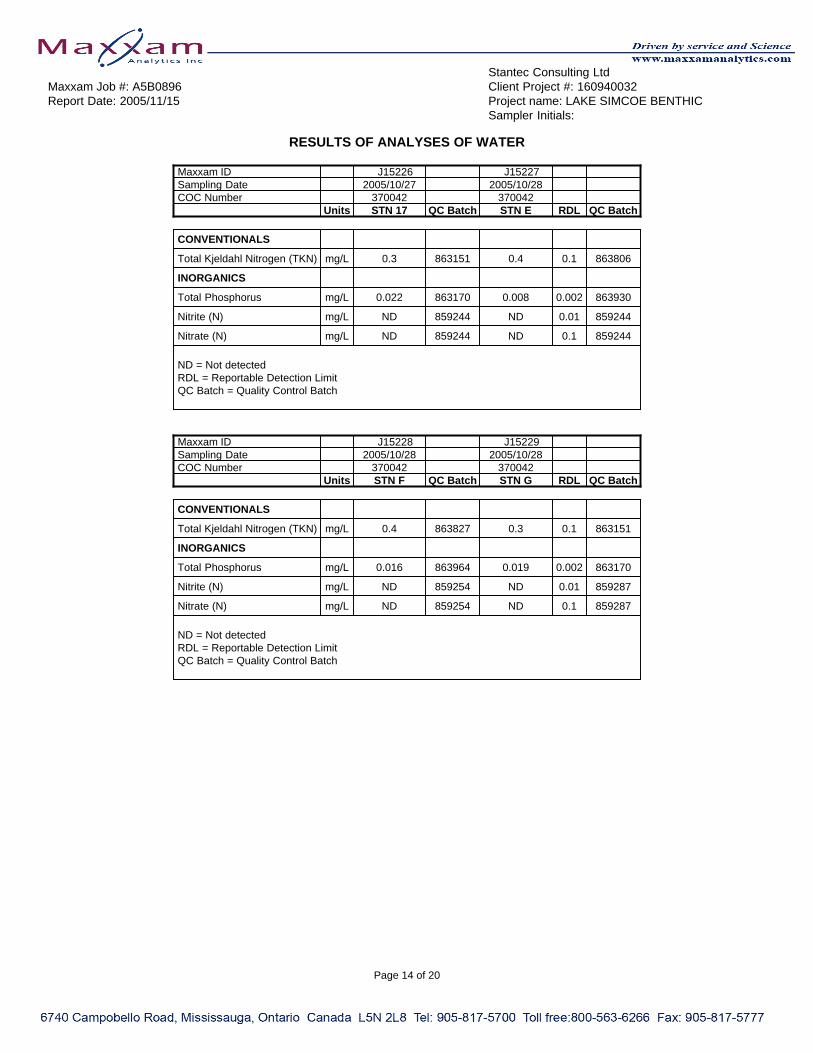
Stantec Consulting LtdMaxxam Job #: A5B0896 Client Project #: 160940032Report Date: 2005/11/15 Project name: LAKE SIMCOE BENTHIC
Sampler Initials:
RESULTS OF ANALYSES OF WATER
Maxxam ID J 1 5 2 2 6 J 1 5 2 2 7Sampling Date 2005/10/27 2005/10/28COC Number 370042 370042 Units STN 17 QC Batch STN E RDL QC Batch
CONVENTIONALS
Total Kjeldahl Nitrogen (TKN) mg/L 0.3 863151 0.4 0.1 863806
INORGANICS
Total Phosphorus mg/L 0.022 863170 0.008 0.002 863930
Nitrite (N) mg/L ND 859244 ND 0.01 859244
Nitrate (N) mg/L ND 859244 ND 0.1 859244
ND = Not detectedRDL = Reportable Detection LimitQC Batch = Quality Control Batch
Maxxam ID J 1 5 2 2 8 J 1 5 2 2 9Sampling Date 2005/10/28 2005/10/28COC Number 370042 370042 Units STN F QC Batch STN G RDL QC Batch
CONVENTIONALS
Total Kjeldahl Nitrogen (TKN) mg/L 0.4 863827 0.3 0.1 863151
INORGANICS
Total Phosphorus mg/L 0.016 863964 0.019 0.002 863170
Nitrite (N) mg/L ND 859254 ND 0.01 859287
Nitrate (N) mg/L ND 859254 ND 0.1 859287
ND = Not detectedRDL = Reportable Detection LimitQC Batch = Quality Control Batch
Page 14 of 20
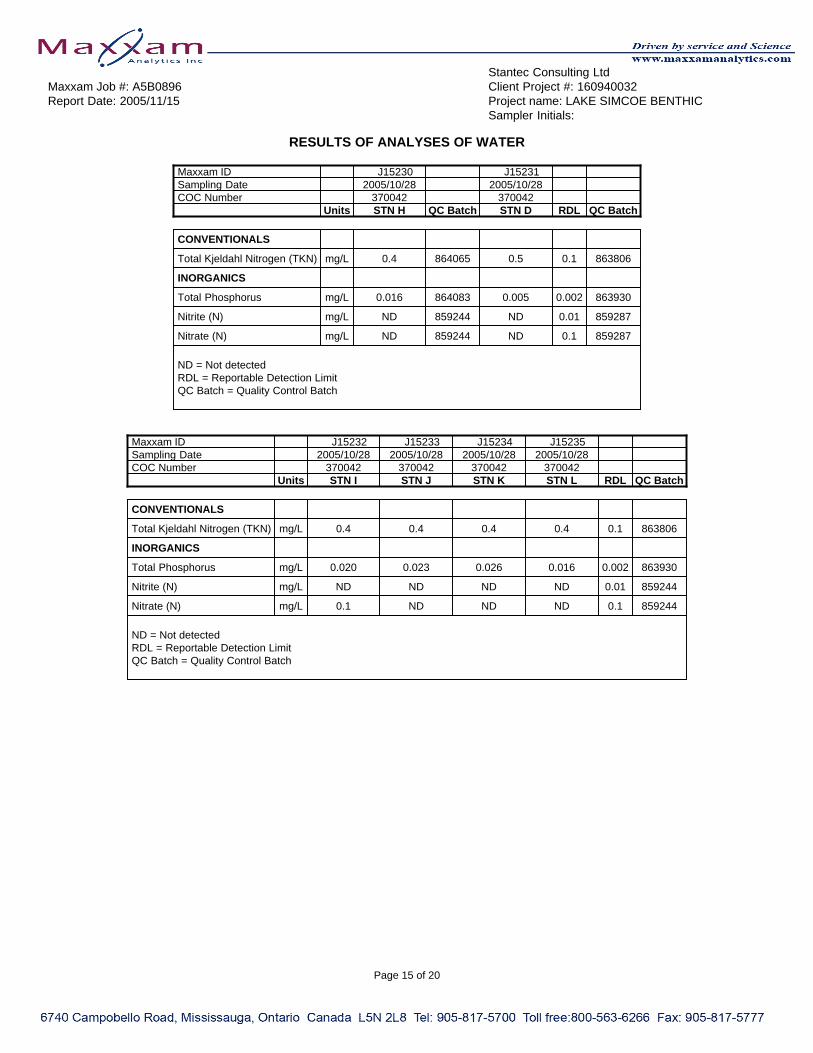
Stantec Consulting LtdMaxxam Job #: A5B0896 Client Project #: 160940032Report Date: 2005/11/15 Project name: LAKE SIMCOE BENTHIC
Sampler Initials:
RESULTS OF ANALYSES OF WATER
Maxxam ID J 1 5 2 3 0 J 1 5 2 3 1Sampling Date 2005/10/28 2005/10/28COC Number 370042 370042 Units STN H QC Batch STN D RDL QC Batch
CONVENTIONALS
Total Kjeldahl Nitrogen (TKN) mg/L 0.4 864065 0.5 0.1 863806
INORGANICS
Total Phosphorus mg/L 0.016 864083 0.005 0.002 863930
Nitrite (N) mg/L ND 859244 ND 0.01 859287
Nitrate (N) mg/L ND 859244 ND 0.1 859287
ND = Not detectedRDL = Reportable Detection LimitQC Batch = Quality Control Batch
Maxxam ID J 1 5 2 3 2 J 1 5 2 3 3 J 1 5 2 3 4 J 1 5 2 3 5Sampling Date 2005/10/28 2005/10/28 2005/10/28 2005/10/28COC Number 370042 370042 370042 370042 Units STN I STN J STN K STN L RDL QC Batch
CONVENTIONALS
Total Kjeldahl Nitrogen (TKN) mg/L 0.4 0.4 0.4 0.4 0.1 863806
INORGANICS
Total Phosphorus mg/L 0.020 0.023 0.026 0.016 0.002 863930
Nitrite (N) mg/L ND ND ND ND 0.01 859244
Nitrate (N) mg/L 0.1 ND ND ND 0.1 859244
ND = Not detectedRDL = Reportable Detection LimitQC Batch = Quality Control Batch
Page 15 of 20
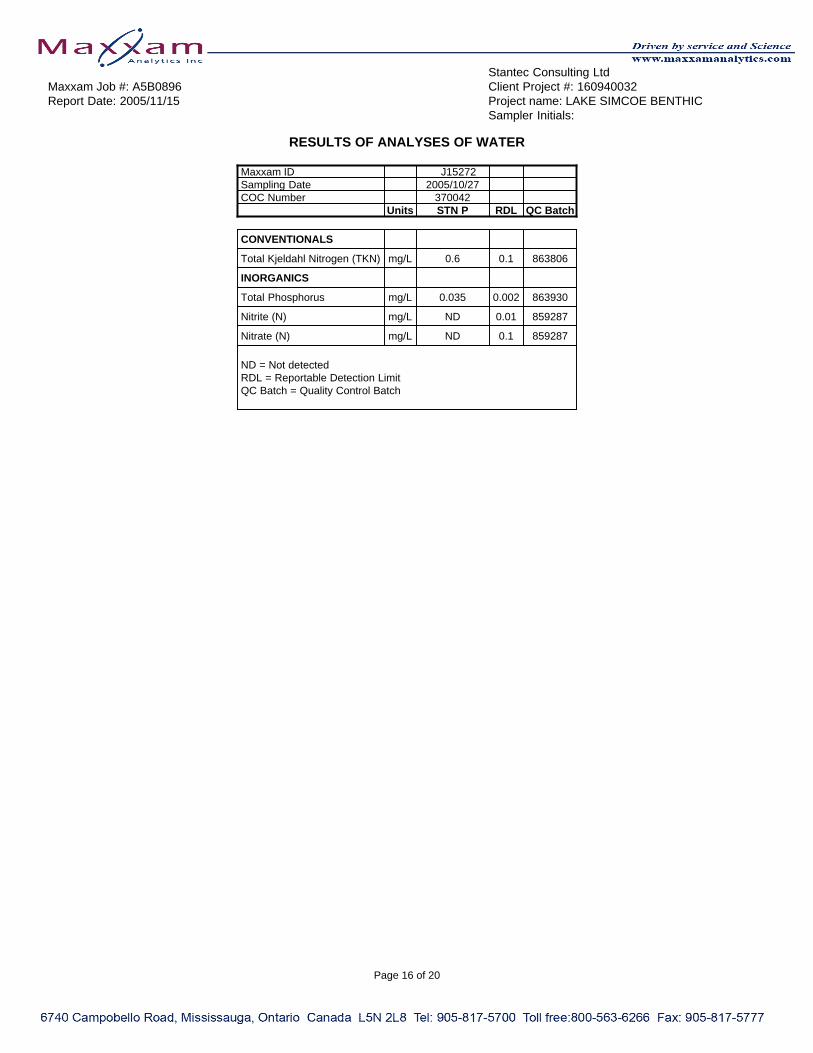
Stantec Consulting LtdMaxxam Job #: A5B0896 Client Project #: 160940032Report Date: 2005/11/15 Project name: LAKE SIMCOE BENTHIC
Sampler Initials:
RESULTS OF ANALYSES OF WATER
Maxxam ID J 1 5 2 7 2Sampling Date 2005/10/27COC Number 370042 Units STN P RDL QC Batch
CONVENTIONALS
Total Kjeldahl Nitrogen (TKN) mg/L 0.6 0.1 863806
INORGANICS
Total Phosphorus mg/L 0.035 0.002 863930
Nitrite (N) mg/L ND 0.01 859287
Nitrate (N) mg/L ND 0.1 859287
ND = Not detectedRDL = Reportable Detection LimitQC Batch = Quality Control Batch
Page 16 of 20
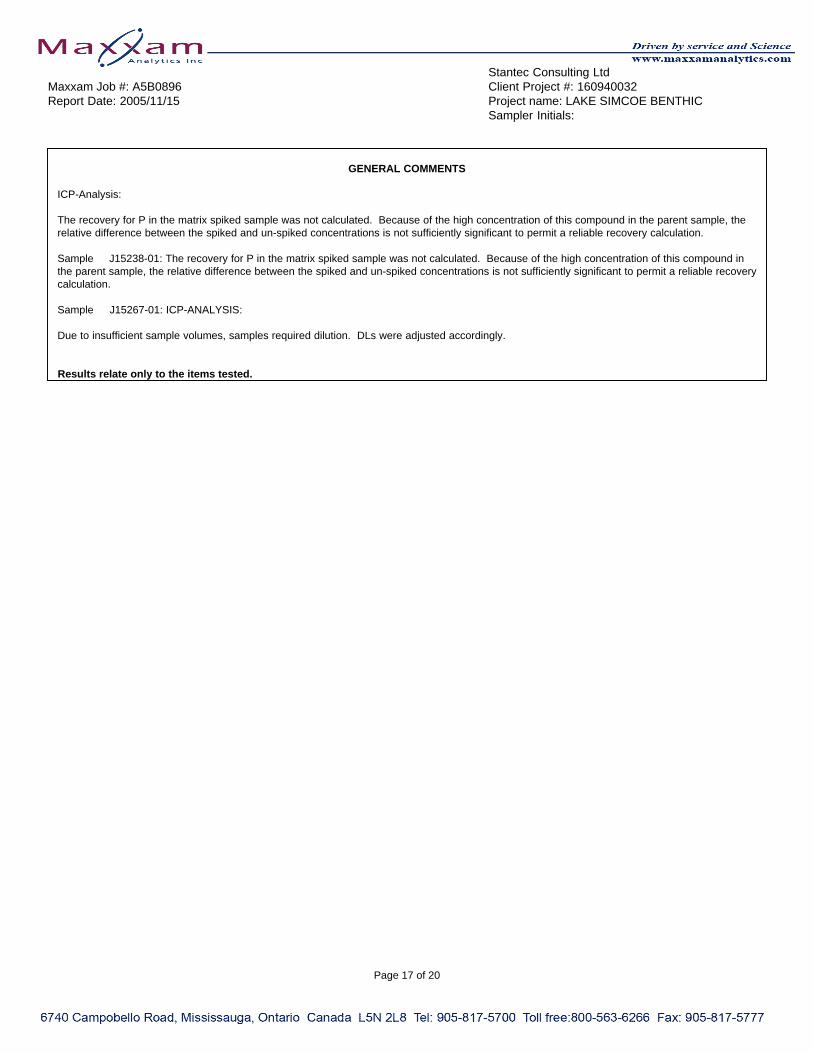
Stantec Consulting LtdMaxxam Job #: A5B0896 Client Project #: 160940032Report Date: 2005/11/15 Project name: LAKE SIMCOE BENTHIC
Sampler Initials:
GENERAL COMMENTS
ICP-Analysis:
The recovery for P in the matrix spiked sample was not calculated. Because of the high concentration of this compound in the parent sample, therelative difference between the spiked and un-spiked concentrations is not sufficiently significant to permit a reliable recovery calculation.
Sample J15238-01: The recovery for P in the matrix spiked sample was not calculated. Because of the high concentration of this compound inthe parent sample, the relative difference between the spiked and un-spiked concentrations is not sufficiently significant to permit a reliable recoverycalculation.
Sample J15267-01: ICP-ANALYSIS:
Due to insufficient sample volumes, samples required dilution. DLs were adjusted accordingly.
Results relate only to the items tested.
Page 17 of 20

Stantec Consulting LtdAttention: Charity Clarkin Client Project #: 160940032P.O. #: Project name: LAKE SIMCOE BENTHIC
Quality Assurance ReportMaxxam Job Number: MA5B0896
QA/QC DateBatch Analyzed
Num Init QC Type Parameter yyyy/mm/dd Value Recovery Units QC Limits859007 SPU RPD [ J 1 5 2 3 7 - 0 1 ] Moisture 2005/11/04 0.2 % 50
Moisture 2005/11/04 4.6 % 50859244 AHA MATRIX SPIKE Nitrite (N) 2005/11/10 104 % 75 - 125
Nitrate (N) 2005/11/10 97 % 75 - 125Spiked Blank Nitrite (N) 2005/11/10 106 % 85 - 115
Nitrate (N) 2005/11/10 92 % 85 - 117Method Blank Nitrite (N) 2005/11/10 ND, DL=0.01 mg/L
Nitrate (N) 2005/11/10 ND, DL=0.1 mg/LRPD Nitrite (N) 2005/11/10 NC % 25
Nitrate (N) 2005/11/10 NC % 25859254 CCI MATRIX SPIKE Nitrite (N) 2005/11/09 104 % 75 - 125
Spiked Blank Nitrite (N) 2005/11/09 103 % 85 - 115Nitrate (N) 2005/11/09 91 % 85 - 117
Method Blank Nitrite (N) 2005/11/09 ND, DL=0.01 mg/LNitrate (N) 2005/11/09 ND, DL=0.1 mg/L
RPD Nitrate (N) 2005/11/09 1.9 % 25859287 CCI MATRIX SPIKE
[J15272-02] Nitrite (N) 2005/11/08 98 % 75 - 125Nitrate (N) 2005/11/08 91 % 75 - 125
Spiked Blank Nitrite (N) 2005/11/08 98 % 85 - 115Nitrate (N) 2005/11/08 90 % 85 - 117
Method Blank Nitrite (N) 2005/11/08 ND, DL=0.01 mg/LNitrate (N) 2005/11/08 ND, DL=0.1 mg/L
RPD [ J 1 5 2 7 2 - 0 2 ] Nitrite (N) 2005/11/08 NC % 25Nitrate (N) 2005/11/08 NC % 25
859685 CCI MATRIX SPIKE Nitrite (N) 2005/11/10 108 % 75 - 125Spiked Blank Nitrite (N) 2005/11/10 103 % 75 - 125Method Blank Nitrite (N) 2005/11/10 ND, DL=2 ug/gRPD Nitrite (N) 2005/11/10 NC % 35
859687 CCI MATRIX SPIKE[J15260-01] Nitrite (N) 2005/11/10 104 % 75 - 125Spiked Blank Nitrite (N) 2005/11/10 103 % 75 - 125Method Blank Nitrite (N) 2005/11/10 ND, DL=2 ug/gRPD [ J 1 5 2 6 0 - 0 1 ] Nitrite (N) 2005/11/10 NC % 35
860242 OK QC STANDARD Total Organic Carbon 2005/11/07 100 % 20 - 120Method Blank Total Organic Carbon 2005/11/07 ND, DL=0.05 mg/kgRPD [ J 1 5 2 3 6 - 0 1 ] Total Organic Carbon 2005/11/07 0.2 % 50
Total Organic Carbon 2005/11/07 1.4 % 50Total Organic Carbon 2005/11/07 1.2 % 50
860501 BGI QC STANDARD Total Phosphorus (P) 2005/11/08 99 % 89 - 111Method Blank Total Phosphorus (P) 2005/11/08 ND, DL=20 ug/gRPD [ J 1 5 2 3 8 - 0 1 ] Total Phosphorus (P) 2005/11/08 0.6 % 35
860503 BGI QC STANDARD Total Phosphorus (P) 2005/11/10 110 % 89 - 111Method Blank Total Phosphorus (P) 2005/11/10 ND, DL=20 ug/gRPD Total Phosphorus (P) 2005/11/10 4.2 % 35
860511 CCI MATRIX SPIKE[J15271-01] Nitrite (N) 2005/11/11 103 % 75 - 125Spiked Blank Nitrite (N) 2005/11/11 103 % 75 - 125Method Blank Nitrite (N) 2005/11/11 ND, DL=2 ug/gRPD [ J 1 5 2 7 1 - 0 1 ] Nitrite (N) 2005/11/11 NC % 35
860554 BGI QC STANDARD Total Phosphorus (P) 2005/11/08 103 % 89 - 111Method Blank Total Phosphorus (P) 2005/11/08 ND, DL=20 ug/gRPD [ J 1 5 2 4 7 - 0 1 ] Total Phosphorus (P) 2005/11/08 1.6 % 35
860700 BGI MATRIX SPIKE Total Phosphorus (P) 2005/11/08 101 % 75 - 125QC STANDARD Total Phosphorus (P) 2005/11/08 106 % 89 - 111Method Blank Total Phosphorus (P) 2005/11/08 ND, DL=20 ug/g
This document is in electronic format, hard copy is available on request.
Page 18 of 20
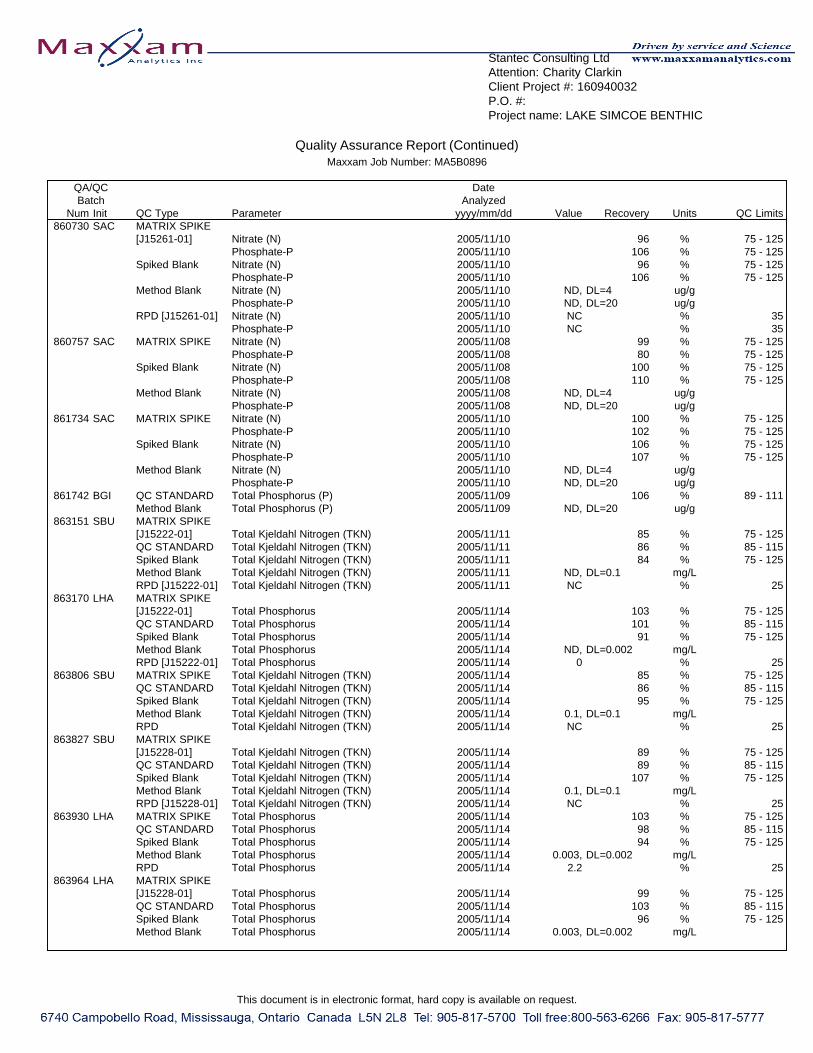
Stantec Consulting LtdAttention: Charity Clarkin Client Project #: 160940032P.O. #: Project name: LAKE SIMCOE BENTHIC
Quality Assurance Report (Continued)Maxxam Job Number: MA5B0896
QA/QC DateBatch Analyzed
Num Init QC Type Parameter yyyy/mm/dd Value Recovery Units QC Limits860730 SAC MATRIX SPIKE
[J15261-01] Nitrate (N) 2005/11/10 96 % 75 - 125Phosphate-P 2005/11/10 106 % 75 - 125
Spiked Blank Nitrate (N) 2005/11/10 96 % 75 - 125Phosphate-P 2005/11/10 106 % 75 - 125
Method Blank Nitrate (N) 2005/11/10 ND, DL=4 ug/gPhosphate-P 2005/11/10 ND, DL=20 ug/g
RPD [ J 1 5 2 6 1 - 0 1 ] Nitrate (N) 2005/11/10 NC % 35Phosphate-P 2005/11/10 NC % 35
860757 SAC MATRIX SPIKE Nitrate (N) 2005/11/08 99 % 75 - 125Phosphate-P 2005/11/08 80 % 75 - 125
Spiked Blank Nitrate (N) 2005/11/08 100 % 75 - 125Phosphate-P 2005/11/08 110 % 75 - 125
Method Blank Nitrate (N) 2005/11/08 ND, DL=4 ug/gPhosphate-P 2005/11/08 ND, DL=20 ug/g
861734 SAC MATRIX SPIKE Nitrate (N) 2005/11/10 100 % 75 - 125Phosphate-P 2005/11/10 102 % 75 - 125
Spiked Blank Nitrate (N) 2005/11/10 106 % 75 - 125Phosphate-P 2005/11/10 107 % 75 - 125
Method Blank Nitrate (N) 2005/11/10 ND, DL=4 ug/gPhosphate-P 2005/11/10 ND, DL=20 ug/g
861742 BGI QC STANDARD Total Phosphorus (P) 2005/11/09 106 % 89 - 111Method Blank Total Phosphorus (P) 2005/11/09 ND, DL=20 ug/g
863151 SBU MATRIX SPIKE[J15222-01] Total Kjeldahl Nitrogen (TKN) 2005/11/11 85 % 75 - 125QC STANDARD Total Kjeldahl Nitrogen (TKN) 2005/11/11 86 % 85 - 115Spiked Blank Total Kjeldahl Nitrogen (TKN) 2005/11/11 84 % 75 - 125Method Blank Total Kjeldahl Nitrogen (TKN) 2005/11/11 ND, DL=0.1 mg/LRPD [ J 1 5 2 2 2 - 0 1 ] Total Kjeldahl Nitrogen (TKN) 2005/11/11 NC % 25
863170 LHA MATRIX SPIKE[J15222-01] Total Phosphorus 2005/11/14 103 % 75 - 125QC STANDARD Total Phosphorus 2005/11/14 101 % 85 - 115Spiked Blank Total Phosphorus 2005/11/14 91 % 75 - 125Method Blank Total Phosphorus 2005/11/14 ND, DL=0.002 mg/LRPD [ J 1 5 2 2 2 - 0 1 ] Total Phosphorus 2005/11/14 0 % 25
863806 SBU MATRIX SPIKE Total Kjeldahl Nitrogen (TKN) 2005/11/14 85 % 75 - 125QC STANDARD Total Kjeldahl Nitrogen (TKN) 2005/11/14 86 % 85 - 115Spiked Blank Total Kjeldahl Nitrogen (TKN) 2005/11/14 95 % 75 - 125Method Blank Total Kjeldahl Nitrogen (TKN) 2005/11/14 0.1, DL=0.1 mg/LRPD Total Kjeldahl Nitrogen (TKN) 2005/11/14 NC % 25
863827 SBU MATRIX SPIKE[J15228-01] Total Kjeldahl Nitrogen (TKN) 2005/11/14 89 % 75 - 125QC STANDARD Total Kjeldahl Nitrogen (TKN) 2005/11/14 89 % 85 - 115Spiked Blank Total Kjeldahl Nitrogen (TKN) 2005/11/14 107 % 75 - 125Method Blank Total Kjeldahl Nitrogen (TKN) 2005/11/14 0.1, DL=0.1 mg/LRPD [ J 1 5 2 2 8 - 0 1 ] Total Kjeldahl Nitrogen (TKN) 2005/11/14 NC % 25
863930 LHA MATRIX SPIKE Total Phosphorus 2005/11/14 103 % 75 - 125QC STANDARD Total Phosphorus 2005/11/14 98 % 85 - 115Spiked Blank Total Phosphorus 2005/11/14 94 % 75 - 125Method Blank Total Phosphorus 2005/11/14 0.003, DL=0.002 mg/LRPD Total Phosphorus 2005/11/14 2.2 % 25
863964 LHA MATRIX SPIKE[J15228-01] Total Phosphorus 2005/11/14 99 % 75 - 125QC STANDARD Total Phosphorus 2005/11/14 103 % 85 - 115Spiked Blank Total Phosphorus 2005/11/14 96 % 75 - 125Method Blank Total Phosphorus 2005/11/14 0.003, DL=0.002 mg/L
This document is in electronic format, hard copy is available on request.
Page 19 of 20

Stantec Consulting LtdAttention: Charity Clarkin Client Project #: 160940032P.O. #: Project name: LAKE SIMCOE BENTHIC
Quality Assurance Report (Continued)Maxxam Job Number: MA5B0896
QA/QC DateBatch Analyzed
Num Init QC Type Parameter yyyy/mm/dd Value Recovery Units QC Limits863964 LHA RPD [ J 1 5 2 2 8 - 0 1 ] Total Phosphorus 2005/11/14 11.8 % 25864065 SBU MATRIX SPIKE Total Kjeldahl Nitrogen (TKN) 2005/11/14 82 % 75 - 125
QC STANDARD Total Kjeldahl Nitrogen (TKN) 2005/11/14 86 % N/ASpiked Blank Total Kjeldahl Nitrogen (TKN) 2005/11/14 105 % 75 - 125Method Blank Total Kjeldahl Nitrogen (TKN) 2005/11/14 ND, DL=0.1 mg/LRPD Total Kjeldahl Nitrogen (TKN) 2005/11/14 NC % 25
864083 LHA MATRIX SPIKE Total Phosphorus 2005/11/14 90 % 75 - 125QC STANDARD Total Phosphorus 2005/11/14 97 % 85 - 115Spiked Blank Total Phosphorus 2005/11/14 87 % 75 - 125Method Blank Total Phosphorus 2005/11/14 ND, DL=0.002 mg/LRPD Total Phosphorus 2005/11/14 0 % 25
864239 SBU MATRIX SPIKE[J15242-01] Total Kjeldahl Nitrogen 2005/11/14 120 % N/AQC STANDARD Total Kjeldahl Nitrogen 2005/11/14 87 % N/ASpiked Blank Total Kjeldahl Nitrogen 2005/11/14 85 % N/AMethod Blank Total Kjeldahl Nitrogen 2005/11/14 ND, DL=0.1 ug/gRPD [ J 1 5 2 4 2 - 0 1 ] Total Kjeldahl Nitrogen 2005/11/14 1.7 % N/A
864346 SBU MATRIX SPIKE[J15247-01] Total Kjeldahl Nitrogen 2005/11/14 110 % N/AQC STANDARD Total Kjeldahl Nitrogen 2005/11/14 90 % N/ASpiked Blank Total Kjeldahl Nitrogen 2005/11/14 88 % N/AMethod Blank Total Kjeldahl Nitrogen 2005/11/14 ND, DL=0.1 ug/gRPD [ J 1 5 2 4 7 - 0 1 ] Total Kjeldahl Nitrogen 2005/11/14 8.2 % N/A
ND = Not detectedN/A = Not ApplicableNC = Non-calculableRPD = Relative Percent DifferenceQC Standard = Quality Control StandardSPIKE = Fortified sample
This document is in electronic format, hard copy is available on request.
Page 20 of 20
Your Project #: MA5B0896 Site: LAKE SIMCOE REGION CONSERVATIO
Attention: SUB CONTRACTORMAXXAM ANALYTICS INC.CAMPOBELLO6740 CAMPOBELLO ROADMISSISSAUGA, ONCANADA L5N 2L8
Report Date: 2005/11/11
CERTIFICATE OF ANALYSIS
MAXXAM JOB #: A547285Received: 2005/11/08, 9:30
Sample Matrix: Soil# Samples Received: 35
Date DateAnalyses Quantity Extracted Analyzed Laboratory Method Analytical MethodParticle Size by Sieve (Wet) ( 1 ) 35 N/A 2005/11/11 CAL SOP# 0045 G R A V I M E T R I C
(1) Result indicates % of sample retained on the sieve.
MAXXAM Analytics Inc.
AZMINA MERALIManager - Inorganics
AM/peencl.
Total cover pages: 1
Calgary: 2021 - 41st Avenue N.E. T2E 6P2 Telephone(403) 291-3077 FAX(403) 291-9468
This document is in electronic format, hard copy is available on request.
Page 1 of 7
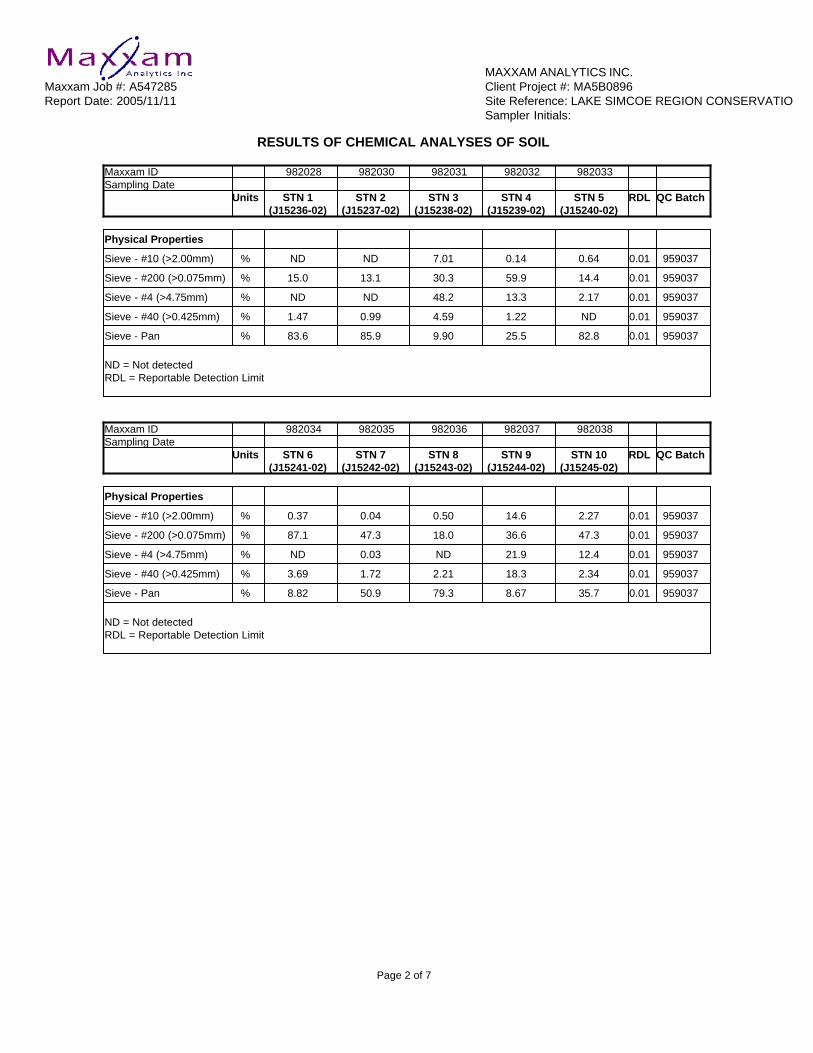
MAXXAM ANALYTICS INC.Maxxam Job #: A547285 Client Project #: MA5B0896Report Date: 2005/11/11 Site Reference: LAKE SIMCOE REGION CONSERVATIO
Sampler Initials:
RESULTS OF CHEMICAL ANALYSES OF SOIL
Maxxam ID 9 8 2 0 2 8 9 8 2 0 3 0 9 8 2 0 3 1 9 8 2 0 3 2 9 8 2 0 3 3Sampling Date Units STN 1 STN 2 STN 3 STN 4 STN 5 RDL QC Batch
(J15236-02) (J15237-02) (J15238-02) (J15239-02) (J15240-02)
Physical Properties
Sieve - #10 (>2.00mm) % ND ND 7.01 0.14 0.64 0.01 959037
Sieve - #200 (>0.075mm) % 15.0 13.1 30.3 59.9 14.4 0.01 959037
Sieve - #4 (>4.75mm) % ND ND 48.2 13.3 2.17 0.01 959037
Sieve - #40 (>0.425mm) % 1.47 0.99 4.59 1.22 ND 0.01 959037
Sieve - Pan % 83.6 85.9 9.90 25.5 82.8 0.01 959037
ND = Not detectedRDL = Reportable Detection Limit
Maxxam ID 9 8 2 0 3 4 9 8 2 0 3 5 9 8 2 0 3 6 9 8 2 0 3 7 9 8 2 0 3 8Sampling Date Units STN 6 STN 7 STN 8 STN 9 STN 10 RDL QC Batch
(J15241-02) (J15242-02) (J15243-02) (J15244-02) (J15245-02)
Physical Properties
Sieve - #10 (>2.00mm) % 0.37 0.04 0.50 14.6 2.27 0.01 959037
Sieve - #200 (>0.075mm) % 87.1 47.3 18.0 36.6 47.3 0.01 959037
Sieve - #4 (>4.75mm) % ND 0.03 ND 21.9 12.4 0.01 959037
Sieve - #40 (>0.425mm) % 3.69 1.72 2.21 18.3 2.34 0.01 959037
Sieve - Pan % 8.82 50.9 79.3 8.67 35.7 0.01 959037
ND = Not detectedRDL = Reportable Detection Limit
Page 2 of 7
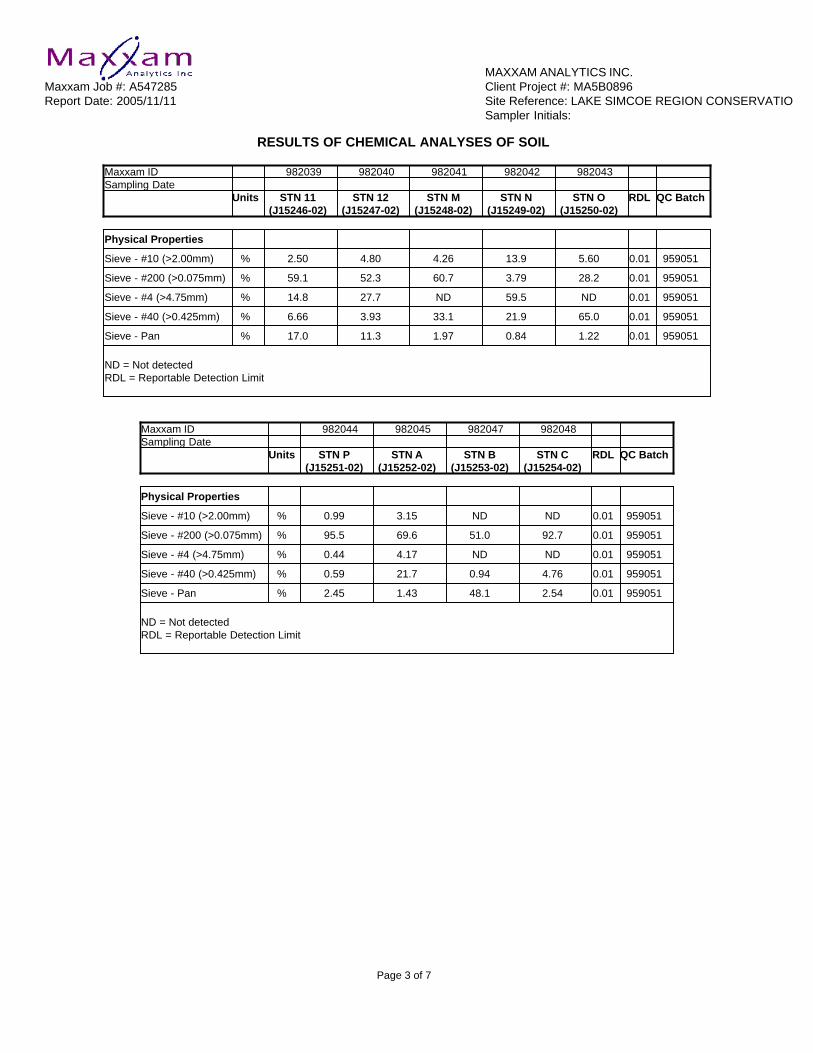
MAXXAM ANALYTICS INC.Maxxam Job #: A547285 Client Project #: MA5B0896Report Date: 2005/11/11 Site Reference: LAKE SIMCOE REGION CONSERVATIO
Sampler Initials:
RESULTS OF CHEMICAL ANALYSES OF SOIL
Maxxam ID 9 8 2 0 3 9 9 8 2 0 4 0 9 8 2 0 4 1 9 8 2 0 4 2 9 8 2 0 4 3Sampling Date Units STN 11 STN 12 STN M STN N STN O RDL QC Batch
(J15246-02) (J15247-02) (J15248-02) (J15249-02) (J15250-02)
Physical Properties
Sieve - #10 (>2.00mm) % 2.50 4.80 4.26 13.9 5.60 0.01 959051
Sieve - #200 (>0.075mm) % 59.1 52.3 60.7 3.79 28.2 0.01 959051
Sieve - #4 (>4.75mm) % 14.8 27.7 ND 59.5 ND 0.01 959051
Sieve - #40 (>0.425mm) % 6.66 3.93 33.1 21.9 65.0 0.01 959051
Sieve - Pan % 17.0 11.3 1.97 0.84 1.22 0.01 959051
ND = Not detectedRDL = Reportable Detection Limit
Maxxam ID 9 8 2 0 4 4 9 8 2 0 4 5 9 8 2 0 4 7 9 8 2 0 4 8Sampling Date Units STN P STN A STN B STN C RDL QC Batch
(J15251-02) (J15252-02) (J15253-02) (J15254-02)
Physical Properties
Sieve - #10 (>2.00mm) % 0.99 3.15 ND ND 0.01 959051
Sieve - #200 (>0.075mm) % 95.5 69.6 51.0 92.7 0.01 959051
Sieve - #4 (>4.75mm) % 0.44 4.17 ND ND 0.01 959051
Sieve - #40 (>0.425mm) % 0.59 21.7 0.94 4.76 0.01 959051
Sieve - Pan % 2.45 1.43 48.1 2.54 0.01 959051
ND = Not detectedRDL = Reportable Detection Limit
Page 3 of 7
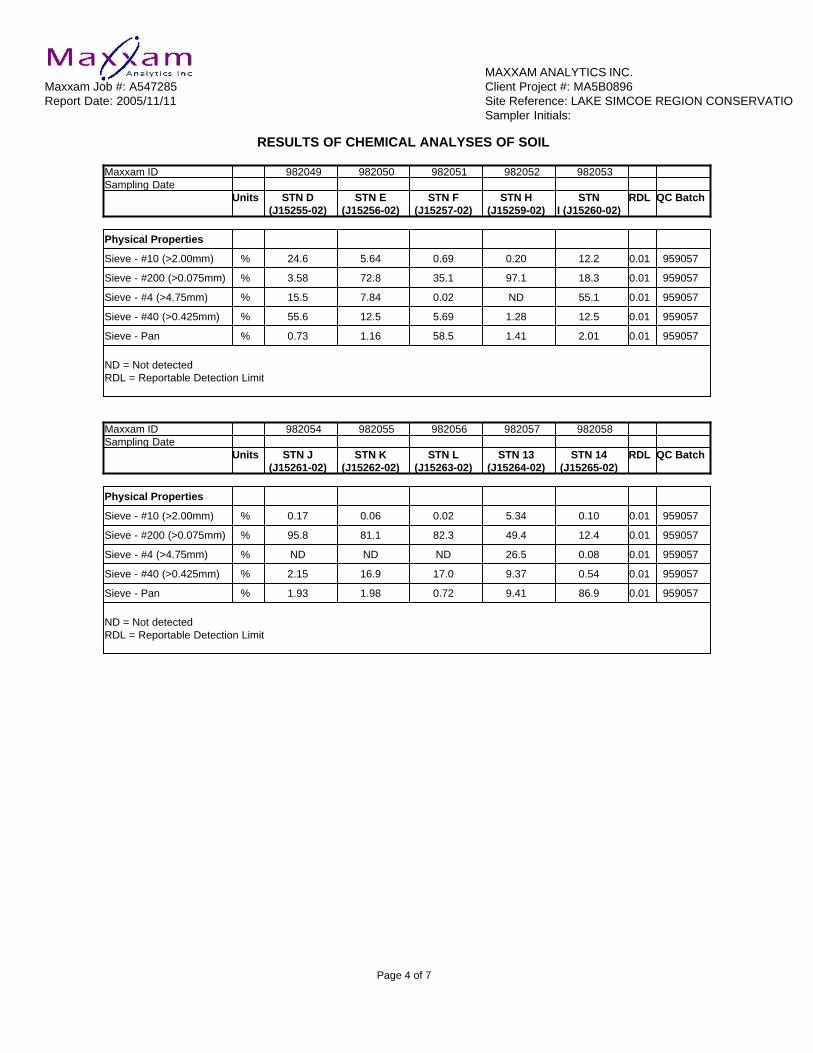
MAXXAM ANALYTICS INC.Maxxam Job #: A547285 Client Project #: MA5B0896Report Date: 2005/11/11 Site Reference: LAKE SIMCOE REGION CONSERVATIO
Sampler Initials:
RESULTS OF CHEMICAL ANALYSES OF SOIL
Maxxam ID 9 8 2 0 4 9 9 8 2 0 5 0 9 8 2 0 5 1 9 8 2 0 5 2 9 8 2 0 5 3Sampling Date Units STN D STN E STN F STN H STN RDL QC Batch
(J15255-02) (J15256-02) (J15257-02) (J15259-02) I (J15260-02)
Physical Properties
Sieve - #10 (>2.00mm) % 24.6 5.64 0.69 0.20 12.2 0.01 959057
Sieve - #200 (>0.075mm) % 3.58 72.8 35.1 97.1 18.3 0.01 959057
Sieve - #4 (>4.75mm) % 15.5 7.84 0.02 ND 55.1 0.01 959057
Sieve - #40 (>0.425mm) % 55.6 12.5 5.69 1.28 12.5 0.01 959057
Sieve - Pan % 0.73 1.16 58.5 1.41 2.01 0.01 959057
ND = Not detectedRDL = Reportable Detection Limit
Maxxam ID 9 8 2 0 5 4 9 8 2 0 5 5 9 8 2 0 5 6 9 8 2 0 5 7 9 8 2 0 5 8Sampling Date Units STN J STN K STN L STN 13 STN 14 RDL QC Batch
(J15261-02) (J15262-02) (J15263-02) (J15264-02) (J15265-02)
Physical Properties
Sieve - #10 (>2.00mm) % 0.17 0.06 0.02 5.34 0.10 0.01 959057
Sieve - #200 (>0.075mm) % 95.8 81.1 82.3 49.4 12.4 0.01 959057
Sieve - #4 (>4.75mm) % ND ND ND 26.5 0.08 0.01 959057
Sieve - #40 (>0.425mm) % 2.15 16.9 17.0 9.37 0.54 0.01 959057
Sieve - Pan % 1.93 1.98 0.72 9.41 86.9 0.01 959057
ND = Not detectedRDL = Reportable Detection Limit
Page 4 of 7
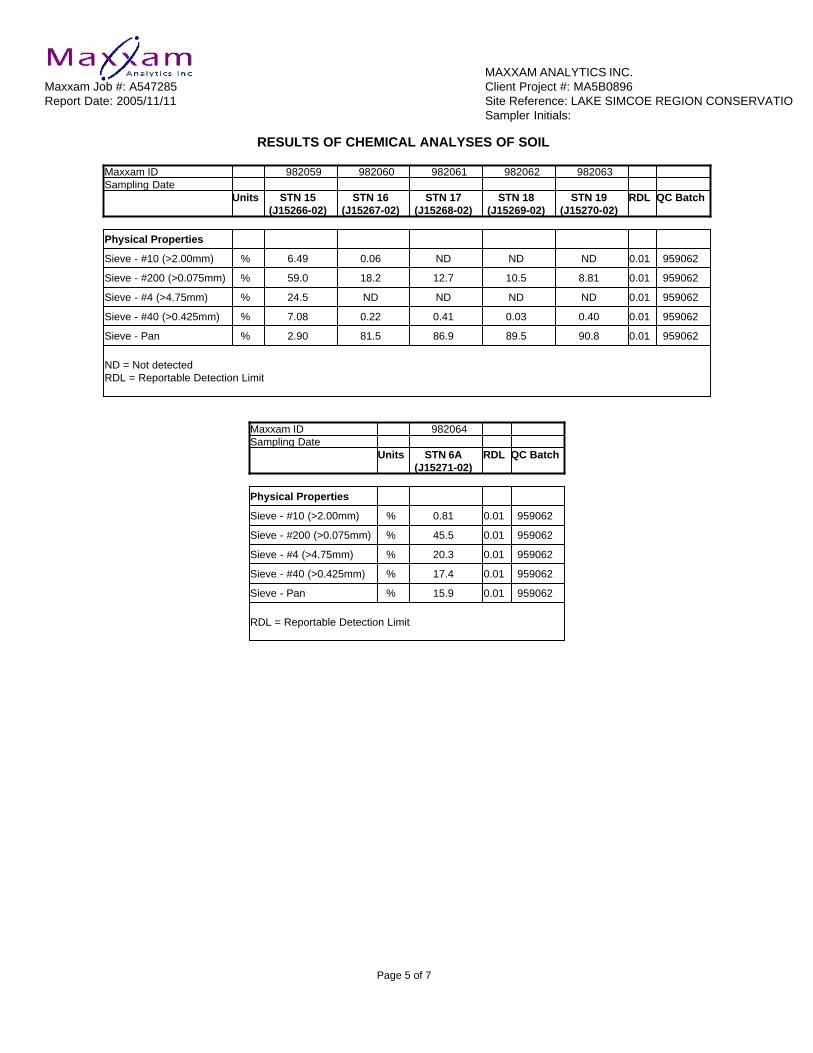
MAXXAM ANALYTICS INC.Maxxam Job #: A547285 Client Project #: MA5B0896Report Date: 2005/11/11 Site Reference: LAKE SIMCOE REGION CONSERVATIO
Sampler Initials:
RESULTS OF CHEMICAL ANALYSES OF SOIL
Maxxam ID 9 8 2 0 5 9 9 8 2 0 6 0 9 8 2 0 6 1 9 8 2 0 6 2 9 8 2 0 6 3Sampling Date Units STN 15 STN 16 STN 17 STN 18 STN 19 RDL QC Batch
(J15266-02) (J15267-02) (J15268-02) (J15269-02) (J15270-02)
Physical Properties
Sieve - #10 (>2.00mm) % 6.49 0.06 ND ND ND 0.01 959062
Sieve - #200 (>0.075mm) % 59.0 18.2 12.7 10.5 8.81 0.01 959062
Sieve - #4 (>4.75mm) % 24.5 ND ND ND ND 0.01 959062
Sieve - #40 (>0.425mm) % 7.08 0.22 0.41 0.03 0.40 0.01 959062
Sieve - Pan % 2.90 81.5 86.9 89.5 90.8 0.01 959062
ND = Not detectedRDL = Reportable Detection Limit
Maxxam ID 9 8 2 0 6 4Sampling Date Units STN 6A RDL QC Batch
(J15271-02)
Physical Properties
Sieve - #10 (>2.00mm) % 0.81 0.01 959062
Sieve - #200 (>0.075mm) % 45.5 0.01 959062
Sieve - #4 (>4.75mm) % 20.3 0.01 959062
Sieve - #40 (>0.425mm) % 17.4 0.01 959062
Sieve - Pan % 15.9 0.01 959062
RDL = Reportable Detection Limit
Page 5 of 7

MAXXAM ANALYTICS INC.Maxxam Job #: A547285 Client Project #: MA5B0896Report Date: 2005/11/11 Site Reference: LAKE SIMCOE REGION CONSERVATIO
Sampler Initials:
General Comments
Results relate only to the items tested.
Page 6 of 7

MAXXAM ANALYTICS INC.Attention: SUB CONTRACTOR Client Project #: MA5B0896P.O. #: Site Reference: LAKE SIMCOE REGION CONSERVATIO
Quality Assurance ReportMaxxam Job Number: CA547285
QA/QC DateBatch Analyzed
Num Init QC Type Parameter yyyy/mm/dd Value Recovery Units QC Limits959037 DC QC STANDARD Sieve - #200 (>0.075mm) 2005/11/11 90 % 76 - 124
RPD Sieve - #200 (>0.075mm) 2005/11/11 6.8 % N/AQC STANDARD Sieve - Pan 2005/11/11 110 % 85 - 115RPD Sieve - Pan 2005/11/11 3.7 % N/A
959051 DC QC STANDARD Sieve - #200 (>0.075mm) 2005/11/11 106 % 76 - 124RPD Sieve - #200 (>0.075mm) 2005/11/11 5.2 % N/AQC STANDARD Sieve - Pan 2005/11/11 100 % 85 - 115RPD Sieve - Pan 2005/11/11 3.6 % N/A
959057 DC QC STANDARD Sieve - #200 (>0.075mm) 2005/11/11 105 % 76 - 124RPD Sieve - #200 (>0.075mm) 2005/11/11 6.7 % N/AQC STANDARD Sieve - Pan 2005/11/11 101 % 85 - 115RPD Sieve - Pan 2005/11/11 4.7 % N/A
959062 DC QC STANDARD Sieve - #200 (>0.075mm) 2005/11/11 102 % 76 - 124RPD Sieve - #200 (>0.075mm) 2005/11/11 2.7 % N/AQC STANDARD Sieve - Pan 2005/11/11 103 % 85 - 115RPD Sieve - Pan 2005/11/11 1.8 % N/A
N/A = Not ApplicableRPD = Relative Percent Difference
Calgary: 2021 - 41st Avenue N.E. T2E 6P2 Telephone(403) 291-3077 FAX(403) 291-9468
This document is in electronic format, hard copy is available on request.
Page 7 of 7