Embed Size (px)
Citation preview
Beyond Black and White
Metropolitan Residential Segregation in Multi-Ethnic America∗
John Iceland
Housing and Household Economic Statistics Division
U.S. Census Bureau
Paper presented at the American Sociological Association meetings, Chicago, Illinois,
August 16-19, 2002
∗ Direct all correspondence to John Iceland, Housing and Household Economic StatisticsDivision, Bldg 3 Rm 1472, Mail Stop: 8500, U.S. Census Bureau, Washington, DC 20233-8500,[email protected]. This paper does not reflect the official views of the U.S. Census Bureau. Itreports the results of research and analysis undertaken by Census Bureau staff, and hasundergone a more limited review than official Census Bureau publications. It is released toinform interested parties of research and to encourage discussion.
Beyond Black and White: Metropolitan Residential Segregation in Multi-Ethnic America
Abstract
Whether greater racial and ethnic diversity in the United States is being accompanied by greater
integration remains unclear. This analysis examines segregation in the multiethnic context over
the 1980 to 2000 period by using the multi-race entropy index, which simultaneously takes the
presence of many groups into account while also looking at the segregation of each group
separately. Results indicate that segregation has been decreasing, mainly due to declines in Black
segregation and White segregation with little change or slight increases in Asian and Pacific
Islander and Hispanic segregation. Diversity tends to have little effect on segregation overall,
though it does reduce African American segregation in particular. Metropolitan areas with
greater growth in Hispanic and Asian and Pacific Islander populations experience greater growth
in Hispanic and Asian and Pacific Islander segregation, respectively, suggesting that this
population growth likely buttresses ethnic enclaves.
1
Beyond Black and White: Metropolitan Residential Segregation in Multi-Ethnic America
The United States is steadily becoming a multi-racial and multi-ethnic country. The
number of Asians and Pacific Islanders, Hispanics, African Americans, and American Indians
and Alaska Natives has grown much more rapidly than the White population over the last few
decades. Before changes to immigration policy in the 1960s, immigrants in the 20th century came
predominantly from Europe; today they arrive from countries across the globe. They and their
offspring often live in areas where people of a variety of other backgrounds also live. However,
it remains unclear if multiethnic areas are ones where groups share many of the same
neighborhoods with each other or if homogeneous ethnic enclaves predominate. Some studies
suggest that multiethnic metropolitan areas may indeed differ. Segregation—even that between
Blacks and Whites—appears to be lower in places where significant numbers of people from
many groups are present, perhaps because this mix decreases the intensity of antipathy between
any two particular groups (Frey and Farley 1996). Because segregation systematically
undermines the social and economic well-being of minority group members (Galster 1987,
Massey and Denton 1993), these findings may provide cause for cautious optimism about the
future course of their well-being.
This analysis is guided by a number of questions: How segregated are the nation’s
metropolitan areas when taking the multiethnic character of the country into account? Do places
with a more diverse population have less segregation? How have patterns changed between 1980
and 2000? Does greater metropolitan diversity reduce segregation between particular ethnic
groups? I address these questions by using 1980 to 2000 Census data from metropolitan areas
and their constituent neighborhoods nationwide. In addition to using the most recent data
available, this analysis provides a methodological advantage over many previous studies. The
2
most widely cited segregation measures, such as the dissimilarity and isolation indexes, are
limited because they calculate segregation for only two groups at a time. In the traditional dual-
group context of Blacks and Whites, this limitation was not a serious one. More recent studies
that have attempted to grapple with the multi-ethnic context have tended to present segregation
scores for different dyad combinations—Black-White, Asian-White, Hispanic-White—and so
on, with non-Hispanic Whites often serving as the reference group. The obvious drawback is that
these studies lack a simple summary statistic on segregation when many groups are present.
These studies also fail to measure segregation between the non-White populations, as this
involves calculating even more segregation statistics which are then an even bigger challenge to
synthesize and understand. This analysis overcomes this by using an index which can
simultaneously takes the presence of many groups into account—the multi-race entropy index. I
also examine the multigroup entropy diversity score, which is not a measure of segregation per
se, to look at the growing diversity of U.S. metropolitan areas. Neither of these are new
measures, but they have seldom been applied to the issues under consideration here.
Segregation in the Multi-Ethnic Context
The nation has become markedly more diverse over the last few decades. The proportion
of the population that is non-Hispanic White declined from 83.5 percent in 1970 to 75.8 percent
in 1990, and to about 69.1 percent in 2000 (Harrison and Bennett 1995, U.S. Census Bureau
2001).1 By 2050, this figure is projected to decline to about 52.5 percent (Harrison and Bennett
1995). The trends are even more visible in some of the nation’s largest cities: 6 of the 10 largest
cities were “majority minority” in 1990.
1 The 69.1 percent figure refers to the proportion of people in 2000 who reported being non-Hispanic and Whitealone.
3
Immigration from Asia and Latin America has played a large role in this growing
diversity. The rapid increase of these populations is a result of the 1965 Immigration Act, which
ended a system of national quotas which favored immigration from Europe. Other factors
contributing to increasing diversity include the decline in fertility rates among the non-Hispanic
White (and Black) populations, and the increasing number of people identifying themselves as at
least part American Indian.
Studies find varying patterns of segregation across groups over the last few decades.
Blacks are the most segregated group, though segregation declined modestly over the last few
decades. The most common measure of segregation, the dissimilarity index, showed that
segregation between African Americans and non-Hispanic Whites averaged across all U.S.
metropolitan areas declined from 73 in 1980 to 68 in 1990,and to 64 in 2000 (Iceland and
Weinberg 2002). This score can be interpreted as the percentage of a group’s population that
would have to change residence so that the group would be evenly distributed across
neighborhoods in a metropolitan area. A score of 0 indicates perfect integration, while 100
indicates complete segregation.
These measures show Hispanics and Asians and Pacific Islanders to be significantly less
segregated than Blacks, but their level of segregation remained about the same or increased
slightly over the 1980 to 2000 period. This is probably due to the concentration of new
immigrants outweighing the residential dispersion of longer-term residents (Harrison and
Bennett 1995). American Indians and Alaska Natives in metropolitan areas are relatively less
segregated, and have become slightly less so over the period.
Several factors contribute to racial and ethnic residential segregation. Socioeconomic
differences and varying housing costs vary across neighborhoods should produce some
4
segregation between groups(Pascal 1967). Some research suggests that segregation is lower for
higher socioeconomic status minority members, though less so for Blacks than for Hispanics and
Asians (Logan et al. 1996).
Others emphasize the importance of discrimination in the real estate and housing
financing institutions (Massey and Denton 1993, Yinger 1995). In American Apartheid, Massey
and Denton (1993) described the steering of African-American home buyers and renters toward
certain neighborhoods and the greater obstacles Black home buyers face when trying to buy
homes than Whites who were otherwise similar in income and education.
People’s preferences for living in neighborhoods with their ethnic group, or conversely,
the desire to avoid another particular group or groups also play a key role (Clark 1986, 1992,
Emerson et al. 2001, Farley 1978). Clark reports (1992) that Whites have the strongest own-race
preference, though he finds these preferences among other minority groups as well. Emerson and
his co-authors find that, holding other factors constant, while Asian and Hispanic composition
does not matter to Whites buying a home, Black neighborhood composition does. Schelling
(1971) mathematically described how relatively minor variations in neighborhood racial and
ethnic preferences can lead to distinct patterns of separation in society. Denton and Massey
(1991) argue that “white flight” from central cities and White home buyers’ avoidance of
integrated areas contributes to segregation. Negative out-group stereotypes also reduce openness
to integration (Bobo and Zubrinksky 1996, Farley et al. 1994), and Blacks tend to be perceived
in the most unfavorable terms (Zubrinsky Charles 2000, 2001).
The growth of a diverse minority population in cities has lead to the rise of multiethnic
areas. Why should segregation in these areas differ from past patterns? Frey and Farley (1996)
posit that having multiple minority groups moderates the single minority vs. White majority
5
thinking that may influence real estate marketing in much of the country. They also mention that
Latinos and Asians often serve as “buffer” groups between initially White and Black
neighborhoods, resulting in less segregation between Blacks and the other minority groups than
between Blacks and Whites. Continued Asian and Latino immigration into ethnic enclaves may
simultaneously reinforce segregation in those enclaves, but also decrease segregation between
the native-born of those groups and others, including Blacks, as they spread outward into more
integrated communities.
Studies of the 1970s and 1980s have generally shown that Black segregation is lower in
multiethnic metropolitan areas (Frey and Farley 1996, Denton and Massey 1991, Lee and Wood
1991). Frey and Farley (1996) specifically find that declines in Black segregation were
significantly greater in multiethnic metropolitan areas. They find while Latino and Asian
segregation levels tend to be higher in multiethnic areas in 1990, Latino segregation declined
more from 1980 to 1990 in such areas and both Latino and Asian segregation declined in
response to the growth of other minority groups. Denton and Massey (1991) report mixed results.
Examining data from 1970 and 1980, they find that on the one hand, all-White neighborhoods
have become rare, and the simple presence of racial or ethnic minorities in small numbers no
longer precipitate rapid neighborhood turnover. The percent of census tracts where Black,
Hispanic, and Asians were present (at least 30 of each group) rose from 19.9 percent in 1970 to
42.1 percent in 1980. Even minority ghettos in cities such as New York are now more likely to
contain both Blacks and Hispanics rather than just Blacks (Alba et al 1995). Denton and Massey
go on to discuss the increasing inappropriateness of Black-White two-group model of
neighborhood change, and describe how the great majority of Whites now accept open housing
at least in principle, even if they do not like its implications in practice.
6
However, Denton and Massey also report that White population loss is greater in
neighborhoods where multiple groups are present. It has also been argued that conceptually,
Black-White segregation may be higher in metro areas where there are more Blacks and other
racial and ethnic minorities because Whites have a certain tolerance for the presence of the non-
White population as a whole in neighborhoods where they live (Krivo and Kaufman 1999). In a
different vein, other researchers have also found that group-specific (i.e. Asian, Latino, African
American) segregation is higher in metropolitan areas where those groups are most concentrated
(Glaeser and Vigdor 2001, Mumford Center 2001).
A remaining question is not only what happens to Black segregation, Asian and Pacific
Islander segregation, and Hispanic segregation in multiethnic cities, but overall segregation in
these areas. Frey and Farley (1996), for example, note that their own study is “limited because it
evaluates segregation pattern of one minority group in relation to the rest of the population rather
than examining different combinations of racial and ethnic groups” (Frey and Farley 1996, pg.
49). This analysis explores the relation between diversity and segregation using rarely-used
multiethnic measures of these phenomenon, and examines how patterns have changed over the
1980 to 2000 period.
While this analysis is mainly exploratory given the dearth of information we have on
multi-group segregation, I hypothesize that more diverse metropolitan areas will have lower
segregation and be more likely to experience declines in segregation over the period. This
follows from the argument above that the presence of multiple groups reduces antipathy and
segregation relative to when just two groups are present.
Data and Methods
7
This analysis is based on Summary File 1 data from the 1980, 1990, and 2000 decennial
censuses. The main data issues involved in analyzing racial and ethnic residential segregation
revolve around the definition of racial and ethnic categories, geographic boundaries, and
segregation measures. These are now discussed in turn.
Race and Ethnicity
In 1977, the Office of Management and Budget (OMB) issued its Statistical Policy
Directive 15, which provided the framework for federal data collection on race and ethnicity to
federal agencies, including the Census Bureau for the 1980 decennial census. The OMB directed
agencies to focus on data collection for four racial groups – White, Negro or Black, American
Indian, Eskimo, or Aleut; and Asian or Pacific Islander – and one ethnicity – Hispanic, Latino, or
Spanish origin. The questions on the 1980 and 1990 censuses asked individuals to self-identify
with one of these four racial groups and whether they were Hispanic or not.2
After much research and public comment in the 1990s, the OMB revised the Nation’s
racial classification to include five categories – White, Black or African American, American
Indian or Alaska Native, Asian, and Native Hawaiian or other Pacific Islander. An additional
major change was to permit the self-identification of individuals as “one or more races.” While a
small fraction of the population had already been doing so on previous census forms, this new
directive made this practice permissible in data collection activities.
This change naturally challenges the researcher to determine the best way to present
historical data. To facilitate comparisons across time, I use minority race/ethnicity definitions
2The Population Censuses have a special dispensation from OMB to allow individuals todesignate “Some Other Race” rather than one of those specifically listed. Because ofCongressional directives, the decennial census questions also ask about specific Asian andPacific Islander races (e.g., Chinese).
8
that could be rather closely reproduced in the three different decades, and which closely
approximate 1990 census categories. I constructed 6 mutually exclusive and exhaustive
categories: Non-Hispanic Whites, Non-Hispanic African Americans, Non-Hispanic Asians and
Pacific Islanders, Non-Hispanic American Indians and Alaska Natives, Non-Hispanics of other
races, and Hispanics. Having mutually exclusive and exhaustive categories is essential for
constructing a single multiracial index. For Census 2000, this involved combining the Asian and
Native Hawaiian or other Pacific Islander groups. In addition, non-Hispanic people who
identified themselves as being of two or more races in 2000 were also categorized as “other”
since people could not mark more than one race in 1980 or 1990. Census 2000 figures indicate
that 4.6 million, or 1.6 percent of the population, designated themselves as multiracial (and non-
Hispanic). People who reported being Hispanic were categorized as such, regardless of their
response to the race question.
Geographic Areas
Residential segregation describes the distribution of different groups across units within
larger areas. Thus, to measure residential segregation, one has to define both the appropriate area
and its component parts. While residential segregation can occur at any geographic level, I have
chosen to focus on metropolitan areas as reasonable approximations of housing markets. These
are operationalized by using independent and Primary MSAs, referred to hereafter as
metropolitan areas, or MAs. One alternative, Combined Metropolitan Statistical Areas (CMSAs)
seems too large. The New York CMSA, for example, stretches from Pennsylvania to
Connecticut. To facilitate comparisons over time, I used the definition of MA boundaries in
effect during Census 2000, issued by the Office of Management and Budget on June 30, 1999.
9
To address the second geographic consideration, this analysis uses census tracts. These units are
designed with the intent of representing neighborhoods, are delineated with substantial local
input, and thereby a reasonable choice from a heuristic perspective. Also, census tracts are the
unit of analysis typically chosen by other researchers.
In 2000, there were 331 MAs in the U.S. For this analysis, six MAs were omitted
(Barnstable-Yarmouth, MA, Flagstaff, AZ-UT, Greenville, NC, Jonesboro, AR, Myrtle Beach,
SC, and Punta Gorda, FL) because they had fewer than 9 census tracts and populations of less
than 41,000 in 1980. All other MAs used had populations of at least 50,000, which is typically
one of the criteria for defining an area an MA.
Segregation Measures
Residential segregation has been the subject of extensive research for many years, and a
number of different measures of segregation have been developed over this time. Reardon and
Firebaugh (2000) note that all major reviews of segregation indexes limit their discussion to
dichotomous measures of segregation (e.g. Duncan and Duncan 1955, James and Taeuber 1985,
Massey and Denton 1988, White 1986, Zoloth 1976, Massey, White and Phua 1996). The
earliest of the multigroup indexes is the entropy index (H), also called the information theory
index, which was defined by Theil (Theil 1972, Theil and Finezza 1971).
The entropy index is a measure of “evenness”—the extent to which groups are evenly
distributed among organizational units (Massey and Denton 1988). More specifically, Theil
described entropy as a measure of the average difference between a unit’s group proportions and
that of the system as a whole (Theil 1972). H can also be interpreted as the difference between
the diversity (entropy) of the system and the weighted average diversity of individual units,
10
expressed as a fraction of the total diversity (entropy) of the system (Reardon and Firebaugh
2000).
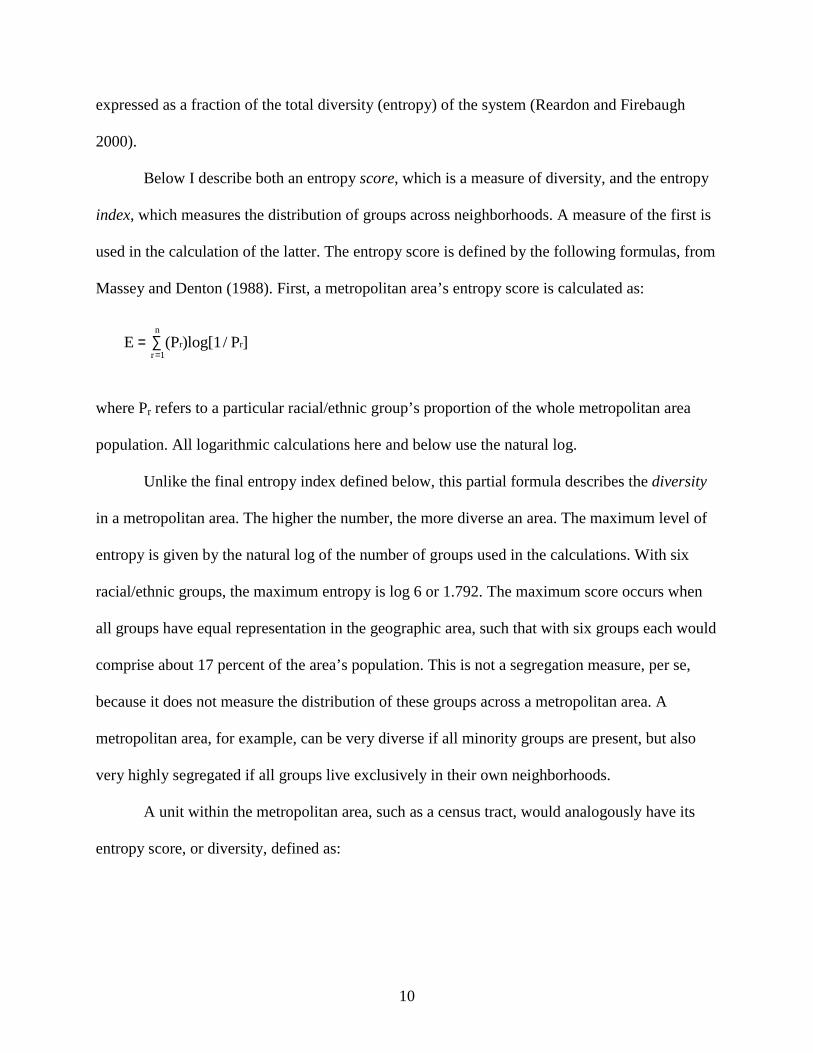
Below I describe both an entropy score, which is a measure of diversity, and the entropy
index, which measures the distribution of groups across neighborhoods. A measure of the first is
used in the calculation of the latter. The entropy score is defined by the following formulas, from
Massey and Denton (1988). First, a metropolitan area’s entropy score is calculated as:
where Pr refers to a particular racial/ethnic group’s proportion of the whole metropolitan area
population. All logarithmic calculations here and below use the natural log.
Unlike the final entropy index defined below, this partial formula describes the diversity
in a metropolitan area. The higher the number, the more diverse an area. The maximum level of
entropy is given by the natural log of the number of groups used in the calculations. With six
racial/ethnic groups, the maximum entropy is log 6 or 1.792. The maximum score occurs when
all groups have equal representation in the geographic area, such that with six groups each would
comprise about 17 percent of the area’s population. This is not a segregation measure, per se,
because it does not measure the distribution of these groups across a metropolitan area. A
metropolitan area, for example, can be very diverse if all minority groups are present, but also
very highly segregated if all groups live exclusively in their own neighborhoods.
A unit within the metropolitan area, such as a census tract, would analogously have its
entropy score, or diversity, defined as:
E (P )log[1/ P ]r rr 1
n
= ∑=
11
where pri refers to a particular racial/ethnic group’s proportion of the population in tract i.
The entropy index is the weighted average deviation of each unit’s entropy from the
metropolitan-wide entropy, expressed as a fraction of the metropolitan area’s total entropy:
where ti refers to the total population of tract i and T is the is the metropolitan area population.
The entropy index varies between 0, when all areas have the same composition as the entire
metropolitan area (i.e., maximum integration), to a high of 1, when all areas contain one group
only (maximum segregation).
Other multigroup segregation indexes exist, such as a generalized dissimilarity index and
an index of relative diversity. In a detailed review of 6 multigroup indexes (dissimilarity, gini,
entropy, squared CV (coefficient of variation), relative diversity, normalized exposure), Reardon
and Firebaugh (2000) conclude that the entropy index is clearly the superior measure. They note,
for example, that entropy is the only index that obeys the “principle of transfers,” (the index
declines when an individual of group m moves from unit i to unit j, where the proportion of
persons of group m is higher in unit i than in unit j). The entropy index can also be decomposed
into its component parts. For these reasons, I use the entropy index for this research.
Results
Ht (E E )
ETi i
i 1
n
=−
∑=
E (P )log[1/ P ]i ri rir 1
n
= ∑=
12
Table 1 provides some basic population and segregation statistics for U.S. metropolitan
areas from 1980 to 2000. It indicates, as is well known, that the proportion of the population that
is non-Hispanic White declined significantly over the 1980 to 2000 period. Likewise, the share
of the population that is Hispanic and non-Hispanic Asian and Pacific Islander grew. The
proportion who are in the “other race” category should be regarded with considerable caution, as
this is the category where changes in race definitions have had their biggest effect. As mentioned
earlier, in order to make race/ethnicity categories as comparable as possible, I categorized those
who marked more than one race (and who were not Hispanic) in 2000 as “other race.” The serves
to increase those in this group.
(Table 1 here)
The diversity and segregation measures show that diversity increased substantially over
the period (by 0.25 points, or 39 percent) and segregation declined (by 0.09 points, or 26
percent). Decomposing the segregation index into the component groups shows that segregation
is greatest among African Americans, followed by Whites. That is, when looking at the
segregation of people of each group vis-a-vis the rest of the population, segregation is high. Yet
both White and African-American segregation decreased over the period, and quite considerably
among the latter group. Both these groups were moderately more evenly distributed across
neighborhoods in metropolitan areas in 2000 than in 1980.
The story for Hispanics and Asians and Pacific Islanders differs. While both these groups
are less segregated than Whites and African Americans, Hispanic segregation remained about the
same over the period, while Asian and Pacific Islander segregation actually increased slightly.
Continued high levels of immigration from Latin American and Asian countries may have served
to reinforce immigrant ethnic enclaves. Segregation among American Indians and Alaska
13
Natives in metropolitan areas and those of other races are lower than those of other groups, and
decreased slightly from 1980 to 2000. Overall, the segregation decomposition indicates that
declines in segregation over the period were due to declines in segregation among Whites and
African Americans, and to a less extent by declines among American Indians and Alaska Natives
and other races.
Table 2 breaks patterns of segregation down by region, population size, and metropolitan
area percent minority. The South and West are both more diverse than the Northeast or Midwest
in all three periods. These are areas with significant immigration, mainly Hispanic and Asian,
since the late 1960s. The South and West are also the regions with the least segregation, though
all regions experienced significant declines over the period. All regions experienced significant
increases in diversity and declines in segregation between 1980 and 2000. Declines in
segregation were highest in the South and Midwest and lowest in the West.
(Table 2 here)
With regard to metropolitan area population size, the largest MAs are considerably more
diverse than others and experienced the greatest increases in diversity over the period. And while
they were the most segregated, they did experience the largest declines in segregation.
Metropolitan areas with populations under 500,000 are the least diverse, but they are also the
least segregated. They experienced only modest declines in segregation between 1980 and 2000.
As expected, metropolitan areas with the greatest proportion of minority residents are by
far the most diverse. Once again, however, the greater presence of a non-White population does
not necessarily translate into less segregation. In fact, the MAs in the highest two quartiles of
percent minority also have the highest levels of segregation, and experienced somewhat similar
declines in segregation over the period as others. Other studies focusing on group-specific
14
segregation (i.e., dichotomous segregation measures) have found that such segregation is often
highest in metropolitan areas which have a greater number of that particular group (Glaeser and
Vigdor 2001, Mumford Center 2001).
Regression Analysis
The descriptive statistics are informative, yet they do not provide clear and definitive
answers on the relationship between diversity and segregation when multiple groups are
considered. Below are results from a reduced-form ordinary least squares regressions which
more systematically examines this relationship, controlling for a few factors. Because both the
dependent and independent variables represent changes over time, these are fixed-effects models
which eliminate the effect of stable unobserved factors. The dependent variables in the models
represent the change in multigroup segregation between 1980 and 2000, 1980 and 1990, and
1990 and 2000.The independent variables likewise represent changes in characteristics over
those respective period.
There are two models within each time period. One focuses on the relationship between
diversity as a whole and multigroup segregation. The second in essence decomposes the diversity
variable by substituting for the diversity summary variable a set of variables representing the
percent changes in the component race/ethnic groups. Regressions in the following analysis are
unweighted, though results from unweighted and weighted regressions yield very similar results
(where the weight is the population size of the metropolitan area).
Table 3 indicates that changes in diversity have little systematic effect on multigroup
segregation over the whole 1980 to 2000 period, nor in either of the 1980-1990 and 1990-2000
15
periods. So at the aggregate level, diversity seems to have little impact on segregation when all
groups are simultaneously considered.
(Table 3 here)
When diversity is broken down into the component racial/ethnic groups, as shown in
models 2, 4, and 6, some interesting findings emerge. The percent growth in the non-Hispanic
White population has no association with segregation in any of the models. Metropolitan areas
with growing non-Hispanic African American populations tended to experience increases in
segregation, though the effect in the 1990s was actually about half the effect in the 1980s. The
effect of the Hispanic population growth on segregation was less clear. While an increasing
Hispanic population was associated with declines in segregation between 1980 and 1990, this
effect disappeared in the 1990s. The overall 1980 to 2000 effect is a weak positive one—a
greater Hispanic population may be associated with higher segregation over the whole period.
Notably, increases in the “other” population is associated with lower segregation over the whole
1980-2000 period, though not in each of the decades considered separately. In 2000 this race
category included multiple-race individuals, who we might expect to be less segregated than
others (as they often live with people of different races within the same household, e.g., as
children of different-race parents).
Of the other variables in the models, metropolitan areas with greater proportional
increases in population were more likely to experience declines in segregation, though mainly in
the 1980s. Metropolitan areas in the Northeast, Midwest and West tended to greater segregation
than those in the South.
Table 4 decomposes the multigroup segregation index into component indexes for
Whites, African Americans, Hispanics, and Asians and Pacific Islanders. For each group, three
16
models are presented. The first and the third are analogous to the models shown in Table 3. The
second shows the effect of the diversity score accompanied by a measure of percent change in
the group-in-question’s population. This basically measures the effect of diversity controlling for
group-specific changes in population. Controlling for group-specific changes in population may
be important because the rapid in-migration or growth of a group often underpins or reinforces
minority enclaves. This in turn is likely associated with greater segregation. The effect of this
control variable should therefore be greater in the Hispanic and Asian and Pacific Islander
equations—as these are the groups with the greatest growth over the period.
Results from Models 1 and 2 in Table 4 indicate that diversity has little impact on non-
Hispanic White segregation. Model 3 indicates that places with relatively greater growth in the
African American population have increasing White segregation—supporting the literature that
Whites are more averse to having African American neighbors. Though it should be noted that
the magnitude of the coefficient declines by more than 50 percent between in the 1990s versus
the 1980s (not shown).3 The model also shows that White segregation also grew in metropolitan
areas with relatively high growth in the Hispanic population over the 1980 to 2000 period; in
contrast to the Black coefficients, the positive relationship in the Hispanic coefficient is stronger
in the 1990s than the 1980s (significant at the 0.05 level). Mirroring findings in the previous
analysis, growth in the “other” population is once again associated with lower non-Hispanic
White segregation. White segregation is not specifically responsive to the change in the White
population in either Model 2 or 3.
(Table 4 here)
In contrast to findings among Whites, non-Hispanic African American segregation is
distinctly and considerably lower in more diverse metropolitan areas, according to Models 4 and
17
5 in Table 4. The growth in the Black population is associated with greater Black segregation
(Models 5 and 6). This could be due either to other groups being more averse to African
Americans as their population increases, or the reinforcement of Black enclaves (self-
segregation) as the population grows, or a combination of these two processes. Black
segregation is not particularly responsive to the growth in Hispanic or Asian and Pacific Islander
population, though it does appear to increase in places where there is growth in the American
Indian and Alaska Native population. The effect of this variable should be viewed with caution,
given broad changes in patterns of American Indian and Alaska Native self-identification in the
censuses over the period. Like among Whites, African American segregation declines in places
with increases in the “other” population over the 1980 to 2000 period. Model 5 shows that the
diversity effect and the Black population effect persist when both are included in a model,
indicating that neither mediates the effect of the other.
Hispanic and non-Hispanic Asian and Pacific Islander segregation patterns share many
similarities. The first model for each group (Models 7 and 10) indicates that, on face value,
diversity is actually associated with greater Hispanic and Asian and Pacific Islander segregation.
Notably, Models 8 and 11 indicate that the positive association between diversity and
segregation disappears once the growth in the groups’ respective populations are taken into
account. That is, diversity appears to increase segregation in models 7 and 10 only because
increasing diversity is associated with the growth in the Hispanic and Asian populations. Once
we control for these factors, diversity no longer has a significant effect on Hispanic and Asian
segregation. In these models, the coefficients for groups-specific population growth rates are
positive and significant at the 0.01 level.
3 The coefficient is .049 in 1980-1990 versus .020 in 1990-2000.
18
Results in Models 9 and 12 continue to show that metropolitan areas with a high
percentage growth in the Hispanic population experience increases in Hispanic segregation, and
metro areas with greater increases in the Asian and Pacific Islander population experience
increases in Asian and Pacific Islander segregation. Of the other variables in these models,
changes in the size of the Black population has little impact on Hispanic segregation, but is
slightly negatively correlated with Asian and Pacific Islander segregation. Growth in the
American Indian and Alaska Native population may be associated with greater Hispanic and
Asian and Pacific Islander segregation. There is weak negative association between the presence
of Asians and Pacific Islanders and Hispanic segregation.
Conclusion
This analysis tracked trends in racial and ethnic residential segregation over the 1980 to
2000 period and examined the association between diversity and segregation. Results indicate
that diversity increased rapidly and multi-group segregation, as measured by using the entropy
index, declined moderately over this period, mainly because White segregation and African
American segregation have been declining. Hispanic segregation changed little over the period
while Asian and Pacific Islander segregation increased slightly.
Diversity tends to have little overall effect on segregation or on the segregation of any
particular group with the notable exception of African Americans. Greater diversity is associated
with lower Black segregation. This result is consistent with previous findings that Black
segregation tends to be lower in multiethnic areas (Frey and Farley 1996, Lee and Wood 1991).
It is also consistent with the hypothesis that Hispanics and Asian and Pacific Islanders may serve
as “buffer” groups between initially White and Black neighborhoods, resulting in less
19
segregation between Blacks and others (Frey and Farley 1996). Basically, having multiple
minority groups may moderate the single minority vs. White majority thinking that dominated in
the past.
Other findings indicate that metropolitan areas with greater growth in Hispanic and Asian
and Pacific Islander populations experience greater growth in Hispanic and Asian and Pacific
Islander segregation, respectively. This suggests that this group-specific population growth is
buttressing relatively homogenous ethnic enclaves. It could be that continued high levels of
immigration from Asia and Latin American may be increasing segregation even if/as the native-
born of those groups are spreading outward into more integrated communities.
The implication of these findings is that while greater diversity does not necessarily
translate into greater integration, it could facilitate integration in certain circumstances. This
study also suggests the continuing need to examine patterns of segregation in the multiethnic
context and to move beyond traditional two-group models. Tools were implemented which do
just that-- summary measures of diversity and segregation which simultaneously take the
presence of multiple groups into account. Findings here also point to the usefulness of
decomposing such an analysis to look at how specific groups are differentially affect by the
increasing racial and ethnic diversity in American society.
20
References
Bobo, Lawrence and Camille Zubrinsky. 1996. “Attitudes Toward Residential Integration:
Perceived Status Differences, Mere In-Group Preference, or Racial Prejudice?” Social
Forces 74 (3): 883-909.
Clark, William A.V. 1986. “Residential Segregation in American Cities: A Review and
Interpretation.” Population Research and Policy Review 5: 95-127.
Clark, William A.V. 1992. “Residential Preferences and Residential Choices in a Multiethnic
Context.” Demography 29, 3 (August): 451-66.
Denton, Nancy, and Douglas Massey. 1991. “Patterns of Neighborhood Transition in a Multi-
Ethnic World: U.S. Metropolitan Areas, 1970-1980.” Demography 28: 41-63.
Duncan, Otis Dudley and Beverly Duncan. 1955. “A methodological analysis of segregation
indexes.” American Sociological Review 20: 210-17.
Emerson, Michael O., George Yancy, and Karen J. Chai. 2001. “Does Race Matter in Residential
Segregation? Exploring Preferences of White Americans.” American Sociological Review
66, 6 (December): 922-35.
Farley, Reynolds. 1978. “Chocolate City, Vanilla Suburbs: Will the Trend Toward Racially
Separate Communities Continue?” Social Science Research 7: 319-44.
Farley, Reynolds, Charlotte Steeh, Maria Krysan, Tara Jackson, and Keith Reeves. 1994.
“Stereotypes and Segregation: Neighborhoods in the Detroit Area.” American Journal of
Sociology 100 (3): 750-80.
Frey, William H. and Reynolds Farley. 1996. “Latino, Asian, and Black Segregation in U.S.
Metropolitan Areas: Are Multiethnic Metros Different?” Demography 33:35-50.
21
Galster, George. 1987. “Residential Segregation and Interracial Economic Disparities:
Simultaneous Equations Appproach.” Journal of Urban Economics 21:22-44.
Harrison, Roderick J. and Claudette Bennett. 1995. “Racial and Ethnic Diversity.” In State of the
Union: America in the 1990’s, vol. 2, pp. 156-165, edited by Reynolds Farley. New
York: Russell Sage Foundation.
Iceland, John, and Daniel H. Weinberg. 2002. Racial and Ethnic Residential Segregation in the
United States: 1980-2000. U.S. Census Bureau, Census Special Report, CENSR-4,
Washington, DC: U.S. Government Printing Office.
James, David R. and Karl E. Taeuber. 1985. “Measures of segregation.” Sociological
Methodology 14: 1-32.
Lee, Barrett, and Peter Wood. 1991. “Is Neighborhood Racial Succession Place-Specific?”
Demography 28: 21-40.
Logan, John R., Richard D. Alba, Tom McNulty, and Brian Fisher. 1996. “Making a Place in the
Metropolis: Locational Attainment in Cities and Suburbs.” Demography 33 (4): 443-53.
Krivo, Lauren J. and Robert L. Kaufman. 1999. “How Low Can It Go? Declining Black-White
Segregation in a Multiethnic Context.” Demography 36, 1 (February): 93-109.
Massey, Douglas S., White, Michael J., and Voon Chin Phua. 1996. "The Dimensions of
Segregation Revisited." Sociological Methods and Research 25, 2 (November): 172-206.
Massey, Douglas S., and Nancy Denton. 1993. American Apartheid. Cambridge: Harvard
University Press.
Pascal, Anthony. 1967. The Economics of Housing Segregation. Santa Monica: RAND.
22
Reardon, Sean F., and Glenn Firebaugh. 2000. “Measures of Multi-Group Segregation.”
Population Research Institute, The Pennsylvania State University, Working Paper 00-13
(November 2000).
Schelling, Thomas. 1971. “Dynamic Models of Segregation.” Journal of Mathematical
Sociology 1: 143-86.
Theil, Henri. 1972. Statistical decomposition analysis. Amsterdam: North-Holland Publishing
Company.
Thiel, Henri and Anthony J. Finezza. 1971. “A note on the measurement of racial integration of
schools by means of informational concepts.” Journal of Mathematical Sociology 1: 187-
94.
U.S. Census Bureau. 2001. Profiles of General Demographic Characteristics 2000. 2000 Census
of Population and Housing, Table DP-1.
White, Michael J. 1986. “Segregation and diversity measures in population distribution.”
Population Index 52: 198-221.
Yinger, John. 1995. Closed Doors, Opportunities /lost: The Continuing Costs of Housing
Discrimination. New York: Russell Sage Foundation.
Zoloth, Barbara S. 1976. “Alternative measures of school segregation.” Land Economics 52:
278-298.
Zubrinsky Charles, Camille. 2000. “Neighborhood Racial-Composition Preferences: Evidence
from a Multiethnic Metropolis.” Social Problems 47 (3): 379-407.
Zubrinsky Charles, Camille. 2001. “Processes of Residential Segregation.” In Urban Inequality:
Evidence from Four Cities. Eds. Alice O’Connor, Chris Tilly, Lawrence D. Bobo. New
York: Russell Sage Foundation.
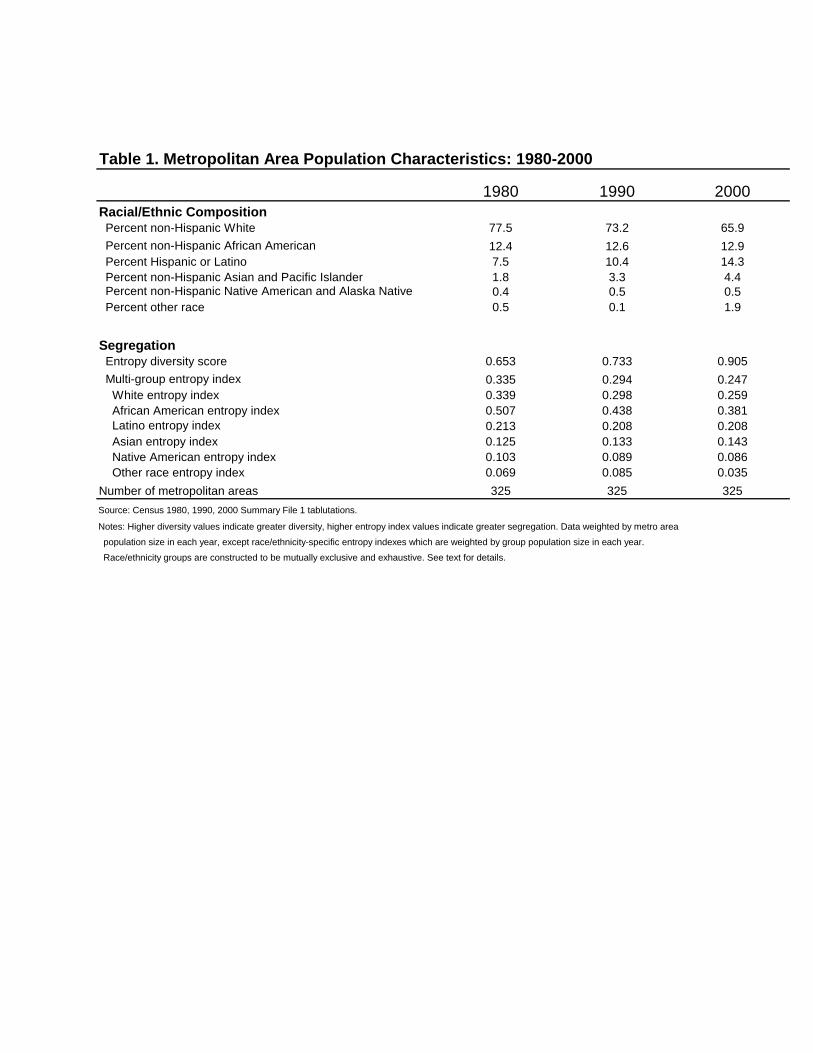
Table 1. Metropolitan Area Population Characteristics: 1980-2000
Racial/Ethnic Composition Percent non-Hispanic White 77.5 73.2 65.9
Percent non-Hispanic African American 12.4 12.6 12.9 Percent Hispanic or Latino 7.5 10.4 14.3 Percent non-Hispanic Asian and Pacific Islander 1.8 3.3 4.4 Percent non-Hispanic Native American and Alaska Native 0.4 0.5 0.5 Percent other race 0.5 0.1 1.9
Segregation Entropy diversity score 0.653 0.733 0.905
Multi-group entropy index 0.335 0.294 0.247 White entropy index 0.339 0.298 0.259 African American entropy index 0.507 0.438 0.381 Latino entropy index 0.213 0.208 0.208 Asian entropy index 0.125 0.133 0.143 Native American entropy index 0.103 0.089 0.086 Other race entropy index 0.069 0.085 0.035
Number of metropolitan areas 325 325 325
Source: Census 1980, 1990, 2000 Summary File 1 tablutations.
Notes: Higher diversity values indicate greater diversity, higher entropy index values indicate greater segregation. Data weighted by metro area
population size in each year, except race/ethnicity-specific entropy indexes which are weighted by group population size in each year.
Race/ethnicity groups are constructed to be mutually exclusive and exhaustive. See text for details.
1980 1990 2000
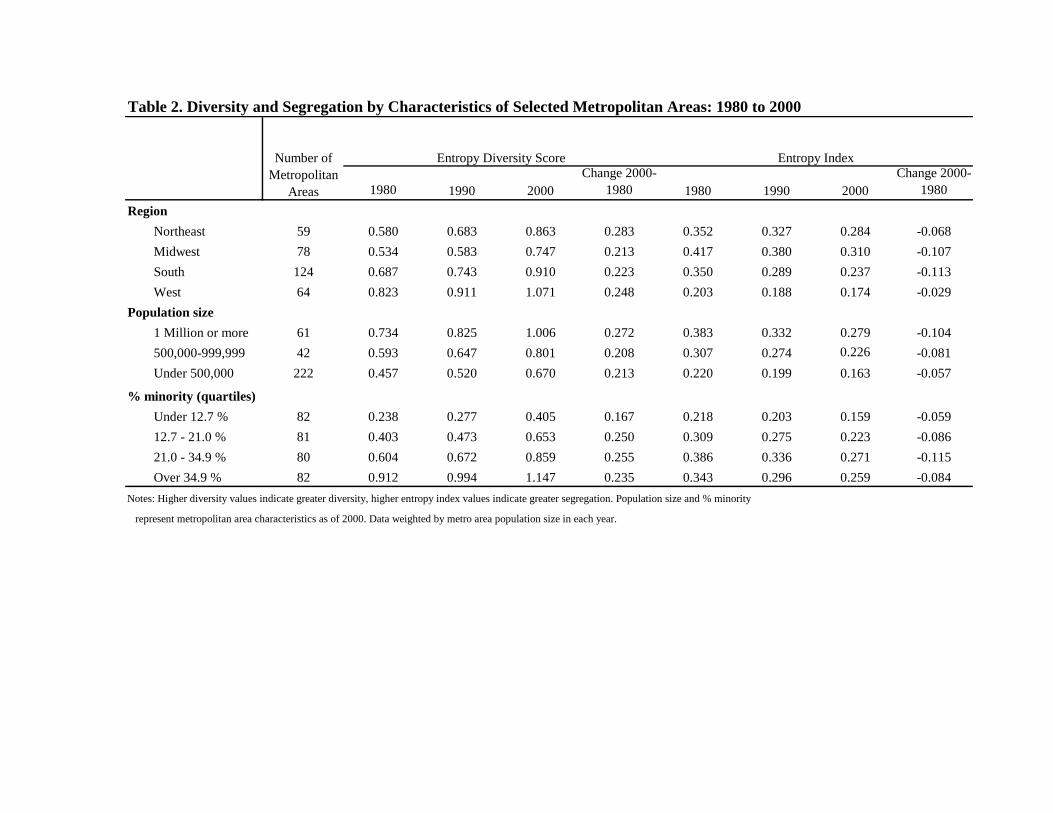
Table 2. Diversity and Segregation by Characteristics of Selected Metropolitan Areas: 1980 to 2000
1980 1990 2000Change 2000-
1980 1980 1990 2000Change 2000-
1980
Region
Northeast 59 0.580 0.683 0.863 0.283 0.352 0.327 0.284 -0.068
Midwest 78 0.534 0.583 0.747 0.213 0.417 0.380 0.310 -0.107
South 124 0.687 0.743 0.910 0.223 0.350 0.289 0.237 -0.113
West 64 0.823 0.911 1.071 0.248 0.203 0.188 0.174 -0.029
Population size
1 Million or more 61 0.734 0.825 1.006 0.272 0.383 0.332 0.279 -0.104
500,000-999,999 42 0.593 0.647 0.801 0.208 0.307 0.274 0.226 -0.081
Under 500,000 222 0.457 0.520 0.670 0.213 0.220 0.199 0.163 -0.057
% minority (quartiles)
Under 12.7 % 82 0.238 0.277 0.405 0.167 0.218 0.203 0.159 -0.059
12.7 - 21.0 % 81 0.403 0.473 0.653 0.250 0.309 0.275 0.223 -0.086
21.0 - 34.9 % 80 0.604 0.672 0.859 0.255 0.386 0.336 0.271 -0.115
Over 34.9 % 82 0.912 0.994 1.147 0.235 0.343 0.296 0.259 -0.084
Notes: Higher diversity values indicate greater diversity, higher entropy index values indicate greater segregation. Population size and % minority
represent metropolitan area characteristics as of 2000. Data weighted by metro area population size in each year.
Number of Metropolitan
Areas
Entropy Diversity Score Entropy Index
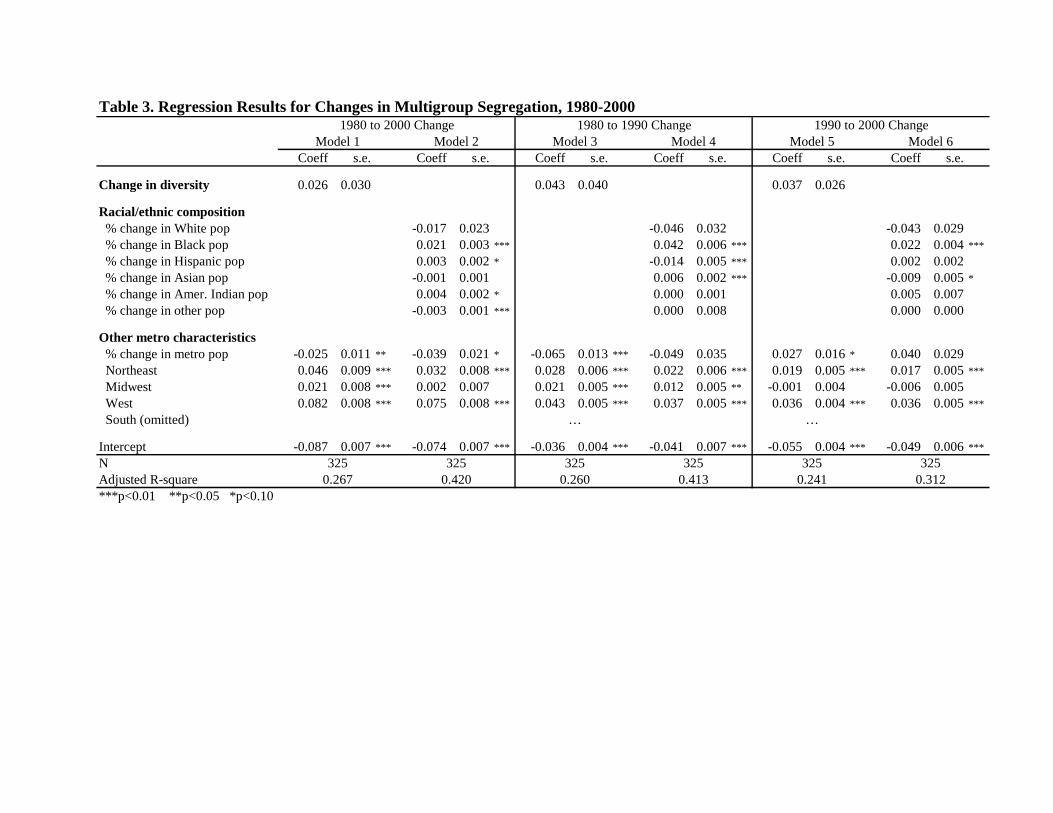
Table 3. Regression Results for Changes in Multigroup Segregation, 1980-2000
Coeff s.e. Coeff s.e. Coeff s.e. Coeff s.e. Coeff s.e. Coeff s.e.
Change in diversity 0.026 0.030 0.043 0.040 0.037 0.026
Racial/ethnic composition % change in White pop -0.017 0.023 -0.046 0.032 -0.043 0.029 % change in Black pop 0.021 0.003 *** 0.042 0.006 *** 0.022 0.004 ***
% change in Hispanic pop 0.003 0.002 * -0.014 0.005 *** 0.002 0.002 % change in Asian pop -0.001 0.001 0.006 0.002 *** -0.009 0.005 *
% change in Amer. Indian pop 0.004 0.002 * 0.000 0.001 0.005 0.007 % change in other pop -0.003 0.001 *** 0.000 0.008 0.000 0.000
Other metro characteristics % change in metro pop -0.025 0.011 ** -0.039 0.021 * -0.065 0.013 *** -0.049 0.035 0.027 0.016 * 0.040 0.029 Northeast 0.046 0.009 *** 0.032 0.008 *** 0.028 0.006 *** 0.022 0.006 *** 0.019 0.005 *** 0.017 0.005 ***
Midwest 0.021 0.008 *** 0.002 0.007 0.021 0.005 *** 0.012 0.005 ** -0.001 0.004 -0.006 0.005 West 0.082 0.008 *** 0.075 0.008 *** 0.043 0.005 *** 0.037 0.005 *** 0.036 0.004 *** 0.036 0.005 ***
South (omitted)
Intercept -0.087 0.007 *** -0.074 0.007 *** -0.036 0.004 *** -0.041 0.007 *** -0.055 0.004 *** -0.049 0.006 ***
NAdjusted R-square***p<0.01 **p<0.05 *p<0.10
0.420 0.312
Model 1 Model 21980 to 1990 Change
Model 3 Model 41980 to 2000 Change
3250.267
325
1990 to 2000 ChangeModel 5 Model 6
325
…
3250.260
…
3250.241
3250.413
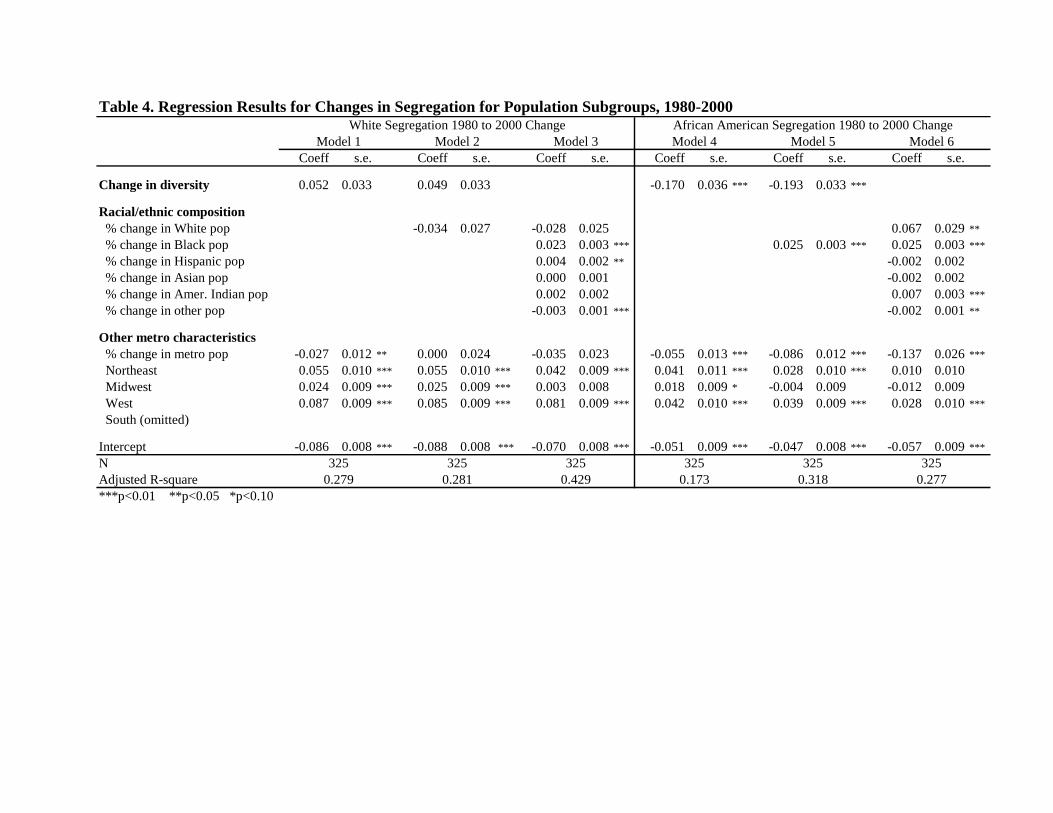
Table 4. Regression Results for Changes in Segregation for Population Subgroups, 1980-2000
Coeff s.e. Coeff s.e. Coeff s.e. Coeff s.e. Coeff s.e. Coeff s.e.
Change in diversity 0.052 0.033 0.049 0.033 -0.170 0.036 *** -0.193 0.033 ***
Racial/ethnic composition % change in White pop -0.034 0.027 -0.028 0.025 0.067 0.029 **
% change in Black pop 0.023 0.003 *** 0.025 0.003 *** 0.025 0.003 ***
% change in Hispanic pop 0.004 0.002 ** -0.002 0.002 % change in Asian pop 0.000 0.001 -0.002 0.002 % change in Amer. Indian pop 0.002 0.002 0.007 0.003 ***
% change in other pop -0.003 0.001 *** -0.002 0.001 **
Other metro characteristics % change in metro pop -0.027 0.012 ** 0.000 0.024 -0.035 0.023 -0.055 0.013 *** -0.086 0.012 *** -0.137 0.026 ***
Northeast 0.055 0.010 *** 0.055 0.010 *** 0.042 0.009 *** 0.041 0.011 *** 0.028 0.010 *** 0.010 0.010 Midwest 0.024 0.009 *** 0.025 0.009 *** 0.003 0.008 0.018 0.009 * -0.004 0.009 -0.012 0.009 West 0.087 0.009 *** 0.085 0.009 *** 0.081 0.009 *** 0.042 0.010 *** 0.039 0.009 *** 0.028 0.010 ***
South (omitted)
Intercept -0.086 0.008 *** -0.088 0.008 *** -0.070 0.008 *** -0.051 0.009 *** -0.047 0.008 *** -0.057 0.009 ***
NAdjusted R-square***p<0.01 **p<0.05 *p<0.10
Model 5 Model 6White Segregation 1980 to 2000 Change African American Segregation 1980 to 2000 Change
Model 1 Model 3Model 2 Model 4
0.279 0.429325 325325
0.281325 325325
0.173 0.2770.318
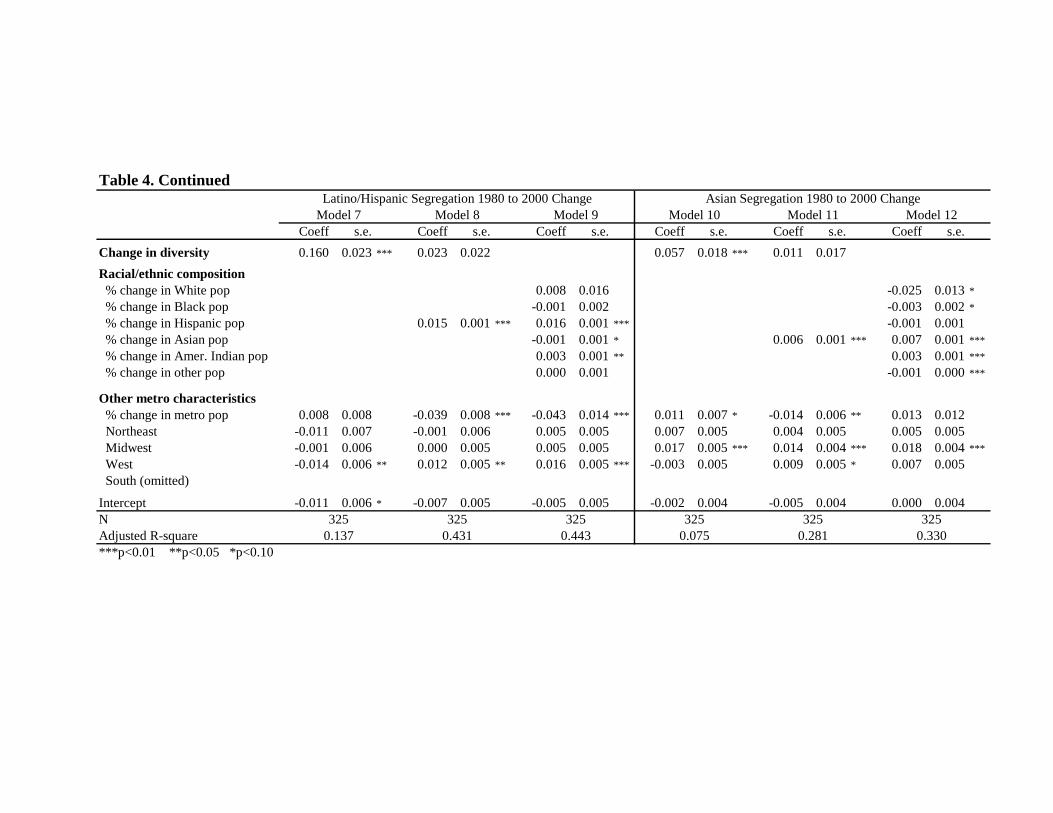
Table 4. Continued
Coeff s.e. Coeff s.e. Coeff s.e. Coeff s.e. Coeff s.e. Coeff s.e.
Change in diversity 0.160 0.023 *** 0.023 0.022 0.057 0.018 *** 0.011 0.017
Racial/ethnic composition % change in White pop 0.008 0.016 -0.025 0.013 *
% change in Black pop -0.001 0.002 -0.003 0.002 *
% change in Hispanic pop 0.015 0.001 *** 0.016 0.001 *** -0.001 0.001 % change in Asian pop -0.001 0.001 * 0.006 0.001 *** 0.007 0.001 ***
% change in Amer. Indian pop 0.003 0.001 ** 0.003 0.001 ***
% change in other pop 0.000 0.001 -0.001 0.000 ***
Other metro characteristics % change in metro pop 0.008 0.008 -0.039 0.008 *** -0.043 0.014 *** 0.011 0.007 * -0.014 0.006 ** 0.013 0.012 Northeast -0.011 0.007 -0.001 0.006 0.005 0.005 0.007 0.005 0.004 0.005 0.005 0.005 Midwest -0.001 0.006 0.000 0.005 0.005 0.005 0.017 0.005 *** 0.014 0.004 *** 0.018 0.004 ***
West -0.014 0.006 ** 0.012 0.005 ** 0.016 0.005 *** -0.003 0.005 0.009 0.005 * 0.007 0.005 South (omitted)
Intercept -0.011 0.006 * -0.007 0.005 -0.005 0.005 -0.002 0.004 -0.005 0.004 0.000 0.004NAdjusted R-square***p<0.01 **p<0.05 *p<0.10
Latino/Hispanic Segregation 1980 to 2000 ChangeModel 7 Model 9Model 8
0.137 0.4430.431325 325325
Asian Segregation 1980 to 2000 ChangeModel 10 Model 12Model 11
0.281 0.3300.075325 325325