Embed Size (px)
Citation preview
Beyond Monte CarloBeyond Monte Carlo
An Algorithmic Replacement for aAn Algorithmic Replacement for a
Misunderstood PracticeMisunderstood Practice
Shawn BraymanPresident, PlanPlus Inc.
Beyond Monte Carlo
Shawn Brayman
Shawn BraymanPresident
PlanPlus Inc.
• PlanPlus Founder
• 20+ years experience in financial services IT sector
• B.Sc. (Applied & Computational Math), MES (Expert Systems) York University
• Canadian Institute of Financial Planning (1994) prescribed course of study
• Software, training, speaking on financial planning in 9 countries
Beyond Monte Carlo
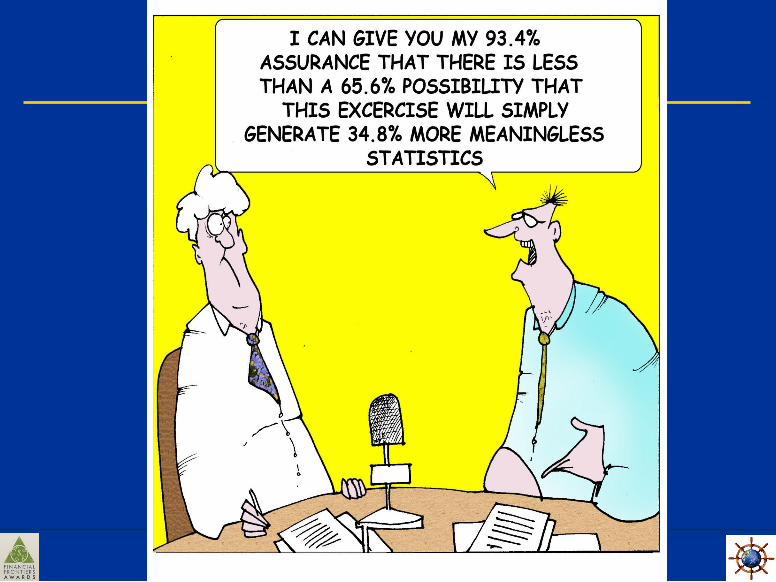
Our industry is filled withOur industry is filled withconflicting information.conflicting information.
For both advisors and clients it is almost For both advisors and clients it is almost impossible to sort out “truth” from impossible to sort out “truth” from
“fiction”.“fiction”.
Beyond Monte Carlo
Executive SummaryExecutive Summary
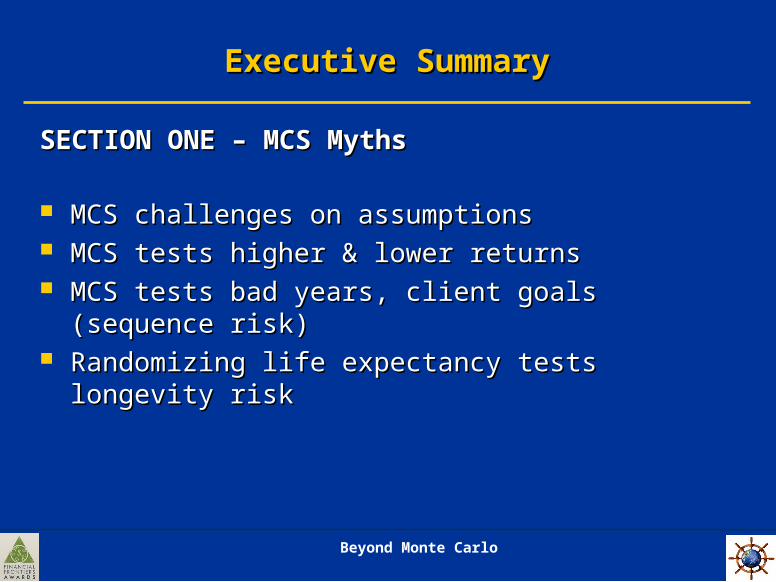
SECTION ONE – MCS MythsSECTION ONE – MCS Myths
MCS challenges on assumptionsMCS challenges on assumptions MCS tests higher & lower returnsMCS tests higher & lower returns MCS tests bad years, client goals (sequence risk) MCS tests bad years, client goals (sequence risk) Randomizing life expectancy tests longevity risk Randomizing life expectancy tests longevity risk
Beyond Monte Carlo
Executive SummaryExecutive Summary
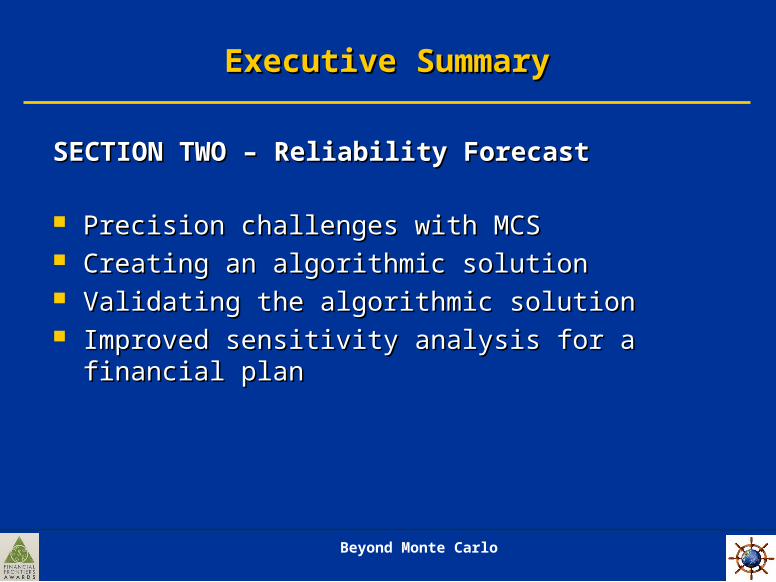
SECTION TWO – Reliability ForecastSECTION TWO – Reliability Forecast
Precision challenges with MCS Precision challenges with MCS Creating an algorithmic solutionCreating an algorithmic solution Validating the algorithmic solutionValidating the algorithmic solution Improved sensitivity analysis for a financial planImproved sensitivity analysis for a financial plan
Beyond Monte Carlo
Disclaimer!Disclaimer!
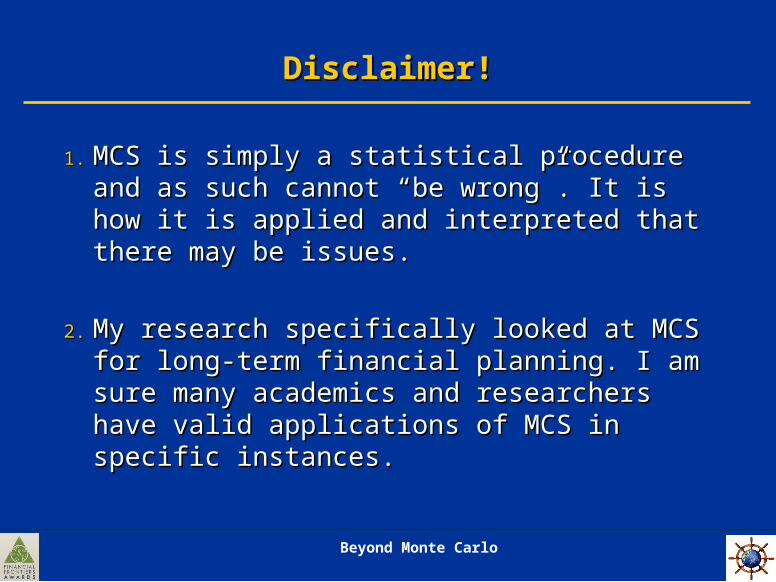
1.1. MCS is simply a statistical procedure and as such MCS is simply a statistical procedure and as such cannot “be wrong”. It is how it is applied and cannot “be wrong”. It is how it is applied and interpreted that there may be issues. interpreted that there may be issues.
2.2. My research specifically looked at MCS for long-My research specifically looked at MCS for long-term financial planning. I am sure many academics term financial planning. I am sure many academics and researchers have valid applications of MCS in and researchers have valid applications of MCS in specific instances. specific instances.
Beyond Monte Carlo
A Last AsideA Last Aside
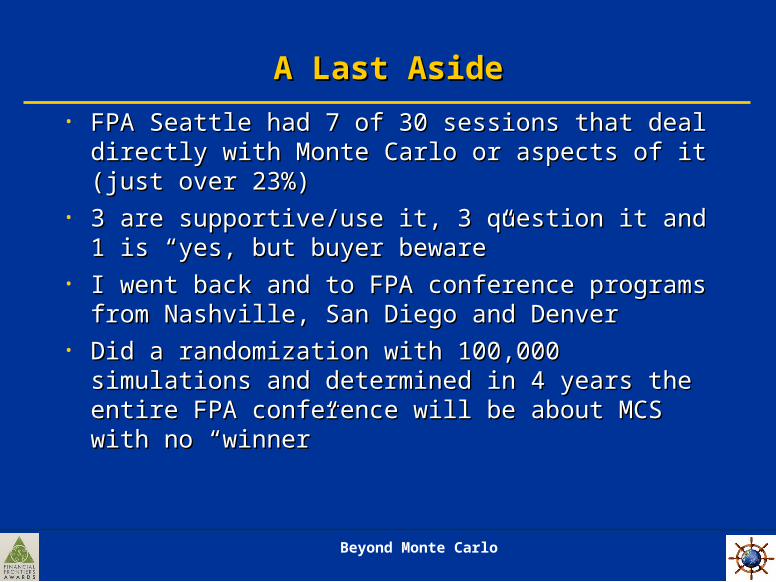
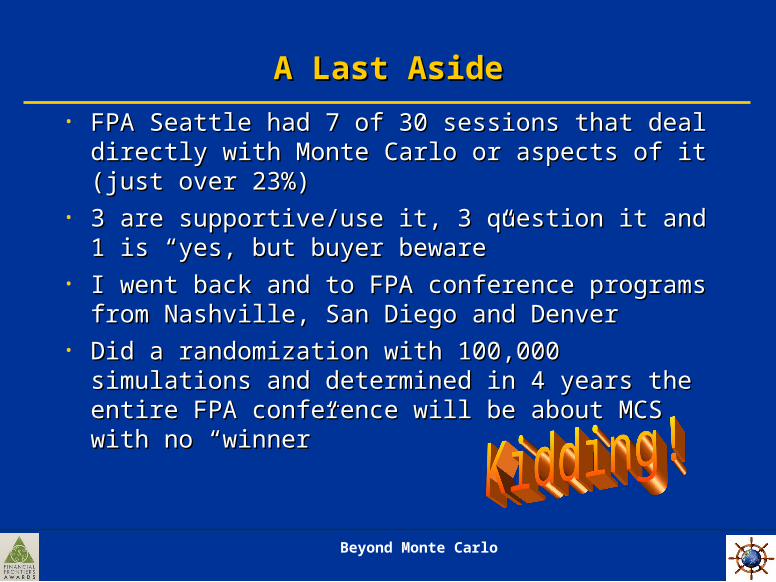
• FPA Seattle had 7 of 30 sessions that deal directly FPA Seattle had 7 of 30 sessions that deal directly with Monte Carlo or aspects of it (just over 23%)with Monte Carlo or aspects of it (just over 23%)
• 3 are supportive/use it, 3 question it and 1 is “yes, 3 are supportive/use it, 3 question it and 1 is “yes, but buyer beware”but buyer beware”
• I went back and to FPA conference programs from I went back and to FPA conference programs from Nashville, San Diego and DenverNashville, San Diego and Denver
• Did a randomization with 100,000 simulations and Did a randomization with 100,000 simulations and determined in 4 years the entire FPA conference determined in 4 years the entire FPA conference will be about MCS with no “winner” will be about MCS with no “winner”
Beyond Monte Carlo
A Last AsideA Last Aside
Beyond Monte Carlo
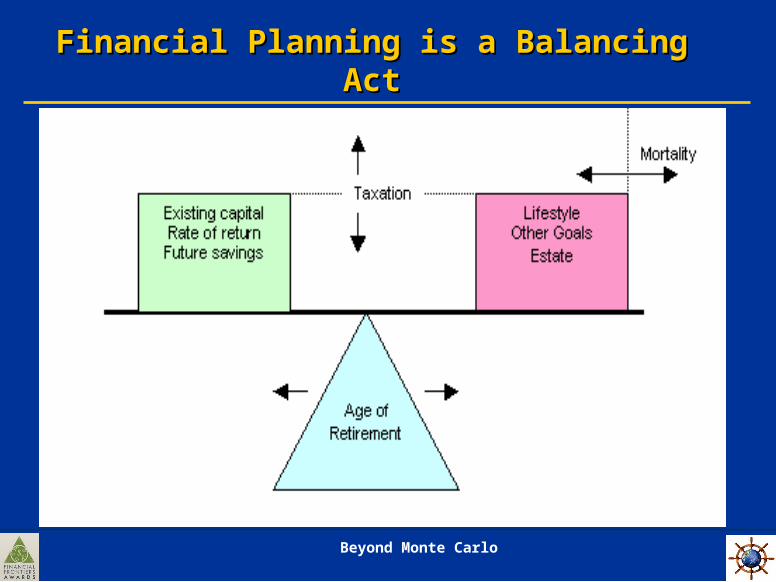
Financial Planning is a Balancing ActFinancial Planning is a Balancing Act
Beyond Monte Carlo
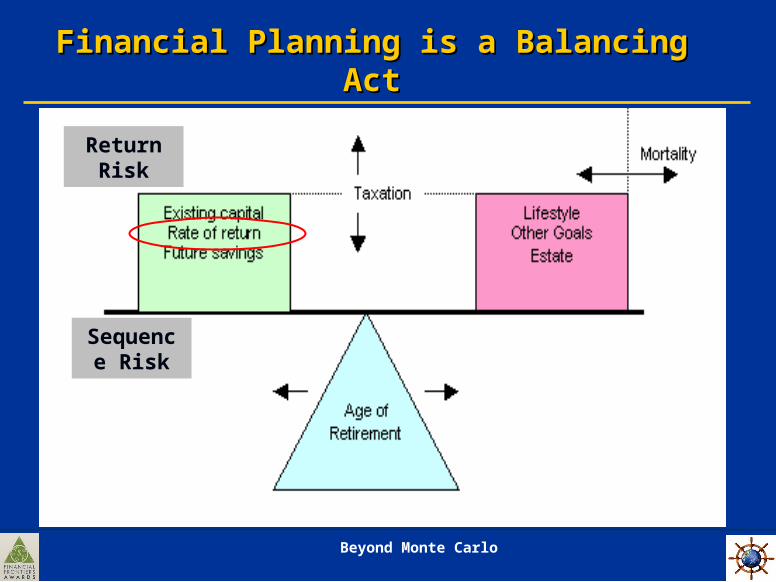
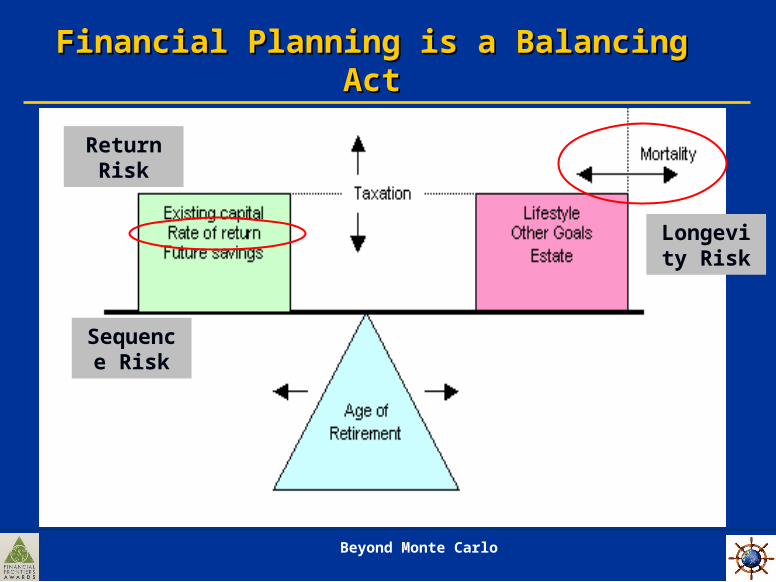
Financial Planning is a Balancing ActFinancial Planning is a Balancing Act
Sequence Risk
Return Risk
Beyond Monte Carlo
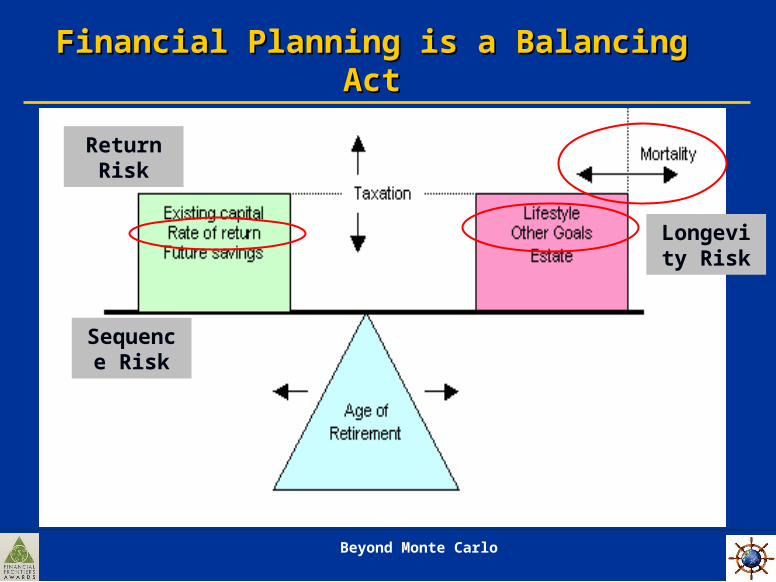
Financial Planning is a Balancing ActFinancial Planning is a Balancing Act
Longevity Risk
Sequence Risk
Return Risk
Beyond Monte Carlo
Financial Planning is a Balancing ActFinancial Planning is a Balancing Act
Longevity Risk
Sequence Risk
Return Risk
Beyond Monte Carlo
Inflation & Return AssumptionsInflation & Return Assumptions
Beyond Monte Carlo
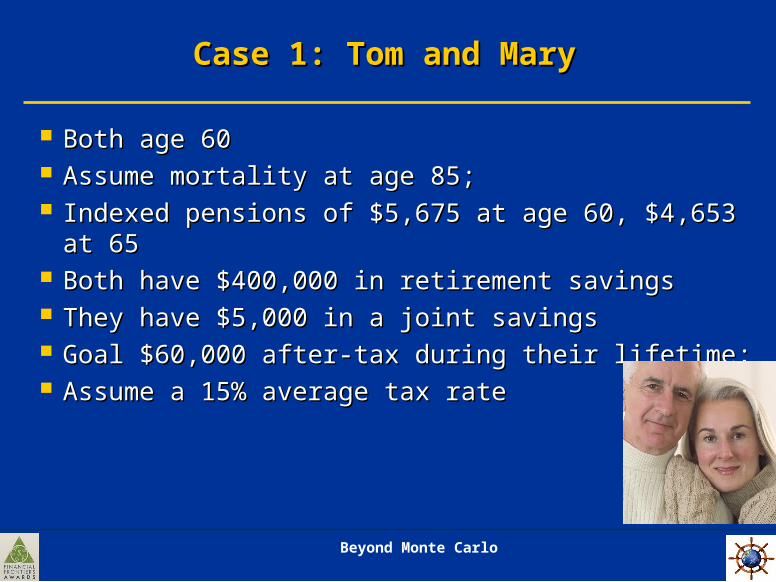
Case 1: Tom and MaryCase 1: Tom and Mary
Both age 60 Both age 60 Assume mortality at age 85;Assume mortality at age 85; Indexed pensions of $5,675 at age 60, $4,653 at 65 Indexed pensions of $5,675 at age 60, $4,653 at 65 Both have $400,000 in retirement savingsBoth have $400,000 in retirement savings They have $5,000 in a joint savings They have $5,000 in a joint savings Goal $60,000 after-tax during their lifetime;Goal $60,000 after-tax during their lifetime; Assume a 15% average tax rateAssume a 15% average tax rate
Beyond Monte Carlo
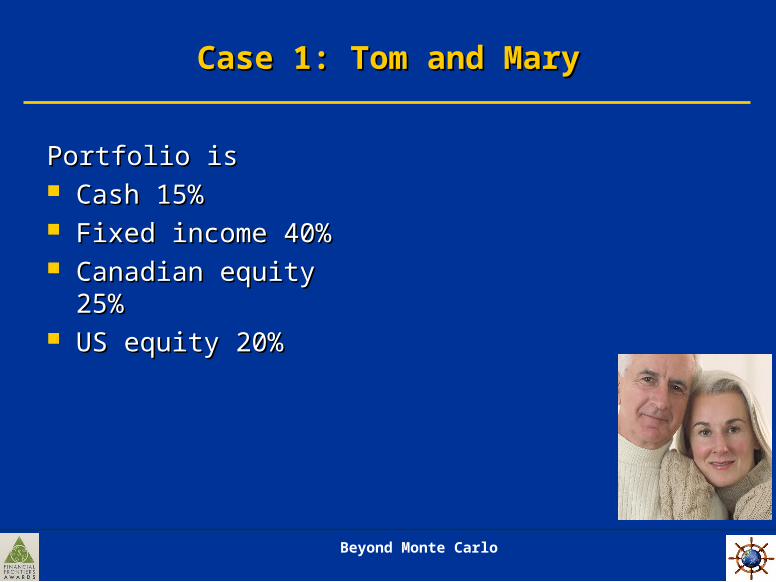
Case 1: Tom and MaryCase 1: Tom and Mary
Portfolio is Portfolio is Cash 15%Cash 15% Fixed income 40%Fixed income 40% Canadian equity 25%Canadian equity 25% US equity 20%US equity 20%
Beyond Monte Carlo
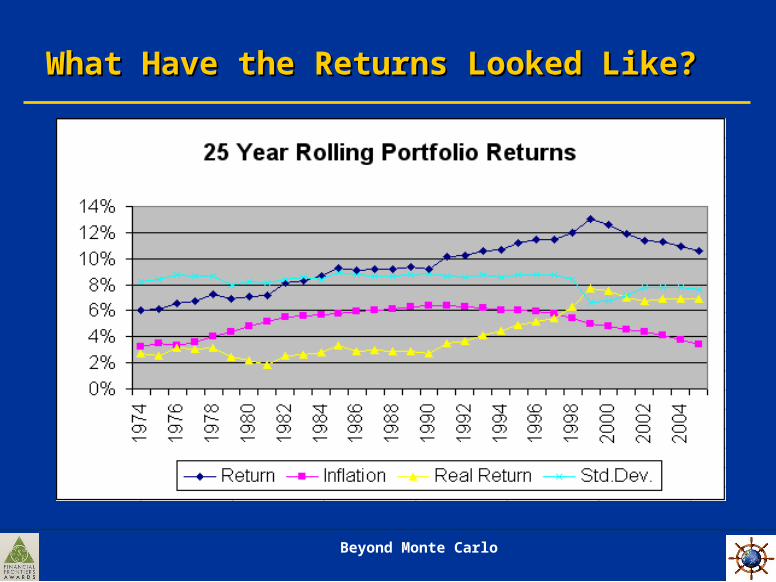
What Have the Returns Looked Like?What Have the Returns Looked Like?
Beyond Monte Carlo
Case 1: Tom and MaryCase 1: Tom and Mary
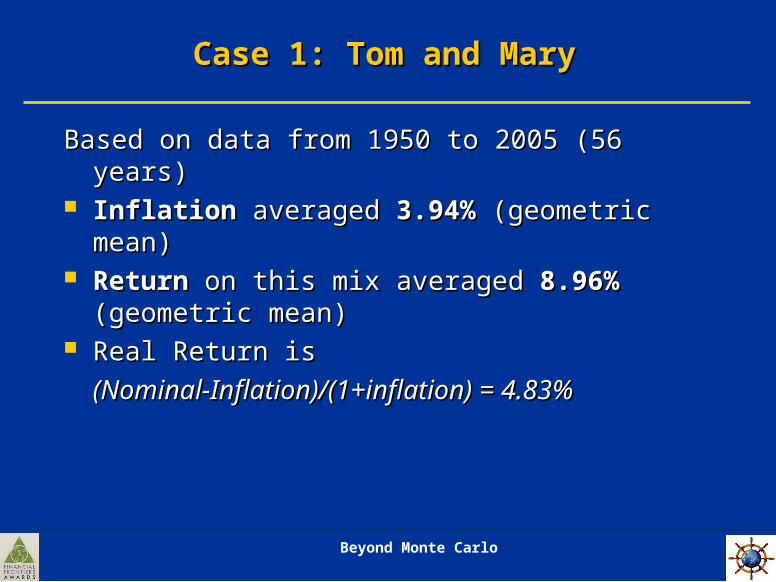
Based on data from 1950 to 2005 (56 years)Based on data from 1950 to 2005 (56 years) InflationInflation averaged averaged 3.94%3.94% (geometric mean) (geometric mean) ReturnReturn on this mix averaged on this mix averaged 8.96%8.96% (geometric (geometric
mean)mean) Real Return is Real Return is
(Nominal-Inflation)/(1+inflation) = 4.83%(Nominal-Inflation)/(1+inflation) = 4.83%
Beyond Monte Carlo
Case 1: Tom and MaryCase 1: Tom and Mary
Results Results Tom and Mary’s plan is perfect and they run out of Tom and Mary’s plan is perfect and they run out of
money at the end of age 85, leaving an estate of $0 money at the end of age 85, leaving an estate of $0 to their cat.to their cat.
Beyond Monte Carlo
Monte CarloMonte Carlo
Beyond Monte Carlo
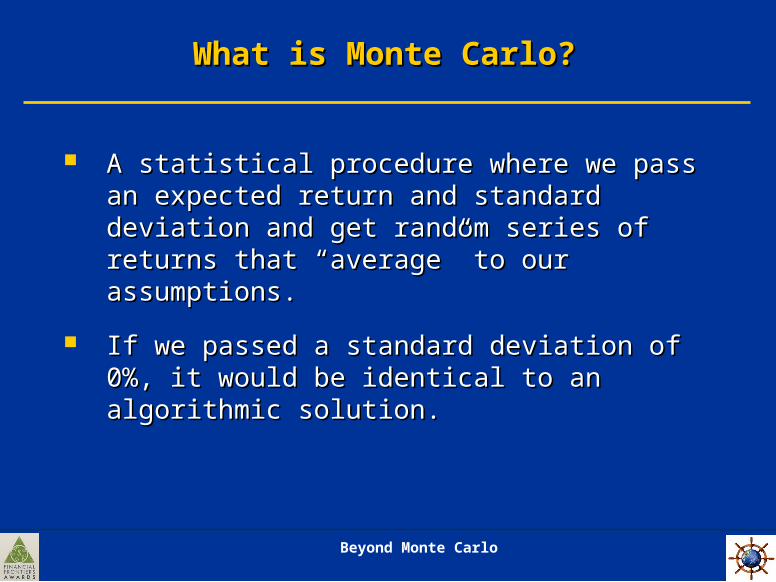
What is Monte Carlo?What is Monte Carlo?
A statistical procedure where we pass an expected A statistical procedure where we pass an expected return and standard deviation and get random return and standard deviation and get random series of returns that “average” to our series of returns that “average” to our assumptions.assumptions.
If we passed a standard deviation of 0%, it would If we passed a standard deviation of 0%, it would be identical to an algorithmic solution.be identical to an algorithmic solution.
Beyond Monte Carlo
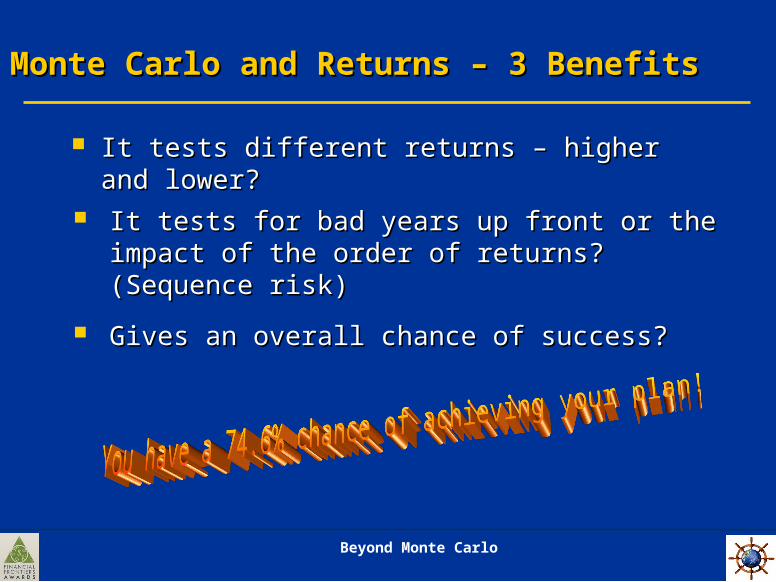
Monte Carlo and Returns – 3 BenefitsMonte Carlo and Returns – 3 Benefits
It tests different returns – higher and lower?It tests different returns – higher and lower?
It tests for bad years up front or the impact of the It tests for bad years up front or the impact of the order of returns? (Sequence risk)order of returns? (Sequence risk)
Gives an overall chance of success? Gives an overall chance of success?
Beyond Monte Carlo
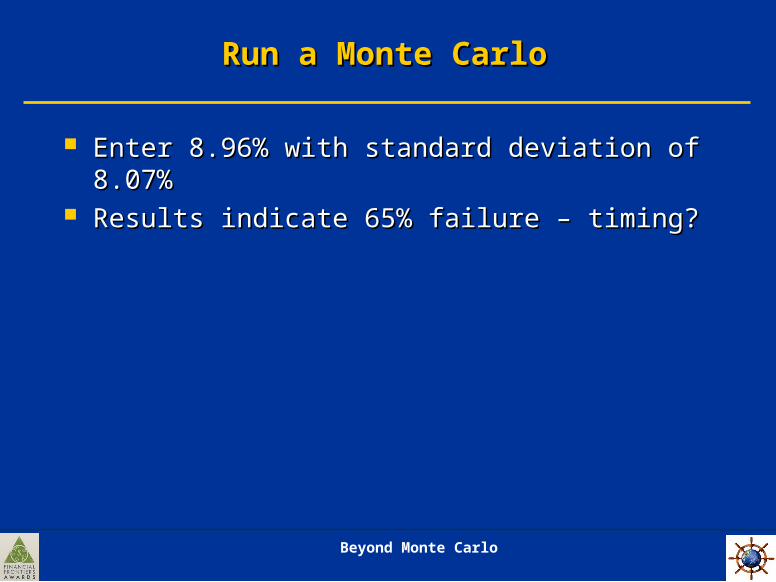
Run a Monte CarloRun a Monte Carlo
Enter 8.96% with standard deviation of 8.07%Enter 8.96% with standard deviation of 8.07% Results indicate 65% failure – timing?Results indicate 65% failure – timing?
Beyond Monte Carlo
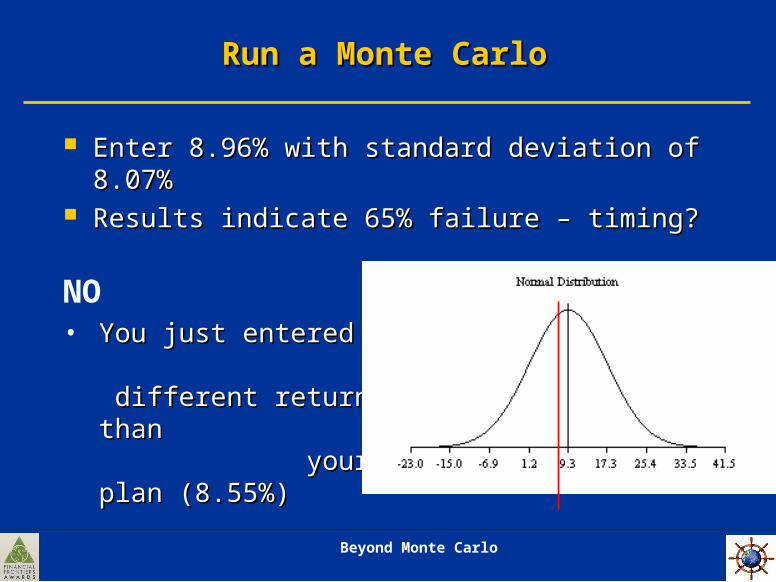
Run a Monte CarloRun a Monte Carlo
Enter 8.96% with standard deviation of 8.07%Enter 8.96% with standard deviation of 8.07% Results indicate 65% failure – timing?Results indicate 65% failure – timing?
NO• You just entered a You just entered a
different return than different return than your plan your plan (8.55%)(8.55%)
Beyond Monte Carlo
Geometric vs. Arithmetic MeanGeometric vs. Arithmetic Mean
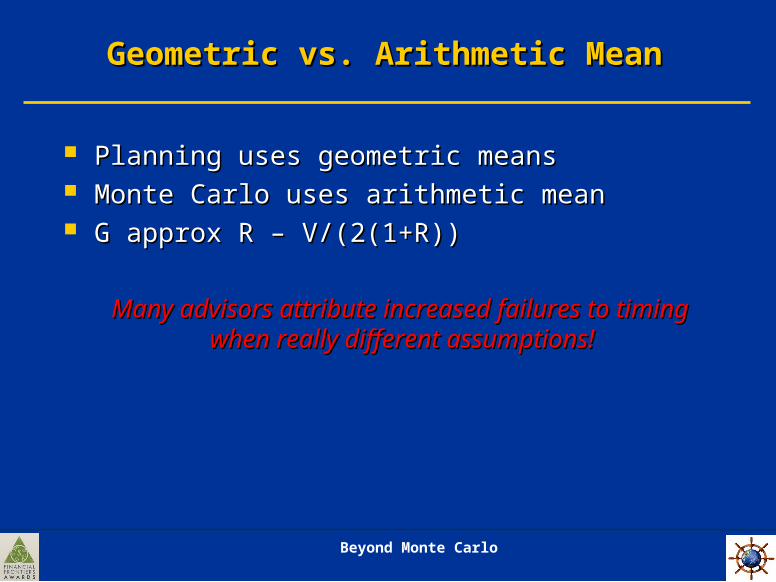
Planning uses geometric meansPlanning uses geometric means Monte Carlo uses arithmetic meanMonte Carlo uses arithmetic mean G approx R – V/(2(1+R))G approx R – V/(2(1+R))
Many advisors attribute increased failures to timing Many advisors attribute increased failures to timing when really different assumptions!when really different assumptions!
Beyond Monte Carlo
Test Higher and Lower Returns?Test Higher and Lower Returns?
For Tom and Mary, 8.96% return was “perfect”. For Tom and Mary, 8.96% return was “perfect”. The geometric mean is by definition the point of The geometric mean is by definition the point of
50/50 probability.50/50 probability.
Beyond Monte Carlo
Test Higher and Lower Returns?Test Higher and Lower Returns?
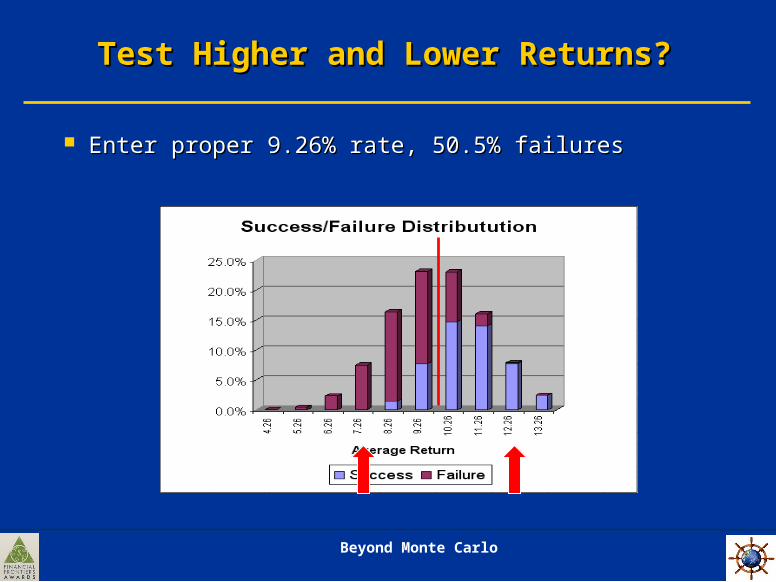
Enter proper 9.26% rate, 50.5% failuresEnter proper 9.26% rate, 50.5% failures
Beyond Monte Carlo
Test Higher and Lower Returns?Test Higher and Lower Returns?
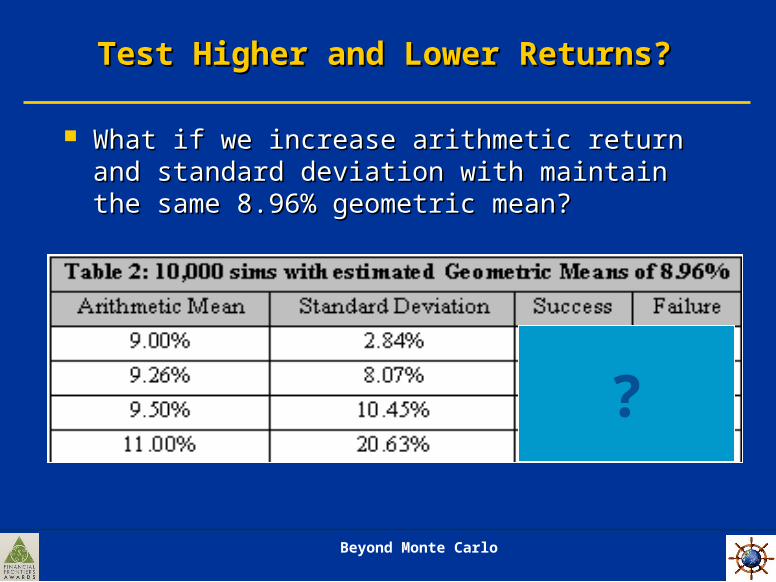
What if we increase arithmetic return and standard What if we increase arithmetic return and standard deviation with maintain the same 8.96% geometric deviation with maintain the same 8.96% geometric mean?mean?
?
Beyond Monte Carlo
Test Higher and Lower Returns?Test Higher and Lower Returns?
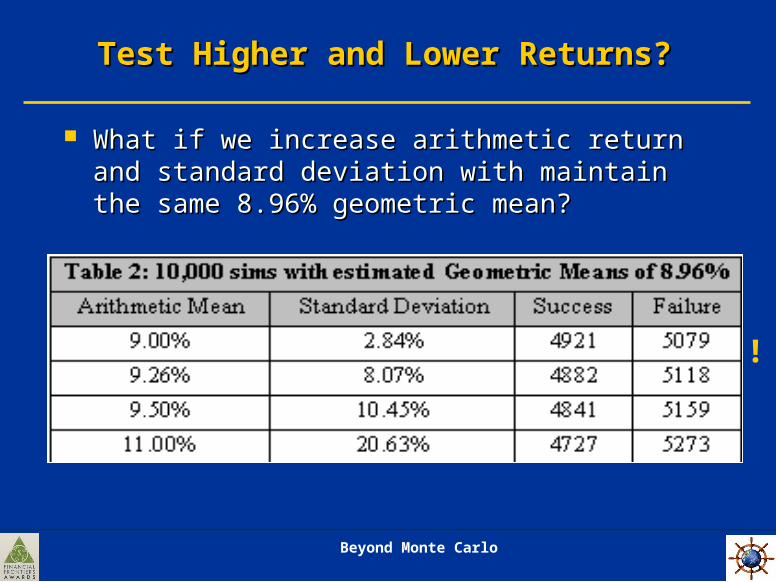
What if we increase arithmetic return and standard What if we increase arithmetic return and standard deviation with maintain the same 8.96% geometric deviation with maintain the same 8.96% geometric mean?mean?
!
Beyond Monte Carlo
Test Higher and Lower Returns?Test Higher and Lower Returns?
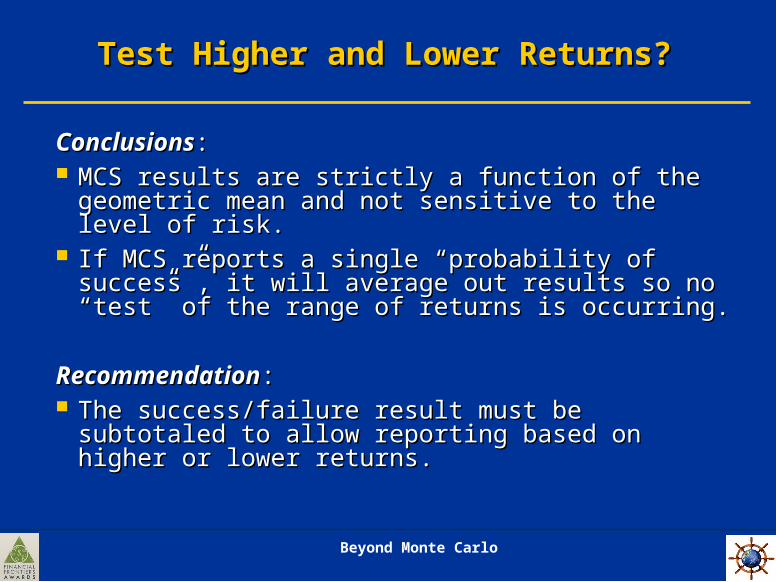
ConclusionsConclusions: : MCS results are strictly a function of the geometric MCS results are strictly a function of the geometric
mean and not sensitive to the level of risk. mean and not sensitive to the level of risk. If MCS reports a single “probability of success”, it will If MCS reports a single “probability of success”, it will
average out results so no “test” of the range of returns average out results so no “test” of the range of returns is occurring.is occurring.
RecommendationRecommendation: : The success/failure result must be subtotaled to allow The success/failure result must be subtotaled to allow
reporting based on higher or lower returns. reporting based on higher or lower returns.
Beyond Monte Carlo
Does MCS Test Sequence Risk?Does MCS Test Sequence Risk?
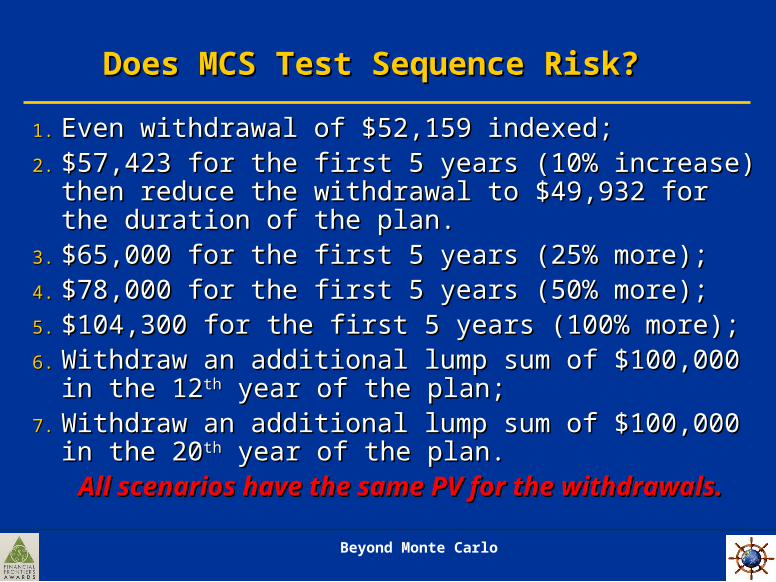
1.1. Even withdrawal of $52,159 indexed; Even withdrawal of $52,159 indexed; 2.2. $57,423 for the first 5 years (10% increase) then reduce the $57,423 for the first 5 years (10% increase) then reduce the
withdrawal to $49,932 for the duration of the plan. withdrawal to $49,932 for the duration of the plan. 3.3. $65,000 for the first 5 years (25% more);$65,000 for the first 5 years (25% more);4.4. $78,000 for the first 5 years (50% more);$78,000 for the first 5 years (50% more);5.5. $104,300 for the first 5 years (100% more);$104,300 for the first 5 years (100% more);6.6. Withdraw an additional lump sum of $100,000 in the 12Withdraw an additional lump sum of $100,000 in the 12 thth
year of the plan;year of the plan;7.7. Withdraw an additional lump sum of $100,000 in the 20Withdraw an additional lump sum of $100,000 in the 20 thth
year of the plan.year of the plan. All scenarios have the same PV for the withdrawals.All scenarios have the same PV for the withdrawals.
Beyond Monte Carlo
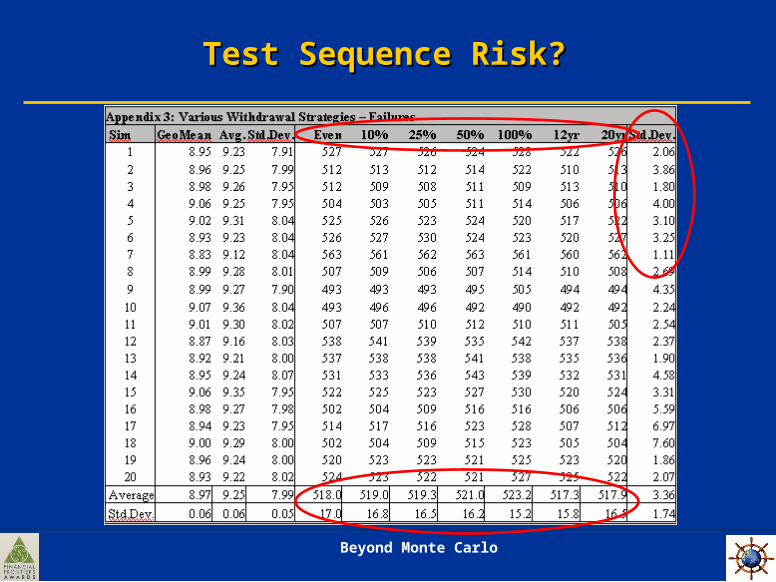
Test Sequence Risk?Test Sequence Risk?
Beyond Monte Carlo
Test Sequence Risk?Test Sequence Risk?
So all withdrawal strategies with same PV of So all withdrawal strategies with same PV of withdrawals resulted in the same 52% failure rate.withdrawals resulted in the same 52% failure rate.
Repeated the same 7 withdrawal strategies using Repeated the same 7 withdrawal strategies using 11% return +/- 20.63% (8.96% geometric mean). 11% return +/- 20.63% (8.96% geometric mean). From 51.8% to 52.1% failures. No change.From 51.8% to 52.1% failures. No change.
Why??Why??
Beyond Monte Carlo
Test Poor Initial Returns?Test Poor Initial Returns?
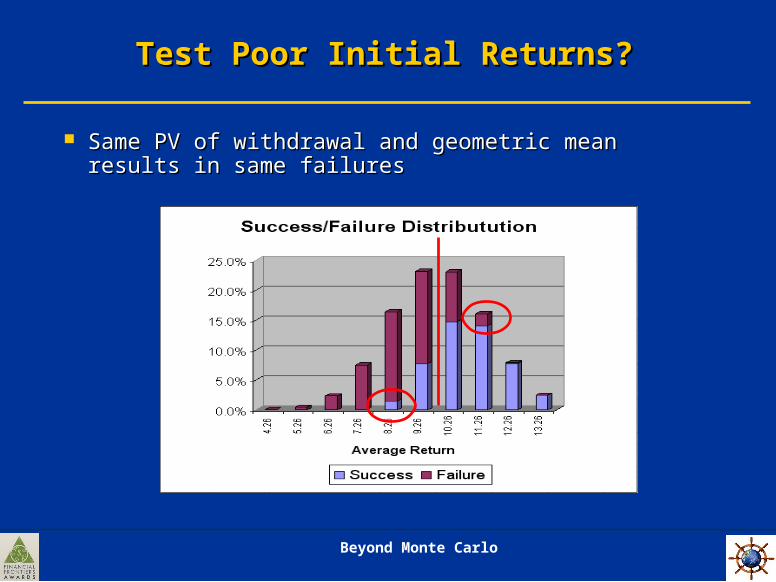
Same PV of withdrawal and geometric mean results in same Same PV of withdrawal and geometric mean results in same failuresfailures
Beyond Monte Carlo
Test Poor Initial Returns?Test Poor Initial Returns?
ConclusionConclusion: If the PV of the withdrawals is constant, : If the PV of the withdrawals is constant,
no difference in success/failure. no difference in success/failure.
Yes MCS can creates initial poor returns but no more Yes MCS can creates initial poor returns but no more
so than great returns. If reports a single “probability of so than great returns. If reports a single “probability of
success”, it will average out results so no “test” success”, it will average out results so no “test”
regardless.regardless.
ObservationObservation: Unless strategies exist to deal with initial : Unless strategies exist to deal with initial
poor returns without compromising initial great returns poor returns without compromising initial great returns
– so what? – so what?
Beyond Monte Carlo
Sidebar on InflationSidebar on Inflation
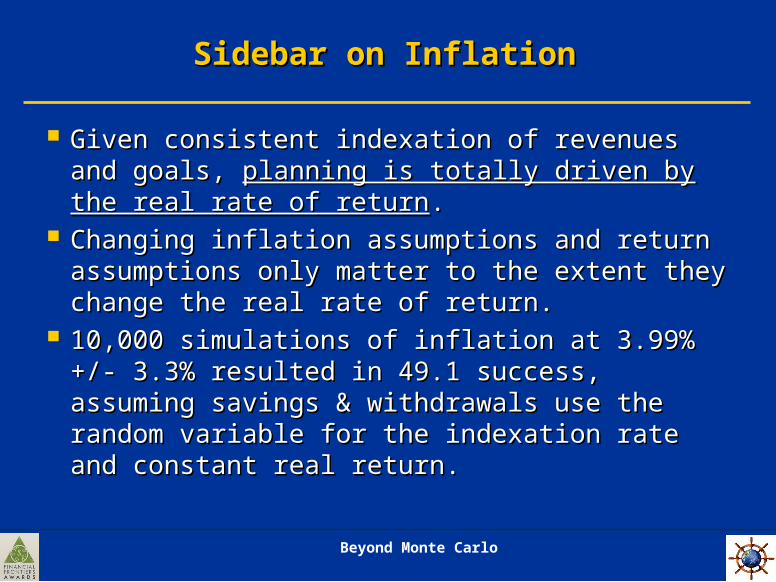
Given consistent indexation of revenues and goals, Given consistent indexation of revenues and goals, planning is totally driven by the real rate of returnplanning is totally driven by the real rate of return. .
Changing inflation assumptions and return assumptions Changing inflation assumptions and return assumptions only matter to the extent they change the real rate of only matter to the extent they change the real rate of return.return.
10,000 simulations of inflation at 3.99% +/- 3.3% 10,000 simulations of inflation at 3.99% +/- 3.3% resulted in 49.1 success, assuming savings & resulted in 49.1 success, assuming savings & withdrawals use the random variable for the indexation withdrawals use the random variable for the indexation rate and constant real return.rate and constant real return.
Beyond Monte Carlo
Mortality Assumptions/Longevity RiskMortality Assumptions/Longevity Risk
Beyond Monte Carlo
Mortality AssumptionsMortality Assumptions
What mortality assumption would you use in financial What mortality assumption would you use in financial plans?plans?
Mortality tables (77 for Tom)Mortality tables (77 for Tom)• Age 85Age 85• Age 90Age 90• Age 99Age 99
Beyond Monte Carlo
MortalityMortality
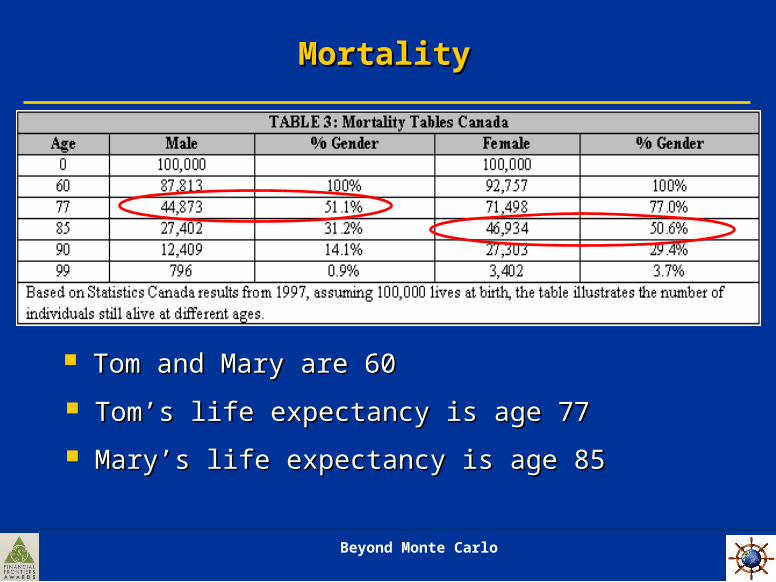
Tom and Mary are 60Tom and Mary are 60
Tom’s life expectancy is age 77Tom’s life expectancy is age 77
Mary’s life expectancy is age 85 Mary’s life expectancy is age 85
Beyond Monte Carlo
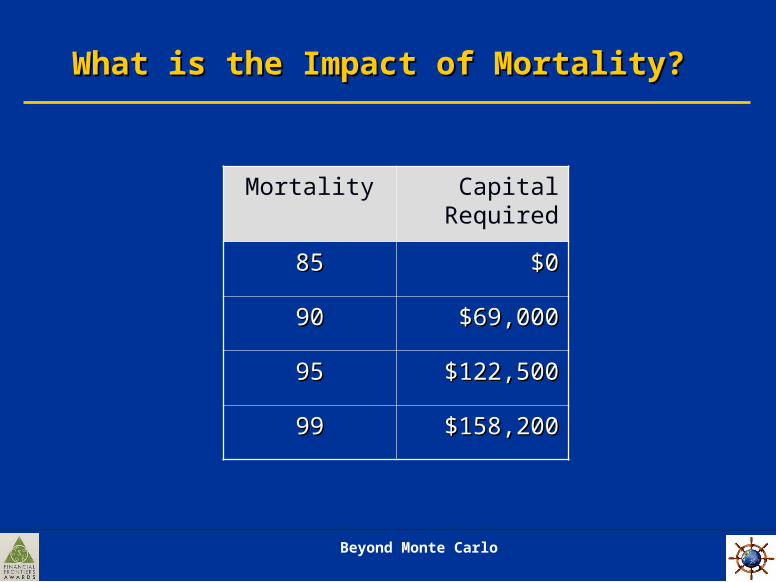
What is the Impact of Mortality?What is the Impact of Mortality?
Mortality Capital Required
8585 $0$0
9090 $69,000$69,000
9595 $122,500$122,500
9999 $158,200$158,200
Beyond Monte Carlo
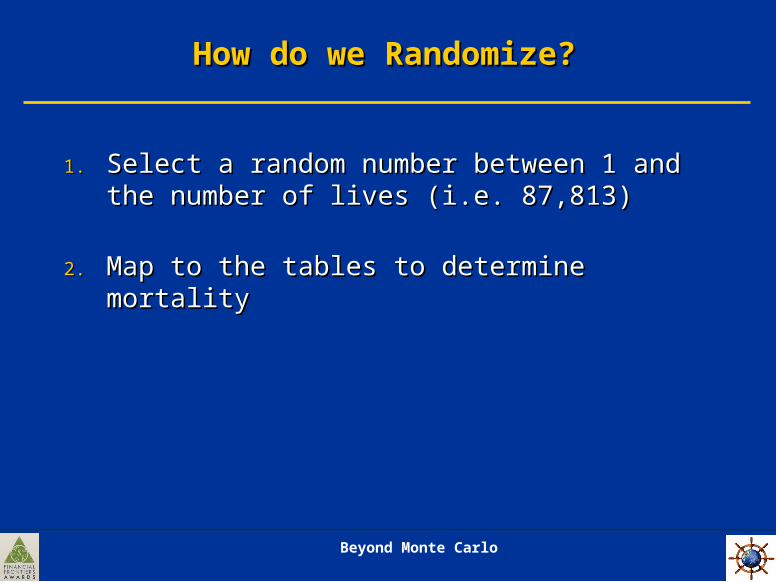
How do we Randomize?How do we Randomize?
1.1. Select a random number between 1 and the Select a random number between 1 and the number of lives (i.e. 87,813)number of lives (i.e. 87,813)
2.2. Map to the tables to determine mortalityMap to the tables to determine mortality
Beyond Monte Carlo
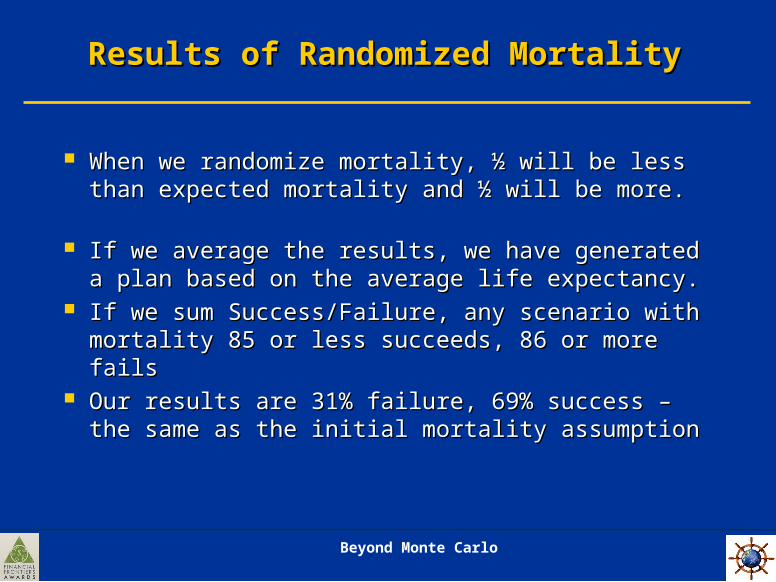
Results of Randomized MortalityResults of Randomized Mortality
When we randomize mortality, ½ will be less than When we randomize mortality, ½ will be less than expected mortality and ½ will be more. expected mortality and ½ will be more.
If we average the results, we have generated a plan If we average the results, we have generated a plan based on the average life expectancy.based on the average life expectancy.
If we sum Success/Failure, any scenario with If we sum Success/Failure, any scenario with mortality 85 or less succeeds, 86 or more failsmortality 85 or less succeeds, 86 or more fails
Our results are 31% failure, 69% success – the Our results are 31% failure, 69% success – the same as the initial mortality assumptionsame as the initial mortality assumption
Beyond Monte Carlo
Another Planning RiskAnother Planning Risk
In respect to life expectancy, aside from longevity In respect to life expectancy, aside from longevity risk, need to consider RAK-IT Riskrisk, need to consider RAK-IT Risk
RRetire etire AAnd nd KKick ick ITIT (IT = The Bucket!) (IT = The Bucket!)
When we obsess on Longevity Risk we may be When we obsess on Longevity Risk we may be planning for our compliance department, not the planning for our compliance department, not the clientclient
I would say “Forget longevity risk if it means I would say “Forget longevity risk if it means delaying my retirement and getting to my boat!” delaying my retirement and getting to my boat!”

Beyond Monte Carlo
Another Planning RiskAnother Planning Risk
Beyond Monte Carlo
Longevity RiskLongevity Risk
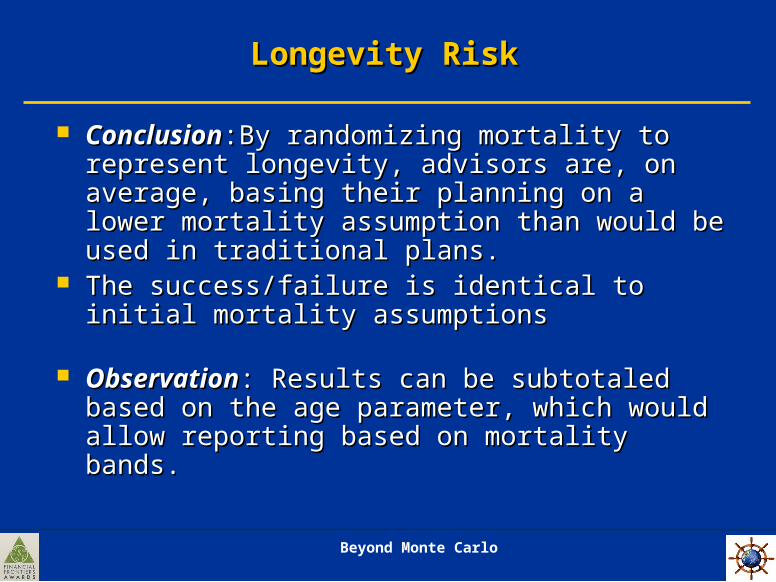
ConclusionConclusion:By randomizing mortality to represent :By randomizing mortality to represent longevity, advisors are, on average, basing their longevity, advisors are, on average, basing their planning on a lower mortality assumption than would planning on a lower mortality assumption than would be used in traditional plans.be used in traditional plans.
The success/failure is identical to initial mortality The success/failure is identical to initial mortality assumptions assumptions
ObservationObservation: Results can be subtotaled based on the : Results can be subtotaled based on the age parameter, which would allow reporting based on age parameter, which would allow reporting based on mortality bands. mortality bands.
Beyond Monte Carlo
Section One SummarySection One Summary
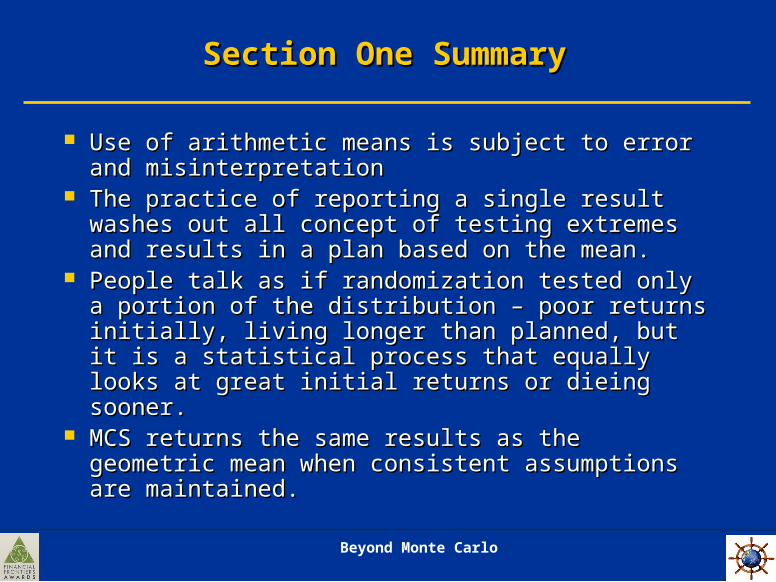
Use of arithmetic means is subject to error and Use of arithmetic means is subject to error and misinterpretationmisinterpretation
The practice of reporting a single result washes out The practice of reporting a single result washes out all concept of testing extremes and results in a plan all concept of testing extremes and results in a plan based on the mean.based on the mean.
People talk as if randomization tested only a portion People talk as if randomization tested only a portion of the distribution – poor returns initially, living of the distribution – poor returns initially, living longer than planned, but it is a statistical process longer than planned, but it is a statistical process that equally looks at great initial returns or dieing that equally looks at great initial returns or dieing sooner.sooner.
MCS returns the same results as the geometric MCS returns the same results as the geometric mean when consistent assumptions are maintained. mean when consistent assumptions are maintained.
Beyond Monte Carlo
Section 2: Reliability ForecastsSection 2: Reliability Forecasts
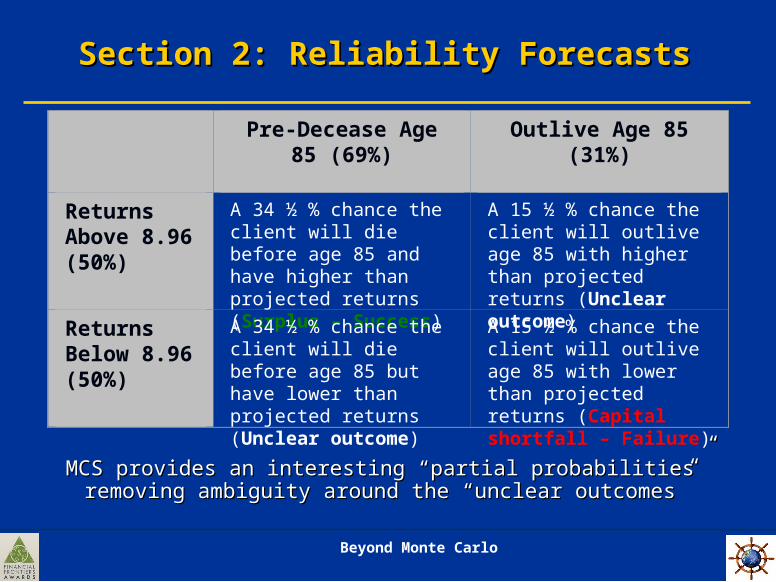
Pre-Decease Age 85 (69%)
Outlive Age 85 (31%)
Returns Above 8.96(50%)
A 34 ½ % chance the client will die before age 85 and have higher than projected returns (Surplus – Success)
A 15 ½ % chance the client will outlive age 85 with higher than projected returns (Unclear outcome)
Returns Below 8.96(50%)
A 34 ½ % chance the client will die before age 85 but have lower than projected returns (Unclear outcome)
A 15 ½ % chance the client will outlive age 85 with lower than projected returns (Capital shortfall – Failure)
MCS provides an interesting “partial probabilities” removing MCS provides an interesting “partial probabilities” removing ambiguity around the “unclear outcomes”ambiguity around the “unclear outcomes”
Beyond Monte Carlo
MCS for Returns & Mortality MCS for Returns & Mortality
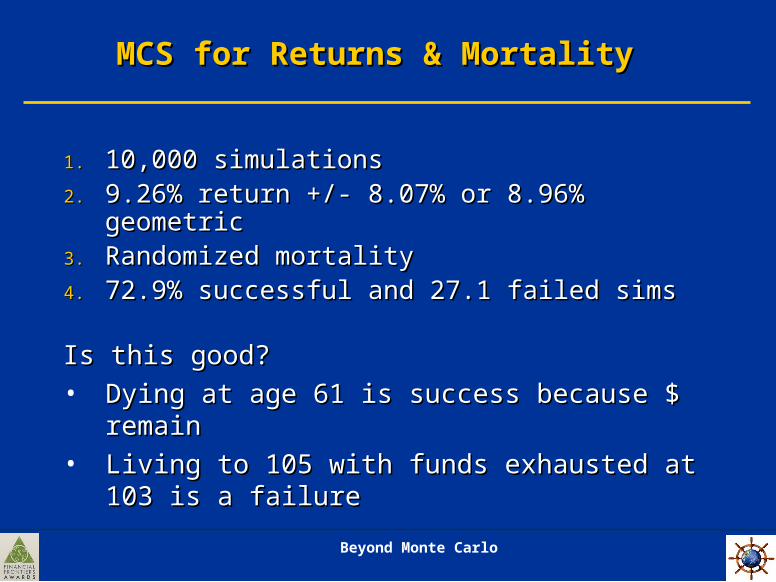
1.1. 10,000 simulations 10,000 simulations 2.2. 9.26% return +/- 8.07% or 8.96% geometric9.26% return +/- 8.07% or 8.96% geometric3.3. Randomized mortalityRandomized mortality4.4. 72.9% successful and 27.1 failed sims72.9% successful and 27.1 failed sims
Is this good?Is this good?• Dying at age 61 is success because $ remainDying at age 61 is success because $ remain• Living to 105 with funds exhausted at 103 is a Living to 105 with funds exhausted at 103 is a
failurefailure
Beyond Monte Carlo
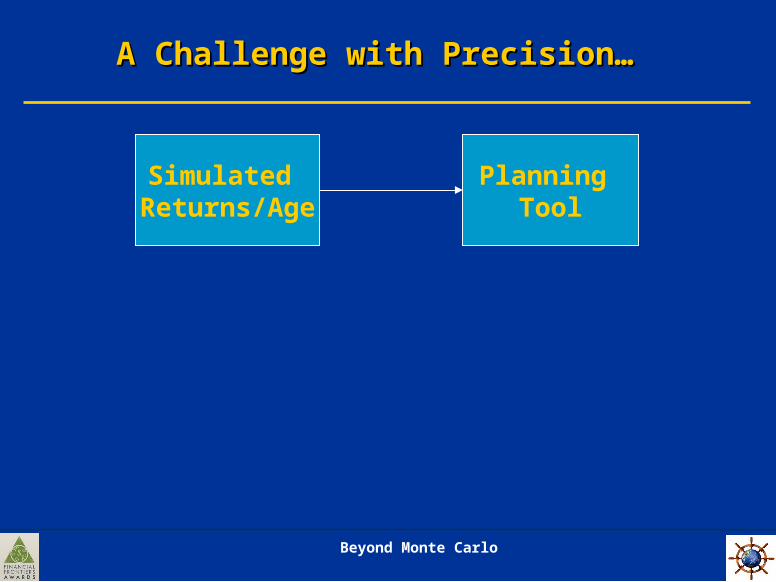
A Challenge with Precision… A Challenge with Precision…
Planning Tool
Simulated Returns/Age
Beyond Monte Carlo
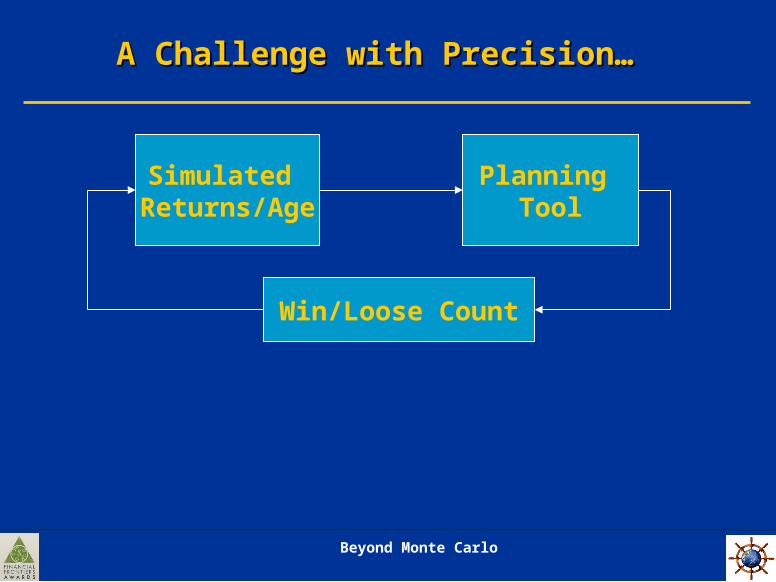
A Challenge with Precision… A Challenge with Precision…
Planning Tool
Simulated Returns/Age
Win/Loose Count
Beyond Monte Carlo
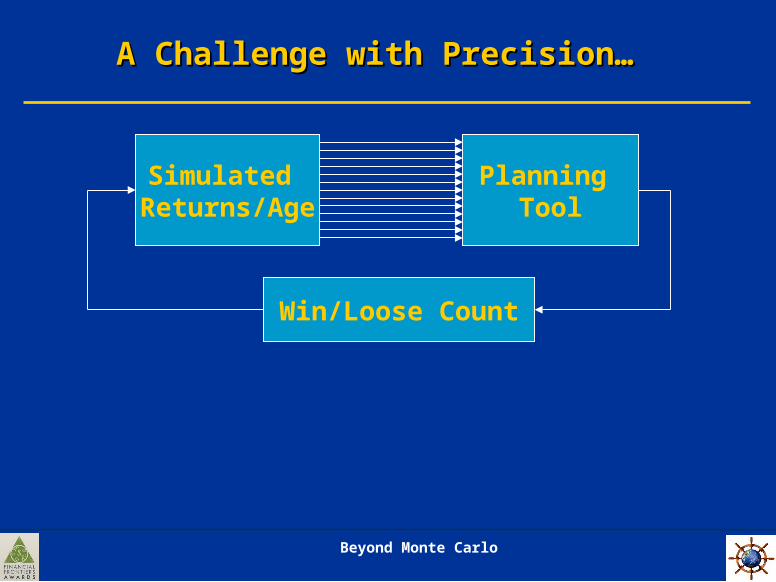
A Challenge with Precision… A Challenge with Precision…
Planning Tool
Simulated Returns/Age
Win/Loose Count
Beyond Monte Carlo
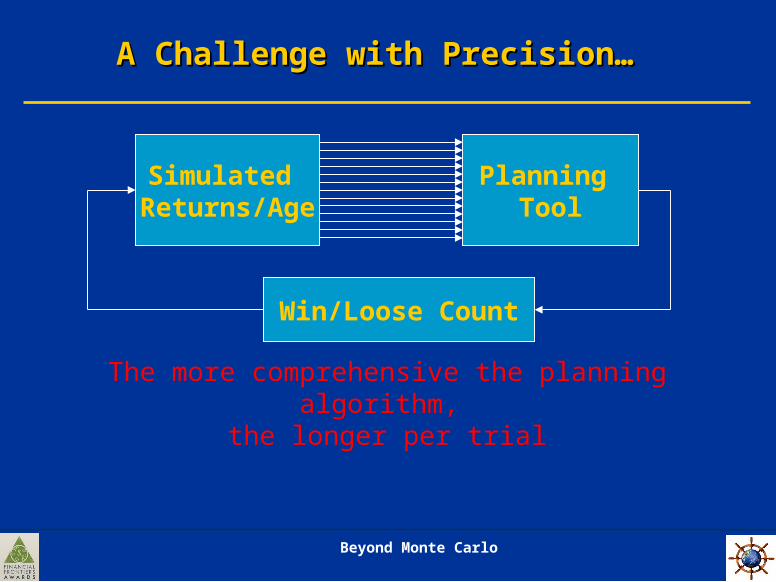
A Challenge with Precision… A Challenge with Precision…
Planning Tool
Simulated Returns/Age
Win/Loose Count
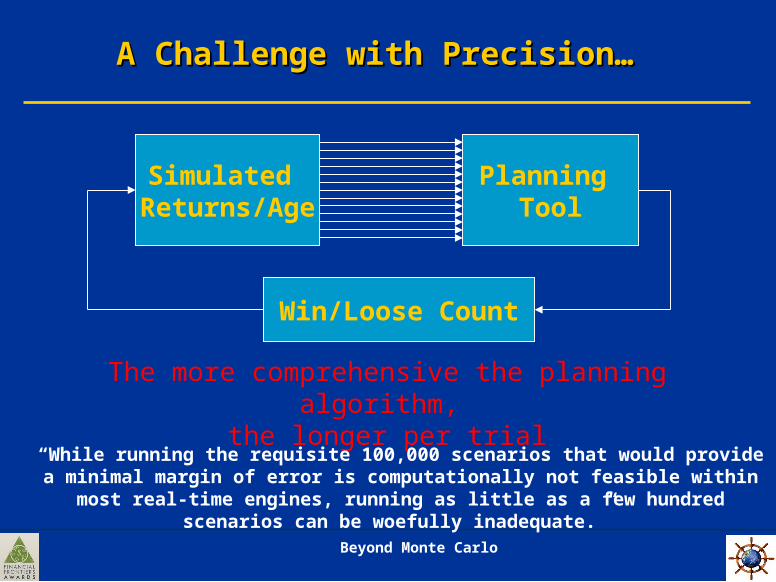
The more comprehensive the planning algorithm, the longer per trial
Beyond Monte Carlo
A Challenge with Precision… A Challenge with Precision…
Planning Tool
Simulated Returns/Age
Win/Loose Count
The more comprehensive the planning algorithm, the longer per trial
“While running the requisite 100,000 scenarios that would provide a minimal margin of error is computationally not feasible within most real-time engines,
running as little as a few hundred scenarios can be woefully inadequate.”
Beyond Monte Carlo
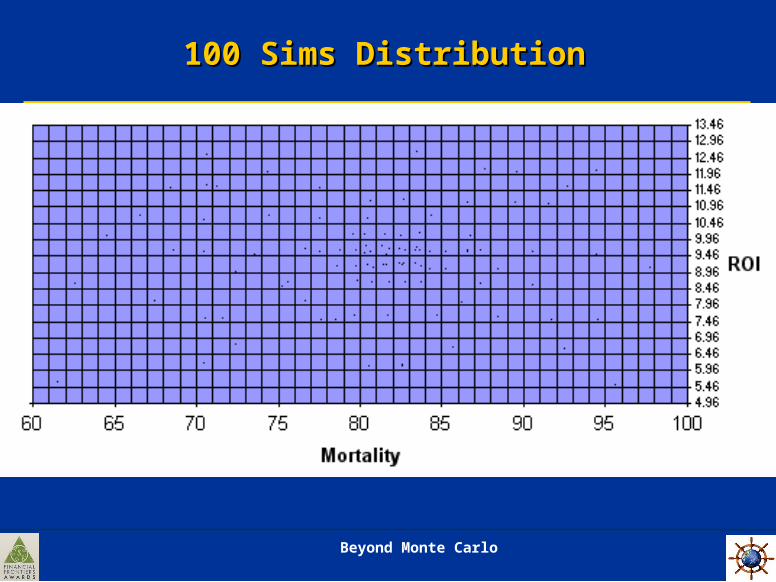
100 Sims Distribution100 Sims Distribution
Beyond Monte Carlo
Goals for an Algorithmic Solution Goals for an Algorithmic Solution
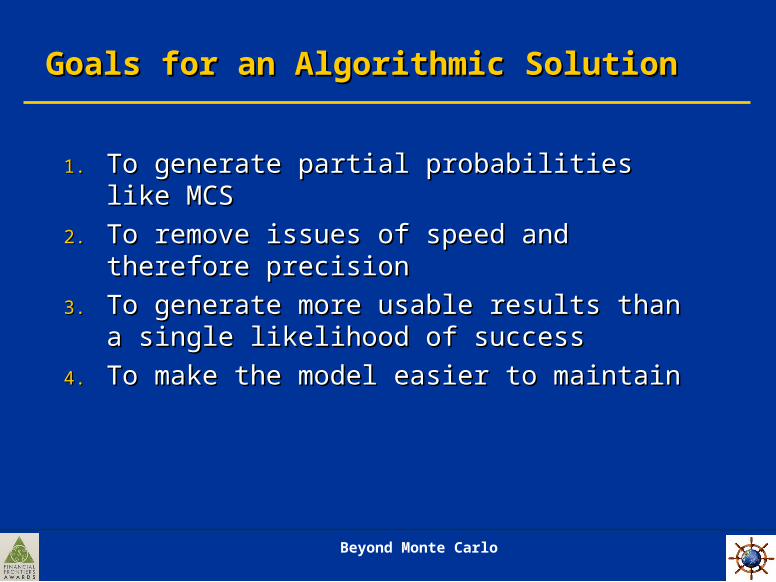
1.1. To generate partial probabilities like MCSTo generate partial probabilities like MCS
2.2. To remove issues of speed and therefore precisionTo remove issues of speed and therefore precision
3.3. To generate more usable results than a single To generate more usable results than a single likelihood of successlikelihood of success
4.4. To make the model easier to maintainTo make the model easier to maintain
Beyond Monte Carlo
2 Critical Observations 2 Critical Observations
Planning Tool
Simulated Returns/Age
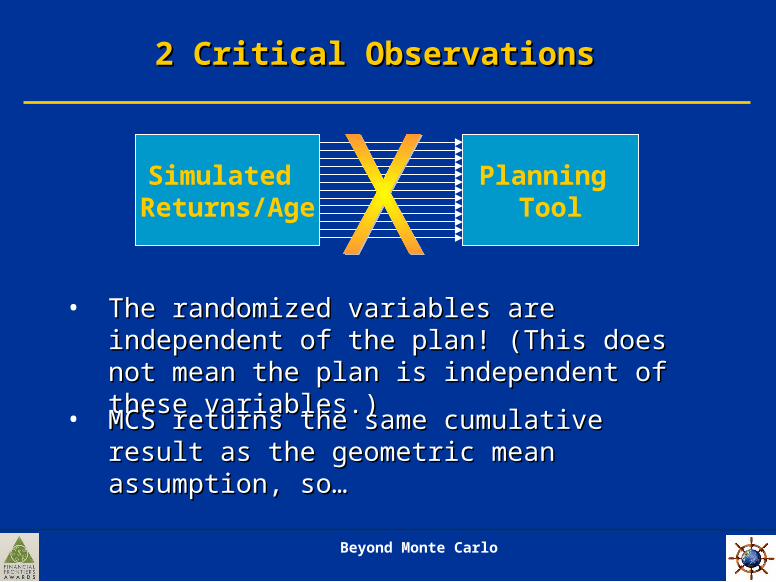
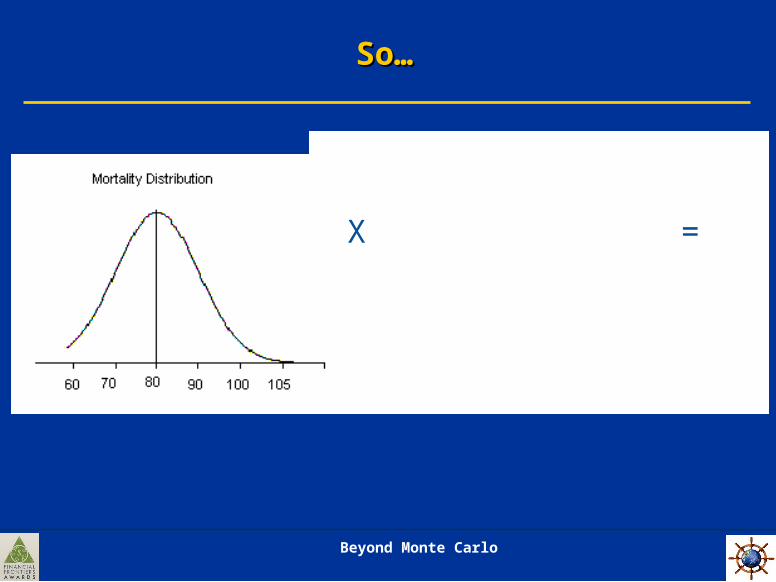
• The randomized variables are independent of the The randomized variables are independent of the plan! (This does not mean the plan is independent plan! (This does not mean the plan is independent of these variables.)of these variables.)
• MCS returns the same cumulative result as the MCS returns the same cumulative result as the geometric mean assumption, so… geometric mean assumption, so…
Beyond Monte Carlo
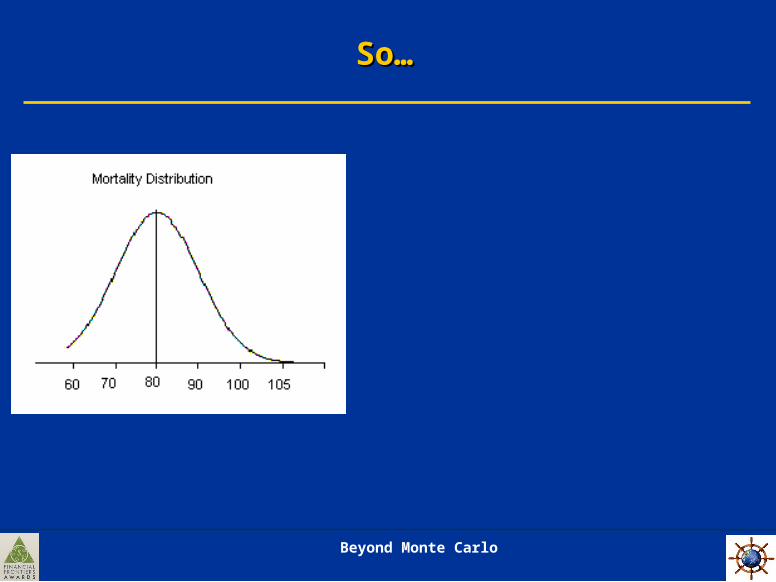
So…So…
Beyond Monte Carlo
So…So…
X =
Beyond Monte Carlo
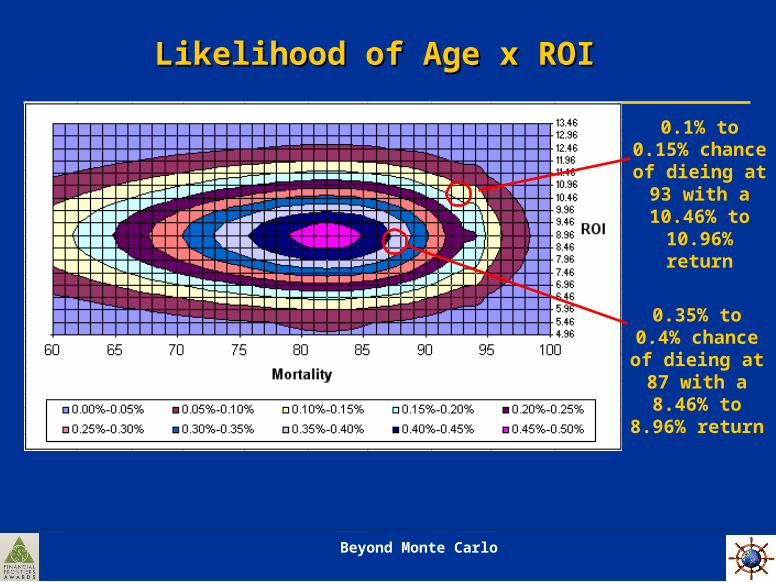
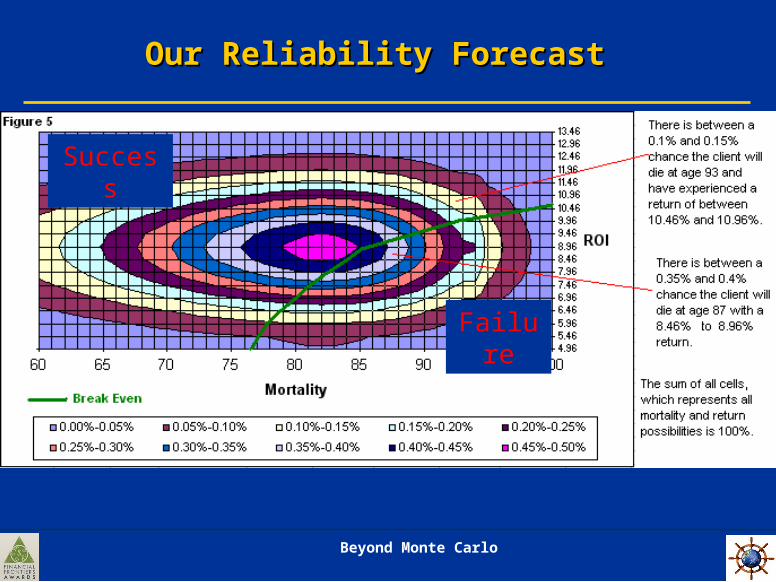
Likelihood of Age x ROI Likelihood of Age x ROI
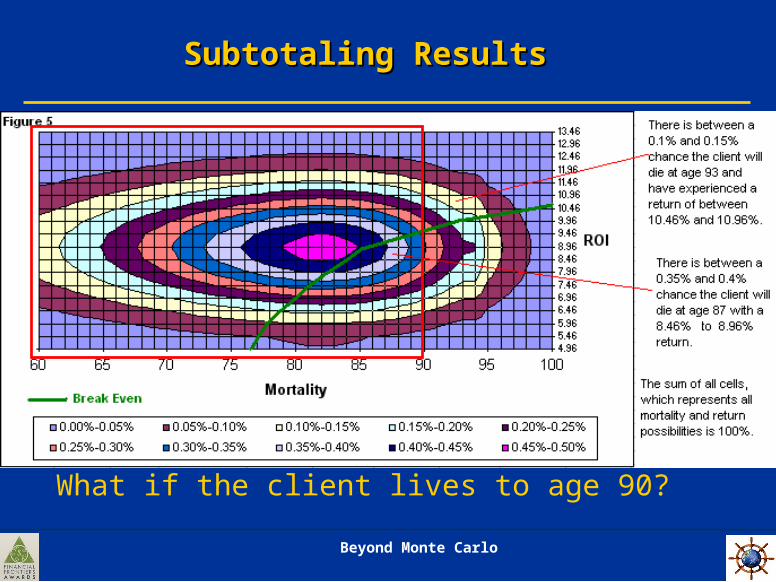
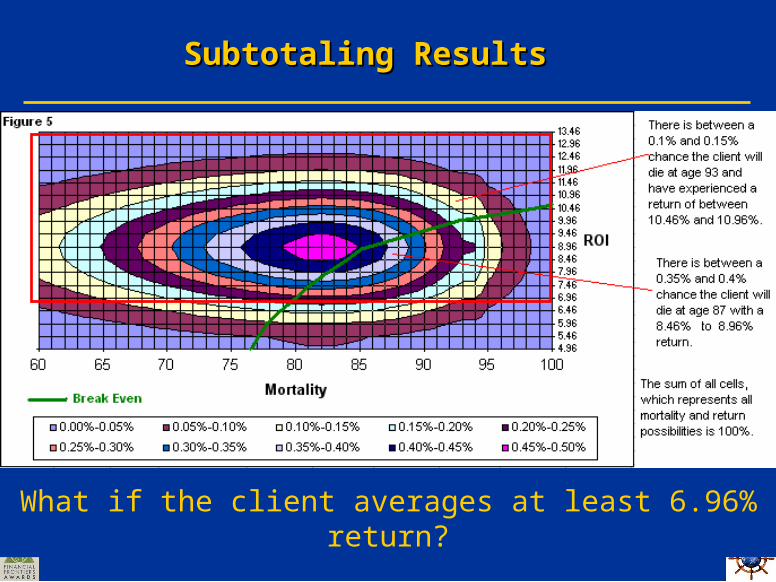
0.1% to 0.15% chance of
dieing at 93 with a 10.46%
to 10.96% return
0.35% to 0.4% chance of
dieing at 87 with a 8.46% to
8.96% return
Beyond Monte Carlo
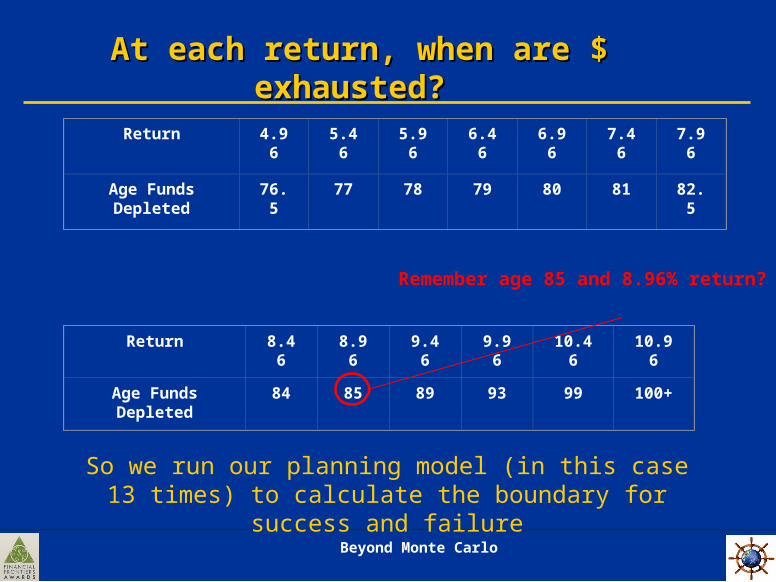
Return 8.46 8.96 9.46 9.96 10.46 10.96
Age Funds Depleted
84 85 89 93 99 100+
Return 4.96 5.46 5.96 6.46 6.96 7.46 7.96
Age Funds Depleted
76.5 77 78 79 80 81 82.5
At each return, when are $ exhausted? At each return, when are $ exhausted?
Remember age 85 and 8.96% return?
So we run our planning model (in this case 13 times) to calculate the boundary for success and failure
Beyond Monte Carlo
Our Reliability Forecast Our Reliability Forecast
Success
Failure
Beyond Monte Carlo
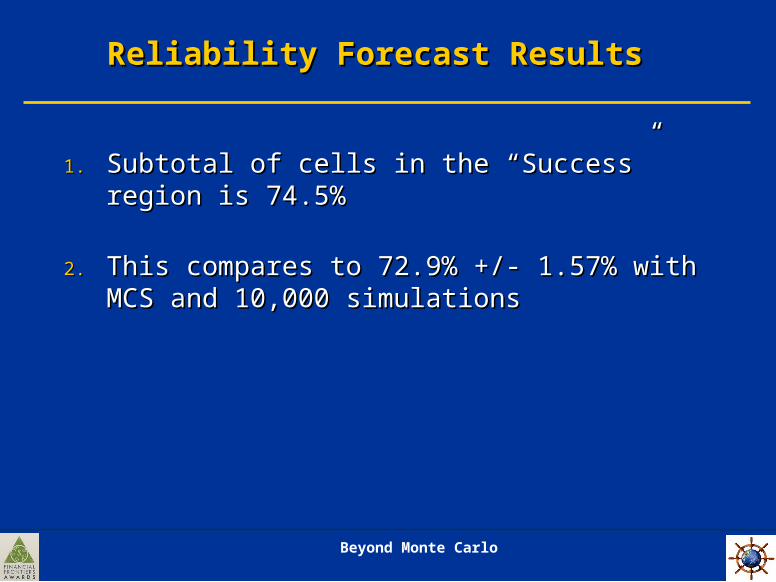
Reliability Forecast Results Reliability Forecast Results
1.1. Subtotal of cells in the “Success” region is 74.5% Subtotal of cells in the “Success” region is 74.5%
2.2. This compares to 72.9% +/- 1.57% with MCS and This compares to 72.9% +/- 1.57% with MCS and 10,000 simulations10,000 simulations
Beyond Monte Carlo
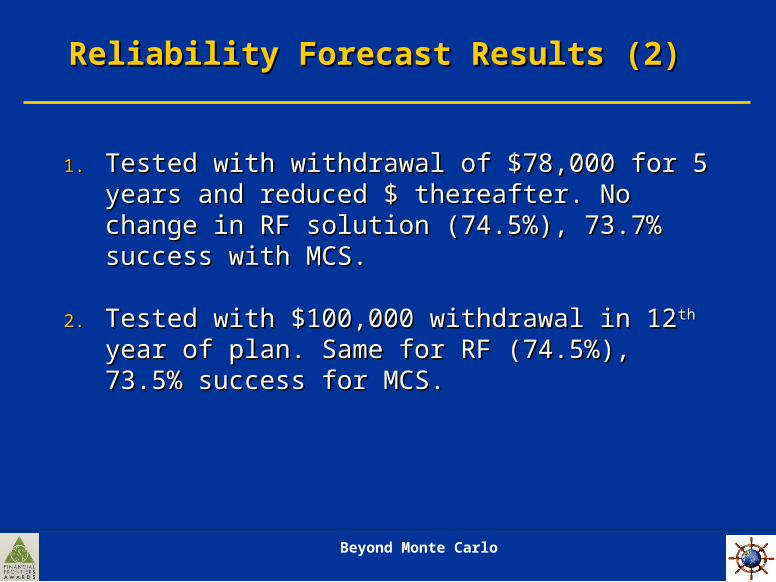
Reliability Forecast Results (2) Reliability Forecast Results (2)
1.1. Tested with withdrawal of $78,000 for 5 years and Tested with withdrawal of $78,000 for 5 years and reduced $ thereafter. No change in RF solution reduced $ thereafter. No change in RF solution (74.5%), 73.7% success with MCS.(74.5%), 73.7% success with MCS.
2.2. Tested with $100,000 withdrawal in 12Tested with $100,000 withdrawal in 12 thth year of year of plan. Same for RF (74.5%), 73.5% success for plan. Same for RF (74.5%), 73.5% success for MCS.MCS.
Beyond Monte Carlo
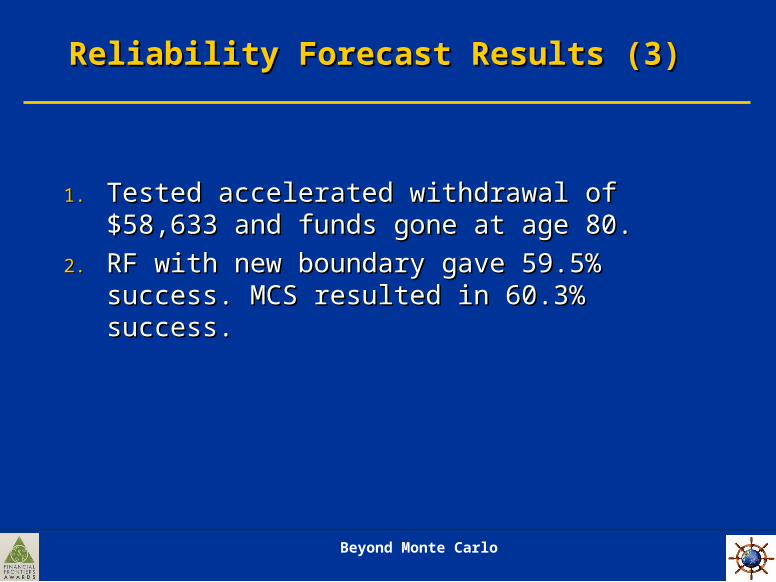
Reliability Forecast Results (3) Reliability Forecast Results (3)
1.1. Tested accelerated withdrawal of $58,633 and Tested accelerated withdrawal of $58,633 and funds gone at age 80.funds gone at age 80.
2.2. RF with new boundary gave 59.5% success. MCS RF with new boundary gave 59.5% success. MCS resulted in 60.3% success.resulted in 60.3% success.
Beyond Monte Carlo
Reliability Forecast Results (4) Reliability Forecast Results (4)
1.1. Tested withdrawal of $65,000, 10% return and Tested withdrawal of $65,000, 10% return and 11% standard deviation (9.5% geometric mean). 11% standard deviation (9.5% geometric mean).
2.2. RF with new boundary gave 51.6% success. MCS RF with new boundary gave 51.6% success. MCS resulted in 51.2% success with 10,000 sims.resulted in 51.2% success with 10,000 sims.
The Reliability Forecast provides the same partial probabilities as MCS with a dozen iterations of the
planning model.
Beyond Monte Carlo
Subtotaling Results Subtotaling Results
What if the client lives to age 90?
Beyond Monte Carlo
Subtotaling Results Subtotaling Results
What if the client averages at least 6.96% return?
Beyond Monte Carlo
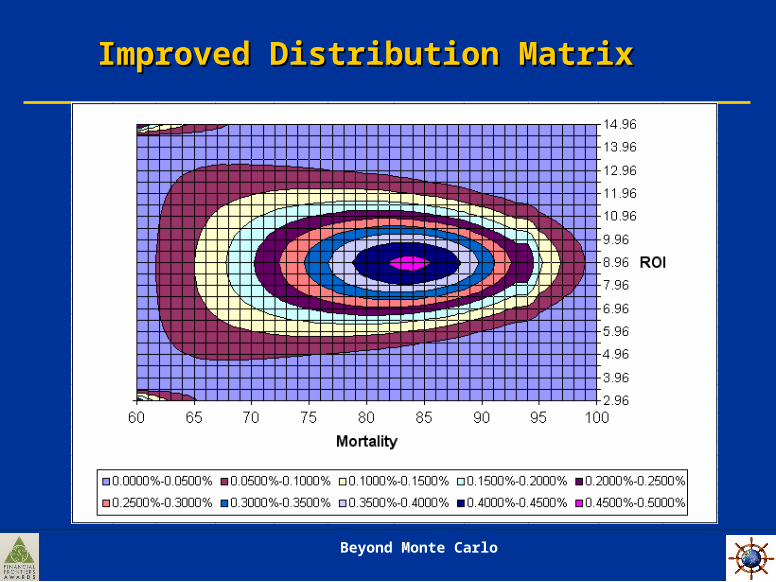
Improved Distribution Matrix Improved Distribution Matrix
Beyond Monte Carlo
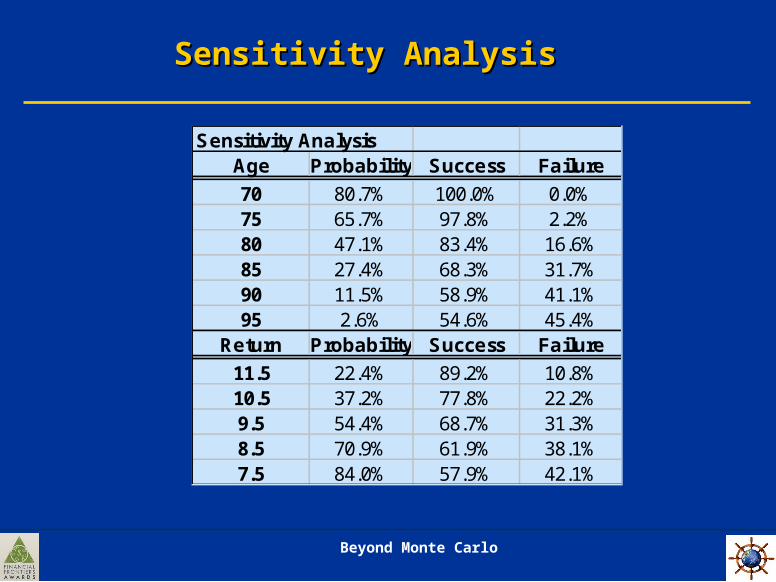
Sensitivity Analysis Sensitivity Analysis
Sensitivity AnalysisAge Probability Success Failure
70 80.7% 100.0% 0.0%75 65.7% 97.8% 2.2%80 47.1% 83.4% 16.6%85 27.4% 68.3% 31.7%90 11.5% 58.9% 41.1%95 2.6% 54.6% 45.4%
Return Probability Success Failure
11.5 22.4% 89.2% 10.8%10.5 37.2% 77.8% 22.2%9.5 54.4% 68.7% 31.3%8.5 70.9% 61.9% 38.1%7.5 84.0% 57.9% 42.1%
Beyond Monte Carlo
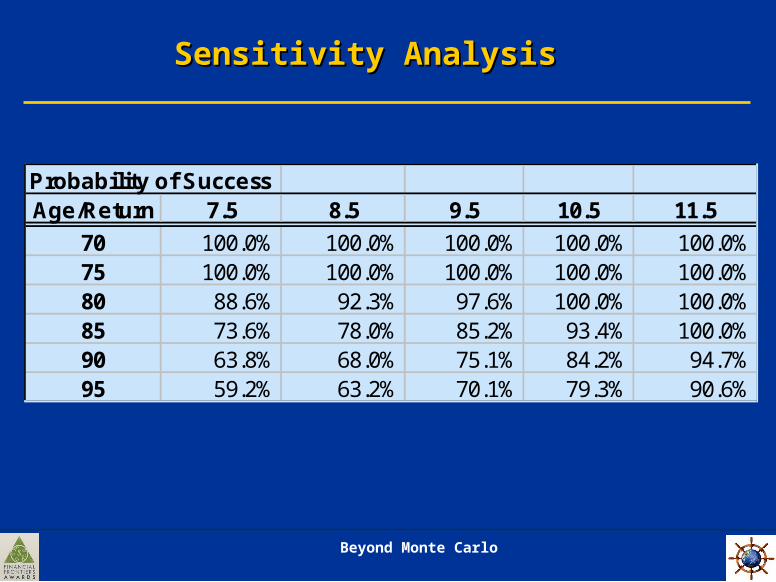
Sensitivity Analysis Sensitivity Analysis
Probability of SuccessAge/Return 7.5 8.5 9.5 10.5 11.5
70 100.0% 100.0% 100.0% 100.0% 100.0%75 100.0% 100.0% 100.0% 100.0% 100.0%80 88.6% 92.3% 97.6% 100.0% 100.0%85 73.6% 78.0% 85.2% 93.4% 100.0%90 63.8% 68.0% 75.1% 84.2% 94.7%95 59.2% 63.2% 70.1% 79.3% 90.6%
Beyond Monte Carlo
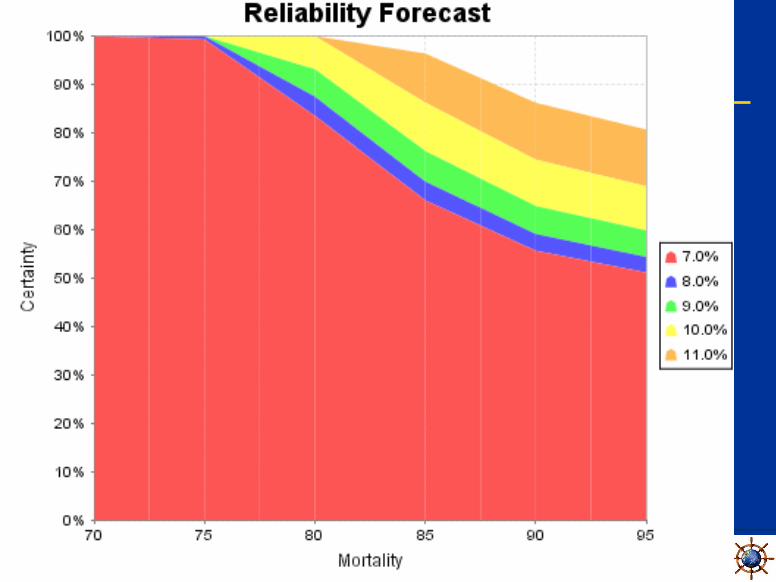
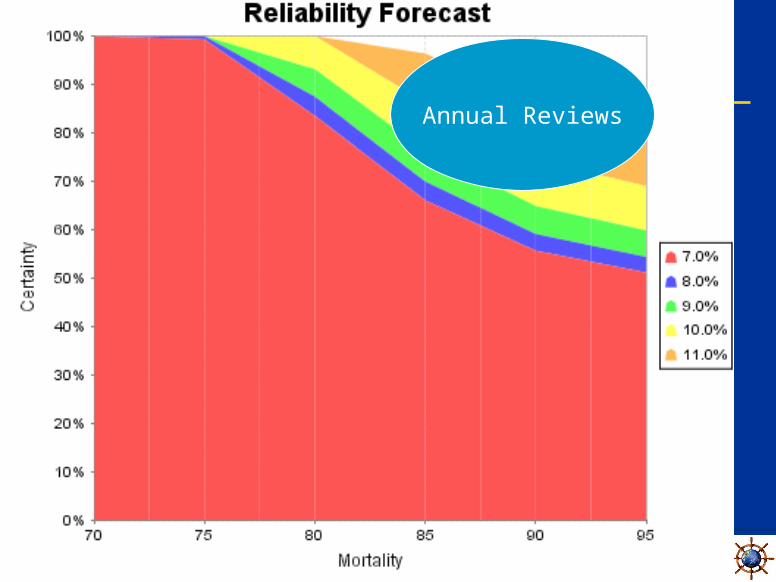
Sensitivity Analysis Sensitivity Analysis
Beyond Monte Carlo
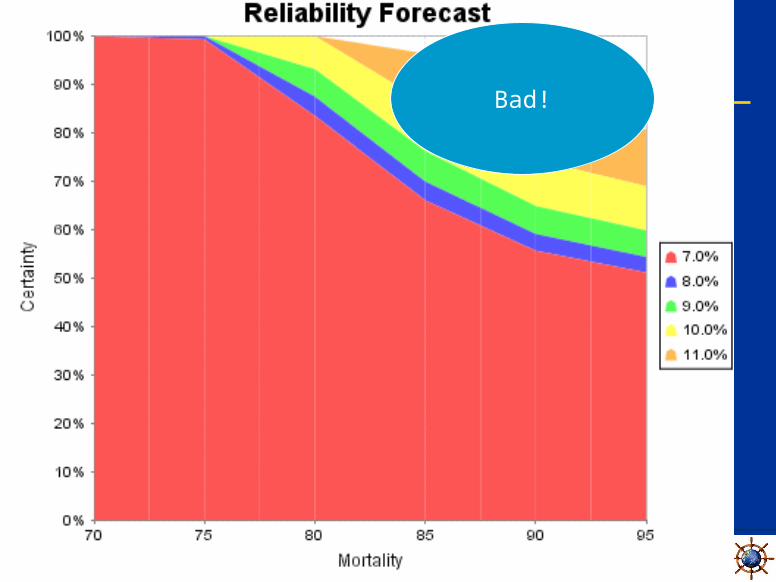
Sensitivity Analysis Sensitivity Analysis Bad!
Beyond Monte Carlo
Sensitivity Analysis Sensitivity Analysis
Annual Reviews
Beyond Monte Carlo
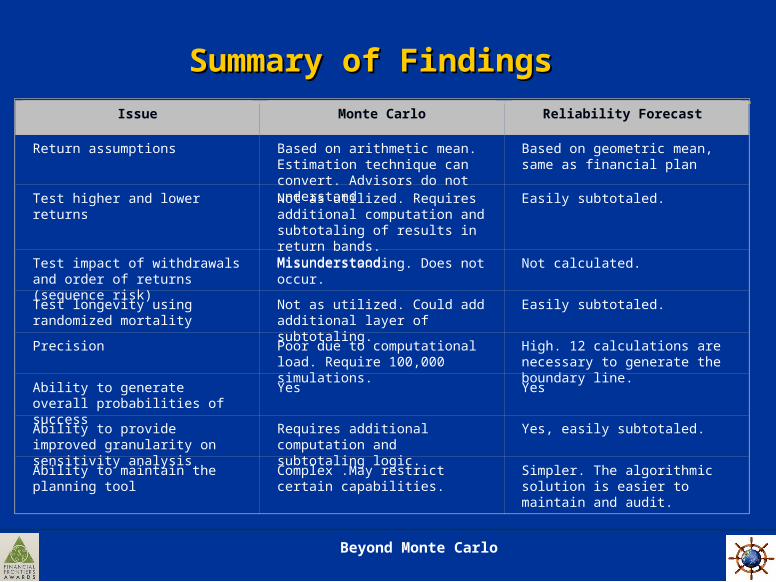
Summary of FindingsSummary of Findings
Issue Monte Carlo Reliability Forecast
Return assumptions Based on arithmetic mean. Estimation technique can convert. Advisors do not understand
Based on geometric mean, same as financial plan
Test higher and lower returns Not as utilized. Requires additional computation and subtotaling of results in return bands. Misunderstood.
Easily subtotaled.
Test impact of withdrawals and order of returns (sequence risk)
Misunderstanding. Does not occur. Not calculated.
Test longevity using randomized mortality
Not as utilized. Could add additional layer of subtotaling.
Easily subtotaled.
Precision Poor due to computational load. Require 100,000 simulations.
High. 12 calculations are necessary to generate the boundary line.
Ability to generate overall probabilities of success
Yes Yes
Ability to provide improved granularity on sensitivity analysis
Requires additional computation and subtotaling logic.
Yes, easily subtotaled.
Ability to maintain the planning tool Complex .May restrict certain capabilities.
Simpler. The algorithmic solution is easier to maintain and audit.
Beyond Monte Carlo
Conclusion Conclusion
The Reliability Forecast approach outlined provides all The Reliability Forecast approach outlined provides all the analytical results available using MCS in a fraction the analytical results available using MCS in a fraction of the calculations, using more common assumptions, of the calculations, using more common assumptions, leading to higher precision.leading to higher precision.

Beyond Monte Carlo
Questions Questions
??