Embed Size (px)
Citation preview
Bharat Financial Inclusion Limited
(Formerly SKS Microfinance Ltd.)
Initiating Coverage
June 2016
Page 2
Bharat Financial Inclusion Ltd. (Formerly SKS Microfinance Ltd.)
‘From AP to Bharat – the resurrection of SKS’
Find Spark Research on Bloomberg (SPAK <go>),
Thomson First Call, Reuters Knowledge and Factset
“In my experience, poor people are the world's greatest entrepreneurs. Every day, they must innovate in order to survive. They
remain poor because they do not have the opportunities to turn their creativity into sustainable income.”
- Muhammad Yunus
Bharat Financial Inclusion’s (SKSM IN) journey thus far resembles the proverbial phoenix – from being virtually written off
post the AP crisis in FY11, SKSM has since clawed back to stand at the very top of the MFI industry. An unwavering
commitment to the JLG model even as other MFI peers diversify away into the riskier individual lending model, clarity on a
volume driven growth model, a geographically diverse franchise backed by a carefully chosen expansion strategy, proactive
concentration norms, a self mandated cap on leverage, sub 20% lending rate and focus on technology hold the company in
good stead. Over FY16-FY19, we believe SKS is a growth-operating leverage-capital raise play. We initiate coverage with a
BUY, valuing SKSM IN at 4.3x FY18E ABV (3.5x FY18E ABV assuming a Rs. 7.5bn capital raise at CMP).
Key Thoughts:
1. Volumes to drive growth: Driven by the introduction of long term loans(LTL) in FY14, SKSM’s volume:value split of growth moved
to 30:70 against 70:30 prior. However, with the RBI now doubling ticket sizes in the <2 year tenor, we expect the volume mix to
move to 55% from 30% currently; additionally, we note that the average ticket size of disbursements (per account) in FY16 was
Rs.15,024, the lowest amongst comparable peers.
2. Concentration norms minimise event risk: SKSM’s AUM per branch at Rs. 65mn is currently the lowest in the industry, while the
AUM per district at Rs.252mn also ranks amongst the lowest minimising event risks. Additionally, we note modest overlap between
SKSM’s key geographies and the bank led SHG model, minimising the risk of a ‘credit bureau data’ led culling of borrowers as SHGs
start reporting data in FY17. Consistently high hit rates of >80%, 20%+ rejection rates for all loans with 38% rejection rates for LTL
provides comfort.
3. High drop-out rates, JLG model, EWI collections minimises ‘ever-greening risk’: We note high 30-40% drop out rates in the
initial loan cycles (IGL 2-4), indicating lower ever-greening risk; in addition SKS is primarily focussed on EWI led collection
frequency translating into constant interaction at the borrower level. Moreover, 100% of first cycle loans are monitored for end use
while the absence of individual loans adds credibility. Finally, we note that 37% of borrowers had repaid loans in the wind down
phase of FY11-FY13 without incremental lending happening.
4. Leverage cap at 5x provides comfort: SKSM was one of the few MFI entities operating out of AP to not resort to Corporate Debt
Restructuring (CDR), successfully paying back lenders (including the securitised portfolio). The current business model is attuned to
a capital raise every ~30 months led by a self imposed leverage cap of 5x against a permissible 13x, making SKSM an attractive
capital raise play.
5. Focus on technology, operating leverage: SKSM is amongst few players in the industry to move to a 100% tab based solution for
field staff; with ~75% of customers being Aadhaar linked and biometric solutions kicking in, we expect the turnaround time to go
down further to 2-3 days from 5 days currently. While the current model is largely focussed on cash disbursements, we expect cost
reductions to kick in as cash disbursements take off. We expect cost to income to decline to 41% by FY19 against 48% currently.
6. Lending rates, incentive structures: SKSM’s lending rates at 19.8% are currently the lowest in the industry and should provide
comfort to policy makers, minimising the risk of political fallout. The incentive structure for employees is centred around number of
customer enrolments and number of customers managed. SKS does not base incentives on the disbursements or collection; about
50% of the gross pay for employees is variable linked.
ABHINESH VIJAYARAJ [email protected] +91 44 4344 0006
NISHANT RUNGTA [email protected] +91 44 4344 0033
NAVIN BABU E S [email protected] +91 44 4344 0065
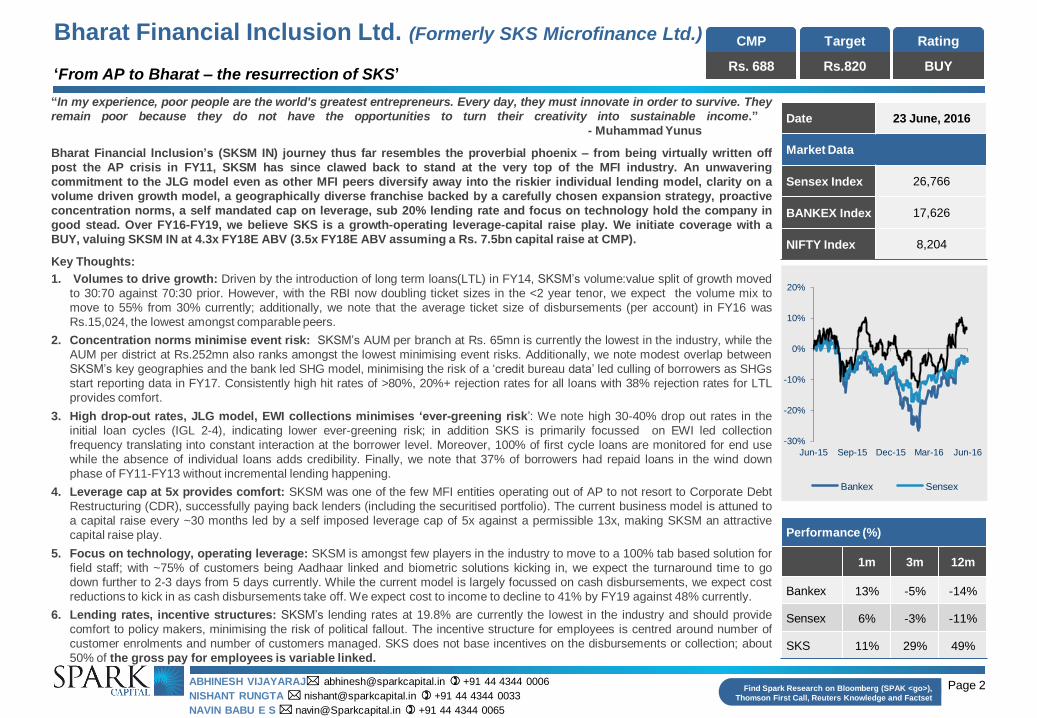
Performance (%)
1m 3m 12m
Bankex 13% -5% -14%
Sensex 6% -3% -11%
SKS 11% 29% 49%
Date 23 June, 2016
Market Data
Sensex Index 26,766
BANKEX Index 17,626
NIFTY Index 8,204
-30%
-20%
-10%
0%
10%
20%
Jun-15 Sep-15 Dec-15 Mar-16 Jun-16
Bankex Sensex
CMP
Rs. 688
Target
Rs.820
Rating
BUY

Page 3
Industry Section
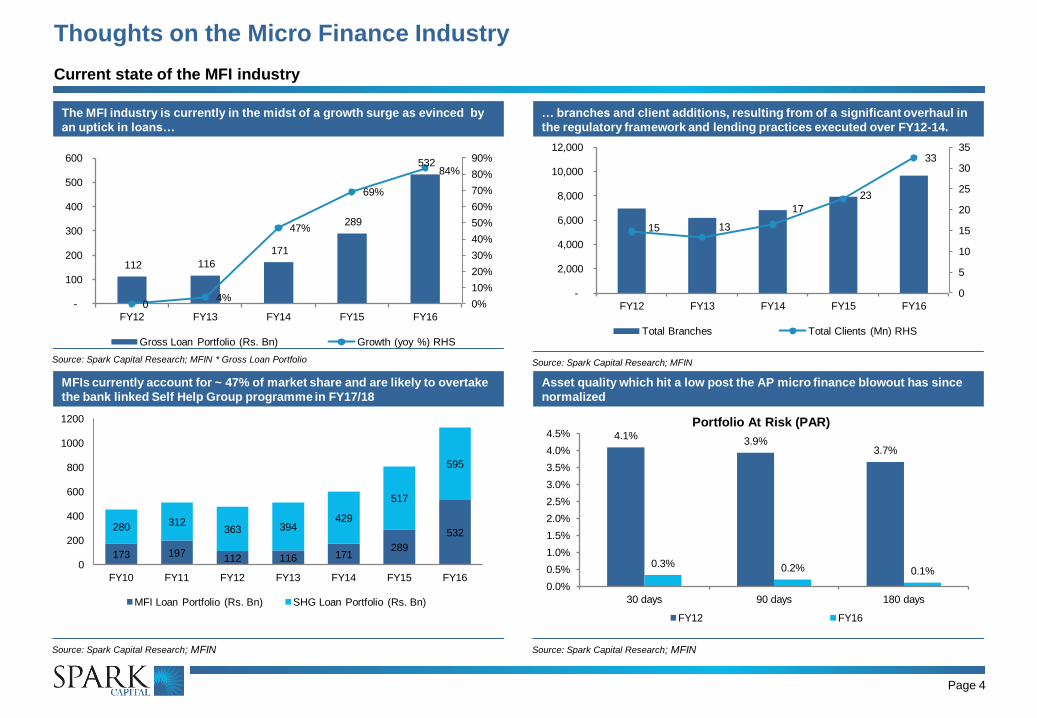
The MFI industry is currently in the midst of a growth surge as evinced by
an uptick in loans…
Source: Spark Capital Research; MFIN * Gross Loan Portfolio
… branches and client additions, resulting from of a significant overhaul in
the regulatory framework and lending practices executed over FY12-14.
Source: Spark Capital Research; MFIN
Page 4
Asset quality which hit a low post the AP micro finance blowout has since
normalized
Source: Spark Capital Research; MFIN
MFIs currently account for ~ 47% of market share and are likely to overtake
the bank linked Self Help Group programme in FY17/18
Source: Spark Capital Research; MFIN
Thoughts on the Micro Finance Industry
Current state of the MFI industry
112 116
171
289
532
0 4%
47%
69%
84%
0%
10%
20%
30%
40%
50%
60%
70%
80%
90%
-
100
200
300
400
500
600
FY12 FY13 FY14 FY15 FY16
Gross Loan Portfolio (Rs. Bn) Growth (yoy %) RHS
15 13
17
23
33
0
5
10
15
20
25
30
35
-
2,000
4,000
6,000
8,000
10,000
12,000
FY12 FY13 FY14 FY15 FY16
Total Branches Total Clients (Mn) RHS
4.1% 3.9%
3.7%
0.3% 0.2% 0.1%
0.0%
0.5%
1.0%
1.5%
2.0%
2.5%
3.0%
3.5%
4.0%
4.5%
30 days 90 days 180 days
Portfolio At Risk (PAR)
FY12 FY16
173 197 112 116 171
289
532 280 312
363 394 429
517
595
0
200
400
600
800
1000
1200
FY10 FY11 FY12 FY13 FY14 FY15 FY16
MFI Loan Portfolio (Rs. Bn) SHG Loan Portfolio (Rs. Bn)
Page 5
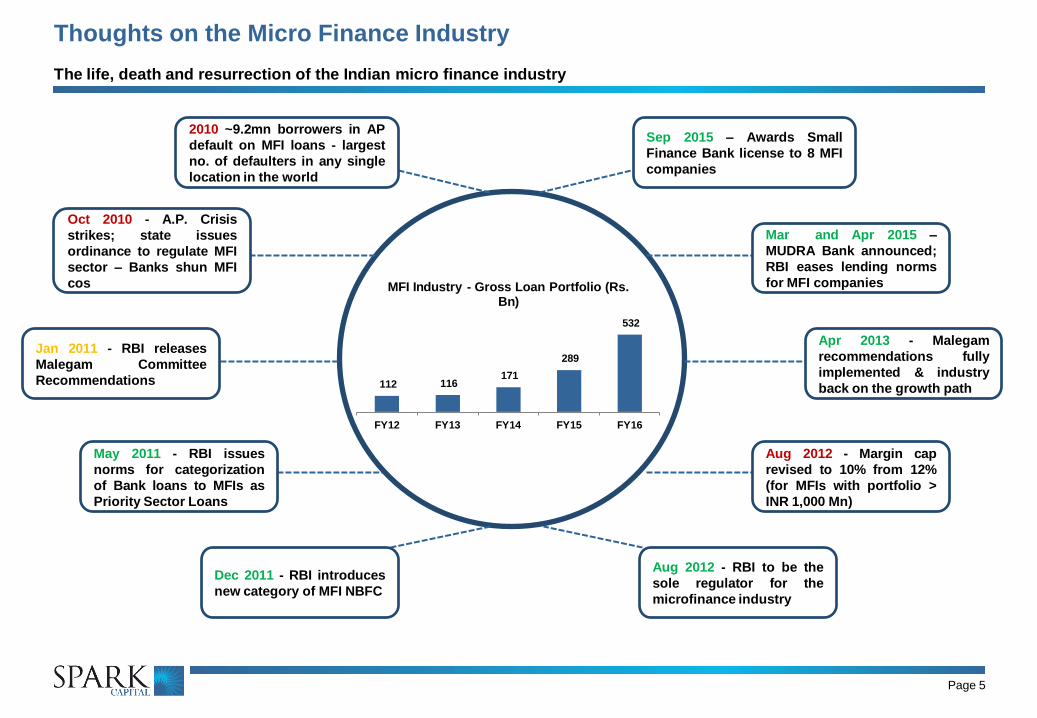
Thoughts on the Micro Finance Industry
The life, death and resurrection of the Indian micro finance industry
2010 ~9.2mn borrowers in AP
default on MFI loans - largest
no. of defaulters in any single
location in the world
Oct 2010 - A.P. Crisis
strikes; state issues
ordinance to regulate MFI
sector – Banks shun MFI
cos
Jan 2011 - RBI releases
Malegam Committee
Recommendations
May 2011 - RBI issues
norms for categorization
of Bank loans to MFIs as
Priority Sector Loans
Dec 2011 - RBI introduces
new category of MFI NBFC
Mar and Apr 2015 –
MUDRA Bank announced;
RBI eases lending norms
for MFI companies
Apr 2013 - Malegam
recommendations fully
implemented & industry
back on the growth path
Aug 2012 - Margin cap
revised to 10% from 12%
(for MFIs with portfolio >
INR 1,000 Mn)
Aug 2012 - RBI to be the
sole regulator for the
microfinance industry
Sep 2015 – Awards Small
Finance Bank license to 8 MFI
companies
112 116 171
289
532
FY12 FY13 FY14 FY15 FY16
MFI Industry - Gross Loan Portfolio (Rs. Bn)
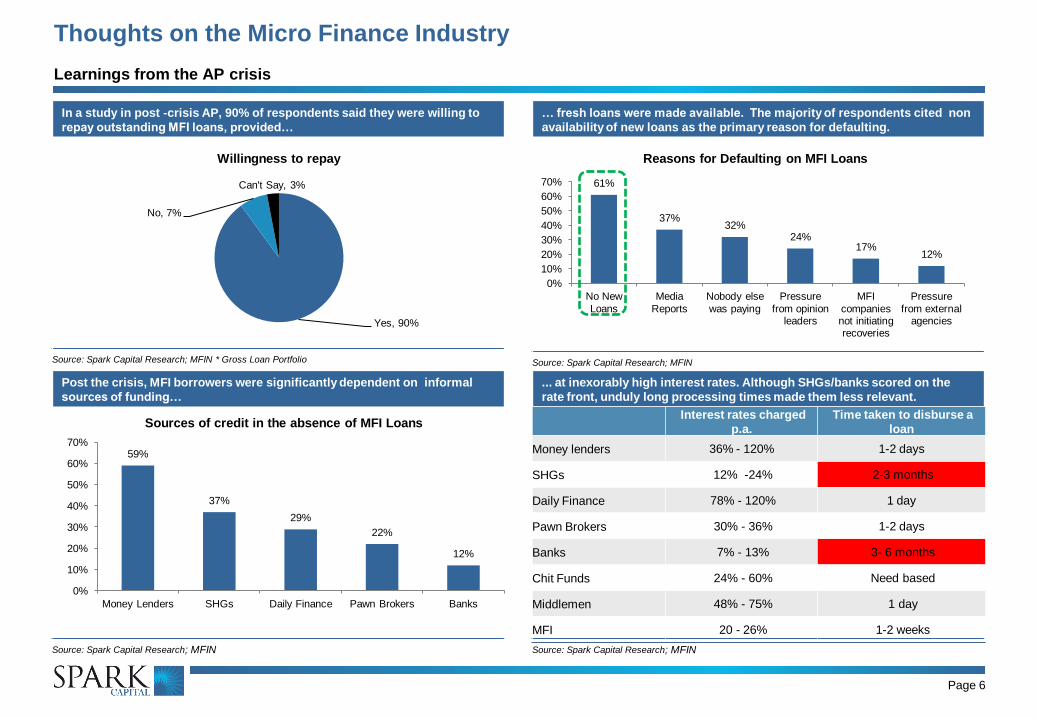
In a study in post -crisis AP, 90% of respondents said they were willing to
repay outstanding MFI loans, provided…
Source: Spark Capital Research; MFIN * Gross Loan Portfolio
… fresh loans were made available. The majority of respondents cited non
availability of new loans as the primary reason for defaulting.
Source: Spark Capital Research; MFIN
Page 6
... at inexorably high interest rates. Although SHGs/banks scored on the
rate front, unduly long processing times made them less relevant.
Source: Spark Capital Research; MFIN
Post the crisis, MFI borrowers were significantly dependent on informal
sources of funding…
Source: Spark Capital Research; MFIN
Thoughts on the Micro Finance Industry
Learnings from the AP crisis
Yes, 90%
No, 7%
Can't Say, 3%
Willingness to repay
61%
37% 32%
24% 17%
12%
0%
10%
20%
30%
40%
50%
60%
70%
No New
Loans
Media
Reports
Nobody else
was paying
Pressure
from opinion leaders
MFI
companies not initiating recoveries
Pressure
from external agencies
Reasons for Defaulting on MFI Loans
59%
37%
29%
22%
12%
0%
10%
20%
30%
40%
50%
60%
70%
Money Lenders SHGs Daily Finance Pawn Brokers Banks
Sources of credit in the absence of MFI Loans
Interest rates charged
p.a.
Time taken to disburse a
loan
Money lenders 36% - 120% 1-2 days
SHGs 12% -24% 2-3 months
Daily Finance 78% - 120% 1 day
Pawn Brokers 30% - 36% 1-2 days
Banks 7% - 13% 3- 6 months
Chit Funds 24% - 60% Need based
Middlemen 48% - 75% 1 day
MFI 20 - 26% 1-2 weeks
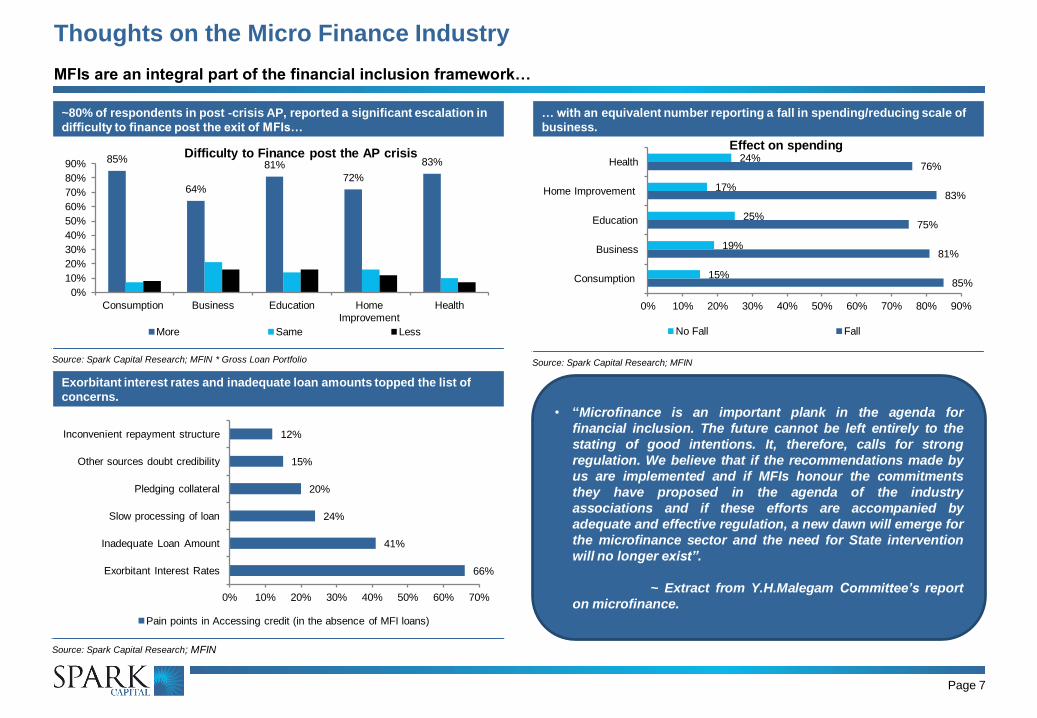
~80% of respondents in post -crisis AP, reported a significant escalation in
difficulty to finance post the exit of MFIs…
Source: Spark Capital Research; MFIN * Gross Loan Portfolio
… with an equivalent number reporting a fall in spending/reducing scale of
business.
Source: Spark Capital Research; MFIN
Page 7
Exorbitant interest rates and inadequate loan amounts topped the list of
concerns.
Source: Spark Capital Research; MFIN
Thoughts on the Micro Finance Industry
MFIs are an integral part of the financial inclusion framework…
85%
64%
81%
72%
83%
0%
10%
20%
30%
40%
50%
60%
70%
80%
90%
Consumption Business Education Home
Improvement
Health
Difficulty to Finance post the AP crisis
More Same Less
66%
41%
24%
20%
15%
12%
0% 10% 20% 30% 40% 50% 60% 70%
Exorbitant Interest Rates
Inadequate Loan Amount
Slow processing of loan
Pledging collateral
Other sources doubt credibility
Inconvenient repayment structure
Pain points in Accessing credit (in the absence of MFI loans)
• “Microfinance is an important plank in the agenda for
financial inclusion. The future cannot be left entirely to the
stating of good intentions. It, therefore, calls for strong
regulation. We believe that if the recommendations made by
us are implemented and if MFIs honour the commitments
they have proposed in the agenda of the industry
associations and if these efforts are accompanied by
adequate and effective regulation, a new dawn will emerge for
the microfinance sector and the need for State intervention
will no longer exist”.
~ Extract from Y.H.Malegam Committee’s report
on microfinance.
85%
81%
75%
83%
76%
15%
19%
25%
17%
24%
0% 10% 20% 30% 40% 50% 60% 70% 80% 90%
Consumption
Business
Education
Home Improvement
Health
Effect on spending
No Fall Fall
13% 15% 21%
60%
90% 120%
0%
20%
40%
60%
80%
100%
120%
Banks SHGs MFIs Pawn Brokers
Money Lenders
Daily Finance Corps
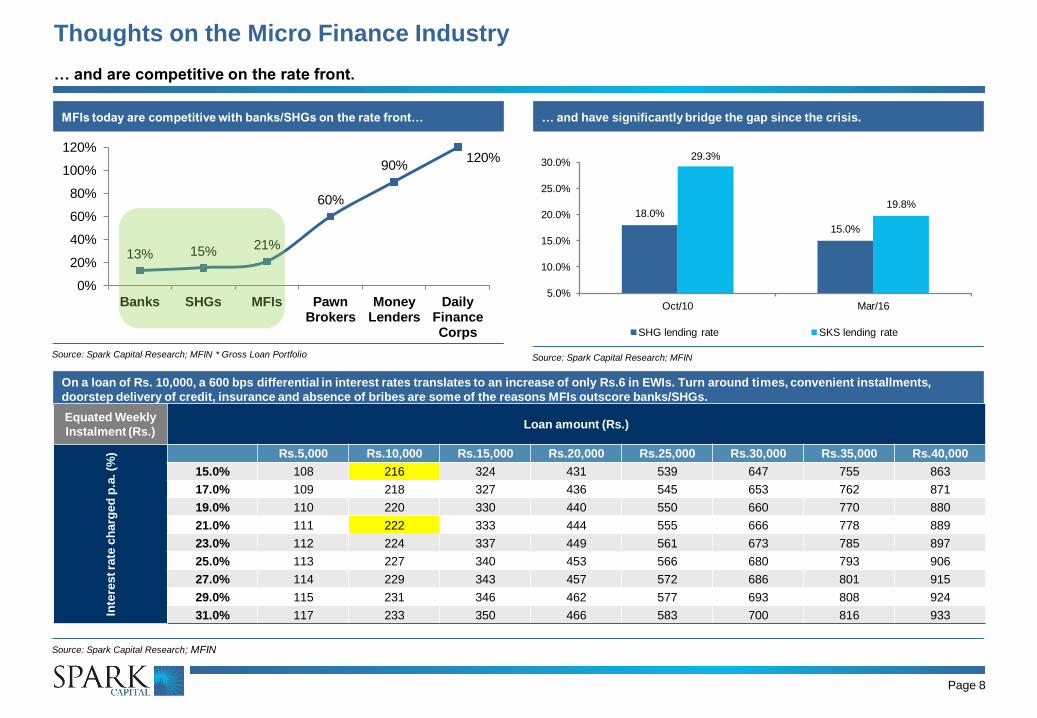
MFIs today are competitive with banks/SHGs on the rate front…
Source: Spark Capital Research; MFIN * Gross Loan Portfolio
… and have significantly bridge the gap since the crisis.
Source: Spark Capital Research; MFIN
Page 8
On a loan of Rs. 10,000, a 600 bps differential in interest rates translates to an increase of only Rs.6 in EWIs. Turn around times, convenient installments,
doorstep delivery of credit, insurance and absence of bribes are some of the reasons MFIs outscore banks/SHGs.
Source: Spark Capital Research; MFIN
Thoughts on the Micro Finance Industry
… and are competitive on the rate front.
18.0%
15.0%
29.3%
19.8%
5.0%
10.0%
15.0%
20.0%
25.0%
30.0%
Oct/10 Mar/16
SHG lending rate SKS lending rate
Equated Weekly
Instalment (Rs.) Loan amount (Rs.)
Inte
rest ra
te c
harg
ed
p.a
. (%
) Rs.5,000 Rs.10,000 Rs.15,000 Rs.20,000 Rs.25,000 Rs.30,000 Rs.35,000 Rs.40,000
15.0% 108 216 324 431 539 647 755 863
17.0% 109 218 327 436 545 653 762 871
19.0% 110 220 330 440 550 660 770 880
21.0% 111 222 333 444 555 666 778 889
23.0% 112 224 337 449 561 673 785 897
25.0% 113 227 340 453 566 680 793 906
27.0% 114 229 343 457 572 686 801 915
29.0% 115 231 346 462 577 693 808 924
31.0% 117 233 350 466 583 700 816 933
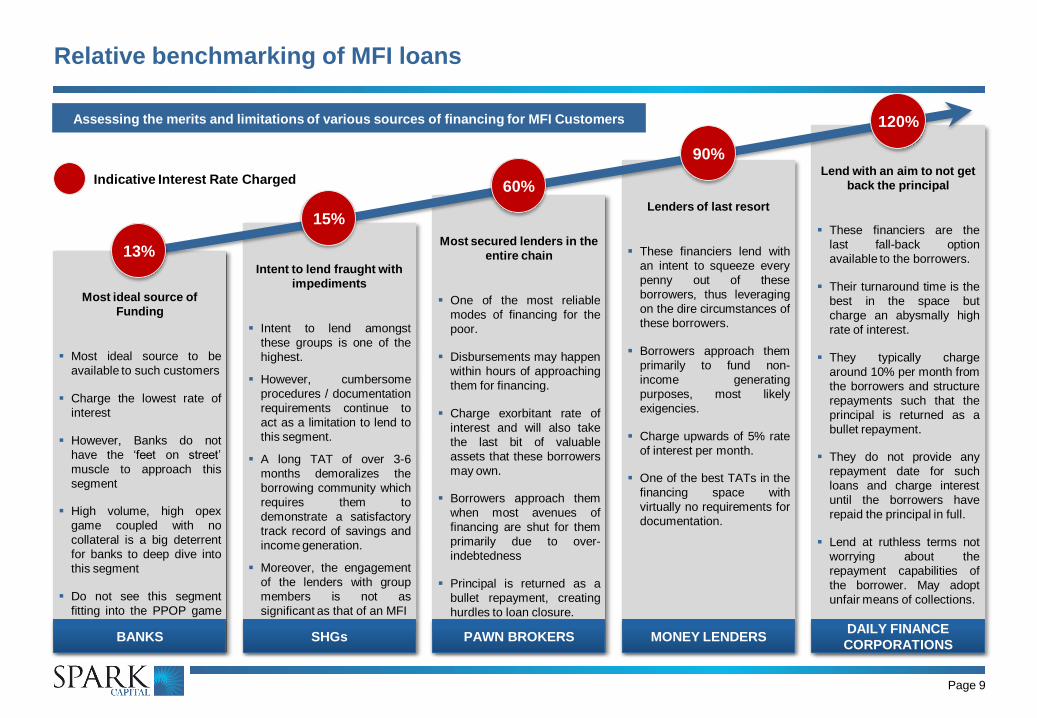
Most ideal source of
Funding
Most ideal source to be
available to such customers
Charge the lowest rate of
interest
However, Banks do not
have the ‘feet on street’
muscle to approach this
segment
High volume, high opex
game coupled with no
collateral is a big deterrent
for banks to deep dive into
this segment
Do not see this segment
fitting into the PPOP game
for banks
Intent to lend fraught with
impediments
Intent to lend amongst
these groups is one of the
highest.
However, cumbersome
procedures / documentation
requirements continue to
act as a limitation to lend to
this segment.
A long TAT of over 3-6
months demoralizes the
borrowing community which
requires them to
demonstrate a satisfactory
track record of savings and
income generation.
Moreover, the engagement
of the lenders with group
members is not as
significant as that of an MFI
Most secured lenders in the
entire chain
One of the most reliable
modes of financing for the
poor.
Disbursements may happen
within hours of approaching
them for financing.
Charge exorbitant rate of
interest and will also take
the last bit of valuable
assets that these borrowers
may own.
Borrowers approach them
when most avenues of
financing are shut for them
primarily due to over-
indebtedness
Principal is returned as a
bullet repayment, creating
hurdles to loan closure.
Lenders of last resort
These financiers lend with
an intent to squeeze every
penny out of these
borrowers, thus leveraging
on the dire circumstances of
these borrowers.
Borrowers approach them
primarily to fund non-
income generating
purposes, most likely
exigencies.
Charge upwards of 5% rate
of interest per month.
One of the best TATs in the
financing space with
virtually no requirements for
documentation.
Lend with an aim to not get
back the principal
These financiers are the
last fall-back option
available to the borrowers.
Their turnaround time is the
best in the space but
charge an abysmally high
rate of interest.
They typically charge
around 10% per month from
the borrowers and structure
repayments such that the
principal is returned as a
bullet repayment.
They do not provide any
repayment date for such
loans and charge interest
until the borrowers have
repaid the principal in full.
Lend at ruthless terms not
worrying about the
repayment capabilities of
the borrower. May adopt
unfair means of collections.
Relative benchmarking of MFI loans
Page 9
15%
60%
90%
120%
13%
BANKS SHGs PAWN BROKERS MONEY LENDERS DAILY FINANCE
CORPORATIONS
Indicative Interest Rate Charged
Assessing the merits and limitations of various sources of financing for MFI Customers
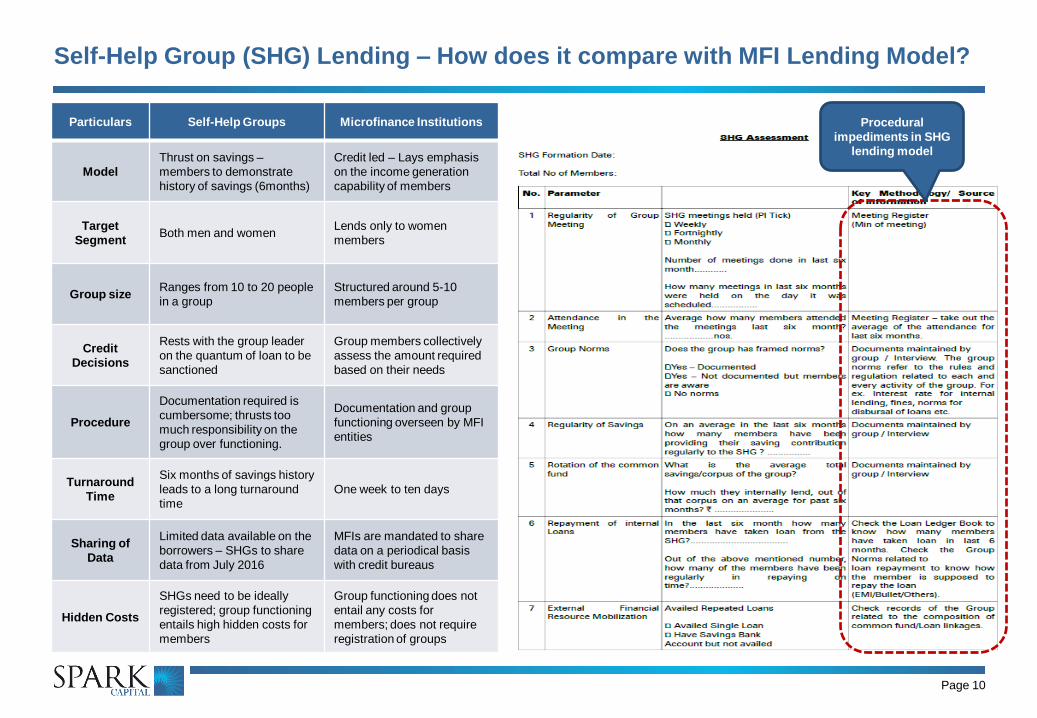
Self-Help Group (SHG) Lending – How does it compare with MFI Lending Model?
Page 10
Particulars Self-Help Groups Microfinance Institutions
Model
Thrust on savings –
members to demonstrate
history of savings (6months)
Credit led – Lays emphasis
on the income generation
capability of members
Target
Segment Both men and women
Lends only to women
members
Group size Ranges from 10 to 20 people
in a group
Structured around 5-10
members per group
Credit
Decisions
Rests with the group leader
on the quantum of loan to be
sanctioned
Group members collectively
assess the amount required
based on their needs
Procedure
Documentation required is
cumbersome; thrusts too
much responsibility on the
group over functioning.
Documentation and group
functioning overseen by MFI
entities
Turnaround
Time
Six months of savings history
leads to a long turnaround
time
One week to ten days
Sharing of
Data
Limited data available on the
borrowers – SHGs to share
data from July 2016
MFIs are mandated to share
data on a periodical basis
with credit bureaus
Hidden Costs
SHGs need to be ideally
registered; group functioning
entails high hidden costs for
members
Group functioning does not
entail any costs for
members; does not require
registration of groups
Procedural
impediments in SHG
lending model
SHG NPAs have remained traditionally higher than MFI industry’s
Source: Spark Capital Research; MFIN * Gross Loan Portfolio
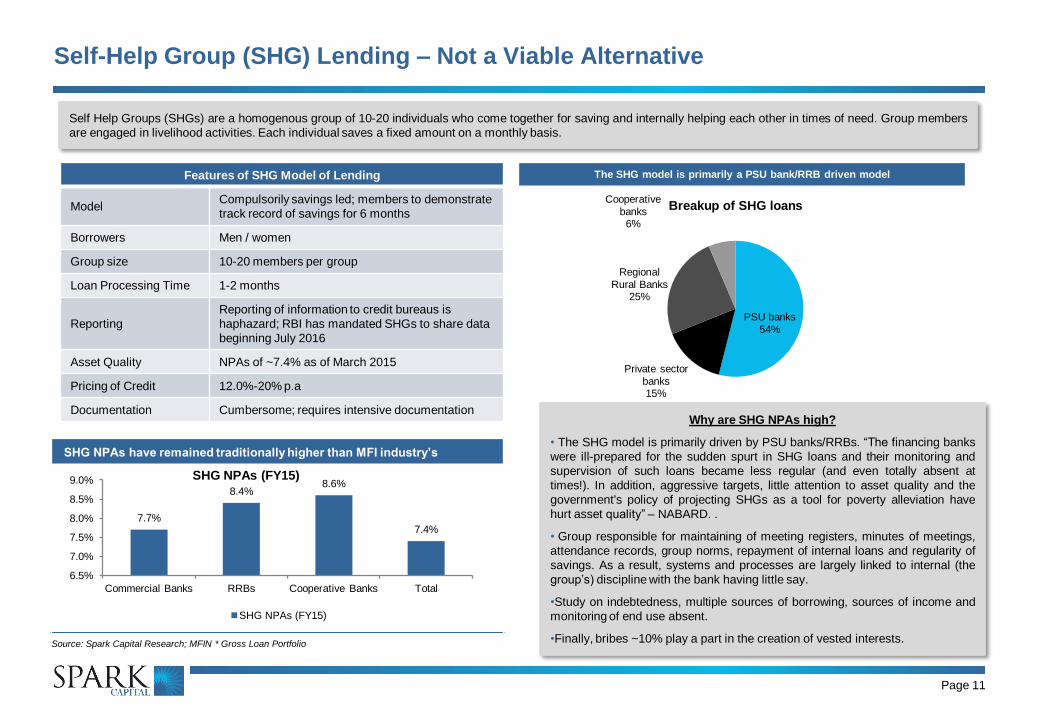
Self-Help Group (SHG) Lending – Not a Viable Alternative
Page 11
Self Help Groups (SHGs) are a homogenous group of 10-20 individuals who come together for saving and internally helping each other in times of need. Group members
are engaged in livelihood activities. Each individual saves a fixed amount on a monthly basis.
Features of SHG Model of Lending
Model Compulsorily savings led; members to demonstrate
track record of savings for 6 months
Borrowers Men / women
Group size 10-20 members per group
Loan Processing Time 1-2 months
Reporting
Reporting of information to credit bureaus is
haphazard; RBI has mandated SHGs to share data
beginning July 2016
Asset Quality NPAs of ~7.4% as of March 2015
Pricing of Credit 12.0%-20% p.a
Documentation Cumbersome; requires intensive documentation
The SHG model is primarily a PSU bank/RRB driven model
Why are SHG NPAs high?
• The SHG model is primarily driven by PSU banks/RRBs. “The financing banks
were ill-prepared for the sudden spurt in SHG loans and their monitoring and
supervision of such loans became less regular (and even totally absent at
times!). In addition, aggressive targets, little attention to asset quality and the
government's policy of projecting SHGs as a tool for poverty alleviation have
hurt asset quality” – NABARD. .
• Group responsible for maintaining of meeting registers, minutes of meetings,
attendance records, group norms, repayment of internal loans and regularity of
savings. As a result, systems and processes are largely linked to internal (the
group’s) discipline with the bank having little say.
•Study on indebtedness, multiple sources of borrowing, sources of income and
monitoring of end use absent.
•Finally, bribes ~10% play a part in the creation of vested interests.
PSU banks
54%
Private sector
banks 15%
Regional
Rural Banks 25%
Cooperative
banks 6%
Breakup of SHG loans
7.7%
8.4% 8.6%
7.4%
6.5%
7.0%
7.5%
8.0%
8.5%
9.0%
Commercial Banks RRBs Cooperative Banks Total
SHG NPAs (FY15)
SHG NPAs (FY15)
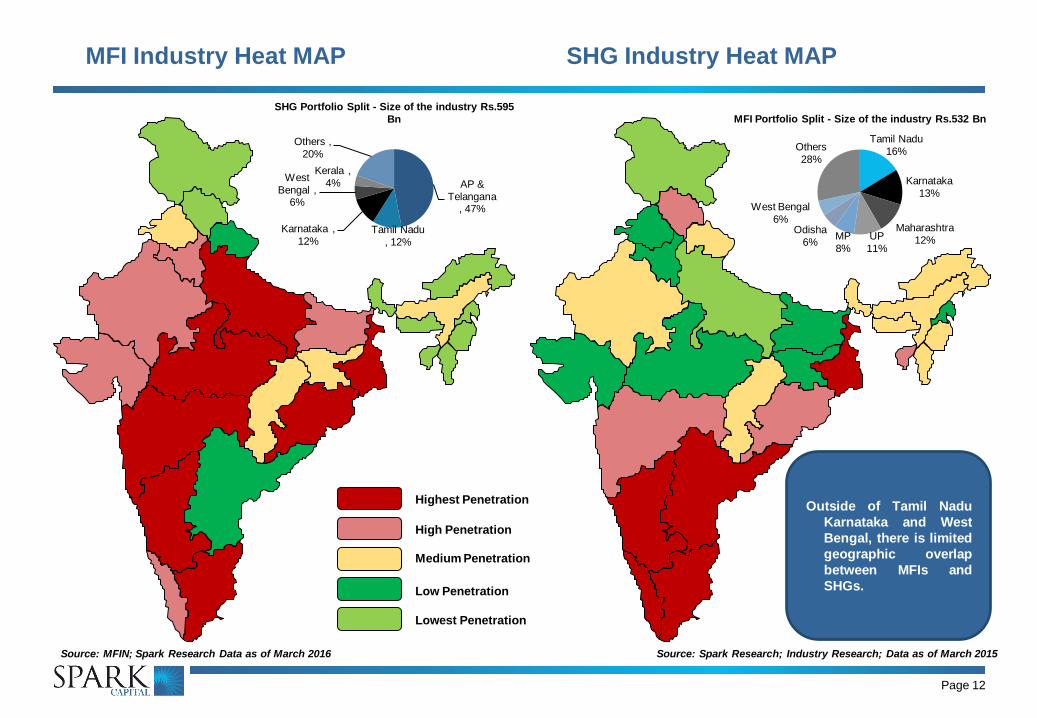
MFI Industry Heat MAP
Page 12
SHG Industry Heat MAP
Highest Penetration
High Penetration
Medium Penetration
Low Penetration
Lowest Penetration
Source: MFIN; Spark Research Data as of March 2016 Source: Spark Research; Industry Research; Data as of March 2015
AP &
Telangana , 47%
Tamil Nadu
, 12%
Karnataka ,
12%
West
Bengal , 6%
Kerala ,
4%
Others ,
20%
SHG Portfolio Split - Size of the industry Rs.595
Bn
Tamil Nadu
16%
Karnataka
13%
Maharashtra
12% UP
11%
MP
8%
Odisha
6%
West Bengal
6%
Others
28%
MFI Portfolio Split - Size of the industry Rs.532 Bn
Outside of Tamil Nadu
Karnataka and West
Bengal, there is limited
geographic overlap
between MFIs and
SHGs.
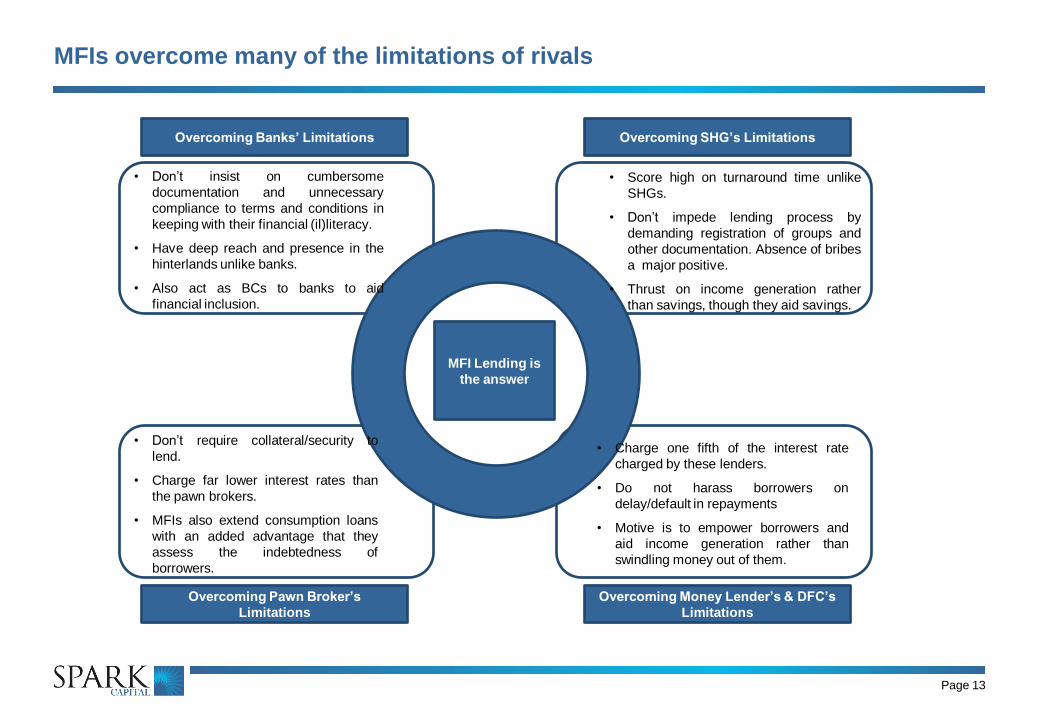
MFIs overcome many of the limitations of rivals
Page 13
Overcoming Banks’ Limitations
MFI Lending is
the answer
Overcoming SHG’s Limitations
Overcoming Pawn Broker’s
Limitations
Overcoming Money Lender’s & DFC’s
Limitations
• Don’t insist on cumbersome
documentation and unnecessary
compliance to terms and conditions in
keeping with their financial (il)literacy.
• Have deep reach and presence in the
hinterlands unlike banks.
• Also act as BCs to banks to aid
financial inclusion.
• Score high on turnaround time unlike
SHGs.
• Don’t impede lending process by
demanding registration of groups and
other documentation. Absence of bribes
a major positive.
• Thrust on income generation rather
than savings, though they aid savings.
• Don’t require collateral/security to
lend.
• Charge far lower interest rates than
the pawn brokers.
• MFIs also extend consumption loans
with an added advantage that they
assess the indebtedness of
borrowers.
• Charge one fifth of the interest rate
charged by these lenders.
• Do not harass borrowers on
delay/default in repayments
• Motive is to empower borrowers and
aid income generation rather than
swindling money out of them.
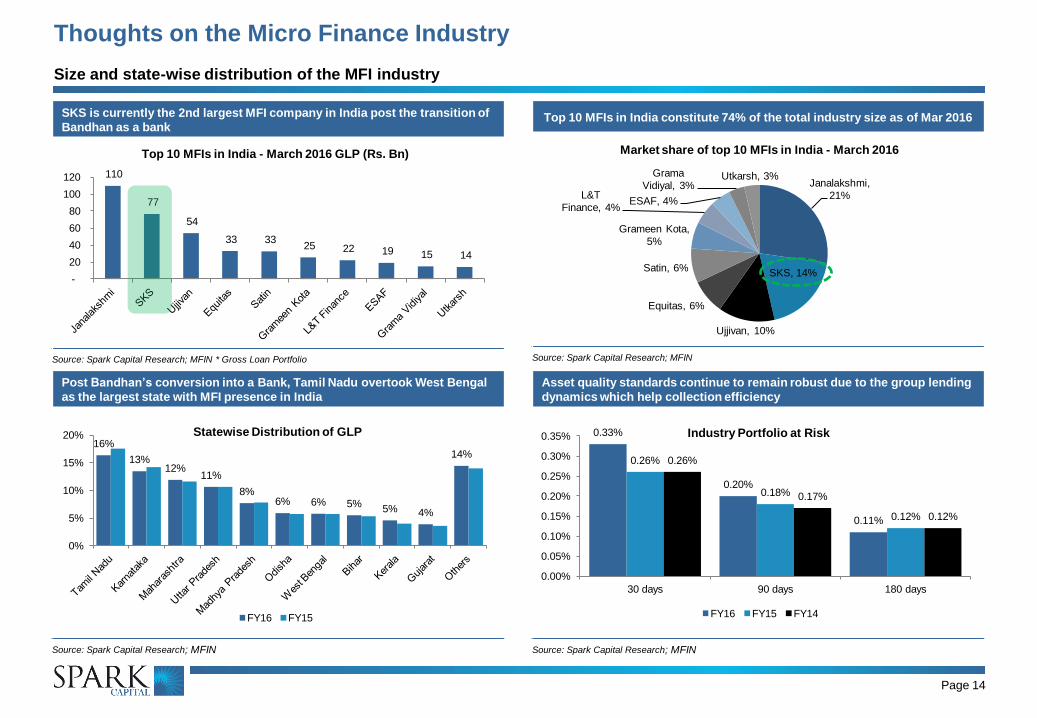
SKS is currently the 2nd largest MFI company in India post the transition of
Bandhan as a bank
Source: Spark Capital Research; MFIN * Gross Loan Portfolio
Top 10 MFIs in India constitute 74% of the total industry size as of Mar 2016
Source: Spark Capital Research; MFIN
Janalakshmi,
21%
SKS, 14%
Ujjivan, 10%
Equitas, 6%
Satin, 6%
Grameen Kota,
5%
L&T
Finance, 4% ESAF, 4%
Grama
Vidiyal, 3% Utkarsh, 3%
Market share of top 10 MFIs in India - March 2016
110
77
54
33 33 25 22 19 15 14
-
20
40
60
80
100
120
Top 10 MFIs in India - March 2016 GLP (Rs. Bn)
Page 14
Asset quality standards continue to remain robust due to the group lending
dynamics which help collection efficiency
Source: Spark Capital Research; MFIN
Post Bandhan’s conversion into a Bank, Tamil Nadu overtook West Bengal
as the largest state with MFI presence in India
Source: Spark Capital Research; MFIN
Thoughts on the Micro Finance Industry
Size and state-wise distribution of the MFI industry
16%
13% 12%
11%
8% 6% 6% 5%
5% 4%
14%
0%
5%
10%
15%
20% Statewise Distribution of GLP
FY16 FY15
0.33%
0.20%
0.11%
0.26%
0.18%
0.12%
0.26%
0.17%
0.12%
0.00%
0.05%
0.10%
0.15%
0.20%
0.25%
0.30%
0.35%
30 days 90 days 180 days
Industry Portfolio at Risk
FY16 FY15 FY14
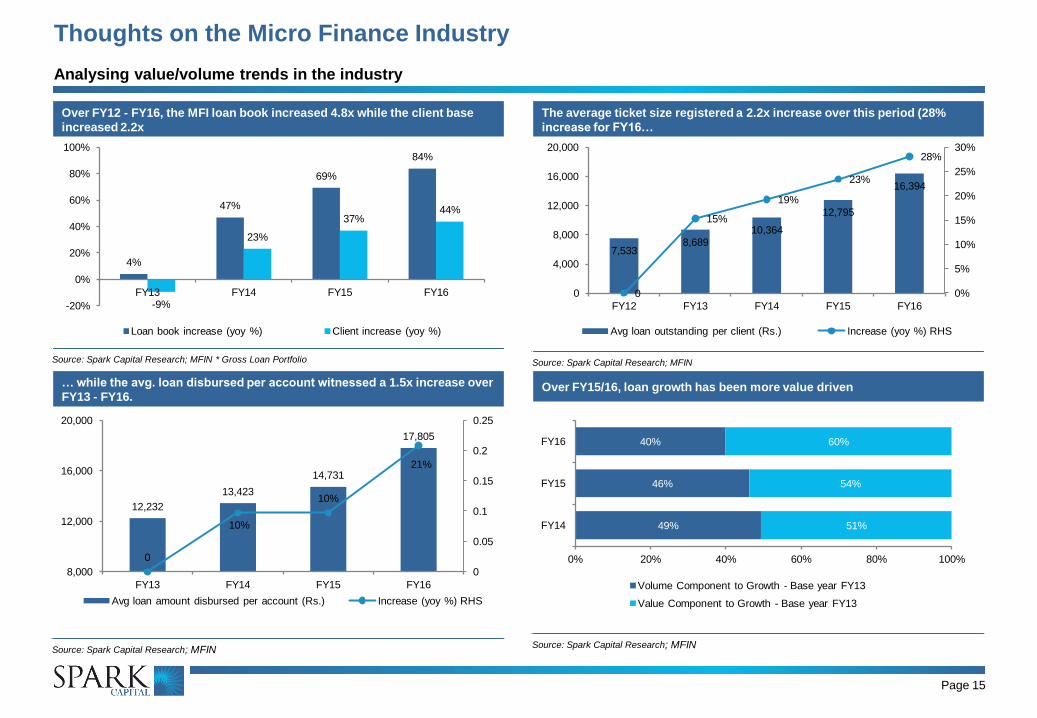
Over FY12 - FY16, the MFI loan book increased 4.8x while the client base
increased 2.2x
Source: Spark Capital Research; MFIN * Gross Loan Portfolio
The average ticket size registered a 2.2x increase over this period (28%
increase for FY16…
Source: Spark Capital Research; MFIN
Page 15
Over FY15/16, loan growth has been more value driven
Source: Spark Capital Research; MFIN
… while the avg. loan disbursed per account witnessed a 1.5x increase over
FY13 - FY16.
Source: Spark Capital Research; MFIN
Thoughts on the Micro Finance Industry
Analysing value/volume trends in the industry
4%
47%
69%
84%
-9%
23%
37% 44%
-20%
0%
20%
40%
60%
80%
100%
FY13 FY14 FY15 FY16
Loan book increase (yoy %) Client increase (yoy %)
7,533 8,689
10,364
12,795
16,394
0
15%
19%
23%
28%
0%
5%
10%
15%
20%
25%
30%
0
4,000
8,000
12,000
16,000
20,000
FY12 FY13 FY14 FY15 FY16
Avg loan outstanding per client (Rs.) Increase (yoy %) RHS
49%
46%
40%
51%
54%
60%
0% 20% 40% 60% 80% 100%
FY14
FY15
FY16
Volume Component to Growth - Base year FY13
Value Component to Growth - Base year FY13
12,232
13,423
14,731
17,805
0
10%
10%
21%
0
0.05
0.1
0.15
0.2
0.25
8,000
12,000
16,000
20,000
FY13 FY14 FY15 FY16
Avg loan amount disbursed per account (Rs.) Increase (yoy %) RHS
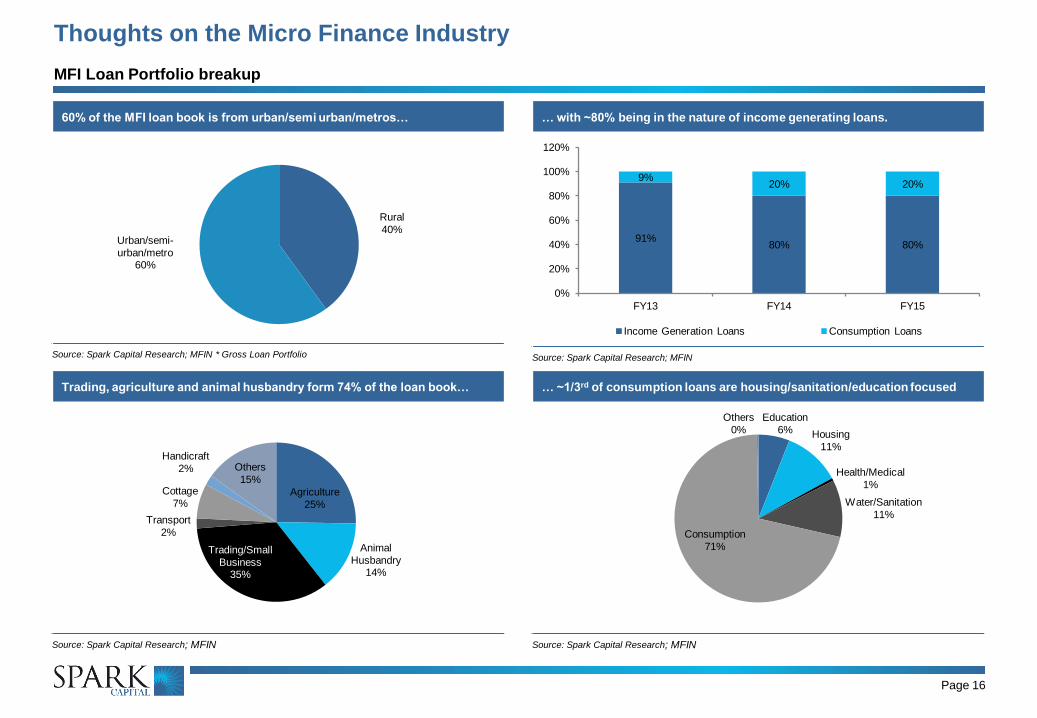
60% of the MFI loan book is from urban/semi urban/metros…
Source: Spark Capital Research; MFIN * Gross Loan Portfolio
… with ~80% being in the nature of income generating loans.
Source: Spark Capital Research; MFIN
Page 16
… ~1/3rd of consumption loans are housing/sanitation/education focused
Source: Spark Capital Research; MFIN
Trading, agriculture and animal husbandry form 74% of the loan book…
Source: Spark Capital Research; MFIN
Thoughts on the Micro Finance Industry
MFI Loan Portfolio breakup
Rural
40% Urban/semi-
urban/metro 60%
Agriculture
25%
Animal
Husbandry 14%
Trading/Small
Business 35%
Transport
2%
Cottage
7%
Handicraft
2% Others
15%
Education
6% Housing
11%
Health/Medical
1%
Water/Sanitation
11%
Consumption
71%
Others
0%
91% 80% 80%
9% 20% 20%
0%
20%
40%
60%
80%
100%
120%
FY13 FY14 FY15
Income Generation Loans Consumption Loans

Assessing the Market Opportunity – On Lending to Indian Households (1)
Page 17
• To calculate the existing penetration of MFI
sector in the Indian households, it has been
assumed that there is only one MFI
borrower per household.
• With distribution of household income in
India being unduly skewed, it creates a huge
opportunity for the MFI players to tap into
the available opportunity.
• As the graph below indicates, the top
quintile of the households in India have 59%
of the total wealth (or household income).
• This creates a huge opportunity to cater to
the remaining 80% of the households in
India with various wealth related services.
States
No. Of
Households (in
mns)
Existing no. of
MFI clients (in
mns)
Existing
Penetration (on
households)
Avg. Household
Income (Rs. p.a)
Andaman & Nicobar Islands 0.1 - 0.0% 545,736
Andhra Pradesh 21.0 0.1 0.5% 449,023
Arunachal Pradesh 0.3 - 0.0% 456,177
Assam 6.4 0.5 8.4% 250,444
Bihar 18.9 1.9 10.2% 173,101
Chandigarh 0.2 - 0.0% 872,813
Chhattisgarh 5.6 0.6 10.4% 342,535
Dadra & Nagar Haveli 0.1 - 0.0% NA
Daman & Diu 0.1 - 0.0% NA
Delhi 3.3 0.6 16.6% 1,106,857
Goa 0.3 - 0.0% 1,291,608
Gujarat 12.2 1.2 10.1% 634,598
Haryana 4.7 0.5 10.4% 711,582
Himachal Pradesh 1.5 - 0.0% 572,394
Jammu & Kashmir 2.0 - 0.0% 316,186
Jharkhand 6.2 0.6 9.2% 263,193
Karnataka 13.2 3.8 29.0% 501,848
Kerala 7.7 1.2 15.8% 545,736
Lakshadweep 0.0 - 0.0% NA
Madhya Pradesh 15.0 2.8 18.7% 293,018
Maharashtra 23.8 3.7 15.6% 628,575
Manipur 0.5 - 0.0% 230,300
Meghalaya 0.5 - 0.0% 343,947
Mizoram 0.2 - 0.0% 451,508
Nagaland 0.4 - 0.0% 409,617
Orissa 9.7 2.1 22.1% 311,270
Pondicherry 0.3 0.1 40.5% 834,718
Punjab 5.4 0.6 10.4% 498,005
Rajasthan 12.6 0.8 6.0% 353,193
Sikkim 0.1 - 0.0% 1,007,015
Tamil Nadu 18.5 5.7 30.6% 623,901
Tripura 0.8 - 0.0% 369,839
Uttar Pradesh 32.9 3.1 9.5% 201,418
Uttrakhand 2.0 0.3 16.6% 584,430
West Bengal 20.1 2.2 10.9% 381,411
All India 246.7 32.4 13.2% 432,536
7% 7% 6% 6% 13% 10% 9% 8%
18% 14% 13% 10%
25% 21%
19% 17%
37% 48% 53% 59%
1993-94 2004-05 2009-10 2014-15E
Distribution of Household Income in India - Quintile Data - % of total income
Q1 (Bottom) Q2 Q3 Q4 Q5 (Top)
Source: Spark Capital Research; NCAER - CMCR
Assessing the Market Opportunity – On Lending to Indian Households (2)
Page 18
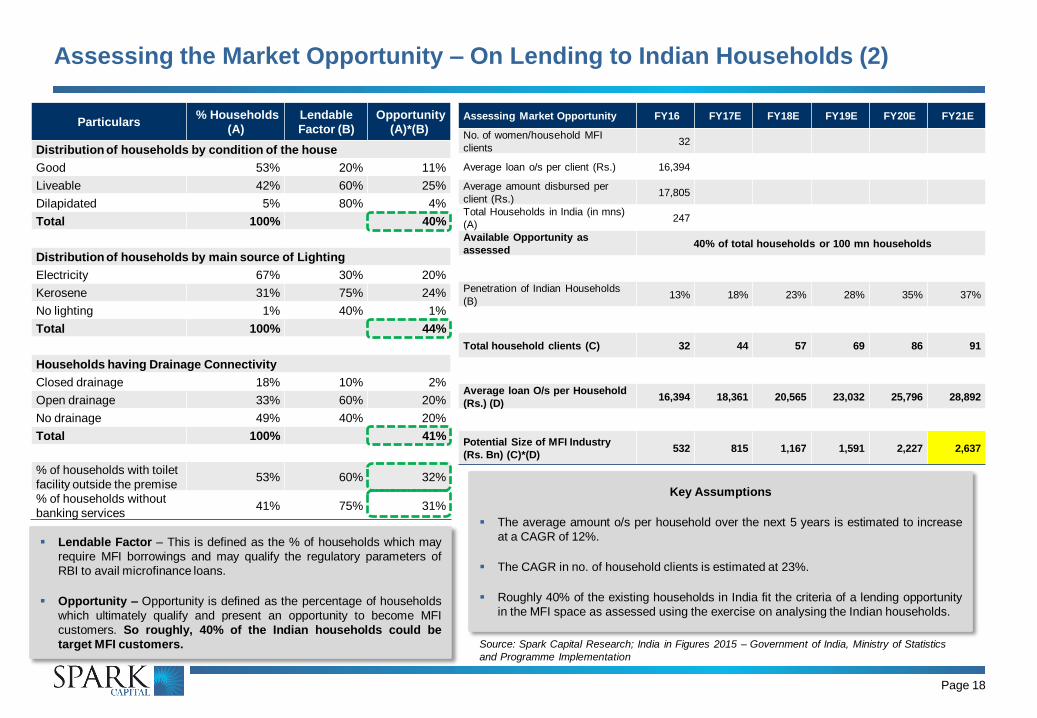
Particulars % Households
(A)
Lendable
Factor (B)
Opportunity
(A)*(B)
Distribution of households by condition of the house
Good 53% 20% 11%
Liveable 42% 60% 25%
Dilapidated 5% 80% 4%
Total 100% 40%
Distribution of households by main source of Lighting
Electricity 67% 30% 20%
Kerosene 31% 75% 24%
No lighting 1% 40% 1%
Total 100% 44%
Households having Drainage Connectivity
Closed drainage 18% 10% 2%
Open drainage 33% 60% 20%
No drainage 49% 40% 20%
Total 100% 41%
% of households with toilet
facility outside the premise 53% 60% 32%
% of households without
banking services 41% 75% 31%
Lendable Factor – This is defined as the % of households which may
require MFI borrowings and may qualify the regulatory parameters of
RBI to avail microfinance loans.
Opportunity – Opportunity is defined as the percentage of households
which ultimately qualify and present an opportunity to become MFI
customers. So roughly, 40% of the Indian households could be
target MFI customers.
Assessing Market Opportunity FY16 FY17E FY18E FY19E FY20E FY21E
No. of women/household MFI
clients 32
Average loan o/s per client (Rs.) 16,394
Average amount disbursed per
client (Rs.) 17,805
Total Households in India (in mns)
(A) 247
Available Opportunity as
assessed 40% of total households or 100 mn households
Penetration of Indian Households
(B) 13% 18% 23% 28% 35% 37%
Total household clients (C) 32 44 57 69 86 91
Average loan O/s per Household
(Rs.) (D) 16,394 18,361 20,565 23,032 25,796 28,892
Potential Size of MFI Industry
(Rs. Bn) (C)*(D) 532 815 1,167 1,591 2,227 2,637
Key Assumptions
The average amount o/s per household over the next 5 years is estimated to increase
at a CAGR of 12%.
The CAGR in no. of household clients is estimated at 23%.
Roughly 40% of the existing households in India fit the criteria of a lending opportunity
in the MFI space as assessed using the exercise on analysing the Indian households.
Source: Spark Capital Research; India in Figures 2015 – Government of India, Ministry of Statistics
and Programme Implementation
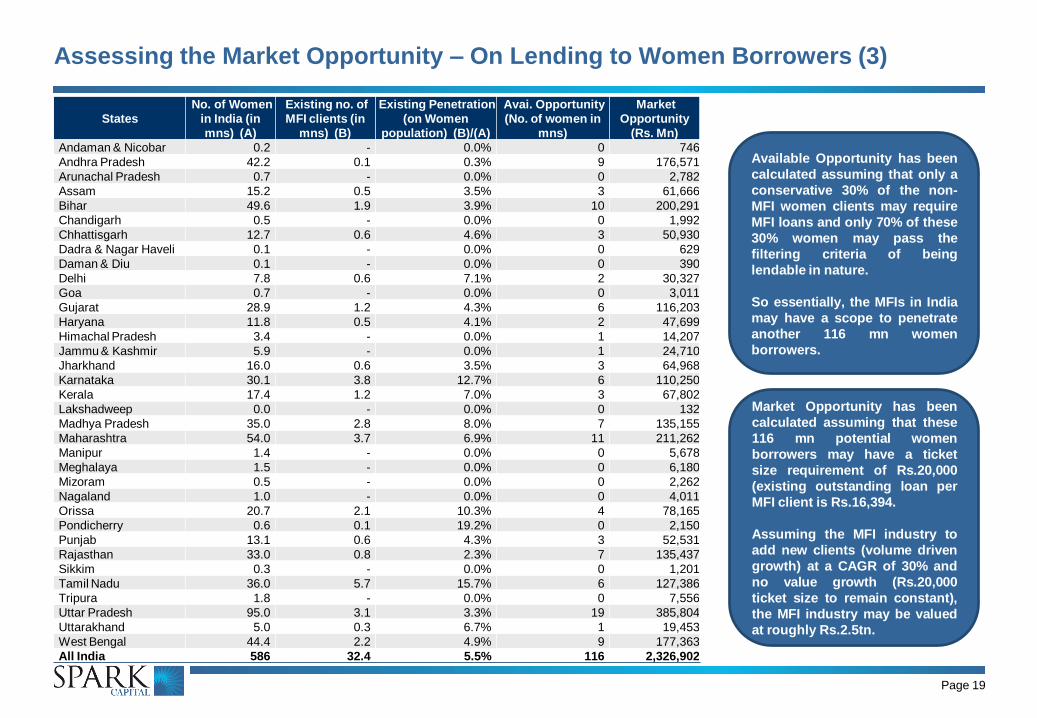
Assessing the Market Opportunity – On Lending to Women Borrowers (3)
Page 19
States
No. of Women
in India (in
mns) (A)
Existing no. of
MFI clients (in
mns) (B)
Existing Penetration
(on Women
population) (B)/(A)
Avai. Opportunity
(No. of women in
mns)
Market
Opportunity
(Rs. Mn)
Andaman & Nicobar 0.2 - 0.0% 0 746
Andhra Pradesh 42.2 0.1 0.3% 9 176,571
Arunachal Pradesh 0.7 - 0.0% 0 2,782
Assam 15.2 0.5 3.5% 3 61,666
Bihar 49.6 1.9 3.9% 10 200,291
Chandigarh 0.5 - 0.0% 0 1,992
Chhattisgarh 12.7 0.6 4.6% 3 50,930
Dadra & Nagar Haveli 0.1 - 0.0% 0 629
Daman & Diu 0.1 - 0.0% 0 390
Delhi 7.8 0.6 7.1% 2 30,327
Goa 0.7 - 0.0% 0 3,011
Gujarat 28.9 1.2 4.3% 6 116,203
Haryana 11.8 0.5 4.1% 2 47,699
Himachal Pradesh 3.4 - 0.0% 1 14,207
Jammu & Kashmir 5.9 - 0.0% 1 24,710
Jharkhand 16.0 0.6 3.5% 3 64,968
Karnataka 30.1 3.8 12.7% 6 110,250
Kerala 17.4 1.2 7.0% 3 67,802
Lakshadweep 0.0 - 0.0% 0 132
Madhya Pradesh 35.0 2.8 8.0% 7 135,155
Maharashtra 54.0 3.7 6.9% 11 211,262
Manipur 1.4 - 0.0% 0 5,678
Meghalaya 1.5 - 0.0% 0 6,180
Mizoram 0.5 - 0.0% 0 2,262
Nagaland 1.0 - 0.0% 0 4,011
Orissa 20.7 2.1 10.3% 4 78,165
Pondicherry 0.6 0.1 19.2% 0 2,150
Punjab 13.1 0.6 4.3% 3 52,531
Rajasthan 33.0 0.8 2.3% 7 135,437
Sikkim 0.3 - 0.0% 0 1,201
Tamil Nadu 36.0 5.7 15.7% 6 127,386
Tripura 1.8 - 0.0% 0 7,556
Uttar Pradesh 95.0 3.1 3.3% 19 385,804
Uttarakhand 5.0 0.3 6.7% 1 19,453
West Bengal 44.4 2.2 4.9% 9 177,363
All India 586 32.4 5.5% 116 2,326,902
Available Opportunity has been
calculated assuming that only a
conservative 30% of the non-
MFI women clients may require
MFI loans and only 70% of these
30% women may pass the
filtering criteria of being
lendable in nature.
So essentially, the MFIs in India
may have a scope to penetrate
another 116 mn women
borrowers.
Market Opportunity has been
calculated assuming that these
116 mn potential women
borrowers may have a ticket
size requirement of Rs.20,000
(existing outstanding loan per
MFI client is Rs.16,394.
Assuming the MFI industry to
add new clients (volume driven
growth) at a CAGR of 30% and
no value growth (Rs.20,000
ticket size to remain constant),
the MFI industry may be valued
at roughly Rs.2.5tn.
Page 20
Assessing the Market Opportunity – On Lending to Women Borrowers (4)
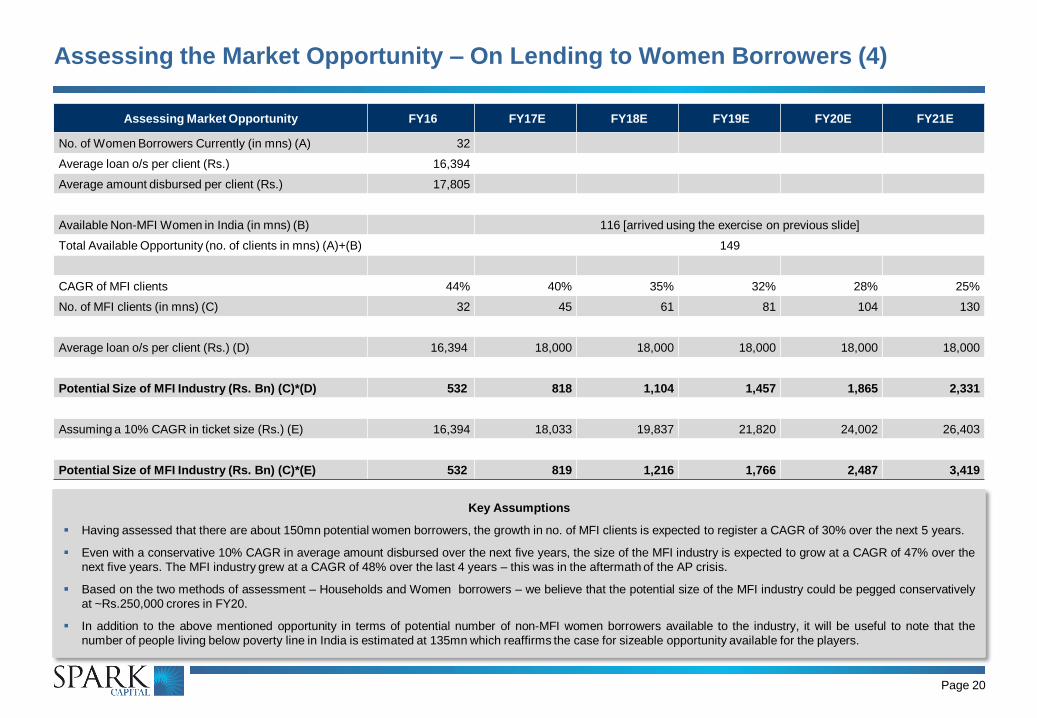
Assessing Market Opportunity FY16 FY17E FY18E FY19E FY20E FY21E
No. of Women Borrowers Currently (in mns) (A) 32
Average loan o/s per client (Rs.) 16,394
Average amount disbursed per client (Rs.) 17,805
Available Non-MFI Women in India (in mns) (B) 116 [arrived using the exercise on previous slide]
Total Available Opportunity (no. of clients in mns) (A)+(B) 149
CAGR of MFI clients 44% 40% 35% 32% 28% 25%
No. of MFI clients (in mns) (C) 32 45 61 81 104 130
Average loan o/s per client (Rs.) (D) 16,394 18,000 18,000 18,000 18,000 18,000
Potential Size of MFI Industry (Rs. Bn) (C)*(D) 532 818 1,104 1,457 1,865 2,331
Assuming a 10% CAGR in ticket size (Rs.) (E) 16,394 18,033 19,837 21,820 24,002 26,403
Potential Size of MFI Industry (Rs. Bn) (C)*(E) 532 819 1,216 1,766 2,487 3,419
Key Assumptions
Having assessed that there are about 150mn potential women borrowers, the growth in no. of MFI clients is expected to register a CAGR of 30% over the next 5 years.
Even with a conservative 10% CAGR in average amount disbursed over the next five years, the size of the MFI industry is expected to grow at a CAGR of 47% over the
next five years. The MFI industry grew at a CAGR of 48% over the last 4 years – this was in the aftermath of the AP crisis.
Based on the two methods of assessment – Households and Women borrowers – we believe that the potential size of the MFI industry could be pegged conservatively
at ~Rs.250,000 crores in FY20.
In addition to the above mentioned opportunity in terms of potential number of non-MFI women borrowers available to the industry, it will be useful to note that the
number of people living below poverty line in India is estimated at 135mn which reaffirms the case for sizeable opportunity available for the players.
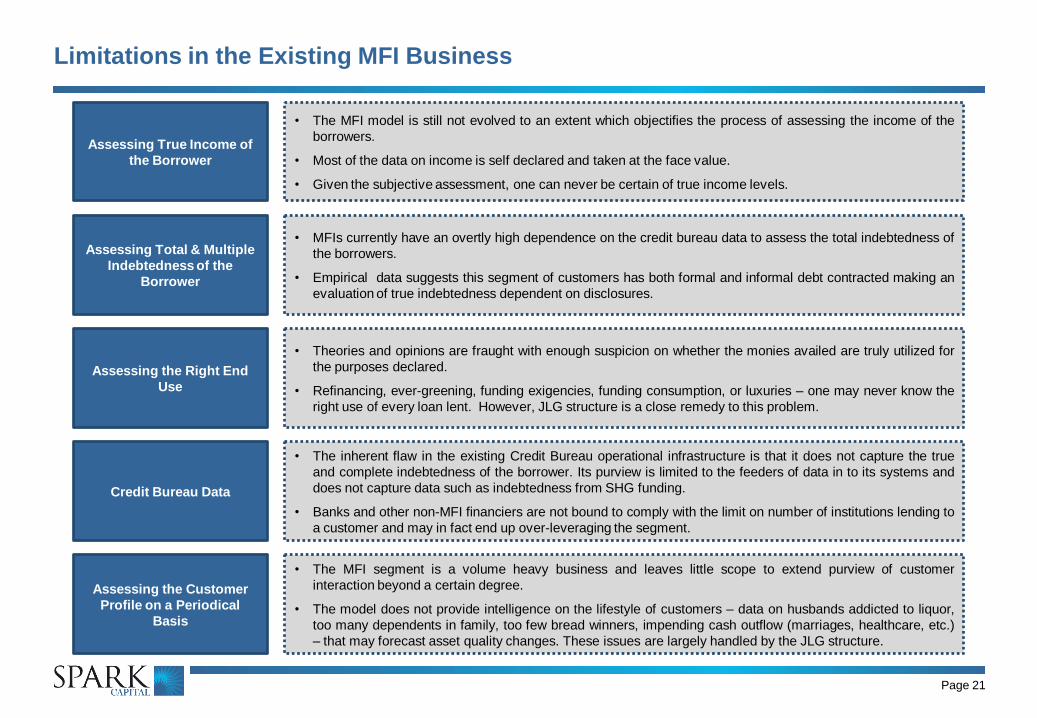
Limitations in the Existing MFI Business
Page 21
Assessing True Income of
the Borrower
Assessing Total & Multiple
Indebtedness of the
Borrower
Assessing the Right End
Use
Credit Bureau Data
• The MFI model is still not evolved to an extent which objectifies the process of assessing the income of the
borrowers.
• Most of the data on income is self declared and taken at the face value.
• Given the subjective assessment, one can never be certain of true income levels.
• MFIs currently have an overtly high dependence on the credit bureau data to assess the total indebtedness of
the borrowers.
• Empirical data suggests this segment of customers has both formal and informal debt contracted making an
evaluation of true indebtedness dependent on disclosures.
• Theories and opinions are fraught with enough suspicion on whether the monies availed are truly utilized for
the purposes declared.
• Refinancing, ever-greening, funding exigencies, funding consumption, or luxuries – one may never know the
right use of every loan lent. However, JLG structure is a close remedy to this problem.
• The inherent flaw in the existing Credit Bureau operational infrastructure is that it does not capture the true
and complete indebtedness of the borrower. Its purview is limited to the feeders of data in to its systems and
does not capture data such as indebtedness from SHG funding.
• Banks and other non-MFI financiers are not bound to comply with the limit on number of institutions lending to
a customer and may in fact end up over-leveraging the segment.
Assessing the Customer
Profile on a Periodical
Basis
• The MFI segment is a volume heavy business and leaves little scope to extend purview of customer
interaction beyond a certain degree.
• The model does not provide intelligence on the lifestyle of customers – data on husbands addicted to liquor,
too many dependents in family, too few bread winners, impending cash outflow (marriages, healthcare, etc.)
– that may forecast asset quality changes. These issues are largely handled by the JLG structure.
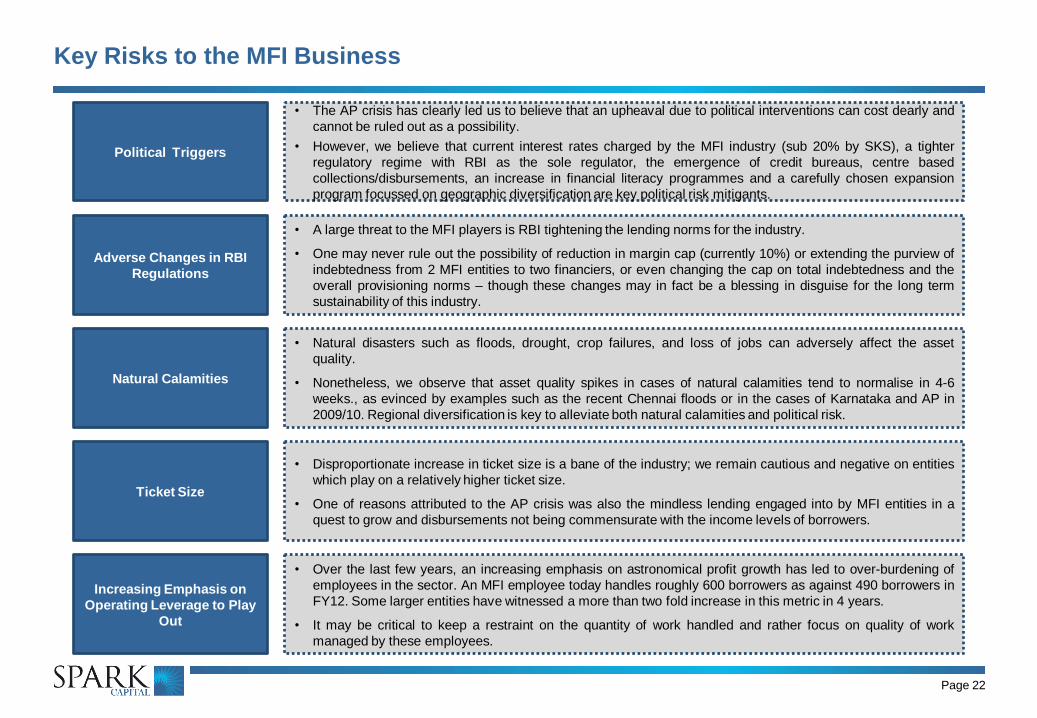
Key Risks to the MFI Business
Page 22
Political Triggers
Adverse Changes in RBI
Regulations
Natural Calamities
Ticket Size
• The AP crisis has clearly led us to believe that an upheaval due to political interventions can cost dearly and
cannot be ruled out as a possibility.
• However, we believe that current interest rates charged by the MFI industry (sub 20% by SKS), a tighter
regulatory regime with RBI as the sole regulator, the emergence of credit bureaus, centre based
collections/disbursements, an increase in financial literacy programmes and a carefully chosen expansion
program focussed on geographic diversification are key political risk mitigants.
• A large threat to the MFI players is RBI tightening the lending norms for the industry.
• One may never rule out the possibility of reduction in margin cap (currently 10%) or extending the purview of
indebtedness from 2 MFI entities to two financiers, or even changing the cap on total indebtedness and the
overall provisioning norms – though these changes may in fact be a blessing in disguise for the long term
sustainability of this industry.
• Natural disasters such as floods, drought, crop failures, and loss of jobs can adversely affect the asset
quality.
• Nonetheless, we observe that asset quality spikes in cases of natural calamities tend to normalise in 4-6
weeks., as evinced by examples such as the recent Chennai floods or in the cases of Karnataka and AP in
2009/10. Regional diversification is key to alleviate both natural calamities and political risk.
• Disproportionate increase in ticket size is a bane of the industry; we remain cautious and negative on entities
which play on a relatively higher ticket size.
• One of reasons attributed to the AP crisis was also the mindless lending engaged into by MFI entities in a
quest to grow and disbursements not being commensurate with the income levels of borrowers.
Increasing Emphasis on
Operating Leverage to Play
Out
• Over the last few years, an increasing emphasis on astronomical profit growth has led to over-burdening of
employees in the sector. An MFI employee today handles roughly 600 borrowers as against 490 borrowers in
FY12. Some larger entities have witnessed a more than two fold increase in this metric in 4 years.
• It may be critical to keep a restraint on the quantity of work handled and rather focus on quality of work
managed by these employees.

Page 23
Company Section
Page 24
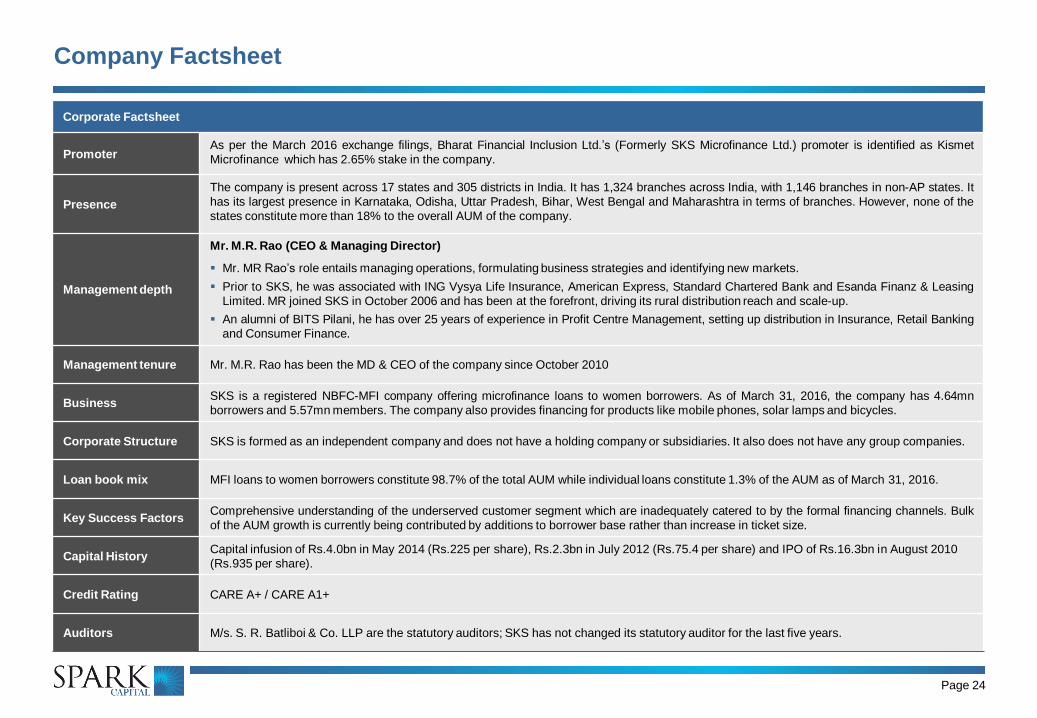
Corporate Factsheet
Promoter As per the March 2016 exchange filings, Bharat Financial Inclusion Ltd.’s (Formerly SKS Microfinance Ltd.) promoter is identified as Kismet
Microfinance which has 2.65% stake in the company.
Presence
The company is present across 17 states and 305 districts in India. It has 1,324 branches across India, with 1,146 branches in non-AP states. It
has its largest presence in Karnataka, Odisha, Uttar Pradesh, Bihar, West Bengal and Maharashtra in terms of branches. However, none of the
states constitute more than 18% to the overall AUM of the company.
Management depth
Mr. M.R. Rao (CEO & Managing Director)
Mr. MR Rao’s role entails managing operations, formulating business strategies and identifying new markets.
Prior to SKS, he was associated with ING Vysya Life Insurance, American Express, Standard Chartered Bank and Esanda Finanz & Leasing
Limited. MR joined SKS in October 2006 and has been at the forefront, driving its rural distribution reach and scale-up.
An alumni of BITS Pilani, he has over 25 years of experience in Profit Centre Management, setting up distribution in Insurance, Retail Banking
and Consumer Finance.
Management tenure Mr. M.R. Rao has been the MD & CEO of the company since October 2010
Business SKS is a registered NBFC-MFI company offering microfinance loans to women borrowers. As of March 31, 2016, the company has 4.64mn
borrowers and 5.57mn members. The company also provides financing for products like mobile phones, solar lamps and bicycles.
Corporate Structure SKS is formed as an independent company and does not have a holding company or subsidiaries. It also does not have any group companies.
Loan book mix MFI loans to women borrowers constitute 98.7% of the total AUM while individual loans constitute 1.3% of the AUM as of March 31, 2016.
Key Success Factors Comprehensive understanding of the underserved customer segment which are inadequately catered to by the formal financing channels. Bulk
of the AUM growth is currently being contributed by additions to borrower base rather than increase in ticket size.
Capital History Capital infusion of Rs.4.0bn in May 2014 (Rs.225 per share), Rs.2.3bn in July 2012 (Rs.75.4 per share) and IPO of Rs.16.3bn in August 2010
(Rs.935 per share).
Credit Rating CARE A+ / CARE A1+
Auditors M/s. S. R. Batliboi & Co. LLP are the statutory auditors; SKS has not changed its statutory auditor for the last five years.
Company Factsheet
Page 25
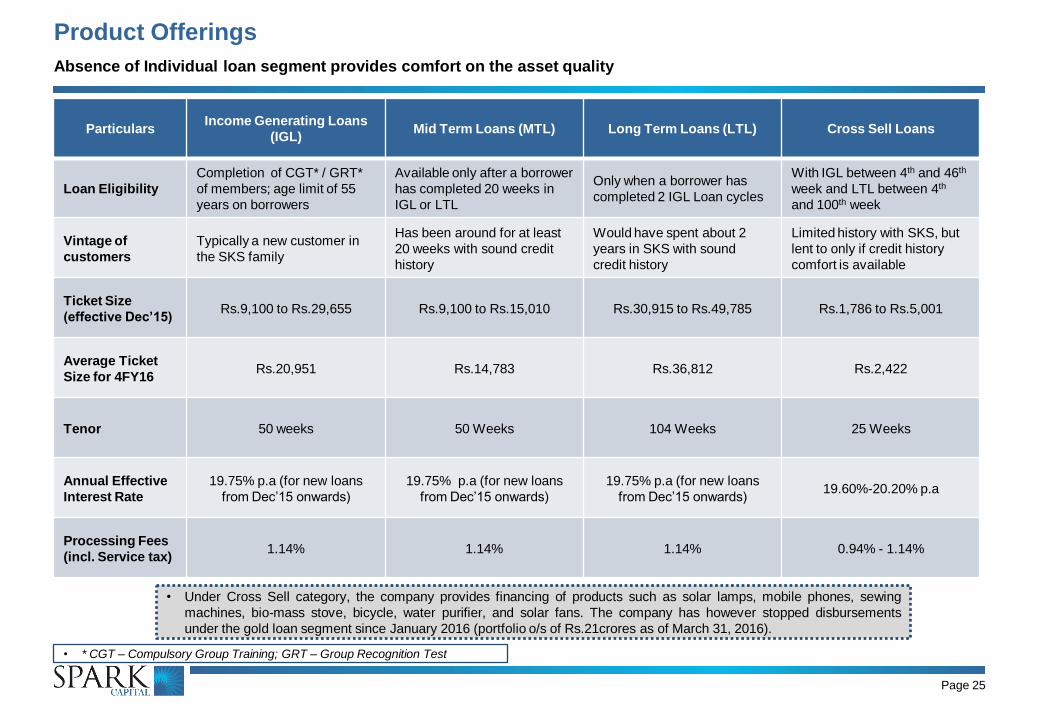
Product Offerings
Absence of Individual loan segment provides comfort on the asset quality
Particulars Income Generating Loans
(IGL) Mid Term Loans (MTL) Long Term Loans (LTL) Cross Sell Loans
Loan Eligibility
Completion of CGT* / GRT*
of members; age limit of 55
years on borrowers
Available only after a borrower
has completed 20 weeks in
IGL or LTL
Only when a borrower has
completed 2 IGL Loan cycles
With IGL between 4th and 46th
week and LTL between 4th
and 100th week
Vintage of
customers
Typically a new customer in
the SKS family
Has been around for at least
20 weeks with sound credit
history
Would have spent about 2
years in SKS with sound
credit history
Limited history with SKS, but
lent to only if credit history
comfort is available
Ticket Size
(effective Dec’15) Rs.9,100 to Rs.29,655 Rs.9,100 to Rs.15,010 Rs.30,915 to Rs.49,785 Rs.1,786 to Rs.5,001
Average Ticket
Size for 4FY16 Rs.20,951 Rs.14,783 Rs.36,812 Rs.2,422
Tenor 50 weeks 50 Weeks 104 Weeks 25 Weeks
Annual Effective
Interest Rate
19.75% p.a (for new loans
from Dec’15 onwards)
19.75% p.a (for new loans
from Dec’15 onwards)
19.75% p.a (for new loans
from Dec’15 onwards) 19.60%-20.20% p.a
Processing Fees
(incl. Service tax) 1.14% 1.14% 1.14% 0.94% - 1.14%
• Under Cross Sell category, the company provides financing of products such as solar lamps, mobile phones, sewing
machines, bio-mass stove, bicycle, water purifier, and solar fans. The company has however stopped disbursements
under the gold loan segment since January 2016 (portfolio o/s of Rs.21crores as of March 31, 2016).
• * CGT – Compulsory Group Training; GRT – Group Recognition Test
Page 26
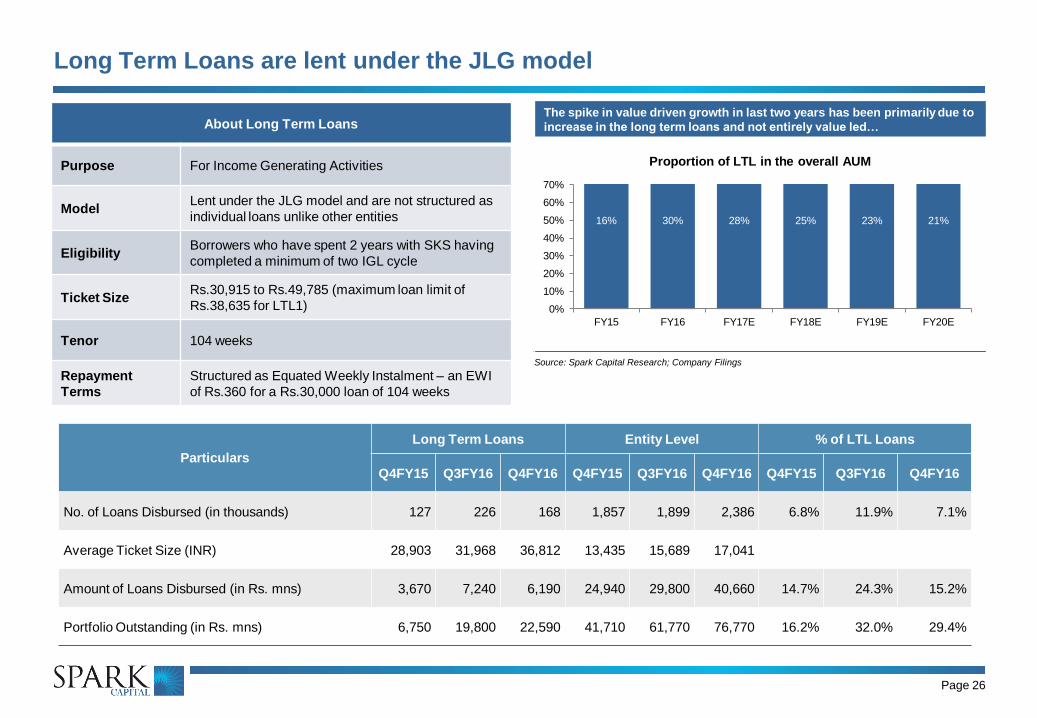
Long Term Loans are lent under the JLG model
About Long Term Loans
Purpose For Income Generating Activities
Model Lent under the JLG model and are not structured as
individual loans unlike other entities
Eligibility Borrowers who have spent 2 years with SKS having
completed a minimum of two IGL cycle
Ticket Size Rs.30,915 to Rs.49,785 (maximum loan limit of
Rs.38,635 for LTL1)
Tenor 104 weeks
Repayment
Terms
Structured as Equated Weekly Instalment – an EWI
of Rs.360 for a Rs.30,000 loan of 104 weeks
Particulars
Long Term Loans Entity Level % of LTL Loans
Q4FY15 Q3FY16 Q4FY16 Q4FY15 Q3FY16 Q4FY16 Q4FY15 Q3FY16 Q4FY16
No. of Loans Disbursed (in thousands) 127 226 168 1,857 1,899 2,386 6.8% 11.9% 7.1%
Average Ticket Size (INR) 28,903 31,968 36,812 13,435 15,689 17,041
Amount of Loans Disbursed (in Rs. mns) 3,670 7,240 6,190 24,940 29,800 40,660 14.7% 24.3% 15.2%
Portfolio Outstanding (in Rs. mns) 6,750 19,800 22,590 41,710 61,770 76,770 16.2% 32.0% 29.4%
The spike in value driven growth in last two years has been primarily due to
increase in the long term loans and not entirely value led…
Source: Spark Capital Research; Company Filings
16% 30% 28% 25% 23% 21%
0%
10%
20%
30%
40%
50%
60%
70%
FY15 FY16 FY17E FY18E FY19E FY20E
Proportion of LTL in the overall AUM
Page 27
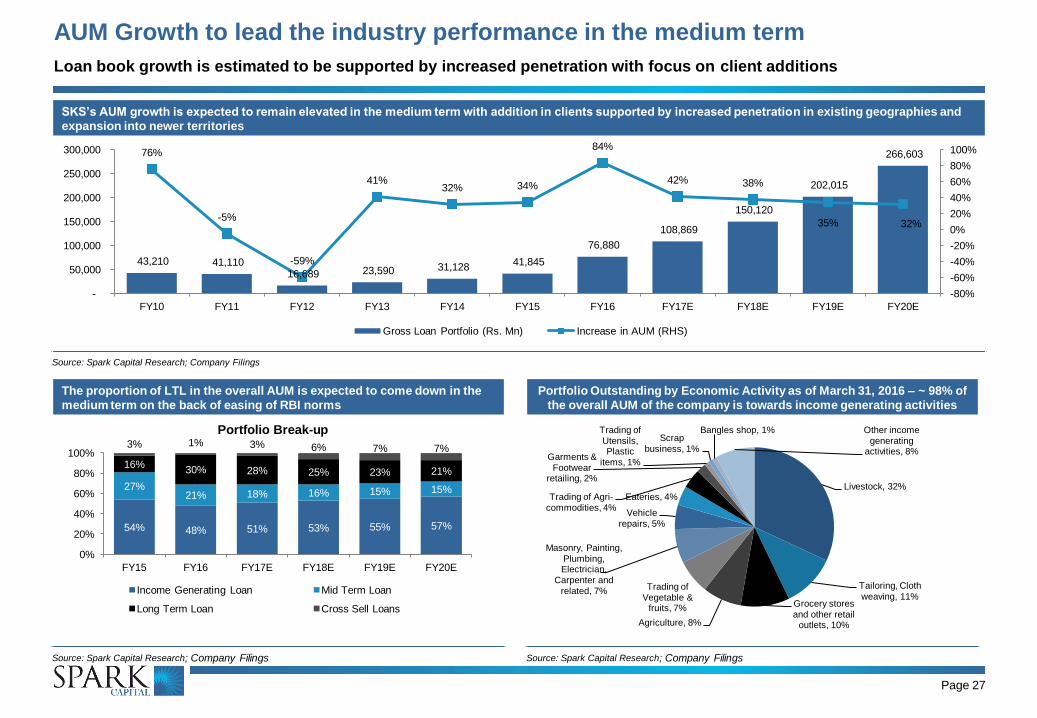
AUM Growth to lead the industry performance in the medium term
The proportion of LTL in the overall AUM is expected to come down in the
medium term on the back of easing of RBI norms
Source: Spark Capital Research; Company Filings
SKS’s AUM growth is expected to remain elevated in the medium term with addition in clients supported by increased penetration in existing geographies and
expansion into newer territories
Source: Spark Capital Research; Company Filings
43,210 41,110 16,689 23,590 31,128
41,845
76,880
108,869
150,120
202,015
266,603 76%
-5%
-59%
41% 32% 34%
84%
42% 38%
35% 32%
-80%
-60%
-40%
-20%
0%
20%
40%
60%
80%
100%
-
50,000
100,000
150,000
200,000
250,000
300,000
FY10 FY11 FY12 FY13 FY14 FY15 FY16 FY17E FY18E FY19E FY20E
Gross Loan Portfolio (Rs. Mn) Increase in AUM (RHS)
54% 48% 51% 53% 55% 57%
27% 21% 18% 16% 15% 15%
16% 30% 28% 25% 23% 21%
3% 1% 3% 6% 7% 7%
0%
20%
40%
60%
80%
100%
FY15 FY16 FY17E FY18E FY19E FY20E
Portfolio Break-up
Income Generating Loan Mid Term Loan
Long Term Loan Cross Sell Loans
Portfolio Outstanding by Economic Activity as of March 31, 2016 – ~ 98% of
the overall AUM of the company is towards income generating activities
Source: Spark Capital Research; Company Filings
Livestock, 32%
Tailoring, Cloth weaving, 11%
Grocery stores and other retail
outlets, 10% Agriculture, 8%
Trading of Vegetable &
fruits, 7%
Masonry, Painting, Plumbing, Electrician,
Carpenter and
related, 7%
Vehicle repairs, 5%
Eateries, 4% Trading of Agri-commodities, 4%
Garments &
Footwear retailing, 2%
Trading of Utensils, Plastic
items, 1%
Scrap
business, 1%
Bangles shop, 1% Other income generating
activities, 8%
Loan book growth is estimated to be supported by increased penetration with focus on client additions
…as evident from the split of volume-value-impact of LTL in the last 3 years
Source: Spark Capital Research; Company Filings; *Due to introduction of Long Term Loans
Page 28
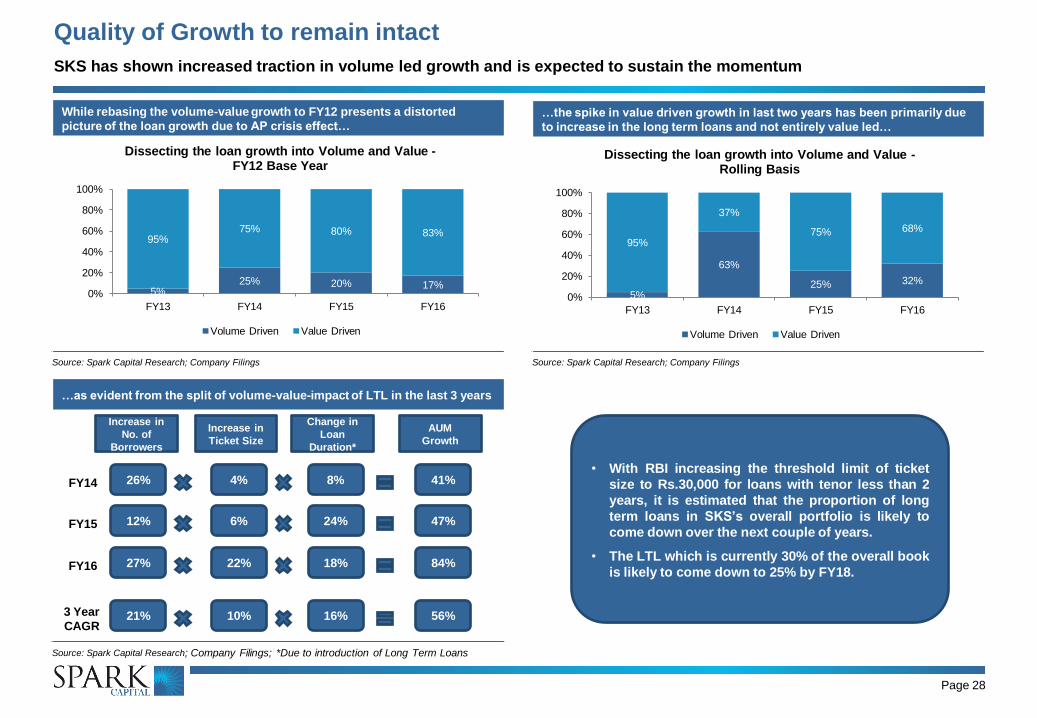
Quality of Growth to remain intact
SKS has shown increased traction in volume led growth and is expected to sustain the momentum
…the spike in value driven growth in last two years has been primarily due
to increase in the long term loans and not entirely value led…
Source: Spark Capital Research; Company Filings
While rebasing the volume-value growth to FY12 presents a distorted
picture of the loan growth due to AP crisis effect…
Source: Spark Capital Research; Company Filings
5% 25% 20% 17%
95% 75% 80% 83%
0%
20%
40%
60%
80%
100%
FY13 FY14 FY15 FY16
Dissecting the loan growth into Volume and Value - FY12 Base Year
Volume Driven Value Driven
5%
63%
25% 32%
95%
37%
75% 68%
0%
20%
40%
60%
80%
100%
FY13 FY14 FY15 FY16
Dissecting the loan growth into Volume and Value - Rolling Basis
Volume Driven Value Driven
• With RBI increasing the threshold limit of ticket
size to Rs.30,000 for loans with tenor less than 2
years, it is estimated that the proportion of long
term loans in SKS’s overall portfolio is likely to
come down over the next couple of years.
• The LTL which is currently 30% of the overall book
is likely to come down to 25% by FY18.
Increase in
No. of
Borrowers
Increase in
Ticket Size
Change in
Loan
Duration*
AUM
Growth
FY14
FY15
FY16
26% 4% 8% 41%
12% 6% 24% 47%
27% 22% 18% 84%
3 Year
CAGR 21% 10% 16% 56%
Page 29
Stacking SKS against its Peers
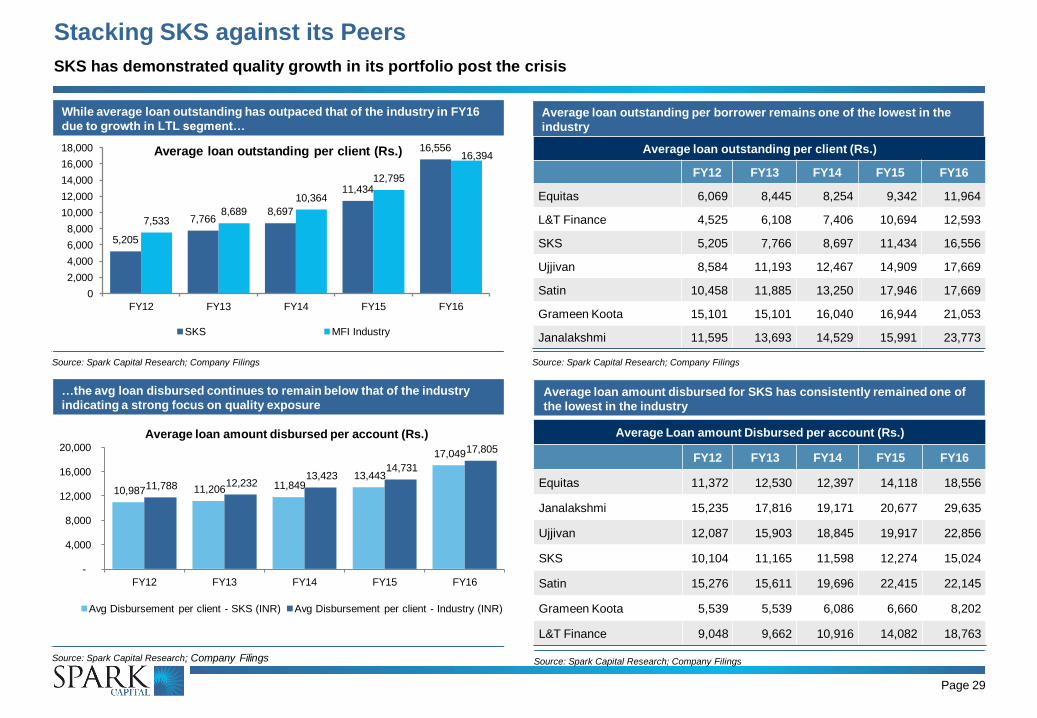
SKS has demonstrated quality growth in its portfolio post the crisis
Average loan outstanding per borrower remains one of the lowest in the
industry
Source: Spark Capital Research; Company Filings
…the avg loan disbursed continues to remain below that of the industry
indicating a strong focus on quality exposure
Source: Spark Capital Research; Company Filings
While average loan outstanding has outpaced that of the industry in FY16
due to growth in LTL segment…
Source: Spark Capital Research; Company Filings
5,205
7,766 8,697
11,434
16,556
7,533 8,689
10,364
12,795
16,394
0
2,000
4,000
6,000
8,000
10,000
12,000
14,000
16,000
18,000
FY12 FY13 FY14 FY15 FY16
Average loan outstanding per client (Rs.)
SKS MFI Industry
Average loan outstanding per client (Rs.)
FY12 FY13 FY14 FY15 FY16
Equitas 6,069 8,445 8,254 9,342 11,964
L&T Finance 4,525 6,108 7,406 10,694 12,593
SKS 5,205 7,766 8,697 11,434 16,556
Ujjivan 8,584 11,193 12,467 14,909 17,669
Satin 10,458 11,885 13,250 17,946 17,669
Grameen Koota 15,101 15,101 16,040 16,944 21,053
Janalakshmi 11,595 13,693 14,529 15,991 23,773
Average loan amount disbursed for SKS has consistently remained one of
the lowest in the industry
Source: Spark Capital Research; Company Filings
Average Loan amount Disbursed per account (Rs.)
FY12 FY13 FY14 FY15 FY16
Equitas 11,372 12,530 12,397 14,118 18,556
Janalakshmi 15,235 17,816 19,171 20,677 29,635
Ujjivan 12,087 15,903 18,845 19,917 22,856
SKS 10,104 11,165 11,598 12,274 15,024
Satin 15,276 15,611 19,696 22,415 22,145
Grameen Koota 5,539 5,539 6,086 6,660 8,202
L&T Finance 9,048 9,662 10,916 14,082 18,763
10,987 11,206 11,849 13,443
17,049
11,788 12,232 13,423
14,731
17,805
-
4,000
8,000
12,000
16,000
20,000
FY12 FY13 FY14 FY15 FY16
Average loan amount disbursed per account (Rs.)
Avg Disbursement per client - SKS (INR) Avg Disbursement per client - Industry (INR)
Page 30
Focus on Volumes in the medium term to drive growth
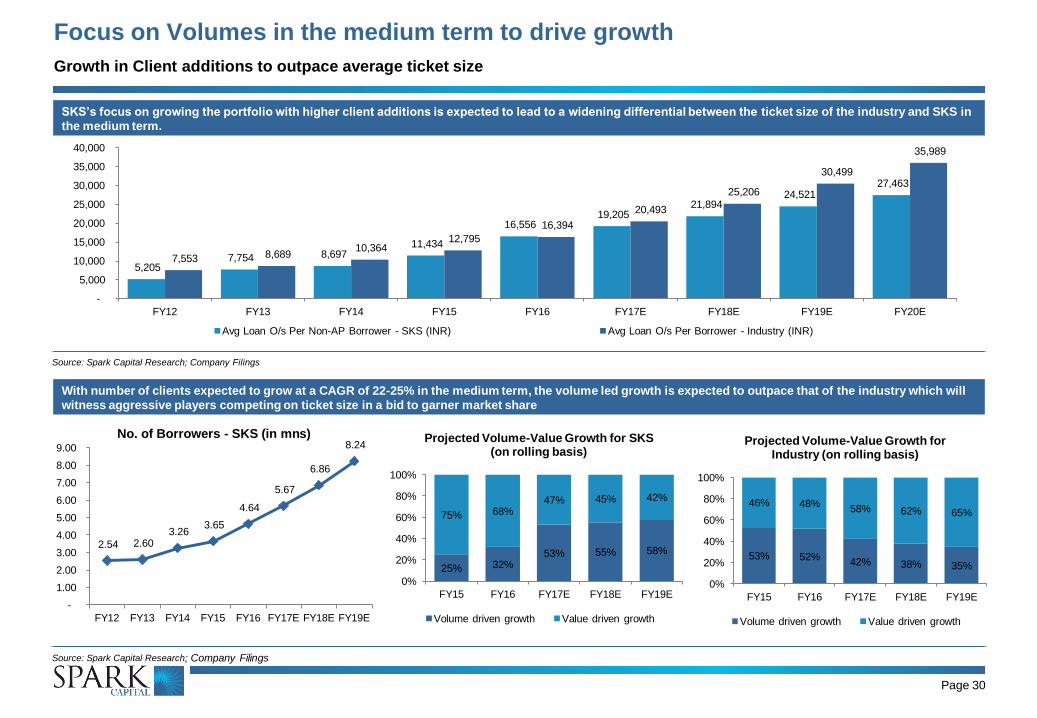
Growth in Client additions to outpace average ticket size
With number of clients expected to grow at a CAGR of 22-25% in the medium term, the volume led growth is expected to outpace that of the industry which will
witness aggressive players competing on ticket size in a bid to garner market share
Source: Spark Capital Research; Company Filings
SKS’s focus on growing the portfolio with higher client additions is expected to lead to a widening differential between the ticket size of the industry and SKS in
the medium term.
Source: Spark Capital Research; Company Filings
5,205 7,754 8,697
11,434
16,556 19,205
21,894 24,521
27,463
7,553 8,689 10,364
12,795
16,394
20,493
25,206
30,499
35,989
-
5,000
10,000
15,000
20,000
25,000
30,000
35,000
40,000
FY12 FY13 FY14 FY15 FY16 FY17E FY18E FY19E FY20E
Avg Loan O/s Per Non-AP Borrower - SKS (INR) Avg Loan O/s Per Borrower - Industry (INR)
2.54 2.60 3.26
3.65
4.64
5.67
6.86
8.24
-
1.00
2.00
3.00
4.00
5.00
6.00
7.00
8.00
9.00
FY12 FY13 FY14 FY15 FY16 FY17E FY18E FY19E
No. of Borrowers - SKS (in mns)
25% 32% 53% 55% 58%
75% 68% 47% 45% 42%
0%
20%
40%
60%
80%
100%
FY15 FY16 FY17E FY18E FY19E
Projected Volume-Value Growth for SKS (on rolling basis)
Volume driven growth Value driven growth
53% 52% 42% 38% 35%
46% 48% 58% 62% 65%
0%
20%
40%
60%
80%
100%
FY15 FY16 FY17E FY18E FY19E
Projected Volume-Value Growth for Industry (on rolling basis)
Volume driven growth Value driven growth
Page 31
Concentration of AUM – Branch
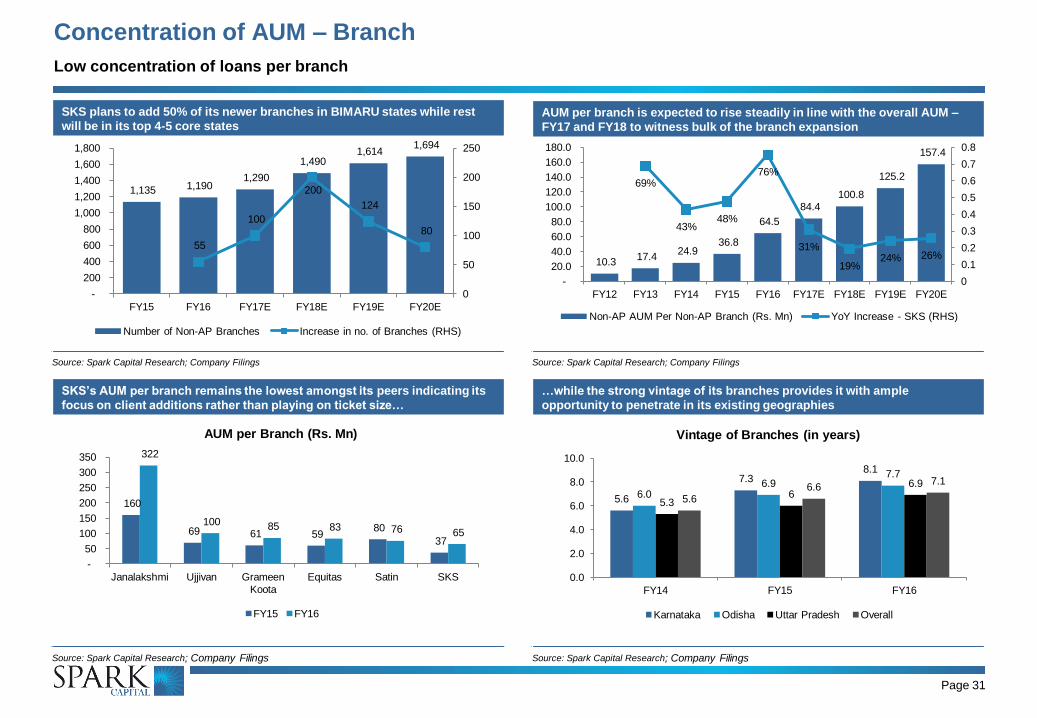
Low concentration of loans per branch
AUM per branch is expected to rise steadily in line with the overall AUM –
FY17 and FY18 to witness bulk of the branch expansion
Source: Spark Capital Research; Company Filings
…while the strong vintage of its branches provides it with ample
opportunity to penetrate in its existing geographies
Source: Spark Capital Research; Company Filings
SKS’s AUM per branch remains the lowest amongst its peers indicating its
focus on client additions rather than playing on ticket size…
Source: Spark Capital Research; Company Filings
SKS plans to add 50% of its newer branches in BIMARU states while rest
will be in its top 4-5 core states
Source: Spark Capital Research; Company Filings
1,135 1,190 1,290
1,490 1,614
1,694
55
100
200
124
80
0
50
100
150
200
250
-
200
400
600
800
1,000
1,200
1,400
1,600
1,800
FY15 FY16 FY17E FY18E FY19E FY20E
Number of Non-AP Branches Increase in no. of Branches (RHS)
10.3 17.4
24.9 36.8
64.5
84.4 100.8
125.2
157.4
69%
43% 48%
76%
31%
19% 24% 26%
0
0.1
0.2
0.3
0.4
0.5
0.6
0.7
0.8
-
20.0
40.0
60.0
80.0
100.0
120.0
140.0
160.0
180.0
FY12 FY13 FY14 FY15 FY16 FY17E FY18E FY19E FY20E
Non-AP AUM Per Non-AP Branch (Rs. Mn) YoY Increase - SKS (RHS)
5.6
7.3 8.1
6.0 6.9
7.7
5.3 6
6.9
5.6 6.6
7.1
0.0
2.0
4.0
6.0
8.0
10.0
FY14 FY15 FY16
Vintage of Branches (in years)
Karnataka Odisha Uttar Pradesh Overall
160
69 61 59 80
37
322
100 85 83 76 65
-
50
100
150
200
250
300
350
Janalakshmi Ujjivan Grameen
Koota
Equitas Satin SKS
AUM per Branch (Rs. Mn)
FY15 FY16
Page 32
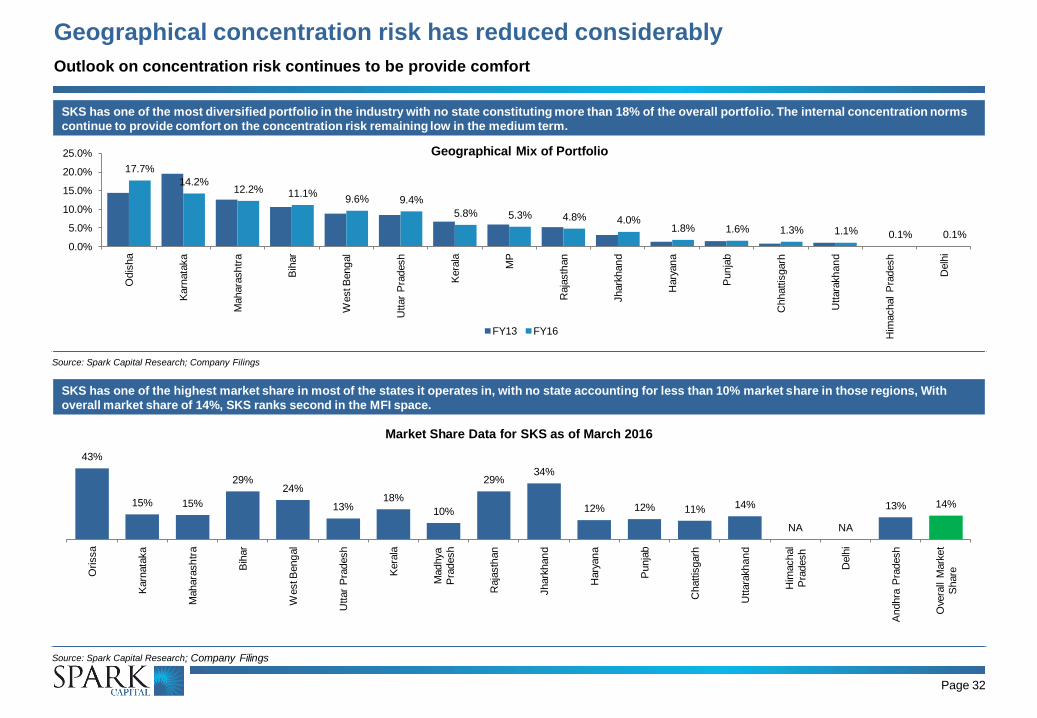
Geographical concentration risk has reduced considerably
Outlook on concentration risk continues to be provide comfort
SKS has one of the highest market share in most of the states it operates in, with no state accounting for less than 10% market share in those regions, With
overall market share of 14%, SKS ranks second in the MFI space.
Source: Spark Capital Research; Company Filings
SKS has one of the most diversified portfolio in the industry with no state constituting more than 18% of the overall portfolio. The internal concentration norms
continue to provide comfort on the concentration risk remaining low in the medium term.
Source: Spark Capital Research; Company Filings
17.7%
14.2% 12.2% 11.1%
9.6% 9.4%
5.8% 5.3% 4.8% 4.0% 1.8% 1.6% 1.3% 1.1% 0.1% 0.1%
0.0%
5.0%
10.0%
15.0%
20.0%
25.0%
Odis
ha
Karn
ata
ka
Mahara
sh
tra
Bih
ar
West B
eng
al
Uttar
Pra
desh
Kera
la
MP
Raja
sth
an
Jhark
han
d
Hary
an
a
Punja
b
Chhattis
garh
Uttara
kh
an
d
Him
achal
Pra
desh
Delh
i
Geographical Mix of Portfolio
FY13 FY16
43%
15% 15%
29% 24%
13% 18%
10%
29% 34%
12% 12% 11% 14%
NA NA
13% 14%
Orissa
Karn
ata
ka
Mahara
sh
tra
Bih
ar
West B
eng
al
Uttar
Pra
desh
Kera
la
Madhya
Pra
desh
Raja
sth
an
Jhark
han
d
Hary
an
a
Punja
b
Chattis
garh
Uttara
kh
an
d
Him
achal
Pra
desh
Delh
i
Andhra
Pra
desh
Ove
rall
Mark
et
Share
Market Share Data for SKS as of March 2016
Page 33
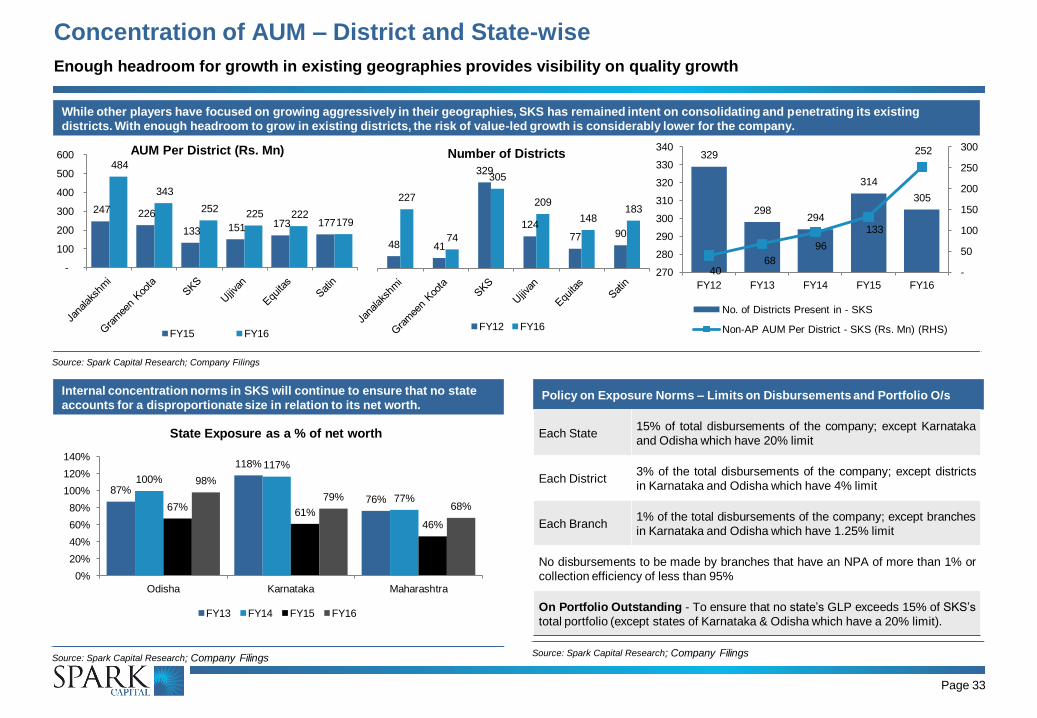
Concentration of AUM – District and State-wise
Enough headroom for growth in existing geographies provides visibility on quality growth
Policy on Exposure Norms – Limits on Disbursements and Portfolio O/s
Source: Spark Capital Research; Company Filings
Internal concentration norms in SKS will continue to ensure that no state
accounts for a disproportionate size in relation to its net worth.
Source: Spark Capital Research; Company Filings
While other players have focused on growing aggressively in their geographies, SKS has remained intent on consolidating and penetrating its existing
districts. With enough headroom to grow in existing districts, the risk of value-led growth is considerably lower for the company.
Source: Spark Capital Research; Company Filings
87%
118%
76%
100%
117%
77% 67%
61% 46%
98%
79% 68%
0%
20%
40%
60%
80%
100%
120%
140%
Odisha Karnataka Maharashtra
State Exposure as a % of net worth
FY13 FY14 FY15 FY16
Each State 15% of total disbursements of the company; except Karnataka
and Odisha which have 20% limit
Each District 3% of the total disbursements of the company; except districts
in Karnataka and Odisha which have 4% limit
Each Branch 1% of the total disbursements of the company; except branches
in Karnataka and Odisha which have 1.25% limit
No disbursements to be made by branches that have an NPA of more than 1% or
collection efficiency of less than 95%
On Portfolio Outstanding - To ensure that no state’s GLP exceeds 15% of SKS’s
total portfolio (except states of Karnataka & Odisha which have a 20% limit).
247 226
133 151 173 177
484
343
252 225 222
179
-
100
200
300
400
500
600 AUM Per District (Rs. Mn)
FY15 FY16
48 41
329
124
77 90
227
74
305
209
148 183
Number of Districts
FY12 FY16
329
298 294
314
305
40 68
96
133
252
-
50
100
150
200
250
300
270
280
290
300
310
320
330
340
FY12 FY13 FY14 FY15 FY16
No. of Districts Present in - SKS
Non-AP AUM Per District - SKS (Rs. Mn) (RHS)
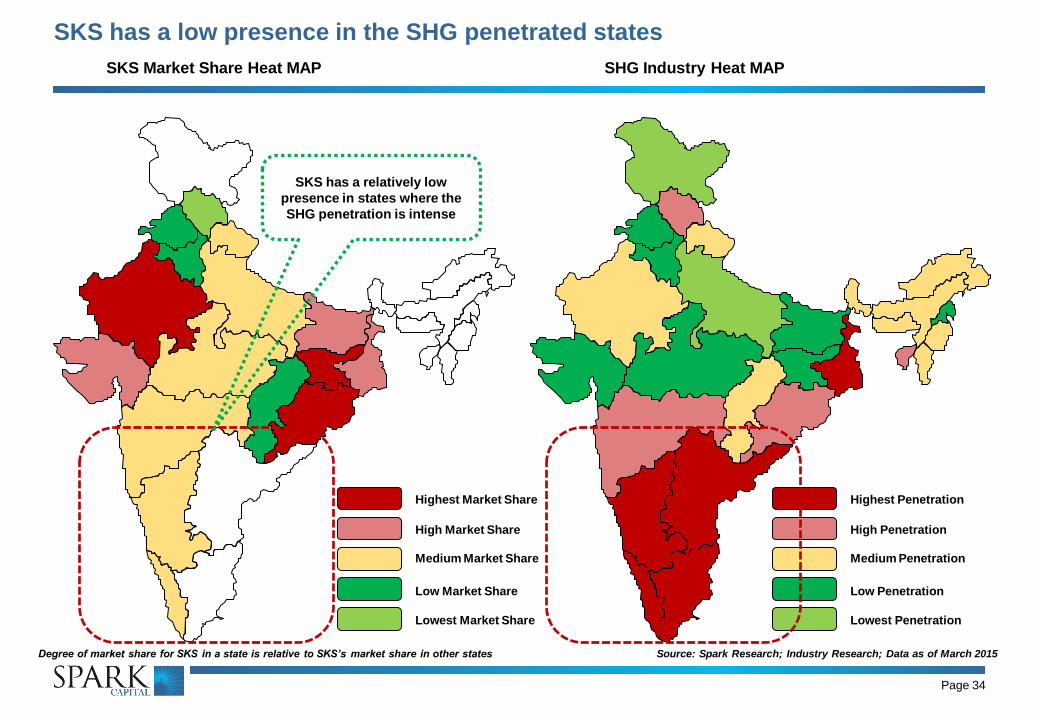
SKS Market Share Heat MAP
Page 34
SHG Industry Heat MAP
Highest Market Share
High Market Share
Medium Market Share
Low Market Share
Lowest Market Share
Highest Penetration
High Penetration
Medium Penetration
Low Penetration
Lowest Penetration
Degree of market share for SKS in a state is relative to SKS’s market share in other states Source: Spark Research; Industry Research; Data as of March 2015
SKS has a relatively low
presence in states where the
SHG penetration is intense
SKS has a low presence in the SHG penetrated states
Page 35
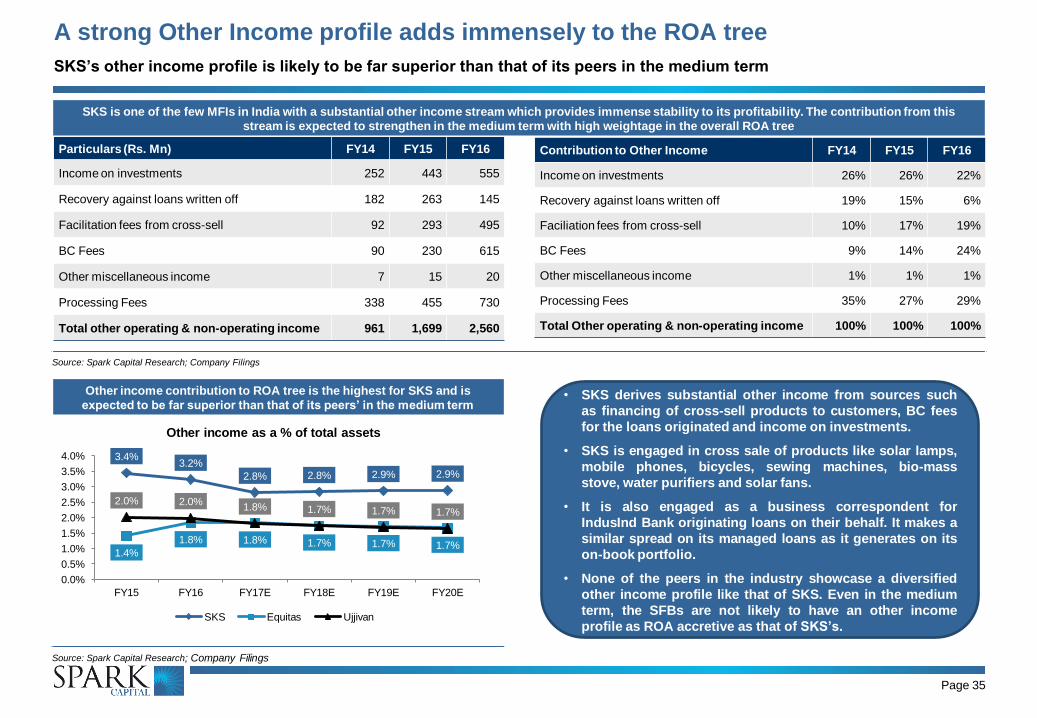
A strong Other Income profile adds immensely to the ROA tree
SKS’s other income profile is likely to be far superior than that of its peers in the medium term
Other income contribution to ROA tree is the highest for SKS and is
expected to be far superior than that of its peers’ in the medium term
Source: Spark Capital Research; Company Filings
SKS is one of the few MFIs in India with a substantial other income stream which provides immense stability to its profitability. The contribution from this
stream is expected to strengthen in the medium term with high weightage in the overall ROA tree
Source: Spark Capital Research; Company Filings
Particulars (Rs. Mn) FY14 FY15 FY16
Income on investments 252 443 555
Recovery against loans written off 182 263 145
Facilitation fees from cross-sell 92 293 495
BC Fees 90 230 615
Other miscellaneous income 7 15 20
Processing Fees 338 455 730
Total other operating & non-operating income 961 1,699 2,560
Contribution to Other Income FY14 FY15 FY16
Income on investments 26% 26% 22%
Recovery against loans written off 19% 15% 6%
Faciliation fees from cross-sell 10% 17% 19%
BC Fees 9% 14% 24%
Other miscellaneous income 1% 1% 1%
Processing Fees 35% 27% 29%
Total Other operating & non-operating income 100% 100% 100%
3.4% 3.2%
2.8% 2.8% 2.9% 2.9%
1.4%
1.8% 1.8% 1.7% 1.7% 1.7%
2.0% 2.0% 1.8% 1.7% 1.7% 1.7%
0.0%
0.5%
1.0%
1.5%
2.0%
2.5%
3.0%
3.5%
4.0%
FY15 FY16 FY17E FY18E FY19E FY20E
Other income as a % of total assets
SKS Equitas Ujjivan
• SKS derives substantial other income from sources such
as financing of cross-sell products to customers, BC fees
for the loans originated and income on investments.
• SKS is engaged in cross sale of products like solar lamps,
mobile phones, bicycles, sewing machines, bio-mass
stove, water purifiers and solar fans.
• It is also engaged as a business correspondent for
IndusInd Bank originating loans on their behalf. It makes a
similar spread on its managed loans as it generates on its
on-book portfolio.
• None of the peers in the industry showcase a diversified
other income profile like that of SKS. Even in the medium
term, the SFBs are not likely to have an other income
profile as ROA accretive as that of SKS’s.
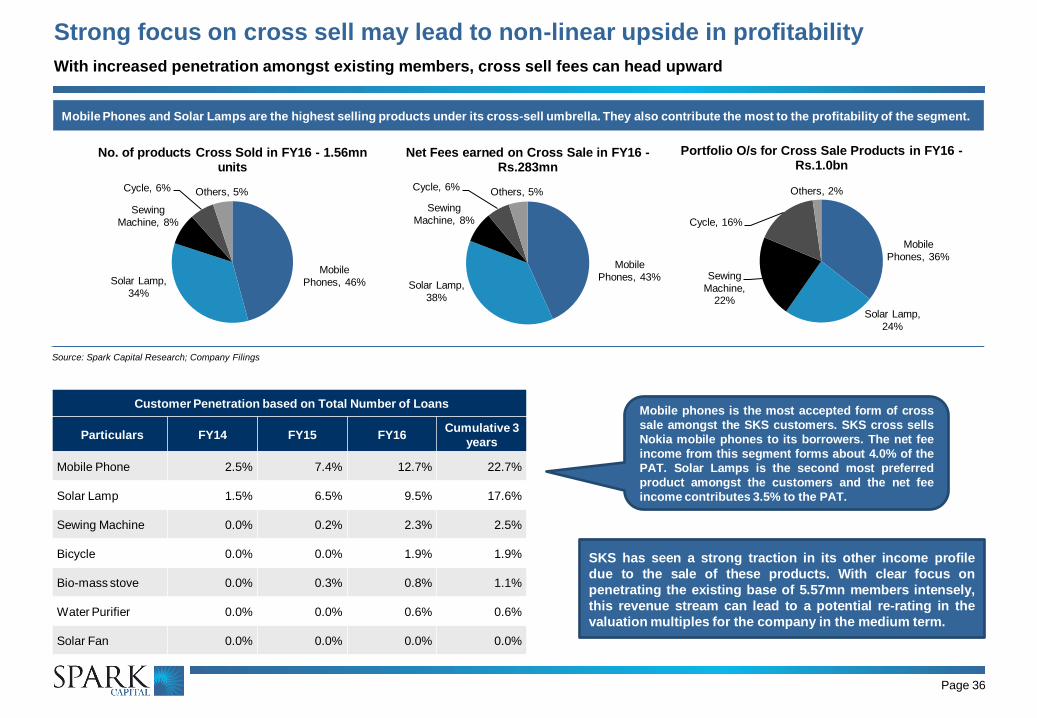
Mobile Phones and Solar Lamps are the highest selling products under its cross-sell umbrella. They also contribute the most to the profitability of the segment.
Source: Spark Capital Research; Company Filings
Page 36
Strong focus on cross sell may lead to non-linear upside in profitability
With increased penetration amongst existing members, cross sell fees can head upward
Mobile
Phones, 46% Solar Lamp,
34%
Sewing
Machine, 8%
Cycle, 6% Others, 5%
No. of products Cross Sold in FY16 - 1.56mn units
Mobile
Phones, 43% Solar Lamp,
38%
Sewing
Machine, 8%
Cycle, 6% Others, 5%
Net Fees earned on Cross Sale in FY16 - Rs.283mn
Mobile
Phones, 36%
Solar Lamp,
24%
Sewing
Machine, 22%
Cycle, 16%
Others, 2%
Portfolio O/s for Cross Sale Products in FY16 - Rs.1.0bn
Customer Penetration based on Total Number of Loans
Particulars FY14 FY15 FY16 Cumulative 3
years
Mobile Phone 2.5% 7.4% 12.7% 22.7%
Solar Lamp 1.5% 6.5% 9.5% 17.6%
Sewing Machine 0.0% 0.2% 2.3% 2.5%
Bicycle 0.0% 0.0% 1.9% 1.9%
Bio-mass stove 0.0% 0.3% 0.8% 1.1%
Water Purifier 0.0% 0.0% 0.6% 0.6%
Solar Fan 0.0% 0.0% 0.0% 0.0%
Mobile phones is the most accepted form of cross
sale amongst the SKS customers. SKS cross sells
Nokia mobile phones to its borrowers. The net fee
income from this segment forms about 4.0% of the
PAT. Solar Lamps is the second most preferred
product amongst the customers and the net fee
income contributes 3.5% to the PAT.
SKS has seen a strong traction in its other income profile
due to the sale of these products. With clear focus on
penetrating the existing base of 5.57mn members intensely,
this revenue stream can lead to a potential re-rating in the
valuation multiples for the company in the medium term.
Page 37
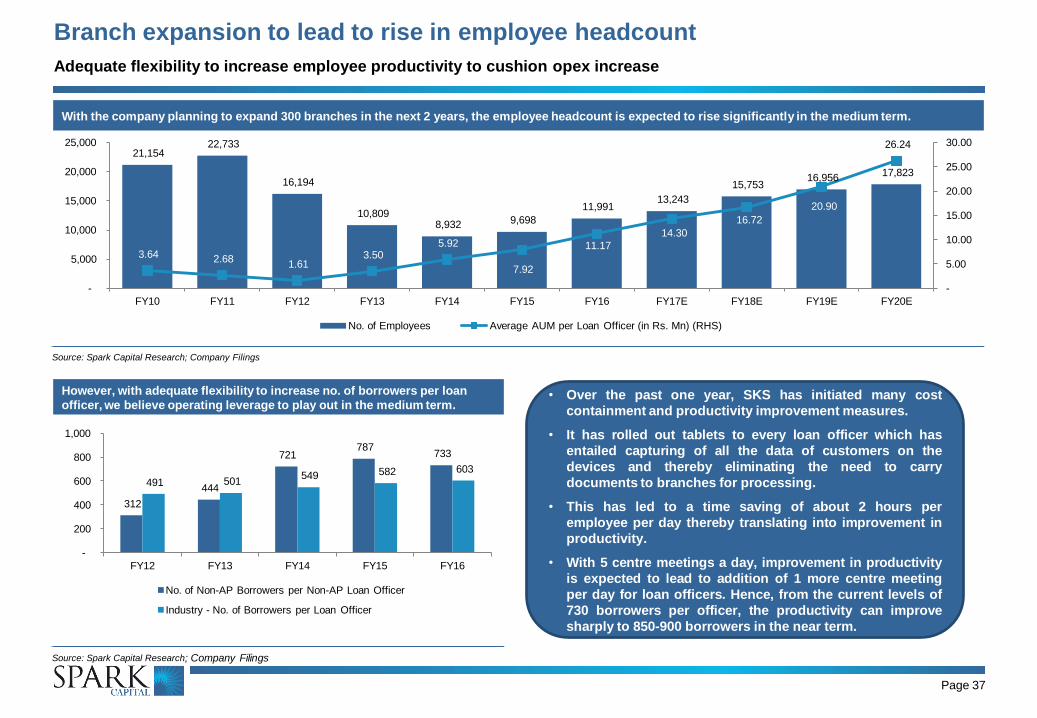
Branch expansion to lead to rise in employee headcount
Adequate flexibility to increase employee productivity to cushion opex increase
However, with adequate flexibility to increase no. of borrowers per loan
officer, we believe operating leverage to play out in the medium term.
Source: Spark Capital Research; Company Filings
With the company planning to expand 300 branches in the next 2 years, the employee headcount is expected to rise significantly in the medium term.
Source: Spark Capital Research; Company Filings
21,154 22,733
16,194
10,809 8,932 9,698
11,991 13,243
15,753 16,956
17,823
3.64 2.68 1.61
3.50 5.92
7.92
11.17
14.30
16.72
20.90
26.24
-
5.00
10.00
15.00
20.00
25.00
30.00
-
5,000
10,000
15,000
20,000
25,000
FY10 FY11 FY12 FY13 FY14 FY15 FY16 FY17E FY18E FY19E FY20E
No. of Employees Average AUM per Loan Officer (in Rs. Mn) (RHS)
312
444
721 787
733
491 501 549 582 603
-
200
400
600
800
1,000
FY12 FY13 FY14 FY15 FY16
No. of Non-AP Borrowers per Non-AP Loan Officer
Industry - No. of Borrowers per Loan Officer
• Over the past one year, SKS has initiated many cost
containment and productivity improvement measures.
• It has rolled out tablets to every loan officer which has
entailed capturing of all the data of customers on the
devices and thereby eliminating the need to carry
documents to branches for processing.
• This has led to a time saving of about 2 hours per
employee per day thereby translating into improvement in
productivity.
• With 5 centre meetings a day, improvement in productivity
is expected to lead to addition of 1 more centre meeting
per day for loan officers. Hence, from the current levels of
730 borrowers per officer, the productivity can improve
sharply to 850-900 borrowers in the near term.
Page 38
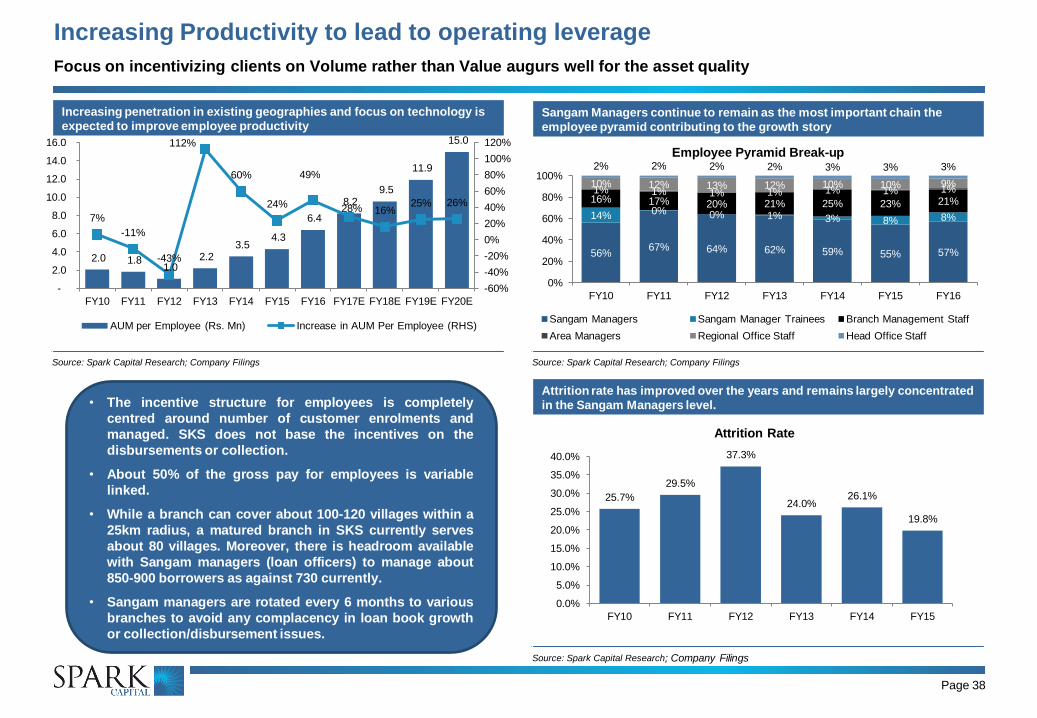
Increasing Productivity to lead to operating leverage
Focus on incentivizing clients on Volume rather than Value augurs well for the asset quality
Sangam Managers continue to remain as the most important chain the
employee pyramid contributing to the growth story
Source: Spark Capital Research; Company Filings
Attrition rate has improved over the years and remains largely concentrated
in the Sangam Managers level.
Source: Spark Capital Research; Company Filings
Increasing penetration in existing geographies and focus on technology is
expected to improve employee productivity
Source: Spark Capital Research; Company Filings
2.0 1.8 1.0
2.2 3.5
4.3
6.4
8.2 9.5
11.9
15.0
7%
-11%
-43%
112%
60%
24%
49%
28% 16% 25% 26%
-60%
-40%
-20%
0%
20%
40%
60%
80%
100%
120%
-
2.0
4.0
6.0
8.0
10.0
12.0
14.0
16.0
FY10 FY11 FY12 FY13 FY14 FY15 FY16 FY17E FY18E FY19E FY20E
AUM per Employee (Rs. Mn) Increase in AUM Per Employee (RHS)
56% 67% 64% 62% 59% 55% 57%
14% 0% 0% 1% 3% 8% 8%
16% 17% 20% 21% 25% 23% 21% 1% 1% 1% 1% 1% 1% 1% 10% 12% 13% 12% 10% 10% 9%
2% 2% 2% 2% 3% 3% 3%
0%
20%
40%
60%
80%
100%
FY10 FY11 FY12 FY13 FY14 FY15 FY16
Employee Pyramid Break-up
Sangam Managers Sangam Manager Trainees Branch Management Staff
Area Managers Regional Office Staff Head Office Staff
25.7%
29.5%
37.3%
24.0% 26.1%
19.8%
0.0%
5.0%
10.0%
15.0%
20.0%
25.0%
30.0%
35.0%
40.0%
FY10 FY11 FY12 FY13 FY14 FY15
Attrition Rate
• The incentive structure for employees is completely
centred around number of customer enrolments and
managed. SKS does not base the incentives on the
disbursements or collection.
• About 50% of the gross pay for employees is variable
linked.
• While a branch can cover about 100-120 villages within a
25km radius, a matured branch in SKS currently serves
about 80 villages. Moreover, there is headroom available
with Sangam managers (loan officers) to manage about
850-900 borrowers as against 730 currently.
• Sangam managers are rotated every 6 months to various
branches to avoid any complacency in loan book growth
or collection/disbursement issues.
Page 39
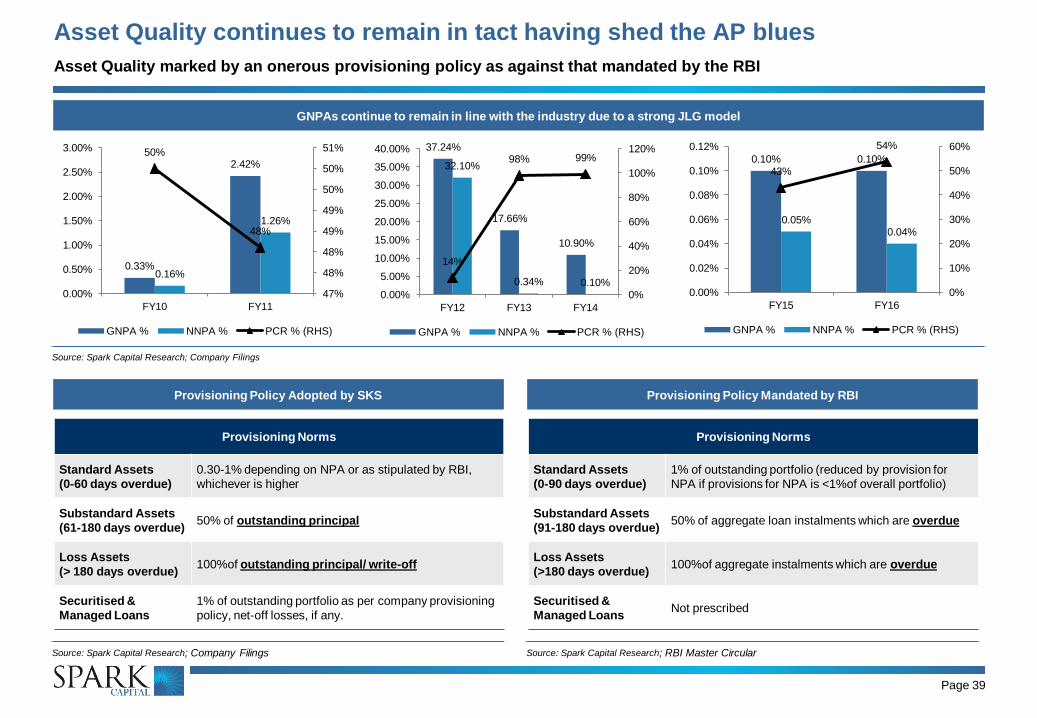
Asset Quality continues to remain in tact having shed the AP blues
Asset Quality marked by an onerous provisioning policy as against that mandated by the RBI
GNPAs continue to remain in line with the industry due to a strong JLG model
Source: Spark Capital Research; Company Filings
0.33%
2.42%
0.16%
1.26%
50%
48%
47%
48%
48%
49%
49%
50%
50%
51%
0.00%
0.50%
1.00%
1.50%
2.00%
2.50%
3.00%
FY10 FY11
GNPA % NNPA % PCR % (RHS)
37.24%
17.66%
10.90%
32.10%
0.34% 0.10%
14%
98% 99%
0%
20%
40%
60%
80%
100%
120%
0.00%
5.00%
10.00%
15.00%
20.00%
25.00%
30.00%
35.00%
40.00%
FY12 FY13 FY14
GNPA % NNPA % PCR % (RHS)
0.10% 0.10%
0.05% 0.04%
43%
54%
0%
10%
20%
30%
40%
50%
60%
0.00%
0.02%
0.04%
0.06%
0.08%
0.10%
0.12%
FY15 FY16
GNPA % NNPA % PCR % (RHS)
Provisioning Policy Mandated by RBI
Source: Spark Capital Research; RBI Master Circular
Provisioning Norms
Standard Assets
(0-90 days overdue)
1% of outstanding portfolio (reduced by provision for
NPA if provisions for NPA is <1%of overall portfolio)
Substandard Assets
(91-180 days overdue) 50% of aggregate loan instalments which are overdue
Loss Assets
(>180 days overdue) 100%of aggregate instalments which are overdue
Securitised &
Managed Loans Not prescribed
Provisioning Policy Adopted by SKS
Source: Spark Capital Research; Company Filings
Provisioning Norms
Standard Assets
(0-60 days overdue)
0.30-1% depending on NPA or as stipulated by RBI,
whichever is higher
Substandard Assets
(61-180 days overdue) 50% of outstanding principal
Loss Assets
(> 180 days overdue) 100%of outstanding principal/ write-off
Securitised &
Managed Loans
1% of outstanding portfolio as per company provisioning
policy, net-off losses, if any.
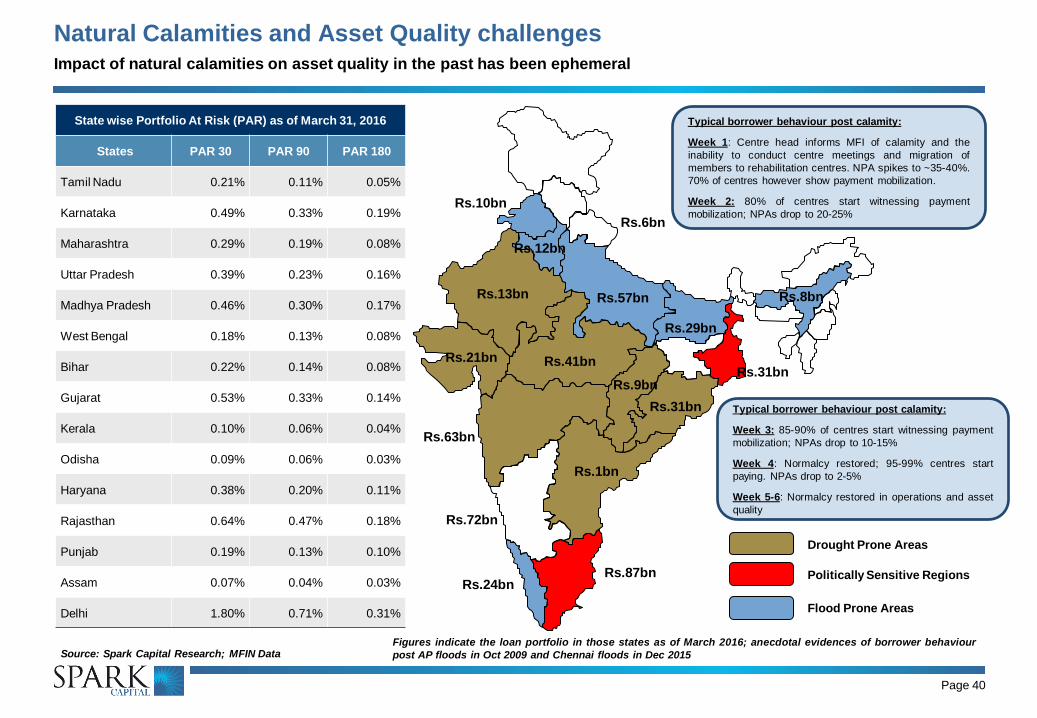
Natural Calamities and Asset Quality challenges
Page 40
Drought Prone Areas
Politically Sensitive Regions
Figures indicate the loan portfolio in those states as of March 2016; anecdotal evidences of borrower behaviour
post AP floods in Oct 2009 and Chennai floods in Dec 2015
Rs.87bn
Rs.72bn
Rs.63bn
Rs.57bn
Rs.41bn
Rs.31bn
Rs.31bn
Rs.29bn
Rs.24bn
Rs.21bn
Rs.13bn
Rs.10bn
Rs.12bn
Rs.9bn
Rs.8bn
Rs.6bn
Rs.1bn
Flood Prone Areas
Typical borrower behaviour post calamity:
Week 1: Centre head informs MFI of calamity and the
inability to conduct centre meetings and migration of
members to rehabilitation centres. NPA spikes to ~35-40%.
70% of centres however show payment mobilization.
Week 2: 80% of centres start witnessing payment
mobilization; NPAs drop to 20-25%
Source: Spark Capital Research; MFIN Data
State wise Portfolio At Risk (PAR) as of March 31, 2016
States PAR 30 PAR 90 PAR 180
Tamil Nadu 0.21% 0.11% 0.05%
Karnataka 0.49% 0.33% 0.19%
Maharashtra 0.29% 0.19% 0.08%
Uttar Pradesh 0.39% 0.23% 0.16%
Madhya Pradesh 0.46% 0.30% 0.17%
West Bengal 0.18% 0.13% 0.08%
Bihar 0.22% 0.14% 0.08%
Gujarat 0.53% 0.33% 0.14%
Kerala 0.10% 0.06% 0.04%
Odisha 0.09% 0.06% 0.03%
Haryana 0.38% 0.20% 0.11%
Rajasthan 0.64% 0.47% 0.18%
Punjab 0.19% 0.13% 0.10%
Assam 0.07% 0.04% 0.03%
Delhi 1.80% 0.71% 0.31%
Typical borrower behaviour post calamity:
Week 3: 85-90% of centres start witnessing payment
mobilization; NPAs drop to 10-15%
Week 4: Normalcy restored; 95-99% centres start
paying. NPAs drop to 2-5%
Week 5-6: Normalcy restored in operations and asset
quality
Impact of natural calamities on asset quality in the past has been ephemeral

Page 41
History of strong repayments even in crisis adds credibility to asset quality
EWI model is far superior to the EMI model which helps preserve asset quality
…Even as the overall MFI industry witnessed a slowdown and the GLP of
the industry shrunk by ~50% in 20 months
Source: Spark Capital Research; Company Filings
Even today SKS boasts of a strong customer retention ratio while high
dropout rates in earlier cycles negates any possibility of ever-greening
Source: Spark Capital Research; Company Filings
Notwithstanding the AP crisis, SKS witnessed a strong collection traction
amongst its Non-AP borrowers who repaid without any incremental loans…
Source: Spark Capital Research; Company Filings
3.3 mn
1.9 mn 5.2 mn
No.of non-AP members
who availed loans during this period
No. of non-AP members
who didn’t receive any incremental credit from SKS during this period
No. of non-AP borrowers
who repaid on-time during this period
283
146
0
50
100
150
200
250
300
Oct-10 Jun-12
Size of Non-AP MFI Industry Portfolio (Rs. Bn)
Indicative Dropout Rates for SKS
on cycle conversion
From IGL-1 to IGL-2 40%
From IGL-2 to IGL-3 27%
From IGL-3 to IGL-4 30%
From IGL-4 to IGL-5 and
above 15%
0.2 - 0.4%
0.8 - 1.1%
in JLG Loans in Individual Loans
Indicative GNPAs • SKS’s EWI schemes operationally act as a far superior
model than the EMI schemes adopted by many players.
• Although the EWI model is cost intensive, its merits
outweigh the cost overhangs in the long run.
• This is superior with respect to the frequency of
customer interaction, staying engaged with them, it
helps mimic the unstructured cash flows of the
borrowers, helps assess the right end use of the loans
and also helps keep a firm handle on the ever-greening
practices in the industry.
• Moreover, absence of any individual loan segment
(where NPAs are higher) in SKS’s book adds credibility
to the sustenance of asset quality in the medium term.
Weekly collections far superior to monthly collections

Page 42
High rejection rates allude to focus on building quality portfolio
Various in-built internal checks and policies insulate SKS from regulatory changes
As the company penetrates higher un-served customers, the hit rates on
borrower records with credit bureaus is bound to come down in future
Source: Spark Capital Research; Company Filings
High rejection rates in the sanctioning of loans, mainly on account of indebtedness with two or more entities, reaffirms company’s focus on building a quality
portfolio
Source: Spark Capital Research; Company Filings
8.7%
15.0%
23.0%
18.0%
29.0%
38.0%
0.0%
5.0%
10.0%
15.0%
20.0%
25.0%
30.0%
35.0%
40.0%
FY14 FY15 FY16
Rejection Rates
All Products Long Term Loans
Loans from
>= 2 MFIs, 84%
Eligibility <
minimum ticket size,
9%
Indebtedne
ss > Rs.60,000,
4%
Default
History, 3%
Reasons for Rejections - All Products - FY16
Loans from
>= 2 MFIs, 72%
Eligibility <
minimum ticket size,
23%
Indebtedne
ss > Rs.60,000,
2%
Default
History, 3%
Reasons for Rejections - Long Term Loans - FY16
87%
83%
80%
76%
78%
80%
82%
84%
86%
88%
FY15 FY16 4QFY16
Hit Rates for borrower records in Credit Bureau for all products
• SKS has considerably low penetration in geographies where SHGs
have a strong presence – states of Tamil Nadu, Andhra Pradesh,
Kerala, etc. This insulates SKS from any significant overlap in
customer indebtedness with SHGs.
• Moreover, SKS follows a rejection policy on indebtedness with
two entities rather than two MFI entities unlike most other players.
• With overall indebtedness capped at an onerous Rs.60,000 per
borrower as against Rs.100,000 as mandated by the RBI, this gives
adequate cushion for SKS to tide through any overlap in customer
base.
• These operational policies in place will insulate SKS from any
imminent pain posed by change in reporting regulations for SHGs.
Is SHGs reporting data to Credit Bureaus a negative for SKS?
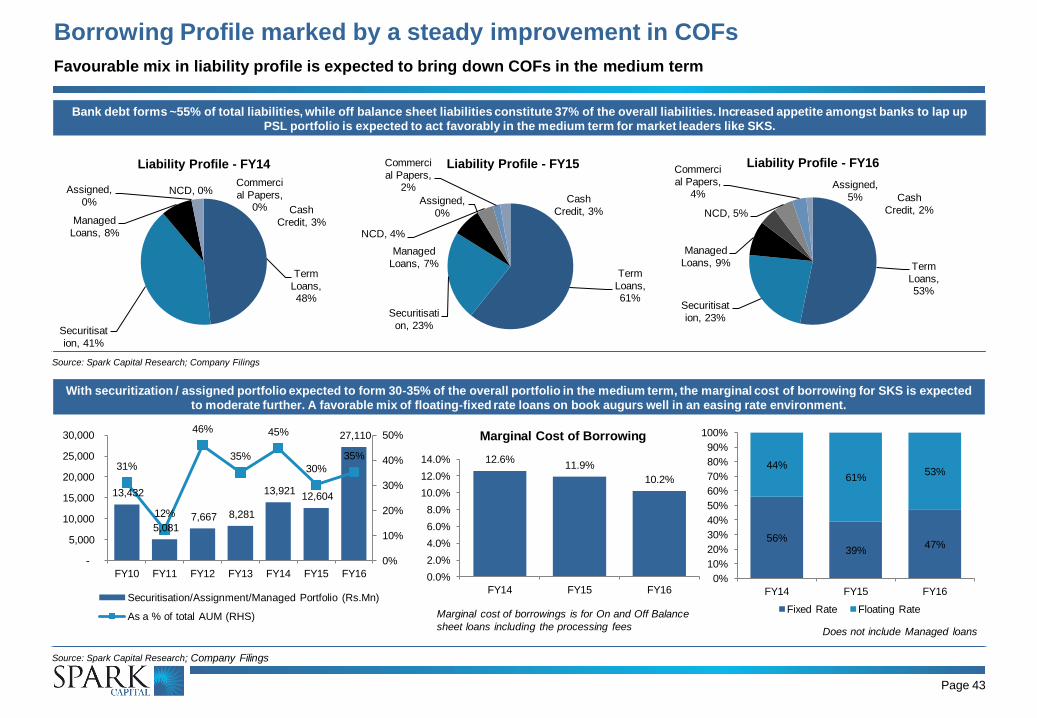
Page 43
Borrowing Profile marked by a steady improvement in COFs
Favourable mix in liability profile is expected to bring down COFs in the medium term
With securitization / assigned portfolio expected to form 30-35% of the overall portfolio in the medium term, the marginal cost of borrowing for SKS is expected
to moderate further. A favorable mix of floating-fixed rate loans on book augurs well in an easing rate environment.
Source: Spark Capital Research; Company Filings
Bank debt forms ~55% of total liabilities, while off balance sheet liabilities constitute 37% of the overall liabilities. Increased appetite amongst banks to lap up
PSL portfolio is expected to act favorably in the medium term for market leaders like SKS.
Source: Spark Capital Research; Company Filings
Term
Loans, 48%
Securitisat
ion, 41%
Managed
Loans, 8%
Assigned,
0% NCD, 0%
Commerci
al Papers, 0% Cash
Credit, 3%
Liability Profile - FY14
Term
Loans, 61%
Securitisati
on, 23%
Managed
Loans, 7%
Assigned,
0%
NCD, 4%
Commerci
al Papers, 2%
Cash
Credit, 3%
Liability Profile - FY15
Term
Loans, 53%
Securitisat
ion, 23%
Managed
Loans, 9%
Assigned,
5%
NCD, 5%
Commerci
al Papers, 4% Cash
Credit, 2%
Liability Profile - FY16
13,432
5,081 7,667 8,281
13,921 12,604
27,110
31%
12%
46%
35%
45%
30%
35%
0%
10%
20%
30%
40%
50%
-
5,000
10,000
15,000
20,000
25,000
30,000
FY10 FY11 FY12 FY13 FY14 FY15 FY16
Securitisation/Assignment/Managed Portfolio (Rs.Mn)
As a % of total AUM (RHS)
12.6% 11.9%
10.2%
0.0%
2.0%
4.0%
6.0%
8.0%
10.0%
12.0%
14.0%
FY14 FY15 FY16
Marginal Cost of Borrowing
56%
39% 47%
44%
61% 53%
0%
10%
20%
30%
40%
50%
60%
70%
80%
90%
100%
FY14 FY15 FY16
Fixed Rate Floating Rate Marginal cost of borrowings is for On and Off Balance
sheet loans including the processing fees Does not include Managed loans
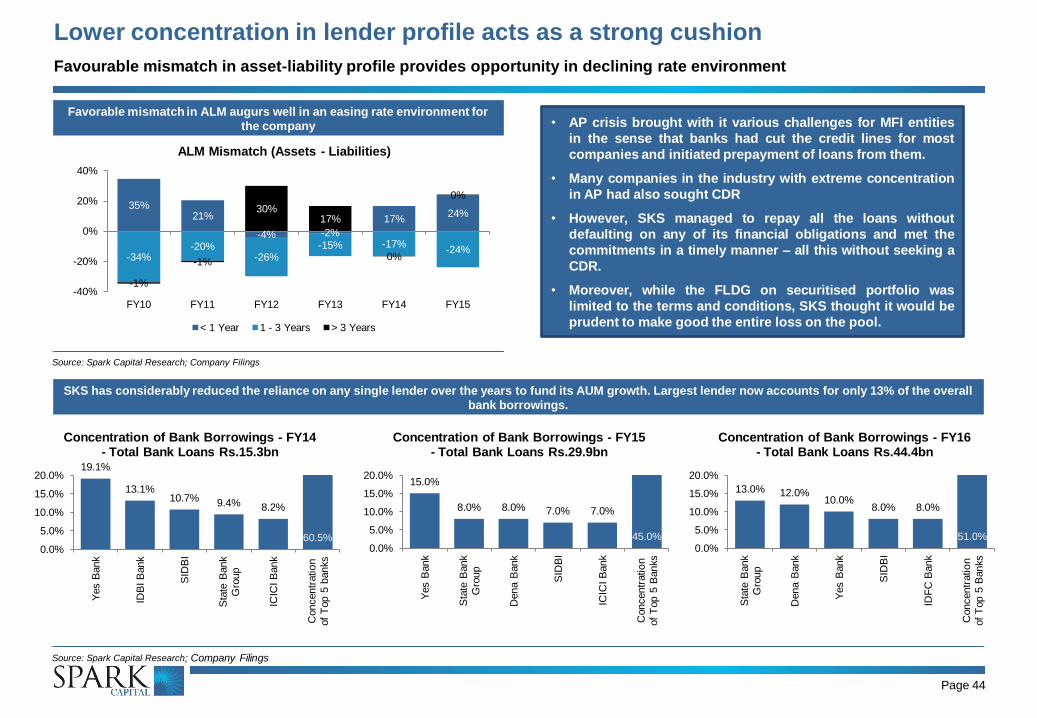
Page 44
Lower concentration in lender profile acts as a strong cushion
Favourable mismatch in asset-liability profile provides opportunity in declining rate environment
SKS has considerably reduced the reliance on any single lender over the years to fund its AUM growth. Largest lender now accounts for only 13% of the overall
bank borrowings.
Source: Spark Capital Research; Company Filings
Favorable mismatch in ALM augurs well in an easing rate environment for
the company
Source: Spark Capital Research; Company Filings
35% 21%
-4% -2%
17% 24%
-34% -20%
-26% -15% -17%
-24%
-1%
-1%
30% 17%
0%
0%
-40%
-20%
0%
20%
40%
FY10 FY11 FY12 FY13 FY14 FY15
ALM Mismatch (Assets - Liabilities)
< 1 Year 1 - 3 Years > 3 Years
• AP crisis brought with it various challenges for MFI entities
in the sense that banks had cut the credit lines for most
companies and initiated prepayment of loans from them.
• Many companies in the industry with extreme concentration
in AP had also sought CDR
• However, SKS managed to repay all the loans without
defaulting on any of its financial obligations and met the
commitments in a timely manner – all this without seeking a
CDR.
• Moreover, while the FLDG on securitised portfolio was
limited to the terms and conditions, SKS thought it would be
prudent to make good the entire loss on the pool.
19.1%
13.1% 10.7% 9.4% 8.2%
60.5% 0.0%
5.0%
10.0%
15.0%
20.0%
Yes B
ank
IDB
I B
ank
SID
BI
Sta
te B
ank
Gro
up
ICIC
I B
ank
Concentr
atio
n
of
Top 5
banks
Concentration of Bank Borrowings - FY14 - Total Bank Loans Rs.15.3bn
15.0%
8.0% 8.0% 7.0% 7.0%
45.0% 0.0%
5.0%
10.0%
15.0%
20.0%
Yes B
ank
Sta
te B
ank
Gro
up
Dena B
ank
SID
BI
ICIC
I B
ank
Concentr
atio
n
of
Top 5
Banks
Concentration of Bank Borrowings - FY15 - Total Bank Loans Rs.29.9bn
13.0% 12.0% 10.0%
8.0% 8.0%
51.0% 0.0%
5.0%
10.0%
15.0%
20.0%
Sta
te B
ank
Gro
up
Dena B
ank
Yes B
ank
SID
BI
IDF
C B
ank
Concentr
atio
n
of
Top 5
Banks
Concentration of Bank Borrowings - FY16 - Total Bank Loans Rs.44.4bn
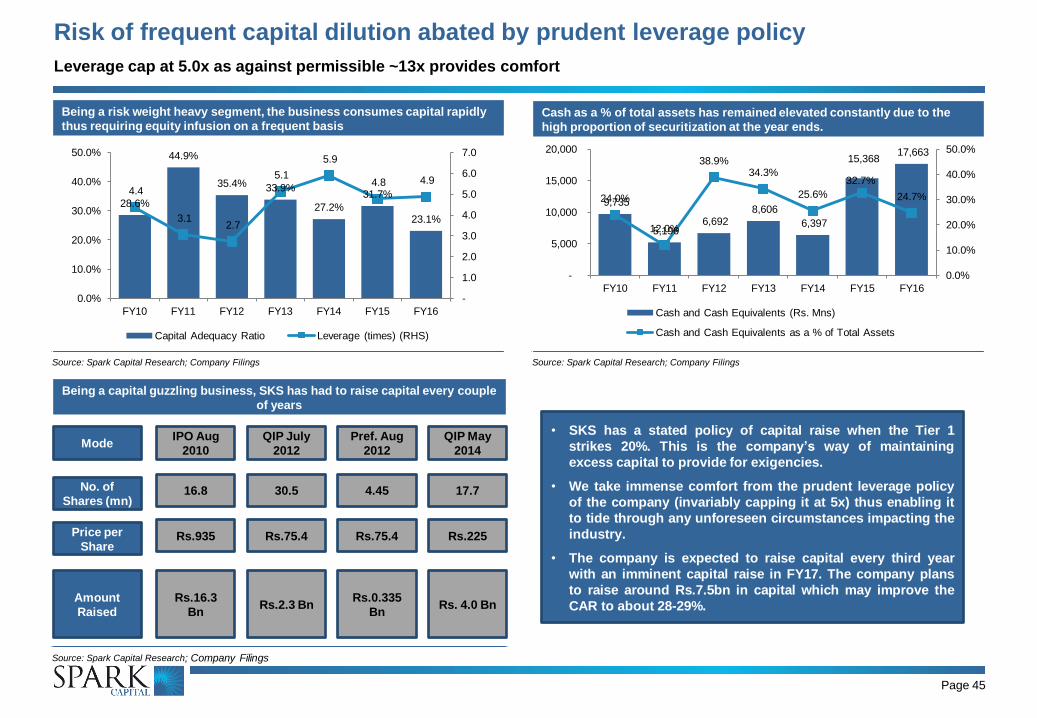
Page 45
Risk of frequent capital dilution abated by prudent leverage policy
Leverage cap at 5.0x as against permissible ~13x provides comfort
Cash as a % of total assets has remained elevated constantly due to the
high proportion of securitization at the year ends.
Source: Spark Capital Research; Company Filings
Being a capital guzzling business, SKS has had to raise capital every couple
of years
Source: Spark Capital Research; Company Filings
Being a risk weight heavy segment, the business consumes capital rapidly
thus requiring equity infusion on a frequent basis
Source: Spark Capital Research; Company Filings
9,735
5,196 6,692
8,606
6,397
15,368 17,663
24.0%
12.0%
38.9% 34.3%
25.6%
32.7%
24.7%
0.0%
10.0%
20.0%
30.0%
40.0%
50.0%
-
5,000
10,000
15,000
20,000
FY10 FY11 FY12 FY13 FY14 FY15 FY16
Cash and Cash Equivalents (Rs. Mns)
Cash and Cash Equivalents as a % of Total Assets
No. of
Shares (mn)
Price per
Share
Amount
Raised
16.8
Rs.935
Rs.16.3
Bn
30.5
Rs.75.4
Rs.2.3 Bn
4.45
Rs.75.4
Rs.0.335
Bn
IPO Aug
2010
QIP July
2012
Pref. Aug
2012 Mode
17.7
Rs.225
Rs. 4.0 Bn
QIP May
2014
• SKS has a stated policy of capital raise when the Tier 1
strikes 20%. This is the company’s way of maintaining
excess capital to provide for exigencies.
• We take immense comfort from the prudent leverage policy
of the company (invariably capping it at 5x) thus enabling it
to tide through any unforeseen circumstances impacting the
industry.
• The company is expected to raise capital every third year
with an imminent capital raise in FY17. The company plans
to raise around Rs.7.5bn in capital which may improve the
CAR to about 28-29%.
28.6%
44.9%
35.4% 33.9%
27.2%
31.7%
23.1%
4.4
3.1 2.7
5.1
5.9
4.8 4.9
-
1.0
2.0
3.0
4.0
5.0
6.0
7.0
0.0%
10.0%
20.0%
30.0%
40.0%
50.0%
FY10 FY11 FY12 FY13 FY14 FY15 FY16
Capital Adequacy Ratio Leverage (times) (RHS)
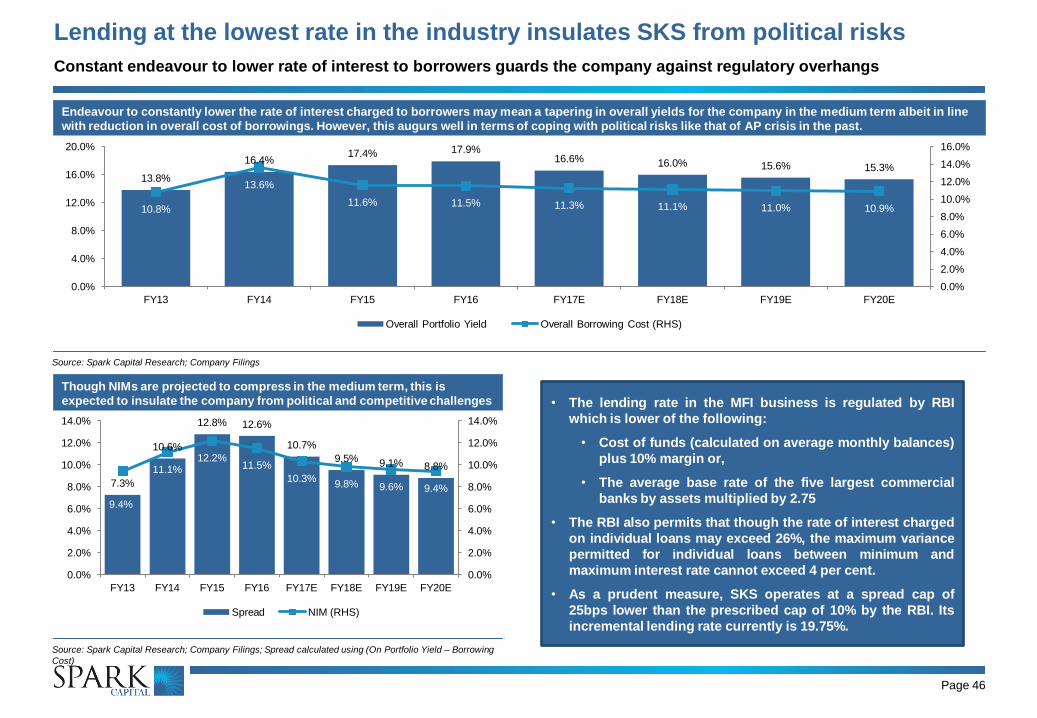
Page 46
Lending at the lowest rate in the industry insulates SKS from political risks
Constant endeavour to lower rate of interest to borrowers guards the company against regulatory overhangs
Though NIMs are projected to compress in the medium term, this is
expected to insulate the company from political and competitive challenges
Source: Spark Capital Research; Company Filings; Spread calculated using (On Portfolio Yield – Borrowing
Cost)
Endeavour to constantly lower the rate of interest charged to borrowers may mean a tapering in overall yields for the company in the medium term albeit in line
with reduction in overall cost of borrowings. However, this augurs well in terms of coping with political risks like that of AP crisis in the past.
Source: Spark Capital Research; Company Filings
13.8%
16.4% 17.4% 17.9%
16.6% 16.0% 15.6% 15.3%
10.8%
13.6%
11.6% 11.5% 11.3% 11.1% 11.0% 10.9%
0.0%
2.0%
4.0%
6.0%
8.0%
10.0%
12.0%
14.0%
16.0%
0.0%
4.0%
8.0%
12.0%
16.0%
20.0%
FY13 FY14 FY15 FY16 FY17E FY18E FY19E FY20E
Overall Portfolio Yield Overall Borrowing Cost (RHS)
7.3%
10.6%
12.8% 12.6%
10.7%
9.5% 9.1% 8.8%
9.4%
11.1% 12.2%
11.5%
10.3% 9.8% 9.6% 9.4%
0.0%
2.0%
4.0%
6.0%
8.0%
10.0%
12.0%
14.0%
0.0%
2.0%
4.0%
6.0%
8.0%
10.0%
12.0%
14.0%
FY13 FY14 FY15 FY16 FY17E FY18E FY19E FY20E
Spread NIM (RHS)
• The lending rate in the MFI business is regulated by RBI
which is lower of the following:
• Cost of funds (calculated on average monthly balances)
plus 10% margin or,
• The average base rate of the five largest commercial
banks by assets multiplied by 2.75
• The RBI also permits that though the rate of interest charged
on individual loans may exceed 26%, the maximum variance
permitted for individual loans between minimum and
maximum interest rate cannot exceed 4 per cent.
• As a prudent measure, SKS operates at a spread cap of
25bps lower than the prescribed cap of 10% by the RBI. Its
incremental lending rate currently is 19.75%.
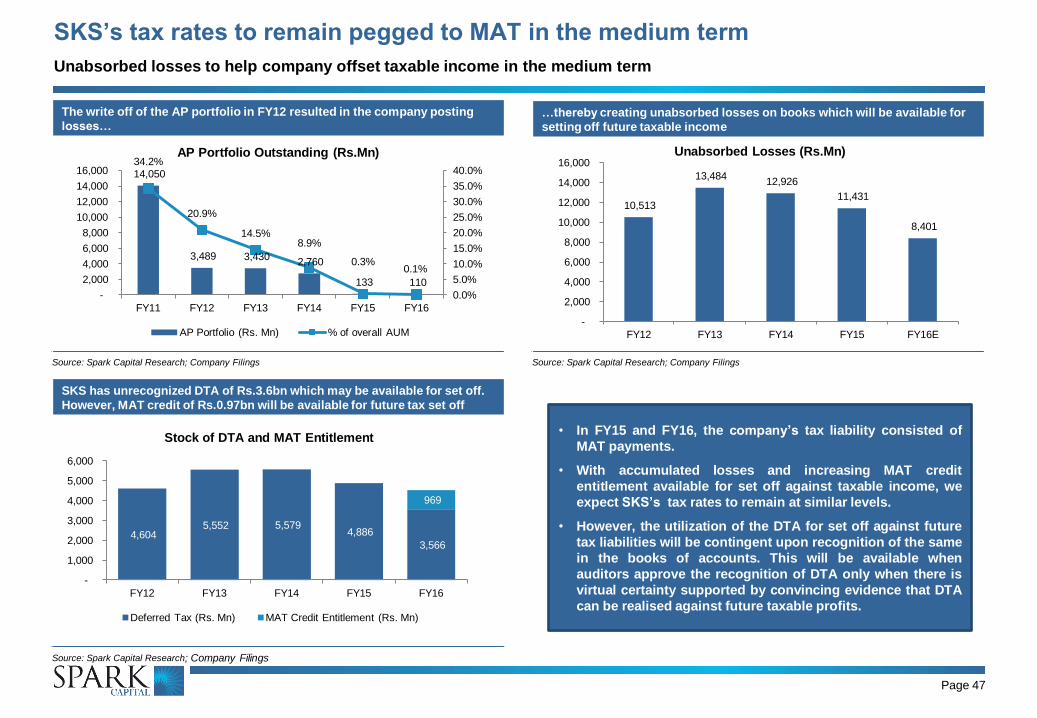
Page 47
SKS’s tax rates to remain pegged to MAT in the medium term
Unabsorbed losses to help company offset taxable income in the medium term
…thereby creating unabsorbed losses on books which will be available for
setting off future taxable income
Source: Spark Capital Research; Company Filings
SKS has unrecognized DTA of Rs.3.6bn which may be available for set off.
However, MAT credit of Rs.0.97bn will be available for future tax set off
Source: Spark Capital Research; Company Filings
The write off of the AP portfolio in FY12 resulted in the company posting
losses…
Source: Spark Capital Research; Company Filings
14,050
3,489 3,430 2,760
133 110
34.2%
20.9%
14.5% 8.9%
0.3% 0.1%
0.0%
5.0%
10.0%
15.0%
20.0%
25.0%
30.0%
35.0%
40.0%
-
2,000
4,000
6,000
8,000
10,000
12,000
14,000
16,000
FY11 FY12 FY13 FY14 FY15 FY16
AP Portfolio Outstanding (Rs.Mn)
AP Portfolio (Rs. Mn) % of overall AUM
10,513
13,484 12,926
11,431
8,401
-
2,000
4,000
6,000
8,000
10,000
12,000
14,000
16,000
FY12 FY13 FY14 FY15 FY16E
Unabsorbed Losses (Rs.Mn)
• In FY15 and FY16, the company’s tax liability consisted of
MAT payments.
• With accumulated losses and increasing MAT credit
entitlement available for set off against taxable income, we
expect SKS’s tax rates to remain at similar levels.
• However, the utilization of the DTA for set off against future
tax liabilities will be contingent upon recognition of the same
in the books of accounts. This will be available when
auditors approve the recognition of DTA only when there is
virtual certainty supported by convincing evidence that DTA
can be realised against future taxable profits.
4,604 5,552 5,579
4,886
3,566
969
-
1,000
2,000
3,000
4,000
5,000
6,000
FY12 FY13 FY14 FY15 FY16
Stock of DTA and MAT Entitlement
Deferred Tax (Rs. Mn) MAT Credit Entitlement (Rs. Mn)
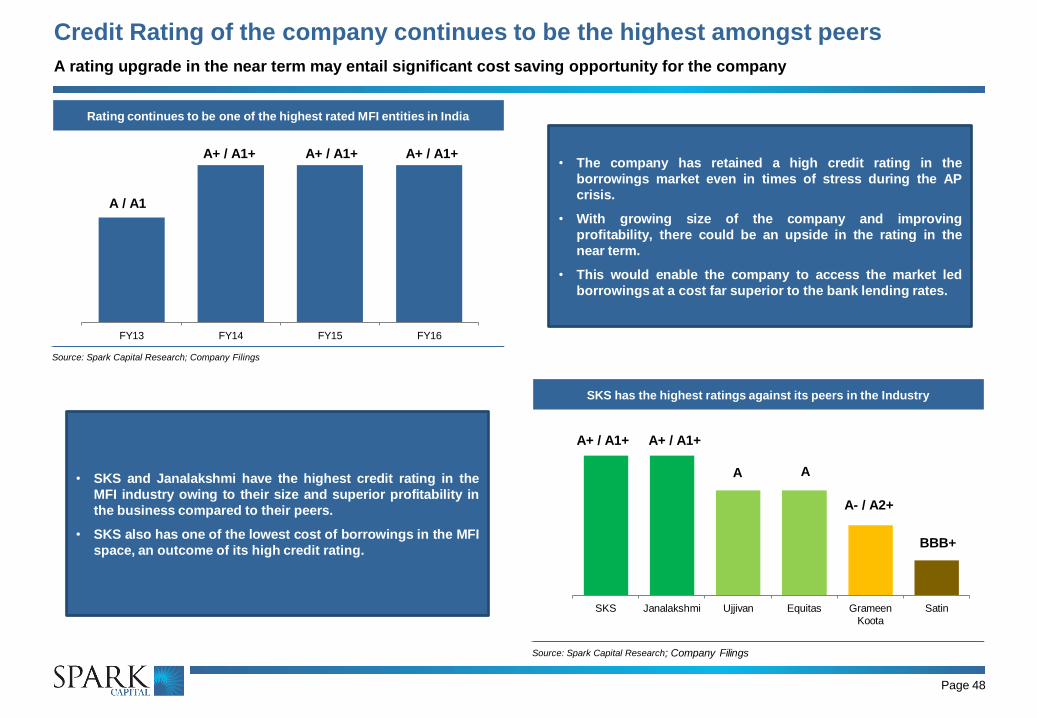
Page 48
Credit Rating of the company continues to be the highest amongst peers
A rating upgrade in the near term may entail significant cost saving opportunity for the company
SKS has the highest ratings against its peers in the Industry
Source: Spark Capital Research; Company Filings
Rating continues to be one of the highest rated MFI entities in India
Source: Spark Capital Research; Company Filings
FY13 FY14 FY15 FY16
SKS Janalakshmi Ujjivan Equitas Grameen
Koota
Satin
A / A1
A+ / A1+ A+ / A1+ A+ / A1+
A+ / A1+ A+ / A1+
A A
A- / A2+
BBB+
• The company has retained a high credit rating in the
borrowings market even in times of stress during the AP
crisis.
• With growing size of the company and improving
profitability, there could be an upside in the rating in the
near term.
• This would enable the company to access the market led
borrowings at a cost far superior to the bank lending rates.
• SKS and Janalakshmi have the highest credit rating in the
MFI industry owing to their size and superior profitability in
the business compared to their peers.
• SKS also has one of the lowest cost of borrowings in the MFI
space, an outcome of its high credit rating.
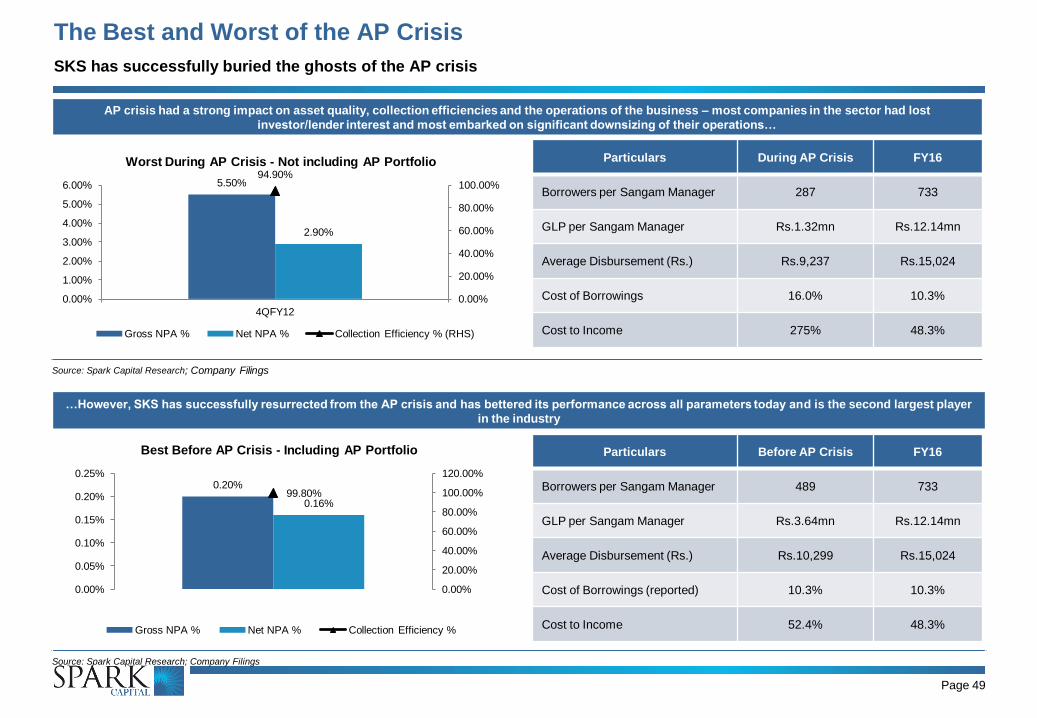
Page 49
The Best and Worst of the AP Crisis
SKS has successfully buried the ghosts of the AP crisis
AP crisis had a strong impact on asset quality, collection efficiencies and the operations of the business – most companies in the sector had lost
investor/lender interest and most embarked on significant downsizing of their operations…
Source: Spark Capital Research; Company Filings
5.50%
2.90%
94.90%
0.00%
20.00%
40.00%
60.00%
80.00%
100.00%
0.00%
1.00%
2.00%
3.00%
4.00%
5.00%
6.00%
4QFY12
Worst During AP Crisis - Not including AP Portfolio
Gross NPA % Net NPA % Collection Efficiency % (RHS)
Particulars During AP Crisis FY16
Borrowers per Sangam Manager 287 733
GLP per Sangam Manager Rs.1.32mn Rs.12.14mn
Average Disbursement (Rs.) Rs.9,237 Rs.15,024
Cost of Borrowings 16.0% 10.3%
Cost to Income 275% 48.3%
…However, SKS has successfully resurrected from the AP crisis and has bettered its performance across all parameters today and is the second largest player
in the industry
Source: Spark Capital Research; Company Filings
0.20%
0.16% 99.80%
0.00%
20.00%
40.00%
60.00%
80.00%
100.00%
120.00%
0.00%
0.05%
0.10%
0.15%
0.20%
0.25%
Best Before AP Crisis - Including AP Portfolio
Gross NPA % Net NPA % Collection Efficiency %
Particulars Before AP Crisis FY16
Borrowers per Sangam Manager 489 733
GLP per Sangam Manager Rs.3.64mn Rs.12.14mn
Average Disbursement (Rs.) Rs.10,299 Rs.15,024
Cost of Borrowings (reported) 10.3% 10.3%
Cost to Income 52.4% 48.3%
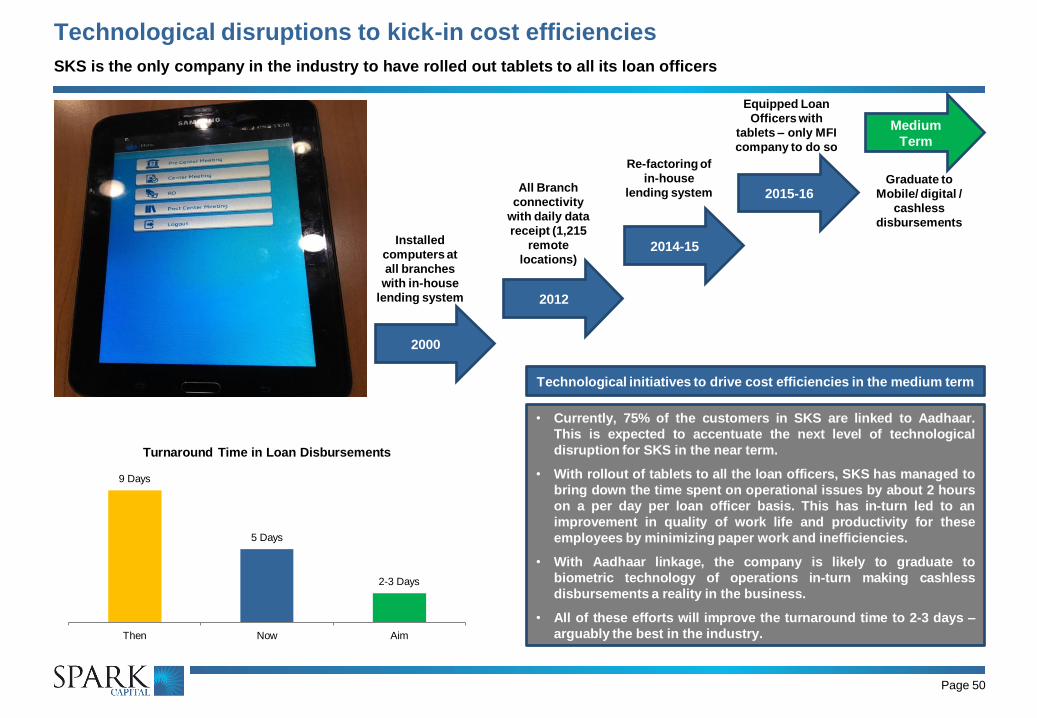
Page 50
Technological disruptions to kick-in cost efficiencies
SKS is the only company in the industry to have rolled out tablets to all its loan officers
2000
2012
2014-15
2015-16
Medium
Term
Installed
computers at
all branches
with in-house
lending system
All Branch
connectivity
with daily data
receipt (1,215
remote
locations)
Re-factoring of
in-house
lending system
Equipped Loan
Officers with
tablets – only MFI
company to do so
Graduate to
Mobile/ digital /
cashless
disbursements
9 Days
5 Days
2-3 Days
Then Now Aim
Turnaround Time in Loan Disbursements
• Currently, 75% of the customers in SKS are linked to Aadhaar.
This is expected to accentuate the next level of technological
disruption for SKS in the near term.
• With rollout of tablets to all the loan officers, SKS has managed to
bring down the time spent on operational issues by about 2 hours
on a per day per loan officer basis. This has in-turn led to an
improvement in quality of work life and productivity for these
employees by minimizing paper work and inefficiencies.
• With Aadhaar linkage, the company is likely to graduate to
biometric technology of operations in-turn making cashless
disbursements a reality in the business.
• All of these efforts will improve the turnaround time to 2-3 days –
arguably the best in the industry.
Technological initiatives to drive cost efficiencies in the medium term
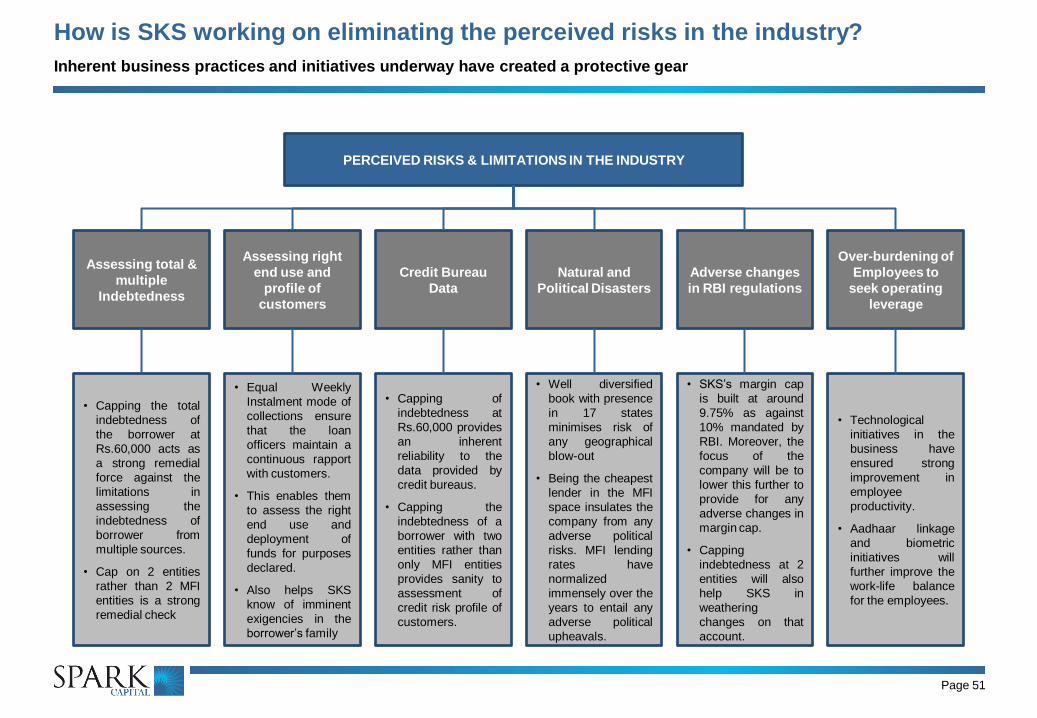
Page 51
How is SKS working on eliminating the perceived risks in the industry?
Inherent business practices and initiatives underway have created a protective gear
PERCEIVED RISKS & LIMITATIONS IN THE INDUSTRY
Assessing total &
multiple
Indebtedness
Assessing right
end use and
profile of
customers
Credit Bureau
Data
Natural and
Political Disasters
Adverse changes
in RBI regulations
Over-burdening of
Employees to
seek operating
leverage
• Capping the total
indebtedness of
the borrower at
Rs.60,000 acts as
a strong remedial
force against the
limitations in
assessing the
indebtedness of
borrower from
multiple sources.
• Cap on 2 entities
rather than 2 MFI
entities is a strong
remedial check
• Equal Weekly
Instalment mode of
collections ensure
that the loan
officers maintain a
continuous rapport
with customers.
• This enables them
to assess the right
end use and
deployment of
funds for purposes
declared.
• Also helps SKS
know of imminent
exigencies in the
borrower’s family
• Capping of
indebtedness at
Rs.60,000 provides
an inherent
reliability to the
data provided by
credit bureaus.
• Capping the
indebtedness of a
borrower with two
entities rather than
only MFI entities
provides sanity to
assessment of
credit risk profile of
customers.
• Well diversified
book with presence
in 17 states
minimises risk of
any geographical
blow-out
• Being the cheapest
lender in the MFI
space insulates the
company from any
adverse political
risks. MFI lending
rates have
normalized
immensely over the
years to entail any
adverse political
upheavals.
• SKS’s margin cap
is built at around
9.75% as against
10% mandated by
RBI. Moreover, the
focus of the
company will be to
lower this further to
provide for any
adverse changes in
margin cap.
• Capping
indebtedness at 2
entities will also
help SKS in
weathering
changes on that
account.
• Technological
initiatives in the
business have
ensured strong
improvement in
employee
productivity.
• Aadhaar linkage
and biometric
initiatives will
further improve the
work-life balance
for the employees.
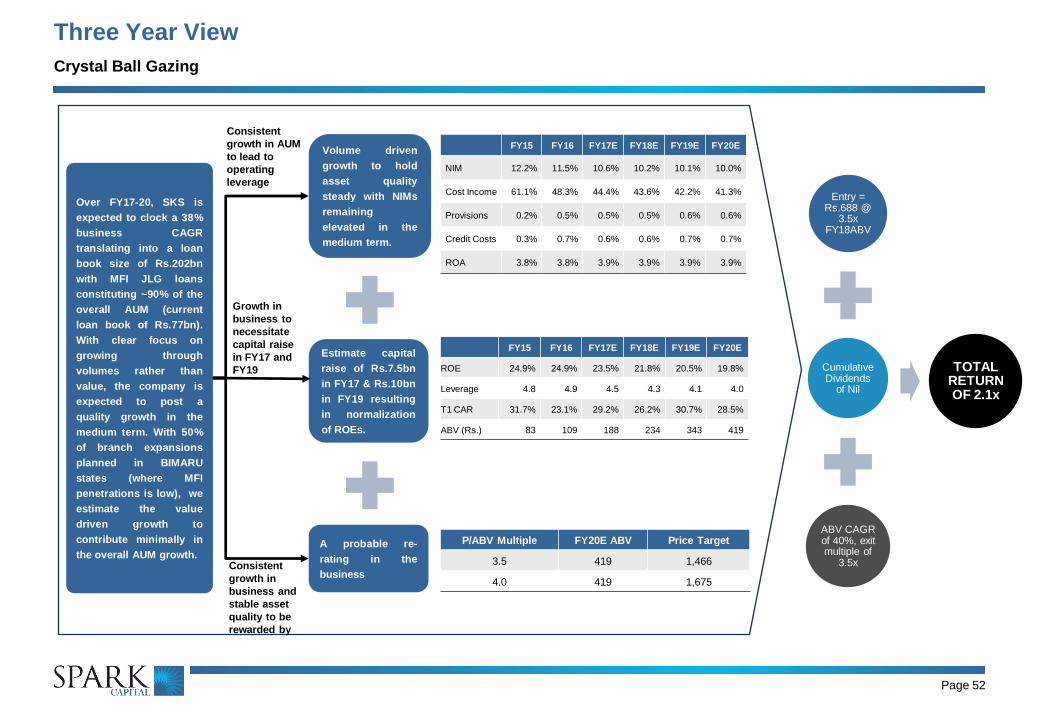
Page 52
Three Year View
Crystal Ball Gazing
Over FY17-20, SKS is
expected to clock a 38%
business CAGR
translating into a loan
book size of Rs.202bn
with MFI JLG loans
constituting ~90% of the
overall AUM (current
loan book of Rs.77bn).
With clear focus on
growing through
volumes rather than
value, the company is
expected to post a
quality growth in the
medium term. With 50%
of branch expansions
planned in BIMARU
states (where MFI
penetrations is low), we
estimate the value
driven growth to
contribute minimally in
the overall AUM growth. A probable re-
rating in the
business
Estimate capital
raise of Rs.7.5bn
in FY17 & Rs.10bn
in FY19 resulting
in normalization
of ROEs.
Volume driven
growth to hold
asset quality
steady with NIMs
remaining
elevated in the
medium term.
Consistent
growth in AUM
to lead to
operating
leverage
Growth in
business to
necessitate
capital raise
in FY17 and
FY19
Consistent
growth in
business and
stable asset
quality to be
rewarded by
Entry = Rs.688 @
3.5x FY18ABV
Cumulative Dividends
of Nil
ABV CAGR of 40%, exit multiple of
3.5x
TOTAL RETURN OF 2.1x
FY15 FY16 FY17E FY18E FY19E FY20E
NIM 12.2% 11.5% 10.6% 10.2% 10.1% 10.0%
Cost Income 61.1% 48.3% 44.4% 43.6% 42.2% 41.3%
Provisions 0.2% 0.5% 0.5% 0.5% 0.6% 0.6%
Credit Costs 0.3% 0.7% 0.6% 0.6% 0.7% 0.7%
ROA 3.8% 3.8% 3.9% 3.9% 3.9% 3.9%
FY15 FY16 FY17E FY18E FY19E FY20E
ROE 24.9% 24.9% 23.5% 21.8% 20.5% 19.8%
Leverage 4.8 4.9 4.5 4.3 4.1 4.0
T1 CAR 31.7% 23.1% 29.2% 26.2% 30.7% 28.5%
ABV (Rs.) 83 109 188 234 343 419
P/ABV Multiple FY20E ABV Price Target
3.5 419 1,466
4.0 419 1,675
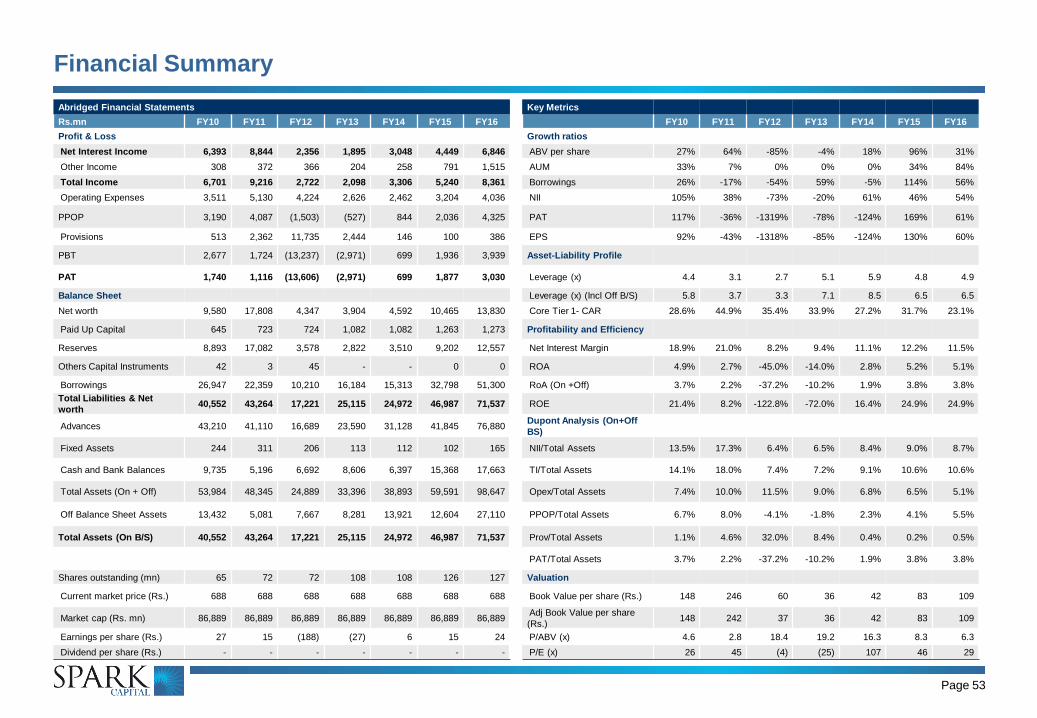
Page 53
Financial Summary
Abridged Financial Statements Key Metrics
Rs.mn FY10 FY11 FY12 FY13 FY14 FY15 FY16 FY10 FY11 FY12 FY13 FY14 FY15 FY16
Profit & Loss Growth ratios
Net Interest Income 6,393 8,844 2,356 1,895 3,048 4,449 6,846 ABV per share 27% 64% -85% -4% 18% 96% 31%
Other Income 308 372 366 204 258 791 1,515 AUM 33% 7% 0% 0% 0% 34% 84%
Total Income 6,701 9,216 2,722 2,098 3,306 5,240 8,361 Borrowings 26% -17% -54% 59% -5% 114% 56%
Operating Expenses 3,511 5,130 4,224 2,626 2,462 3,204 4,036 NII 105% 38% -73% -20% 61% 46% 54%
PPOP 3,190 4,087 (1,503) (527) 844 2,036 4,325 PAT 117% -36% -1319% -78% -124% 169% 61%
Provisions 513 2,362 11,735 2,444 146 100 386 EPS 92% -43% -1318% -85% -124% 130% 60%
PBT 2,677 1,724 (13,237) (2,971) 699 1,936 3,939 Asset-Liability Profile
PAT 1,740 1,116 (13,606) (2,971) 699 1,877 3,030 Leverage (x) 4.4 3.1 2.7 5.1 5.9 4.8 4.9
Balance Sheet Leverage (x) (Incl Off B/S) 5.8 3.7 3.3 7.1 8.5 6.5 6.5
Net worth 9,580 17,808 4,347 3,904 4,592 10,465 13,830 Core Tier 1- CAR 28.6% 44.9% 35.4% 33.9% 27.2% 31.7% 23.1%
Paid Up Capital 645 723 724 1,082 1,082 1,263 1,273 Profitability and Efficiency
Reserves 8,893 17,082 3,578 2,822 3,510 9,202 12,557 Net Interest Margin 18.9% 21.0% 8.2% 9.4% 11.1% 12.2% 11.5%
Others Capital Instruments 42 3 45 - - 0 0 ROA 4.9% 2.7% -45.0% -14.0% 2.8% 5.2% 5.1%
Borrowings 26,947 22,359 10,210 16,184 15,313 32,798 51,300 RoA (On +Off) 3.7% 2.2% -37.2% -10.2% 1.9% 3.8% 3.8%
Total Liabilities & Net
worth 40,552 43,264 17,221 25,115 24,972 46,987 71,537 ROE 21.4% 8.2% -122.8% -72.0% 16.4% 24.9% 24.9%
Advances 43,210 41,110 16,689 23,590 31,128 41,845 76,880 Dupont Analysis (On+Off
BS)
Fixed Assets 244 311 206 113 112 102 165 NII/Total Assets 13.5% 17.3% 6.4% 6.5% 8.4% 9.0% 8.7%
Cash and Bank Balances 9,735 5,196 6,692 8,606 6,397 15,368 17,663 TI/Total Assets 14.1% 18.0% 7.4% 7.2% 9.1% 10.6% 10.6%
Total Assets (On + Off) 53,984 48,345 24,889 33,396 38,893 59,591 98,647 Opex/Total Assets 7.4% 10.0% 11.5% 9.0% 6.8% 6.5% 5.1%
Off Balance Sheet Assets 13,432 5,081 7,667 8,281 13,921 12,604 27,110 PPOP/Total Assets 6.7% 8.0% -4.1% -1.8% 2.3% 4.1% 5.5%
Total Assets (On B/S) 40,552 43,264 17,221 25,115 24,972 46,987 71,537 Prov/Total Assets 1.1% 4.6% 32.0% 8.4% 0.4% 0.2% 0.5%
PAT/Total Assets 3.7% 2.2% -37.2% -10.2% 1.9% 3.8% 3.8%
Shares outstanding (mn) 65 72 72 108 108 126 127 Valuation
Current market price (Rs.) 688 688 688 688 688 688 688 Book Value per share (Rs.) 148 246 60 36 42 83 109
Market cap (Rs. mn) 86,889 86,889 86,889 86,889 86,889 86,889 86,889 Adj Book Value per share
(Rs.) 148 242 37 36 42 83 109
Earnings per share (Rs.) 27 15 (188) (27) 6 15 24 P/ABV (x) 4.6 2.8 18.4 19.2 16.3 8.3 6.3
Dividend per share (Rs.) - - - - - - - P/E (x) 26 45 (4) (25) 107 46 29
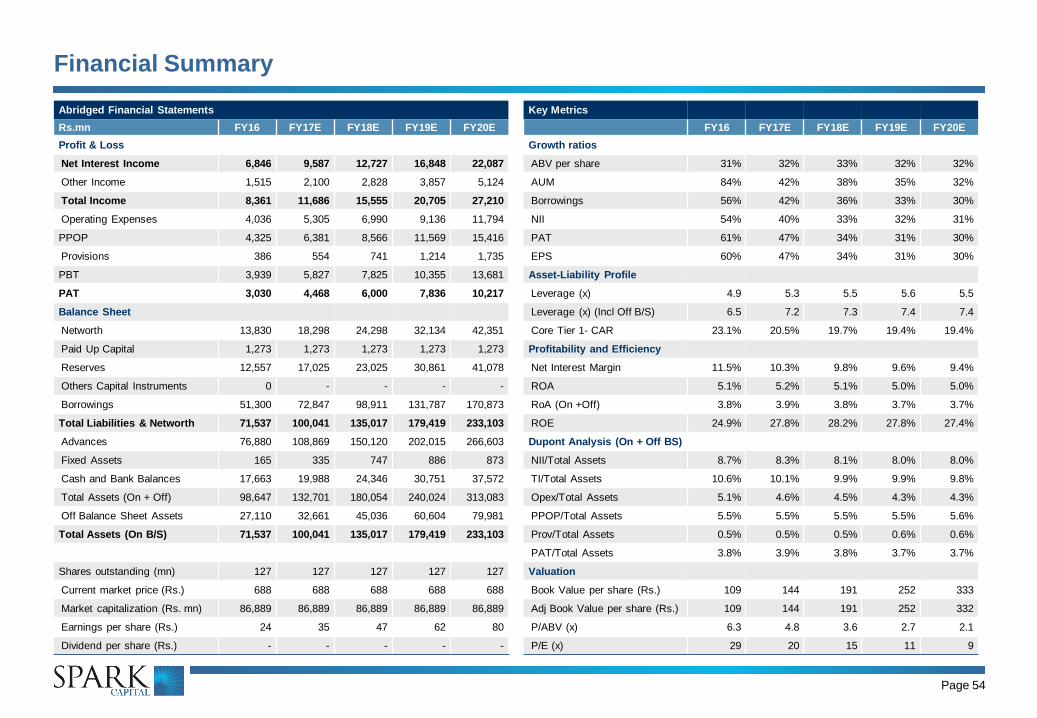
Page 54
Financial Summary
Abridged Financial Statements Key Metrics
Rs.mn FY16 FY17E FY18E FY19E FY20E FY16 FY17E FY18E FY19E FY20E
Profit & Loss Growth ratios
Net Interest Income 6,846 9,587 12,727 16,848 22,087 ABV per share 31% 32% 33% 32% 32%
Other Income 1,515 2,100 2,828 3,857 5,124 AUM 84% 42% 38% 35% 32%
Total Income 8,361 11,686 15,555 20,705 27,210 Borrowings 56% 42% 36% 33% 30%
Operating Expenses 4,036 5,305 6,990 9,136 11,794 NII 54% 40% 33% 32% 31%
PPOP 4,325 6,381 8,566 11,569 15,416 PAT 61% 47% 34% 31% 30%
Provisions 386 554 741 1,214 1,735 EPS 60% 47% 34% 31% 30%
PBT 3,939 5,827 7,825 10,355 13,681 Asset-Liability Profile
PAT 3,030 4,468 6,000 7,836 10,217 Leverage (x) 4.9 5.3 5.5 5.6 5.5
Balance Sheet Leverage (x) (Incl Off B/S) 6.5 7.2 7.3 7.4 7.4
Networth 13,830 18,298 24,298 32,134 42,351 Core Tier 1- CAR 23.1% 20.5% 19.7% 19.4% 19.4%
Paid Up Capital 1,273 1,273 1,273 1,273 1,273 Profitability and Efficiency
Reserves 12,557 17,025 23,025 30,861 41,078 Net Interest Margin 11.5% 10.3% 9.8% 9.6% 9.4%
Others Capital Instruments 0 - - - - ROA 5.1% 5.2% 5.1% 5.0% 5.0%
Borrowings 51,300 72,847 98,911 131,787 170,873 RoA (On +Off) 3.8% 3.9% 3.8% 3.7% 3.7%
Total Liabilities & Networth 71,537 100,041 135,017 179,419 233,103 ROE 24.9% 27.8% 28.2% 27.8% 27.4%
Advances 76,880 108,869 150,120 202,015 266,603 Dupont Analysis (On + Off BS)
Fixed Assets 165 335 747 886 873 NII/Total Assets 8.7% 8.3% 8.1% 8.0% 8.0%
Cash and Bank Balances 17,663 19,988 24,346 30,751 37,572 TI/Total Assets 10.6% 10.1% 9.9% 9.9% 9.8%
Total Assets (On + Off) 98,647 132,701 180,054 240,024 313,083 Opex/Total Assets 5.1% 4.6% 4.5% 4.3% 4.3%
Off Balance Sheet Assets 27,110 32,661 45,036 60,604 79,981 PPOP/Total Assets 5.5% 5.5% 5.5% 5.5% 5.6%
Total Assets (On B/S) 71,537 100,041 135,017 179,419 233,103 Prov/Total Assets 0.5% 0.5% 0.5% 0.6% 0.6%
PAT/Total Assets 3.8% 3.9% 3.8% 3.7% 3.7%
Shares outstanding (mn) 127 127 127 127 127 Valuation
Current market price (Rs.) 688 688 688 688 688 Book Value per share (Rs.) 109 144 191 252 333
Market capitalization (Rs. mn) 86,889 86,889 86,889 86,889 86,889 Adj Book Value per share (Rs.) 109 144 191 252 332
Earnings per share (Rs.) 24 35 47 62 80 P/ABV (x) 6.3 4.8 3.6 2.7 2.1
Dividend per share (Rs.) - - - - - P/E (x) 29 20 15 11 9
Page 55
Annexures
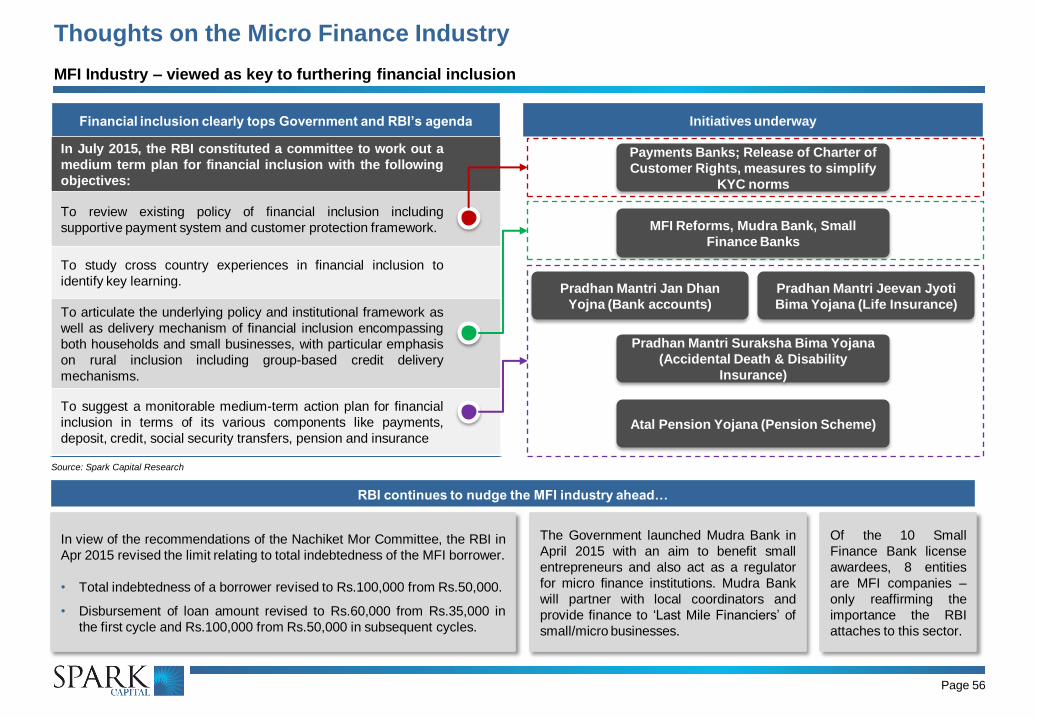
Page 56
Thoughts on the Micro Finance Industry
MFI Industry – viewed as key to furthering financial inclusion
RBI continues to nudge the MFI industry ahead…
In view of the recommendations of the Nachiket Mor Committee, the RBI in
Apr 2015 revised the limit relating to total indebtedness of the MFI borrower.
• Total indebtedness of a borrower revised to Rs.100,000 from Rs.50,000.
• Disbursement of loan amount revised to Rs.60,000 from Rs.35,000 in
the first cycle and Rs.100,000 from Rs.50,000 in subsequent cycles.
The Government launched Mudra Bank in
April 2015 with an aim to benefit small
entrepreneurs and also act as a regulator
for micro finance institutions. Mudra Bank
will partner with local coordinators and
provide finance to ‘Last Mile Financiers’ of
small/micro businesses.
Of the 10 Small
Finance Bank license
awardees, 8 entities
are MFI companies –
only reaffirming the
importance the RBI
attaches to this sector.
Initiatives underway Financial inclusion clearly tops Government and RBI’s agenda
Source: Spark Capital Research
In July 2015, the RBI constituted a committee to work out a
medium term plan for financial inclusion with the following
objectives:
To review existing policy of financial inclusion including
supportive payment system and customer protection framework.
To study cross country experiences in financial inclusion to
identify key learning.
To articulate the underlying policy and institutional framework as
well as delivery mechanism of financial inclusion encompassing
both households and small businesses, with particular emphasis
on rural inclusion including group-based credit delivery
mechanisms.
To suggest a monitorable medium-term action plan for financial
inclusion in terms of its various components like payments,
deposit, credit, social security transfers, pension and insurance
Payments Banks; Release of Charter of
Customer Rights, measures to simplify
KYC norms
Pradhan Mantri Suraksha Bima Yojana
(Accidental Death & Disability
Insurance)
MFI Reforms, Mudra Bank, Small
Finance Banks
Pradhan Mantri Jan Dhan
Yojna (Bank accounts)
Pradhan Mantri Jeevan Jyoti
Bima Yojana (Life Insurance)
Atal Pension Yojana (Pension Scheme)
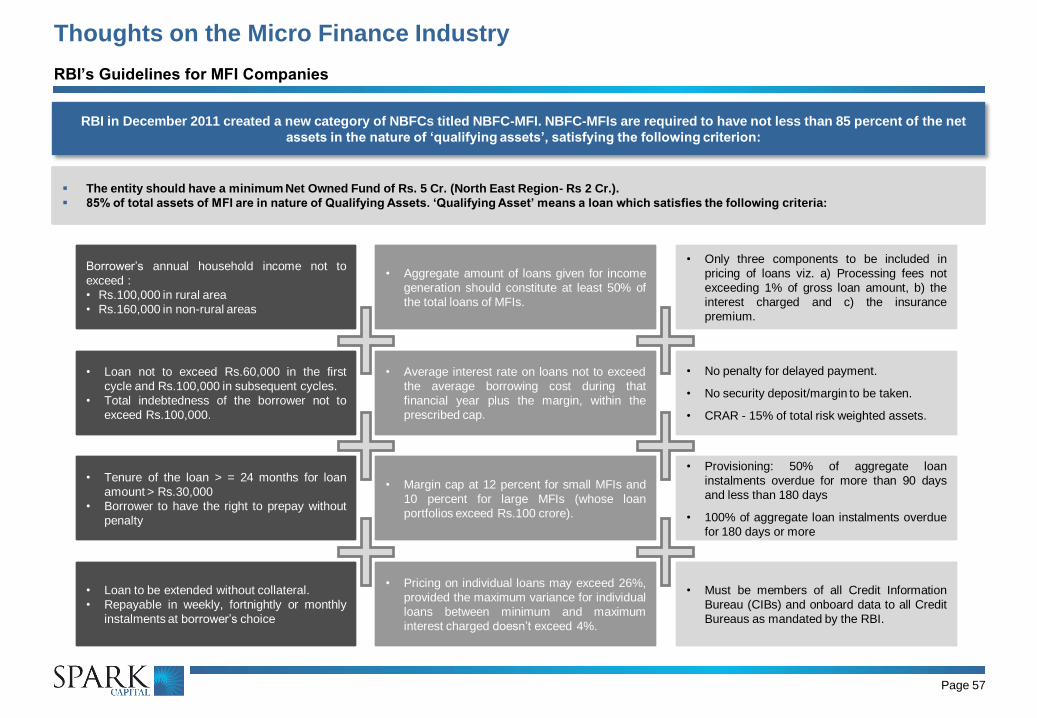
Page 57
Thoughts on the Micro Finance Industry
RBI’s Guidelines for MFI Companies
RBI in December 2011 created a new category of NBFCs titled NBFC-MFI. NBFC-MFIs are required to have not less than 85 percent of the net
assets in the nature of ‘qualifying assets’, satisfying the following criterion:
The entity should have a minimum Net Owned Fund of Rs. 5 Cr. (North East Region- Rs 2 Cr.).
85% of total assets of MFI are in nature of Qualifying Assets. ‘Qualifying Asset’ means a loan which satisfies the following criteria:
Borrower’s annual household income not to
exceed :
• Rs.100,000 in rural area
• Rs.160,000 in non-rural areas
• Aggregate amount of loans given for income
generation should constitute at least 50% of
the total loans of MFIs.
• Only three components to be included in
pricing of loans viz. a) Processing fees not
exceeding 1% of gross loan amount, b) the
interest charged and c) the insurance
premium.
• Loan not to exceed Rs.60,000 in the first
cycle and Rs.100,000 in subsequent cycles.
• Total indebtedness of the borrower not to
exceed Rs.100,000.
• Average interest rate on loans not to exceed
the average borrowing cost during that
financial year plus the margin, within the
prescribed cap.
• No penalty for delayed payment.
• No security deposit/margin to be taken.
• CRAR - 15% of total risk weighted assets.
• Tenure of the loan > = 24 months for loan
amount > Rs.30,000
• Borrower to have the right to prepay without
penalty
• Margin cap at 12 percent for small MFIs and
10 percent for large MFIs (whose loan
portfolios exceed Rs.100 crore).
• Provisioning: 50% of aggregate loan
instalments overdue for more than 90 days
and less than 180 days
• 100% of aggregate loan instalments overdue
for 180 days or more
• Loan to be extended without collateral.
• Repayable in weekly, fortnightly or monthly
instalments at borrower’s choice
• Pricing on individual loans may exceed 26%,
provided the maximum variance for individual
loans between minimum and maximum
interest charged doesn’t exceed 4%.
• Must be members of all Credit Information
Bureau (CIBs) and onboard data to all Credit
Bureaus as mandated by the RBI.
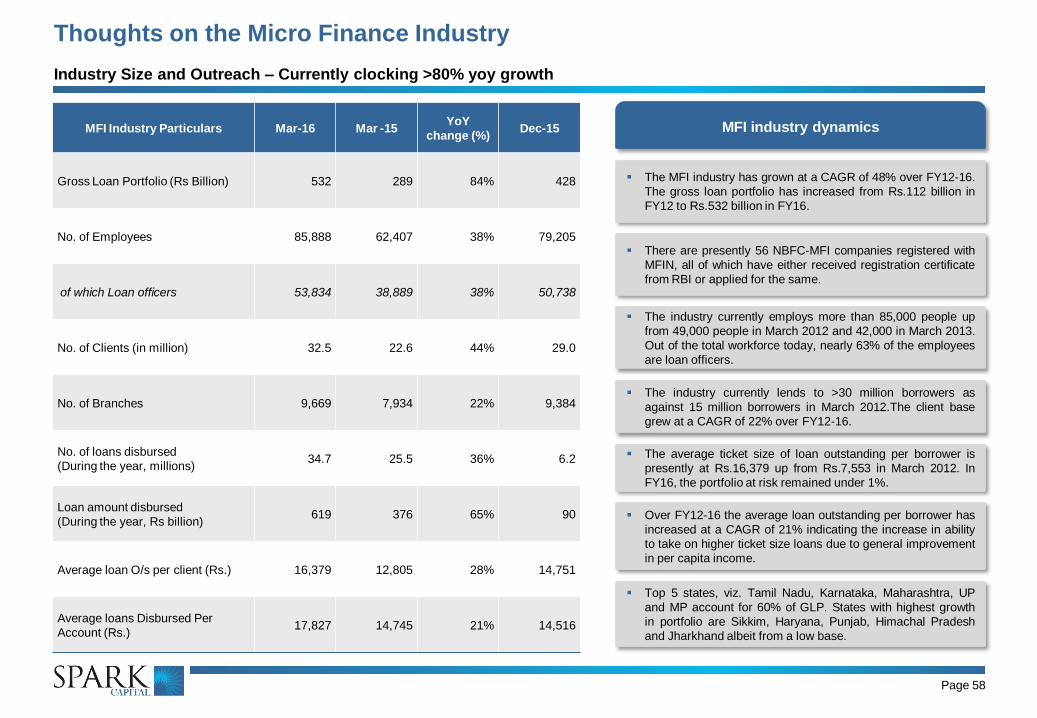
Thoughts on the Micro Finance Industry
Page 58
MFI Industry Particulars Mar-16 Mar -15 YoY
change (%) Dec-15
Gross Loan Portfolio (Rs Billion) 532 289 84% 428
No. of Employees 85,888 62,407 38% 79,205
of which Loan officers 53,834 38,889 38% 50,738
No. of Clients (in million) 32.5 22.6 44% 29.0
No. of Branches 9,669 7,934 22% 9,384
No. of loans disbursed
(During the year, millions) 34.7 25.5 36% 6.2
Loan amount disbursed
(During the year, Rs billion) 619 376 65% 90
Average loan O/s per client (Rs.) 16,379 12,805 28% 14,751
Average loans Disbursed Per
Account (Rs.) 17,827 14,745 21% 14,516
The MFI industry has grown at a CAGR of 48% over FY12-16.
The gross loan portfolio has increased from Rs.112 billion in
FY12 to Rs.532 billion in FY16.
MFI industry dynamics
Industry Size and Outreach – Currently clocking >80% yoy growth
There are presently 56 NBFC-MFI companies registered with
MFIN, all of which have either received registration certificate
from RBI or applied for the same.
The industry currently employs more than 85,000 people up
from 49,000 people in March 2012 and 42,000 in March 2013.
Out of the total workforce today, nearly 63% of the employees
are loan officers.
The industry currently lends to >30 million borrowers as
against 15 million borrowers in March 2012.The client base
grew at a CAGR of 22% over FY12-16.
The average ticket size of loan outstanding per borrower is
presently at Rs.16,379 up from Rs.7,553 in March 2012. In
FY16, the portfolio at risk remained under 1%.
Over FY12-16 the average loan outstanding per borrower has
increased at a CAGR of 21% indicating the increase in ability
to take on higher ticket size loans due to general improvement
in per capita income.
Top 5 states, viz. Tamil Nadu, Karnataka, Maharashtra, UP
and MP account for 60% of GLP. States with highest growth
in portfolio are Sikkim, Haryana, Punjab, Himachal Pradesh
and Jharkhand albeit from a low base.
Disclaimer
Page 59
Spark Disclaimer
Spark Capital Advisors (India) Private Limited (Spark Capital) and its affiliates are engaged in investment banking, investment advisory and institutional equities and
infrastructure advisory services. Spark Capital is registered with SEBI as a Stock Broker and Category 1 Merchant Banker.
We hereby declare that our activities were neither suspended nor we have defaulted with any stock exchange authority with whom we are registered in the last five years. We
have not been debarred from doing business by any Stock Exchange/SEBI or any other authorities, nor has our certificate of registration been cancelled by SEBI at any point of
time.
Spark Capital has a subsidiary Spark Investment Advisors (India) Private Limited which is engaged in the services of providing investment advisory services and is registered
with SEBI as Investment Advisor. Spark Capital has also an associate company Spark Infra Advisors (India) Private Limited which is engaged in providing infrastructure
advisory services.
This document does not constitute or form part of any offer or solicitation for the purchase or sale of any financial instrument or as an official confirmation of any transaction.
This document is provided for assistance only and is not intended to be and must not alone be taken as the basis for an investment decision. Nothing in this document should
be construed as investment or financial advice, and nothing in this document should be construed as an advice to buy or sell or solicitation to buy or sell the securities of
companies referred to in this document.
Each recipient of this document should make such investigations as it deems necessary to arrive at an independent evaluation of an investment in the securities of companies
referred to in this document (including the merits and risks involved), and should consult its own advisors to determine the merits and risks of such an investment. This
document is being supplied to you solely for your information and may not be reproduced, redistributed or passed on, directly or indirectly, to any other person or published,
copied, in whole or in part, for any purpose. This report is not directed or intended for distribution to or use by any person or entity who is a citizen or resident of or located in
any locality, state, country or other jurisdiction, where such distribution, publication, availability or use would be contrary to law, regulation or which would subject Spark Capital
and/or its affiliates to any registration or licensing requirement within such jurisdiction. The securities described herein may or may not be eligible for sale in all jurisdictions or to
a certain category of investors. Persons in whose possession this document may come are required to inform themselves of and to observe such applicable restrictions. This
material should not be construed as an offer to sell or the solicitation of an offer to buy any security in any jurisdiction where such an offer or solicitation would be illegal.
Spark Capital makes no representation or warranty, express or implied, as to the accuracy, completeness or fairness of the information and opinions contained in this
document. Spark Capital , its affiliates, and the employees of Spark Capital and its affiliates may, from time to time, effect or have effected an own account transaction in, or
deal as principal or agent in or for the securities mentioned in this document. They may perform or seek to perform investment banking or other services for, or solicit
investment banking or other business from, any company referred to in this report.
This report has been prepared on the basis of information, which is already available in publicly accessible media or developed through an independent analysis by Spark
Capital. While we would endeavour to update the information herein on a reasonable basis, Spark Capital and its affiliates are under no obligation to update the information.
Also, there may be regulatory, compliance or other reasons that prevent Spark Capital and its affiliates from doing so. Neither Spark Capital nor its affiliates or their respective
directors, employees, agents or representatives shall be responsible or liable in any manner, directly or indirectly, for views or opinions expressed in this report or the contents
or any errors or discrepancies herein or for any decisions or actions taken in reliance on the report or the inability to use or access our service in this report or for any loss or
damages whether direct or indirect, incidental, special or consequential including without limitation loss of revenue or profits that may arise from or in connection with the use of
or reliance on this report.
Absolute
Rating
Interpretation
BUY Stock expected to provide positive returns of >15% over a 1-year horizon REDUCE Stock expected to provide returns of <5% – -10% over a 1-year
horizon
ADD Stock expected to provide positive returns of >5% – <15% over a 1-year
horizon SELL Stock expected to fall >10% over a 1-year horizon
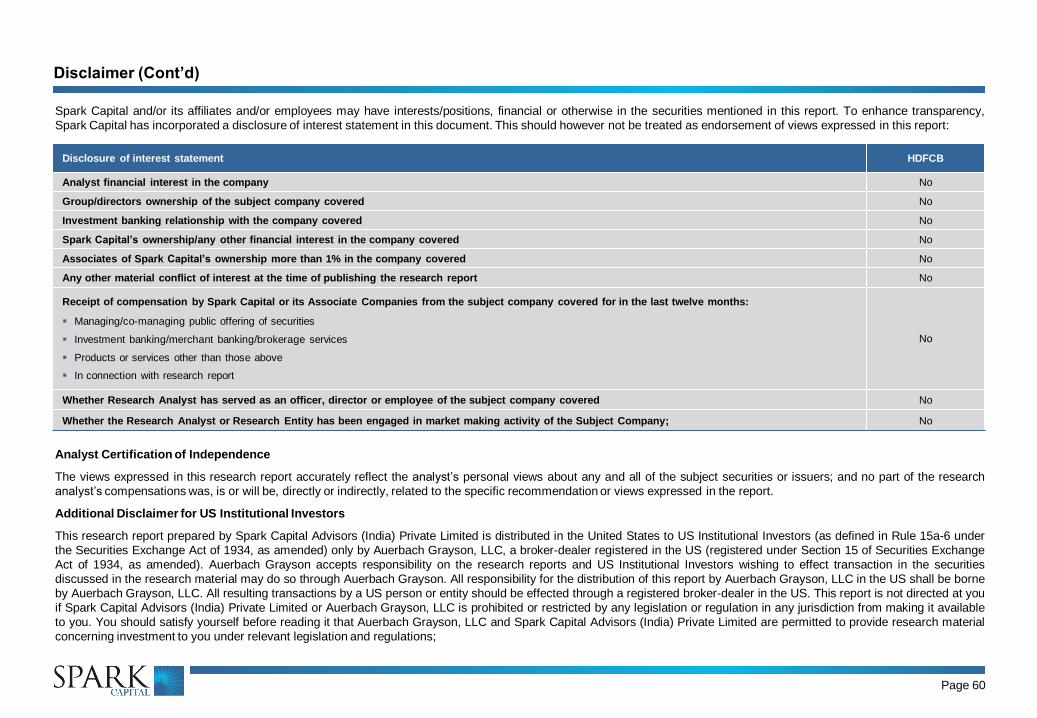
Disclaimer (Cont’d)
Page 60
Spark Capital and/or its affiliates and/or employees may have interests/positions, financial or otherwise in the securities mentioned in this report. To enhance transparency,
Spark Capital has incorporated a disclosure of interest statement in this document. This should however not be treated as endorsement of views expressed in this report:
Disclosure of interest statement HDFCB
Analyst financial interest in the company No
Group/directors ownership of the subject company covered No
Investment banking relationship with the company covered No
Spark Capital’s ownership/any other financial interest in the company covered No
Associates of Spark Capital’s ownership more than 1% in the company covered No
Any other material conflict of interest at the time of publishing the research report No
Receipt of compensation by Spark Capital or its Associate Companies from the subject company covered for in the last twelve months:
Managing/co-managing public offering of securities
Investment banking/merchant banking/brokerage services
Products or services other than those above
In connection with research report
No
Whether Research Analyst has served as an officer, director or employee of the subject company covered No
Whether the Research Analyst or Research Entity has been engaged in market making activity of the Subject Company; No
Analyst Certification of Independence
The views expressed in this research report accurately reflect the analyst’s personal views about any and all of the subject securities or issuers; and no part of the research
analyst’s compensations was, is or will be, directly or indirectly, related to the specific recommendation or views expressed in the report.
Additional Disclaimer for US Institutional Investors
This research report prepared by Spark Capital Advisors (India) Private Limited is distributed in the United States to US Institutional Investors (as defined in Rule 15a-6 under
the Securities Exchange Act of 1934, as amended) only by Auerbach Grayson, LLC, a broker-dealer registered in the US (registered under Section 15 of Securities Exchange
Act of 1934, as amended). Auerbach Grayson accepts responsibility on the research reports and US Institutional Investors wishing to effect transaction in the securities
discussed in the research material may do so through Auerbach Grayson. All responsibility for the distribution of this report by Auerbach Grayson, LLC in the US shall be borne
by Auerbach Grayson, LLC. All resulting transactions by a US person or entity should be effected through a registered broker-dealer in the US. This report is not directed at you
if Spark Capital Advisors (India) Private Limited or Auerbach Grayson, LLC is prohibited or restricted by any legislation or regulation in any jurisdiction from making it available
to you. You should satisfy yourself before reading it that Auerbach Grayson, LLC and Spark Capital Advisors (India) Private Limited are permitted to provide research material
concerning investment to you under relevant legislation and regulations;