Embed Size (px)
Citation preview

Big Data’s Influence on Product Design
and QualityJoseph Sefair
Agenda
Big Data - Setting yourself up for success What are the basics – can you deal with the Big Data Chaos?
What problems are you really trying to solve?
Who (disciplines), what, and how
How programs evolve
Case Studies / Examples of Evolution Microsoft Application ScoreCard Example
Office Anomaly Detection

Big DataSetting yourself for success
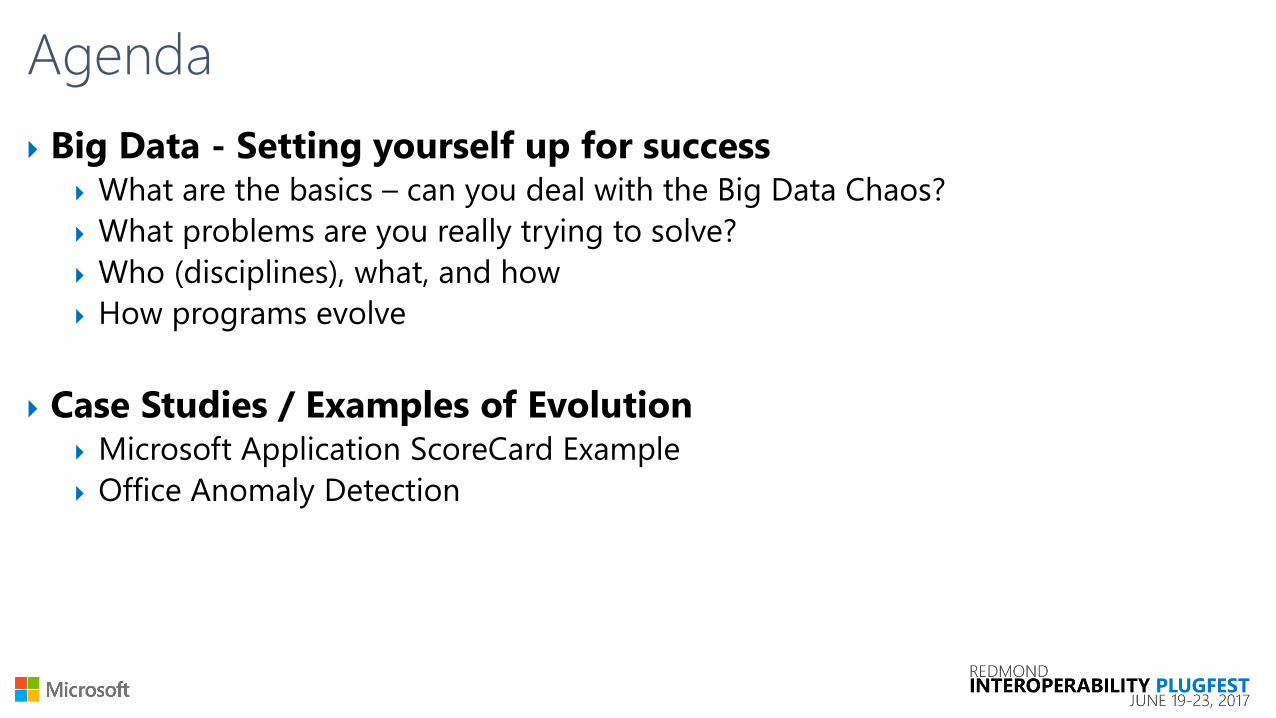
Big Data
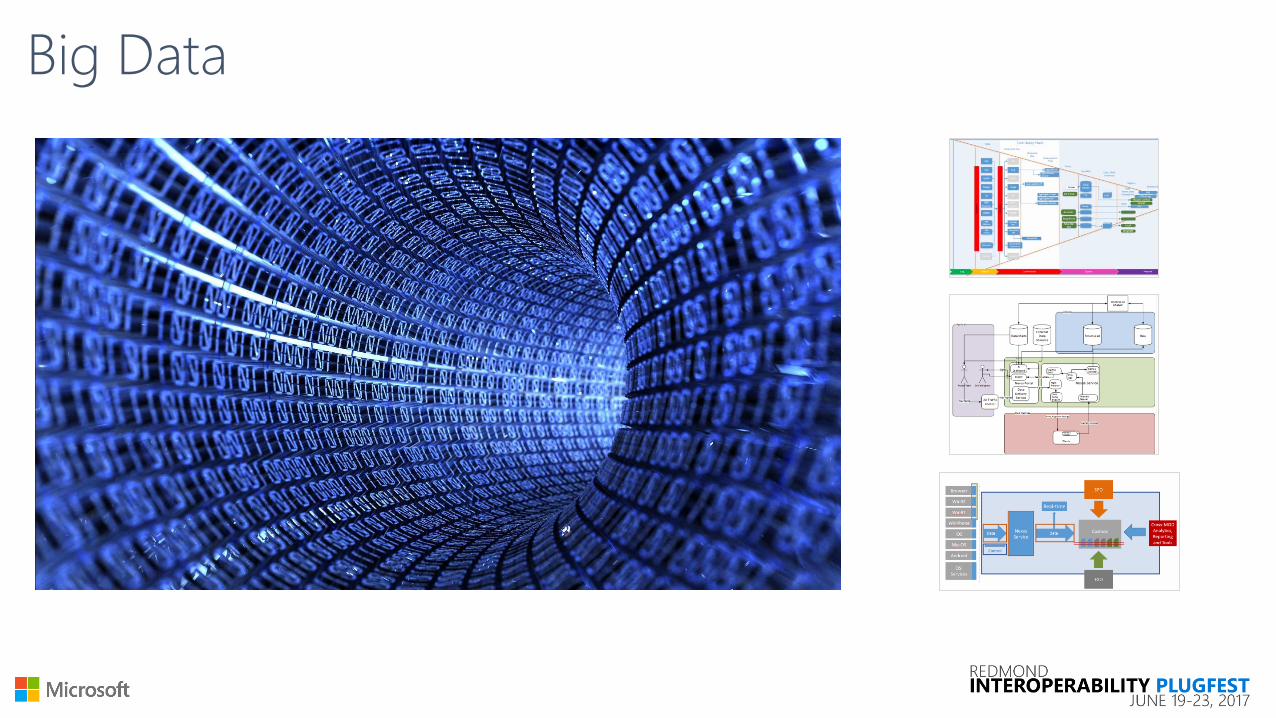
Can you organize your data?
What is the problem you are trying to solve?
Do you have the taxonomy that will help you ask these questions?
Does each discipline know their Data role?
What are the questions you are trying to answer?
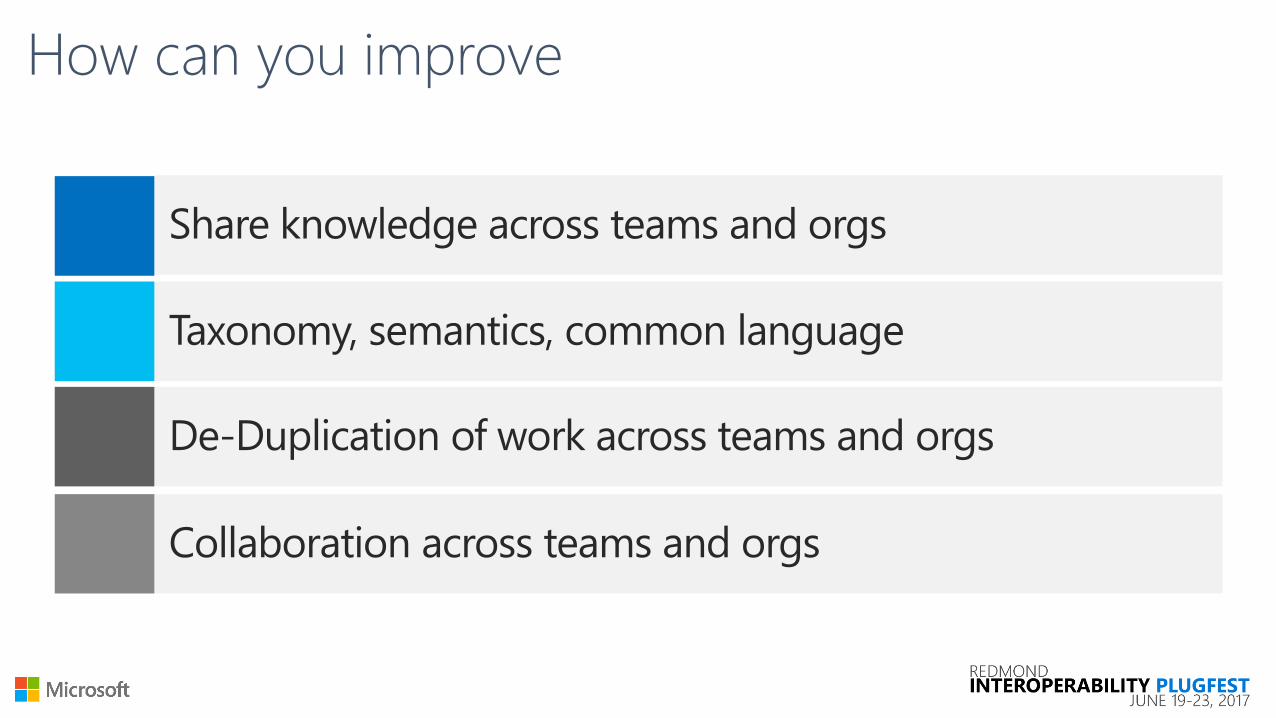
How can you improve
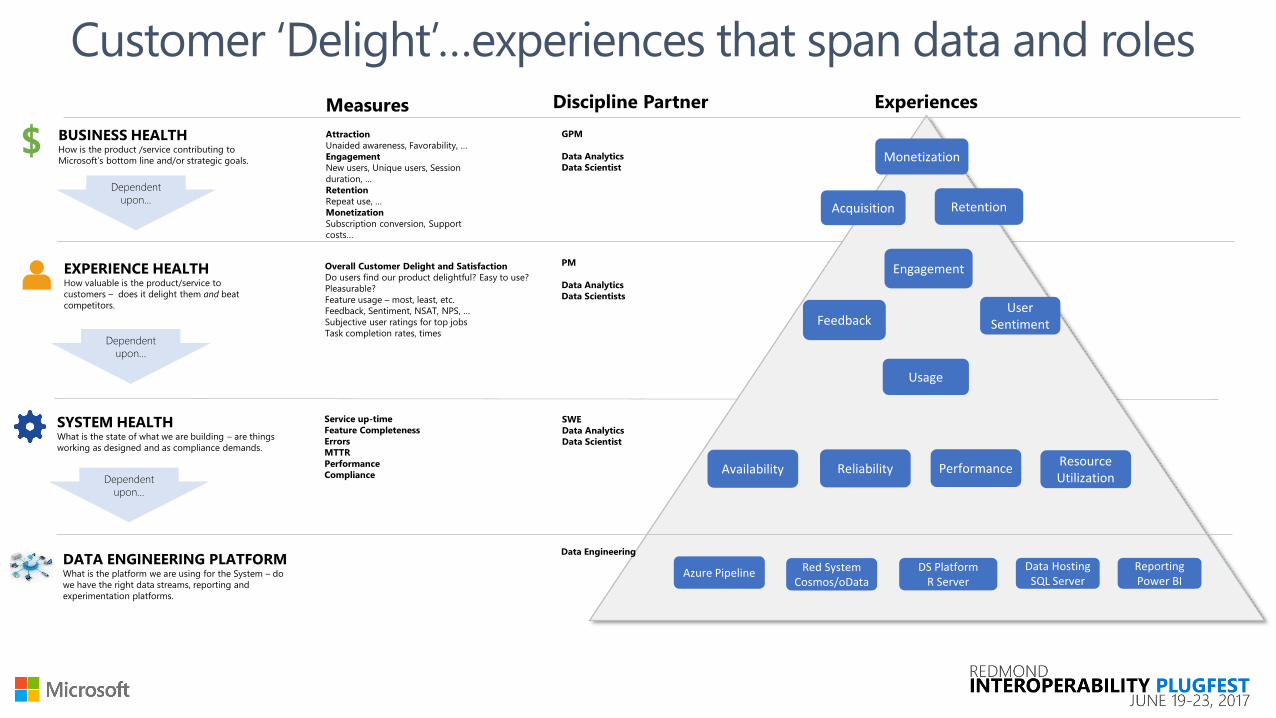
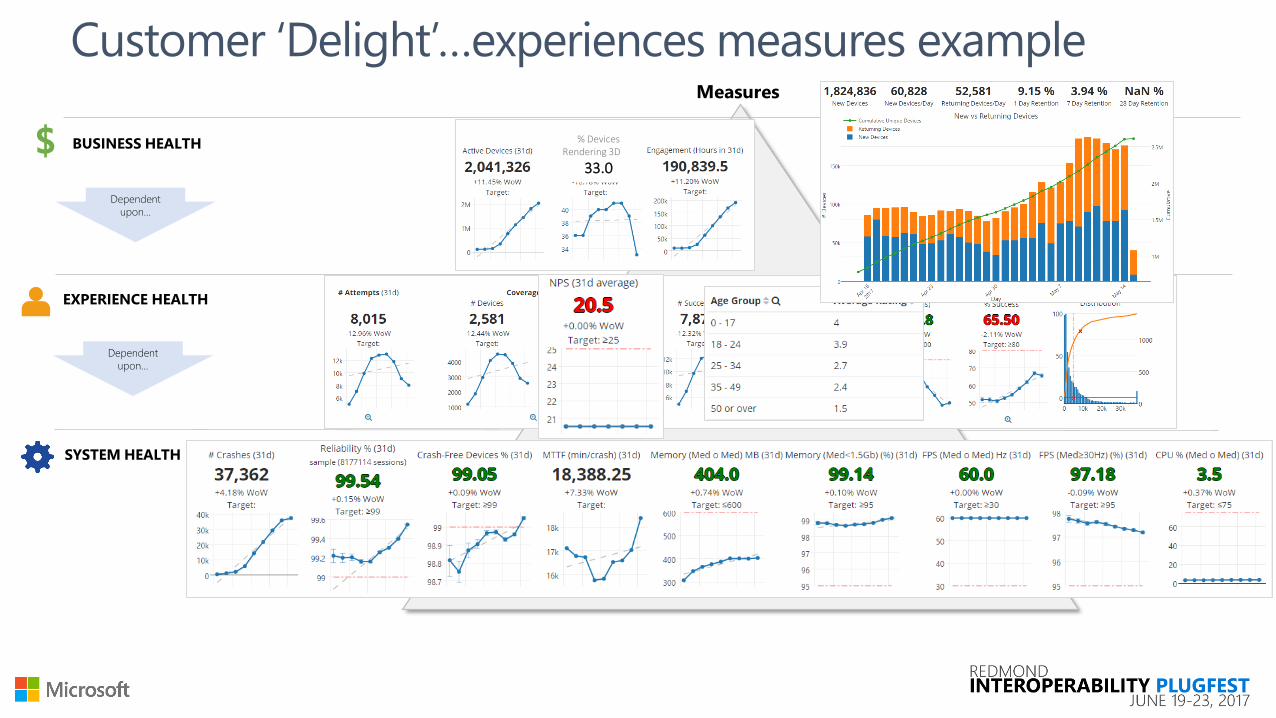
$ BUSINESS HEALTH How is the product /service contributing to
Microsoft’s bottom line and/or strategic goals.
EXPERIENCE HEALTH How valuable is the product/service to
customers – does it delight them and beat
competitors.
SYSTEM HEALTHWhat is the state of what we are building – are things
working as designed and as compliance demands.
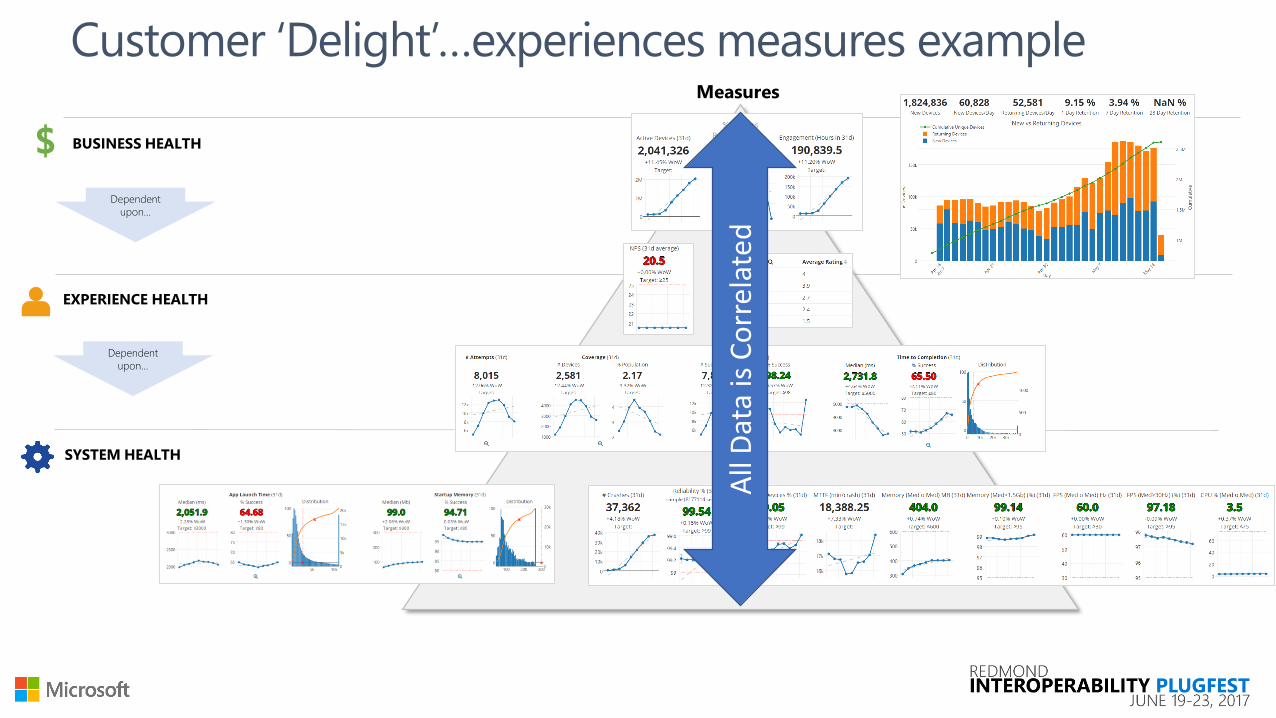
Measures
Attraction
Unaided awareness, Favorability, …
Engagement
New users, Unique users, Session
duration, …
Retention
Repeat use, …
Monetization
Subscription conversion, Support
costs…
Overall Customer Delight and Satisfaction
Do users find our product delightful? Easy to use?
Pleasurable?
Feature usage – most, least, etc.
Feedback, Sentiment, NSAT, NPS, …
Subjective user ratings for top jobs
Task completion rates, times
Service up-time
Feature Completeness
Errors
MTTR
Performance
Compliance
Dependent
upon…
Dependent
upon…
ExperiencesDiscipline Partner
GPM
Data Analytics
Data Scientist
PM
Data Analytics
Data Scientists
SWE
Data Analytics
Data Scientist
DATA ENGINEERING PLATFORMWhat is the platform we are using for the System – do
we have the right data streams, reporting and
experimentation platforms.
Data Engineering
Dependent
upon…
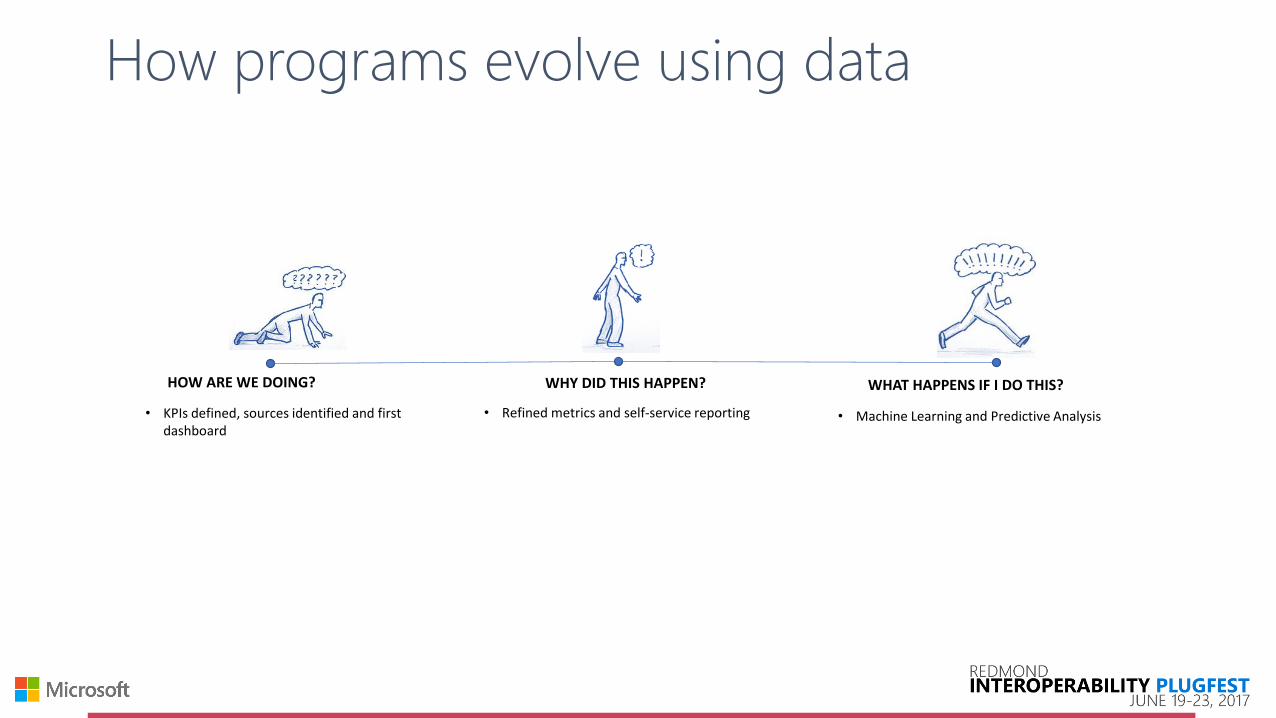
How programs evolve using data
HOW ARE WE DOING? WHY DID THIS HAPPEN? WHAT HAPPENS IF I DO THIS?
• Machine Learning and Predictive Analysis• Refined metrics and self-service reporting• KPIs defined, sources identified and first dashboard
PRODUCT HEALTH SPECTRUM
Contoso Application (Example): App edit / render 3D Objects
$ BUSINESS HEALTH
EXPERIENCE HEALTH
SYSTEM HEALTH
Measures
Dependent
upon…
Dependent
upon…
% DevicesRendering 3D
33.0
*Data from: April 16th to May 14th
$ BUSINESS HEALTH
EXPERIENCE HEALTH
SYSTEM HEALTH
Measures
Dependent
upon…
Dependent
upon…
% DevicesRendering 3D
33.0
*Data from: April 16th to May 14th
All
Dat
a is
Co
rrel
ated
Anomaly detectionOffice Reliability
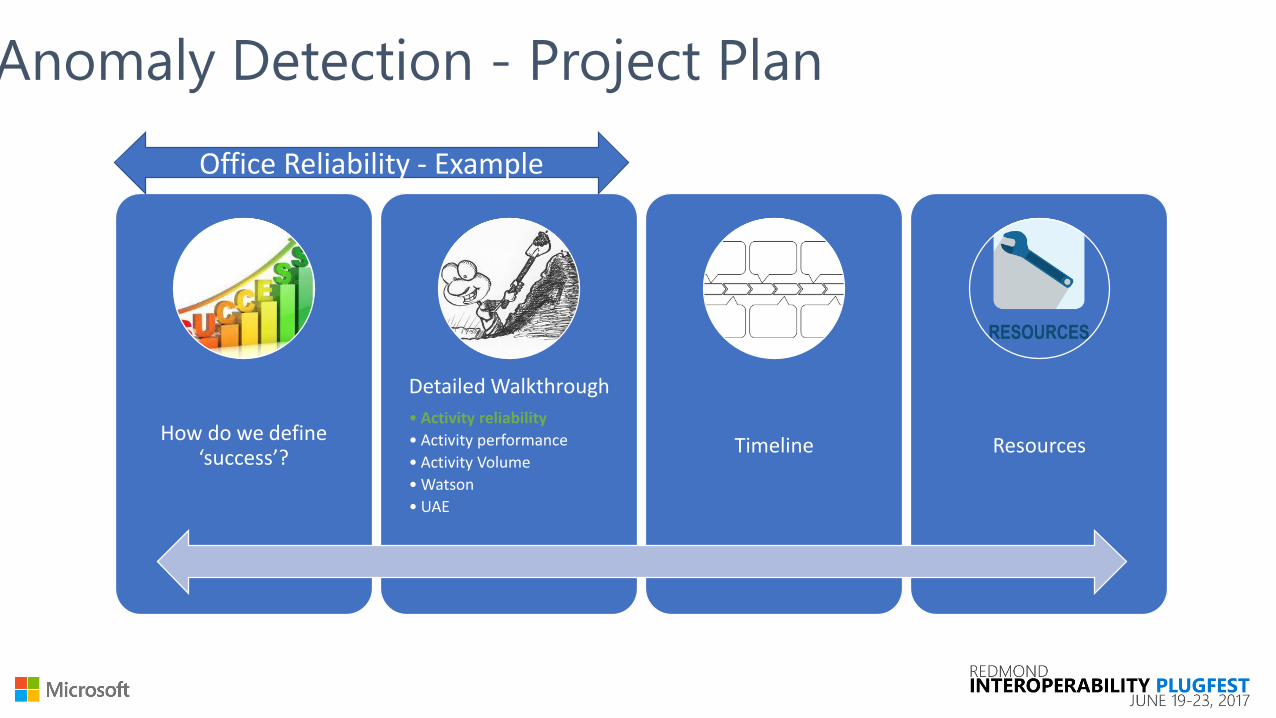
Anomaly Detection - Project Plan
How do we define ‘success’?
Detailed Walkthrough
• Activity reliability
• Activity performance
• Activity Volume
• Watson
• UAE
Timeline Resources
Office Reliability - Example
What is ‘Anomaly detection (AD)’?
There are a lot of definitions out there –
“In data mining, anomaly detection (also outlier detection) is the identification of items, events or observations which do not conform to an expected pattern or other items in a dataset”
In our world,
➢ The model that represents a normal behavior from a given normal training set and testing the likelihood of a test instance to be generated from the learnt model
➢ Training involves learning behaviors from other builds and then test a given build against the dynamic thresholds
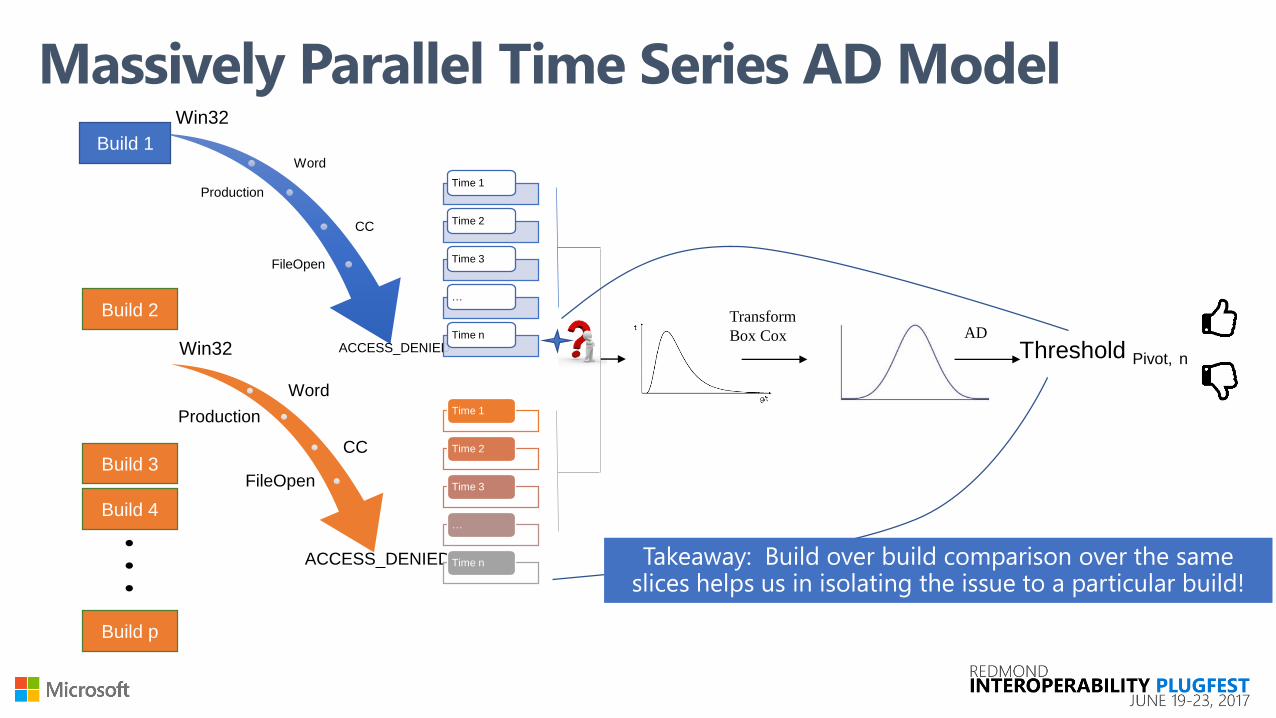
Win32
Word
Production
CC
FileOpen
ACCESS_DENIED
Time 1
Time 2
Time 3
…
Time n
Win32
Word
Production
CC
FileOpen
ACCESS_DENIED
Time 1
Time 2
Time 3
…
Time n
Build 1
Build 2AD
Transform
Box Cox Threshold Pivot, n
Massively Parallel Time Series AD Model
Build 3
Build 4
Build p
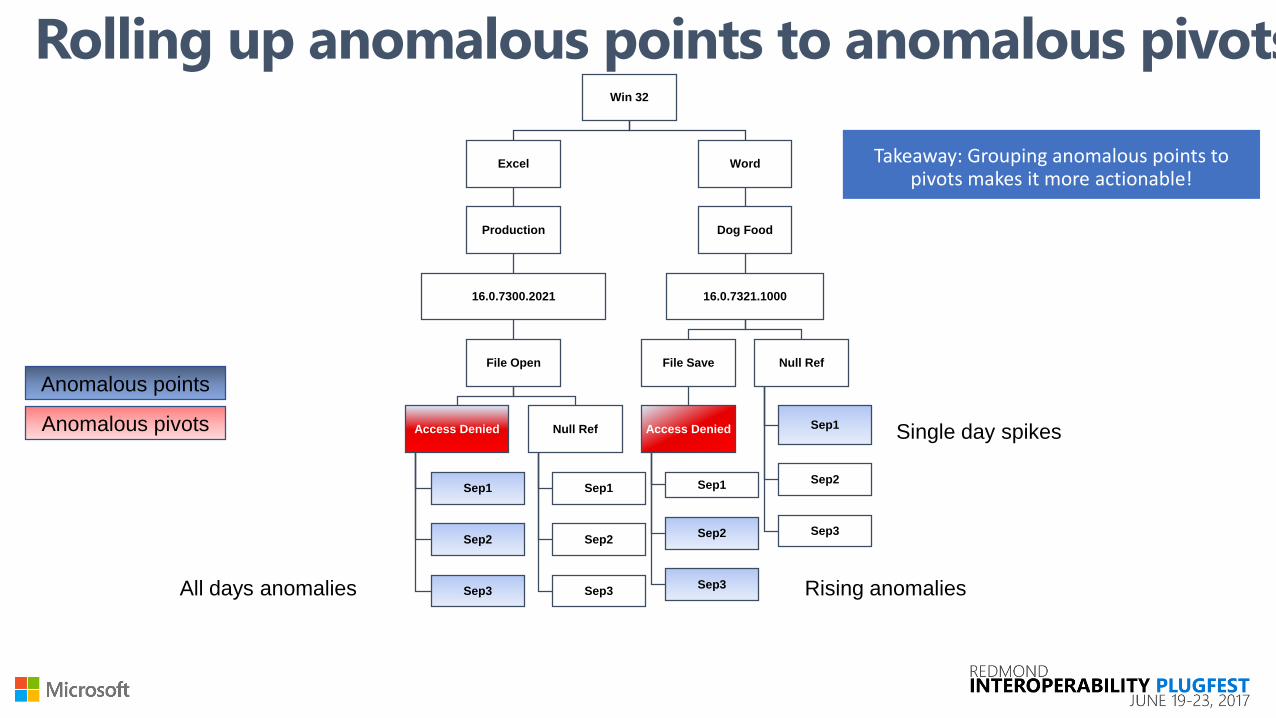
Win 32
Excel
Production
16.0.7300.2021
File Open
Access Denied
Sep1
Sep2
Sep3
Null Ref
Sep1
Sep2
Sep3
Word
Dog Food
16.0.7321.1000
File Save
Access Denied
Sep1
Sep2
Sep3
Null Ref
Sep1
Sep2
Sep3
Anomalous points
Anomalous pivots
All days anomalies
Single day spikes
Rising anomalies
Rolling up anomalous points to anomalous pivots
Our ‘success metrics’
Time To Detect – This is a top level org metric, that measures our ability to detect ship-blocking issues earlier
σ𝑘=0𝑛 Time when bug was created –
Time when the issue was checked in (based on root cause)
Internal metrics
Usage of the reports/offerings per team/GEM/GPM
# of users
# of views
# of Alerts created
# of Bugs created, sliced by ship-blocking v/s not


Thank You!Questions?


![Big Data Analytics & Privacy: How To Resolve This Paradox? · across all industries recognize Big Data’s value and seek to harness its potential. For example (see also [Klou15]](https://img.pdfslide.net/doc/110x75/5fa376782ce2e260754893c8/big-data-analytics-privacy-how-to-resolve-this-paradox-across-all-industries.jpg)