Embed Size (px)
Citation preview
157© Springer International Publishing AG 2018 Z. Shen, M. Li (eds.), Big Data Support of Urban Planning and Management, Advances in Geographic Information Science, DOI 10.1007/978-3-319-51929-6_9
Chapter 9Geographic Big Data’s Applications in Retailing Business Market
Xin Chen, Fangcao Xu, Weili Wang, Yikang Du, and Miaoyi Li
Abstract Location has been considered as a determinant factor for retail location’s success since the 1970s. Various researches have inspected different aspects in order to understand the market and select the best site for each store, from classifying the location to generating hierarchical trading areas. Previous researches done by human geographers may provide great insights into one specified site. However, their traditional methods are likely to be too expensive and difficult to expand to the whole city and even the whole nation. This chapter explores methods based on a large amount of data, which are currently being used as commercial solutions. By inspecting POI data and other social media data within pre-built grids, different types of business districts could be discovered, and site characteristics could be summarized. Two famous fast-food retailers have been explored in this study. Results indicate that more than 70% of stores can be explained by business district classifications. Also, results indicate that similar POI aggregations can be analyzed, from which 83% and 90% of stores’ locations can be explained for two retailers separately. Besides, the distance relationship between POIs and stores can contrib-ute to explain the location of retail stores.
Keywords Site selection • POI • Retail • Location • Spatial analyst • Big data
X. Chen (*) • F. Xu • W. Wang • Y. Du Beijing GISuni Information Co., Ltd, Beijing, Chinae-mail: [email protected]
M. Li Joint International FZUKU Lab SPSD, Fuzhou University, Fuzhou City, China
158
9.1 Introduction
Retailing is a high-tech, global industry that offers customers with daily living goods and services to earn a profit. However, retailing business is not static and is constantly evolving and changing. Companies have to figure out how to make their own business more successful through researching the world of retailing, from inte-rior factors like categories of retailers, their product types and multiple channels—stores, the Internet, and catalogs—they sell their products, to the exterior factors like the environment of their target market, consumer buying behaviors, and com-petitors in the same regions (Levy and Weitz 2013). For both small retail businesses and chain giants, a full broad overview of the market will provide background infor-mation needed to develop and implement an effective retail strategy (Yudelson 2009). At this point in the evolution of the Information Age, most retailing compa-nies are now seeking for sorts of advanced methodologies as well as traditional questionnaire surveys or count measures to do market analysis and decision mak-ings (Cressie and Wikle 2010). In recent years, the big data, including smart card data (SCD), social media data, and mobile phone records provided by location- based services (LBS) like Global System for Mobile communication (GSM), global positioning system (GPS), social networking services (SNS), and Wi-Fi, can be used to real time monitor the urban activities (Calabrese and Ratti 2006). Then chain retailers could use geographic information science (GIS) software, combining computer-generated mapping (Hernandez 2007) with key locational data to graphi-cally delineate extensive demographic and business characteristics and analyze the intensity and temporal distribution of people mobility patterns (Ratti et al. 2006), thus helping do market analysis (Rachel 2007; Duggal 2008).
This study will introduce some business solutions developed by Location Intelligence department of GISuni and its own commercial business software—GeoQ—to provide location analytics and consulting services for part of the world’s top 500 enterprises and some famous institutions with on-demand analysis, geo- visualization maps, and ready reports.
9.1.1 Site Selection
Finding the right location is definitely one of the most influential paths to success in a customer’s store choice decision for any retailer (Mover 1972). Industry research suggests that location explains up to 70% of the variance in people’s supermarket choice decisions. Teller and Thomas (2008) have found that retailers choose their store locations based on a wide range of factors, including population characteristics, attributes of trading areas, the adjacency to other stores operated by the same firm or competing firms, legal restrictions, and more. Likewise, consum-ers choose locations where they like to shop based on a wide range of factors, including the overall appeal of the area, the distance and transportation access to
X. Chen et al.
159
the store, the availability of a choice of retailers or brands, the ease of parking, and more. Retailers usually follow these three steps in choosing a store location (Berman and Evans 2012):
1. Know the customer. This is a very critical part in site selection which will need lots of researches about the shopper profiles like people’s shopping behaviors and their characteristics.
2. Determine which type of location is needed. Will it be in an unplanned business district or in a planned shopping center within the geographic area? The types of location will be defined in the next paragraphs. Then seek out locales with the highest sales potential and reasonable leasing.
3. Research existing shopping centers to see if they are compatible for customer attraction. Evaluate alternate sites and their geographic (trading) areas. Generally, this step will involve finding factors like characteristics of residents and existing retailers, stores’ visibility, access, population density, household income, and traffic convenience for a specific area or location.
Steps 1–3 usually make lots of preparations, including preliminary market researches and evaluations.
9.2 Understand Customers
Understanding target customers is a vital and high priority in retailing business. The gender, age, income, and other similar demographic characteristics of customers have a significant relationship in evaluating site locations. The values of those vari-ables summed or aggregated in certain range could indicate where potential busi-ness market locates in and which type of location consumers will select to visit (Cliquet 2007).
9.2.1 Shopping Behavior
Levy and Weitz (2013) have defined three typical shopping behaviors for most of people.
Convenience shopping: consumers are primarily concerned with minimizing their effort to get the product or service they want, like the gas stations, generally located in neighborhood strip centers and freestanding locations.
Comparison shopping: consumers already have a general idea about the type of product or service they want, but they do not have a well-developed preference for a brand. However, they are willing to expend effort to compare alternatives. This is the reason why furniture retailers and shopping malls often locate next to one another.
Specialty shopping: consumers know what they want and will not accept a sub-stitute. They are brand and/or retailer loyal. Customer group with this type of shop-ping behavior is preferred by some special retailers like organic vegetables.
9 Geographic Big Data’s Applications in Retailing Business Market
160
9.2.1.1 Demographic Data of Customers
A retailer could use GIS to learn the demographics of customers at its best locations and set up a computer model to find potential locations with the most desired attri-butes, such as learn which of its stores have trading areas containing households with a median annual income of more than $50,000, or pinpoint its geographic areas of strength and weakness.
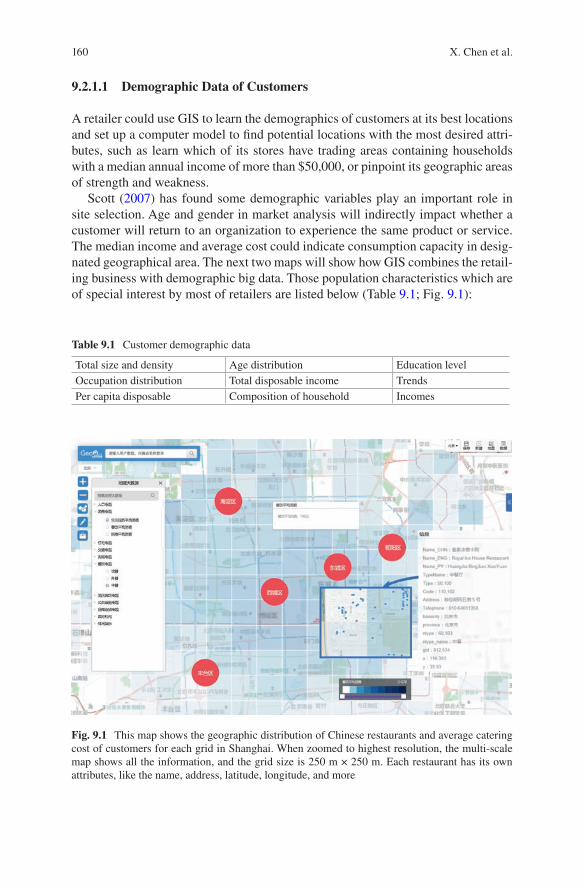
Scott (2007) has found some demographic variables play an important role in site selection. Age and gender in market analysis will indirectly impact whether a customer will return to an organization to experience the same product or service. The median income and average cost could indicate consumption capacity in desig-nated geographical area. The next two maps will show how GIS combines the retail-ing business with demographic big data. Those population characteristics which are of special interest by most of retailers are listed below (Table 9.1; Fig. 9.1):
Table 9.1 Customer demographic data
Total size and density Age distribution Education levelOccupation distribution Total disposable income TrendsPer capita disposable Composition of household Incomes
Fig. 9.1 This map shows the geographic distribution of Chinese restaurants and average catering cost of customers for each grid in Shanghai. When zoomed to highest resolution, the multi-scale map shows all the information, and the grid size is 250 m × 250 m. Each restaurant has its own attributes, like the name, address, latitude, longitude, and more
X. Chen et al.
161
9.2.2 Determine Types of Location
Not all types of locations are suitable for each different retailing business, so the primary consideration in the choice of a specific site is to decide which type of loca-tion is best for retailers.
9.2.2.1 Traditional Types of Location
According to the traditional classification in the world, there are four different loca-tion types: Isolated Store (freestanding), Unplanned Business District, Planned Shopping Center, and Other Location Opportunity (Levy and Weitz 2013; Berman and Evans 2012). Each one has its own characteristics as to the size of the trading area, the occupancy cost, the convenience and traffic in association with the loca-tion, the composition of competitors, parking, and other factors (Van 2008).
9.2.2.2 Isolated Store
An isolated store is a freestanding retail outlet located on either a highway or a street. There are no adjacent retailers with which this type of store shares traffic (Yudelson 2009).
The advantages of this type of retail are no competition in close proximity, and rental costs are relatively low with larger space and easy parking (Wood and Sue 2007). There are also various disadvantages like: initial customers may be difficult to attract because many people will not travel very far to this type of store. Besides, advertising expenses may be high, and the cost such as outside lighting, security, grounds maintenance, and trash collection is not shared by other retailers.
Isolation is good for convenience-oriented shopping store such as gas stations and fast-food restaurants.
9.2.2.3 Unplanned Business Districts
An unplanned business district is where two or more stores situate in close proxim-ity, but the total arrangement is not due to prior long-range planning (Table 9.2).
9.2.2.4 Planned Shopping Center
The planned shopping centers consist of a group of architecturally unified commercial establishments on a site that is owned or managed, designed and operated as a unit, based on balanced tenancy, and accompanied by parking facilities. Its location, size, and mix of stores are related to the trading area served (Jerath and Zhang 2010).
9 Geographic Big Data’s Applications in Retailing Business Market
162
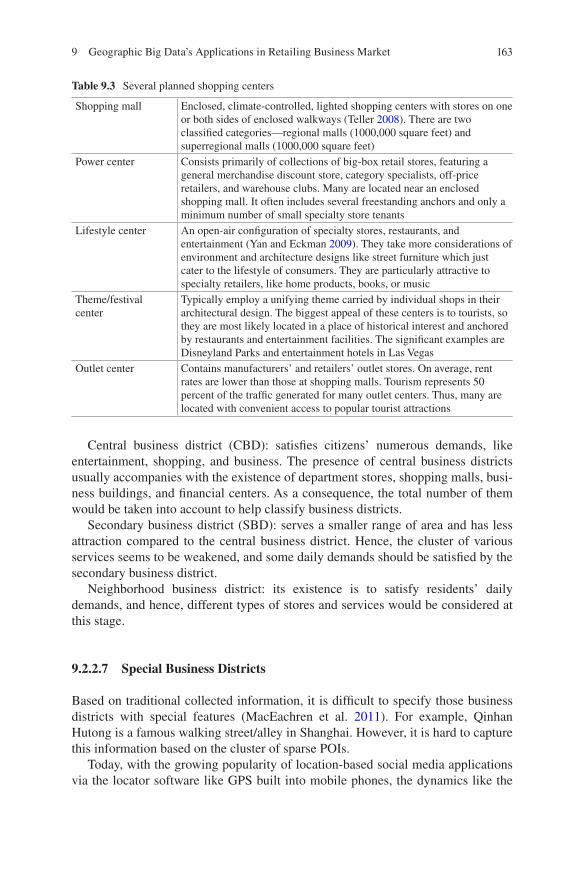
Their positive strengths are more appealing for one-stop, family shopping and cooperative planning of goods and services based on long-range planning with shar-ing of common costs. The limitations associated with them are many kinds of regu-lations that have reduced each retailer’s flexibility, like the operation hours. The competition within the center is very harsh with the domination by large anchor stores (Kramer 2010). This type of location is best suited for comparison shopping behavior and big chain retailers (Table 9.3).
9.2.2.5 Other Location Opportunities
Some stores opened in a people-aggregated area and not belonging to previous ones are also other location alternatives for many retailers. For examples, the pop-up temporary stores along the roadside and the stores in airports or railway stations are all nontraditional sites. They are popular in customers with convenience shopping behavior and fast-food restaurants (Brooks et al. 2008).
9.2.2.6 Business Districts in China
Among four types of location, both isolated store and other location opportunities have relative smaller trading areas. Instead of conducting this classification based on concepts of human geography mentioned above, the definition of business dis-tricts in GISuni follows three classifications, including CBD, SBD, and neighbor-hood business district. But they are aggregation of grids which have similar market segments and have been done by integrating various variables based on empirical and quantitative methods.
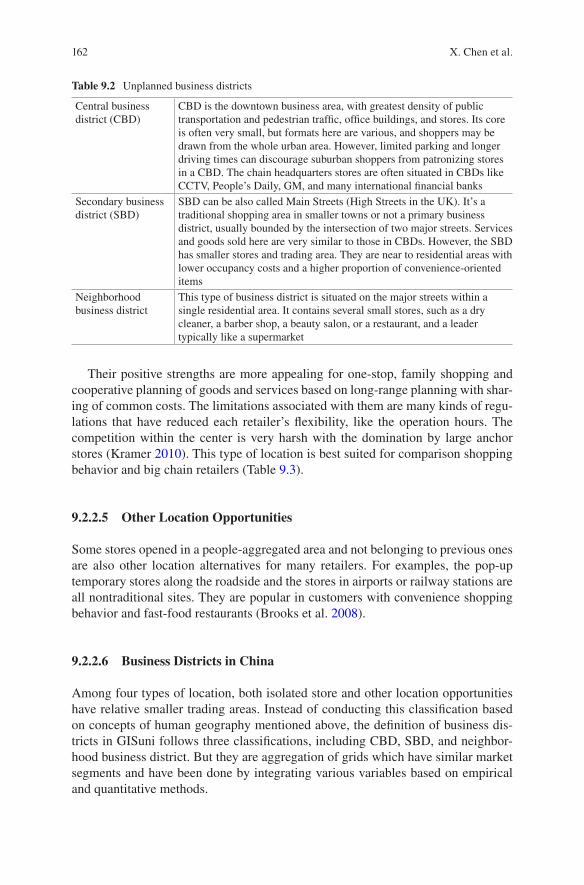
Table 9.2 Unplanned business districts
Central business district (CBD)
CBD is the downtown business area, with greatest density of public transportation and pedestrian traffic, office buildings, and stores. Its core is often very small, but formats here are various, and shoppers may be drawn from the whole urban area. However, limited parking and longer driving times can discourage suburban shoppers from patronizing stores in a CBD. The chain headquarters stores are often situated in CBDs like CCTV, People’s Daily, GM, and many international financial banks
Secondary business district (SBD)
SBD can be also called Main Streets (High Streets in the UK). It’s a traditional shopping area in smaller towns or not a primary business district, usually bounded by the intersection of two major streets. Services and goods sold here are very similar to those in CBDs. However, the SBD has smaller stores and trading area. They are near to residential areas with lower occupancy costs and a higher proportion of convenience-oriented items
Neighborhood business district
This type of business district is situated on the major streets within a single residential area. It contains several small stores, such as a dry cleaner, a barber shop, a beauty salon, or a restaurant, and a leader typically like a supermarket
X. Chen et al.
163
Central business district (CBD): satisfies citizens’ numerous demands, like entertainment, shopping, and business. The presence of central business districts usually accompanies with the existence of department stores, shopping malls, busi-ness buildings, and financial centers. As a consequence, the total number of them would be taken into account to help classify business districts.
Secondary business district (SBD): serves a smaller range of area and has less attraction compared to the central business district. Hence, the cluster of various services seems to be weakened, and some daily demands should be satisfied by the secondary business district.
Neighborhood business district: its existence is to satisfy residents’ daily demands, and hence, different types of stores and services would be considered at this stage.
9.2.2.7 Special Business Districts
Based on traditional collected information, it is difficult to specify those business districts with special features (MacEachren et al. 2011). For example, Qinhan Hutong is a famous walking street/alley in Shanghai. However, it is hard to capture this information based on the cluster of sparse POIs.
Today, with the growing popularity of location-based social media applications via the locator software like GPS built into mobile phones, the dynamics like the
Table 9.3 Several planned shopping centers
Shopping mall Enclosed, climate-controlled, lighted shopping centers with stores on one or both sides of enclosed walkways (Teller 2008). There are two classified categories—regional malls (1000,000 square feet) and superregional malls (1000,000 square feet)
Power center Consists primarily of collections of big-box retail stores, featuring a general merchandise discount store, category specialists, off-price retailers, and warehouse clubs. Many are located near an enclosed shopping mall. It often includes several freestanding anchors and only a minimum number of small specialty store tenants
Lifestyle center An open-air configuration of specialty stores, restaurants, and entertainment (Yan and Eckman 2009). They take more considerations of environment and architecture designs like street furniture which just cater to the lifestyle of consumers. They are particularly attractive to specialty retailers, like home products, books, or music
Theme/festival center
Typically employ a unifying theme carried by individual shops in their architectural design. The biggest appeal of these centers is to tourists, so they are most likely located in a place of historical interest and anchored by restaurants and entertainment facilities. The significant examples are Disneyland Parks and entertainment hotels in Las Vegas
Outlet center Contains manufacturers’ and retailers’ outlet stores. On average, rent rates are lower than those at shopping malls. Tourism represents 50 percent of the traffic generated for many outlet centers. Thus, many are located with convenient access to popular tourist attractions
9 Geographic Big Data’s Applications in Retailing Business Market
164
locations, distances, and directions to nearby POIs or stores are certainly providing a new way to inspect the flow of people, and hence, those special business districts could be explored (Zafarani et al. (2014). And the reviews also allow the retailers to design more personalized shopping experience and stimulate loyalty for customers (Mathioudakis and Koudas 2010).
Among most of the social media data, Weibo is a massive social networking site tuned toward fast communication and has played a prominent role in sociopolitical events. These data could help identify those special business districts.
9.2.3 Analyze Trading Areas
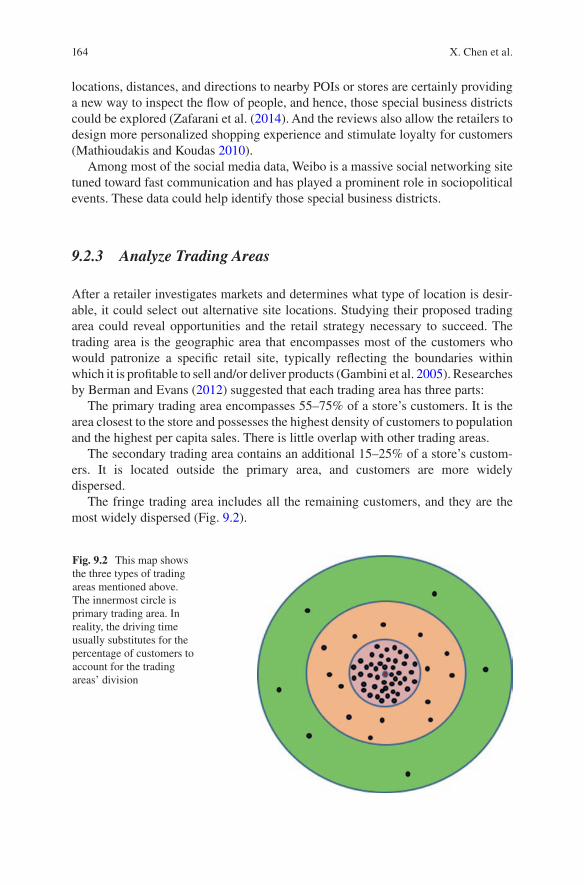
After a retailer investigates markets and determines what type of location is desir-able, it could select out alternative site locations. Studying their proposed trading area could reveal opportunities and the retail strategy necessary to succeed. The trading area is the geographic area that encompasses most of the customers who would patronize a specific retail site, typically reflecting the boundaries within which it is profitable to sell and/or deliver products (Gambini et al. 2005). Researches by Berman and Evans (2012) suggested that each trading area has three parts:
The primary trading area encompasses 55–75% of a store’s customers. It is the area closest to the store and possesses the highest density of customers to population and the highest per capita sales. There is little overlap with other trading areas.
The secondary trading area contains an additional 15–25% of a store’s custom-ers. It is located outside the primary area, and customers are more widely dispersed.
The fringe trading area includes all the remaining customers, and they are the most widely dispersed (Fig. 9.2).
Fig. 9.2 This map shows the three types of trading areas mentioned above. The innermost circle is primary trading area. In reality, the driving time usually substitutes for the percentage of customers to account for the trading areas’ division
X. Chen et al.
165
A thorough analysis of trading areas provides several benefits (Ozuduru 2009):Demographic data of consumers and socioeconomic characteristics are exam-
ined. Other factors like the impact of the Internet, transportation, and supplier loca-tion legal restrictions are also reviewed.
The retailer can look at geographical coverage of proposed or existing locations and learn whether a proposed new store will service additional customers or take business from its existing stores. The best number of similar stores for a chain to operate in a given area is calculated for not too much overlap.
Geographic weaknesses are highlighted. Suppose a shopping center discovers that most of the people residing south of it do not shop there because the pedestrian overpass needs people to detour a lot. Then the manager should take actions to make up this weakness.
Berman and Evans (2012) have mentioned that when one store has created a stronger image, it may become a destination store and generate a trading area much larger than its adjacent competitors. The parasite store does not create its own real trading area which depends on people drawn to the location for other reasons, like snack bars and restaurants in a shopping center. Customers patronize these shops for convenience also with some sort of comparison.
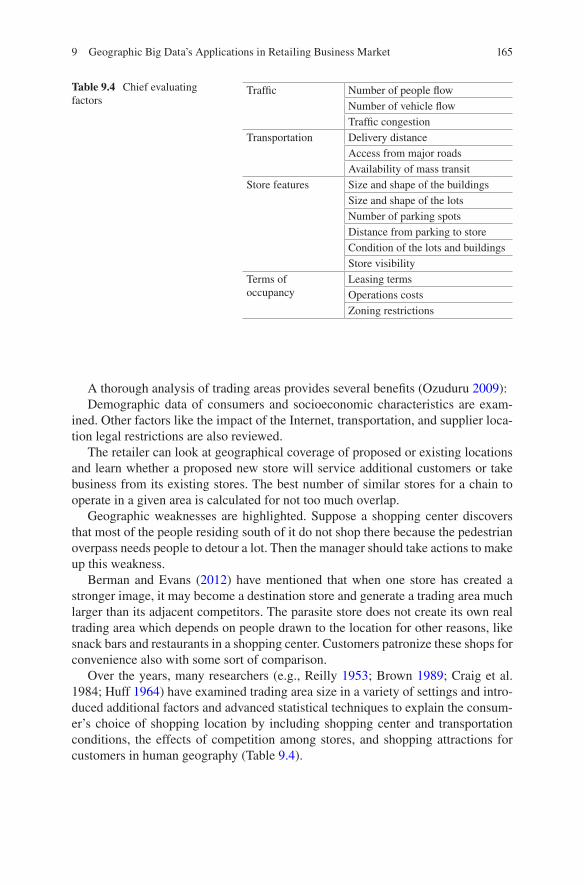
Over the years, many researchers (e.g., Reilly 1953; Brown 1989; Craig et al. 1984; Huff 1964) have examined trading area size in a variety of settings and intro-duced additional factors and advanced statistical techniques to explain the consum-er’s choice of shopping location by including shopping center and transportation conditions, the effects of competition among stores, and shopping attractions for customers in human geography (Table 9.4).
Table 9.4 Chief evaluating factors
Traffic Number of people flowNumber of vehicle flowTraffic congestion
Transportation Delivery distanceAccess from major roadsAvailability of mass transit
Store features Size and shape of the buildingsSize and shape of the lotsNumber of parking spotsDistance from parking to storeCondition of the lots and buildingsStore visibility
Terms of occupancy
Leasing termsOperations costsZoning restrictions
9 Geographic Big Data’s Applications in Retailing Business Market
166
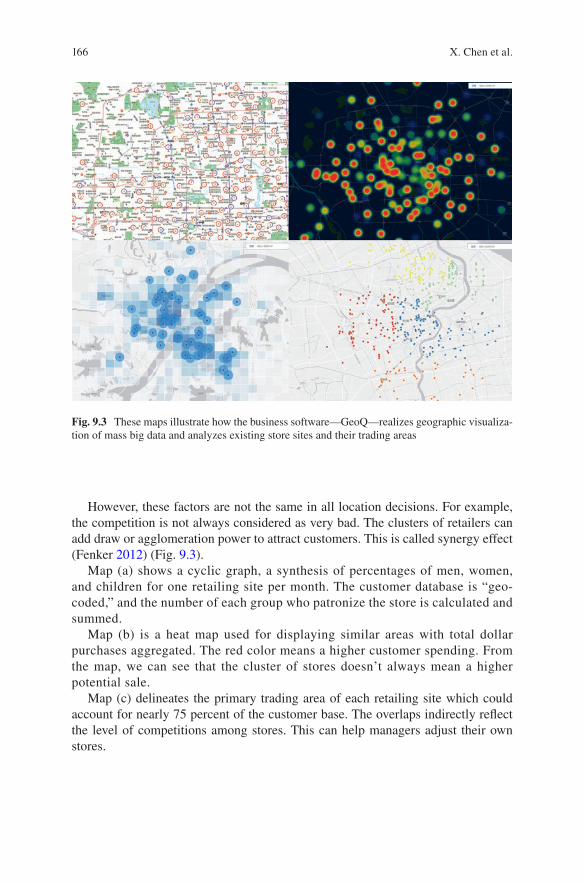
However, these factors are not the same in all location decisions. For example, the competition is not always considered as very bad. The clusters of retailers can add draw or agglomeration power to attract customers. This is called synergy effect (Fenker 2012) (Fig. 9.3).
Map (a) shows a cyclic graph, a synthesis of percentages of men, women, and children for one retailing site per month. The customer database is “geo-coded,” and the number of each group who patronize the store is calculated and summed.
Map (b) is a heat map used for displaying similar areas with total dollar purchases aggregated. The red color means a higher customer spending. From the map, we can see that the cluster of stores doesn’t always mean a higher potential sale.
Map (c) delineates the primary trading area of each retailing site which could account for nearly 75 percent of the customer base. The overlaps indirectly reflect the level of competitions among stores. This can help managers adjust their own stores.
Fig. 9.3 These maps illustrate how the business software—GeoQ—realizes geographic visualiza-tion of mass big data and analyzes existing store sites and their trading areas
X. Chen et al.
167
Map (d) generates the distribution of retailing sites vs. customers to further understand the correlation between the purchase behavior and store locations. The points with the same color correspond to the true service area of each store based on registered members’ information.
9.3 Commercial Methodology
Most of GIS analysis relies on grid by grid calculation. It’s difficult to get accu-rate classifications of the whole market by only using human geography which needs lots of in-site survey work and artificial interpretation. In reality, trading areas do not usually follow circular patterns, and many of their characteristics are rather hard to calculate. They are influenced by store type, store size, competitor locations, travel time, traffic barriers, and media availability. The probability of people shopping at a location depends on customers’ sensitivity to travel time which is not clear because it will vary from product types to their own shopping preferences. However, it’s a common principle that each retailing business does have similar market environments. It’s very powerful to use market segmentation methodology to properly describe successful business areas associated with geo-graphical data.
9.3.1 Market Segmentation
Market segmentation is a strategy which involves dividing a broad market into sub-sets of consumers or businesses that have common needs, interests, or types of loca-tions and then designing and implementing strategies to target them (McDonald and Dunbar 2012). There are several traditional types of market segmentation (Swart and Roodt 2015):
Geographic segmentation: segmentation according to geographic criteria—nations, states, regions, countries, cities, neighborhoods, or postal codes. The geo-cluster approach combining demographic data with geographic data could create a more accurate or specific profile.
Consumer segmentation: segmentation according to demography is based on vari-ables such as age, gender, occupation, and educational level.
Behavior segmentation: it divides consumers into groups according to their knowl-edge of, attitude toward, usage rate, response, loyalty status, and readiness stage to a product.
Psychographic (lifestyle) segmentation: this is measured by studying activities, interests, and customer opinions (Miguéis et al. 2012).
9 Geographic Big Data’s Applications in Retailing Business Market
168
The big data provided by LBS technology is commonly used here. However, such massive data are usually time series, from which useful information are hard to be extracted. GISuni has developed its own commercial segmentation methods on the basis of classified POIs (point of interest) with a supplement of social media data to improve precisions.
9.3.2 POI Segmentation
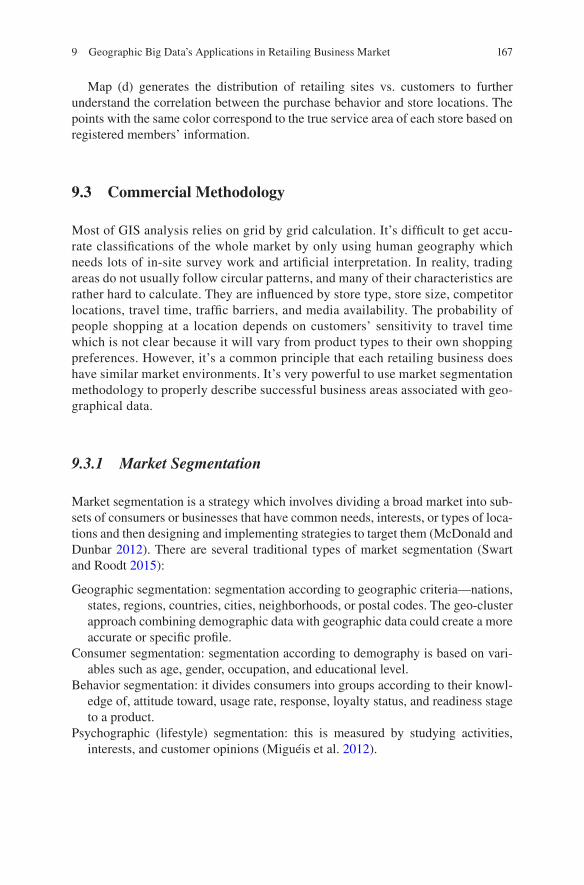
POI is a specific point location that is useful or interesting, like schools or supermar-kets. Unlike problems of completeness, logical consistency, positional and temporal accuracy in SCD, and mobile and social media data, POI information can be widely accessible with guaranteed time consistency, so it’s the core data of this market segmentation method. As of today, there are 18 classes and nearly 313 subclasses of POIs classified by GISuni (Table 9.5).
Through creating blocks (grids as 300 m × 300 m), various POIs could be inte-grated in each block so that subsequent calculations could be conducted at this level to do market segmentation.
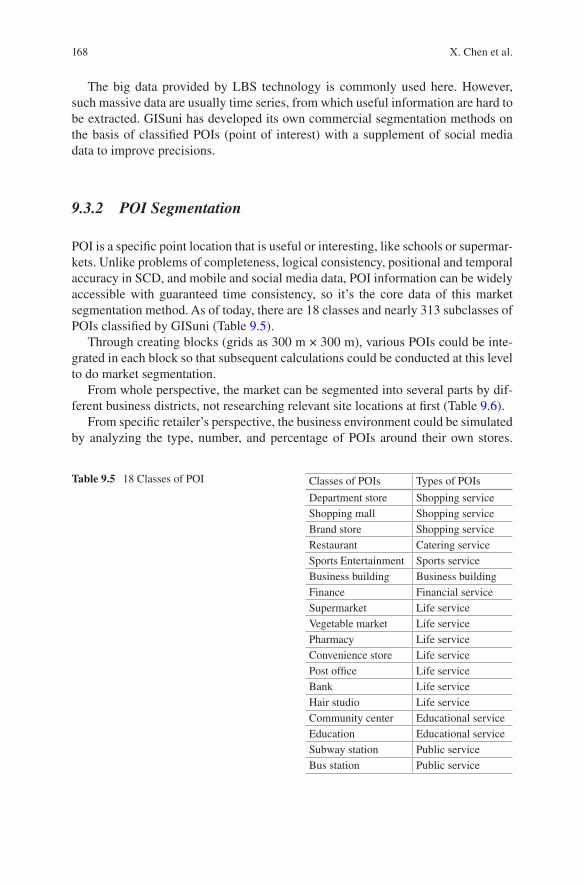
From whole perspective, the market can be segmented into several parts by dif-ferent business districts, not researching relevant site locations at first (Table 9.6).
From specific retailer’s perspective, the business environment could be simulated by analyzing the type, number, and percentage of POIs around their own stores.
Table 9.5 18 Classes of POI Classes of POIs Types of POIs
Department store Shopping serviceShopping mall Shopping serviceBrand store Shopping serviceRestaurant Catering serviceSports Entertainment Sports serviceBusiness building Business buildingFinance Financial serviceSupermarket Life serviceVegetable market Life servicePharmacy Life serviceConvenience store Life servicePost office Life serviceBank Life serviceHair studio Life serviceCommunity center Educational serviceEducation Educational serviceSubway station Public serviceBus station Public service
X. Chen et al.
169
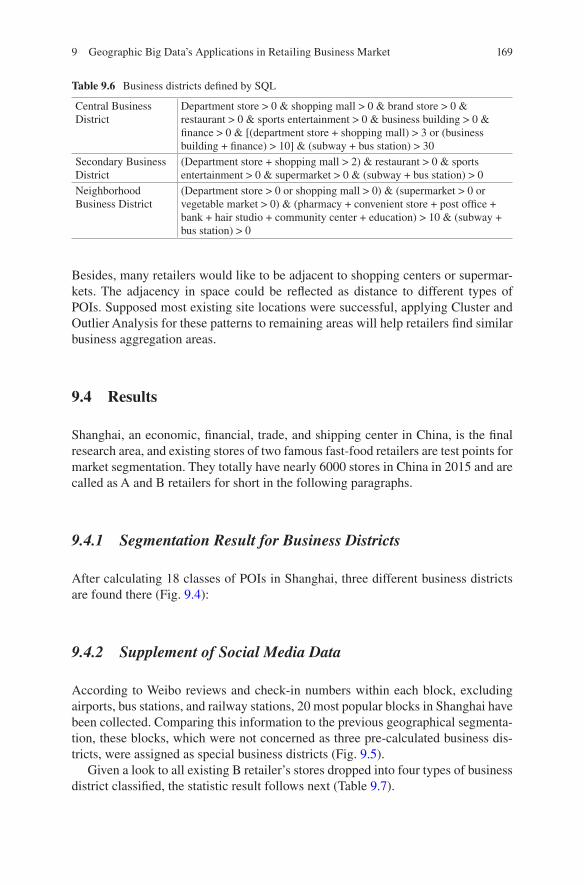
Besides, many retailers would like to be adjacent to shopping centers or supermar-kets. The adjacency in space could be reflected as distance to different types of POIs. Supposed most existing site locations were successful, applying Cluster and Outlier Analysis for these patterns to remaining areas will help retailers find similar business aggregation areas.
9.4 Results
Shanghai, an economic, financial, trade, and shipping center in China, is the final research area, and existing stores of two famous fast-food retailers are test points for market segmentation. They totally have nearly 6000 stores in China in 2015 and are called as A and B retailers for short in the following paragraphs.
9.4.1 Segmentation Result for Business Districts
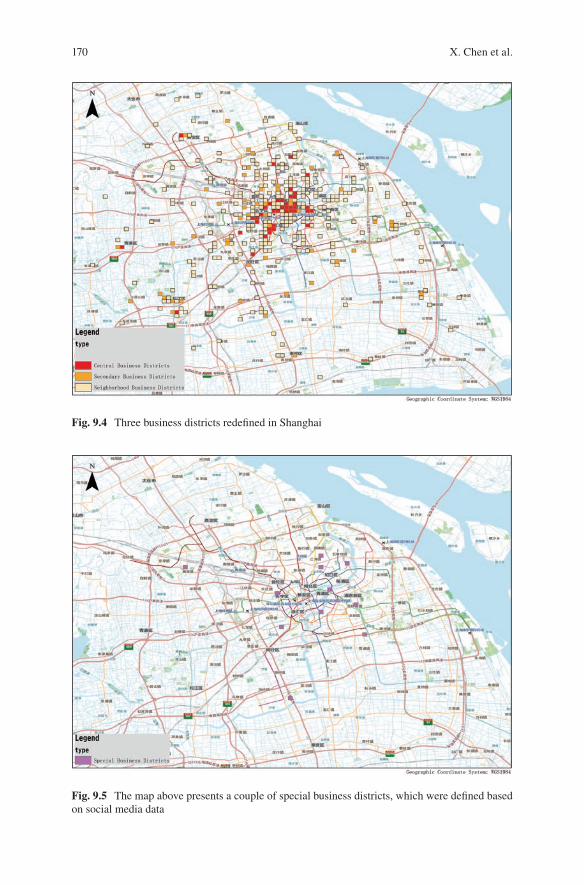
After calculating 18 classes of POIs in Shanghai, three different business districts are found there (Fig. 9.4):
9.4.2 Supplement of Social Media Data
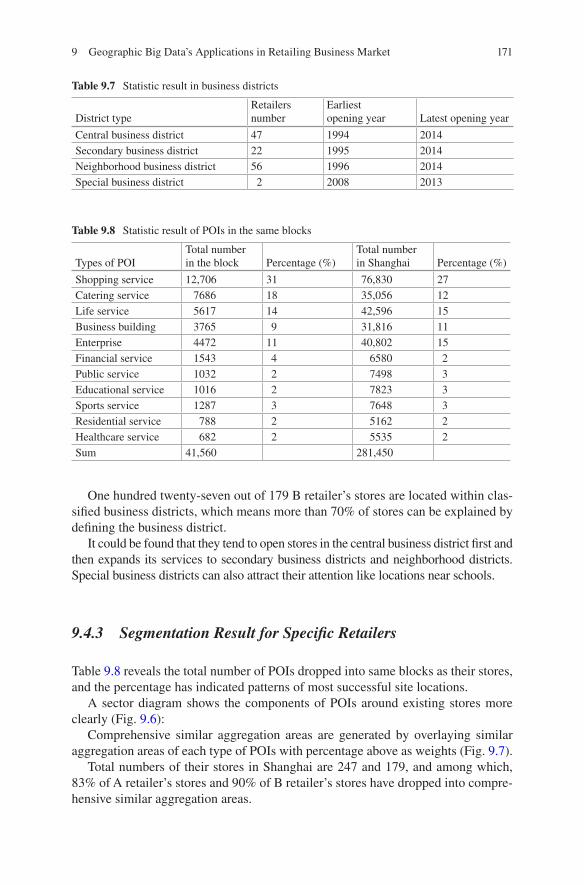
According to Weibo reviews and check-in numbers within each block, excluding airports, bus stations, and railway stations, 20 most popular blocks in Shanghai have been collected. Comparing this information to the previous geographical segmenta-tion, these blocks, which were not concerned as three pre-calculated business dis-tricts, were assigned as special business districts (Fig. 9.5).
Given a look to all existing B retailer’s stores dropped into four types of business district classified, the statistic result follows next (Table 9.7).
Table 9.6 Business districts defined by SQL
Central Business District
Department store > 0 & shopping mall > 0 & brand store > 0 & restaurant > 0 & sports entertainment > 0 & business building > 0 & finance > 0 & [(department store + shopping mall) > 3 or (business building + finance) > 10] & (subway + bus station) > 30
Secondary Business District
(Department store + shopping mall > 2) & restaurant > 0 & sports entertainment > 0 & supermarket > 0 & (subway + bus station) > 0
Neighborhood Business District
(Department store > 0 or shopping mall > 0) & (supermarket > 0 or vegetable market > 0) & (pharmacy + convenient store + post office + bank + hair studio + community center + education) > 10 & (subway + bus station) > 0
9 Geographic Big Data’s Applications in Retailing Business Market
170
Fig. 9.5 The map above presents a couple of special business districts, which were defined based on social media data
Fig. 9.4 Three business districts redefined in Shanghai
X. Chen et al.
171
One hundred twenty-seven out of 179 B retailer’s stores are located within clas-sified business districts, which means more than 70% of stores can be explained by defining the business district.
It could be found that they tend to open stores in the central business district first and then expands its services to secondary business districts and neighborhood districts. Special business districts can also attract their attention like locations near schools.
9.4.3 Segmentation Result for Specific Retailers
Table 9.8 reveals the total number of POIs dropped into same blocks as their stores, and the percentage has indicated patterns of most successful site locations.
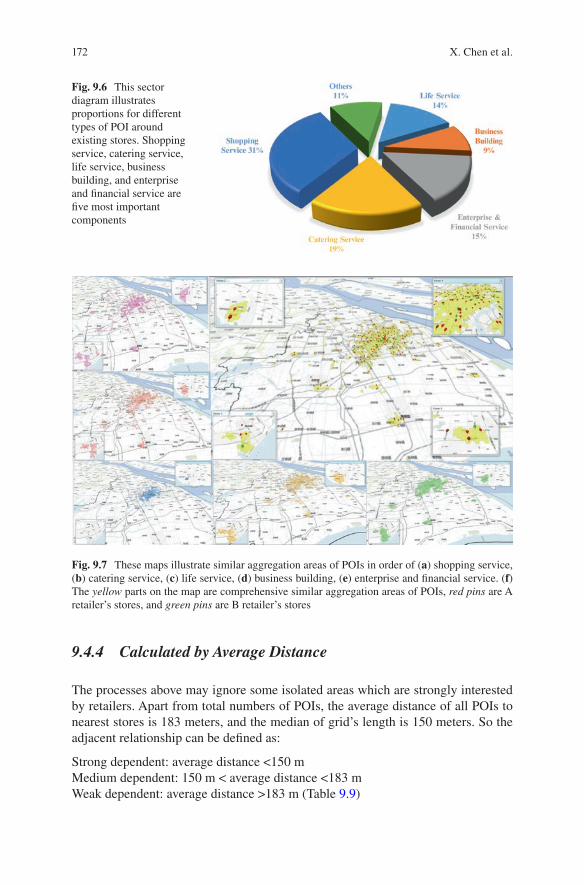
A sector diagram shows the components of POIs around existing stores more clearly (Fig. 9.6):
Comprehensive similar aggregation areas are generated by overlaying similar aggregation areas of each type of POIs with percentage above as weights (Fig. 9.7).
Total numbers of their stores in Shanghai are 247 and 179, and among which, 83% of A retailer’s stores and 90% of B retailer’s stores have dropped into compre-hensive similar aggregation areas.
Table 9.7 Statistic result in business districts
District typeRetailers number
Earliest opening year Latest opening year
Central business district 47 1994 2014Secondary business district 22 1995 2014Neighborhood business district 56 1996 2014Special business district 2 2008 2013
Table 9.8 Statistic result of POIs in the same blocks
Types of POITotal number in the block Percentage (%)
Total number in Shanghai Percentage (%)
Shopping service 12,706 31 76,830 27Catering service 7686 18 35,056 12Life service 5617 14 42,596 15Business building 3765 9 31,816 11Enterprise 4472 11 40,802 15Financial service 1543 4 6580 2Public service 1032 2 7498 3Educational service 1016 2 7823 3Sports service 1287 3 7648 3Residential service 788 2 5162 2Healthcare service 682 2 5535 2Sum 41,560 281,450
9 Geographic Big Data’s Applications in Retailing Business Market
172
9.4.4 Calculated by Average Distance
The processes above may ignore some isolated areas which are strongly interested by retailers. Apart from total numbers of POIs, the average distance of all POIs to nearest stores is 183 meters, and the median of grid’s length is 150 meters. So the adjacent relationship can be defined as:
Strong dependent: average distance <150 mMedium dependent: 150 m < average distance <183 mWeak dependent: average distance >183 m (Table 9.9)
Fig. 9.7 These maps illustrate similar aggregation areas of POIs in order of (a) shopping service, (b) catering service, (c) life service, (d) business building, (e) enterprise and financial service. (f) The yellow parts on the map are comprehensive similar aggregation areas of POIs, red pins are A retailer’s stores, and green pins are B retailer’s stores
Fig. 9.6 This sector diagram illustrates proportions for different types of POI around existing stores. Shopping service, catering service, life service, business building, and enterprise and financial service are five most important components
X. Chen et al.
173
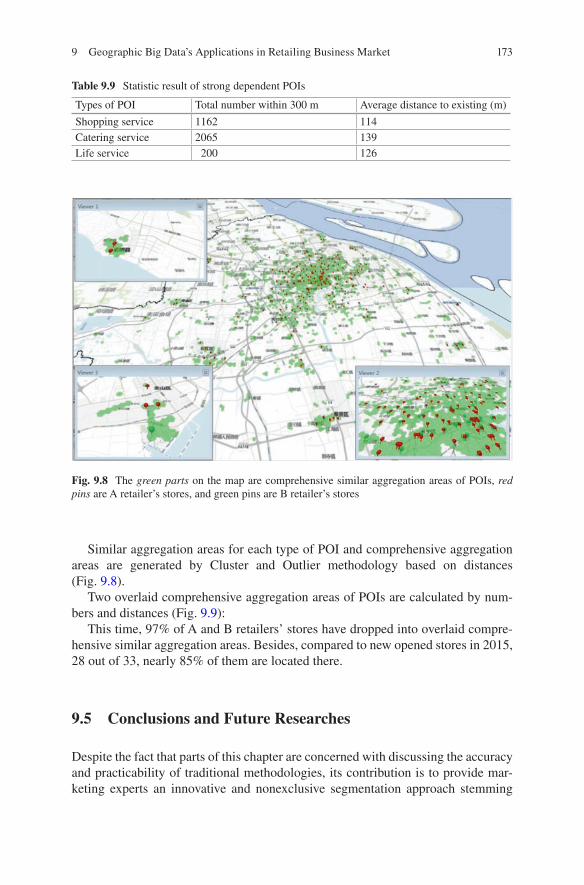
Similar aggregation areas for each type of POI and comprehensive aggregation areas are generated by Cluster and Outlier methodology based on distances (Fig. 9.8).
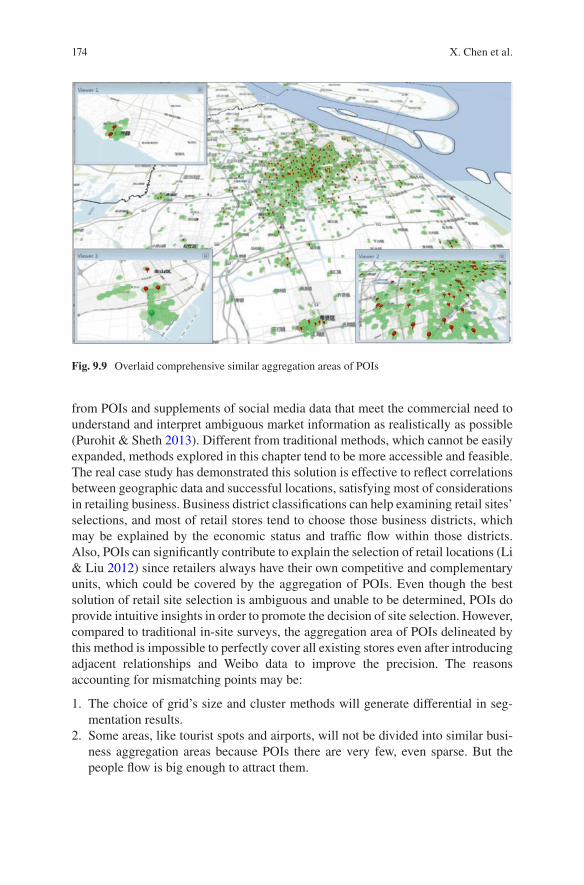
Two overlaid comprehensive aggregation areas of POIs are calculated by num-bers and distances (Fig. 9.9):
This time, 97% of A and B retailers’ stores have dropped into overlaid compre-hensive similar aggregation areas. Besides, compared to new opened stores in 2015, 28 out of 33, nearly 85% of them are located there.
9.5 Conclusions and Future Researches
Despite the fact that parts of this chapter are concerned with discussing the accuracy and practicability of traditional methodologies, its contribution is to provide mar-keting experts an innovative and nonexclusive segmentation approach stemming
Table 9.9 Statistic result of strong dependent POIs
Types of POI Total number within 300 m Average distance to existing (m)
Shopping service 1162 114Catering service 2065 139Life service 200 126
Fig. 9.8 The green parts on the map are comprehensive similar aggregation areas of POIs, red pins are A retailer’s stores, and green pins are B retailer’s stores
9 Geographic Big Data’s Applications in Retailing Business Market
174
from POIs and supplements of social media data that meet the commercial need to understand and interpret ambiguous market information as realistically as possible (Purohit & Sheth 2013). Different from traditional methods, which cannot be easily expanded, methods explored in this chapter tend to be more accessible and feasible. The real case study has demonstrated this solution is effective to reflect correlations between geographic data and successful locations, satisfying most of considerations in retailing business. Business district classifications can help examining retail sites’ selections, and most of retail stores tend to choose those business districts, which may be explained by the economic status and traffic flow within those districts. Also, POIs can significantly contribute to explain the selection of retail locations (Li & Liu 2012) since retailers always have their own competitive and complementary units, which could be covered by the aggregation of POIs. Even though the best solution of retail site selection is ambiguous and unable to be determined, POIs do provide intuitive insights in order to promote the decision of site selection. However, compared to traditional in-site surveys, the aggregation area of POIs delineated by this method is impossible to perfectly cover all existing stores even after introducing adjacent relationships and Weibo data to improve the precision. The reasons accounting for mismatching points may be:
1. The choice of grid’s size and cluster methods will generate differential in seg-mentation results.
2. Some areas, like tourist spots and airports, will not be divided into similar busi-ness aggregation areas because POIs there are very few, even sparse. But the people flow is big enough to attract them.
Fig. 9.9 Overlaid comprehensive similar aggregation areas of POIs
X. Chen et al.
175
Due to difficulties in distinguishing all locations for successful sites, there exist certain directions for future researches. First of all, the social media data not only just indicates spatial positions but also contains massive temporal and personal pref-erence information in comments. This can be dug further to find missed areas, thus increasing the accuracy of market segmentation. Secondly, some special factors like competitiveness and customers’ sensitiveness to travelling distance can also be included to narrow the range of final result. Only by adding more and more power-ful indicators step by step into analysis can this method be really responsive and accountable for decision makings. Besides, the regularity varies for different busi-ness formats, so principles of Cluster and Outlier should be adjusted associated with relevant requirements.
References
Berman, B., & Evans, J. R. (2012). Retail management: A strategic approach (12th ed.). Boston: Pearson.
Brooks, C., Patrick, J. K., et al. (2008). Trip chaining behavior in multi-destination shopping trips: A field experiment and laboratory replication. Journal of Retailing, 84(1), 29–38.
Brown, S. (1989). Form and Function in an Unplanned Retail Park: Evidence from the Abbey Trading Centre. Area, 21(2), 137–144.
Calabrese, F., & Ratti, C. (2006). Real time Rome. Networks and Communication Studies, 20, 247–258.
Cliquet, G. (2007). Geomarketing methods and strategies in spatial marketing. Washington, DC: ISTE Special Priced Titles.
Cressie, N., & Wikle, K. C. (2010). Statistics for spatio-temporal data. Hoboken, N.J.: Wiley.Duggal, N. (2008). Use of GIS in retail location analysis. Saarbrucken: VDM Verlag.Fenker, R. (2012). Using property scoring to find the right location. Retail Property Insights, 19(1),
32–34.Gambini, R., Huff, L. D., et al. (2005). Geometric properties of market areas. Papers in Regional
Science, 20(1), 85–92.Hernandez, T. (2007). Enhancing retail location decision support: The development and applica-
tion of geovisualization. Journal of Retailing and Consumer Services, 14(4), 249–258.Huff, D. L. (1964). Defining and Estimating a Trading Area. Journal of Marketing, 28(3), 34.Jerath, K., & Zhang, Z. J. (2010). Store within a store. Journal of Marketing Research, 47(4),
748–763.Kramer, A. (2010). Dollars & Cents of Shopping Centers/The SCORE 2010. Washington, DC:
Urban Land Institute.Levy, M., & Weitz, B. A. (2013). Retailing management. New York: McGraw Hill.Li, Y. R., & Liu, L. (2012). Assessing the impact of retail location on store performance: A com-
parison of Wal-Mart and Kmart stores in Cincinnati. Applied Geography, 32, 591–600.MacEachren, A. M., et al. (2011). Senseplace2: Geotwitter analytics support for situational aware-
ness. IEEE Conference On Visual Analytics Science and Technology (VAST) (pp. 181–190). Providence, RI: IEEE.
Mathioudakis, M., & Koudas, N. (2010). Twitter monitor: Trend detection over the twitter stream. In Proceedings of the 2010 ACM SIGMOD International Conference on Management of data (pp. 1155–1158). Indianapolis, IN, USA.
McDonald, M., & Dunbar, I. (2012). Market segmentation: How to do it and how to profit from it, revised 4th edition. Oxford: Butterworth-Heinemann.
9 Geographic Big Data’s Applications in Retailing Business Market
176
Miguéis, V. L., Camanho, A. S., et al. (2012). Customer data mining for lifestyle segmentation. Expert Systems with Applications, 39, 9359–9366.
Mover, M. S. (1972). Management science in retailing. Journal of Marketing, 36, 3–9.Ozuduru, B. (2009). Trade area modeling in retail location analysis. Saarbrucken: VDM Verlag.Purohit, H., & Sheth, A. (2013). Twitris v3: From citizen sensing to analysis, coordination and
action. In Proceedings of the 2013 International Conference on Weblogs and Social Media. Cambridge, Massachusetts, USA.
Rachel, J. C. (2007). Significance and variety of Geographic Information System (GIS) applica-tions in retail, hospitality, tourism, and consumer services. Journal of Retailing and Consumer Services, 14(4), 247–248.
Ratti, C., Frenchman, D., et al. (2006). Mobile Landscapes: Using Location Data from Cell Phones for Urban Analysis. Environment and Planning B: Planning and Design, 33(5), 727–748.
Reilly, W. J. (1953). The law of retail gravitation (2d ed.). New York: Pilsbury Publishers.Scott, P. (2007). Geography and retailing. Edison: Aldine Transaction.Swart, P. M., & Roodt, G. (2015). Market segmentation variables as moderators in the prediction
of business tourist retention. Service Business, 9, 491–513.Teller, C. (2008). Shopping streets versus shopping malls—Determinants of agglomeration format
attractiveness from the consumers’ point of view. International Review of Retail, Distribution and Consumer Research, 18(4), 381–403.
Teller, C., & Thomas, R. (2008). The evolving concept of retail attractiveness: What makes retail agglomerations attractive when customers shop at them? Journal of Retailing and Consumer Services, 15(3), 127–143.
Van, U. C. (2008). Malls & department stores. Berlin: Braun.Wood, S., & Sue, B. (2007). Convenience store location planning and forecasting—A practical
research. International Journal of Retail and Distribution Management, 35(4), 233–255.Yudelson, J. (2009). Sustainable retail development: New success strategies. New York: ICSC.Yan, R. N., & Eckman, M. (2009). Are lifestyle centers unique? Consumers’ perceptions across
locations. International Journal of Retail & Distribution Management, 37(1), 24–42.Zafarani, R., Abbasi, M. A., et al. (2014). Social media mining: An introduction. Cambridge
University Press.
X. Chen et al.