Embed Size (px)
Citation preview
Vol.7 (2017) No. 3
ISSN: 2088-5334
Big Data’s Tools for Internet Data Analytics: Modelling of System Dynamics
Feldiansyah Bin Bakri Nasution#, Nor Erne Nazira Bazin#, Daliyusmanto*, Andry Zulfikar+ # Computer Science Department, Universiti Teknologi Malaysia, Skudai, Johor, 81310, Malaysia
E-mail: [email protected]
*Computer Science Department, Universitas Riau, Panam, Pekanbaru, 28293, Indonesia
E-mail:[email protected]
+PT. ODP, Jakarta, 12930, Indonesia
E-mail:[email protected]
Abstract— In this paper, an application based on Apache Hadoop is deployed to gather, store and analyze the data from Internet, especially online and social media. Nowadays, this application is a common tool for media analysis. In our case, it is used to assist in the modelling of system dynamics. Basically, There are several tools that will be used, such as for file system, data crawling from the Internet, data indexing, data storage, and data analytics. The selection of technology is as the industrial trend. Surely, this is not the best approach, but as another perspective for modelling of system dynamics. A system dynamics model is developed to study the profitability of the telecommunication company and how the complaint or negative sentiment will impact to their profits. The clustering analytics is used to identify the components of the system. In continuation of the improvement process, the clustering analytics will be used not only as one time effort. It runs periodically to develop a better model of the system. Sentiment analysis tool is used as the input for one of the component, which is the complaint component. The sentiments are sourced from online and social media. Manual investigation and analytics of Internet data is required in developing the relation between the components. Keywords— Big Data; System Dynamics; Modelling;
I. INTRODUCTION
There are three things to be noted in this study. First, Big Data, it is a concept related to the increasing amount of data (Volume), the diversity of data (Variety) and growth rate of the data (Velocity) [1]. Technologist, businessman and academia need to address this issue to meet the target achievement and continually grow without constraint. Second, Internet as a source of data is a big pool consisting a variety of data. It consists of structured, semi-structured and unstructured data. There is other type of data, such as streaming data which is not in our concern at this moment. In this paper, the focus is on online and social media data, which the updating is not as frequent as streaming data. Third, System Dynamics [2]-[6] is a methodology based on the system theory that studies behaviour of the components of the system and its relations. The critical part of system dynamics is designing a model for simulation. A model is a mimic of the real system. The capability to analyse Internet complex data could be benefits in assisting creation of the
model of system dynamics. It is hard but it is possible [7]. The challenge is how to develop and run the analytics tools for Internet data, which is considered as Big Data to assist in identifying the components of the system and its relations [8]. A framework is needed to make the overall process clear. The simple one is by modifying one of the existing system dynamics framework and designing how it work collaboratively with Big Data. Clustering method is used to identify the new components. It runs continually and conducts the improvement at the same time. It’s a long way to be perfect, but this paper will become a good starting step for this approach.
The strength of the Big Data, Internet and system dynamics needs to be synergized to produce the optimum output. It requires the right tools to perform analytics against large data [8]. For a case study, the tool developed in this research is used to create a model of a simple system. The model is about profitability of one of GSM company in Indonesia. The questions addressed in this paper are (1) How the tools help in identifying the components? (2) How the sentiments from peoples that are recorded in the online and
745
brought to you by COREView metadata, citation and similar papers at core.ac.uk
provided by Universiti Teknologi Malaysia Institutional Repository
social media can be the input of one of the component? (3) How this complaint is able to impact the overall profits indirectly. Because of the lack of information in crawled data, designer analyse the data from online annual report of the company to establish relations between components.
II. MATERIAL AND METHOD
A. System Dynamics as the Method
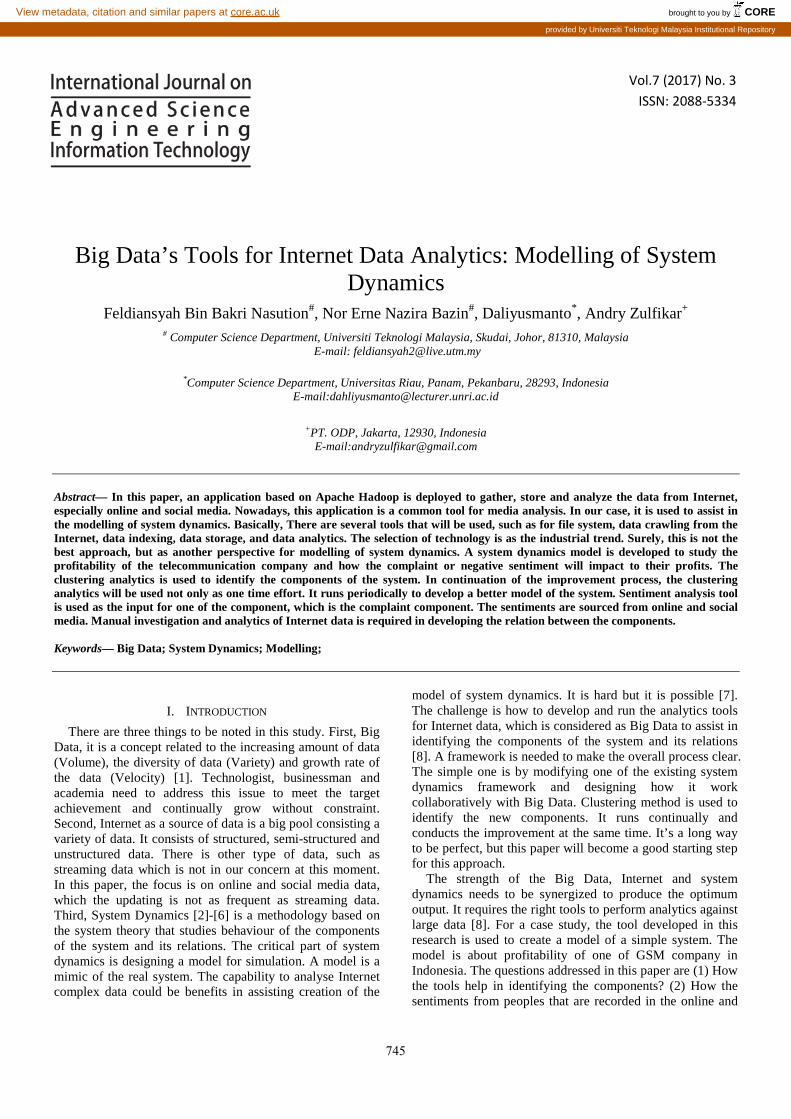
Here, a process framework based on system dynamics is created for processing the Internet data (Big Data) to build a model of a real system before running the simulation. In this paper, the framework is modified from Jay Forrester’s [2] (see Figure 1). But, there are other approaches as well which are discussed by some experts [6],[9].
Fig. 1 Framework of Big Data and modelling of System Dynamics
The analytics of Big Data is used to identify the
components of the system, the equation or input to/from the components, and also the relation between the components. The identified components and its relations become the foundation of the model. Designing a model is an art [10]. Subjectivity of the designer is depending on his/her own mental construct [11]-[13]. It is very dominant to everybody. Each designer has a different point of view when creating a model of a system even though the data is the same. A designer needs a double loop learning [14] capability to become more objective.
Here, we run the identification process of the model using the framework. The system involved is the profitability system in one of GSM company in Indonesia. In step 1, the designer needs some inputs in the identification of components of the systems and its relations. Input can be from designer’s mental construct or other’s opinion from others papers [15]-[19]. Another input is Big Data analytic of the Internet data crawling. Step 2 is created based on the data from Internet, other sources and also some assumptions. In our case, the Internet is the main data source. There is no ideal way to formulate the equations. Although this exact
calculation is an objective process, it could be full of subjectivity of the designer. It is known as subjective modelling in some papers [20]-[24].
Steps 3 until step 6 are the processes of running simulation with multiple scenarios or cases. Improvement is conducted in every step, and it’s not one time cycle. It could be repeated several times before finalizing a mature model.
The Big Data process supports the step 1 to identify the components of the system and relations between components and step 2 to provide any number calculation and correlation between components [8]. It could be done using assumptions, logic calculation, estimation and prediction. In some cases, intelligent processes are conducted. Unfortunately, data and information of Big Data do not always satisfy the designer to achieve a purpose.
B. Source of Data
On this occasion, the data is acquired in large amounts from Internet, which source is from online and social media. Each of them has their own characteristics. Online media or digital media is basically news in the Internet. The data and information is published on their formal web site. It is commonly unstructured data [25]. Social media, such as Facebook, Twitter, and YouTube is very popular at this moment. There are many fake identities and information in the social media [26]-[30]. This happens if the issues are related to crimes and politics, especially in non-democratic country. As Indonesia has Information Technology Regulation to protect this issues and enforcement commitment from the government, it will be ignored at this moment. Fortunately, most of the complaints on the services on the telecommunication [31] are really from the unsatisfied customer, even if it is using a fake identity. In this research, the online media is the popular ones in Indonesia. The social media is only Twitter.
C. Software Application for Data Analytics
It is identified that some application softwares are required to support the data analytics process, such as:
• Operating System (OS). • File System • Application, such as Web Application, Data
Crawler Application and Geospatial Application • Database, such as NoSQL and SQL • Analytics Application • Cluster Management (optional)
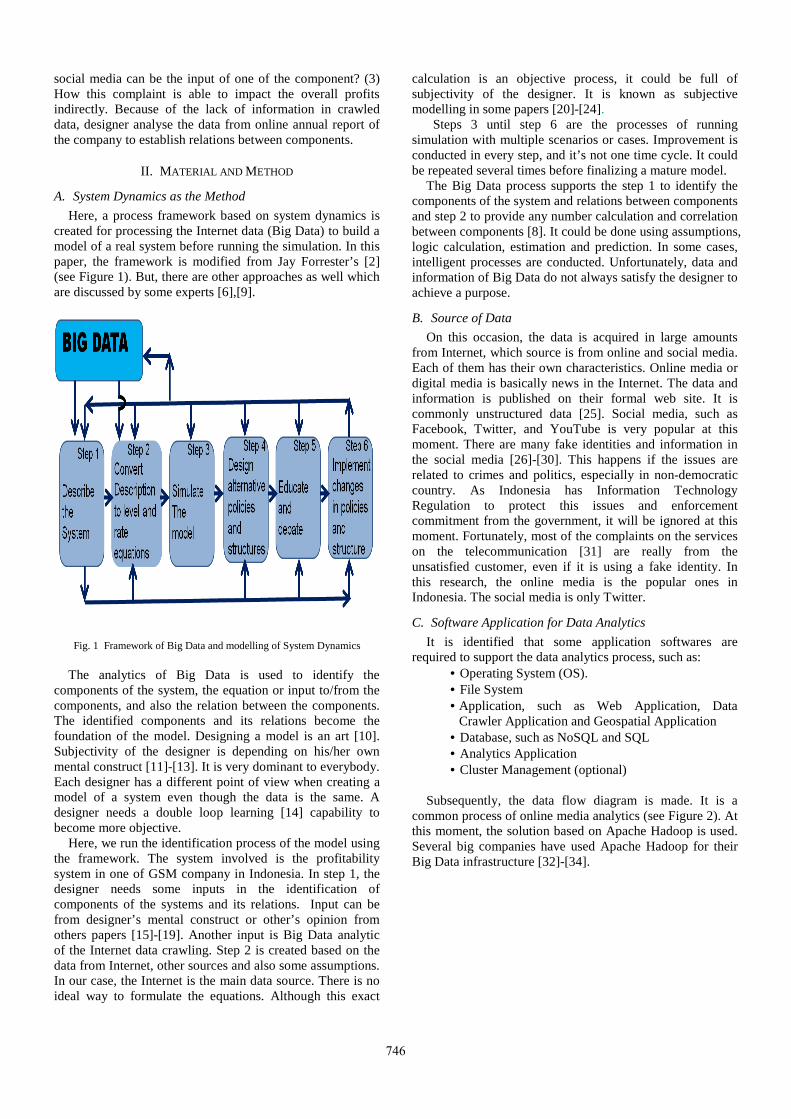
Subsequently, the data flow diagram is made. It is a
common process of online media analytics (see Figure 2). At this moment, the solution based on Apache Hadoop is used. Several big companies have used Apache Hadoop for their Big Data infrastructure [32]-[34].
746
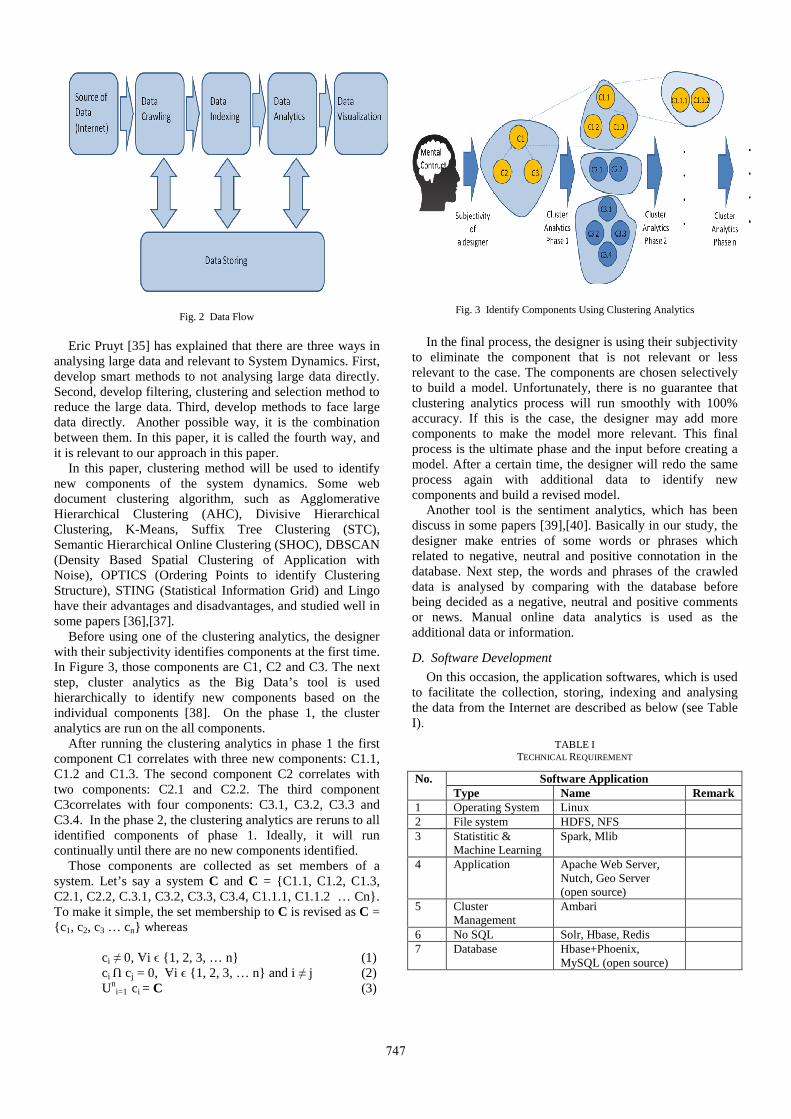
Fig. 2 Data Flow Eric Pruyt [35] has explained that there are three ways in
analysing large data and relevant to System Dynamics. First, develop smart methods to not analysing large data directly. Second, develop filtering, clustering and selection method to reduce the large data. Third, develop methods to face large data directly. Another possible way, it is the combination between them. In this paper, it is called the fourth way, and it is relevant to our approach in this paper.
In this paper, clustering method will be used to identify new components of the system dynamics. Some web document clustering algorithm, such as Agglomerative Hierarchical Clustering (AHC), Divisive Hierarchical Clustering, K-Means, Suffix Tree Clustering (STC), Semantic Hierarchical Online Clustering (SHOC), DBSCAN (Density Based Spatial Clustering of Application with Noise), OPTICS (Ordering Points to identify Clustering Structure), STING (Statistical Information Grid) and Lingo have their advantages and disadvantages, and studied well in some papers [36],[37].
Before using one of the clustering analytics, the designer with their subjectivity identifies components at the first time. In Figure 3, those components are C1, C2 and C3. The next step, cluster analytics as the Big Data’s tool is used hierarchically to identify new components based on the individual components [38]. On the phase 1, the cluster analytics are run on the all components.
After running the clustering analytics in phase 1 the first component C1 correlates with three new components: C1.1, C1.2 and C1.3. The second component C2 correlates with two components: C2.1 and C2.2. The third component C3correlates with four components: C3.1, C3.2, C3.3 and C3.4. In the phase 2, the clustering analytics are reruns to all identified components of phase 1. Ideally, it will run continually until there are no new components identified.
Those components are collected as set members of a system. Let’s say a system C and C = {C1.1, C1.2, C1.3, C2.1, C2.2, C.3.1, C3.2, C3.3, C3.4, C1.1.1, C1.1.2 … Cn}. To make it simple, the set membership to C is revised as C = {c1, c2, c3 … cn} whereas
ci ≠ 0, Ɐi ϵ {1, 2, 3, … n} (1) ci Ո cj = 0, Ɐi ϵ {1, 2, 3, … n} and i ≠ j (2) Un
i=1 ci = C (3)
Fig. 3 Identify Components Using Clustering Analytics
In the final process, the designer is using their subjectivity
to eliminate the component that is not relevant or less relevant to the case. The components are chosen selectively to build a model. Unfortunately, there is no guarantee that clustering analytics process will run smoothly with 100% accuracy. If this is the case, the designer may add more components to make the model more relevant. This final process is the ultimate phase and the input before creating a model. After a certain time, the designer will redo the same process again with additional data to identify new components and build a revised model.
Another tool is the sentiment analytics, which has been discuss in some papers [39],[40]. Basically in our study, the designer make entries of some words or phrases which related to negative, neutral and positive connotation in the database. Next step, the words and phrases of the crawled data is analysed by comparing with the database before being decided as a negative, neutral and positive comments or news. Manual online data analytics is used as the additional data or information.
D. Software Development
On this occasion, the application softwares, which is used to facilitate the collection, storing, indexing and analysing the data from the Internet are described as below (see Table I).
TABLE I TECHNICAL REQUIREMENT
No. Software Application Type Name Remark
1 Operating System Linux 2 File system HDFS, NFS 3 Statistitic &
Machine Learning Spark, Mlib
4 Application Apache Web Server, Nutch, Geo Server (open source)
5 Cluster Management
Ambari
6 No SQL Solr, Hbase, Redis 7 Database Hbase+Phoenix,
MySQL (open source)
747
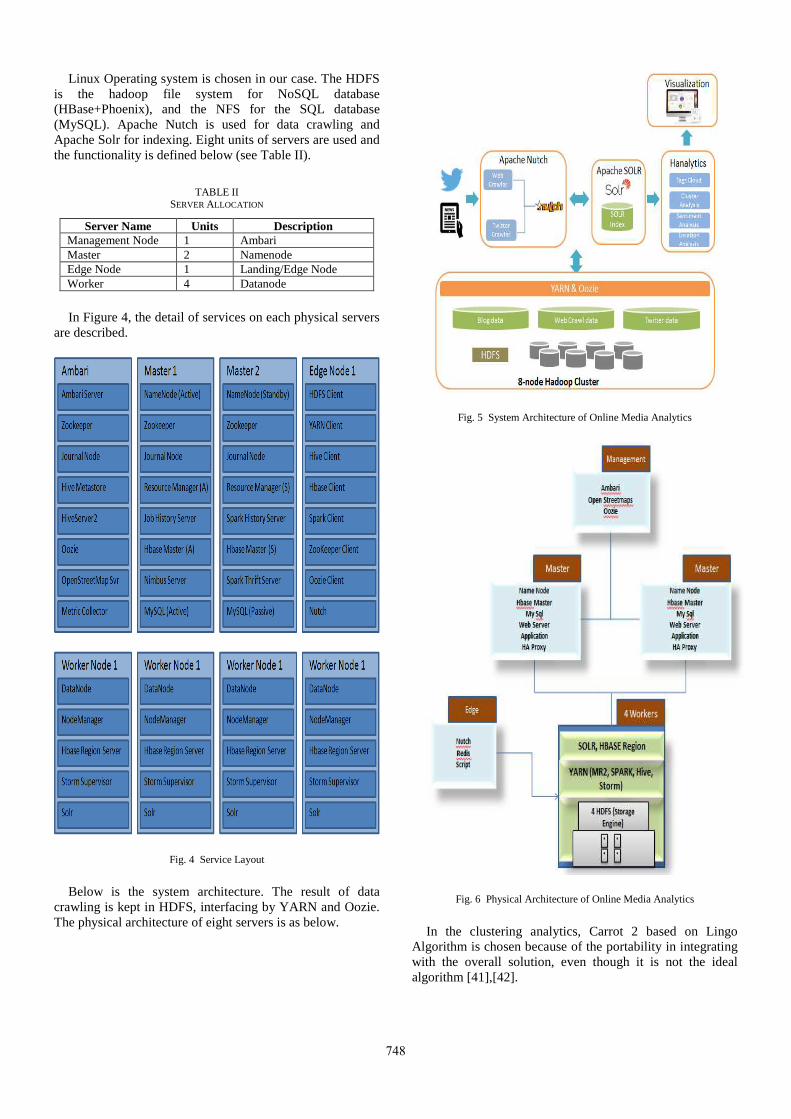
Linux Operating system is chosen in our case. The HDFS is the hadoop file system for NoSQL database (HBase+Phoenix), and the NFS for the SQL database (MySQL). Apache Nutch is used for data crawling and Apache Solr for indexing. Eight units of servers are used and the functionality is defined below (see Table II).
TABLE II SERVER ALLOCATION
Server Name Units Description Management Node 1 Ambari Master 2 Namenode Edge Node 1 Landing/Edge Node Worker 4 Datanode
In Figure 4, the detail of services on each physical servers
are described.
Fig. 4 Service Layout
Below is the system architecture. The result of data
crawling is kept in HDFS, interfacing by YARN and Oozie. The physical architecture of eight servers is as below.
Fig. 5 System Architecture of Online Media Analytics
Fig. 6 Physical Architecture of Online Media Analytics
In the clustering analytics, Carrot 2 based on Lingo
Algorithm is chosen because of the portability in integrating with the overall solution, even though it is not the ideal algorithm [41],[42].
748
III. RESULTS AND DISCUSSION
Application software is only tool. Expertise of a designer of system dynamics is still required to develop a model. The designer needs his/her own idea or mental construct. In our case, one of the functions of the application software is used to identify components of the system.
Fig. 7 Model state 1
Creation of model of system dynamics is not a one-time
effort, but it is a continual process. In other papers [43],[44], it is called as system breakdown structure (SBS). The first state of the model is created by intuition of the designer. It is full of subjectivity. But, the more expert is the designer, the more objective is the model. The objectivity is more dominant by utilizing more and intensive data. Based on the feedback from some experts [15]-[19], the model of profitability of GSM company is simplified as above (see Figure 7). The SBS has not been run on this state.
Model is evolved as the designer find new components and new relations or modification of the existing components and its relations. In our context, Cluster Analytic, one of the features that exist in the application software is used to identify the new components and relations. It identifies the words on the online media and clusters it. There are few key words that are used in this analytics. It is related to the components of model state 1 which are “Profits(1)”, “Subscriber(2)”, “Advertisement/Promotion(3)” (see Figure 8 for one of the result, “Pelanggan/Subscriber”).
Fig. 8 Clustering Analytics of “Pelanggan (Subscriber)”
Fig. 9 Clustering Analytics of “Biaya (Cost)”
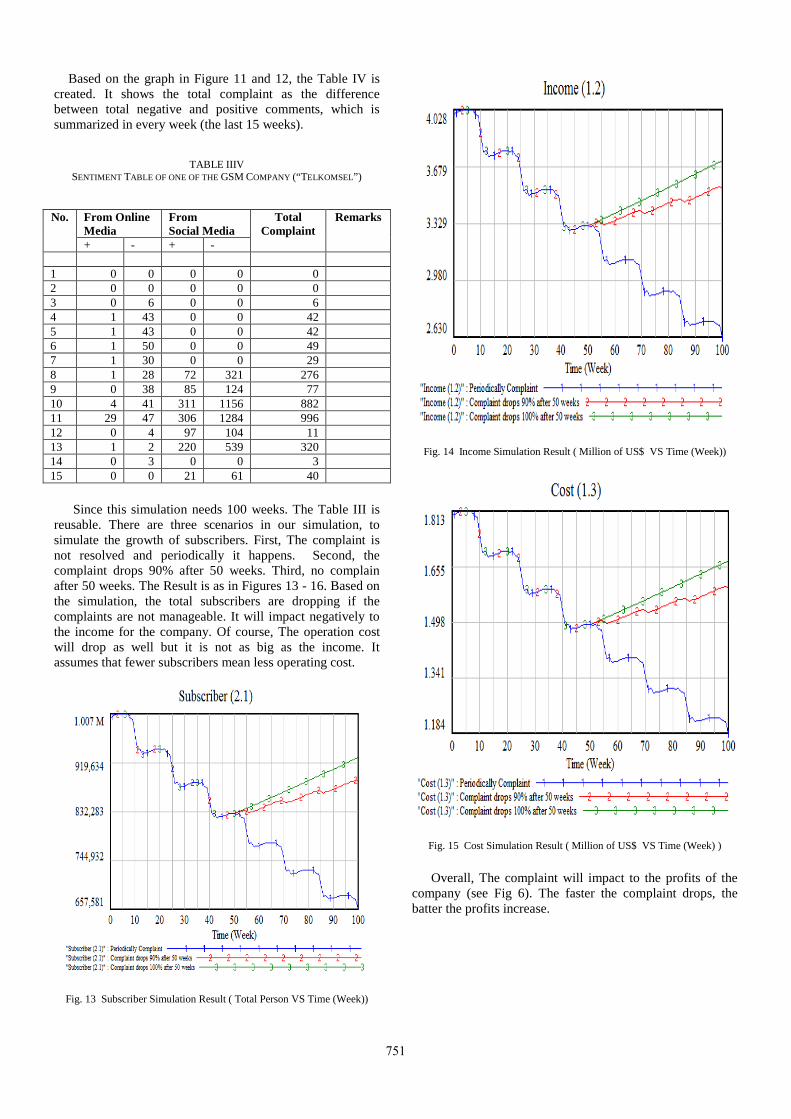
There are few components identified in cluster analytics
of “Subscriber”, such as “Cost”, “Competitor” and “Cyber Crime”. It is a continual process. If clustering analytics on the “Cost” as the key of cluster analytics, it gives “Operation Cost”, “Internet”, “Politics or Policy”, “Price” and “Infrastructure Development”. The process is continual until no new component is identified.
SBS is run using clustering analytics of Big Data of online media. The identification of new components is strongly related to the content of online media, because the input is from online media. This tool is helpful in identifying new components associated with the system. After collecting several components, the designer needs to use their expertise to selectively choose the components. The designer selects some components that are relevant to the purpose.
Next, the model state 2 is created as below (see Figure 10) after selectively choosing all the identified components. It is recommended to run this clustering analytics periodically to identify new components for the future, as almost all of the systems are dynamics.
The created model of system deals with the profit of a communications company and the effect of customer satisfaction to the profitability. Another analytic, which is sentiment analytics, will become the input to one of the component.
749
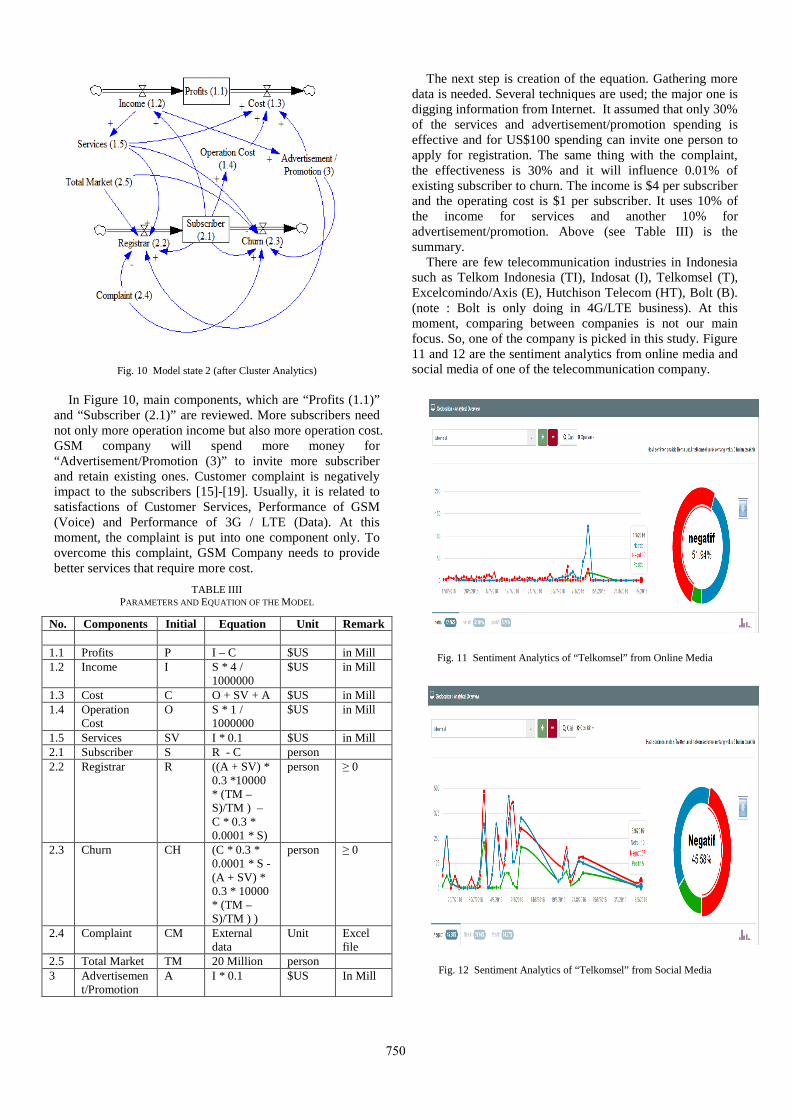
Fig. 10 Model state 2 (after Cluster Analytics) In Figure 10, main components, which are “Profits (1.1)”
and “Subscriber (2.1)” are reviewed. More subscribers need not only more operation income but also more operation cost. GSM company will spend more money for “Advertisement/Promotion (3)” to invite more subscriber and retain existing ones. Customer complaint is negatively impact to the subscribers [15]-[19]. Usually, it is related to satisfactions of Customer Services, Performance of GSM (Voice) and Performance of 3G / LTE (Data). At this moment, the complaint is put into one component only. To overcome this complaint, GSM Company needs to provide better services that require more cost.
TABLE IIII PARAMETERS AND EQUATION OF THE MODEL
No. Components Initial Equation Unit Remark 1.1 Profits P I – C $US in Mill 1.2 Income I S * 4 /
1000000 $US in Mill
1.3 Cost C O + SV + A $US in Mill 1.4 Operation
Cost O S * 1 /
1000000 $US in Mill
1.5 Services SV I * 0.1 $US in Mill 2.1 Subscriber S R - C person 2.2 Registrar R ((A + SV) *
0.3 *10000 * (TM – S)/TM ) – C * 0.3 * 0.0001 * S)
person ≥ 0
2.3 Churn CH (C * 0.3 * 0.0001 * S - (A + SV) * 0.3 * 10000 * (TM – S)/TM ) )
person ≥ 0
2.4 Complaint CM External data
Unit Excel file
2.5 Total Market TM 20 Million person 3 Advertisemen
t/Promotion A I * 0.1 $US In Mill
The next step is creation of the equation. Gathering more data is needed. Several techniques are used; the major one is digging information from Internet. It assumed that only 30% of the services and advertisement/promotion spending is effective and for US$100 spending can invite one person to apply for registration. The same thing with the complaint, the effectiveness is 30% and it will influence 0.01% of existing subscriber to churn. The income is $4 per subscriber and the operating cost is $1 per subscriber. It uses 10% of the income for services and another 10% for advertisement/promotion. Above (see Table III) is the summary.
There are few telecommunication industries in Indonesia such as Telkom Indonesia (TI), Indosat (I), Telkomsel (T), Excelcomindo/Axis (E), Hutchison Telecom (HT), Bolt (B). (note : Bolt is only doing in 4G/LTE business). At this moment, comparing between companies is not our main focus. So, one of the company is picked in this study. Figure 11 and 12 are the sentiment analytics from online media and social media of one of the telecommunication company.
Fig. 11 Sentiment Analytics of “Telkomsel” from Online Media
Fig. 12 Sentiment Analytics of “Telkomsel” from Social Media
750
Based on the graph in Figure 11 and 12, the Table IV is created. It shows the total complaint as the difference between total negative and positive comments, which is summarized in every week (the last 15 weeks).
TABLE IIIV
SENTIMENT TABLE OF ONE OF THE GSM COMPANY (“TELKOMSEL”)
No. From Online
Media From Social Media
Total Complaint
Remarks
+ - + - 1 0 0 0 0 0 2 0 0 0 0 0 3 0 6 0 0 6 4 1 43 0 0 42 5 1 43 0 0 42 6 1 50 0 0 49 7 1 30 0 0 29 8 1 28 72 321 276 9 0 38 85 124 77 10 4 41 311 1156 882 11 29 47 306 1284 996 12 0 4 97 104 11 13 1 2 220 539 320 14 0 3 0 0 3 15 0 0 21 61 40
Since this simulation needs 100 weeks. The Table III is
reusable. There are three scenarios in our simulation, to simulate the growth of subscribers. First, The complaint is not resolved and periodically it happens. Second, the complaint drops 90% after 50 weeks. Third, no complain after 50 weeks. The Result is as in Figures 13 - 16. Based on the simulation, the total subscribers are dropping if the complaints are not manageable. It will impact negatively to the income for the company. Of course, The operation cost will drop as well but it is not as big as the income. It assumes that fewer subscribers mean less operating cost.
Fig. 13 Subscriber Simulation Result ( Total Person VS Time (Week))
Fig. 14 Income Simulation Result ( Million of US$ VS Time (Week))
Fig. 15 Cost Simulation Result ( Million of US$ VS Time (Week) )
Overall, The complaint will impact to the profits of the
company (see Fig 6). The faster the complaint drops, the batter the profits increase.
751
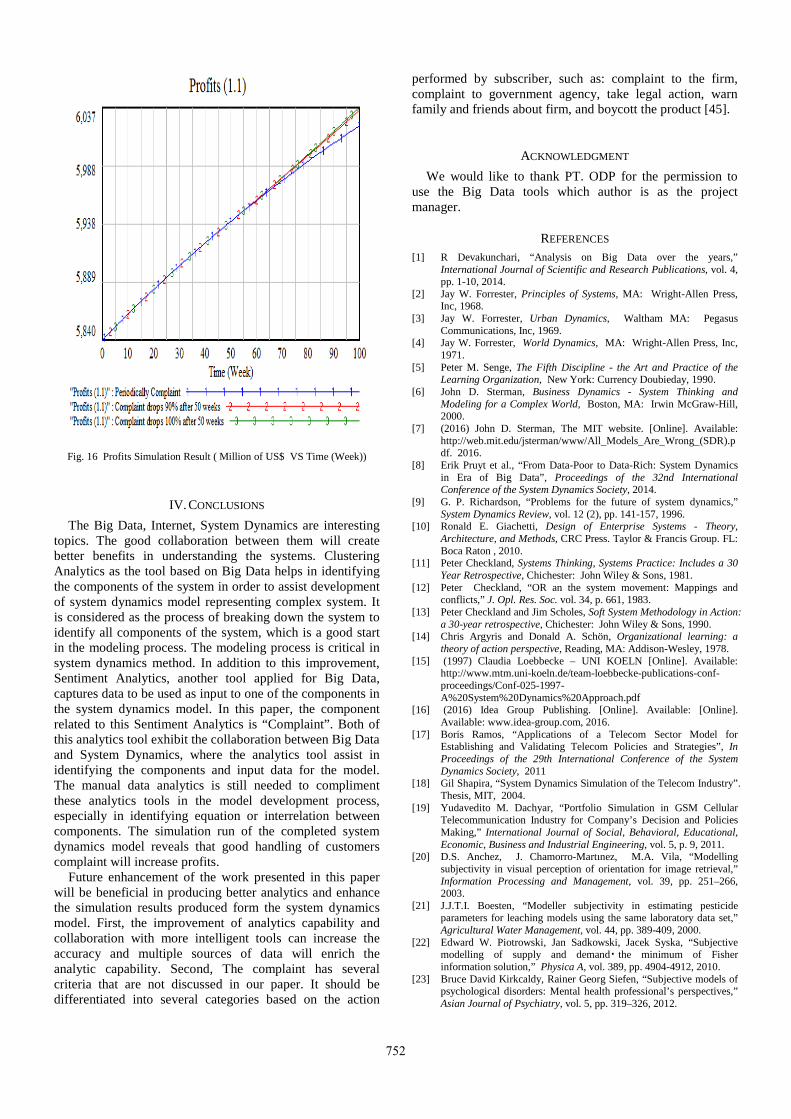
Fig. 16 Profits Simulation Result ( Million of US$ VS Time (Week))
IV. CONCLUSIONS
The Big Data, Internet, System Dynamics are interesting topics. The good collaboration between them will create better benefits in understanding the systems. Clustering Analytics as the tool based on Big Data helps in identifying the components of the system in order to assist development of system dynamics model representing complex system. It is considered as the process of breaking down the system to identify all components of the system, which is a good start in the modeling process. The modeling process is critical in system dynamics method. In addition to this improvement, Sentiment Analytics, another tool applied for Big Data, captures data to be used as input to one of the components in the system dynamics model. In this paper, the component related to this Sentiment Analytics is “Complaint”. Both of this analytics tool exhibit the collaboration between Big Data and System Dynamics, where the analytics tool assist in identifying the components and input data for the model. The manual data analytics is still needed to compliment these analytics tools in the model development process, especially in identifying equation or interrelation between components. The simulation run of the completed system dynamics model reveals that good handling of customers complaint will increase profits.
Future enhancement of the work presented in this paper will be beneficial in producing better analytics and enhance the simulation results produced form the system dynamics model. First, the improvement of analytics capability and collaboration with more intelligent tools can increase the accuracy and multiple sources of data will enrich the analytic capability. Second, The complaint has several criteria that are not discussed in our paper. It should be differentiated into several categories based on the action
performed by subscriber, such as: complaint to the firm, complaint to government agency, take legal action, warn family and friends about firm, and boycott the product [45].
ACKNOWLEDGMENT
We would like to thank PT. ODP for the permission to use the Big Data tools which author is as the project manager.
REFERENCES [1] R Devakunchari, “Analysis on Big Data over the years,”
International Journal of Scientific and Research Publications, vol. 4, pp. 1-10, 2014.
[2] Jay W. Forrester, Principles of Systems, MA: Wright-Allen Press, Inc, 1968.
[3] Jay W. Forrester, Urban Dynamics, Waltham MA: Pegasus Communications, Inc, 1969.
[4] Jay W. Forrester, World Dynamics, MA: Wright-Allen Press, Inc, 1971.
[5] Peter M. Senge, The Fifth Discipline - the Art and Practice of the Learning Organization, New York: Currency Doubieday, 1990.
[6] John D. Sterman, Business Dynamics - System Thinking and Modeling for a Complex World, Boston, MA: Irwin McGraw-Hill, 2000.
[7] (2016) John D. Sterman, The MIT website. [Online]. Available: http://web.mit.edu/jsterman/www/All_Models_Are_Wrong_(SDR).pdf. 2016.
[8] Erik Pruyt et al., “From Data-Poor to Data-Rich: System Dynamics in Era of Big Data”, Proceedings of the 32nd International Conference of the System Dynamics Society, 2014.
[9] G. P. Richardson, “Problems for the future of system dynamics,” System Dynamics Review, vol. 12 (2), pp. 141-157, 1996.
[10] Ronald E. Giachetti, Design of Enterprise Systems - Theory, Architecture, and Methods, CRC Press. Taylor & Francis Group. FL: Boca Raton , 2010.
[11] Peter Checkland, Systems Thinking, Systems Practice: Includes a 30 Year Retrospective, Chichester: John Wiley & Sons, 1981.
[12] Peter Checkland, “OR an the system movement: Mappings and conflicts,” J. Opl. Res. Soc. vol. 34, p. 661, 1983.
[13] Peter Checkland and Jim Scholes, Soft System Methodology in Action: a 30-year retrospective, Chichester: John Wiley & Sons, 1990.
[14] Chris Argyris and Donald A. Schön, Organizational learning: a theory of action perspective, Reading, MA: Addison-Wesley, 1978.
[15] (1997) Claudia Loebbecke – UNI KOELN [Online]. Available: http://www.mtm.uni-koeln.de/team-loebbecke-publications-conf-proceedings/Conf-025-1997-A%20System%20Dynamics%20Approach.pdf
[16] (2016) Idea Group Publishing. [Online]. Available: [Online]. Available: www.idea-group.com, 2016.
[17] Boris Ramos, “Applications of a Telecom Sector Model for Establishing and Validating Telecom Policies and Strategies”, In Proceedings of the 29th International Conference of the System Dynamics Society, 2011
[18] Gil Shapira, “System Dynamics Simulation of the Telecom Industry”. Thesis, MIT, 2004.
[19] Yudavedito M. Dachyar, “Portfolio Simulation in GSM Cellular Telecommunication Industry for Company’s Decision and Policies Making,” International Journal of Social, Behavioral, Educational, Economic, Business and Industrial Engineering, vol. 5, p. 9, 2011.
[20] D.S. Anchez, J. Chamorro-Martınez, M.A. Vila, “Modelling subjectivity in visual perception of orientation for image retrieval,” Information Processing and Management, vol. 39, pp. 251–266, 2003.
[21] J.J.T.I. Boesten, “Modeller subjectivity in estimating pesticide parameters for leaching models using the same laboratory data set,” Agricultural Water Management, vol. 44, pp. 389-409, 2000.
[22] Edward W. Piotrowski, Jan Sadkowski, Jacek Syska, “Subjective �modelling of supply and demand the minimum of Fisher
information solution,” Physica A, vol. 389, pp. 4904-4912, 2010. [23] Bruce David Kirkcaldy, Rainer Georg Siefen, “Subjective models of
psychological disorders: Mental health professional’s perspectives,” Asian Journal of Psychiatry, vol. 5, pp. 319–326, 2012.
752
[24] P. Sebastian, Y. Ledoux, A. Collignan, J. Pailhes, “Linking objective and subjective modeling in engineering design through arc-elastic dominance,” Expert Systems with Applications, vol. 39, pp. 7743–7756, 2012.
[25] (2015) Steven Hagan – Oracle. [Online]. Available: www.oracle.com
[26] Mauro Conti, Radha Poovendran, Marco Secchiero, “FakeBook: Detecting Fake Profiles in On-line Social Networks”, 2012 IEEE/ACM International Conference on Advances in Social Networks Analysis and Mining, 2012.
[27] Mohammad Reza Khayyambashi, Fatemeh Salehi Rizi, “An approach for detecting profile cloning in online social networks,” 7th International Conference on e-commerce in Developing countries with focus on e-security, 2013.
[28] M.A Devmane, N.K. Rana, “Detection and Prevention of Profile Cloning in Online Social Networks,” IEEE International Conference on Recent Advances and Innovations in Engineering (ICRAI E - 2014), 2014.
[29] Piotr Bródka, Mateusz Sobas, Henric Johnson,”Profile Cloning Detection in Social Networks,” 2014 European Network Intelligence Conference, 2014.
[30] Kiruthiaga S., Kola Sujatha. P, Kannan A, “Detecting Cloning Attack in Social Networks Using Classification and Clustering Techniques,” 2014 International Conference on Recent Trends in Information Technology, 2014
[31] M. Ghiassi, J. Skinner, D. Zimbra, “Twitter brand sentiment analysis: A hybrid system using n-gram analysis and dynamic artificial neural network,” Expert Systems with Applications, vol. 40, pp. 6266–6282, 2013.
[32] (2013) Thomas Davenport, Jill Dyche. [Online]. Available: https://www.sas.com/resources/asset/Big-Data-in-Big-Companies.pdf
[33] (2014) Dezyre. [Online]. Available: https://www.dezyre.com/article/top-10-industries-using-big-data-and-121-companies-who-hire-hadoop-developers/69, 2014
[34] (2016) McKinsey. [Online]. Available: http://www.mckinsey.com/business-functions/mckinsey-analytics/our-insights/how-companies-are-using-big-data-and-analytics
[35] Eric Pruyt, “Integrating System Modelling and Data Science: The Join Future of Simulation and ‘Big Data’ Science,” International Journal of System Dynamics Applications, vol 5, p. 1, 2016.
[36] Harshada S. Deshmukh, P. L. Ramteke, “Comparing The Techniques of Cluster Analysis for Big Data,” International Journal of Advanced Research in Computer Engineering & Technology (IJARCET) vol. 4, p. 12, 2015.
[37] Pragna Makwana, Soni,Neha, “Analysis and Comparison of Web Document Clustering Algorithms with Lingo,” International Journal of Engineering Research & Technology (IJERT), vol. 2, p. 2, 2013.
[38] Feldiansyah B.B.N and Nor E.N.B , “Creating Model with System Breakdown Structure (SBS) for System Dynamics Approach”, Universiti Teknologi Malaysia, Skudai, Johor, Malaysia, 2016.
[39] Merfat M Altawaier and Sabrina Tiun, “Comparison of Machine Learning Approaches on Arabic Twitter Sentiment Analysis,” International Journal on Advanced Science Engineering Information Technology (IJASEIT), vol. 6 (6), pp. 1067-1073, 2016.
[40] Siti Rohaidah Ahmad, Mohd Ridzwan Yaakub and Azuraliza Abu Bakar,”Detecting Relationship between Features and Sentiment Words using Hybrid of Typed Dependency Relations Layer and POS Tagging (TDR Layer POS Tags) Algorithm,” International Journal on Advanced Science Engineering Information Technology (IJASEIT), vol. 6 (6), pp. 1120-1126, 2016.
[41] Stanislaw Osinski, Dawid Weiss, “Conceptual Clustering Using Lingo Algorithm: Evaluation on Open Directory Project Data”, in Intelligent Information Processing and Web Mining, vol. 25, pp. 369-377, 2004.
[42] Claudio Carpineto, Stanislaw Osinski, Giovanni Romano, Dawid Weiss, “A Survey of Web Clustering Engines,” ACM Computing Surveys, vol. 41, p. 3, Jul. 2009.
[43] Feldiansyah B.B.N, Nor E.N.B, Putranto Prayudhi, and Yusmar Affandy, “Public policy of hydrocarbon productivity optimization for oleo- and petrochemical industry: system dynamics approach (Case Study : Hydrocarbon Consumption in Riau Province, Indonesia),” International Conference on Oleo- and PetroChemical Engineering 2015 (ICOOPChe 2015), 2015.
[44] Feldiansyah B.B.N, Nor E.N.B, “Adjusting ICT Capacity Planning by Minimizing Cyber Crime Effects in Urban Area: A System Dynamics Approach,” International Journal of Electrical and Computer Engineering. Vol. 4, pp. 668-678, 2014.
[45] Simon Gyasi Nimako, “Customer Dissatisfaction and Complaining Responses Towards Mobile Telephony Services,” The African Journal of Information Systems, vol 4, p. 3, Jul. 2012.
753


![Big Data Analytics & Privacy: How To Resolve This Paradox? · across all industries recognize Big Data’s value and seek to harness its potential. For example (see also [Klou15]](https://img.pdfslide.net/doc/110x75/5fa376782ce2e260754893c8/big-data-analytics-privacy-how-to-resolve-this-paradox-across-all-industries.jpg)