Embed Size (px)
DESCRIPTION
Big Ideas 4 - 6 Session 3. Continuing with. Tonight we will finish our work with number operations and go on to patterns and relations and statistics and probability. Alternate algorithms. We ended last time talking about the value of alternate strategies (or algorithms). Would you…. - PowerPoint PPT Presentation
Citation preview

©Marian Small, 2011
Big Ideas 4 - 6Session 3

©Marian Small, 2011
Continuing with..
• Tonight we will finish our work with number operations and go on to patterns and relations and statistics and probability.

©Marian Small, 2011
Alternate algorithms
• We ended last time talking about the value of alternate strategies (or algorithms).

©Marian Small, 2011
Would you…
• calculate 532 – 99 the same way you would calculate 532 – 111?
• Use a √ for yes and an x for no.

©Marian Small, 2011
Would you…
• calculate 532 – 99 the same way you would calculate 532 – 111?
• Use a √ for yes and an x for no.
• Should students?

©Marian Small, 2011
22 x 13• Here are two ways to represent 22 x 13.
22
x13
66
+220
286
Which one do you prefer?
Use √ for the left and x for the right.
20 2
10
3
200 20
60 6

©Marian Small, 2011
What about division?
Let’s think about both
• what it means and
• how to calculate

©Marian Small, 2011
Which representation?
• Which picture best shows what 72 ÷ 3 means? (You will vote soon.)

©Marian Small, 2011
Which representation?
• Which picture best shows what 72 ÷ 3 means? (You will vote soon.)

©Marian Small, 2011
Vote
• A for 1st picture
• B for 2nd picture
• C if you think they’re equally good
• D if you think neither is good
I will ask a few people to explain their thinking.

©Marian Small, 2011
And what procedure?
• What do each of the procedures on the next screen help a student see better than the other ones?
• Vote A,B or C to tell me which you are willing to talk about in terms of what is good about it.
• I will call on people in each category.

©Marian Small, 2011
115 ÷ 5 23 10 + 10 + 3
5 115 5 115 5 50 + 50 + 15
-100 - 50 10
15 65
- 15 - 50 10
0 15
- 15 3
0 23

©Marian Small, 2011
What about estimating?
• Let’s think about estimating questions.
• It’s no longer just about rounding rules.
• Consider these questions.

©Marian Small, 2011
I added….
• 3 numbers.
• One is little.
• One is close to double the other.
• The sum is 5000.
• What could the numbers be?
• Type your numbers on next empty screen.

©Marian Small, 2011

©Marian Small, 2011
I subtracted…
• a number from 3000.
• The result had the digits 3 and 4 in it.
• What could the subtraction have been?
• Write some numbers on next empty screen.

©Marian Small, 2011

©Marian Small, 2011
The product is..
• The product of two numbers is almost 400.
• What might the numbers be?
Raise your hand to respond.

©Marian Small, 2011
I wonder..
• I divided []3[] by 4.
• The answer was a 3 digit number.
• Tell me anything about []3[] that you’re sure of.
Raise your hand to respond.

©Marian Small, 2011

©Marian Small, 2011
Patterns

©Marian Small, 2011
WNCP Pattern Outcomes
• Grade 4- focus on identifying patterns and relationships in tables and charts
• Grade 5- focus on pattern rule to predict
• Grade 6- focus on table of value relationships

©Marian Small, 2011
Here is a multiplication table
X 0 1 2 3 4 5 6 7 8 9
0 0 0 0 0 0 0 0 0 0 0
1 0 1 2 3 4 5 6 7 8 9
2 0 2 4 6 8 10 12 14 16 18
3 0 3 6 9 12 15 18 21 24 27
4 0 4 8 12 16 20 24 28 32 36
5 0 5 10 15 20 25 30 35 40 45
6 0 6 12 18 24 30 36 42 48 54
7 0 7 14 21 28 35 42 49 56 63
8 0 8 16 24 32 40 48 56 64 72
9 0 9 18 27 36 45 54 63 72 81

©Marian Small, 2011
Big Idea

©Marian Small, 2011
Here is a multiplication table
X 0 1 2 3 4 5 6 7 8 9
0 0 0 0 0 0 0 0 0 0 0
1 0 1 2 3 4 5 6 7 8 9
2 0 2 4 6 8 10 12 14 16 18
3 0 3 6 9 12 15 18 21 24 27
4 0 4 8 12 16 20 24 28 32 36
5 0 5 10 15 20 25 30 35 40 45
6 0 6 12 18 24 30 36 42 48 54
7 0 7 14 21 28 35 42 49 56 63
8 0 8 16 24 32 40 48 56 64 72
9 0 9 18 27 36 45 54 63 72 81

©Marian Small, 2011
Big idea

©Marian Small, 2011
Look at this
• To show the final digits of the multiples of 8:
01
2
3
45
6
7
8
9

©Marian Small, 2011
Look at this
• To show the final digits of the multiples of 6. Someone take the pen.
01
2
3
45
6
7
8
9

©Marian Small, 2011
Another big idea

©Marian Small, 2011
Or another pattern
X 0 1 2 3 4 5 6 7 8 9
0 0 0 0 0 0 0 0 0 0 0
1 0 1 2 3 4 5 6 7 8 9
2 0 2 4 6 8 10 12 14 16 18
3 0 3 6 9 12 15 18 21 24 27
4 0 4 8 12 16 20 24 28 32 36
5 0 5 10 15 20 25 30 35 40 45
6 0 6 12 18 24 30 36 42 48 54
7 0 7 14 21 28 35 42 49 56 63
8 0 8 16 24 32 40 48 56 64 72
9 0 9 18 27 36 45 54 63 72 81

©Marian Small, 2011
1 x 2 + 2 x 3 1 x 3 + 2 x 3
3 x 1 + 4 x 2 3 x 2+ 4 x 1

©Marian Small, 2011
Move objects to compare 3 x 3 + 4 x 4 to 3 x 4 + 4 x 3

©Marian Small, 2011
Picture a 100 chart
1 2 3 4 5 6 7 8 9 10
11 12 13 14 15 16 17 18 19 20
21 22 23 24 25 26 27 28 29 30
31 32 33 34 35 36 37 38 39 40
41 42 43 44 45 46 47 48 49 50
51 52 53 54 55 56 57 58 59 60
61 62 63 64 65 66 67 68 69 70
71 72 73 74 75 76 77 78 79 80
81 82 83 84 85 86 87 88 89 90
91 92 93 94 95 96 97 98 99 100

©Marian Small, 2011
Big Idea

©Marian Small, 2011
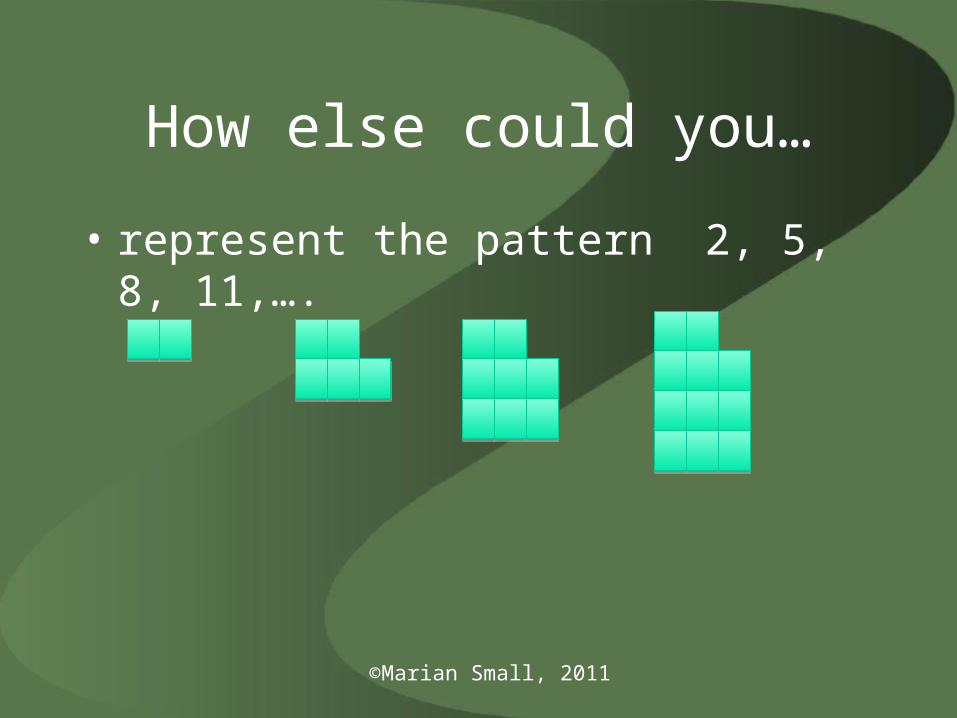
How else could you…
• represent the pattern 2, 5, 8, 11,….
©Marian Small, 2011
How else could you…
• represent the pattern 2, 5, 8, 11,….

©Marian Small, 2011
How else could you…
• represent the pattern 2, 5, 8, 11,….

©Marian Small, 2011
How else could you…
• What pattern do you see?
Term number Term value
1 2
2 5
3 8
4 11

©Marian Small, 2011
How else could you…
• What pattern do you see?
Term number Term value Related pattern
1 2 3
2 5 6
3 8 9
4 11 12

©Marian Small, 2011
Variables and equations
• Grade 4- problems as equations with unknowns; solve one-step equations
• Grade 5- single-variable, one-step equations
• Grade 6- generalizations written using variables; model equality preservation

©Marian Small, 2011
Algebra big ideas

©Marian Small, 2011
Try this
• What situation might 2w describe?
• Type some possibilities on the next screen.

©Marian Small, 2011

©Marian Small, 2011
Try this
• Jeff got $12 in allowance every week.
• What does 6 x w tell about the situation?
A: his allowance
B: his allowance in w weeks
C: his allowance in 2 xw weeks
D: his allowance in w ÷ 2 weeks

©Marian Small, 2011
Try this
• Jeff got $12 in allowance every week.
• What does 12w tell about the situation?
• What equation would you solve to find out how many weeks until he had $156?

©Marian Small, 2011
The solution is…
• The solution to an equation is x = 2.
• What might the equation have been?
• Type some possibilities on the next screen.

©Marian Small, 2011

©Marian Small, 2011
Respond by raising your hand

©Marian Small, 2011
Data
• Grade 4- many-to-one correspondence for
pictographs and bar graphs
• Grade 5- double bar graphs
• Grade 6- line graphs

©Marian Small, 2011
What’s going on?
• Vote for A or B in terms of which makes it easier for you to tell what’s going on?

©Marian Small, 2011
A
• Kids who like chocolate chip cookies most: Jane, Kyle, Ravi, Shilpa, Elaine, Jar-Ye, Sindy, Amy, Liam
• Kids who like oatmeal cookies most: Aaron, Amanda, Diana, Carolyn, Geoffrey, Suhana, Jeremy, Terry-Lynn

©Marian Small, 2011
B
Chocolate Chip
Oatmeal

©Marian Small, 2011
B
Chocolate Chip
Oatmeal

©Marian Small, 2011
Which graph would you use?
• Vote:
• A for bar graph with scale of 2
• B for bar graph with scale of 5
• C for pictograph with scale of 2
• D for pictograph with scale of 5

©Marian Small, 2011
Let’s compare bar graphs
• Do the two graphs on the next two slides give you the same impression about the following data?
• Use √ for yes and x for no.
Favourite Pets
Dog 20
Cat 15
Rat 2

©Marian Small, 2011
You choose

©Marian Small, 2011
You choose

©Marian Small, 2011
You choose

©Marian Small, 2011
How do these differ in the impression they give? Raise
your hand.

©Marian Small, 2011
What will happen
• I will show you a graph.
• I will mention some things you might think it shows well.
• If you think it is easy to see, click a happy face.
• If not, click a thumbs down.

©Marian Small, 2011
What does this graph about how I divide my day show?

©Marian Small, 2011
The big idea

©Marian Small, 2011
Other important big ideas
• Pictographs and bar graphs are particularly useful for comparing frequency of data in different categories.
• Line graphs are particularly useful for showing relationships between quantities and trends.

©Marian Small, 2011
Probability
• Grade 5- verbal comparisons of likelihood
• Grade 6- experimental/theoretical probability

©Marian Small, 2011
Using probability language
• Choose which is most likely about a new kid joining a Grade 5 class:
• A: It’s a boy.
• B: The student is the same age as lots of other kids in the class.
• C: The student lives in the area.
• D: The student is human.

©Marian Small, 2011
Now…
• You write a phrase that is:
• Almost certain
• Impossible
• Very likely
• Very unlikely

©Marian Small, 2011
A Big Idea

©Marian Small, 2011
You just flipped a coin and…
• You got
• H H H H H H H H H
Vote:
√ if you think a H next time
X if you think a T next time

©Marian Small, 2011
Experimental probability
• You are going to create an experiment using ONE die.
• The result you want should happen about three-fourths of the time.
• What would you choose for your result?
• Some choices are on the next screen.

©Marian Small, 2011
Choices
• A: an even number
• B: a number more than 2
• C: anything but 1
• D: a number less than 5

©Marian Small, 2011
Big Ideas
©Marian Small, 2011
Sharing Time
• I hope some of you have stories to share.

©Marian Small, 2011
I am hoping that :
• you will try out one of the questions we discussed or, even better, your own question to bring out a big idea in number.
• We’ll talk about the results next time.