Embed Size (px)
Citation preview

Biodiversity Assessment Method

Find out more about your environment at: www.environment.nsw.gov.au
© 2017 State of NSW With the exception of photographs, the State of NSW and Office of Environment and Heritage are pleased to allow this material to be reproduced in whole or in part for educational and non-commercial use, provided the meaning is unchanged and its source, publisher and authorship are acknowledged. Specific permission is required for the reproduction of photographs.
The Office of Environment and Heritage (OEH) has compiled this publication in good faith, exercising all due care and attention. No representation is made about the accuracy, completeness or suitability of the information in this publication for any particular purpose. OEH shall not be liable for any damage which may occur to any person or organisation taking action or not on the basis of this publication. Readers should seek appropriate advice when applying the information to their specific needs.
All content in this publication is owned by the State of NSW and is protected by Crown Copyright. It is licensed under the Creative Commons Attribution 4.0 International (CC BY 4.0), subject to the exemptions contained in the licence. The legal code for the licence is available at Creative Commons.
Published by the Office of Environment and Heritage on behalf of the NSW Government.
The State of NSW asserts the right to be attributed as author of the original material in the following manner: © State of New South Wales 2017.
Published by:
Office of Environment and Heritage for the NSW Government 59 Goulburn Street, Sydney NSW 2000 PO Box A290, Sydney South NSW 1232
Phone: +61 2 9995 5000 (switchboard) Phone: 131 555 (environment information and publications requests) Phone: 1300 361 967 (national parks, general environmental enquiries, and publications requests) Fax: +61 2 9995 5999 TTY users: phone 133 677, then ask for 131 555 Speak and listen users: phone 1300 555 727, then ask for 131 555
Email: [email protected] Website: www.environment.nsw.gov.au
Report pollution and environmental incidents Environment Line: 131 555 (NSW only) or [email protected] See also www.epa.nsw.gov.au
ISBN 978 1 76039 773 9 OEH 2017/0206 August 2017

Contents iii
Contents List of appendices ................................................................................................................ vi
List of figures ........................................................................................................................ vi
List of tables ......................................................................................................................... vi
1 Background to the Biodiversity Assessment Method ...................................................... 1
2 Overview of the Biodiversity Assessment Method........................................................... 2
2.1.2 Persons accredited to prepare assessment reports.................................... 2 2.2 Data and information used in the BAM .................................................................. 3
2.2.1 Use of published databases in the BAM ..................................................... 3 2.2.2 Use of more appropriate local data ............................................................ 3 2.2.3 Updates to the Credit Calculator and databases ........................................ 3
2.3 Biodiversity values not assessed under the BAM .................................................. 4
Stage 1 – Biodiversity assessment .................................................................................... 5
3 Introduction to Stage 1.................................................................................................... 5
3.1 Assessment of biodiversity values ......................................................................... 5 3.2 Streamlined assessment modules ......................................................................... 5
4 Landscape context ......................................................................................................... 8
4.2 Identify landscape features .................................................................................... 8 4.3 Determining the site context ................................................................................ 10
4.3.1 Assessment requirements ........................................................................ 10 4.3.2 Assessing native vegetation cover ........................................................... 10
5 Assessing native vegetation, threatened ecological communities and vegetation integrity ......................................................................................................................... 11
5.1 Map native vegetation extent on the subject land ................................................ 11 5.2 Identifying native plant community types and ecological communities on the
subject land ......................................................................................................... 11 5.3 Vegetation integrity assessment (site condition) .................................................. 13
5.3.1 Mapping vegetation zones ....................................................................... 13 5.3.2 Assessing the patch size for a vegetation zone ........................................ 14 5.3.3 Assessing vegetation integrity (site condition) .......................................... 14 5.3.4 Vegetation integrity survey plots ............................................................... 15
5.4 Determining the vegetation integrity score ........................................................... 18
6 Assessing the habitat suitability for threatened species ................................................ 19
6.1 Threatened Biodiversity Data Collection .............................................................. 19 6.2 Assessing habitat suitability for species that can be predicted by habitat
surrogates (ecosystem credits) ............................................................................ 19 6.3 Assessing habitat suitability for species that cannot be predicted by habitat
surrogates (species credit species) ..................................................................... 20 6.4 Steps for identifying habitat suitability for threatened species .............................. 20 6.5 Undertaking a threatened species survey ............................................................ 24
6.5.2 Using expert reports instead of undertaking a survey ............................... 25

iv Biodiversity Assessment Method
6.6 Identify the biodiversity risk weighting for the species (development sites, clearing sites and biodiversity certification) .......................................................... 26
6.7 Identifying potential prescribed biodiversity impacts on threatened species ......... 27
Stage 2 – Impact assessment (biodiversity values and prescribed impacts) ............... 29
7 Introduction to Stage 2.................................................................................................. 29
7.1 Documenting Stage 2 outcomes .......................................................................... 29
8 Avoiding and minimising impacts on biodiversity values ............................................... 30
8.1 Avoiding and minimising impacts on native vegetation and habitat during project planning ................................................................................................... 30 8.1.1 Locating a project to avoid and minimise impacts on native vegetation
and habitat ............................................................................................... 30 8.1.2 Designing a project to avoid and minimise impacts on native vegetation
and habitat ............................................................................................... 31 8.2 Avoiding and minimising prescribed biodiversity impacts during project planning 31
8.2.2 Locating a project to avoid and minimise prescribed biodiversity impacts 32 8.2.3 Designing a project to avoid and minimise prescribed biodiversity
impacts .................................................................................................... 32
9 Assessment of impacts ................................................................................................. 34
9.1 Assessing impacts on native vegetation and habitat ............................................ 34 9.1.2 Assessing the impact of clearing native vegetation, threatened
ecological communities and threatened species habitat ........................... 34 9.1.3 Calculating the change in the vegetation integrity score for clearing of
native vegetation, threatened ecological communities and threatened species habitat ......................................................................................... 35
9.1.4 Assessing indirect impacts on native vegetation and habitat .................... 35 9.2 Assessing prescribed biodiversity impacts ........................................................... 36 9.3 Mitigating and managing impacts on biodiversity values ...................................... 40
9.3.2 Mitigating impacts on native vegetation and habitat ................................. 40 9.3.3 Mitigating prescribed biodiversity impacts ................................................ 41
9.4 Adaptive management for uncertain impacts ....................................................... 42 9.4.2 Guidelines for adaptive management for impacts on biodiversity that are
uncertain .................................................................................................. 43
10 Thresholds for the assessment and offsetting of impacts of development .................... 44
10.2 Impact assessment of potential entities of serious and irreversible impacts on biodiversity values ............................................................................................... 44 10.2.2 Additional impact assessment provisions for ecological communities ...... 45 10.2.3 Additional impact assessment provisions for threatened species or
populations .............................................................................................. 45 10.3 Impacts for which the assessor is required to determine an offset requirement ... 47
10.3.1 Impacts on native vegetation (ecosystem credits) .................................... 47 10.3.2 Impacts on threatened species ................................................................ 47
10.4 Impacts that do not require further assessment by the assessor ......................... 47
11 Application of the no net loss standard ......................................................................... 48
11.2 Calculating the offset requirement ....................................................................... 48
Contents v
11.2.2 Ecosystem credits and species credits ..................................................... 49 11.2.3 Calculating the required number of ecosystem credits for the direct
impact on vegetation that is a TEC, threatened species habitat, or a PCT generally .......................................................................................... 49
11.2.4 Calculating the required species credits for direct impacts on threatened species .................................................................................................... 50
11.3 Identifying the credit class for ecosystem credits and species credits .................. 51 11.4 Offset rules for biodiversity values ....................................................................... 52
Stage 3 – Improving biodiversity values .......................................................................... 53
12 Introduction to Stage 3.................................................................................................. 53
12.1 Documenting Stage 3 outcomes .......................................................................... 53
13 Calculating gain in biodiversity values at a biodiversity stewardship site ....................... 54
13.1 Assessing gain in biodiversity values at the biodiversity stewardship site ............ 54 13.2 Preparation of a management plan for the biodiversity stewardship site .............. 54 13.3 Management actions that improve biodiversity values ......................................... 55
13.3.2 Required management actions................................................................. 55 13.3.3 Active restoration management actions .................................................... 57
13.4 Calculating the change (gain) in vegetation integrity score at a biodiversity stewardship site ................................................................................................... 59
13.5 Estimating the future value of vegetation integrity attributes without management ....................................................................................................... 59
13.6 Estimating the future value of vegetation integrity attributes with management ... 61 13.6.2 Probability of reaching benchmark for composition, structure and
function with management ....................................................................... 61 13.6.3 Determine the future condition score for function attributes with required
management actions ................................................................................ 62 13.6.4 Determine the future habitat condition score for threatened species ........ 62
13.7 Calculating the security benefit score at a biodiversity stewardship site ............... 62 13.8 Calculating the number of ecosystem credits created at a biodiversity
stewardship site ................................................................................................... 63 13.9 Calculating the number of species credits created at a biodiversity stewardship
site ...................................................................................................................... 63 13.10 Identifying the credit class for biodiversity credits created at a biodiversity
stewardship site ................................................................................................... 64 13.11 Existing obligations and management actions ..................................................... 64
Definitions ........................................................................................................................... 68

vi Biodiversity Assessment Method
List of appendices Appendix 1: Streamlined assessment module – clearing paddock trees .............................. 76
Appendix 2: Streamlined assessment module – small area development that requires consent ......................................................................................................................... 79
Appendix 3: Ordering of waterways and riparian buffer distances ....................................... 81
Appendix 4: Growth form definitions .................................................................................... 83
Appendix 5: Guidelines for the collection of benchmark data from local reference sites or published sources ......................................................................................................... 85
Appendix 6: Determining the vegetation integrity score ....................................................... 86
Appendix 7: Biodiversity risk weighting ................................................................................ 97
Appendix 8: Intrinsic rate of increase for richness, cover and function attributes ............... 102
Appendix 9: Guidelines for assessing the future value of attributes used to assess composition, structure and function at a biodiversity stewardship site ......................... 104
Appendix 10: Requirements for a Biodiversity Development Assessment Report (major projects) and a Biodiversity Certification Assessment Report (strategic biodiversity certification proposals) ................................................................................................ 113
Appendix 11: Requirements for a Biodiversity Stewardship Site Assessment Report ........ 119
Appendix 12: Requirements for a Biodiversity Development Assessment Report – streamlined assessment modules ............................................................................... 121
List of figures Figure 1: Strahler stream ordering system ....................................................................... 81
Figure 2: Weibull distribution used for the continuous unweighted scoring of composition condition for each growth form group ............................................ 87
Figure 3: Hypothetical curves illustrating how the probability of reaching benchmark conditions might vary for different vegetation attributes ................................... 104
Figure 4: Modifier for the intrinsic rate of increase in habitat attributes ........................... 106
Figure 5: Curve specified in Equation 32 to describe the effect of high threat exotic plants on rates of gain in habitat attributes ...................................................... 107
Figure 6: Modifier to account for vegetation integrity (site resilience) at different levels of high threat exotic cover ................................................................................... 109
Figure 7: Cumulative likelihoods of a successful regeneration event P(R) over a 20-year management timeframe .................................................................................. 110
Figure 8: Relationship between the cover of high threat exotic vegetation (HTW) and the modifier used to calculate the maximum allowable active restoration gains112
List of tables Table 1: Area limits for application of the module for assessing small areas ..................... 6
Table 2: Vegetation survey data collected at the subject land ......................................... 12
Table 3: Growth form groups and attributes used to assess the composition, structure and function components of vegetation integrity ................................................ 15
Table 4: Minimum number of plots and transects required per zone area ....................... 16

Contents vii
Table 5: Offset trading group tiers for ecosystem credits................................................. 52
Table 6: Required management actions and types of management activities for improving vegetation integrity and threatened species habitat at a biodiversity stewardship site ................................................................................................ 56
Table 7: Active restoration management actions that may be undertaken to improve or manage native vegetation or threatened species habitat at a biodiversity stewardship site ................................................................................................ 58
Table 8: Estimated annual probability of decline for each attribute .................................. 60
Table 9: Security benefit score ........................................................................................ 63
Table 10: Percentage reduction for ecosystem credits and species credits for a biodiversity stewardship site on certain types of publicly owned land ................ 66
Table 11: Percentage reduction for ecosystem credits and species credits for a biodiversity stewardship site with existing conservation obligations ................... 67
Table 12: Number of ecosystem credits required per paddock tree ................................... 78
Table 13: Area limits for application of small area development threshold on land not shaded on the biodiversity values map .............................................................. 79
Table 14: Riparian buffer distances ................................................................................... 82
Table 15: Growth form groups and growth form definitions ............................................... 83
Table 16: Static weights that apply to the scoring of function attributes ............................. 89
Table 17: Tree stem size class scores .............................................................................. 90
Table 18: Application of the biodiversity risk weighting – ecosystem credits ..................... 97
Table 19: Application of the biodiversity risk weighting – species credits .......................... 98
Table 20: Sensitivity to loss class – threatened species, ecological communities and PCTs ................................................................................................................. 98
Table 21: Sensitivity to gain class – threatened species ................................................. 100
Table 22: Intrinsic rate of increase for treed formations ................................................... 102
Table 23: Intrinsic rate of increase in cover for non-treed formations .............................. 102
Table 24: Values for w (Equation 32) and c (Equation 33) .............................................. 107
Table 25: Minimum information requirements for the Biodiversity Development Assessment Report and the Biodiversity Certification Assessment Report – Stage 1: Biodiversity assessment .................................................................... 114
Table 26: Minimum information requirements for the BDAR or BCAS (Application for a development consent or biodiversity certification – Stage 2: Impact assessment (biodiversity values)) ................................................................... 117
Table 27: Minimum information requirements for the Biodiversity Stewardship Site Assessment Report (Application for a biodiversity stewardship agreement – Stage 3: Improving biodiversity values) ........................................................... 119
Table 28: Minimum information requirements for the Biodiversity Development Assessment Report – streamlined assessment modules ................................. 121


Background to the Biodiversity Assessment Method 1
1 Background to the Biodiversity Assessment Method 1.1.1.1 The NSW biodiversity offsets scheme (the offsets scheme) is established under
Part 6 of the NSW Biodiversity Conservation Act 2016 (BC Act). 1.1.1.2 The Biodiversity Assessment Method (BAM) is established under section 6.7 of
the BC Act. The BAM is established for the purpose of assessing certain impacts on threatened species and threatened ecological communities (TECs), and their habitats, and the impact on biodiversity values, where required under the BC Act, Local Land Services Act 2013 (LLS Act) or the State Environmental Planning Policy (Vegetation in Non-Rural Areas) 2017).
1.1.1.3 The BAM is made by the Minister administering the BC Act by order and published on the NSW legislation website.
1.1.1.4 The BAM is structured around three primary stages. Stage 1 of the BAM establishes a single consistent approach to assessing the biodiversity values on land. Under the proposed offsets scheme, this will include: (a) land proposed as a development site, including for a Part 5 activity
(proposed development site) (b) land subject to a vegetation clearing proposal which is required to be
assessed by the BAM under the LLS Act (proposed clearing site) (c) land proposed to be biodiversity certified, and (d) land proposed as a biodiversity stewardship site under a biodiversity
stewardship agreement (proposed biodiversity stewardship site). 1.1.1.5 Stage 2 provides for an impact assessment on biodiversity values where the land
is a development site, clearing site or land proposed for biodiversity certification. This stage includes the guidelines and requirements that apply the avoid, minimise and offset hierarchy for assessing direct and indirect impacts. Direct impacts on biodiversity values include those related to clearing native vegetation and threatened species habitat, and impacts on biodiversity values prescribed by the Biodiversity Conservation Regulation 2017 (the BC Regulation).
1.1.1.6 Stage 3 provides for the assessment of the management requirements at a proposed biodiversity stewardship site and the likely improvement in biodiversity values that are predicted to occur over time. The gain that is predicted to occur from the management actions determines the number of biodiversity credits that can be created at the site.

2 Biodiversity Assessment Method
2 Overview of the Biodiversity Assessment Method 2.1.1.1 The BAM sets out the requirements for a repeatable and transparent assessment
of terrestrial biodiversity values on land in order to: (a) identify the biodiversity values on land subject to proposed development,
clearing, or land in a biodiversity certification assessment area, or land proposed as a biodiversity stewardship site
(b) determine the impacts of proposed development, or clearing or biodiversity certification on biodiversity values
(c) quantify and describe the biodiversity credits required to offset the residual impacts of proposed development or clearing or conferral of biodiversity certification on biodiversity values
(d) quantify and describe the biodiversity credits that can be created at a biodiversity stewardship site from the improvement in biodiversity values from management actions undertaken at the site.
2.1.1.2 Where required to be used under NSW legislation, the BAM is used to assess terrestrial biodiversity values on a proposed development site or proposed clearing site or land proposed for biodiversity certification. It must also be used to assess the biodiversity values on land proposed to be secured under a biodiversity stewardship agreement.
2.1.1.3 The terms development, development footprint and development site are also taken to include clearing, clearing footprint and clearing site respectively, except where the reference is to a small area development or a major project development.
2.1.1.4 The assessment requirements set out in the BAM enable the survey and assessment effort to be scaled depending on the level of risk posed by the impact of the development, the availability and quality of existing information such as native vegetation maps, and the area of land that is being assessed.
2.1.1.5 Impacts of development, clearing or certification on biodiversity values, or gains in biodiversity values at biodiversity stewardship sites are measured in biodiversity credits. There are two broad categories of classes of credit for the purposes of measuring impact or gain – ecosystem credits and species credits. The method will step through the credit class category that is created or required for certain kinds of impact or gain. Each credit is assigned attributes in accordance with Section 11.3 to determine whether a particular credit within a class is ‘like’ another credit in the same class for the purpose of applying the like for like rules and variation rules set out in the BC Regulation. A class of credits is formed where the biodiversity credit shares the same attributes as set out in Section 11.3. Ecosystem credits have seven shared attributes. For species credits, the only shared attribute is the name of the threatened species.
2.1.2 Persons accredited to prepare assessment reports 2.1.2.1 Under the BC Act, a Biodiversity Development Assessment Report (BDAR),
Biodiversity Certification Assessment Report (BCAR), or a Biodiversity Stewardship Site Assessment Report (BSSAR) is a report setting out the outcomes of an assessment in accordance with the BAM.
2.1.2.2 These reports can only be prepared by a person accredited under the accreditation scheme prepared under section 6.10 of the BC Act. Throughout this method, an accredited person is referred to as the assessor.

Overview of the Biodiversity Assessment Method 3
2.2 Data and information used in the BAM
2.2.1 Use of published databases in the BAM 2.2.1.1 When preparing a BDAR, BCAR or a BSSAR, an assessor is required to make
use of the following databases published from time to time by the Office of Environment and Heritage (OEH): (a) BioNet Vegetation Classification (formerly known as the NSW Vegetation
Information System Classification Database) (b) Threatened Biodiversity Data Collection (formerly known as the Threatened
Species Profile Database) (c) BioNet Atlas (formerly known as the NSW Wildlife Atlas).
2.2.1.2 The BAM requires an assessor to use information in the Directory of Important Wetlands of Australia (DIWA) published from time to time by Environment Australia.
2.2.2 Use of more appropriate local data
2.2.2.1 When preparing a BDAR, BCAR or BSSAR the assessor may make use of more appropriate local data rather than information and datasets specified in Paragraph 2.2.1.1.
2.2.2.2 An assessor may use more appropriate local data if the decision-maker is of the opinion that it more accurately reflects local environmental conditions than the data in the databases and agrees in writing that this can be used.
2.2.2.3 The assessor must provide the decision-maker with the reasons that support their opinion that the more appropriate local data more accurately reflects local environmental conditions.
2.2.2.4 An assessor may not use more appropriate local data to change the: (a) sensitivity to loss class for a TEC, plant community type (PCT) or a
threatened species or a component of its habitat (b) sensitivity to gain class for a TEC, PCT or a threatened species or a
component of its habitat (c) biodiversity risk weighting for a TEC, PCT or a threatened species or a
component of its habitat.
2.2.2.5 More appropriate local data that is used to develop a benchmark for a PCT may be collected by an assessor from local reference sites, or obtained from relevant published sources using the procedures set out in Appendix 5.
2.2.2.6 An assessor may also use benchmark data contained in the BioNet Vegetation Classification that reflects seasonal or climatic variation in the benchmark values for a PCT as more appropriate local data.
2.2.2.7 After the data is varied, the proposal may be reassessed in accordance with the BAM.
2.2.3 Updates to the Credit Calculator and databases 2.2.3.1 The BAM Credit Calculator must be used by an assessor to undertake an
assessment of the biodiversity values of a proposed development site, clearing site, land to be biodiversity certified, or a biodiversity stewardship site.

4 Biodiversity Assessment Method
2.2.3.2 The databases listed in Subsection 2.2.1, which are used in the BAM and the Credit Calculator, are updated periodically in response to increased knowledge about biodiversity values and relevant biodiversity data. This may also include data and information relating to newly listed threatened species, threatened ecological communities and amendments to the BioNet Vegetation Classification.
2.2.3.3 Changes to the databases may require an updated version of the Credit Calculator to be issued by the Environment Agency Head. The Environment Agency Head will notify assessors when an updated version of the Credit Calculator is available.
2.2.3.4 The assessor must use the most recent version of the Credit Calculator that applies the version of the BAM that the assessor is using for the purposes of preparing a BAR.
2.3 Biodiversity values not assessed under the BAM 2.3.1.1 Biodiversity values not assessed under the BAM include:
(a) marine mammals (b) wandering sea birds (c) biodiversity that is endemic to Lord Howe Island (d) biodiversity values associated with the assessment of the impacts of any
clearing of native vegetation and loss of habitat on category 1-exempt land (within the meaning of Part 5A of the LLS Act), other than the additional biodiversity impacts in accordance with clause 6.1 of the BC regulation.
2.3.1.2 A separate assessment of the biodiversity values in Paragraph 2.3.1.1 and the impacts of development not covered in the BAM may be required under the BC Act or the Environmental Planning and Assessment Act 1979 (EP&A Act).

Introduction to Stage 1 5
Stage 1 – Biodiversity assessment 3 Introduction to Stage 1 3.1 Assessment of biodiversity values 3.1.1.1 The assessor must undertake an assessment of the biodiversity values of the
land proposed (the subject land): (a) as a development site, including for a Part 5 activity in the case of
development that requires consent under Part 4 or approval under Part 5.1 or assessment under Part 5 of the EP&A Act, or
(b) as a clearing site in the case of clearing that requires approval under Part 5A of the LLS Act or under the Vegetation SEPP, or
(c) to be biodiversity certified in the case of an application for biodiversity certification under the BC Act, or
(d) as a biodiversity stewardship site in the case of an application for a biodiversity stewardship agreement under the BC Act.
3.1.1.2 The assessor must undertake an assessment of biodiversity values by assessing the: (a) landscape features and site context of the subject land in accordance with
Chapter 4, and (b) presence of TECs, PCTs, and the condition (vegetation integrity) of native
vegetation on the subject land in accordance with Chapter 5, and (c) habitat suitability for threatened species on the subject land in accordance
with Chapter 6.
3.1.1.3 If, during the assessment of biodiversity values for any type of development, clearing or biodiversity certification proposal as required by Chapter 5, the assessor determines that: (a) an area of land does not contain native vegetation, or (b) a vegetation zone has a vegetation integrity score <15 where the PCT is
representative of an endangered or critically endangered ecological community, or
(c) a vegetation zone has a vegetation integrity score <17 where the PCT is associated with threatened species habitat (as represented by ecosystem credits), or is representative of a vulnerable ecological community, or
(d) a vegetation zone has a vegetation integrity score <20 where the PCT is not representative of a TEC or associated with threatened species habitat
then for that vegetation zone: (e) assessment of native vegetation is not required beyond Section 5.4, and (f) an assessment of threatened species habitat according to Section 6.2 and
Paragraph 6.2.1.4 is not required.
3.2 Streamlined assessment modules 3.2.1.1 The BAM contains streamlined assessment modules that may be used by an
assessor to assess:

6 Biodiversity Assessment Method
(a) clearing that requires the clearing of paddock trees or development that requires the clearing of paddock trees according to the requirements specified in Appendix 1
(b) small areas according to the requirements specified in Appendix 2.
3.2.1.2 The module for assessing paddock trees can only be used in the circumstances set out in that module.
3.2.1.3 The module for assessing small areas must only be used according to the area clearing thresholds shown in Table 1.
3.2.1.4 Streamlined assessment modules cannot be used to assess clearing within the biodiversity values map.
3.2.1.5 Where the subject land contains paddock trees and intact native vegetation, an assessor may use the module for assessing clearing of paddock trees for that part of the proposal and the full BAM for the remaining areas.
3.2.1.6 Where the subject land is eligible to use the module for assessing small areas according to the limits in Table 1, and part of the subject land is within the biodiversity values map, an assessor must assess the habitat suitability of that land in accordance with Chapter 6.
Table 1: Area limits for application of the module for assessing small areas
Minimum lot size associated with the property
Maximum area limit for application of the small area development module
Less than 1ha ≤1ha
Less than 40ha but not less than 1ha ≤2ha
Less than 1000ha but not less than 40ha ≤5ha
1000ha or more ≤10ha
Sections within Stage 1 4 Landscape context ......................................................................................................... 8
4.2 Identify landscape features .................................................................................... 8 4.3 Determining the site context ................................................................................ 10
5 Assessing native vegetation, threatened ecological communities and vegetation integrity ......................................................................................................................... 11
5.1 Map native vegetation extent on the subject land ................................................ 11 5.2 Identifying native plant community types and ecological communities on the
subject land ......................................................................................................... 11 5.3 Vegetation integrity assessment (site condition) .................................................. 13 5.4 Determining the vegetation integrity score ........................................................... 18
6 Assessing the habitat suitability for threatened species ................................................ 19
6.1 Threatened Biodiversity Data Collection .............................................................. 19

Introduction to Stage 1 7
6.2 Assessing habitat suitability for species that can be predicted by habitat surrogates (ecosystem credits) ............................................................................ 19
6.3 Assessing habitat suitability for species that cannot be predicted by habitat surrogates (species credit species) ..................................................................... 20
6.4 Steps for identifying habitat suitability for threatened species .............................. 20

8 Biodiversity Assessment Method
4 Landscape context 4.1.1.1 In this chapter, a range of landscape features must be identified where they
occur on the subject land or within the assessment area surrounding the subject land. These features may contain biodiversity values that are important for the site context of the subject land, or for informing the likely habitat suitability of the subject land.
4.1.1.2 For proposals assessed using a streamlined assessment module in accordance with Section 3.2 an assessor is only required, in this chapter, to identify the IBRA bioregion and the IBRA subregion.
4.2 Identify landscape features 4.2.1.1 Prepare a Site Map based on digital aerial photography (such as ADS–40
imagery) or the best available imagery showing (at a recommended scale 1:1,000 or finer):
(i) boundary of the subject land (ii) cadastre of the subject land (iii) landscape features identified in 4.2.1.3 below.
4.2.1.2 Prepare a Location Map based on digital aerial photography (such as ADS–40 imagery) or the best available imagery showing (at a recommended scale 1:1,000 or finer):
(i) boundary of the subject land (ii) buffer area of 1500m surrounding the outside edge of the boundary of
the subject land OR 500m along each side of the centre line of a linear shaped development
(iii) landscape features identified in 4.2.1.3 below (iv) additional relevant detail such as local government area boundaries or
other base data relevant at this scale.
4.2.1.3 Map the following landscape features on the Site and Location Maps: (a) IBRA bioregions and IBRA subregions (b) rivers, streams and estuaries (classified according to stream order and
including riparian buffers as outlined in Appendix 3) (c) important and local wetlands on, adjacent and downstream of the site (d) habitat connectivity identifying the area/s of connectivity joining different
areas of habitat that intersect with the subject land and the areas of habitat that are connected
(e) karst, caves, crevices, cliffs and areas of geological significance (f) areas of outstanding biodiversity value that have been identified under the
BC Act (g) additional features and any other landscape features required to be
assessed by the Secretary’s Environmental Assessment Requirements (SEARs) for a major project.
Additional features for biodiversity stewardship agreements (h) Mitchell landscapes

Landscape context 9
Additional features for vegetation clearing proposals (i) soil hazard features.
IBRA bioregions and IBRA subregions
4.2.1.4 The IBRA bioregion and IBRA subregion is used by the assessor to gather information on PCTs and benchmarks in Chapter 5, and on habitat suitability for threatened species in Chapter 6.
Mitchell landscapes 4.2.1.5 Mitchell landscapes are relevant to assessing the site context of the subject land.
Rivers, streams and estuaries 4.2.1.6 Impacts of development, clearing or biodiversity certification on rivers, streams
and estuaries must be considered by the assessor in accordance with Section 9.1, Section 9.2 and Section 9.3.
Wetlands 4.2.1.7 Impacts of development, clearing or biodiversity certification on wetlands,
including identifying any important wetlands, must be considered by the assessor in accordance with Section 9.1, Section 9.2 and Section 9.3.
Connectivity of different areas of habitat 4.2.1.8 For applications for a biodiversity stewardship agreement, any land that is in a
priority investment area and occurs on the subject land or in the assessment area surrounding the subject land, must be identified and shown on the Site Map and Location Map.
4.2.1.9 For development sites, the assessor must identify the connectivity of different areas of habitat that may facilitate the movement of threatened species across their range and identify these on the Location Map.
4.2.1.10 Impacts of development or biodiversity certification on the connectivity of different forms of habitat must be considered by the assessor in accordance with Paragraph 9.2.1.6.
4.2.1.11 For development sites that are major projects, the flyways for migratory species that pass over the subject land must be mapped and shown on the Location Map.
Areas of geological significance and soil hazard features 4.2.1.12 This assessment must considerer whether there is karst, caves, crevices, cliffs or
other areas of geological significance within the subject land or within the assessment area surrounding the subject land.
4.2.1.13 For a clearing proposal, all soil hazard features that occur on the subject land must be identified and shown on the Site Map.
4.2.1.14 Any other areas of geological significance and soil hazard features that occur within the assessment area surrounding the subject land must be identified and shown on the Location Map.
4.2.1.15 Impacts of development or biodiversity certification on karst, caves, crevices, cliffs or other areas of geological significance within the subject land must be considered by the assessor in accordance with Paragraph 9.2.1.1 and Paragraph 9.2.1.2.
Areas of outstanding biodiversity value 4.2.1.16 Any area of outstanding biodiversity value that has been declared by the Minister
which occurs on the subject land must be identified and shown on the Site Map.

10 Biodiversity Assessment Method
4.2.1.17 Any areas of outstanding biodiversity value that have been declared by the Minister which occur within the assessment area surrounding the subject land must be identified and shown on the Location Map.
4.2.1.18 An area of outstanding biodiversity value must be shown on the management plan required at Section 13.2 for a biodiversity stewardship site.
4.3 Determining the site context
4.3.1 Assessment requirements 4.3.1.1 To determine the site context of the subject land an assessor must assess native
vegetation cover and patch size in accordance with Subsections 4.3.2 and 5.3.2. Percentage vegetation cover and patch size are used later to assess habitat suitability for threatened species in the site (see Section 6.4).
4.3.2 Assessing native vegetation cover 4.3.2.1 The assessor must estimate the percent cover of native woody and non-woody
vegetation relative to the approximate benchmarks for the PCT.
4.3.2.2 Native over-storey vegetation is used to determine the percent cover in woody vegetation types, and native ground cover is used to assess cover in non-woody vegetation types.
4.3.2.3 Native vegetation cover is assessed on the subject land and within a 1500m buffer area surrounding the outside edge of the boundary of the subject site. The buffer area must be established by using a GIS.
4.3.2.4 Native vegetation cover is assigned to a class, being 0–10%, >10–30%, >30–70% and >70% for the development, biodiversity certification or clearing proposal.
4.3.2.5 The native vegetation cover class is later used to assess the habitat suitability of the subject land for threatened species in Section 6.4.
4.3.2.6 For a development proposal that only uses the streamlined assessment module for clearing paddock trees in Appendix 1, native vegetation cover is only assessed for the area of the subject land.
4.3.2.7 All areas of native vegetation cover on the subject land and within the buffer area surrounding the subject land must be mapped onto digital aerial photography (such as ADS–40 imagery) or the best available imagery of the subject land, and shown on the Location Map.

Assessing native vegetation, threatened ecological communities and vegetation integrity 11
5 Assessing native vegetation, threatened ecological communities and vegetation integrity
5.1 Map native vegetation extent on the subject land 5.1.1.1 The extent of native vegetation cover within the subject land must be mapped
onto digital aerial photography (such as ADS–40 imagery) or the best available imagery of the subject land.
5.1.1.2 Mapping of the extent of native vegetation may use existing maps of native vegetation in the area, or an assessment of the subject land by the assessor.
5.1.1.3 The native vegetation extent on the subject land includes all areas of native vegetation including native ground cover and the canopy area of trees.
5.1.1.4 The capture scale for native vegetation extent shown on the Site Map should be 1:1,000 – 1:5,000, and not greater than 1:10,000.
5.1.1.5 The areas that are not native vegetation (i.e. land not included in native vegetation extent) do not require further assessment in the BAM except where: (a) they are proposed for restoration as part of an offset (refer to Stage 3) (b) they are assessed as habitat for threatened species according to Section 6.4.
Changes to the mapped native vegetation extent
5.1.1.6 The extent of native vegetation within the subject land may have changed since the satellite or ortho-rectified aerial image was made. For example, clearing may have been permitted under the Native Vegetation Act 2003 (NV Act) or the EP&A Act. Where there are changes in the extent of native vegetation, the assessor may map the native vegetation extent to reflect the current situation and confirm this by field survey.
5.1.1.7 The assessor must identify any areas of native vegetation extent that are different to the satellite or ortho-rectified aerial image on the Site Map and describe the changes in the extent of native vegetation in the BAR.
5.2 Identifying native plant community types and ecological communities on the subject land
5.2.1.1 An assessor must identify and map the distribution of PCTs, or the most likely PCTs and all TECs on the subject land. The identification must be according to the NSW PCT classification as described in the BioNet Vegetation Classification.
5.2.1.2 A detailed description of each PCT and its geographic distribution is contained within the BioNet Vegetation Classification and is publicly available from www.environment.nsw.gov.au/research/vegetationinformationsystem.htm.
5.2.1.3 A detailed description of each threatened ecological community is available from the OEH website at www.environment.nsw.gov.au/threatenedSpeciesApp/.
5.2.1.4 The survey effort and intent of the plot-based vegetation survey described in Paragraph 5.2.1.9 is to identify the PCTs, or the most likely PCTs. An assessor may identify the most likely PCTs where vegetation on the subject land, or on part of the subject land: (a) has been modified to an extent that it has reduced species richness, or it is
missing structural layers, or (b) has no distinct linear boundary to determine a difference between PCTs on
the site.

12 Biodiversity Assessment Method
5.2.1.5 The assessor should review any existing information on native vegetation that is relevant to the subject land and land within the 1500m buffer area. This includes: (a) survey data or individual species records that are held in the Flora Survey
(BioNet), or (b) existing maps of native vegetation in the area such as those held by OEH, or
a local government authority, or (c) information in ecological reports, soil surveys or previous native vegetation
surveys that is relevant to the subject land.
5.2.1.6 Using the information from sources described in Paragraph 5.2.1.5, the assessor can develop a vegetation survey design to identify PCTs on the subject land based on: (a) an assessment of the expected environmental variation (b) the scale of further assessment required for PCT identification (c) gaps in existing mapping and site information (d) the survey extent.
5.2.1.7 The assessor must undertake a plot-based vegetation survey of the subject land that is stratified and targeted to assess the expected environmental variation and address any areas with gaps in existing mapping and site information.
5.2.1.8 A BDAR, BCAR or BSSAR must include: (a) the review of existing information on native vegetation including references to
previous vegetation maps of the subject land, and (b) a description of the systematic field-based floristic vegetation survey using
documented and repeatable methods, and (c) a description of the systematic survey effort of the subject land, ensuring it
was commensurate with the expected environmental variation, and (d) how the plot-based floristic vegetation survey intensity has sampled the
expected environmental variation between stratified environmental units, and (e) that the survey effort was targeted to fill gaps in the existing mapping and
site information.
5.2.1.9 The plot-based floristic vegetation survey is based on a 20m × 20m plot (or 400m2 equivalent for linear areas). The assessor must assess the plot for the information contained in Table 2 and include these data in the BDAR, BCAR or BSSAR.
Table 2: Vegetation survey data collected at the subject land
Attribute Survey requirement
Stratum (& layer) Stratum & layer in which each species occurs
Growth form Growth form for each recorded species
Species name Scientific name and common name
Cover Estimate the % foliage cover across the plot of each species rooted in or overhanging the plot. Cover should be recorded in decimals if less than 1% (0.1, 0.2…), or whole numbers up to 5% (1,2,3…), or to the nearest 5% where greater than 5% cover (5,10,15,20,25…)

Assessing native vegetation, threatened ecological communities and vegetation integrity 13
Attribute Survey requirement
Abundance rating For species with cover less than or equal to 5%, count or estimate the number of individuals or shoots of each species within the plot, using the following intervals: 1,2,3,4,5,6,7,8,9,10,20,50,100,500,1000,1500,2000, etc. Numbers above 20 are estimates only, and the recorded abundance is the upper end of each class (e.g. 50 represents an estimated abundance of between 20 and 50) For species with cover greater than 5%, abundance estimates are not required (but may be recorded if desired)
5.2.1.10 Plots used for the floristic vegetation survey may also be used as vegetation integrity plots. The assessor must assign each native plant species to an adult/mature growth form group according to the definitions set out in Appendix 4. The assessor must assign a native species to only one growth form based on the adult/mature growth form of the species.
5.2.1.11 The full species name (Genus species) must be recorded for all native species, unless insufficient diagnostic plant material is present, in which case the genus name followed by a species number must be used.
5.2.1.12 The assessor must provide justification of evidence used to identify the PCT, or the likely PCTs, on the subject land. This includes: (a) evidence of a quantitative analysis of existing and new site survey data to define
the likely PCTs, and (b) matching the outputs of the quantitative analysis of existing and new site
survey data to PCTs in the Flora Survey (BioNet) (c) a map showing the distribution of the PCTs on the subject land.
5.2.1.13 Following completion of the plot-based floristic vegetation survey, the map of PCTs should be amended to reflect the outcomes of the vegetation survey.
5.2.1.14 The assessor must identify any TECs that are associated with a PCT, or the most likely PCTs.
5.2.1.15 The assessor must map the distribution of all TECs on the subject land and provide this on the Site Map. The BioNet Vegetation Classification indicates where a PCT may be associated with the TEC.
5.2.1.16 The assessor must also record the estimated percent cleared value of the PCT or the likely PCTs, using data contained in the BioNet Vegetation Classification for the PCT.
5.2.1.17 The assessor must only identify PCTs on the subject land that are described in the BioNet Vegetation Classification as derived vegetation communities where the assessor cannot determine the original PCT.
5.3 Vegetation integrity assessment (site condition)
5.3.1 Mapping vegetation zones 5.3.1.1 In Subsection 5.3.2 a vegetation zone means an area of native vegetation on the
subject land that is the same PCT and has a similar broad condition state.
5.3.1.2 The assessor must use the map of PCTs referred to in Section 5.2 to identify and map the area of each PCT into a vegetation zone on the subject land.

14 Biodiversity Assessment Method
5.3.1.3 The assessor must stratify areas of each PCT that are in different broad condition states into separate vegetation zones.
5.3.1.4 The assessor may consider areas of the PCT that have a similar tree, shrub and ground cover, weed extent or combinations of these to assign areas of similar condition.
5.3.1.5 A vegetation zone may comprise a number of discontinuous patches of vegetation provided the vegetation within the discontinuous areas is the same PCT and in a similar broad condition state.
5.3.1.6 A vegetation zone that is mapped as derived vegetation must be assessed against the benchmark data which in the opinion of the assessor is the most likely original PCT, or against the benchmark data for the vegetation class of the most likely original PCT. A vegetation zone that is mapped as derived vegetation must be assessed against the benchmark data for the PCT from which it was derived.
5.3.2 Assessing the patch size for a vegetation zone 5.3.2.1 For each vegetation zone, the assessor must determine the patch size area
within which the vegetation zone is located.
5.3.2.2 The patch size area is assigned to the vegetation zone as a class, being <5ha, 5–24ha, 25–100ha or ≥100ha.
5.3.2.3 For a vegetation zone that comprises a number of discontinuous patches and the area of the discontinuous patches meets more than one class, the assessor may assign more than one patch size class to the vegetation zone.
5.3.2.4 The patch size class is later used to assess the habitat suitability of the subject land for threatened species in Section 6.4.
5.3.3 Assessing vegetation integrity (site condition) 5.3.3.1 In this section references to the map means the map of vegetation zones on the
subject land prepared under Subsection 5.3.1. 5.3.3.2 For PCTs classified under vegetation formations that are rainforests, wet
sclerophyll forests, dry sclerophyll forests, forested wetlands, grassy woodlands, semi-arid woodlands and heathlands with trees (Wallum Sand Heaths (NSW031), Sydney Coastal Heaths (NSW032), Northern Montane Heaths (NSW033), Sydney Montane Heaths (NSW034)), the assessor must survey each vegetation zone identified on the map to obtain a quantitative measure for each zone of the composition, structure and function attributes listed in Table 3.
5.3.3.3 For PCTs classified under vegetation formations that are freshwater wetlands, saline wetlands, grasslands, alpine complex, arid shrublands and heathlands without trees (Southern Montane Heaths (NSW035), South Coast Heaths (NSW065), Coastal Headland Heaths (NSW070)), the assessor must survey each vegetation zone identified on the map to obtain a quantitative measure for each zone of the composition and structure attributes listed in Table 3.
5.3.3.4 The assessor must assess the composition, structure and relevant function attributes listed in Table 3 for each zone against the benchmark data for the relevant PCT.
5.3.3.5 For the purposes of Subsection 5.3.2, the assessor must use benchmark data from the BioNet Vegetation Classification unless benchmark data is obtained from local reference sites or from relevant published sources in accordance with Appendix 5.

Assessing native vegetation, threatened ecological communities and vegetation integrity 15
Table 3: Growth form groups and attributes used to assess the composition, structure and function components of vegetation integrity
Growth form groups used to assess composition and structure
Attributes used to assess function
a) Tree
b) Shrub
c) Grass and grass like
d) Forb
e) Fern
f) Other
a) Number of large trees
b) Tree regeneration
c) Tree stem size class
d) Total length of fallen logs
e) Litter cover
f) High threat exotic vegetation cover
g) Hollow bearing trees
5.3.4 Vegetation integrity survey plots 5.3.4.1 The minimum number of plots/transects that must be sampled for each
vegetation zone is detailed in Table 4.
5.3.4.2 Survey data from the plot-based floristic vegetation survey established within a zone to identify a PCT under Section 5.2 can contribute to the minimum number of plots required to assess vegetation integrity.
5.3.4.3 If the broad condition state of the vegetation is more variable across the zone, additional plots/transects to the number specified in Table 4 may be required to ensure a representative sample is taken for the vegetation.
5.3.4.4 Plots/transects must be established to provide a representative assessment of the vegetation integrity of the vegetation zone, accounting for the level of variation in the broad condition state of the vegetation zone.
5.3.4.5 Acceptable methods to establish or randomly locate plots within stratification units to provide a representative assessment of the vegetation integrity of the vegetation zone include: (a) marking waypoints and bearings randomly to provide a representative
assessment of the vegetation integrity of the vegetation zone in the assessment area and establishing plots at all or some of these waypoints, or
(b) walking a random distance into the vegetation zone. The survey data must be collected from that location on a randomly generated compass bearing, with the process repeated elsewhere within the vegetation zone.
5.3.4.6 Plots should not be located in or near ecotones, vehicle tracks and their edges, or other disturbed areas that are readily distinguishable from the broad condition state of the vegetation zone.
5.3.4.7 Where separate areas of land are mapped into a single vegetation zone, the plots/transects must be evenly located across the separate areas of the vegetation zone.
5.3.4.8 The assessor must establish survey plots around a central 50m transect as follows: (a) One 400m2 plot (standard 20m x 20m) is used to assess all of the
composition and structure attributes set out in Table 3.

16 Biodiversity Assessment Method
(b) One 1000m2 (standard 20m x 50m) plot is used to assess the function attributes: number of large trees, stem size class, tree regeneration and length of logs.
(c) Five 1m2 sub-plots are used to assess average litter cover (and other optional groundcover components) for the plot.
Table 4: Minimum number of plots and transects required per zone area
Vegetation zone area (ha) Minimum number of plots/transects
<2 1 plot/transect
>2–5 2 plots/transects
>5–20 3 plots /transects
>20–50 4 plots/transects
>50–100 5 plots/transects
>100–250 6 plots/transects
>250–1000 7 plots/transects; more plots may be needed if the condition of the vegetation is variable across the zone
>1000 8 plots/transects; more plots may be needed if the condition of the vegetation is variable across the zone
Composition 5.3.4.9 Assessment of composition is based on the number of native plant species
(richness) observed and recorded by the assessor within a plot for each growth form group shown in Table 3.
5.3.4.10 The assessor must assign a native plant species to a growth form group according to the definitions set out in Appendix 4. An assessor must allocate a species to one growth form group based on the adult/mature growth form of the species.
5.3.4.11 The minimum vegetation survey data required to be recorded by the assessor for composition at each 20m x 20m condition plot are: (a) full species name (Genus species) for the three dominant native species
within each growth form group. Dominant native species means those native species that contribute most to the total cover of the growth form group, and
(b) genus name or the full species name where practicable for all other species. Practicable means that sufficient plant material is present to make a species level identification and the assessor has sufficient skills and knowledge to make the identification in the field
(c) whether each species is native, exotic, or high threat exotic (d) the growth form group to which each native species has been allocated.
5.3.4.12 The composition of each growth form group is assessed by counting the number of different native plant species recorded within each growth form group within each 20m × 20m condition plot.
Structure 5.3.4.13 Structure is the assessment of foliage cover for each growth form group within
the 20m x 20m plot boundary. Foliage cover for a growth form group is the percentage of cover of all living plant material of all individuals of the species

Assessing native vegetation, threatened ecological communities and vegetation integrity 17
present for that group. This includes leaves, twigs, branchlets and branches as well as canopy overhanging the plot even if the stem is outside the plot.
5.3.4.14 The assessor must record an estimate of the foliage cover for each native and exotic species present within the 20m x 20m plot. Foliage cover estimates for each species must draw from the following number series: 0.1, 0.2, 0.3,……1, 2, 3,……10, 15, 20, 25,……100%.
5.3.4.15 The assessor must not use methods such as Braun-Blanquet (or other) classes, or a transect point intercept method to record the foliage cover score for a growth form group.
5.3.4.16 The structure of each growth form group for the 20m x 20m plot is recorded by the assessor as the sum of all the individual foliage cover estimates of all native plant species recorded within each growth form group within each plot.
5.3.4.17 The assessor must assign each non-native (exotic) plant species a foliage cover estimate and either E (exotic) or HTE (high threat exotic).
Function 5.3.4.18 The number of large trees, tree stem size class, tree regeneration and length of
fallen logs is recorded within a 1000m2 plot as specified in Paragraph 5.3.4.8.
5.3.4.19 Tree stem size classes should be measured at 1.3m above ground height, referred to as ‘diameter at breast height over bark’ or DBH.
5.3.4.20 Tree stem size classes are: <5, 5–9, 10–19, 20–29, 30–49, 50–79, and 80+ cm DBH and include all species in the tree growth form group.
5.3.4.21 Only living trees contribute to counts for determination of presence and for a multi-stemmed tree, only the largest living stem is included in the count.
5.3.4.22 The number of large trees is a count of all living stems with a DBH equal to or greater than the large tree benchmark DBH size for that PCT or vegetation class.
5.3.4.23 For a multi-stemmed tree, at least one living stem must be equal to or greater than the large tree benchmark DBH size to count as a large tree.
5.3.4.24 Stem size class is based on the presence or absence of living tree stems within size classes that fall between regenerating stems (<5cm DBH) and the large tree benchmark DBH size(s).
5.3.4.25 For a multi-stemmed tree, only the largest living stem is counted for determining the presence or absence of stems within each size class.
5.3.4.26 Regeneration is based on the presence or absence of living trees with stems <5cm DBH.
5.3.4.27 The length of fallen logs is the total length in metres of all woody material greater than 10cm in diameter that is dead and entirely or in part on the ground within the 20m x 50m plot. Where logs extend outside of the plot, the assessor must only record the length of fallen log that is contained within the plot.
5.3.4.28 Litter cover is assessed as the average percentage ground cover of litter recorded from five 1m x 1m plots evenly located along the central transect specified in Paragraph 5.3.4.8. Litter cover includes leaves, seeds, twigs, branchlets and branches (<10cm in diameter). The assessment of litter cover must include all plant material that is detached from a living plant. Dead material still attached to a living plant (such as a grass) is assessed as litter cover where it is in contact with the ground. Dead material still attached to a living plant that is not in contact with the ground, or litter suspended in the canopies of other plants

18 Biodiversity Assessment Method
is not assessed as litter cover. Litter cover should be considered as the two-dimensional litter layer and includes litter under the canopies of erect plants.
5.3.4.29 The number of trees with hollows is determined by counting the number of trees with hollows that are visible from the ground in the 20m x 50m plot. The number of trees with hollows can include native species allocated to the shrub growth form group. It must include both living and dead trees.
5.3.4.30 The number of trees with hollows does not contribute to the vegetation integrity score. The presence of hollow bearing trees is used as part of the habitat suitability assessment for some threatened species in Chapter 6 and for identifying the credit class for biodiversity credits in Chapter 11.
5.4 Determining the vegetation integrity score 5.4.1.1 To determine the vegetation integrity score for a vegetation zone, the assessor
must determine the composition score, structure score and function score using the plot survey data collected for the vegetation zone.
5.4.1.2 The assessor must use Equations 8–16 set out in Appendix 6 and the BAM Credit Calculator to determine the current vegetation integrity score.

Assessing the habitat suitability for threatened species 19
6 Assessing the habitat suitability for threatened species
6.1 Threatened Biodiversity Data Collection 6.1.1.1 The assessment of habitat suitability is supported by information from the
Threatened Biodiversity Data Collection. An assessor must obtain this information through the BAM Credit Calculator or directly from the Threatened Biodiversity Data Collection.
6.1.1.2 An assessor may use additional information about a threatened species, in BioNet (e.g. the profile of a threatened species) or published, peer reviewed literature, when assessing the habitat suitability of a site.
6.1.1.3 The habitat suitability assessment requires the assessor to use the following information from the Threatened Biodiversity Data Collection: (a) the threatened species that are either known or predicted to occur within the
IBRA subregion identified in Paragraph 4.2.1.3(a) (b) the threatened species that are associated with each PCT identified in
Section 5.2 (c) the native vegetation cover with which the threatened species is associated,
estimated as a percentage of the vegetation surrounding the subject area, as identified in Paragraph 4.3.2
(d) minimum patch size in hectares, identified in Paragraph 5.3.2, with which the threatened species is associated
(e) any geographic constraints associated with the occurrence of the threatened species
(f) any habitat constraints associated with the occurrence of the threatened species
(g) past records of the threatened species on the subject land (h) the class of credit for the threatened species.
6.1.1.4 To assess the habitat suitability of a site for a threatened species using the streamlined assessment for paddock trees, an assessor must establish that paddock trees are important habitat for the species as identified in the Threatened Biodiversity Data Collection.
6.1.1.5 An assessor may use more appropriate local data, in accordance with Subsection 2.2.2 instead of data from the Threatened Biodiversity Data Collection.
6.1.1.6 If the assessor uses more appropriate local data, the assessor must include the reasons for the use of more appropriate local data in the BAR.
6.2 Assessing habitat suitability for species that can be predicted by habitat surrogates (ecosystem credits)
6.2.1.1 Threatened species where the likelihood of occurrence of a species or elements of the species’ habitat can be predicted by vegetation surrogates and landscape features, or for which targeted survey has a low probability of detection, are identified in the Threatened Biodiversity Data Collection as ecosystem credit species. Targeted survey is not required for these species.

20 Biodiversity Assessment Method
6.2.1.2 These ecosystem credit threatened species must be assessed in conjunction with information collected by the assessor about site context of the subject land in Section 4.3 and Subsection 5.3.2, PCTs and vegetation integrity attributes in Chapter 5, and data from the Threatened Biodiversity Data Collection.
6.2.1.3 The residual impact on the species’ habitat from development, clearing or conferral of biodiversity certification is measured in biodiversity credits using the vegetation integrity score for each vegetation zone determined in Appendix 6.
6.2.1.4 Species that require ecosystem credits are assessed according to Step 1 and Step 2 in Section 6.4.
6.3 Assessing habitat suitability for species that cannot be predicted by habitat surrogates (species credit species)
6.3.1.1 Species credit species must be assessed in conjunction with information collected by the assessor about the site context of the subject land in Section4.3, on PCTs and vegetation integrity attributes in Chapter 5, and data obtained from the Threatened Biodiversity Data Collection.
6.3.1.2 Threatened species where the likelihood of occurrence of a species or elements of suitable habitat for the species cannot be confidently predicted by vegetation surrogates and landscape features and can be reliably detected by survey are identified in the Threatened Biodiversity Data Collection as species credit species.
6.3.1.3 Targeted survey or an expert report is required to confirm presence/absence of these species on the subject land.
6.3.1.4 In some circumstances, the Threatened Biodiversity Data Collection may identify that a species requires assessment for ecosystem credits and species credits. This occurs where part of the habitat is assessed as a species credit (e.g. breeding habitat, or mapped locations identified as important area that is used by a species). The remaining part of the habitat is assessed as an ecosystem credit (e.g. foraging habitat, unmapped locations used by a species).
6.3.1.5 Species that require ecosystem credits and species credits are generally highly mobile species reliant on particular habitat components for breeding, such as maternity caves for bats or tree hollows for some large forest owls or cockatoos, and/or particular areas have been identified as being important for the species’ persistence such as select beaches for migratory shorebirds.
6.3.1.6 Species that require assessment at a development site, clearing site or land proposed for the conferral of biodiversity certification, or to create species credits at a biodiversity stewardship site, must be identified and assessed in accordance with Section 6.4.
6.3.1.7 An assessment of species for species credits is optional at a biodiversity stewardship site; however, species credits can only be created where the biodiversity stewardship site has been assessed in accordance with Section 6.4.
6.4 Steps for identifying habitat suitability for threatened species 6.4.1.1 The assessor must identify the habitat suitability for threatened species on the
subject land using the following steps.
Step 1: Identify threatened species for assessment 6.4.1.2 The purpose of Step 1 is to identify the threatened species required for
assessment using the information obtained from the Threatened Biodiversity

Assessing the habitat suitability for threatened species 21
Data Collection in Section 6.1 and from assessing the subject land in Chapter 4 and Chapter 5.
6.4.1.3 The assessor must first use the following criteria to predict the threatened species that require assessment at the site: (a) the distribution of the species includes the IBRA subregion which the subject
land is, in the opinion of the assessor, mostly located within, and (b) the subject land is within any geographic constraints of the distribution of the
species within the IBRA subregion, and (c) the species is associated with any of the PCTs identified by the assessor
under Chapter 5 as occurring within the subject land, and (d) the native vegetation cover within an assessment area 1500m wide
surrounding the boundary of the subject site as determined by the assessor in accordance with Subsection 4.3.2 is equal to or greater than the minimum class that is required for the species (unless the development is, or is part of, a linear shaped development), and
(e) the patch size which the vegetation zone is part of, as identified in Subsection 5.3.2 is equal to or greater than the minimum specified for that species, and
(f) the species is identified as an ecosystem or species credit species in the Threatened Biodiversity Data Collection.
6.4.1.4 A threatened species is predicted as requiring assessment if that species meets all of the criteria a) – f) that are relevant to the species. A criterion is not relevant to a species if the species’ profile in the Threatened Biodiversity Data Collection does not contain information for that criterion.
6.4.1.5 If any past surveys undertaken on the subject land, regardless of whether or not the data is within BioNet, have recorded the presence of a threatened species, this species must be identified as being a species that requires assessment at the subject land.
6.4.1.6 Where a vegetation zone is across one or more IBRA subregions, the IBRA subregion in which most of the proposal occurs must be used. This provision is not applicable to linear shaped developments.
6.4.1.7 For linear shaped developments, the assessor must carry out a separate habitat suitability assessment for each IBRA subregion.
6.4.1.8 If any one of the criteria relevant to the species in Paragraph 6.4.1.3 a) – f) is not met, the subject land is considered not suitable habitat for the threatened species. No further assessment is required for that species at a development site, clearing site, land subject to biodiversity certification or at a biodiversity stewardship site.
Step 2: Assessment of the habitat constraints and vagrant species on the subject land 6.4.1.9 The assessor may opt to undertake an additional assessment of the habitat
constraints on the subject land for the threatened species predicted for assessment.
6.4.1.10 The assessor must use the habitat constraints identified in the Threatened Biodiversity Data Collection to assess the habitat on the subject land for each threatened species predicted for assessment. Step 2 is not applicable to a species where no habitat constraints are listed for that species in the Threatened Biodiversity Data Collection.

22 Biodiversity Assessment Method
6.4.1.11 If the assessor determines that one or more of the habitat constraints is present on the subject land or in a vegetation zone, the assessor must retain the species as a species that requires further assessment.
6.4.1.12 Where the assessor determines that none of the habitat constraints are present in a vegetation zone for a threatened species predicted for assessment, the species is considered unlikely to occur and no further assessment is required for that species in that vegetation zone. The assessor must record in the BAR the reasons for determining that a predicted species is unlikely to occur in the vegetation zone.
6.4.1.13 Where the assessor determines that none of the habitat constraints are present on the entire subject land for the threatened species predicted for assessment, the species is considered unlikely to occur and no further assessment is required for that species. The assessor must record in the BAR the reasons for determining that a predicted species is unlikely to occur on the subject land.
6.4.1.14 If the species is a vagrant in the IBRA subregion, the species is considered unlikely to occur and no further assessment is required. The assessor must record in the BAR the reasons for determining that the species is unlikely to occur on the subject land.
6.4.1.15 All remaining threatened species predicted for assessment that require ecosystem credits are considered likely to have suitable habitat on the site. These species require assessment for the impacts of development, clearing or biodiversity certification in Stage 2, including measures taken to avoid and minimise the impacts of development, and the calculation of ecosystem credits to offset any residual impacts.
6.4.1.16 All remaining threatened species predicted for assessment that require species credits are considered likely to have suitable habitat on the subject land. These species are referred to as ‘candidate species credit species’ and require further assessment under Step 3.
Step 3: Identify candidate species credit species for further assessment 6.4.1.17 A candidate species credit species will be considered unlikely to occur on the
subject land (or specific vegetation zones) if: (a) after carrying out a field assessment of the habitat constraints or
microhabitats on the subject land, the assessor determines that the habitat is substantially degraded such that the species is unlikely to utilise the subject land (or specific vegetation zones), or
(b) an expert report that is prepared in accordance with Subsection 6.5.2 states that the species is unlikely to be present on the subject land or specific vegetation zones.
6.4.1.18 A candidate species credit species that is not considered to have suitable habitat on the subject land (or specific vegetation zones) in accordance with Paragraph 6.4.1.17 does not require further assessment on the subject land (or specific vegetation zones).
6.4.1.19 The assessor must provide the reasons in the BAR for determining in Step 3 that a predicted species credit species is unlikely to have suitable habitat on the subject land (or specific vegetation zones).
Step 4: Determine presence or absence of a candidate species credit species 6.4.1.20 The assessor must determine the presence or absence of each remaining
candidate species credit species.

Assessing the habitat suitability for threatened species 23
6.4.1.21 An assessor must establish whether each of the species credit species is present, or is likely to use suitable habitat, on the subject land (or specific vegetation zones), by either: (a) assuming it is present (development sites or land proposed to be biodiversity
certified only), or (b) undertaking a threatened species survey in accordance with Section 6.5, or (c) obtaining an expert report in accordance with Subsection 6.5.2.
6.4.1.22 An assessor cannot assume that a species is present on a biodiversity stewardship site.
6.4.1.23 Where the survey or expert report confirms that a species credit species is present, or is likely to use the suitable habitat, on the subject land (or specific vegetation zones) OR the species is assumed to be present (development sites or land proposed to be biodiversity certified only), it must be assessed further under Step 5.
6.4.1.24 Where the survey or expert report confirms that a species credit species is not present or unlikely to be present on the subject land, or unlikely to use the suitable habitat on the subject land, no further assessment is required.
6.4.1.25 Where the subject land is within a mapped location identified as an important area that is used by a species, the assessor is not required to survey to determine that the species is present. Where the subject land is within a mapped location, the habitat for the species is considered to be present.
Step 5: Determine the area or count, and location of suitable habitat for a species credit species 6.4.1.26 Where either:
(a) a survey or expert report confirms that a species credit species is present, or is likely to use the suitable habitat, on the subject land, or
(b) a species credit species is assumed to be present on the development site, clearing site or land proposed to be biodiversity certified
the assessor must prepare a species polygon for each species credit species.
6.4.1.27 Using the results of the species survey or information in the expert report, the assessor must use a species polygon to identify the area, or count and location of the suitable habitat for a species credit species on the subject land.
6.4.1.28 For fauna species, and flora species where the unit of measure is area, according to the Threatened Biodiversity Data Collection, the species polygon is used to measure the area and location of suitable habitat.
6.4.1.29 For flora species where the unit of measure is a count of individuals, according to the Threatened Biodiversity Data Collection, the targeted survey is used to provide a count, or an estimation, of the number of individual plants on the subject land. The species polygon is used to show the location of individual plants present on the subject land. The species polygon is to be established by the location of the individual plant or group of plants, and a 30m buffer area around the outside of the individual plant or group of plants.
6.4.1.30 Where a species is assumed to be present on the subject land (except for a biodiversity stewardship site), the assessor must use either:

24 Biodiversity Assessment Method
(a) an expert report, in accordance with Subsection 6.5.2, to determine the location and area of the species polygon to include the fauna/flora habitat or number of individual flora species assumed to be present on the development site, OR
(b) the species polygon must encompass the entire vegetation zone/s within which the candidate species is predicted to use/occur, based on application of Step 1 to Step 4.
6.4.1.31 For species identified according to Paragraph 6.4.1.25, the species polygon will include all areas of the subject area that occur within the mapped area as identified by the habitat constraints information for the species contained in the Threatened Biodiversity Data Collection.
6.4.1.32 The boundary of the species polygon must be finalised on completion of the species survey or expert report.
6.4.1.33 The species polygon must: (a) be mapped using a satellite image (ADS–40) or the best available ortho-
rectified aerial image of the subject land, and (b) use the unit of measurement identified for that species in the Threatened
Biodiversity Data Collection to show the locations of individual flora species (and buffer), or the area of suitable fauna/flora species habitat, and
(c) contain the suitable habitat features or habitat components associated with that species on the subject land, and
(d) utilise GPS to confirm the location of the species polygon on the best available ortho-rectified aerial image of the subject land.
6.4.1.34 A description of the species and the habitat feature/s or habitat constraints associated with the species on the site must be included in the BAR.
Step 6: Determine the habitat condition within the species polygon for species assessed by area 6.4.1.35 The assessor must determine the habitat condition of the species polygon by
using the vegetation integrity score for each vegetation zone that is within the species polygon.
6.4.1.36 Different areas of the species polygon may have different habitat condition where the species polygon contains areas of land from more than one vegetation zone.
6.4.1.37 Where the species polygon contains an area of land that is not part of a vegetation zone, the assessor must not use a vegetation integrity score to determine the habitat condition of this area. Such areas can include suitable habitat features or habitat components such as exotic vegetation, caves, rock faces or bridges. For development, clearing or biodiversity certification proposals, these features are considered in Section 6.7.
6.5 Undertaking a threatened species survey 6.5.1.1 A species survey must be undertaken for all species credit species identified as
likely to occur on the site based on the application of Steps 1–3 in Section 6.4 unless: (a) an expert report prepared in accordance with Subsection 6.5.2 has been
obtained for the species, or

Assessing the habitat suitability for threatened species 25
(b) the species is assumed to be present and the area of habitat or number of individuals in a species polygon is determined in accordance with Step 5 in Section 6.4.
6.5.1.2 An assessor must only undertake a species survey during the time period specified for that species in the Threatened Biodiversity Data Collection.
6.5.1.3 A species survey must be undertaken in accordance with the OEH threatened species survey guidelines published by the Environment Agency Head including the Threatened species survey guidelines for amphibians and NSW Guide to Surveying Threatened Plants.
6.5.1.4 Where no relevant published OEH guidelines exist, the assessor must undertake a species survey using best practice methods that can be replicated for repeat surveys.
6.5.1.5 The timing, methods and effort used for a species survey must be described in the BAR.
6.5.2 Using expert reports instead of undertaking a survey 6.5.2.1 An expert report may be obtained instead of undertaking a species survey at a
development site, clearing site, land to be biodiversity certified or a biodiversity stewardship site.
6.5.2.2 An expert report must only be prepared by a person who, in the opinion of the Environment Agency Head, possesses specialised knowledge based on training, study or experience to provide an expert opinion in relation to the biodiversity values to which an expert report relates.
6.5.2.3 The credentials of the expert must be provided in the expert report which must be appended to the BAR. Expert status can be demonstrated by: (a) the expert’s qualifications such as relevant degrees, post graduate
qualifications, and (b) their history of experience in the ecological research and survey method, for
the relevant species, and (c) a resume detailing projects pertaining to the survey of the relevant species
(including the locations and dates of the work) over the previous 10 years, and
(d) their employer’s name and period of employment (where relevant), and (e) relevant peer reviewed publications, and (f) evidence that the person is a well-known authority on the relevant species to
which the survey relates. The accredited assessor cannot act as a referee for the proposed expert.
6.5.2.4 The Environment Agency Head may publish a list of experts.
6.5.2.5 The expert report must document the information that was considered, and/or rejected as unsuitable for consideration, to reach the determination made in the expert report.
6.5.2.6 An expert report can only be used instead of a survey for species to which species credits apply.
6.5.2.7 An expert report must set out whether:

26 Biodiversity Assessment Method
(a) for development sites or land proposed for biodiversity certification – the species is unlikely to be present on the development site or land proposed for biodiversity certification – in this case no further assessment of the species is required, or
(b) for all subject land – the species is likely to be present on the site – in this case the expert report must provide an estimate of the number of individuals or area of habitat to be impacted by the development or the management actions (according to the unit of measurement identified for the species in the Threatened Biodiversity Data Collection).
6.5.2.8 An expert report must address all the following criteria: (a) identify the relevant species or population (b) provide a justification for the use of an expert report (c) indicate and justify the likelihood of presence of the species or population
and prepare a species polygon showing the location and area of the species polygon
(d) estimate the area of habitat (as identified in the Credit Calculator) for the subject land, or
(e) estimate the maximum number of mature individuals (as identified in the Credit Calculator) for the subject land. Where the expert report is required because the species is assumed to be present, provide evidence such as a reference site, for this estimation, and
(f) include the information considered in relation to the determination made in the report, and
(g) identify the expert and provide evidence of their credentials.
6.6 Identify the biodiversity risk weighting for the species (development sites, clearing sites and biodiversity certification)
6.6.1.1 The biodiversity risk weighting for the species is used in the credit calculation to assess the impacts of development, clearing and biodiversity certification on a threatened species.
6.6.1.2 The biodiversity risk weighting is based on the combination of two components: sensitivity to loss score and sensitivity to potential gain score using the criteria listed in Appendix 7.
6.6.1.3 For species credit species information on the species’ sensitivity to loss, its sensitivity to gain and its biodiversity risk weighting, and for ecosystem credit species information on the species’ sensitivity to gain, is contained in the species profile for that species in the Threatened Biodiversity Data Collection.
6.6.1.4 The Credit Calculator will present the biodiversity risk weighting used in: (a) ecosystem credit calculations – here the biodiversity risk weighting is based
on the predicted ecosystem credit species with the highest sensitivity to gain score and the sensitivity to loss score for the relevant vegetation community (including TECs), see Appendix 7.
(b) species credit calculations – the biodiversity risk weighting relevant to that species, see Appendix 7.
Assessing the habitat suitability for threatened species 27
6.6.1.5 Threatened species that have a very high biodiversity risk weighting are species that are listed in the Guidance to assist a decision-maker to determine a serious and irreversible impact.
6.7 Identifying potential prescribed biodiversity impacts on threatened species
6.7.1.1 Identify occurrences of karst, caves, crevices and cliffs including: (a) locations on the Site Map (b) a candidate list of threatened species and ecological communities using or
dependent on these habitat features1 (c) any biological processes that sustain these habitat features (d) known threats operating on the biological processes that sustain these
habitat features
6.7.1.2 Identify occurrences of rock including: (a) locations of outcrops on the Site Map (b) a description of the characteristics of any scattered rock (c) a candidate list of threatened species dependent on these habitat features.
6.7.1.3 Identify occurrences of human made structures and non-native vegetation including: (a) locations on the Site Map (b) a candidate list of threatened species using these habitat features.
6.7.1.4 Identify hydrological processes that sustain and interact with the rivers, streams and wetlands mapped in Paragraph 4.2.1.3. including: (a) volumes and seasonal patterns (b) flow paths and seasonal patterns (c) baseline water quality data.
6.7.1.5 Where the proposed development is for a wind farm, identify a candidate list of species that may use the development site as a flyway or migration route, including: (a) resident threatened aerial species (b) resident raptor species (c) nomadic and migratory species that are likely to fly over the project area.
6.7.1.6 The assessor must undertake targeted surveys for each of the candidate species. The targeted survey must: (a) use methods appropriate for the species being targeted as per Paragraph
6.5.1.3 or 6.5.1.4, and (b) use methods that measure movement of a species, for example ultrasonic
bat detectors on monitoring masts or other structures of suitable height, and (c) be performed at times of the year appropriate for identifying the species, and (d) be based on a repeatable method for inclusion in any ongoing monitoring
program post-approval.
1 Note that impacts on some of these potential species may have been identified under Sections 6.4 and 6.5 and be considered serious and irreversible in accordance with Section 10.2.

28 Biodiversity Assessment Method
6.7.1.7 The survey methods, location of detectors (including whether they are in the impact zone), effort and timing for each species must be included in the BDAR/BCAR.
6.7.1.8 Based on the outcomes of the targeted survey, the assessor is required to: (a) predict and map the habitual flight paths for nomadic and migratory species
likely to fly over the project area on the Location Map and Site Map (b) map the likely habitat for resident threatened aerial and raptor species on the
Site Map.

Introduction to Stage 2 29
Stage 2 – Impact assessment (biodiversity values and prescribed impacts) 7 Introduction to Stage 2
7.1 Documenting Stage 2 outcomes 7.1.1.1 The outcomes of Stage 2, combined with the outcomes of Stage 1, are
documented in the BDAR or a BCAR. The BDAR/BCAR must be prepared by an assessor and must contain the matters identified in Appendix 10 or Appendix 12 for assessments using the streamlined assessment module.
Sections within Stage 2 8 Avoiding and minimising impacts on biodiversity values ............................................... 30
8.1 Avoiding and minimising impacts on native vegetation and habitat during project planning ................................................................................................... 30
8.2 Avoiding and minimising prescribed biodiversity impacts during project planning 31
9 Assessment of impacts ................................................................................................. 34
9.1 Assessing impacts on native vegetation and habitat ............................................ 34 9.2 Assessing prescribed biodiversity impacts ........................................................... 36 9.3 Mitigating and managing impacts on biodiversity values ...................................... 40 9.4 Adaptive management for uncertain impacts ....................................................... 42
10 Thresholds for the assessment and offsetting of impacts of development .................... 44
10.2 Impact assessment of potential entities of serious and irreversible impacts on biodiversity values ............................................................................................... 44
10.3 Impacts for which the assessor is required to determine an offset requirement ... 47 10.4 Impacts that do not require further assessment by the assessor ......................... 47
11 Application of the no net loss standard ......................................................................... 48
11.2 Calculating the offset requirement ....................................................................... 48 11.3 Identifying the credit class for ecosystem credits and species credits .................. 51 11.4 Offset rules for biodiversity values ....................................................................... 52

30 Biodiversity Assessment Method
8 Avoiding and minimising impacts on biodiversity values
8.1 Avoiding and minimising impacts on native vegetation and habitat during project planning
8.1.1 Locating a project to avoid and minimise impacts on native vegetation and habitat
8.1.1.1 Project location decisions should be informed by knowledge of biodiversity values. The assessment requirements set out in Stage 1 of the BAM may be used to provide an initial desktop assessment of biodiversity values for early consideration in planning the route or location of a project.
8.1.1.2 Final selection of project location may be an iterative process. Location decisions may need to be revisited when all field surveys have been completed.
8.1.1.3 Direct impacts on clearing of native vegetation and habitat can be avoided and minimised by: (a) locating the project in areas where there are no biodiversity values (b) locating the project in areas where the native vegetation or threatened
species habitat is in the poorest condition (i.e. areas that have a lower vegetation integrity score)
(c) locating the project in areas that avoid habitat for species that have a high biodiversity risk weighting or native vegetation that is a critically endangered ecological community (CEEC) or an endangered ecological community (EEC)
(d) locating the project such that connectivity enabling movement of species and genetic material between areas of adjacent or nearby habitat is maintained.
8.1.1.4 In selecting a project location, the following should be addressed, as they apply to the project: (a) an analysis of alternative modes or technologies that would avoid or
minimise impacts on biodiversity values and justification for selecting the proposed mode or technology
(b) an analysis of alternative routes that would avoid or minimise impacts on biodiversity values and justification for selecting the proposed route
(c) an analysis of alternative locations that would avoid or minimise impacts on biodiversity values and justification for selecting the proposed location
(d) an analysis of alternative sites within a property on which the project is proposed that would avoid or minimise impacts on biodiversity values and justification for selecting the proposed site.
8.1.1.5 Justifications for project location decisions should identify any other site constraints that the proponent has considered in determining the location and design of the project, e.g. bushfire protection requirements including clearing for asset protection zones, flood planning levels, servicing constraints.
8.1.1.6 Actions taken to avoid and minimise impacts through locating the project, or selecting the land to be biodiversity certified must be documented and justified in the BDAR or BCAR.
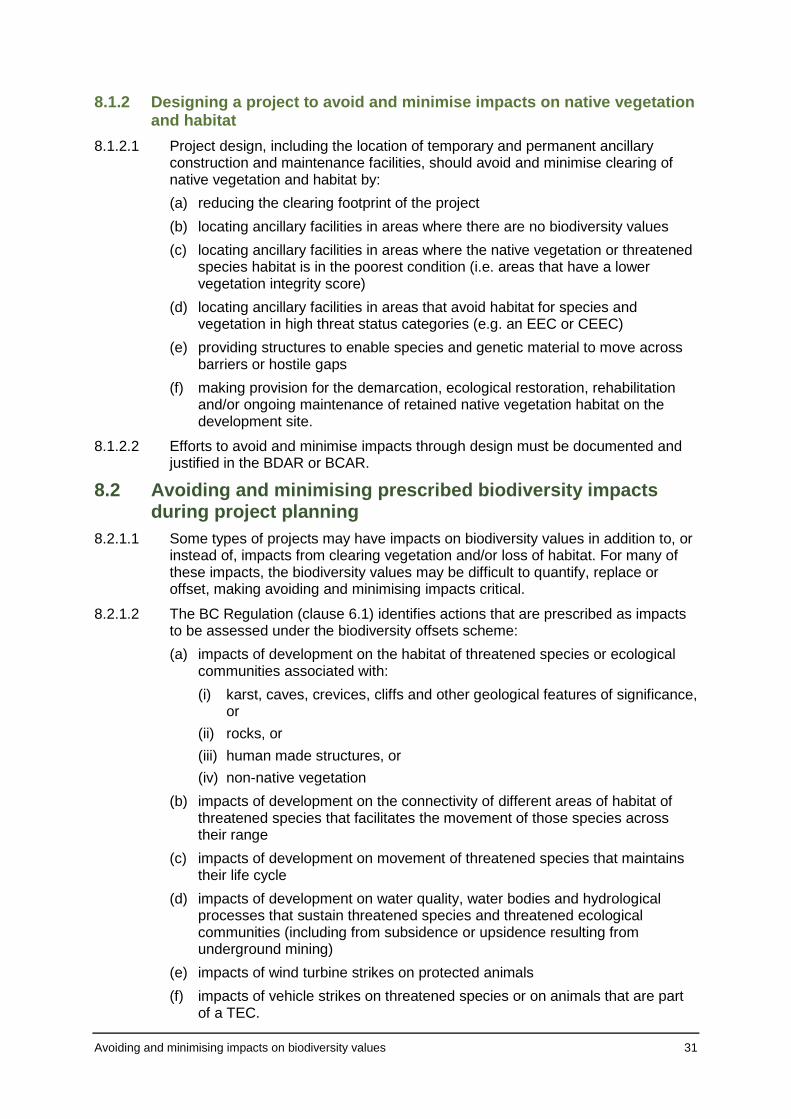
Avoiding and minimising impacts on biodiversity values 31
8.1.2 Designing a project to avoid and minimise impacts on native vegetation and habitat
8.1.2.1 Project design, including the location of temporary and permanent ancillary construction and maintenance facilities, should avoid and minimise clearing of native vegetation and habitat by: (a) reducing the clearing footprint of the project (b) locating ancillary facilities in areas where there are no biodiversity values (c) locating ancillary facilities in areas where the native vegetation or threatened
species habitat is in the poorest condition (i.e. areas that have a lower vegetation integrity score)
(d) locating ancillary facilities in areas that avoid habitat for species and vegetation in high threat status categories (e.g. an EEC or CEEC)
(e) providing structures to enable species and genetic material to move across barriers or hostile gaps
(f) making provision for the demarcation, ecological restoration, rehabilitation and/or ongoing maintenance of retained native vegetation habitat on the development site.
8.1.2.2 Efforts to avoid and minimise impacts through design must be documented and justified in the BDAR or BCAR.
8.2 Avoiding and minimising prescribed biodiversity impacts during project planning
8.2.1.1 Some types of projects may have impacts on biodiversity values in addition to, or instead of, impacts from clearing vegetation and/or loss of habitat. For many of these impacts, the biodiversity values may be difficult to quantify, replace or offset, making avoiding and minimising impacts critical.
8.2.1.2 The BC Regulation (clause 6.1) identifies actions that are prescribed as impacts to be assessed under the biodiversity offsets scheme: (a) impacts of development on the habitat of threatened species or ecological
communities associated with: (i) karst, caves, crevices, cliffs and other geological features of significance,
or (ii) rocks, or (iii) human made structures, or (iv) non-native vegetation
(b) impacts of development on the connectivity of different areas of habitat of threatened species that facilitates the movement of those species across their range
(c) impacts of development on movement of threatened species that maintains their life cycle
(d) impacts of development on water quality, water bodies and hydrological processes that sustain threatened species and threatened ecological communities (including from subsidence or upsidence resulting from underground mining)
(e) impacts of wind turbine strikes on protected animals (f) impacts of vehicle strikes on threatened species or on animals that are part
of a TEC.

32 Biodiversity Assessment Method
8.2.2 Locating a project to avoid and minimise prescribed biodiversity impacts
8.2.2.1 Prescribed biodiversity impacts can be avoided and minimised by: (a) locating the envelope of surface works to avoid direct impacts on the habitat
features identified in Paragraph 8.2.1.2 (b) locating the envelope of sub-surface works, both in the horizontal and
vertical plane, to avoid and minimise operations beneath the habitat features identified in Paragraph 8.2.1.2, e.g. locating longwall panels away from geological features of significance or water dependent plant communities and their supporting aquifers
(c) locating the project to avoid severing or interfering with corridors connecting different areas of habitat, migratory flight paths to important habitat or local movement pathways
(d) optimising project layout to minimise interactions with threatened species and ecological communities, e.g. designing turbine layout to allow buffers around features that attract and support aerial species, such as forest edges, riparian corridors and wetlands, ridgetops and gullies
(e) locating the project to avoid direct impacts on water bodies. 8.2.2.2 In selecting a project location, the following should be addressed, as they apply
to the project: (a) an analysis of alternative modes or technologies that would avoid or
minimise prescribed biodiversity impacts and justification for selecting the proposed mode or technology
(b) an analysis of alternative routes that would avoid or minimise prescribed biodiversity impacts and justification for selecting the proposed route
(c) an analysis of alternative locations that would avoid or minimise prescribed biodiversity impacts and justification for selecting the proposed location
(d) an analysis of alternative sites within a property on which the project is proposed that would avoid or minimise prescribed biodiversity impacts and justification for selecting the proposed site.
8.2.2.3 Justifications for project location decisions should identify any other site constraints that the proponent has considered in determining the location and design of the project, e.g. bushfire protection requirements including clearing for asset protection zones, flood planning levels, servicing constraints.
8.2.2.4 Efforts to avoid and minimise impacts through locating the project must be documented and justified in the BDAR or BCAR.
8.2.3 Designing a project to avoid and minimise prescribed biodiversity impacts
8.2.3.1 Prescribed biodiversity impacts can be avoided and minimised by: (a) engineering solutions, e.g. proven techniques to minimise fracturing of
bedrock underlying features of geological significance, water dependent communities and their supporting aquifers, proven engineering solutions to restore connectivity and favoured movement pathways
(b) design of project elements to minimise interactions with threatened and protected species and ecological communities, e.g. designing turbines to dissuade perching and minimise the diameter of the rotor swept area, designing fencing to prevent animal entry to transport corridors

Avoiding and minimising impacts on biodiversity values 33
(c) design of the project to maintain environmental processes critical to the formation and persistence of habitat features not associated with native vegetation
(d) design of the project to maintain hydrological processes that sustain threatened species and TECs
(e) design of the project to avoid and minimise downstream impacts on rivers, wetlands and estuaries by control of the quality of water released from the site.
8.2.3.2 Efforts to avoid and minimise impacts through design must be documented and justified in the BDAR or BCAR.

34 Biodiversity Assessment Method
9 Assessment of impacts
9.1 Assessing impacts on native vegetation and habitat 9.1.1.1 The assessor must determine the impacts on native vegetation and habitat in
accordance with Subsections 9.1.2, 9.1.3 and 9.1.4.
9.1.1.2 The BDAR or BCAR must assess the impacts of the project on native vegetation and habitat, including but not limited to: (a) describing impacts on clearing of native vegetation, threatened ecological
communities and threatened species habitat consistent with Chapter 1 and Chapter 10
(b) describing the nature, extent, frequency, duration and timing of indirect impacts of the proposal including but not limited to: (i) indirect impacts on adjacent vegetation and habitat during construction (ii) indirect impacts on adjacent vegetation and habitat during operation (iii) impacts on adjacent vegetation and habitat arising from a change in
land-use patterns (c) describing the nature, extent, frequency, duration and timing of prescribed
biodiversity impacts relevant to the proposal, including but not limited to: (i) prescribed biodiversity impacts during construction (ii) prescribed biodiversity impacts during operation (iii) predictions of prescribed biodiversity impacts where impacts are
uncertain (d) evaluating the consequences of indirect impacts on biodiversity values (e) evaluating the consequences of prescribed biodiversity impacts (f) documenting any limitations to data, assumptions and predictions with
respect to impacts on biodiversity.
9.1.1.3 For any species listed as potential species in the Guidance to assist a decision-maker to determine a serious and irreversible impact, the BDAR or BCAR will also need to include the additional information in accordance with Section 10.2.
9.1.2 Assessing the impact of clearing native vegetation, threatened ecological communities and threatened species habitat
9.1.2.1 Impacts from clearing native vegetation, threatened ecological communities and threatened species habitat on a development or clearing site, or land to be biodiversity certified, are determined by the assessor: (a) using information collected by the assessor in Stage 1 (b) based on the final boundary of the project taking into account the measures
taken to avoid and minimise impacts in accordance with Chapter 8, and (c) considering the spatial and temporal extent of the impact.
9.1.2.2 Taking into account the impact of the proposal, the assessor must estimate the future value of each: (a) growth form group used to assess composition and determine the
composition condition score in Appendix 6 (b) growth form group used to assess structure, and determine the structure
condition score in Appendix 6, and

Assessment of impacts 35
(c) attribute used to assess function and determine the function condition score in Appendix 6
for each vegetation zone on the development site, clearing site or land to be biodiversity certified.
9.1.2.3 The future value of the attributes may take into account impacts from partial clearing in a vegetation zone. The assessor must provide supporting information in the BAR that specifies how the future value of the attribute and vegetation integrity will be achieved and maintained.
9.1.2.4 Using the future value for each attribute, the assessor must use Equations 8–14 and Equations 17–18 in Appendix 6 to determine the future vegetation integrity score for each vegetation zone.
9.1.2.5 For proposals that will result in the total clearing of the site, the future value for each attribute must be 0.
9.1.2.6 The assessor is required to record in the BDAR or BCAR the number of hollow bearing trees in each vegetation zone that are directly impacted by the proposal, using the information collected from the plot survey in Paragraph 5.3.4.29.
9.1.3 Calculating the change in the vegetation integrity score for clearing of native vegetation, threatened ecological communities and threatened species habitat
9.1.3.1 The change (loss) in the vegetation integrity score is a measure of the direct impact on native vegetation and threatened species habitat. The assessor must calculate the change in vegetation integrity score for each vegetation zone or for a management zone using Equation 19 in Appendix 6.
9.1.3.2 The change (loss) in vegetation integrity is the difference between the current vegetation integrity score determined before the development takes place and the future vegetation integrity score determined by accounting for the impacts of development.
9.1.3.3 For threatened species assessed by area, the assessor must use change (loss) in the vegetation integrity score of each vegetation zone that is within the species polygon as a measure of the direct impact on the habitat condition for the species.
9.1.3.4 Where the species polygon contains an area of land that is not part of a vegetation zone, the assessor must not use a vegetation integrity score to determine the habitat condition of this area. For species assessed by area, the assessor must record the area of non-vegetation habitat features or habitat components such as exotic vegetation, caves, rock faces or bridges that are directly impacted by the proposal.
9.1.3.5 The assessor must measure the direct impact on individual flora defined by the species polygon in accordance with Step 5 in Section 6.4 using a count of the number of each flora species in the species polygon.
Note: The number of individual flora species directly cleared within a species polygon is later used in Subsection 11.2.4 to determine the offset requirement, or the number of credits created at a biodiversity stewardship site.
9.1.4 Assessing indirect impacts on native vegetation and habitat 9.1.4.1 Indirect impacts occur when the proposal or activities relating to the construction
or operation of the proposal affect native vegetation, threatened ecological communities and threatened species habitat beyond the subject site. Impacts may also result from changes to land-use patterns, such as an increase in

36 Biodiversity Assessment Method
vehicular access and human activity on native vegetation, threatened ecological communities and threatened species habitat.
9.1.4.2 The assessor must describe and assess the impacts of the proposal on native vegetation and habitat beyond the subject site, including but not limited to: (a) inadvertent impacts on adjacent habitat or vegetation (b) reduced viability of adjacent habitat due to edge effects (c) reduced viability of adjacent habitat due to noise, dust or light spill (d) transport of weeds and pathogens from the site to adjacent vegetation (e) increased risk of starvation, exposure and loss of shade or shelter (f) loss of breeding habitats (g) trampling of threatened flora species (h) inhibition of nitrogen fixation and increased soil salinity (i) fertiliser drift (j) rubbish dumping (k) wood collection (l) bush rock removal and disturbance (m) increase in predatory species populations (n) increase in pest animal populations (o) increased risk of fire (p) disturbance to specialist breeding and foraging habitat, e.g. beach nesting for
shorebirds.
9.1.4.3 The assessment of indirect impacts must: (a) describe the nature, extent and duration of short-term and long-term impacts (b) identify the threatened species, threatened ecological communities and
habitats likely to be affected (c) predict the consequences of the impacts for the bioregional persistence of
the threatened species, threatened ecological communities and their habitats.
9.2 Assessing prescribed biodiversity impacts 9.2.1.1 The assessment of the impacts of development on the habitat of threatened
species or ecological communities associated with karst, caves, crevices, cliffs and other features of geological significance must: (a) identify the species and ecological communities likely to use the habitat (b) describe, with reference to relevant literature and other reliable published
sources of information, the importance within the bioregion of the habitat to these species or ecological communities
(c) predict the nature, extent and duration of short and long-term geological impacts
(d) predict the nature, extent and duration of short and long-term impacts on environmental processes critical to the formation and persistence of the unique natural features of the area of karst, geological features of significance, and cliff fall

Assessment of impacts 37
(e) predict the consequences of impacts for the persistence of the suite of threatened species and communities likely to use these areas as habitat, with reference to relevant literature and other published sources of information
(f) justify the predictions of impacts with appropriate modelling and with reference to relevant literature and guidelines.
9.2.1.2 The assessment of the impacts of development on the habitat of threatened species or ecological communities associated with rocks must: (a) identify the species and ecological communities likely to use the habitat (b) describe, with reference to relevant literature and other reliable published
sources of information, the importance of scattered rock for connectivity and refuge
(c) predict the nature, extent and duration of short and long-term impacts due to rock removal
(d) predict the consequences of the impacts for the local and bioregional persistence of the suite of threatened species and communities likely to use these areas as habitat, with reference to relevant literature and other published sources of information.
9.2.1.3 The assessment of the impacts of development on the habitat of threatened species or ecological communities associated with human made structures must: (a) identify the human made structures with potential to be habitat for threatened
species or ecological communities (b) identify the species and ecological communities likely to use the habitat (c) describe the nature, extent and duration of short and long-term impacts (d) describe, with reference to relevant literature and other reliable published
sources of information, the importance within the bioregion of the habitat to these species or ecological communities
(e) predict the consequences of the impacts for the local and bioregional persistence of the suite of threatened species and communities likely to use these areas as habitat, with reference to relevant literature and other published sources of information.
9.2.1.4 The assessment of the impacts of development on the habitat of threatened species or ecological communities associated with non-native vegetation must: (a) identify the species and ecological communities likely to use the habitat (b) describe the nature, extent and duration of short and long-term impacts (c) describe, with reference to relevant literature and other reliable published
sources of information, the importance within the bioregion of the habitat to these species or ecological communities
(d) predict the consequences of the impacts for the local and bioregional persistence of the suite of threatened species and communities likely to use these areas as habitat, with reference to relevant literature and other published sources of information.
9.2.1.5 The assessment of the impacts of development on the connectivity of different areas of habitat of threatened species that facilitates the movement of those species across their range must:

38 Biodiversity Assessment Method
(a) identify the area/s of connectivity joining different areas of habitat that intersect with the subject land and the areas of habitat that are connected according to Paragraph 4.2.1.3
(b) identify the species and ecological communities likely to benefit from the connectivity
(c) describe the nature, extent and duration of short and long-term impacts (d) describe, with reference to relevant literature and other reliable published
sources of information, the importance of the area of connectivity within the bioregion
(e) predict the consequences of the impacts for the bioregional persistence of the suite of threatened species and communities currently benefitting from the connectivity with reference to relevant literature and other published sources of information and taking into consideration mobility, abundance, range and other relevant life history factors.
9.2.1.6 The assessment of the impacts of the development on movement of threatened species that maintains their life cycle must: (a) identify movement patterns key to the life cycle of relevant threatened
species that intersect with the subject land (b) describe the nature, extent and duration of short and long-term impacts (c) describe, with reference to relevant literature and other reliable published
sources of information, the importance of the movement of the threatened species to their life cycle
(d) predict the consequences of the impacts for the bioregional persistence of the threatened species, with reference to relevant literature and other published sources of information.
9.2.1.7 The assessment of the impacts of development on water quality, water bodies and hydrological processes that sustain threatened species and threatened ecological communities (including subsidence or upsidence resulting from underground mining or other development) must: (a) identify water bodies with potential to be habitat for threatened species or
threatened ecological communities that are likely to be impacted by the proposal
(b) identify the threatened species and threatened ecological communities likely to use the habitat
(c) identify hydrological processes that sustain threatened species or threatened ecological communities and the species and communities that are dependent on them
(d) describe, with reference to relevant literature and other reliable published sources of information, the importance within the bioregion of the water body or hydrological process to these species or ecological communities
(e) describe the nature, extent and duration of known short and long-term impacts on water bodies and hydrological processes
(f) describe the nature, extent and duration of short and long-term impacts on water quality
(g) predict the consequences of the impacts for the bioregional persistence of the suite of threatened species and communities likely to use these areas as habitat, with reference to relevant literature and other published sources of information

Assessment of impacts 39
(h) predict the nature, extent and duration of short and long-term impacts on the habitat and life cycle of species using the natural features of any water dependent plant community
(i) justify predictions of impact on any water dependent plant communities, with appropriate modelling and with reference to relevant literature and other published sources of information
(j) predict the cumulative impacts of the project together with existing mining operations mining underneath the same water dependent plant communities
(k) based on predictions of impacts on water dependant plant communities and the species they support, calculate the maximum predicted offset liability in accordance with the Upland Swamp Policy
(l) justify any prediction of ‘nil’ or ‘negligible’ environmental consequences for any impact on water dependent plant communities and the species they support.
9.2.1.8 The assessment of the impacts of wind turbine strikes on protected animals must: (a) predict the likelihood of impact on aerial species resident in, or likely to fly
over, the project area including but not limited to bat/bird strike and barotrauma
(b) predict the rate of impact per turbine per year for species likely to be affected (c) justify predictions of likelihood of impact and rates of impact, with reference
to relevant literature and other published sources of information (d) predict the consequences of impacts for the persistence of bioregional
populations, with reference to relevant literature and other published sources of information
(e) predict the cumulative impacts of the project together with existing wind farms on aerial species mortality and provide justification for these predictions
(f) predict and map the likely zone of disturbance around wind turbines for aerial species resident in, or likely to fly over, the project area, with reference to relevant literature and other published sources of information
(g) map significant landscape and habitat features within the zone of disturbance for species likely to be affected, including but not limited to hollow bearing trees and important habitat for migratory species
(h) predict the likelihood and describe the nature of indirect impacts on aerial species resident in, or likely to fly over, the project area including but not limited to barriers to migratory pathways and breeding, feeding and resting resources
(i) for migratory species, predict the impact of avoidance behaviour relative to migration distances and the availability of suitable habitat for breeding, feeding and resting over the migration route, with reference to relevant literature and other sources of published information
(j) justify predictions of likelihood and nature of impact, with reference to relevant literature and other published sources of information
(k) predict the cumulative impacts of the project together with existing wind farms with respect to movement patterns and use of adjacent habitat and provide justification for these predictions.
9.2.1.9 The assessment of the impacts of vehicle strikes on threatened species of animals or on animals that are part of a TEC must:

40 Biodiversity Assessment Method
(a) identify the range of threatened animal species or animals that are part of a TEC at risk of vehicle (or other transport mode) strike
(b) predict the likelihood of vehicle strike to each relevant species, taking into consideration mobility, abundance, range and other relevant life history factors
(c) estimate vehicle strike rates where supporting data or literature is available (d) predict the consequences of the impacts for the local and bioregional
persistence of the suite of relevant species, with reference to relevant literature and other published sources of information.
9.3 Mitigating and managing impacts on biodiversity values 9.3.1.1 The proponent must identify measures to mitigate or manage impacts in
accordance with the guidelines for mitigating and managing impacts on biodiversity values at Subsection 9.3.2 and Subsection9.3.3.
9.3.1.2 The BDAR or BCAR must: (a) document mitigation measures proposed to manage impacts, including
proposed techniques, timing, frequency and responsibility for implementing each measure
(b) identify any measures for which there is risk of failure (c) evaluate the risk and consequence of any residual impacts likely to remain
after mitigation measures are applied (d) document any adaptive management strategy proposed, including:
i. any baseline data against which monitoring will occur ii. any seasonal changes to the resource or relevant to the impacts
being monitored iii. monitoring methods, including frequency, timing and reporting iv. trigger values for the commencement of adaptive management
actions v. adaptive management actions proposed to reduce or eliminate the
impact vi. information that will be necessary to measure the impact over time. It
should also consider how the results of the monitoring program could be used to inform ongoing operations in order to reduce the extent of indirect impacts.
9.3.2 Mitigating impacts on native vegetation and habitat 9.3.2.1 The removal of vegetation and habitat, including habitat features not associated
with native vegetation from within the project footprint is likely to result in the displacement of resident fauna. Impacts related to the displacement of resident fauna occur in both the construction and operation phases, including but not limited to: (a) removal of hollow bearing trees and other habitat features during
construction (b) injury or death during construction (c) disruption to established home range (d) disruption to connections between suitable habitat for foraging and dispersal.

Assessment of impacts 41
9.3.2.2 Measures for mitigating impacts related to the displacement of resident fauna include but are not limited to: (a) timing works to avoid critical life cycle events such as breeding or nursing (b) instigating clearing protocols including pre-clearing surveys, daily surveys
and staged clearing, the presence of a trained ecological or licensed wildlife handler during clearing events
(c) relocation of habitat features (fallen timber, hollow logs) from within the development site.
9.3.2.3 Measures for mitigating indirect impacts on native vegetation and habitat may include but are not limited to: (a) clearing protocols that identify vegetation to be retained, prevent inadvertent
damage and reduce soil disturbance; for example, removal of native vegetation by chainsaw, rather than heavy machinery, is preferable in situations where partial clearing is proposed
(b) noise barriers or daily/seasonal timing of construction and operational activities to reduce impacts of noise
(c) light shields or daily/seasonal timing of construction and operational activities to reduce impacts of light spill
(d) adaptive dust monitoring programs to control air quality (e) programming construction activities to avoid impacts; for example, timing
construction activities for when migratory species are absent from the site, or when particular species known to or likely to use the habitat on the site are not breeding or nesting
(f) temporary fencing to protect significant environmental features such as riparian zones
(g) hygiene protocols to prevent the spread of weeds or pathogens between infected areas and uninfected areas
(h) staff training and site briefing to communicate environmental features to be protected and measures to be implemented
(i) preparation of a vegetation management plan to regulate activity in vegetation and habitat adjacent to residential development. The vegetation management plan may include controls on pet ownership, rubbish disposal, wood collection, fire management and disturbance to nests and other niche habitats
(j) making provision for the ecological restoration, rehabilitation and/or ongoing maintenance of retained native vegetation habitat on or adjacent to the development site.
9.3.2.4 In determining and justifying whether application of a particular measure is reasonable, the proponent may take into account: (a) industry best practice and standards (b) the proportion of the total cost of the development that is dedicated to
biodiversity protection (c) the risk of failure of the measure.
9.3.3 Mitigating prescribed biodiversity impacts 9.3.3.1 Measures for mitigating prescribed biodiversity impacts may include but are not
limited to:

42 Biodiversity Assessment Method
(a) programming construction activities to avoid critical life cycle events; for example, timing construction activities for when migratory species are absent from the site, or when particular species known to or likely to use the habitat on the site are not breeding or nesting for impacts on karst/caves, human made structures and water bodies
(b) instigating clearing protocols including pre-clearing surveys, daily surveys and staged clearing, the presence of a trained ecological or licensed wildlife handler during clearing events for rocks, human made structures and non-native vegetation
(c) retention of habitat features (fallen timber, hollow logs, rocks) within the development site, or the relocation of habitat features such as stags, hollow logs or rocks from the development site onto adjacent retained remnant vegetation to provide habitat
(d) installing artificial connectivity measures to re-establish connections between habitat and favoured movement pathways, e.g. glider poles, rope crossings, habitat bridges
(e) temporary fencing to protect significant environmental features such as karst/caves, rocks and water bodies
(f) replacing habitat in human made structures and non-native vegetation with artificial habitat
(g) sediment barriers or sedimentation ponds to control the quality of water released from the site into the receiving environment
(h) staff training and site briefing to communicate environmental features to be protected and measures to be implemented
(i) development control measures to regulate activity in vegetation and habitat adjacent to residential development including regulation of bush rock collection
(j) making provision for the ecological restoration, rehabilitation and/or ongoing maintenance of retained native vegetation habitat on or adjacent to the development site
(k) fencing or other measures to control animal and vehicle interactions.
9.3.3.2 In determining and justifying whether application of a particular measure is reasonable, the proponent may take into account: (a) industry best practice and standards (b) the proportion of the total cost of the development that is dedicated to
biodiversity protection (c) the risk of failure of the measure.
9.4 Adaptive management for uncertain impacts 9.4.1.1 For impacts that are infrequent or difficult to measure prior to commencement, a
monitoring program can be used to measure and respond to these impacts during construction and operation.
9.4.1.2 For these impacts, the proponent must develop an adaptive management strategy in accordance with the guidelines for adaptive management for impacts on biodiversity values that are uncertain at Subsection 9.4.2.

Assessment of impacts 43
9.4.2 Guidelines for adaptive management for impacts on biodiversity that are uncertain
9.4.2.1 An adaptive management plan for impacts related to damage to karst, caves, crevices, cliffs and other geological features of significance should include details of: (a) measures to monitor predicted indirect impacts (b) potential adaptive management actions (c) thresholds for failure of areas of karst, caves, crevices, cliffs and other
geological features of significance, including justification for which of these will trigger adaptive management actions
(d) any other measures proposed to mitigate potential impacts. 9.4.2.2 An adaptive management plan for impacts related to subsidence and upsidence
resulting from underground mining should include details of: (a) measures to secure offsets proposed to fulfil the maximum predicted offset
liability, in accordance with the Upland Swamp Policy (b) a strategy for monitoring changes to groundwater and secondary
environmental consequences in accordance with the Upland Swamp Policy (c) a strategy for delivery of offsets commensurate with monitoring results in
accordance with the Upland Swamp Policy (d) any other measures proposed to mitigate potential impacts.
9.4.2.3 An adaptive management plan for impacts related to wind turbine strikes should include details of: (a) measures to monitor predicted impacts (b) thresholds for species mortality, based on relevant literature, which will
trigger adaptive management actions (c) measures to monitor predicted indirect impacts and nominate corresponding
thresholds, based on relevant literature, which will trigger adaptive management actions
(d) any other measures proposed to mitigate potential impacts. 9.4.2.4 An adaptive management plan for impacts related to vehicle strikes should
include details of: (a) measures to monitor predicted impacts (b) thresholds for species mortality, based on relevant literature, which will
trigger adaptive management actions (c) any other measures proposed to mitigate potential impacts.
9.4.2.5 The BDAR/BCAR must outline the adaptive management strategy proposed for minimising impacts that are uncertain.

44 Biodiversity Assessment Method
10 Thresholds for the assessment and offsetting of impacts of development
10.1.1.1 The assessment of site context, native vegetation, threatened ecological communities and the assessment of habitat suitability for threatened species in Stage 1, and the demonstration of avoidance and minimisation in Chapter 8, will have informed the final site for the proposed development, clearing or biodiversity certification.
10.1.1.2 This section sets out the impact thresholds that the assessor must apply including: (a) impacts on a potential entity that are serious and irreversible impacts (b) impacts for which the assessor is required to determine an offset
requirement (c) impacts for which the assessor is not required to determine an offset
requirement (d) impacts that do not require further assessment by the assessor.
10.2 Impact assessment of potential entities of serious and irreversible impacts on biodiversity values
10.2.1.1 The determination of serious and irreversible impacts on biodiversity values is to be made by the consent authority in accordance with the principles set out in the BC Regulation.
10.2.1.2 To assist the consent authority, the guidance document Guidance to assist a decision-maker to determine a serious and irreversible impact includes criteria that enable the application of the four principles set out in clause 6.7 of the BC Regulation to identify the species and ecological communities that are likely to be the subject of serious and irreversible impacts. These species and ecological communities are listed in the guideline and are referred to as ‘potential SAII entities’.
10.2.1.3 The assessor must identify every potential SAII entity that is listed in the Guidance to assist a decision-maker to determine a serious and irreversible impact that would be impacted on by the proposed development, activity, clearing proposal or proposed application for biodiversity certification.
10.2.1.4 The assessor must identify any other entity impacted on by the proposed development, activity, clearing proposal or proposed application for biodiversity certification with potential to become a serious and irreversible impact in accordance with the four principles in the BC Regulation.
10.2.1.5 A consent authority may require an assessor to include an assessment of potential serious and irreversible impacts on other threatened entities not listed in the Guidance to assist a decision-maker to determine a serious and irreversible impact as part of a development application, clearing or biodiversity certification proposal.
10.2.1.6 To assist the consent authority to evaluate the nature of an impact on a potential entity at risk of a serious and irreversible impact, the BDAR or BCAR must contain details of the assessment of serious and irreversible impacts, in accordance with the assessment criteria set out in Subsection 10.2.2 for impacts on each potential TEC and in Subsection 10.2.3 for impacts on each potential threatened species.

Thresholds for the assessment and offsetting of impacts of development 45
10.2.2 Additional impact assessment provisions for ecological communities 10.2.2.1 The assessor is required to provide the following further information in the BDAR
or BCAR about potential ecological communities: (a) the action and measures taken to avoid the direct and indirect impact on the
potential entity for an SAII (b) the area (ha) and condition of the TEC to be impacted directly and indirectly
by the proposed development. The condition of the TEC is to be represented by the vegetation integrity score for each vegetation zone
(c) a description of the extent to which the impact exceeds the threshold for the potential entity that is specified in the Guidance to assist a decision-maker to determine a serious and irreversible impact
(d) the extent and overall condition of the potential TEC within an area of 1000ha, and then 10,000ha, surrounding the proposed development footprint
(e) an estimate of the extant area and overall condition of the potential TEC remaining in the IBRA subregion before and after the impact of the proposed development has been taken into consideration
(f) an estimate of the area of the potential TEC that is in the reserve system within the IBRA region and the IBRA subregion
(g) the development, clearing or biodiversity certification proposal’s impact on: (i) abiotic factors critical to the long-term survival of the potential TEC; for
example, how much the impact will lead to a reduction of groundwater levels or the substantial alteration of surface water patterns
(ii) characteristic and functionally important species through impacts such as, but not limited to, inappropriate fire/flooding regimes, removal of understorey species or harvesting of plants
(iii) the quality and integrity of an occurrence of the potential TEC through threats and indirect impacts including, but not limited to, assisting invasive flora and fauna species to become established or causing regular mobilisation of fertilisers, herbicides or other chemicals or pollutants which may harm or inhibit growth of species in the potential TEC
(h) direct or indirect fragmentation and isolation of an important area of the potential TEC
(i) the measures proposed to contribute to the recovery of the potential TEC in the IBRA subregion.
10.2.3 Additional impact assessment provisions for threatened species or populations
10.2.3.1 The assessor is required to provide the following further information in the BDAR: (a) the action and measures taken to avoid the direct and indirect impact on the
potential entity for an SAII (b) the size of the local population directly and indirectly impacted by the
development, clearing or biodiversity certification (c) the extent to which the impact exceeds any threshold for the potential entity
that is specified in the Guidance to assist a decision-maker to determine a serious and irreversible impact

46 Biodiversity Assessment Method
(d) the likely impact (including direct and indirect impacts) that the development, clearing or biodiversity certification will have on the habitat of the local population, including but not limited to: (i) an estimate of the change in habitat available to the local population as
a result of the proposed development (ii) the proposed loss, modification, destruction or isolation of the available
habitat used by the local population, and (iii) modification of habitat required for the maintenance of processes
important to the species’ life cycle (such as in the case of a plant – pollination, seed set, seed dispersal, germination), genetic diversity and long-term evolutionary development.
BioNet Atlas records or other documented, quantifiable means must be used by the assessor to estimate what percentage of the species’ population and habitat is likely to be lost in the long term within the IBRA subregion due to the direct and indirect impacts of the development
(e) the likely impact on the ecology of the local population. At a minimum, address the following: (i) for fauna:
– breeding – foraging – roosting, and – dispersal or movement pathways
(ii) for flora, address how the proposal is likely to affect the ecology and biology of any residual plant population that will remain post development including where information is available:
– pollination cycle – seedbanks – recruitment, and – interactions with other species (e.g. pollinators, host species,
mycorrhizal associations) (f) a description of the extent to which the local population will become
fragmented or isolated as a result of the proposed development (g) the relationship of the local population to other population/populations of the
species. This must include consideration of the interaction and importance of the local population to other population/populations for factors such as breeding, dispersal and genetic viability/diversity, and whether the local population is at the limit of the species’ range
(h) the extent to which the proposed development will lead to an increase in threats and indirect impacts, including impacts from invasive flora and fauna, that may in turn lead to a decrease in the viability of the local population
(i) an estimate of the area, or number of populations and size of populations that is in the reserve system in NSW, the IBRA region and the IBRA subregion
(j) the measure/s proposed to contribute to the recovery of the species in the IBRA subregion.

Thresholds for the assessment and offsetting of impacts of development 47
10.3 Impacts for which the assessor is required to determine an offset requirement
10.3.1 Impacts on native vegetation (ecosystem credits) 10.3.1.1 The assessor is required to determine an offset for all impacts of development or
impacts from the conferral of biodiversity certification on PCTs that are associated with: (a) a vegetation zone that has a vegetation integrity score ≥15 where the PCT is
representative of an endangered or critically endangered ecological community, or
(b) a vegetation zone that has a vegetation integrity score of ≥17 where the PCT is associated with threatened species habitat (as represented by ecosystem credits), or is representative of a vulnerable ecological community, or
(c) a vegetation zone that has a vegetation integrity score ≥20 where the PCT is not representative of a TEC or associated with threatened species habitat.
10.3.1.2 The offset requirement for impacts on native vegetation is determined in accordance with Chapter 11.
10.3.1.3 An offset is not required for impacts on native vegetation where the vegetation integrity score is below those set out in Paragraph 10.3.1.1.
10.3.2 Impacts on threatened species 10.3.2.1 The assessor is required to determine an offset for the impacts of development,
clearing or impacts from the conferral of biodiversity certification on the habitat of threatened species assessed for ecosystem credits and associated with a PCT in a vegetation zone with a vegetation integrity score ≥17.
10.3.2.2 An offset is not required for impacts on threatened species habitat where the vegetation integrity score is below that set out in Paragraph10.3.2.1.
10.3.2.3 The assessor is required to determine an offset for the potential threatened species impacted by the development, clearing or the conferral of biodiversity certification that require species credits, identified at Step 5 in Section 6.4.
10.3.2.4 The offset requirement for impacts on threatened species and threatened species habitat is determined in accordance with Chapter 11.
10.4 Impacts that do not require further assessment by the assessor
10.4.1.1 An assessor is not required to assess areas of land on the development site or land proposed for biodiversity certification for ecosystem credits without native vegetation under Chapter 4 or Chapter 5.
Note: Areas of land that do not contain native vegetation must still be assessed for threatened species, in accordance with Chapter 6.

48 Biodiversity Assessment Method
11 Application of the no net loss standard 11.1.1.1 The BAM establishes the circumstances where offsetting the impacts of
development, clearing or biodiversity certification will result in no net loss of biodiversity. This includes circumstances where the impacts of development, clearing or biodiversity certification on biodiversity values are offset by improvements in vegetation/habitat condition based on management actions which create biodiversity credits at a biodiversity stewardship site.
11.1.1.2 The baseline used for when the BAM will result in no net loss accounts for the expected annual decline in biodiversity values without management. The rate of the annual decline used in the BAM is set out Table 8. Biodiversity credits created at a biodiversity stewardship site include this averted loss in the calculation of gain that is predicted through undertaking the required management actions.
11.1.1.3 The BAM sets a standard that will result in no net loss of biodiversity values in New South Wales where the impacts on biodiversity values from a development, clearing or biodiversity certification proposal: (a) are avoided, minimised and mitigated through reasonable measures in
accordance with Chapter 8, and (b) all residual direct impacts on biodiversity values from clearing native
vegetation and habitat loss are offset by: (i) the retirement of the required number of biodiversity credits determined
at Section 11.2, with a class of credit identified in Section 11.3 that meets the like for like rules in accordance with clause 6.3 of the BC Regulation, or
(ii) in the case of a development or clearing proposal, undertaking biodiversity conservation actions that qualify as biodiversity conservation measures under the offset rules and listed in the ancillary rules, and the action is for the benefit of the entity impacted by the proposal.
11.2 Calculating the offset requirement 11.2.1.1 A biodiversity offset requirement for residual impacts of a proposed development,
clearing or biodiversity certification proposal must be calculated in accordance with Section 11.2 and Section 11.3.
11.2.1.2 To determine the offset requirement for residual impacts of development, clearing or conferral of biodiversity certification on a threatened species or community, the following information from the Threatened Biodiversity Data Collection is used: (a) the sensitivity to loss (threat status) for TECs and PCTs and threatened
species (b) the sensitivity to gain value for threatened species (c) biodiversity risk weighting for the entity or the habitat component of the entity
being impacted on by the development or conferral of biodiversity certification.
11.2.1.3 Species for which biodiversity conservation actions are preferred as an offset measure instead of, or in combination with the retirement of species credits for a threatened species, are listed in the ancillary rules.

Application of the no net loss standard 49
11.2.2 Ecosystem credits and species credits 11.2.2.1 Impacts of development, clearing or biodiversity certification referred to in Section
10.3 are measured in biodiversity credits.
11.2.2.2 There are two broad credit class categories – ecosystem credits and species credits. Each credit within each class category is assigned attributes in accordance with Section 11.3 to help determine whether a particular credit within a class is ‘like’ or equal to another credit in the same class for the purpose of applying the like for like rules and variation rules in the BC Regulation. A class of credits is formed where the biodiversity credit shares the same attributes as set out in Section 11.3.
11.2.2.3 Ecosystem credits and species credits will be used to measure the residual impact on biodiversity values following all reasonable measures to avoid and minimise the impacts of the development in accordance with Chapter 8, and to mitigate the impact in accordance with Chapter 1. Ecosystem credits measure the offset requirement for impacts on TECs, threatened species habitat for species that can be reliably predicted to occur with a PCT and other PCTs generally. Species credits measure the offset requirement for impacts on individual threatened species or their area of habitat. Ecosystem credits and species credits are together referred to as ‘biodiversity credits’.
11.2.2.4 Biodiversity credits are used to measure the residual impact on biodiversity values to determine the offset requirement. The offset requirement must be documented in the BDAR or BCAR as outlined in Appendix 10.
11.2.2.5 The offset requirement for any impacts from a major project that has a serious and irreversible impact on threatened species and/or communities that are assessed under Subsections 10.2.2 and 10.2.3 may be calculated according to Subsections 11.2.3 and 11.2.4. If the project is approved, the consent authority may also impose additional offset requirements for these impacts.
11.2.2.6 The assessor must use the Credit Calculator to determine the number of ecosystem credits and species credits required for the proposal.
11.2.3 Calculating the required number of ecosystem credits for the direct impact on vegetation that is a TEC, threatened species habitat, or a PCT generally
11.2.3.1 The direct impact of a development, clearing or certification on vegetation in each vegetation zone that: (a) the assessor has identified as a TEC under Chapter 5, or (b) contains suitable habitat for a threatened species that is predicted to use the
site at Step 2 in Section 6.4, or (c) contains any other PCT generally
must be measured using ecosystem credits.
11.2.3.2 The biodiversity risk weighting for a TEC or a PCT containing threatened species habitat is based on the sensitivity to loss class of the TEC/PCT and the highest sensitivity to gain class of the predicted threatened species.
11.2.3.3 The highest sensitivity to gain class is derived from the suite of threatened species predicted to use the site as suitable habitat determined at Step 2 in Section 6.4.
11.2.3.4 The assessor must calculate those ecosystem credits using the Credit Calculator in accordance with Equation 1.

50 Biodiversity Assessment Method
Equation 1: Determine the number of ecosystem credits required for the impact on vegetation that is a TEC or contains threatened species habitat
n
= Σ (∆VI Loss×𝐵𝐵𝐵𝐵𝐵𝐵 𝑥𝑥 𝑎𝑎𝑎𝑎𝑎𝑎𝑎𝑎) 𝑥𝑥 0.25 i = 1 where: i = the ith vegetation zone impacted by development at the development site, or on land to be biodiversity certified ∆VI Loss = the change (loss) in the vegetation integrity score of a vegetation zone at the development site as determined by Equation 19 BRW = means the biodiversity risk weighting applied to the vegetation zone. The biodiversity risk weighting for a TEC or a PCT containing threatened species habitat is based on the sensitivity to loss class of the TEC/PCT and the highest sensitivity to gain class of the predicted threatened species. For a PCT or TEC not associated with threatened species habitat, the sensitivity to loss class for the PCT or TEC is used with the low sensitivity gain class area = the area in hectares of the vegetation zone
11.2.3.5 The assessor must record the required number of ecosystem credits for each PCT/TEC in the BDAR or BCAR.
11.2.3.6 Where the total number of credits calculated for a vegetation zone by the assessor is not a whole number, the assessor is to round it to the nearest whole number using conventional rounding rules, except if the number being rounded is less than one, in which case the number of credits is rounded to one.
11.2.3.7 The assessor must use the Credit Calculator to obtain a biodiversity credit report setting out the number and class of ecosystem credits which measure the direct impact of the development or clearing on the biodiversity values of the site, or the impact of the conferral of biodiversity certification.
11.2.4 Calculating the required species credits for direct impacts on threatened species
11.2.4.1 The direct impact of the development or certification on the species credit species determined to be present on the development site or land to be biodiversity certified under Chapter 6 must be measured using species credits.
11.2.4.2 For fauna species, the assessor must calculate the number of species credits using Equation 2, according to the area of suitable habitat identified by the species polygon as prepared at Step 5 in Section 6.4.
11.2.4.3 For flora species that are assessed by area, the assessor must calculate those species credits using the Credit Calculator in accordance with Equation 2, by applying the area of suitable habitat identified by the species polygon as prepared at Step 5 in Section 6.4.
Equation 2: Determine the number of fauna species credits or flora species credits required for the impact of development, clearing or certification
Number of fauna or flora species credits required = HCi×HLi×BRWi×0.25 where: HCi = the condition of fauna or flora habitat in the ith species polygon summed across the area of each vegetation zone within the species polygon HiL = the area of habitat determined using the ith species polygon for the development site or biodiversity certification proposal, prepared in accordance with Paragraph 6.4.1.33
Ecosystem credits required for each vegetation zone

Application of the no net loss standard 51
BRWi = the biodiversity risk weighting for the ith species as set out in the Threatened Biodiversity Data Collection. 11.2.4.4 For flora species that are assessed by number of individuals the assessor must
calculate those species credits using Equation 3, according to the number of individuals in the species polygon as prepared at Step 5 in Section 6.4.
Equation 3: Determine the required number of flora species credits for the impact of development, clearing or certification
Number of flora species credits required = HL x BRW where: HL = the number of individuals determined using the species polygon for the development site or land proposed for biodiversity certification, prepared in accordance with Paragraph 6.4.1.33
BRW = the biodiversity risk weighting for the threatened species as set out in the Threatened Biodiversity Data Collection
11.2.4.5 Where the required number of species credits calculated by the assessor is not a whole number, the assessor is to round it to the nearest whole number using conventional rounding rules, except if the number being rounded is less than one, in which case the number of credits is rounded to one.
11.2.4.6 The assessor must record the number of required species credits for each threatened species in the BDAR or BCAR.
11.2.4.7 The assessor must use the Credit Calculator to obtain a biodiversity credit report setting out the number and class of species credits which measure the impact of the development or certification on species credit species.
11.3 Identifying the credit class for ecosystem credits and species credits
11.3.1.1 A class of credits is formed where the biodiversity credit shares the same attributes. For ecosystem credits, the attributes are as follows: (a) name of the PCT impacted by development, clearing or conferral of
biodiversity certification (b) name of any CEEC or EEC or vulnerable ecological community (VEC)
associated with the PCT identified in (a) (c) name of the offset trading group for the PCT or TEC as identified in Table 5 (d) vegetation class of the PCT identified in (a) (e) vegetation formation of the PCT identified in (a) (f) presence or absence of hollow bearing trees (g) IBRA subregion in which the development, clearing or biodiversity
certification occurs. 11.3.1.2 The credit class for credits within the ecosystem credit category is created for
each PCT at the development site, clearing site or on the land to be certified. A different credit class may be identified for the same PCT where there is a variation in attributes (b), (e) or (g) at the development or clearing site, or on land to be certified.
11.3.1.3 PCTs that are associated with the same ecological community according to attribute (b) will require field verification at the biodiversity stewardship site to confirm that the PCT is part of the ecological community.

52 Biodiversity Assessment Method
11.3.1.4 For species credits, name of the threatened species being impacted at the development site, clearing site or land to be certified is the only attribute that needs to be shared in order to be in the same class of credits.
Table 5: Offset trading group tiers for ecosystem credits
Threat status group Offset trading group tiers for ecosystem credits
Very high threat status
Tier 1: Name of the critically endangered ecological community
Tier 2: PCTs in the same vegetation class with a percent cleared value ≥90% (being the name of the vegetation class – percent cleared value ≥90%)
High threat status
Tier 3: Name of the endangered ecological community
Tier 4: PCTs in the same vegetation class with a percent cleared value ≥70% and <90% (being the name of the vegetation class – percent cleared value ≥70% and <90%)
Moderate threat status
Tier 5: Name of the vulnerable ecological community
Tier 6: PCTs in the same vegetation class with a percent cleared value ≥50% and <70% (being the name of the vegetation class – percent cleared value ≥50% and <70%)
Low threat status Tier 7: PCTs in the same vegetation class with a percent cleared value <50% (being the name of the vegetation class – percent cleared value <50%)
11.4 Offset rules for biodiversity values 11.4.1.1 The offset rules are established at clause 6.2 of the BC Regulation. The ancillary
rules are published for the purpose of interpreting and applying the like for like and variation offset rules as required in clause 6.3 of the BC Regulation.

Introduction to Stage 3 53
Stage 3 – Improving biodiversity values 12 Introduction to Stage 3
12.1 Documenting Stage 3 outcomes 12.1.1.1 For the purposes of an application for a biodiversity stewardship agreement, the
improvement in biodiversity values on a biodiversity stewardship site determined through Stage 3 is combined with the outcomes of Stage 1 and documented in the Biodiversity Stewardship Site Assessment Report (BSSAR). The BSSAR must be prepared by an assessor and it must contain the matters identified in Appendix 11.
Sections within Stage 3 13 Calculating gain in biodiversity values at a biodiversity stewardship site ....................... 54
13.1 Assessing gain in biodiversity values at the biodiversity stewardship site ............ 54 13.2 Preparation of a management plan for the biodiversity stewardship site .............. 54 13.3 Management actions that improve biodiversity values ......................................... 55 13.4 Calculating the change (gain) in vegetation integrity score at a biodiversity
stewardship site ................................................................................................... 59 13.5 Estimating the future value of vegetation integrity attributes without
management ....................................................................................................... 59 13.6 Estimating the future value of vegetation integrity attributes with management ... 61 13.7 Calculating the security benefit score at a biodiversity stewardship site ............... 62 13.8 Calculating the number of ecosystem credits created at a biodiversity
stewardship site ................................................................................................... 63 13.9 Calculating the number of species credits created at a biodiversity stewardship
site ...................................................................................................................... 63 13.10 Identifying the credit class for biodiversity credits created at a biodiversity
stewardship site ................................................................................................... 64 13.11 Existing obligations and management actions ..................................................... 64

54 Biodiversity Assessment Method
13 Calculating gain in biodiversity values at a biodiversity stewardship site
13.1 Assessing gain in biodiversity values at the biodiversity stewardship site
13.1.1.1 The assessor must undertake an assessment of the gain in biodiversity values of the proposed biodiversity stewardship site by first assessing the: (a) site context of the biodiversity stewardship site in accordance with Chapter 4,
and (b) biodiversity values of native vegetation on the biodiversity stewardship site in
accordance with Chapter 5, and (c) habitat suitability of the biodiversity stewardship site for threatened species in
accordance with Chapter 6.
13.1.1.2 The information and data resulting from this assessment of biodiversity values of the biodiversity stewardship site must be used to determine the class of biodiversity credits that can be created at the biodiversity stewardship site in accordance with this chapter.
13.1.1.3 The number of credits for each biodiversity credit class created at the biodiversity stewardship site is determined according to: (a) the averted loss of biodiversity values from undertaking the required
management actions, and (b) the gain in biodiversity values from undertaking the required management
actions, and (c) the additional gain in biodiversity values from undertaking active restoration
management actions, and (d) the security benefit resulting from undertaking the required management
actions and entering into the biodiversity stewardship agreement.
13.2 Preparation of a management plan for the biodiversity stewardship site
13.2.1.1 The assessor is required to prepare a management plan for the proposed biodiversity stewardship site. A completed management plan must be included as part of the BSSAR for the site.
13.2.1.2 The management plan must include: (a) a Site Map of the biodiversity stewardship site, and (b) a description and the required location of the management actions and
management activities that are to be undertaken on the biodiversity stewardship site, and
(c) the timing and duration of the required management actions and any active restoration actions over a 20-year period, and
(d) the timing and duration of the management actions for the ongoing maintenance of the biodiversity stewardship site beyond the 20-year period, and
(e) performance measures for each of the required management actions and active restoration management actions, and

Calculating gain in biodiversity values at a biodiversity stewardship site 55
(f) a map of the management zones that identifies the location of the required management actions and any active restoration actions, and
(g) a map of vegetation zones prepared in accordance with Subsection 5.3.1, and
(h) a map identifying the location of any threatened species polygons prepared in accordance with Step 5 in Section 6.4.
13.2.1.3 At the completion of the 20-year management plan, the owner of the land may apply for a variation to the biodiversity stewardship agreement to replace the section of the management plan required for Clause 13.2.1.2(d) with a new 20-year management plan. The assessor must do this by applying Stage 3 of the BAM.
13.2.1.4 The Site Map must identify any area of the biodiversity stewardship site that is subject to a legal obligation, such as a covenant, asset protection zone or an easement on the land title, which restricts implementation of all the required management actions.
13.2.1.5 These areas must be shown on the Site Map. The creation of biodiversity credits on land that is subject to a legal obligation may be reduced where the implementation of all the required management actions cannot be undertaken, or the legal impediment requires undertaking management activities that are not set out as permissible activities as part of the biodiversity stewardship agreement.
13.3 Management actions that improve biodiversity values 13.3.1.1 In this section management plan means the management plan required under
Section 13.2.
13.3.1.2 Biodiversity credits may only be created from the required management actions, or active restoration management actions that are or are proposed to be carried out at a biodiversity stewardship site for a 20-year period in accordance with Section 13.3 and Subsection 13.3.3.
13.3.1.3 The assessor is required to record in the BSSAR the type and location of the required management actions and any restoration management actions as per Section 13.2.
13.3.1.4 The management plan must specify performance measures for each of the management activities undertaken as part of the required management actions.
13.3.2 Required management actions 13.3.2.1 The required management actions that can create biodiversity credits are set out
in Table 6. All of these management actions must be implemented on the biodiversity stewardship site to achieve the predicted gain in vegetation integrity, as determined using Equation 28.
13.3.2.2 The assessor must determine the type of management activities undertaken at the stewardship site for each management action.

56 Biodiversity Assessment Method
Table 6: Required management actions and types of management activities for improving vegetation integrity and threatened species habitat at a biodiversity stewardship site
Required management action Types of management activities that may be undertaken as part of the required management action for ecosystem credits and species credits
Preparation of a management plan Preparation of a management plan for the biodiversity stewardship agreement for the site
Fire management Undertake ecological burning activities Prevention of fire
Grazing management Fencing to exclude stock Strategic grazing of stock
Native vegetation management Restore/rehabilitate native vegetation Retain and manage regrowth Undertake nutrient control Threatened species habitat management activities related to native vegetation
Threatened species habitat management
Protection of breeding habitat features or sites Undertake any other required management action identified in the Threatened Biodiversity Data Collection to create species credits or ecosystem credits required for that threatened species
Integrated pest animal control Undertake feral pest management including control of foxes, cats, pigs, goats, avian pests, horses and any other miscellaneous species as required
Integrated weed management and control of high threat weeds
Undertake weed management and activities to control high threat exotic and other exotic vegetation Fine-scale intensive removal of high threat exotic and other exotic vegetation
Management of human disturbance Exclude development and clearing activities except those listed as permissible in the biodiversity stewardship agreement Identify sensitive locations and protect from disturbance Undertake rubbish removal Implement measures to restrict access to the site where necessary (vehicles, etc.)
Monitoring Monitoring for evidence of disease Assessment of the management plan and activities against the performance measures Establishment of permanent plots to provide a baseline for assessing biodiversity outcomes Establishment of 360° photo points Review of the management plan and management activities

Calculating gain in biodiversity values at a biodiversity stewardship site 57
13.3.3 Active restoration management actions 13.3.3.1 Active restoration management actions in addition to the required management
actions may be undertaken at a biodiversity stewardship site. Active restoration management actions may be used to create biodiversity credits at a biodiversity stewardship site in addition to the biodiversity credits created for the required management actions.
13.3.3.2 These actions are referred to in the BAM as active restoration management actions and include but are not limited to the management actions set out in Table 7.
13.3.3.3 The use of active restoration management actions to create biodiversity credits must be approved by the Environment Agency Head.
13.3.3.4 Active restoration management actions that are proposed in an application for a biodiversity stewardship agreement must be set out in the management plan. Active restoration management actions must be designed to achieve the outcomes specified in the management plan.
13.3.3.5 Active restoration management actions to create ecosystem credits may be proposed as part of the management plan to increase the gain in the vegetation integrity score for a vegetation zone or part of a vegetation zone.
13.3.3.6 The BSSAR must provide evidence of the proponent’s capability to implement the active restoration management actions set out in the management plan. The BSSAR must: (a) set out the vegetation attributes and habitat that is subject to the restoration
management actions, and (b) identify any topographical, biophysical, financial, knowledge, resource,
methodological or other constraint that is likely to affect reaching the restoration target value for each attribute or threatened flora species, and
(c) demonstrate how each constraint has been addressed in the management plan, including providing evidence of the capability of the proponent to implement the action.
13.3.3.7 For attributes in the richness and cover growth form groups, length of logs and litter cover, the assessor may propose a restoration target value from undertaking the required management actions that is greater than or equal to the future value for that attribute that was determined using Equation 24. The final restoration risk weighting is then applied to the restoration target value for each attribute using Equation 27.
13.3.3.8 Restoration target values proposed by the assessor should reflect the likely outcomes expected to be achieved after 20 years through application of the active restoration management plan.
13.3.3.9 Proposed target values that are above the benchmark value for any attribute will not increase the maximum allowable gain in vegetation integrity.
13.3.3.10 Active restoration management actions may be used to create species credits where: (a) restoration of habitat for the fauna species that is the target of the proposed
active restoration activities is feasible, or (b) the proposed active restoration activities are likely to result in the target flora
species being present and self-sustaining on the stewardship site, and

58 Biodiversity Assessment Method
(c) the proposed active restoration activities will be applied to the area or location of the threatened species habitat that is identified by the species polygon, and
(d) the proposed restoration management activities and performance measures are set out in the management plan for the species.
Table 7: Active restoration management actions that may be undertaken to improve or manage native vegetation or threatened species habitat at a biodiversity stewardship site
Types of active restoration management actions
Types of management activities that may be undertaken as part of the active restoration management actions for ecosystem credits and species credits
Habitat enhancement Inclusion of artificial nesting boxes and the management plan specifies ongoing management, replacement and maintenance Relocation of fallen logs onto biodiversity stewardship site from appropriate sources Addition of rocks from appropriate sources Relocation and securing of dead hollow bearing stag trees from appropriate sources
Native vegetation and habitat management and augmentation
Undertake targeted supplementary planting to: • increase native plant richness and cover above the
level determined for management gain • restore or enhance the condition and species
composition of recognisable PCTs • improve habitat suitability for specific threatened
species Restoration of PCTs through changed hydrological flows
Integrated weed management and control of high threat exotic vegetation
Removal of high threat exotic vegetation through appropriate methods (e.g. scalping) and replacement with native vegetation Other approved methods to reduce cover of high threat exotic vegetation
Hydrology management Create artificial frog ponds or wetlands Manage drainage Install sediment trap(s) Manage debris Undertake nutrient control
Monitoring Assessment of performance measures of outcomes related to the active restoration components such as: • evidence of occupation of and condition of artificial
hollows or relocated logs and stags • persistence and abundance of species targeted by
supplementary plantings or sowings
13.3.3.11 For flora species assessed as count of individuals, active restoration management actions can only be used to create credits where the BSSAR

Calculating gain in biodiversity values at a biodiversity stewardship site 59
demonstrates that the additional individual plants can be self-sustaining on the biodiversity stewardship site.
13.3.3.12 Active restoration management actions apply to the area or location of the threatened species habitat that is identified by the species polygon.
13.3.3.13 The assessor is required to record the duration and timing of additional management actions in the BSSAR.
13.3.3.14 The BSSAR must specify the expected limitations and constraints of the proposed method and availability of appropriate resources and material proposed to be used for active restoration.
13.4 Calculating the change (gain) in vegetation integrity score at a biodiversity stewardship site
13.4.1.1 Using the information collected from the biodiversity stewardship site according to Subsection 5.3.3 to determine the current vegetation integrity score, the assessor must determine the future condition score for each growth form group used to assess structure, composition and function: (a) where land is not managed under a biodiversity stewardship agreement, and (b) where land is managed under a biodiversity stewardship agreement.
13.4.1.2 The difference between the vegetation integrity score without management and the vegetation integrity score with management is then used to determine the overall gain in the vegetation integrity score at the biodiversity stewardship site.
13.5 Estimating the future value of vegetation integrity attributes without management
13.5.1.1 In this section, the assessor estimates the future condition of the attributes used to assess vegetation integrity as if the site were not secured under a biodiversity stewardship agreement.
13.5.1.2 The assessor must estimate the level of averted loss in vegetation integrity at the biodiversity stewardship site through considering the: (a) annual rate of decline in condition of the vegetation integrity attributes set out
in Table 8, and (b) mean of the observed values of these attributes as determined in Subsection
5.3.3, and (c) 20-year time horizon over which averted loss is estimated, and (d) land-use zone that applies to the vegetation zone.
13.5.1.3 The assessor must use this information to estimate the future condition score for these attributes and the growth form groups for each vegetation zone.
13.5.1.4 The annual rate of decline is only required to be estimated for the growth form groups used to assess structure and some attributes used to assess composition and function according to Table 8.
13.5.1.5 The assessor may vary the annual rate of decline in circumstances defined by the criteria set out in Table 8.
13.5.1.6 The assessor is not required to consider the future condition without management for the following attributes: (a) ‘tree’ richness (b) ‘litter cover’
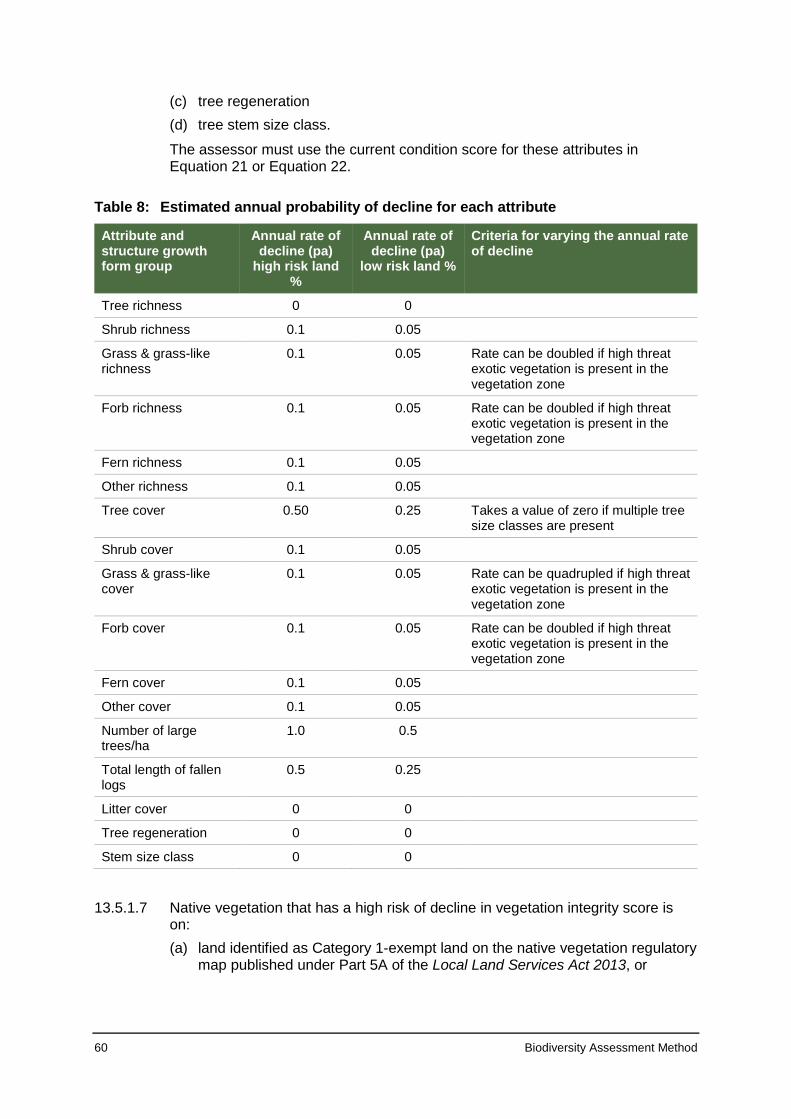
60 Biodiversity Assessment Method
(c) tree regeneration (d) tree stem size class.
The assessor must use the current condition score for these attributes in Equation 21 or Equation 22.
Table 8: Estimated annual probability of decline for each attribute
Attribute and structure growth form group
Annual rate of decline (pa)
high risk land %
Annual rate of decline (pa)
low risk land %
Criteria for varying the annual rate of decline
Tree richness 0 0
Shrub richness 0.1 0.05
Grass & grass-like richness
0.1 0.05 Rate can be doubled if high threat exotic vegetation is present in the vegetation zone
Forb richness 0.1 0.05 Rate can be doubled if high threat exotic vegetation is present in the vegetation zone
Fern richness 0.1 0.05
Other richness 0.1 0.05
Tree cover 0.50 0.25 Takes a value of zero if multiple tree size classes are present
Shrub cover 0.1 0.05
Grass & grass-like cover
0.1 0.05 Rate can be quadrupled if high threat exotic vegetation is present in the vegetation zone
Forb cover 0.1 0.05 Rate can be doubled if high threat exotic vegetation is present in the vegetation zone
Fern cover 0.1 0.05
Other cover 0.1 0.05
Number of large trees/ha
1.0 0.5
Total length of fallen logs
0.5 0.25
Litter cover 0 0
Tree regeneration 0 0
Stem size class 0 0
13.5.1.7 Native vegetation that has a high risk of decline in vegetation integrity score is
on: (a) land identified as Category 1-exempt land on the native vegetation regulatory
map published under Part 5A of the Local Land Services Act 2013, or

Calculating gain in biodiversity values at a biodiversity stewardship site 61
(b) lands that were or are zoned for residential (including rural residential), business or industrial uses in a local environmental plan (LEP) prior to the development of a Standard Instrument LEP (in accordance with the Standard Instrument (LEP) Order 2006), or
(c) land that is zoned RU1 (Primary production).
13.5.1.8 Native vegetation on all other land is considered to have a low risk of decline in the vegetation integrity score of the vegetation zone over a 20-year period.
13.5.1.9 Native vegetation on land that is part of a biodiversity stewardship agreement is considered to be under management. Therefore the assessor must not apply this section of the BAM to an application for a variation to the agreement where the purpose of the variation is to create new or additional credits.
13.5.1.10 For each vegetation zone, the assessor must determine the future condition of the attributes and growth form group without management using Equation 20.
13.6 Estimating the future value of vegetation integrity attributes with management
13.6.1.1 In this section, the assessor estimates the future condition of the attributes used to assess vegetation integrity at the biodiversity stewardship site, considering application of the required management actions, and any active restoration management actions proposed under a secured and funded biodiversity stewardship agreement.
13.6.1.2 The assessor is not required to consider the future condition with management for the following attributes where only the required management actions are undertaken: (a) ‘other’ growth form group used to assess composition (b) ‘other’ growth form group used to assess structure (c) tree stem size class.
The assessor must use the current condition score for these attributes in Equation 25 or Equation 26.
13.6.1.3 Further information on the approach to determining the future value of the attributes used to assess composition, structure and function is included in Appendix 9.
13.6.2 Probability of reaching benchmark for composition, structure and function with management
13.6.2.1 The estimated future values of the growth form groups used to assess composition and structure are based on the probability of reaching benchmark condition from undertaking the required management actions over 20 years using a logistic probability function according to Equation 23 in Appendix 6.
13.6.2.2 The probability of reaching benchmark does not apply to the ‘other’ growth form group. The current value is used to determine the future composition and structure score from undertaking the required management actions over 20 years.
13.6.2.3 The assessor must use the intrinsic rate of increase of the growth form group for the vegetation formation of the PCT being assessed. The intrinsic rate of increase for each growth form group is set out in Appendix 8.

62 Biodiversity Assessment Method
13.6.2.4 The rate of increase is modified according to Equations 29 and 30 in Appendix 9, which take into account the effect of current landscape vegetation cover, high threat exotic vegetation cover and site resilience.
13.6.3 Determine the future condition score for function attributes with required management actions
13.6.3.1 Changes in the number of large trees in a vegetation zone are not assessed as changing at the biodiversity stewardship site over a 20-year timeframe. For the number of large trees attribute, the assessor must use the current observed value.
13.6.3.2 To determine the future value of the leaf litter cover attribute, the assessor must use Equation 23 and Equation 24.
13.6.3.3 To determine the future value of the total length of fallen logs attribute, the assessor must use Equation 23 and Equation 24. This attribute can only be assessed when trees >5cm DBH are present on the biodiversity stewardship site.
13.6.3.4 Where regeneration is present on the biodiversity stewardship site at the start of the management period, the BAM will assume that the biodiversity stewardship site will continue to support regeneration over the 20-year management timeframe.
13.6.3.5 The probability of regeneration occurring at a biodiversity stewardship site where regeneration is absent at the start of the management period is set out in Appendix 9.
13.6.3.6 A biodiversity stewardship site is predicted to have no regeneration in a 20-year period when stems >20cm DBH are absent at the start of the management period.
13.6.3.7 Stem size class is estimated from the number of stem size classes present excluding the <5cm DBH (regeneration) and the large tree class.
13.6.3.8 Changes in stem size class are not assessed as changing at the biodiversity stewardship site over the 20-year management period. The current score for stem size class is used to determine the future function score.
13.6.4 Determine the future habitat condition score for threatened species 13.6.4.1 For threatened species assessed by area, the assessor must determine the gain
in the vegetation integrity score of each vegetation zone that is within the species polygon, considering the vegetation integrity score without management as per Section 13.5 and the vegetation integrity score with management as per Section 13.6.
13.6.4.2 Where the species polygon contains an area of land that is not part of a vegetation zone, the assessor must not use a vegetation integrity score to determine the habitat condition of this area. For species assessed by area, the assessor must record the area of non-vegetation habitat features or habitat components such as caves, rock faces or bridges that are directly impacted by the proposal.
13.7 Calculating the security benefit score at a biodiversity stewardship site
13.7.1.1 The assessor may calculate a security benefit score for the area of each vegetation zone that: (a) has a current vegetation integrity score ≥60, and

Calculating gain in biodiversity values at a biodiversity stewardship site 63
(b) has a current high threat exotic vegetation cover ≤10%, and (c) is not on land which is Crown land, or land to which an existing conservation
obligation applies.
13.7.1.2 The assessor must calculate the security benefit score according to Table 9.
Table 9: Security benefit score
Current vegetation integrity score Security benefit
≥60 – <70 4% of current vegetation integrity score
≥70 – <85 4.5% of current vegetation integrity score
≥85 5% of current vegetation integrity score
13.8 Calculating the number of ecosystem credits created at a biodiversity stewardship site
13.8.1.1 Ecosystem credits are created for the improvement in biodiversity values at a biodiversity stewardship site by undertaking the management actions set out in Section 13.3.
13.8.1.2 The assessor must calculate the number of ecosystem credits created for each vegetation zone on the biodiversity stewardship site in accordance with Equation 4. The number of credits must be rounded to the nearest whole number using conventional rounding rules, except if the number being rounded is less than one, in which case the number of credits is rounded to one.
Equation 4: Calculate the number of ecosystem credits at a biodiversity stewardship site
𝑁𝑁𝑁𝑁𝑁𝑁𝑁𝑁𝑎𝑎𝑎𝑎 𝑜𝑜𝑜𝑜 𝑎𝑎𝑒𝑒𝑜𝑜𝑒𝑒𝑒𝑒𝑒𝑒𝑒𝑒𝑎𝑎𝑁𝑁 𝑒𝑒𝑎𝑎𝑎𝑎𝑐𝑐𝑐𝑐𝑒𝑒𝑒𝑒 = (𝑉𝑉𝐼𝐼 𝑔𝑔𝑎𝑎𝑐𝑐𝑔𝑔 𝑥𝑥 𝑎𝑎𝑎𝑎𝑎𝑎𝑎𝑎) 𝑥𝑥 0.25 where: Number of ecosystem credits = the number of ecosystem credits created for the vegetation zone or part of a vegetation zone under a different management regime
∆VI gain = the change (gain) in the vegetation integrity score of a vegetation zone at the biodiversity stewardship site from management and averted loss
area = the area of the vegetation zone or part of a vegetation zone under a different management regime
13.9 Calculating the number of species credits created at a biodiversity stewardship site
13.9.1.1 For species credits for fauna species, the assessor must use Equation 5 to calculate the number of species credits created at a biodiversity stewardship site for each fauna species determined to be present on the biodiversity stewardship site and mapped in a species polygon prepared in accordance with Paragraph 6.4.1.33.
13.9.1.2 For flora species where the unit of measure is area, the assessor must calculate the number of species credits created at the biodiversity stewardship site using Equation 5, where the area is taken from the species polygon as prepared in Step 5 of Section 6.4.

64 Biodiversity Assessment Method
Equation 5: Determine the number of fauna or flora species credits created at the biodiversity stewardship site
𝑁𝑁𝑁𝑁𝑁𝑁𝑁𝑁𝑎𝑎𝑎𝑎 𝑜𝑜𝑜𝑜 𝑒𝑒𝑠𝑠𝑎𝑎𝑒𝑒𝑐𝑐𝑎𝑎𝑒𝑒 𝑒𝑒𝑎𝑎𝑎𝑎𝑐𝑐𝑐𝑐𝑒𝑒𝑒𝑒 𝑒𝑒𝑎𝑎𝑎𝑎𝑎𝑎𝑒𝑒𝑎𝑎𝑐𝑐 𝑜𝑜𝑜𝑜𝑎𝑎 𝑐𝑐𝑒𝑒ℎ 𝑓𝑓𝑓𝑓𝑓𝑓𝑓𝑓𝑓𝑓𝑓𝑓𝑓𝑓𝑓𝑓𝑓𝑓𝑓𝑓
𝑒𝑒𝑠𝑠𝑎𝑎𝑒𝑒𝑐𝑐𝑎𝑎𝑒𝑒 = 𝐻𝐻𝑔𝑔𝑖𝑖 𝑥𝑥 𝐻𝐻𝑎𝑎𝑖𝑖 𝑥𝑥 0.25
where:
Hgi = the gain in condition of the ith fauna/flora species habitat for each vegetation zone in the species polygon, taken as the ∆VI gain determined in Equation 4
Ha = the area of habitat determined using the area of each vegetation zone within the species polygon for the biodiversity stewardship site, prepared in accordance with Paragraph 6.4.1.33
13.9.1.3 For flora species where the unit of measure is number of individuals in the species polygon, as prepared in Step 5 of Section 6.4, the assessor must calculate the number of species credits created at the biodiversity stewardship site using Equation 6.
Equation 6: Determine the number of flora species credits created at the biodiversity stewardship site
Number of species credits created for the ith flora species = 𝐼𝐼𝑖𝑖 − (𝐼𝐼𝑖𝑖 𝑥𝑥 (1 − 𝑐𝑐𝑎𝑎)𝑡𝑡) where: Ii = the number of individuals in the species polygon for the biodiversity stewardship site, prepared in accordance with Paragraph 6.4.1.33 ir = the estimated intrinsic rate of increase for the ith species based on the rate of increase for structure for the growth form group to which the species belongs t = management timeframe (20 years)
13.9.1.4 The number of fauna or flora species credits must be rounded to the nearest whole number using conventional rounding rules, except if the number being rounded is less than one, in which case the number of credits is rounded to one.
13.10 Identifying the credit class for biodiversity credits created at a biodiversity stewardship site
13.10.1.1 The credit class for ecosystem credits created at a biodiversity stewardship site is identified by the same attributes set out in Paragraph 11.3.1.1.
13.10.1.2 The credit class for ecosystem credits is created for each PCT at the biodiversity stewardship site. A different credit class may be identified for the same PCT where there is a variation in attributes (b), (e) or (g) as set out in Paragraph 11.3.1.1.
13.10.1.3 The credit class of a species credit created at a biodiversity stewardship site is the species which is being managed at the biodiversity stewardship site.
13.10.1.4 The credit class is part of the biodiversity credit report (biodiversity credits) produced from the Credit Calculator, which sets out the number and class of ecosystem credits created at the biodiversity stewardship site in accordance with Section 13.8, or of species credits in accordance with Section 13.9.
13.11 Existing obligations and management actions 13.11.1.1 Ecosystem and species credits may only be created by management actions
proposed to be carried out on a biodiversity stewardship site where the

Calculating gain in biodiversity values at a biodiversity stewardship site 65
management actions are additional to any biodiversity conservation measure or action that is an existing conservation obligation.
13.11.1.2 For the purposes of Paragraph 13.11.1.1, existing conservation obligation means any measure or action required to be carried out under: (a) a restriction on use or public positive covenant under Part 4A of the Crown
Lands Act 1989 or Division 5.10 of the Crown Land Management Act 2016 (b) a conservation agreement entered into under the National Parks and Wildlife
Act 1974 (NPW Act) (c) a trust agreement entered into under the Nature Conservation Trust Act 2001
(NCT Act) (d) a conservation agreement under Part 5 of the BC Act (e) any agreement entered into with a public authority under which the owner of
the land received, or is entitled to receive funding for biodiversity conservation purposes
(f) in the case of publicly owned land, any legislative requirements to manage the land for biodiversity conservation purposes
(g) a biobanking agreement entered into under the Threatened Species Conservation Act 1995 (TSC Act)
(h) a biodiversity stewardship agreement entered into under Part 5 of the BC Act (i) a legal obligation imposed by a statutory body or officer where that officer or
body (or the Minister to whom the officer or body is responsible) has advised in writing that the legal obligation was not imposed for biodiversity offset purposes
(j) a property vegetation plan (PVP) under the Native Vegetation Act 2003 that is described as a Conservation PVP (and relates to land which is required to be conserved or in respect of which public funding was provided to improve biodiversity).
Note: Clause 5.1(c) of the BC Regulation prevents land to which many of these instruments apply from being designated as a biodiversity stewardship agreement site, unless the instrument was not imposed for biodiversity offsetting purposes. If the instrument was not entered into for biodiversity offsetting purposes, a biodiversity stewardship agreement may be entered into and this Section 13.11 will apply in relation to the management actions required under the agreement that are additional to those under the relevant instrument above.
13.11.1.3 This rule does not apply to: (a) a restriction on use or public positive covenant under Part 4A of the Crown
Lands Act that is imposed in connection with an application to purchase land that is duly made by a leaseholder in respect of that land before 10 March 2009
(b) a conservation agreement entered into under the NPW Act as a result of a proposal made by the landholder to the Minister administering that Act before 10 March 2009, or
(c) a trust agreement entered into under the NCT Act as a result of a proposal made by the landholder to the Nature Conservation Trust before 10 March 2009.
13.11.1.4 For the purposes of Paragraph 13.11.1.1: (a) existing conservation obligation does not include management actions that
are undertaken voluntarily and which are not secured by any legal obligation

66 Biodiversity Assessment Method
(b) publicly owned land means land owned by, or under the control of, the State, the Commonwealth or a public authority, other than land that is the subject of a perpetual lease or land that the Minister is satisfied is being managed by a person or body (other than the State, Commonwealth or public authority) under a long-term lease, licence or other arrangement.
13.11.1.5 This section will apply to a variation of a biodiversity stewardship agreement or a biobanking agreement for the purpose of creating an additional class or number of credits on land that is part of the existing agreement where: (a) the date the application for the variation is made is later than 12 months after
the date of the first management payment, or (b) the date the application for the variation is made is later than 36 months after
the date when the agreement first took effect (whichever of (a) or (b) occurs earlier).
In any other circumstance, no additional credits can be generated in relation to an existing biodiversity stewardship site or biobanking site.
13.11.1.6 Where a biodiversity stewardship site is proposed on land to which an existing conservation obligation applies, the number of biodiversity credits calculated in accordance with Section 13.8 and Section 13.9 must be reduced in accordance with the following steps.
Step 1: Calculate credits for the proposed biodiversity stewardship site 13.11.1.7 Calculate the number of ecosystem credits and species credits that are created
for the proposed stewardship agreement in accordance with Equation 4 for ecosystem credits and Equation 5 or Equation 6 for species credits.
Step 2: Identify the management actions that are undertaken for the existing conservation obligations 13.11.1.8 The management actions referred to in Section 13.3 that are required for the
existing conservation obligation and the timeframe for which they are required must be identified.
Step 3: Determine the management action reduction percentage required for the existing conservation obligations 13.11.1.9 For publicly owned land, the number of credits as determined in Step 1 for the
proposed stewardship agreement is reduced according to the percentage reduction identified in: (a) Table 10 for the types of legislative requirement listed in Table 10, or (b) Table 11 for all other types of publicly owned land.
Table 10: Percentage reduction for ecosystem credits and species credits for a biodiversity stewardship site on certain types of publicly owned land
Legislative requirement Percentage reduction where the existing conservation obligation is in-perpetuity
Land classed as ‘community’ land under the Local Government Act 1993, Chapter 6, Part 2 Division 1,
20%
Land classed as ‘operational’ land under the Local Government Act, Chapter 6, Part 2 Division 1 after 25 August 2017
20%
Land that is reserved land under Part 5 of the Crown Lands Act or dedicated or reserved land under the Crown Lands Act
20%

Calculating gain in biodiversity values at a biodiversity stewardship site 67
13.11.1.10 For privately owned land, the number of credits as determined in Step 1 for the proposed stewardship agreement is reduced according to the management actions that the landholder is already obliged to perform under the existing obligation and the percentage reduction for each management action detailed in Table 11.
Table 11: Percentage reduction for ecosystem credits and species credits for a biodiversity stewardship site with existing conservation obligations
Required management action
Management activities subject to additionality
Percentage reduction where the existing
conservation obligation is in-
perpetuity
Preparation of a management plan
Preparation of a management plan is a required element of the existing conservation obligation
5%
Fire management Periodical ecological burning has been or is to be carried out Ecological burning is supported by funding
10%
Grazing management Strategic grazing of stock 5%
Native vegetation and threatened species habitat management
Existing obligation specifies actions that restore or rehabilitate native vegetation
10%
Pest animal control Existing obligation specifies actions that control: • feral and/or overabundant native herbivores • vertebrate pests including foxes, cats and/or
other miscellaneous species such as pigs, goats
10%
Integrated weed control
Existing obligation specifies that broad-scale weed control or site-based weed control has been or is to be carried out Weed control actions are supported by funding
10%
Management of human disturbance
Existing obligation specifies actions that require: • removal of existing and future rubbish • measures that restrict access to the site
including vehicles, trail bikes, etc.
5%
Threatened species habitat management
Existing obligation specifies other management actions identified in the Threatened Biodiversity Data Collection as being required to create biodiversity credits for that threatened species
5% – 10%
Monitoring Existing obligation specifies: • monitoring of biodiversity outcomes against
performance measures • reporting of actions undertaken
5%

68 Biodiversity Assessment Method
Definitions Terms in the BAM have the same meaning as terms used in the BC Act unless otherwise provided. References to environmental planning instruments in the BAM are references to the environmental planning instruments as in force from time to time. References to databases in the BAM are references to databases as in force from time to time. References to sections are references to sections of this BAM unless otherwise indicated. The following terms are defined for the purposes of the BAM: Accredited person: has the same meaning as in the BC Act, referred to in the BAM as ‘assessor’. Ancillary rules: has the same meaning as set out in clause 6.5 of the BC Regulation. Annual probability of decline in vegetation and habitat condition: an estimate of the average probability of decline of each attribute through clearing, stochastic factors or ongoing degrading actions (firewood removal, weed invasion, livestock grazing). Areas of geological significance: geological features such as karst, caves, crevices, cliffs. Assessment area surrounding the subject land: the area of land in the 1500m buffer zone around a development site, or land to be biodiversity certified or a biodiversity stewardship site, that is determined in accordance with Subsection 4.3.2. Assessor: the person accredited under the BC Act referred to in Subsection 2.1.2 and who has been engaged by the proponent. Averted loss: the gain in vegetation and habitat condition that arises from managing the proposed land as an offset compared to the probable future vegetation condition if the land was to be left unmanaged (see Annual probability of decline). Avoid: measures taken by a proponent such as careful site selection or actions taken through the design, planning, construction and operational phases of the development to completely avoid impacts on biodiversity values, or certain areas of biodiversity. Refer to the BAM for operational guidance. BAM: the Biodiversity Assessment Method. BC Act: the Biodiversity Conservation Act 2016. BC Regulation: the Biodiversity Conservation Regulation 2017. Benchmark data: for a PCT, vegetation class or vegetation formation benchmark data is contained in the BioNet Vegetation Classification. A local reference site may also be used to establish benchmark data for a PCT that may be used in a BAM assessment. Benchmarks: the quantitative measures that represent the ‘best-attainable’ condition, which acknowledges that native vegetation within the contemporary landscape has been subject to both natural and human-induced disturbance. Benchmarks are defined for specified variables for each PCT. Vegetation with relatively little evidence of modification generally has minimal timber harvesting (few stumps, coppicing, cut logs), minimal firewood collection, minimal exotic weed cover, minimal grazing and trampling by introduced or overabundant native herbivores, minimal soil disturbance, minimal canopy dieback, no evidence of recent fire or flood, is not subject to high frequency burning, and has evidence of recruitment of native species. Biodiversity certification: has the same meaning as in the BC Act. Biodiversity Certification Assessment Report (BCAR): has the same meaning as in the BC Act.

Definitions 69
Biodiversity credit report: the report produced by the Credit Calculator that sets out the number and class of biodiversity credits required to offset the remaining adverse impacts on biodiversity values at a development site, or on land to be biodiversity certified, or that sets out the number and class of biodiversity credits that are created at a biodiversity stewardship site. Biodiversity Development Assessment Report (BDAR): has the same meaning as in the BC Act. Biodiversity offsets: management actions that are undertaken to achieve a gain in biodiversity values on areas of land in order to compensate for losses to biodiversity values from the impacts of development. Biodiversity stewardship agreement: has the same meaning as in the BC Act. Biodiversity stewardship site: has the same meaning as in the BC Act. Biodiversity Stewardship Site Assessment Report (BSSAR): the report that must be prepared in accordance with the BAM and submitted as part of an application for a biodiversity stewardship agreement.
Biodiversity values: has the same meaning as clause 1.5(2) of the BC Act. Biodiversity values map: is established according to clause 7.3 of the BC Regulation. Development within an area identified on the map requires assessment using the BAM. BioNet Atlas: the OEH database of flora and fauna records (formerly known as the NSW Wildlife Atlas). The Atlas contains records of plants, mammals, birds, reptiles, amphibians, some fungi, some invertebrates (such as insects and snails listed under the TSC Act) and some fish. BioNet Vegetation Classification: the master vegetation community-level classification for use in vegetation mapping programs and regulatory biodiversity impact assessment frameworks in NSW. The BioNet Vegetation Classification is published by OEH and available at www.environment.nsw.gov.au/research/Visclassification.htm. Broad condition state: areas of the same PCT that are in relatively homogenous condition. Broad condition is used for stratifying areas of the same PCT into a vegetation zone for the purpose of determining the vegetation integrity score. Certified more appropriate local data: has the same meaning as set out in Subsection 2.2.2. Change in vegetation integrity score for a biodiversity stewardship site: the difference (gain) between the estimated vegetation integrity score without management at a biodiversity stewardship site and the predicted future vegetation integrity score with management at a biodiversity stewardship site, calculated in accordance with Equation 28. Class of biodiversity credit: as defined in Section 11.3. Clearing site: the site proposed to be cleared of native vegetation where approval is sought under Part 5A of the Local Land Services Act 2013 or the State Environmental Planning Policy (Vegetation in Non-Rural Areas) 2017. Clonal species: flora species that propagate asexually at a site or have a limited degree of sexual reproduction, either within or between sites. Modes of asexual reproduction will include vegetative reproduction such as by rhizomes, root suckers or bulb replication. Connectivity: the measure of the degree to which an area(s) of native vegetation is linked with other areas of vegetation. Credit Calculator: the computer program that provides decision support to assessors and proponents by applying the BAM, in particular by using the data required to be entered and the equations in Appendix 6 and Appendix 9 to calculate the number and class of biodiversity credits required to offset the impacts of a development or created at a biodiversity stewardship site.

70 Biodiversity Assessment Method
Critically endangered ecological community (CEEC): an ecological community specified as critically endangered in Schedule 2 of the BC Act and/or listed under Part 13, Division 1, Subdivision A of the Commonwealth Environment Protection and Biodiversity Conservation Act 1999 (EPBC Act). Crown cover: the vertical projection of the periphery of tree crowns within a designated area. Derived vegetation: PCTs that have changed to an alternative stable state as a consequence of land management practices since European settlement. Derived communities can have one or more structural components of the vegetation entirely removed or severely reduced (e.g. over-storey of grassy woodland), or have developed new structural components where they were previously absent (e.g. shrubby mid-storey in an open woodland system). Development site: an area of land that is subject to a proposed development application, application for approval, or activity within the meaning of Part 5 of the EP&A Act. The term development is also taken to include clearing, except where the reference is to a small area development or a major project development. Development footprint: the area of land that is directly impacted on by a proposed development, including access roads, and areas used to store construction materials. The term development footprint is also taken to include clearing footprint except where the reference is to a small area development or a major project development. Development site: an area of land that is subject to a proposed development that is under the EP&A Act. The term development site is also taken to include clearing site except where the reference is to a small area development or a major project development. Ecosystem credits: a measurement of the value of threatened ecological communities, threatened species habitat for species that can be reliably predicted to occur with a PCT, and PCTs generally. Ecosystem credits measure the loss in biodiversity values at a development site and the gain in biodiversity values at a biodiversity stewardship site. Endangered ecological community (EEC): an ecological community specified as endangered in Schedule 2 of the BC Act, or listed under the EPBC Act. Environment Agency Head: has the same meaning as in the BC Act. EP&A Act: the NSW Environmental Planning and Assessment Act 1979. EPBC Act: the Commonwealth Environment Protection and Biodiversity Conservation Act 1999. Ephemeral flora species: flora species where the abundance of the species above ground fluctuates in response to the plant life history in combination with environmental conditions and/or disturbance regimes. Fluctuations in abundance may be short-term (seasonal) or long-term (yearly to decadal). Many ephemeral species persist underground through unfavourable conditions via soil seed banks or dormant vegetative organs (bulbs, tubers, rootstocks). Estuarine area: a semi-enclosed body of water having an open or intermittently open connection with the ocean, in which water levels do not vary with the ocean tide (when closed to the sea) or vary in a predictable, periodic way in response to the ocean tide at the entrance (when open to the sea). Expert: a person who has the relevant experience and/or qualifications to provide expert opinion in relation to the biodiversity values to which an expert report relates. Foliage cover: the percentage of a plot area that would be covered by a vertical projection of the foliage and branches and trunk of a plant, or plants or a growth form group. Foliage cover can also be referred to as percent foliage cover.

Definitions 71
Gain: the gain in biodiversity values at a biodiversity stewardship site, over time from undertaking management actions at a biodiversity stewardship site. Gain in biodiversity values is the basis for creating biodiversity credits at the biodiversity stewardship site. Grassland: native vegetation classified in the vegetation formation ‘Grasslands’ in Keith (2004)2. Grasslands are generally dominated by large perennial tussock grasses, lack of woody plants, the presence of broad-leaved herbs in inter-tussock spaces, and their ecological association with fertile, heavy clay soils on flat topography in regions with low to moderate rainfall. Growth form: the form that is characteristic of a particular flora species at maturity. Growth forms are set out in Appendix 4. Habitat: an area or areas occupied, or periodically or occasionally occupied, by a species or ecological community, including any biotic or abiotic component. Habitat component: the component of habitat that is used by a threatened species for either breeding, foraging or shelter. Habitat surrogates: measures of habitat that predict the occurrence of threatened species and communities: IBRA subregion, PCT, percent vegetation cover and vegetation condition. Herbfield: native vegetation which predominantly does not contain an over-storey or mid-storey and where the ground cover is dominated by non-grass species. High threat exotic plant cover: plant cover composed of vascular plants not native to Australia that if not controlled will invade and outcompete native plant species. Also referred to as high threat weeds. Hollow bearing tree: a living or dead tree that has at least one hollow. A tree is considered to contain a hollow if: (a) the entrance can be seen; (b) the entrance width is at least 5cm; (c) the hollow appears to have depth (i.e. you cannot see solid wood beyond the entrance); (d) the hollow is at least 1m above the ground. Trees must be examined from all angles. IBRA region: a bioregion identified under the Interim Biogeographic Regionalisation for Australia (IBRA) system3, which divides Australia into bioregions on the basis of their dominant landscape-scale attributes. IBRA subregion: a subregion of a bioregion identified under the IBRA system. Impact assessment: an assessment of the impact or likely impact of a development on biodiversity values which is prepared in accordance with the BAM. Impacts on biodiversity values: loss in biodiversity values from direct or indirect impacts of development in accordance with Chapters 8, 1 and 10. Important wetland means:
(e) a wetland that is listed in the Directory of Important Wetlands of Australia (DIWA) from time to time, and
(f) for the purposes of all paragraphs except 4.2.1.6 the actual location on the ground that corresponds to a SEPP 14 Coastal wetland
(g) for the purposes of Paragraph 4.2.1.6: (i) a SEPP 14 Coastal Wetland, and (ii) the actual location on the ground that corresponds to a SEPP 14 Coastal
Wetland.
2 Keith, D (2004), Ocean shores to desert dunes: the native vegetation of New South Wales and the ACT, Department of Environment and Conservation NSW, Hurstville. 3 Thackway, R and Cresswell ID (1995), An interim biogeographic regionalisation for Australia: a framework for setting priorities in the National Reserves System Cooperative Program, Australian Nature Conservation Agency, Canberra.

72 Biodiversity Assessment Method
Individual: in relation to organisms, a single, mature organism that is a threatened species, or any additional threatened species listed under Part 13 of the EPBC Act. Intact vegetation: vegetation where all tree, shrub, grass and/or forb structural growth form groups expected for a plant community type are present. Intrinsic rate of increase (ir): an estimate of the rate of gain for an attribute at a biodiversity stewardship site from actions undertaken as part of the management plan. The intrinsic rate of increase is specified for an attribute according to the formation of the PCT being assessed (see Appendix 8). Landscape attributes: in relation to a development site or a biodiversity stewardship site, native vegetation cover, vegetation connectivity, patch size and the strategic location of a biodiversity stewardship site. Large tree benchmark: is the largest stem size class for a PCT as determined by the benchmark for the PCT. Life cycle: the series of stages of reproduction, growth, development, aging and death of an organism. Life form: the form that is characteristic of a particular species at maturity. In the BAM, life form has the same meaning as growth form for flora species. Linear shaped development: development that is generally narrow in width and extends across the landscape for a distance greater than 3.5 kilometres in length. Litter cover: the percentage ground cover of all plant material that has detached from a living plant, including leaves, seeds, twigs, branchlets and branches (<10cm in diameter). Local population: the population that occurs in the study area. In cases where multiple populations occur in the study area or a population occupies part of the study area, impacts on each subpopulation must be assessed separately. Local wetland: any wetland that is not identified as an important wetland (refer to definition of Important wetland). Loss of biodiversity: the loss of biodiversity values from a development site, native vegetation clearing site or land where biodiversity certification is conferred. Major project: State Significant Development and State Significant Infrastructure. Minimise: a process applied throughout the development planning and design life cycle which seeks to reduce the residual impacts of development on biodiversity values. Mitchell landscape: landscapes with relatively homogeneous geomorphology, soils and broad vegetation types, mapped at a scale of 1:250,000. Multiple fragmentation impact development: developments such as wind farms and coal seam gas extraction that require multiple extraction points (wells) or turbines and a network of associated development including roads, tracks, gathering systems/flow lines, transmission lines. Native ground cover: all native vegetation below 1m in height, including all such species native to NSW (i.e. not confined to species indigenous to the area). Native ground cover (grasses): native ground cover composed specifically of native grasses. Native ground cover (other): native ground cover composed specifically of non-woody native vegetation (vascular plants only) <1m in height that is not grass (e.g. herbs, ferns). Native ground cover (shrubs): native ground cover composed specifically of native woody vegetation <1m in height. Native mid-storey cover: all vegetation between the over-storey stratum and a height of 1m (typically tall shrubs, under-storey trees and tree regeneration) and including all species native to NSW (i.e. native species not local to the area can contribute to mid-storey structure).

Definitions 73
Native over-storey cover: the tallest woody stratum present (including emergent) above 1m and including all species native to NSW (i.e. native species not local to the area can contribute to over-storey structure). In a woodland community, the over-storey stratum is the tree layer, and in a shrubland community the over-storey stratum is the tallest shrub layer. Some vegetation types (e.g. grasslands) may not have an over-storey stratum. Native plant species richness: the number of different native vascular plant species that are characteristic of a PCT. Native vegetation: has the same meaning as in section 1.6 of the BC Act. Native vegetation cover: the percentage of native vegetation cover on the subject land and the surrounding buffer area. Cover estimates are based on the cover of native woody and non-woody vegetation relative to the approximate benchmarks for the PCT, taking into account vegetation condition and extent. Native over-storey vegetation is used to determine the percent cover in woody vegetation types, and native ground cover is used to assess cover in non-woody vegetation types. Number of trees with hollows: a count of the number of living and dead trees that are hollow bearing. Offset rules: are those established by the BC Regulation. Onsite measures: measures and strategies that are taken, or are proposed to be taken at a development site to avoid and minimise the direct and indirect impacts of the development on biodiversity values. Operational Manual: the Operational Manual published from time to time by OEH, which is a guide to assist assessors when using the BAM. Patch size: an area of intact native vegetation that:
a) occurs on the development site or biodiversity stewardship site, and b) includes native vegetation that has a gap of less than 100m from the next area of
moderate to good condition native vegetation (or ≤30m for non-woody ecosystems). Patch size may extend onto adjoining land that is not part of the development site or biodiversity stewardship site. PCT classification system: the system of classifying native vegetation approved by the NSW Plant Community Type Control Panel and described in the BioNet Vegetation Classification. Percent cleared value: the percentage of a PCT that has been cleared as a proportion of its pre-1750 extent, as identified in the BioNet Vegetation Classification. Plant community type (PCT): a NSW plant community type identified using the PCT classification system. Plot: an area within a vegetation zone in which site attributes are assessed. Population: a group of organisms, all of the same species, occupying a particular area. Probability of reaching benchmark: the probability of a specific attribute or growth form group reaching benchmark conditions in the vegetation zone at the end of the management timeframe. Proponent: a person who intends to apply for consent or approval to carry out development, clearing, biodiversity certification or for approval for infrastructure. Reference sites: the relatively unmodified sites that are assessed to obtain local benchmark information when benchmarks in the Vegetation Benchmarks Database are too broad or otherwise incorrect for the PCT and/or local situation. Benchmarks can also be obtained from published sources. Regeneration: the proportion of over-storey species characteristic of the PCT that are naturally regenerating and have a diameter at breast height <5cm within a vegetation zone.

74 Biodiversity Assessment Method
Residual impact: an impact on biodiversity values after all reasonable measures have been taken to avoid and minimise the impacts of development. Under the BAM, an offset requirement is calculated for the remaining impacts on biodiversity values. Retirement of credits: the retirement of biodiversity credits from a biobank site or a biodiversity stewardship site secured by a biodiversity stewardship agreement. Riparian buffer: an area of land determined according to Appendix 3. Risk of extinction: the likelihood that the local population or CEEC or EEC will become extinct either in the short term or in the long term as a result of direct or indirect impacts on the viability of that population or CEEC or EEC. SEPP 14 Coastal wetland: a wetland to which State Environmental Planning Policy No 14 – Coastal Wetlands applies or an area that is identified as a coastal wetland within the meaning of the term coastal wetlands and littoral rainforests area for the purposes of Coastal Management Act 2016. Site attributes: the matters assessed to determine vegetation integrity. They include: native plant species richness, native over-storey cover, native mid-storey cover, native ground cover (grasses), native ground cover (shrubs), native ground cover (other), exotic plant cover (as a percentage of total ground and mid-storey cover), number of trees with hollows, proportion of over-storey species occurring as regeneration, and total length of fallen logs. Site-based development: a development other than a linear shaped development, or a multiple fragmentation impact development. Site context: the value given to landscape attributes of a development site or biodiversity stewardship site after an assessment undertaken in accordance with Section 4.3. Species credit species: are threatened species or components of species habitat that are identified in the Threatened Species Data Collection as requiring assessment for species credits. Species credits: the class of biodiversity credits created or required for the impact on threatened species that cannot be reliably predicted to use an area of land based on habitat surrogates. Species that require species credits are listed in the Threatened Biodiversity Data Collection. State Significant Development: has the meaning given by Division 4.1 of Part 4 of the EP&A Act. State Significant Infrastructure: has the meaning given by Part 5.1 of the EP&A Act. Stream order: has the same meaning as in Appendix 3. Subject land: is land to which the BAM is applied in Stage 1 to assess the biodiversity values of the land. It includes land that may be a development site, clearing site, proposed for biodiversity certification or land that is proposed for a biodiversity stewardship agreement. Threat status class: the extent to which a species or ecological community is threatened with extinction, or the extent to which a PCT is estimated to have been cleared (see Percent cleared value). Threatened Biodiversity Data Collection: part of the BioNet database, published by OEH and accessible from the BioNet website at www.bionet.nsw.gov.au. Threatened ecological community (TEC): means a critically endangered ecological community, an endangered ecological community or a vulnerable ecological community listed in Schedule 2 of the BC Act. Threatened species: critically endangered, endangered or vulnerable threatened species as defined by Schedule 1 of the BC Act, or any additional threatened species listed under Part 13 of the EPBC Act as critically endangered, endangered or vulnerable.

Definitions 75
Threatened species survey: a targeted survey for threatened species undertaken in accordance with Section 6.5. Threatened species survey guidelines: survey methods or guidelines published by OEH from time to time at www.environment.nsw.gov.au/topics/animals-and-plants/threatened-species/about-threatened-species/surveys-and-assessments. Total length of fallen logs: the total length of logs present in a vegetation zone that are at least 10cm in diameter and at least 0.5m long. Transect: a line or narrow belt along which environmental data is collected. Upland Swamp Policy: the document entitled Addendum to NSW Biodiversity Offsets Policy for Major Projects: Upland swamps impacted by longwall mining subsidence as in force on the day when the BAM is published until such time as the Environment Agency Head publishes any further document for the purpose of it being adopted by the BAM as the Upland Swamp Policy. Vegetation Benchmarks Database: a database of benchmarks for vegetation classes and some PCTs. The Vegetation Benchmarks Database is published by OEH and is part of the BioNet Vegetation Classification. It is available at www.environment.nsw.gov.au/research/Visclassification.htm. Vegetation class: a level of classification of vegetation communities defined in Keith (2004)4. There are 99 vegetation classes in NSW. Vegetation formation: a broad level of vegetation classification as defined in Keith (2004)4. There are 16 vegetation formations and sub-formations in NSW. Vegetation integrity: the condition of native vegetation assessed for each vegetation zone against the benchmark for the PCT. Vegetation integrity score: the quantitative measure of vegetation condition calculated in accordance with Equation 15 or Equation 16. Vegetation zone: a relatively homogenous area of native vegetation on a development site, land to be biodiversity certified or a biodiversity stewardship site that is the same PCT and broad condition state. Viability: the capacity of a species to successfully complete each stage of its life cycle under normal conditions so as to retain long-term population densities. Vulnerable ecological community (VEC): an ecological community specified as vulnerable in Schedule 2 of the BC Act and/or listed under Part 13, Division 1, Subdivision A of the EPBC Act. Wetland: an area of land that is wet by surface water or ground water, or both, for long enough periods that the plants and animals in it are adapted to, and depend on, moist conditions for at least part of their life cycle. Wetlands may exhibit wet and dry phases and may be wet permanently, cyclically or intermittently with fresh, brackish or saline water (see also Important wetland and Local wetland). Woody native vegetation: native vegetation that contains an over-storey and/or mid-storey that predominantly consists of trees and/or shrubs.
4 Keith, D (2004), Ocean shores to desert dunes: the native vegetation of New South Wales and the ACT, Department of Environment and Conservation NSW, Hurstville.

76 Biodiversity Assessment Method
Appendix 1: Streamlined assessment module – clearing paddock trees
Introduction An assessment of the impact of clearing paddock trees can be made using this module. This module may be used where the Land Management Code established under the Local Land Services Act 2013 cannot be applied, and for development under the Environmental Planning and Assessment Act 1979 where the BAM is required to assess the impacts on biodiversity values. The streamlined assessment module – clearing paddock trees must only be used to assess the impacts of clearing or development proposals for vegetation that meets the definition of paddock trees. Where only part of the subject land contains paddock trees, this module may be used to assess that part of a development or clearing proposal and the full BAM must be used to assess impacts on the remaining areas.
Paddock trees covered by this module – definition of paddock trees Vegetation meets the definition of paddock trees if:
a) the trees located on category 2 land are surrounded by category 1 land on the regulatory maps under the Biodiversity Conservation Act, or
b) the native vegetation that comprises the groundcover is:
i) less than 50% of the cover of indigenous species of vegetation, and
ii) not less than 10% of the area is covered with vegetation (whether dead or alive), and
iii) the assessment is made at the time of year when the proportion of the amount of indigenous vegetation in the area to the amount of non-indigenous vegetation in the area is likely to be at its maximum, and
c) the foliage cover for the tree growth form group is less than 25% of the benchmark for tree cover for the most likely plant community type, or
d) it is a tree located more than 50m away from any living tree that is greater than 20cm DBH and the tree is located on category 2 land that is surrounded by category 1 land; or it is in a group of three (3) or fewer living trees within a distance of 50m of each other, that in turn, are greater than 50m from the next living tree that is greater than 20cm DBH and located on category 2 land that is surrounded by category 1 land.
Any proposed clearing of native vegetation that does not meet the definition of paddock trees must be assessed according to Chapters 4–6 of the BAM.
Map paddock tree zone and determine the assessment class The assessor must prepare a paddock tree clearing map that identifies all the paddock trees proposed to be cleared. The assessor must identify the genus and species of each paddock tree. The assessor must then assign each paddock tree or group of trees to be cleared into a class according to:
a) Class 1: paddock trees that are ≤20cm DBH, or trees that meet the definition of trees with negligible biodiversity value as defined below
b) Class 2: paddock trees that are ≥20cm DBH and less than the large tree benchmark for the most likely plant community type

Appendix 1: Streamlined assessment module – clearing paddock trees 77
c) Class 3: paddock trees that are greater than or equal to the large tree benchmark for the most likely plant community type.
Check the vegetation in the zone meets the definition of paddock trees Any vegetation that does not meet the definition of paddock trees cannot be assessed according to this module.
Identify paddock trees with negligible biodiversity value Paddock trees with negligible biodiversity value are those trees identified as class 1 paddock trees and do not contain hollows.
Assess the habitat suitability of class 2 and class 3 paddock trees for threatened species The assessor is required to assess the habitat suitability of all class 3 paddock trees for threatened species. Threatened species that require ecosystem credits are likely to use the paddock trees as suitable habitat if that species meets all the following criteria:
a) the distribution of the species includes the IBRA subregion in which the development is located, or mostly located, and
b) the species is a species that is likely to use paddock trees as habitat according to data in the Threatened Biodiversity Data Collection.
The assessor must identify any potential entity that is listed in the Guidance to assist a decision-maker to determine a serious and irreversible impact that would be impacted on by the proposed clearing of the paddock trees. The assessor must visually assess all class 2 and class 3 paddock trees in the field to determine whether they are a hollow bearing tree or contain any other important habitat features for any threatened species using data from the Threatened Biodiversity Data Collection. All hollow bearing trees identified by the assessor must be clearly identified on the map.
Determine the offset requirements The assessor is required to determine an offset requirement for development that requires the clearing of paddock trees in class 2 and class 3 according to Equation 7. The assessor is required to determine the extent of native vegetation cover according to Subsection 4.3.2. No offset is required to be calculated for development that impacts on paddock trees in class 1.
Equation 7: Calculate the number of ecosystem credits required for clearing paddock trees in class 2 and class 3
𝑁𝑁𝑁𝑁𝑁𝑁𝑁𝑁𝑎𝑎𝑎𝑎 𝑜𝑜𝑜𝑜 𝑎𝑎𝑒𝑒𝑜𝑜𝑒𝑒𝑒𝑒𝑒𝑒𝑎𝑎𝑁𝑁 𝑒𝑒𝑎𝑎𝑎𝑎𝑐𝑐𝑐𝑐𝑒𝑒𝑒𝑒 𝑎𝑎𝑎𝑎𝑟𝑟𝑁𝑁𝑐𝑐𝑎𝑎𝑎𝑎𝑐𝑐 = #𝑃𝑃𝑃𝑃 𝑥𝑥 #𝐸𝐸𝐸𝐸/𝑃𝑃𝑎𝑎𝑎𝑎𝑎𝑎 where:
number of ecosystem credits required = the number of ecosystem credits required to offset the clearing of the paddock trees
#PT = the number of paddock trees in class 2, or the number of paddock trees in class 3 counted by the assessor and identified in the map
#EC/PT = the number of ecosystem credits required per tree based on the class of paddock tree and the extent of intact native vegetation remaining on the property according to Table 12

78 Biodiversity Assessment Method
Table 12: Number of ecosystem credits required per paddock tree
Class of paddock tree being cleared
Number of credits required to offset clearing of a paddock tree
Paddock trees that contain hollows
Paddock trees that do not contain hollows
Class 2 (≥ 20cm DBH and < large tree benchmark)
0.75 0.5
Class 3 (≥ large tree benchmark)
1.0 0.75
Credit profile The credit profile must include the seven attributes identified in Section 11.3. The assessor must nominate up to three candidate PCTs for attribute (a), being a PCT that:
a) includes the species of the paddock tree being cleared as one of its dominant tree species according to information in the BioNet Vegetation Classification, and
b) is a PCT that is associated with all the threatened species assessed as likely to use the paddock tree as habitat.
Attributes (b) – (e) are determined according to the PCTs identified for attribute (a). Attribute (f) is assigned according to whether hollows were recorded for any class 2 or class 3 paddock trees. Attribute (g) is assigned according to the IBRA subregion in which the clearing occurs or mostly occurs.

Appendix 2: Streamlined assessment module – small area development that requires consent 79
Appendix 2: Streamlined assessment module – small area development that requires consent
This appendix sets out a streamlined assessment module for assessing:
a) the biodiversity values of a small area development (Stage 1), and
b) the impacts of the development on biodiversity, and
c) an offset requirement for the impact. The assessor must use the streamlined assessment module for small area development in the BAM Credit Calculator as part of the assessment of biodiversity values for developments that require consent in the NSW planning system. The streamlined assessment module for small area developments must only be used according to the area clearing threshold shown in Table 13. The streamlined assessment module for small area developments cannot be used to assess the biodiversity values of land that is located within an area shaded on the biodiversity values map.
Table 13: Area limits for application of small area development threshold on land not shaded on the biodiversity values map
Minimum lot size associated with the property
Maximum area limit for application of the small area development module
Less than 1ha ≤1ha
Less than 40ha but not less than 1ha ≤2ha
Less than 1000ha but not less than 40ha ≤5ha
1000ha or more ≤10ha
BAM reference Streamlined assessment requirement
Chapter 4 Identify landscape features and site context
4.2 Identify the IBRA subregion in which the development takes place
4.3 An assessor must assess the site context of the site, in accordance with Subsections 4.3.2 and 5.3.2:
a) native vegetation cover
b) patch size
Chapter 5 Assess native vegetation and vegetation integrity
5.1 Prepare a map of native vegetation on the site as per Paragraph 5.1.1.1
5.2 Identify the dominant PCT on the site either by:
a) use of existing information as defined in Paragraph 5.2.1.5, or
b) collection of plot-based survey data as required by Paragraph 5.2.1.9 and choosing the PCT based on analysis of the plot data

80 Biodiversity Assessment Method
BAM reference Streamlined assessment requirement Identify if the PCT is associated with an ecological community as required by Paragraph 5.2.1.14
5.3 Assess the vegetation integrity of the PCTs on the development or clearing site as individual vegetation zones by either:
a) qualitatively by observing values for the condition attributes set out in Table 3, or
b) quantitatively by collecting values for the condition attributes at a plot/transect in accordance with Subsection 5.3.4
5.4 Determine the vegetation integrity score in accordance with Section 5.4, and by using Equations 8–16 in Appendix 6, by entering observed values into the small area module of the BAM Credit Calculator
Chapter 6 Assess the habitat suitability for threatened species
6.4 Determine the suite of threatened fauna species likely to use the development site as suitable habitat according to Step 1 and Step 2 in Section 6.4
Appendix 7 Identify if any threatened species on the candidate species list that is established at Paragraph 6.4.1.16 in Step 2 are in the very high sensitivity to gain class according to Table 21 and information in the Threatened Biodiversity Data Collection
6.6 Determine the biodiversity risk weighting for any species that is found on the development site using information for the species in the Threatened Biodiversity Data Collection
Chapter 11 Determine the offset requirement
11.2 Complete Subsection 9.1.3 to determine the impact of the development on vegetation integrity and threatened species habitat
11.2.3 Calculate the number of ecosystem credits required for impact of the development on biodiversity values according to Subsection 11.2.3
11.2.4 (only required when Step 4 in S.6.4 is completed
Calculate the number of flora or fauna species credits required for impact of the development on biodiversity values according to Subsection 11.2.4
11.3 Identify the credit class for ecosystem credits and species credits according to Section 11.3 (note that this report will be auto-generated by the BAM Credit Calculator)

Appendix 3: Ordering of waterways and riparian buffer distances 81
Appendix 3: Ordering of waterways and riparian buffer distances
The Strahler stream ordering system is a classification system that gives a waterway an ‘order’ according to the number of tributaries associated with it (Strahler 19525). Figure 1 illustrates the Strahler stream ordering process. Numbering begins at the top of a catchment with headwater (‘new’) flow paths being assigned the number one. Where two flow paths of order one join, the section downstream of the junction is referred to as a second order stream. Where two second order streams join, the waterway downstream of the junction is referred to as a third order stream, and so on. Where a lower order stream (e.g. first order) joins a higher order stream (e.g. third order), the area downstream of the junction will retain the higher number (i.e. it will remain a third order stream). The stream ordering system is designed to produce results that are consistent between catchments, but also recognises regional differences.
Figure 1: Strahler stream ordering system
Riparian buffer distances must be measured on both sides of the stream from the top of bank, if this is defined, otherwise from the edge of the stream and only from the centre of the stream if the edge is not defined. Where a stream has more than one bank on either side, the bank closest to the main channel must be used, to protect vegetation on and within the stream banks. The riparian buffer distances for various water bodies are set out in Table 14. Riparian buffer distances do not include the width of the water body.
5 Strahler, AN (1952), ‘Hypsometric (area-altitude) analysis of erosional topology’, Geological Society of America Bulletin 63 (11): 1117–1142.

82 Biodiversity Assessment Method
Table 14: Riparian buffer distances
Water body type Riparian corridor width (each side of waterway)
Unmapped & 1st order streams 10
2nd order stream 20
3rd order stream 30
4th & 5th order streams & above 40
6th order stream & above 50
Local wetland 20
Important wetland 50
Estuarine area 50
The DIWA wetlands are available from www.environment.gov.au/metadataexplorer/download_test_form.jsp?dataTitle=Directory%20of%20Important%20Wetlands%20in%20Australia%20(DIWA)%20Spatial%20Database&[email protected]&dataFormat=Shapefile SEPP 14 Coastal wetland data is available from www.planningportal.nsw.gov.au/planning-tools/open-data-tools/open-data

Appendix 4: Growth form definitions 83
Appendix 4: Growth form definitions For the composition and structure components of the vegetation integrity assessment in Section 5.3 the assessor must assign all observed native plant species to a growth form group according to the definitions set out in Table 15.
Definitions have been modified from the NSW Native Vegetation Interim Type Standard (Sivertsen 20096) and the National Vegetation Information System V6 (Department of Environment and Heritage 2003).
OEH may provide a growth form group look-up table for assigning each plant species to a growth form group. Where the assessor is unsure of the correct growth form group for a species the growth form look-up table should be consulted.
Table 15: Growth form groups and growth form definitions
BAM growth form group
Growth form code
Growth form category *
Growth form definition
Tree (TG)
t Tree Woody perennial plant usually with a distinct trunk. Usually more than 6m tall when mature.
m Mallee tree Primarily species of Eucalyptus with multiple stems arising from a lignotuber. Usually more than 6m tall when mature.
Shrub (SG) s Shrub Woody perennial plant, multi-stemmed at the base (or within 750mm from ground level). Usually less than 6m tall when mature. Not a mallee, heath or chenopod shrub.
y Mallee shrub Primarily species of Eucalyptus with multiple stems arising from a lignotuber. Usually less than 6m tall when mature.
z Heath shrub Woody perennial shrub, commonly with ericoid leaves (nanophyll or smaller). Commonly occurs on nutrient-poor substrates.
c Chenopod shrub
Woody perennial shrub or sub-shrub from the family Chenopodiaceae (excludes forb-like chenopods). Single or multi-stemmed, may be semi-succulent, or leafless with fleshy, jointed stems (e.g. Tecticornia and Sarcocornia).
Grass & grass-like (GG)
g Tussock grass
Any tussock or bunch grass that forms discrete but open tussocks usually with distinct individual shoots. Includes clumping species with deep subterranean rhizomes, e.g. Imperata and the reed Phragmites.
h Hummock grass
Coarse xeromorphic grass with a mound-like form often dead in the middle. Includes all members of Triodia.
d Other grass Member of the family Poaceae that generally has a mat-forming habit (rhizomatous and/or stoloniferous, ‘sod’ grasses), rather than a distinctive tussock, reed or hummock habit.
v Sedge Herbaceous, usually perennial erect plant generally with a tufted habit. Includes all members of the family Cyperaceae.
6 Sivertsen D (2009), Native Vegetation Interim Type Standard, Department of Environment, Climate Change and Water NSW, Sydney.

84 Biodiversity Assessment Method
BAM growth form group
Growth form code
Growth form category *
Growth form definition
r Rush Herbaceous, usually perennial erect plant that is neither a grass nor a sedge. Includes all members of the families Eriocaulaceae, Juncaceae, Lomandraceae, Restionaceae, Sparganiaceae and Typhaceae.
Forb (FG) f Forb Herbaceous or slightly woody, annual, biennial or sometimes perennial plant. Includes bulbous or tuberous herbs, ground orchids, lilies and irises from the families Amaryllidaceae, Anthericaceae, Araceae, Asphodelaceae, Blandfordiaceae, Commelinaceae, Hypoxidaceae, Iridaceae, terrestrial/geophytic Orchidaceae, Philydraceae and Phormiaceae. Includes some aquatic or semi-aquatic species. Includes all members of the family Juncaginaceae, plus members of the genera Lemna, Wolffia, Potamogeton and Vallisneria. Includes forb-like chenopod species (e.g. Einadia spp., some Atriplex, Chenopodium, Dysphania and Maireana species).
Fern (EG) e Fern and fern allies
Characterised by large and usually branched leaves (fronds), herbaceous; lithophytic or epiphytic; terrestrial to aquatic. Includes all members of the families Adiantaceae, Aspleniaceae, Azollaceae, Davalliaceae, Grammitaceae, Marsileaceae, Psilotaceae, Pteridaceae, Polypodiaceae, Lycopodiaceae, Selaginellaceae and Isoetaceae. Excludes tree ferns and all members of the families Cyatheaceae, Dicksoniaceae, Osmundaceae and Marattiaceae.
Other (OG)
q Tree fern Characterised by large and usually branched leaves (fronds), arborescent and terrestrial. Includes all members of the families Cyatheaceae, Dicksoniaceae, Osmundaceae and Marattiaceae.
p Palm & palm-like
Palm and other arborescent monocotyledons. All members of the families Agavaceae, Arecaceae, Doryanthaceae or the genus Cordyline.
a Cycad & cycad-like
Palm-like plant, stemless to arborescent with fruit in cones. Includes all members of the family Zamiaceae and the genus Pandanus.
l Vine Climbing, twining, winding, scrambling or sprawling plants.
k Epiphyte and lithophyte
Plant with roots attached to the aerial portions of other plants or rocks. Includes angiosperm epiphytes, mistletoes, parasites and some orchids. Includes all members of the families Loranthaceae and Viscaceae. Excludes lithophytic or epiphytic ferns, which are included in the fern growth form category.
x Xanthorrhoea Grass tree. All members of the genus Xanthorrhoeaceae.
* adapted from Walker J & Hopkins MS (1990) Vegetation, in: RC McDonald, RF Isbell, JG Speight, J Walker and MS Hopkins (eds), Australian soil and land survey field handbook, pp. 58–86, Inkata Press, Melbourne.

Appendix 5: Guidelines for the collection of benchmark data from local reference sites or published sources 85
Appendix 5: Guidelines for the collection of benchmark data from local reference sites or published sources
Benchmark data from local reference sites may be used where that data more accurately reflects the local environmental conditions and condition attributes for a PCT. Where local benchmark data is developed, it must be derived from measurements taken on reference sites that measure the same PCT in a relatively unmodified condition or from published sources. Except for where the local benchmark is a seasonal benchmark that is published in the BioNet Vegetation Classification, the consent authority must approve the use of benchmark data from local reference sites or published sources in accordance with Subsection 2.2.2.
Locating reference sites Reference sites are sites with relatively little evidence of modification by humans since European (post-1750) settlement, as indicated by minimal timber harvesting (few stumps, coppicing, cut logs), minimal firewood collection, minimal exotic weed cover, minimal grazing and trampling by introduced or overabundant native herbivores, minimal soil disturbance, dieback not in excess of normal senescence, no evidence of very recent major perturbation such as fire or flood, not subject to high frequency burning, and evidence of recruitment of native plant species. It may be difficult to find totally unmodified sites, particularly in highly cleared regions. Vegetation in relatively unmodified condition can be found in some travelling stock routes and reserves, national parks and nature reserves, state forests (especially flora reserves), cemeteries, roadsides and commons. Reference sites can occur in small remnants, such as narrow roadsides and cemeteries.
Number of reference plots To obtain a reasonable composite picture that encompasses the variation in condition variables, a minimum of three reference plots/transects for each variable should be measured for each PCT (or vegetation class), with more plots/transects being desirable.
Published sources Benchmarks may also be obtained from published sources.

86 Biodiversity Assessment Method
Appendix 6: Determining the vegetation integrity score Determining the vegetation integrity score To determine the vegetation integrity score for a vegetation zone, the assessor must determine the composition score, structure score and function score using the plot and transect survey data collected for the vegetation zone.
Composition condition score Each growth form group is initially scored out of 100 for composition condition. Average observed values for each growth form group are converted to continuous unweighted condition scores using Equation 8 (Weibull function, Figure 2). Equation 8 is calculated for each growth form group shown in Table 3 based on the inputs:
a) mean species richness of the growth form group recorded (observed) from all the plots in the vegetation zone, or
b) mean species richness of the growth form group taking into account the impacts of development, clearing or biodiversity certification in the vegetation zone, or
c) mean species richness of the growth form group from estimating the future value of vegetation integrity attributes without management in the vegetation zone, or
d) mean species richness of the growth form group from estimating the future value of vegetation integrity attributes with management in the vegetation zone, and
e) the benchmark richness for that growth form group drawn from the BioNet Vegetation Classification.
Equation 8: Unweighted condition score calculation for each growth form group or relevant function attribute in a vegetation zone
𝑈𝑈𝐸𝐸𝑈𝑈𝑖𝑖 = 100.68 × (1− 𝑎𝑎−5�x̄𝑖𝑖
𝐵𝐵𝑖𝑖� �2.5
) where:
UCSi = unweighted condition score for the ith growth form group (composition) or function attribute in the vegetation zone
x̄i = mean of species richness of the ith growth form group (composition) or function attribute among plots within the vegetation zone (observed or predicted future)
Bi = benchmark value for the ith growth form group for composition or function attribute (from BioNet Vegetation Classification)

Appendix 6: Determining the vegetation integrity score 87
Figure 2: Weibull distribution used for the continuous unweighted scoring of composition condition for each growth form group
Dynamic weights are applied to unweighted composition condition scores for each growth form group based on the proportional contribution of each growth form group’s benchmark richness to the benchmark total richness (sum of benchmark richness across all growth form groups). Dynamic weights are calculated using Equation 9.
Equation 9: Dynamic weight calculation for each composition growth form group
𝑤𝑤𝑖𝑖 = 𝐵𝐵𝑖𝑖/�𝐵𝐵𝑖𝑖
𝑓𝑓
𝑖𝑖=1
where: wi = dynamic weight for the ith growth form group Bi = benchmark species richness value for the ith growth form group n = number of growth form groups
The composition condition score for the zone is calculated as the sum of the products of unweighted condition scores and their dynamic weights for each growth form group using Equation 10.
Equation 10: Composition condition score calculation for the zone
𝐸𝐸𝐸𝐸𝑈𝑈 = �𝑈𝑈𝐸𝐸𝑈𝑈𝑖𝑖 ×𝑤𝑤𝑖𝑖
𝑓𝑓
𝑖𝑖=1
where: CCS = composition condition score for the zone UCSi = unweighted composition condition score for the ith growth form group wi = dynamic weight for the ith growth form group n = number of growth form groups

88 Biodiversity Assessment Method
Structure condition score Each growth form group is initially scored out of 100 for structure condition. The mean of all observed cover values for a growth form group within a vegetation zone is converted to a continuous unweighted condition score using Equation 11 (Weibull function, Figure 2). Where the mean of observed cover values for a growth form group within a vegetation zone is more than benchmark value, the mean value is assumed to be equal to benchmark for that growth form group. Equation 11 is used to calculate the cover score of each structure growth form group shown in Table 3 based on the inputs:
a) mean cover for the growth form group recorded (observed) from all plots/transects in the vegetation zone, or
b) mean cover for the growth form group taking into account the impacts of development, clearing or biodiversity certification in the vegetation zone, or
c) mean cover for the growth form group from estimating the future value of vegetation integrity attributes without management in the vegetation zone, or
d) mean cover for the growth form group from estimating the future value of vegetation integrity attributes with management in the vegetation zone, and
e) the benchmark cover for the growth form group drawn from the benchmarks database.
Equation 11: Unweighted structure condition score calculation for each growth form group in a vegetation zone
𝑈𝑈𝑈𝑈𝑈𝑈𝑖𝑖 = 100.68 × (1 − 𝑎𝑎−5�x̄𝑖𝑖
𝐵𝐵𝑖𝑖� �2.5
) where:
USSi = unweighted structure score for the ith growth form group or function attribute in the vegetation zone
x̄i = mean cover of the ith growth form group or function attribute among plots within the vegetation zone (observed or predicted future cover)
Bi = benchmark value for the ith growth form group for structure of function attribute (from benchmarks database)
Dynamic weights are applied to unweighted structure scores for each growth form group based on the proportional contribution of each growth form group’s benchmark cover to the benchmark total cover (sum of benchmark cover across all growth form groups). Dynamic weights are calculated using Equation 12.
Equation 12: Dynamic weight calculation for each structure growth form group
𝑤𝑤𝑖𝑖 = 𝐵𝐵𝑖𝑖/�𝐵𝐵𝑖𝑖
𝑓𝑓
𝑖𝑖=1
where:
wi = dynamic weight for the ith growth form group
Bi = benchmark cover value for the ith growth form group
n = number of growth form groups

Appendix 6: Determining the vegetation integrity score 89
The structure condition score for the zone is calculated as the sum of the products of unweighted condition scores and their dynamic weights for each growth form group using Equation 13.
Equation 13: Structure condition score calculation for the zone
𝑈𝑈𝐸𝐸𝑈𝑈 = �𝑈𝑈𝑈𝑈𝑈𝑈𝑖𝑖 ×𝑤𝑤𝑖𝑖
𝑓𝑓
𝑖𝑖=1
where:
SCS = structure condition score for the zone
USSi = unweighted structure score for the ith growth form group
wi = dynamic weight for the ith growth form group
n = number of growth form groups
Function condition score The assessor must determine a function condition score for PCTs classified under:
a) vegetation formations that are rainforests, wet sclerophyll forests, dry sclerophyll forests, forested wetlands, grassy woodlands, semi-arid woodlands, and
b) vegetation classes that are Wallum Sand Heaths, Sydney Coastal Heaths, Northern Montane Heaths, and Sydney Montane Heaths.
The assessor does not determine a function condition score for PCTs classified under:
a) vegetation formations that are freshwater wetlands, saline wetlands, grasslands, alpine complex and arid shrublands, or
b) vegetation classes that are Southern Montane Heaths, South Coast Heaths and Coastal Headland Heaths.
Dynamic weights do not apply to function attributes. Static weights applied are shown in Table 16.
Table 16: Static weights that apply to the scoring of function attributes
Attribute Attribute weight
Number of large trees 0.35
Length of logs 0.20
Litter cover 0.15
Tree regeneration 0.15
Tree stem size class 0.15
Number of large trees. Equation 8 is used to determine the unweighted condition score for the average number of large trees observed among plots within a zone. Length of logs. Equation 8 is used to determine the unweighted condition score for the average length of fallen logs observed among plots within a zone.

90 Biodiversity Assessment Method
Litter cover. Equation 11 is used to determine the unweighted condition score for average litter cover observed among plots within a zone. Tree regeneration. When counts at a plot are ≥1 the unweighted regeneration score for the plot is 100. When counts at a plot are zero the unweighted regeneration score for the plot is zero. The average unweighted regeneration score for the zone is calculated as the sum of scores divided by the number of plots. Tree stem size class is based on the number of stem size classes present within the plot. The unweighted score for tree stem size class is scored according to Table 17. The average unweighted tree stem size class score for the zone is calculated as the sum of scores divided by the number of plots.
Table 17: Tree stem size class scores
Number of stem size classes present (not including large trees or regenerating trees)
Large tree benchmark
size ≥80cm
DBHOB
Large tree benchmark
size ≥50cm
DBHOB
Large tree benchmark
size ≥30cm
DBHOB
Large tree benchmark
size ≥20cm
DBHOB
None 0 0 0 0
One 9 15 28 59
Two 40 59 85 100
Three 76 92 100 NA
Four 95 100 NA NA
Five 100 NA NA NA
The function condition score for the zone is calculated as the sum of the products of unweighted condition scores and their static weights (Table 16) for each attribute using Equation 14.
Equation 14: Function condition score calculation for the zone
𝐹𝐹𝐸𝐸𝑈𝑈 = �𝑈𝑈𝐹𝐹𝑈𝑈𝑖𝑖 ×𝑤𝑤𝑖𝑖
5
𝑖𝑖=1
where:
FCS = function condition score for the zone
UFSi = unweighted function condition score for the ith attribute
wi = weight for the ith attribute
Vegetation integrity score The assessor must determine a vegetation integrity score for each vegetation zone identified in Subsection 5.3.1. The assessor must use Equation 15 to determine the vegetation integrity score for PCTs classified under:
a) vegetation formations that are rainforests, wet sclerophyll forests, dry sclerophyll forests, forested wetlands, grassy woodlands, semi-arid woodlands, or
b) vegetation classes that are Wallum Sand Heaths, Sydney Coastal Heaths, Northern Montane Heaths, and Sydney Montane Heaths.

Appendix 6: Determining the vegetation integrity score 91
Equation 15: Current vegetation integrity score calculation for treed systems
𝑉𝑉𝐼𝐼 = √𝐸𝐸𝐸𝐸𝑈𝑈 𝑥𝑥 𝑈𝑈𝐸𝐸𝑈𝑈 𝑥𝑥 𝐹𝐹𝐸𝐸𝑈𝑈3 where:
𝑉𝑉𝐼𝐼 = current vegetation integrity score for the zone
CCS = composition condition score for the zone
SCS = structure condition score for the zone
FCS = function condition score for the zone
The assessor must use Equation 16 to determine the vegetation integrity score for PCTs classified under:
a) vegetation formations that are freshwater wetlands, saline wetlands, grasslands, alpine complex and arid shrublands, or
b) vegetation classes that are Southern Montane Heaths, South Coast Heaths and Coastal Headland Heaths.
Equation 16: Vegetation integrity score calculation for non-treed systems
𝑉𝑉𝐼𝐼 = √𝐸𝐸𝐸𝐸𝑈𝑈 𝑥𝑥 𝑈𝑈𝐸𝐸𝑈𝑈2 where:
CCS = composition condition score for the zone
SCS = structure condition score for the zone
Future vegetation integrity score accounting for the impacts of development, clearing or conferral of biodiversity certification The assessor must determine the future vegetation integrity score for each vegetation zone identified in Subsection 5.3.1 by taking into account the impacts of development, clearing or biodiversity certification on the growth form groups used to determine the composition and cover score, and the attributes used to determine the function score. The assessor must use Equation 17 to determine the future vegetation integrity score for a zone for PCTs classified under:
a) vegetation formations that are rainforests, wet sclerophyll forests, dry sclerophyll forests, forested wetlands, grassy woodlands, semi-arid woodlands, or
b) vegetation classes that are Wallum Sand Heaths, Sydney Coastal Heaths, Northern Montane Heaths, and Sydney Montane Heaths.
Equation 17: Future vegetation integrity score calculation for treed systems
𝑉𝑉𝐼𝐼𝑉𝑉 = √𝐸𝐸𝑈𝑈 𝑥𝑥 𝑈𝑈𝑈𝑈 𝑥𝑥 𝐹𝐹𝑈𝑈3 where:
VID = future vegetation integrity score taking into account the impacts of development, clearing or conferral of biodiversity certification
CS = future composition condition score for the zone
SS = future structure condition score for the zone
FS = future function condition score for the zone

92 Biodiversity Assessment Method
The assessor must use Equation 18 to determine the future vegetation integrity score for a zone for PCTs classified under:
a) vegetation formations that are freshwater wetlands, saline wetlands, grasslands, alpine complex and arid shrublands, or
b) vegetation classes that are Southern Montane Heaths, South Coast Heaths and Coastal Headland Heaths.
Equation 18: Future vegetation integrity score calculation for non-treed systems
𝑉𝑉𝐼𝐼𝑉𝑉 = √𝐸𝐸𝑈𝑈 𝑥𝑥 𝑈𝑈𝑈𝑈2 where:
VID = future vegetation integrity score taking into account the impacts of development, clearing or conferral of biodiversity certification
CS = future composition condition score for the zone
SS = future structure condition score for the zone
Calculating the change in the vegetation integrity score for vegetation zones on the development site/land to be certified The change (loss) in the vegetation integrity score is a measure of the direct impact on native vegetation and threatened species habitat. The assessor must calculate the change in vegetation integrity score for the vegetation zone or for a management zone using Equation 19. The change (loss) in vegetation integrity is the difference between the current vegetation integrity score determined before the development takes place and the future vegetation integrity score determined by accounting for the impacts of development. The assessor must measure the direct impact on the area of suitable habitat defined by the species polygon in accordance with Step 5 in Section 6.4 using Equation 19. The assessor must measure the direct impact on individual flora defined by the species polygon in accordance with Step 5 in Section 6.4 using a count of the number of each flora species in the species polygon. Note: The number of individual flora species directly cleared within a species polygon is later used in Subsection 11.2.4 to determine the offset requirement.
Equation 19: Calculate the change in vegetation integrity score at the development site or land to be biodiversity certified
∆𝑉𝑉𝐼𝐼 𝐿𝐿𝑜𝑜𝑒𝑒𝑒𝑒 = 𝑉𝑉𝐼𝐼 − 𝑉𝑉𝐼𝐼𝑉𝑉 where: ∆VI Loss = the change (loss) in the vegetation integrity score of a vegetation zone at the development site or land to be biodiversity certified VI = the current vegetation integrity score, as determined in accordance with Section 5.4 VID = future vegetation integrity score taking into account the impacts of development, as determined in accordance with Subsection 9.1.2 Note: The loss in vegetation integrity for a vegetation zone or a species polygon, is later used in Subsection 11.2.3 and Subsection 11.2.4 to determine the offset requirement.
Estimating the future value of vegetation integrity attributes without management For each vegetation zone, the assessor must determine the future condition of the attributes and growth form group without management using Equation 20.

Appendix 6: Determining the vegetation integrity score 93
Equation 20: Estimated future value of attributes without a biodiversity stewardship agreement
𝐹𝐹𝑉𝑉0 = 𝑉𝑉𝑖𝑖×(1 − 𝑉𝑉𝑖𝑖)𝑡𝑡 where: FV0 = future value of the attribute without a biodiversity stewardship agreement in a vegetation zone Vi = current observed mean of the ith attribute (at t=0) from plot data in the vegetation zone Di = estimated annual probability of decline for the ith attribute according to Table 8 t = management timeframe, which takes a value of 20 years
Once the assessor has determined the future value of the attribute without a biodiversity stewardship agreement, the future value of the attribute is then used to determine the:
a) composition condition score without management, and
b) structure condition score without management, and
c) function condition score without management. Future attribute values, without a biodiversity stewardship agreement, are converted to composition, structure and function condition scores using Equations 8 through to 14. The assessor must use Equation 21 to determine the future vegetation integrity score without management for PCTs classified under:
a) vegetation formations that are rainforests, wet sclerophyll forests, dry sclerophyll forests, forested wetlands, grassy woodlands, semi-arid woodlands, or
b) vegetation classes that are Wallum Sand Heaths, Sydney Coastal Heaths, Northern Montane Heaths, and Sydney Montane Heaths.
Equation 21: Vegetation integrity score calculation for treed systems without management
𝑉𝑉𝐼𝐼𝑎𝑎𝑉𝑉 = √𝐸𝐸𝐸𝐸𝑈𝑈 𝑥𝑥 𝑈𝑈𝐸𝐸𝑈𝑈 𝑥𝑥 𝐹𝐹𝐸𝐸𝑈𝑈3 where:
VIal = the vegetation integrity score with averted loss taking into account the decline in vegetation integrity without management
CCS = composition condition score with averted loss for the zone taking into account the decline in composition without management
SCS = structure condition score with averted loss for the zone taking into account the decline in structure without management
FCS = function condition score with averted loss for the zone taking into account the decline in function without management
The assessor must use Equation 22 to determine the vegetation integrity score for PCTs classified under:
a) vegetation formations that are freshwater wetlands, saline wetlands, grasslands, alpine complex and arid shrublands, or
b) vegetation classes that are Southern Montane Heaths, South Coast Heaths and Coastal Headland Heaths.

94 Biodiversity Assessment Method
Equation 22: Vegetation integrity score calculation for non-treed systems without management
𝑉𝑉𝐼𝐼𝑎𝑎𝑉𝑉 = √𝐸𝐸𝐸𝐸𝑈𝑈 𝑥𝑥 𝑈𝑈𝐸𝐸𝑈𝑈2 where:
VIal = the vegetation integrity score with averted loss taking into account the decline in vegetation integrity without management
CCS = composition condition score with averted loss for the zone taking into account the decline in composition without management
SCS = structure condition score with averted loss for the zone taking into account the decline in structure without management
Equation 23: Probability of growth form group reaching benchmark within a 20-year management timeframe
𝑃𝑃𝑖𝑖 =(𝐸𝐸𝑖𝑖𝐾𝐾𝑖𝑖
)×𝑎𝑎𝑓𝑓𝑡𝑡
1 + �𝐸𝐸𝑖𝑖𝐾𝐾𝑖𝑖�×𝑎𝑎𝑓𝑓𝑡𝑡 − 1
where: Pi = probability of specific attribute or growth form group reaching benchmark conditions in the vegetation zone at the end of the management timeframe Ki = the benchmark value for the specific attribute or growth form group Ci = the current value of an attribute in a vegetation zone determined using Equation 8 for functional attributes, Equation 10 for composition attributes and Equation 13 for structure attributes at time 0 r = intrinsic rate of increase for the attribute or growth form group t = management timeframe (20 years)
Estimate the future condition score for composition and structure with required management actions If the current attribute value (Ci) is below benchmark (Ki) then the predicted attribute value at a stewardship site (FV1), when the required management actions are undertaken over a 20-year timeframe (t=20), is estimated using Equation 24. If the current attribute value is greater than benchmark then the future value (FV1) is assumed to be equal to Ci.
Equation 24: Future condition score of attributes used to assess composition and structure with management
FV1 = Pi x Ki where: FV1 = the future value of the attribute at t=20 years Pi = the predicted probability of benchmark value at t=20 years Ki = the estimated benchmark value for the ith attribute
Once the assessor has determined the future value of the attribute with management, the future value of the attribute is then used to determine the:
a) composition condition score with management, and
b) structure condition score with management, and
c) function condition score with management.

Appendix 6: Determining the vegetation integrity score 95
Future attribute values, with management (required and/or active restoration), are converted to composition, structure and function condition scores using Equations 8 through to 14.
Calculating the future vegetation integrity score at a biodiversity stewardship site with required management actions For PCTs in grassy woodland, wet sclerophyll forest, dry sclerophyll forest, semi-arid woodland and rainforest formations, vegetation integrity for a zone is calculated as the geometric mean of the composition, structure and function scores using Equation 25. For PCTs in treeless heathlands, shrublands, grasslands and wetlands formations, the vegetation integrity for a zone is calculated as the geometric mean of composition and structure scores using Equation 26.
Equation 25: Future vegetation integrity score calculation for treed systems
𝑉𝑉𝐼𝐼𝑤𝑤𝑁𝑁 = √𝐸𝐸𝐸𝐸𝑈𝑈 𝑥𝑥 𝑈𝑈𝐸𝐸𝑈𝑈 𝑥𝑥 𝐹𝐹𝐸𝐸𝑈𝑈3
Equation 26: Future vegetation integrity score calculation for non-treed systems
𝑉𝑉𝐼𝐼𝑤𝑤𝑁𝑁 = √𝐸𝐸𝐸𝐸𝑈𝑈 𝑥𝑥 𝑈𝑈𝐸𝐸𝑈𝑈2 where:
VIwm = future vegetation integrity score taking into account the gain in vegetation integrity from required management or active restoration
CCS = composition condition score for the zone taking into account the gain in vegetation integrity from required and any active restoration management actions
SCS = structure condition score for the zone taking into account the gain from required and any active restoration management actions
FCS = function condition score for the zone taking into account the from required and any active restoration management actions
Calculating the future vegetation integrity score at a biodiversity stewardship site with active restoration management actions Where active restoration management actions are undertaken at a stewardship site, the assessor must calculate the maximum allowable gain for each condition attribute subject to active restoration management actions. The maximum allowable gain for each condition attribute is based on:
a) the difference between the predicted attribute value determined for the required management actions, and the target value for the attribute from undertaking the active restoration management actions after 20 years, and
b) application of the final restoration risk weighting determined using Equation 27 to the target value to determine the maximum allowable gain for each condition attribute.
The maximum allowable gain for each condition attribute is then used in Equation 25 or Equation 26 to determine the future vegetation integrity score with active restoration.
Equation 27: Determine the final restoration risk weighting R 𝐵𝐵𝑖𝑖 = (𝑎𝑎𝑤𝑤𝑖𝑖 × 𝐻𝐻𝑃𝑃𝐵𝐵𝑁𝑁)
where:
Ri = final risk weighting for the ith habitat attribute
rwi = risk weighting of 0.3 for the ith habitat attribute
HTWm= effect of high threat exotic vegetation on the risk weighting determined using Equation 36

96 Biodiversity Assessment Method
The final risk weighting that is applied to the target attribute value from active restoration is calculated using Equation 27 based on application of:
a) the initial restoration risk weighting of 0.3 to each target attribute, and
b) the high threat exotic vegetation modifier based on the cover of high threat exotic vegetation present at the stewardship site as determined at Equation 36 and Figure 8.
Calculating the gain in the vegetation integrity score for vegetation zones at a biodiversity stewardship site The assessor must calculate the change in vegetation integrity score for the vegetation zone using Equation 28. The gain in vegetation integrity is the difference between the future vegetation integrity score with management determined in either Equation 25 or Equation 26 and the future vegetation integrity score without management determined by either Equation 21 or Equation 22.
Equation 28: Calculate the change in vegetation integrity score at a biodiversity stewardship site
𝑉𝑉𝐼𝐼 𝑔𝑔𝑎𝑎𝑐𝑐𝑔𝑔 = (𝑉𝑉𝐼𝐼𝑤𝑤𝑁𝑁 − 𝑉𝑉𝐼𝐼𝑎𝑎𝑉𝑉) + 𝑈𝑈𝑁𝑁 where:
∆VI gain = the change (gain) in the vegetation integrity score of a vegetation zone at the biodiversity stewardship site from management and averted loss
VIwm = the future vegetation integrity score taking into account the gain with required management actions and restoration management actions under a biodiversity stewardship agreement determined in accordance with Equation 25 or Equation 26
𝑉𝑉𝐼𝐼𝑎𝑎𝑉𝑉 = the future vegetation integrity score without a biodiversity stewardship agreement determined in accordance with Equation 21 or Equation 22
Sb = the security benefit that may apply in accordance with Section 13.7

Appendix 7: Biodiversity risk weighting 97
Appendix 7: Biodiversity risk weighting The BAM uses a biodiversity risk weighting to evaluate the ecological risks of threatened entities from the biodiversity offsets scheme. The biodiversity risk weighting is comprised of two components:
2. Sensitivity to loss – this considers the increased threat posed to an entity from offsetting the loss of habitat or population, and
3. Sensitivity to potential gain – this considers the ability of a species to respond to improvements in habitat condition at an offset site.
The biodiversity risk weighting for determining the credit requirement for ecosystem credits is based on the sensitivity to loss of either the listed TEC, or the PCT identified at the site, and the highest sensitivity to gain ranking for the ecosystem credit species associated with that TEC or PCT. This relationship is represented in Table 18. The biodiversity risk weighting is applied by the Credit Calculator to each vegetation zone based on the site survey data collected by the assessor in Stage 1 of the BAM, and the impact assessment outcomes determined by the assessor in Stage 2.
Table 18: Application of the biodiversity risk weighting – ecosystem credits
Sensitivity to gain – ecosystem credit species
(based on the species with the highest sensitivity impacted by the development, or biodiversity certification
Sensitivity to loss – ecological communities and
PCTs
Very high sensitivity
(x’s 3)
High sensitivity (x’s 2)
Medium sensitivity (x’s 1.5)
Low sensitivity (x’s 1)
CEEC or a PCT ≥90% cleared
Very high sensitivity (3)
3 2.5 2.25 2.0
EEC or a PCT ≥70% – <90%
cleared High sensitivity (2)
2.5 2.0 1.75 1.5
VEC or a PCT ≥50% – <70%
cleared Moderate
sensitivity (1.5)
2.25 1.75 1.5 1.25
PCT <50% cleared Low sensitivity
(x’1) 2.0 1.5 1.25 1
A PCT or TEC that does not provide habitat for threatened species assessed for ecosystem credits has a sensitivity to gain value of 1 to determine the biodiversity risk weighting. The biodiversity risk weighting for determining the credit requirement for species credits is based on the sensitivity to loss and the sensitivity to gain for the species. This relationship is represented in Table 19. The biodiversity risk weighting is applied by the Credit Calculator to

98 Biodiversity Assessment Method
area of impact for the species-based site survey data collected by the assessor in Stage 1 of the BAM, and the impact assessment outcomes determined by the assessor in Stage 2.
Table 19: Application of the biodiversity risk weighting – species credits
Sensitivity to potential gain
Sensitivity to loss Very high High Moderate Low
Very high – critically endangered or very high sensitivity to loss
3 3 3 2
High – endangered or high sensitivity to loss
3 2 2 1.5
Moderate –vulnerable or moderate sensitivity to loss
3 2 1.5 1
The criteria used to determine the sensitivity to loss class for a threatened entity is set out in Table 20. The criteria used to determine the sensitivity to gain class for a threatened entity is set out in Table 21.
Table 20: Sensitivity to loss class – threatened species, ecological communities and PCTs
Sensitivity to loss class
Sensitivity to loss assessment criteria7
Very high – critically endangered or very high sensitivity to loss
Species that have a very high sensitivity to loss:
a) are listed under the BC Act as critically endangered, or b) are listed under the EPBC Act as critically endangered, or c) are species with a very highly restricted geographic distribution, or d) are species with a very small population size, or e) are species with a very high rate of decline
Threatened ecological communities that have a very high sensitivity to loss:
a) are listed under the BC Act as critically endangered, or b) are ecological communities with a very highly restricted geographic
distribution, or c) are ecological communities with a very small population, or d) are an ecological communities with a very high rate of decline
Plant community types that have a very high sensitivity to loss are those with a percent cleared value ≥90%
7 Detailed information on the criteria used to make these assessments are in Guidance to assist a decision-maker to determine a serious and irreversible impact

Appendix 7: Biodiversity risk weighting 99
Sensitivity to loss class
Sensitivity to loss assessment criteria7
High – endangered or high sensitivity to loss
Species that have a high sensitivity to loss:
a) are listed under the BC Act as endangered, or
b) are listed under the EPBC Act as endangered, or
c) are species with a highly restricted geographic distribution, or
d) are species with a small population, or
e) are species with a high rate of decline
Threatened ecological communities that have a high sensitivity to loss:
a) are listed under the BC Act as endangered, or
b) are ecological communities with a highly restricted geographic distribution, or
c) are ecological communities with a small population, or
d) are ecological communities with a high rate of decline
Plant community types that have a high sensitivity to loss are those with a percent cleared value ≥70% and less than 90%
Moderate –vulnerable or moderate sensitivity to loss
Species that have a moderate sensitivity to loss:
a) are listed under the BC Act as vulnerable, or
b) are listed under the EPBC Act as vulnerable, or
c) are species with a restricted geographic distribution, or
d) are species with a moderately small population size, or
e) are species with a moderate rate of decline
Threatened ecological communities that have a moderate sensitivity to loss:
a) are listed under the BC Act as vulnerable, or b) are ecological communities with a restricted geographic distribution, or c) are ecological communities with a moderately small population size, or d) are ecological communities with a moderate rate of decline
Plant community types that have a moderate sensitivity to loss are those with a percent cleared value ≥50% and less than 70%
Low – low sensitivity to loss
Plant community types that have a low sensitivity to loss are those with a percent cleared value less than 50%

100 Biodiversity Assessment Method
Table 21: Sensitivity to gain class – threatened species
Sensitivity to gain class
Sensitivity to gain assessment criteria
Very high
Flora and fauna species that have a very high sensitivity to gain are those:
a) for which effectiveness of management in controlling threats is not possible or threats are beyond control. The species’ life history traits and/or ecology is known; however the ability to control key threats at the site-scale is negligible, or
b) that are dependent on habitat attributes that are non-responding to management, e.g. caves for roosting/breeding habitat, or
c) that are flora species with very restricted recruitment, being primarily sterile or clonal
High – the species is highly sensitive to gain
Flora and fauna species that have a high sensitivity to gain are those for which the effectiveness of management in controlling threats is limited and/or where their ecology or response to management is poorly known
Fauna species that have a high sensitivity to gain are those:
a) that are dependent on habitat attributes (very slow-developing attributes)
b) whose ability to colonise improved habitat is limited (disperse <100m and/or specific dispersal corridor or vector requirements)
c) whose fecundity in terms of average number of offspring is low (<1 per year)
d) whose fecundity in terms of age at which females first produce is low (age is >4years)
Flora species with a high sensitivity to gain are those whose:
a) recruitment strategy is significant (re-sprouts and occasionally sets seeds)
b) recruitment in terms of age at first flowering is significant (>10years) c) recruitment in terms of seed production is significant (<50 viable
seeds) d) ability to colonise improved habitat is limited (can only disperse near
the adult plant) e) ability to withstand temporary poor environmental conditions is limited
due to lifespan (<1 year) f) ability to withstand temporary poor environmental conditions is limited
due to seedbank (transient canopy seedbank 0–2 years)
Moderate – the species has a moderate sensitivity to gain
Species that have a moderate sensitivity to gain are those for which the effectiveness of management in controlling threats is moderate
Fauna species that have a moderate sensitivity to gain are those:
a) that are dependent on habitat attributes (slow-developing attributes) b) whose ability to colonise improved habitat is moderate c) whose fecundity in terms of average number of offspring is moderate
(1–3 per year) d) whose fecundity in terms of age at which females first produce is
moderate (age is 2–4years) e) that are a high order predator

Appendix 7: Biodiversity risk weighting 101
Sensitivity to gain class
Sensitivity to gain assessment criteria
Flora species that have a moderate sensitivity gain are those whose:
a) recruitment strategy is moderate (re-sprouts and sets seeds) b) recruitment in terms of age at first flowering is moderate (5–10 years) c) recruitment in terms of seed production is moderate (100s of viable
seeds) d) ability to colonise improved habitat is moderate (disperse beyond the
adult plant but within the population) e) ability to withstand temporary poor environmental conditions is
moderate due to lifespan (1–5 years) f) ability to withstand temporary poor environmental conditions is
moderate due to seedbank (transient soil seedbank 0–2 years)
Low
Species that have a low sensitivity to gain are those for which the effectiveness of management in controlling threats is good
Fauna species that have a low sensitivity to gain are those:
a) that are not dependent on habitat attributes (no) b) whose ability to colonise improved habitat is good (disperse >10km) c) whose fecundity in terms of average number of offspring is high (>3
per year) d) whose fecundity in terms of age at which females first produce is high
(age is <2 years)
Flora species that have a low sensitivity to gain are those whose:
a) recruitment strategy is few (primarily sets seeds) b) recruitment in terms of age at first flowering is few (<5 years) c) recruitment in terms of seed production is few (1000s of viable seeds) d) ability to colonise improved habitat is good (disperse near the adult
plant) e) ability to withstand temporary poor environmental conditions is good
due to lifespan (>5 years)

102 Biodiversity Assessment Method
Appendix 8: Intrinsic rate of increase for richness, cover and function attributes
The intrinsic rate of increase (ir) is an estimate of the rate of gain for each attribute at a biodiversity stewardship site from actions undertaken as part of the management plan. The intrinsic rate of increase is used to determine the likelihood of that attribute reaching benchmark over a defined 20-year timeframe in which gain is estimated.
Table 22: Intrinsic rate of increase for treed formations
Attribute Intrinsic rate of increase per formation (treed)
COMPOSITION
Tree composition 0.05 Shrub composition 0.04 Grass & grass-like composition 0.05 Forb composition 0.03 Fern composition 0.04
STRUCTURE
Tree cover 0.06 Shrub cover 0.085 Grass & grass-like cover 0.125 Forb cover 0.08 Fern cover 0.06
FUNCTION
Number of large trees 0 Litter cover 0.07
Coarse woody debris# 0.08, 0.05, 0 # Coarse woody debris takes a value of 0.08 if large trees are present, if no large trees but other trees are present (any tree stems recorded) 0.05, otherwise 0.
The intrinsic rate of increase for non-treed formations includes PCTs in the grasslands, freshwater wetlands, arid shrublands, alpine complex and saline wetlands formations. The intrinsic rate of increase for non-treed formations will also apply to PCTs in the heath formation from the following vegetation classes:
• Coastal Headland Heaths • Southern Montane Heaths, and • South Coast Heaths.
Table 23: Intrinsic rate of increase in cover for non-treed formations
Attribute Intrinsic rate of increase per formation (non-treed)
COMPOSITION
Tree composition 0.05 Shrub composition 0.04 Grass & grass-like composition 0.05 Forb composition 0.03 Fern composition 0.04

Appendix 8: Intrinsic rate of increase for richness, cover and function attributes 103
Attribute Intrinsic rate of increase per formation (non-treed)
STRUCTURE
Tree cover 0.06 Shrub cover 0.085 Grass & grass-like cover 0.125 Forb cover 0.08 Fern cover 0.06

104 Biodiversity Assessment Method
Appendix 9: Guidelines for assessing the future value of attributes used to assess composition, structure and function at a biodiversity stewardship site
Probability of reaching benchmark for composition and structure The probability of reaching benchmark conditions is estimated over the specified timeframe (20 years) and used to derive a future value for each attribute. These probabilities vary depending on the attribute, vegetation formation, landscape vegetation cover, the abundance of high threat exotic vegetation and the likely outcome from management actions (see below). With the exception of regeneration, each structural and compositional attribute is assumed to have a vegetation formation specific intrinsic rate of increase (ir). Differences in the intrinsic rate of increase will provide different probabilities of reaching benchmark condition within any given timeframe (Figure 3). For example, many structural attributes are assumed to have high initial rates of increase while others such as species richness are likely to have very delayed and slow responses. The likely response is also assumed to be a function of starting condition. Sites in low condition are assumed to have delayed rates of increase, while those in moderate condition could improve relatively rapidly. Sites very close to benchmark conditions are also expected to improve more slowly. These patterns are approximated by a logistic probability function (Figure 3).
Figure 3: Hypothetical curves illustrating how the probability of reaching benchmark conditions might vary for different vegetation attributes
Rate of increase for composition The rate of gain for growth form groups used to assess composition attributes is calculated using Equation 29.

Appendix 9: Guidelines for assessing the future value of attributes at a biodiversity stewardship site 105
Equation 29: Determine the intrinsic rate of increase for growth form groups used to assess composition
𝑎𝑎 = (𝑐𝑐𝑎𝑎𝑖𝑖𝑥𝑥𝑃𝑃𝐸𝐸𝑥𝑥𝐸𝐸𝐵𝐵𝑥𝑥𝑃𝑃𝐵𝐵) where:
iri = estimated intrinsic rate of increase for the ith habitat attribute
PE = probability of new plant establishment as a function of landscape vegetation cover (see Equation 31)
ER = probability modifier based on the % cover of high threat exotic weeds estimated from Equation 32 below
PR = probability modifier based on the current vegetation integrity score for a vegetation zone from Equation 33 below
Rate of increase for structure On a biodiversity stewardship site the rate of gain for growth form groups used to assess structure is calculated using Equation 30.
Equation 30: Determine the intrinsic rate of increase for growth form groups from active management
𝑎𝑎 = (𝑐𝑐𝑎𝑎𝑖𝑖 𝑥𝑥 𝐸𝐸𝐵𝐵 𝑥𝑥 𝑃𝑃𝐸𝐸 𝑥𝑥 𝑃𝑃𝐵𝐵) where:
iri = estimated intrinsic rate of increase for the ith habitat attribute
ER = probability modifier based on the % cover of high threat exotic weeds estimated from Equation 32 below
PE = probability modifier based on landscape vegetation cover (see Equation 31)
PR = probability modifier based on site resilience from Equation 33 below
Assessing extant native vegetation cover and increase in species richness and plant cover The BAM assesses the probability that a flora species can disperse into and establish at a biodiversity stewardship site and therefore increase the composition and cover of a growth form group. The model assumes that the likelihood that new plants will establish is based on a sigmoidal logistic curve with a threshold response at 40% vegetation cover determined in accordance with Equation 31 (Figure 4).
Equation 31: Assessing the impact of native vegetation cover on the intrinsic rate of increase
𝑃𝑃𝐸𝐸 =1
1 + 𝑎𝑎𝛽𝛽−𝑣𝑣𝜀𝜀
where:
PE = probability that new plants will disperse to and establish at the biodiversity stewardship site at the intrinsic rate of increase expected in intact vegetation
β = a constant to describe threshold behaviour in response to habitat loss
v = native vegetation cover in the landscape determined in Subsection 4.3.2
ε = a constant that describes the slope or rate of decline probabilities of dispersal and establishment

106 Biodiversity Assessment Method
Figure 4 shows the default relationship between PE and habitat cover (v), where β = 3.2 and ε = 8. Such a relationship assumes that the likelihood of plant establishment declines slowly with increasing habitat loss until a threshold level of approximately 40% at which point processes that lead to plant establishment are dramatically reduced.
Figure 4: Modifier for the intrinsic rate of increase in habitat attributes
The modifier is based on theoretical estimates of how vegetation cover in the surrounding landscape modifies average probabilities of plant migration. Theory suggests that threshold behaviour could be expected.
Assessing the impact of high threat exotic vegetation cover on the intrinsic rate of increase Exotic plants, particularly high threat perennial species, can significantly reduce the ability to improve the vegetation integrity and habitat suitability at a biodiversity stewardship site. The probability that most vegetation attributes will improve at the base intrinsic rate of increase is expected to decline as the cover of high threat exotic vegetation increases. The probability that growth form groups and function attributes that occur in the ground layer will increase at the predicted intrinsic rate is expected to approach zero when high threat exotic vegetation cover dominates plant cover, and 100% and one when high threat exotic vegetation is absent. Between these two values the effect of high threat exotic vegetation cover on the intrinsic rate of increase is determined using a sigmoidal decay function according to Equation 32. This means that intrinsic rate of increase will slow as the percentage of high threat exotic vegetation cover increases (Figure 5).
0
0.1
0.2
0.3
0.4
0.5
0.6
0.7
0.8
0.9
1
0 10 20 30 40 50 60 70 80 90 100
PE (p
roba
bilit
y of
pla
nt e
stab
lishm
ent)
% Native Vegetation

Appendix 9: Guidelines for assessing the future value of attributes at a biodiversity stewardship site 107
Equation 32: Determining the impact of high threat exotic vegetation cover on the intrinsic rate of increase
𝐸𝐸𝐵𝐵 = 𝑎𝑎((𝑥𝑥/𝑤𝑤)1.7×−ln2) where:
ER = the effect of exotic vegetation on the intrinsic rate of increase ir
x = the average observed value for cover of high threat exotic vegetation in the vegetation zone at time = 0
w = a constant that varies according to the vegetation attribute (see Table 24)
Figure 5: Curve specified in Equation 32 to describe the effect of high threat exotic plants on rates of gain in habitat attributes
Table 24: Values for w (Equation 32) and c (Equation 33)
Attribute W (constant) C (constant)
STRUCTURE
Tree cover NA 3.5
Shrub cover 25 3.5
Grass & grass-like cover 20 3.5
Forb cover 20 3.5
Fern cover 20 3.5
Other cover Does not apply Does not apply
0
0.1
0.2
0.3
0.4
0.5
0.6
0.7
0.8
0.9
1
0 10 20 30 40 50 60 70 80 90 100
High
thre
at e
xotic
effe
ct (E
R)
Cover of High Threat Exotics (%)

108 Biodiversity Assessment Method
Attribute W (constant) C (constant)
RICHNESS
Tree richness 30 3.5
Shrub richness 25 4
Grass & grass-like richness 20 3.5
Forb richness 15 4
Fern richness 20 4
Other richness Does not apply Does not apply
FUNCTION
Number of large trees Does not apply Does not apply
Litter cover Does not apply Does not apply
Length of logs Does not apply 3.5
Regeneration Does not apply Does not apply
Stem size class Does not apply Does not apply
Site resilience Areas of vegetation with high integrity scores at the beginning of the management period are assumed to be more resilient and have greater likelihoods of recovery. In these circumstances, key ecological processes are thought to be relatively intact and will favour recovery. Soil seed banks, soil nutrients, soil structure and soil microbial composition are assumed to be more intact. Processes such as pollination are also relatively intact. Vegetation with low condition is expected to have a modified pollinator fauna, modified soil seed banks, soil nutrient levels, soil microbial composition and soil structure. Recovery without active intervention (modification to soils, weed competition, seed and plant addition) is highly uncertain in such situations. The probability of a biodiversity stewardship site recovering at the maximum rate is expected to be highest in areas with vegetation integrity score >75, but declines rapidly below scores of approximately 40–50. This is approximated by Equation 33.
Equation 33: Probability of a biodiversity stewardship site recovering at the maximum rate
𝑃𝑃𝐵𝐵 =1
1 + 𝑎𝑎𝑐𝑐−𝑉𝑉𝑉𝑉10
where:
PR = probability of natural recovery from existing soil seed banks and locally dispersed seed based on the underlying site resilience
VI = total geometric mean vegetation integrity score at t=0
C = a constant that varies according to the vegetation attribute (see Table 24)
Areas of vegetation with low vegetation integrity are more likely to be those with less resilience (e.g. higher soil nutrients, greater weed seed bank, lower diversity of soil mycorrhiza) and hence poorer establishment success. High threat exotic vegetation will also reduce likelihoods of success. The shape of this modifier is shown in Figure 6.

Appendix 9: Guidelines for assessing the future value of attributes at a biodiversity stewardship site 109
Figure 6: Modifier to account for vegetation integrity (site resilience) at different levels of high threat exotic cover
Functional attributes
Number of large trees There is not expected to be any increase in the number of large trees within the 20-year management timeframe. Tree growth rates are expected to follow a logistic relationship with little likelihood of new large trees being added to the site (likelihood assumed to be effectively zero within 20 years).
Litter cover The gain in litter cover is estimated using ir as rates of litter accumulation are not assumed to be modified by high threat weed cover, site resilience or landscape native vegetation cover.
Regeneration Where regeneration is present in a vegetation zone at the start of the management period, the BAM will assume that the biodiversity stewardship site will continue to support regeneration over the 20-year management timeframe. The probability of regeneration is estimated to be a function of the presence of stem size classes >20cm DBH, the presence of exotic high threat weed cover and current site vegetation integrity score. The BAM assumes that when high threat exotic vegetation is <15% cover, vegetation integrity is >50 and stem size classes >20cm DBH are present, then the probability of a successful regeneration event in any 5-year period is at maximum (i.e. 25% of successive 5-year periods produce regeneration).
0
0.1
0.2
0.3
0.4
0.5
0.6
0.7
0.8
0.9
1
0 20 40 60 80 100
Rest
orat
ion
Prob
abili
ty
Vegetation Integrity Score
0% 15%
33% 66%
High threat exotic cover

110 Biodiversity Assessment Method
The probability of regeneration is low when stem size classes >20cm DBH are absent or very low (<0.01), even in vegetation with high vegetation integrity and low high threat weed abundance. When the vegetation integrity score is <20 and high threat weed cover is >33%, likelihoods of regeneration are also low (<0.05) even when seed producing trees are present. The predicted probabilities for regeneration occurring are approximated by the logistic probability from Equation 31. The actual probability of at least one successful regeneration event occurring over the 20-year management timeframe is therefore estimated as the binomial probabilities of at least one in 16 years producing a germination event followed by survival of subsequent seedlings to five years of age (possible germinants after year 16 are unable to reach an adequate size to be included as successful regeneration). Under the BAM, a biodiversity stewardship site is predicted to be likely to have regeneration present when P(R) is greater than 0.9 when stems >20cm DBH are present and cover of high threat exotic vegetation is low. This means that the probability of a successful regeneration event during the 20-year management timeframe is greater than 90%. Under the BAM, a biodiversity stewardship site is predicted to have no regeneration in a 20-year period when stems >20cm DBH are absent. The probability of successful regeneration when stems >20cm DBH are present reduces as the cover of high threat exotic vegetation increases, as shown in Figure 7.
Figure 7: Cumulative likelihoods of a successful regeneration event P(R) over a 20-year management timeframe
Figure 7 shows cumulative likelihoods of a successful regeneration event P(R) over a 20-year management timeframe when seed producing trees are present (A) and absent (B) in vegetation with varying high threat exotic plant cover and vegetation integrity scores. Likelihoods of regeneration are predicted to be greatest when high threat exotic vegetation is absent and vegetation integrity is >30.

Appendix 9: Guidelines for assessing the future value of attributes at a biodiversity stewardship site 111
Equation 34: Probability of regeneration occurring in a successive 5-year period at a biodiversity stewardship site
𝑃𝑃𝐵𝐵 =0.25
1 + 𝑎𝑎(6+6𝑥𝑥− 𝑉𝑉𝑉𝑉𝛼𝛼+6𝑥𝑥)
where:
PR = probability of regeneration in a successive 5-year period
VI = total geometric mean vegetation integrity score at t=0
x = proportional cover of high threat exotic vegetation
α = constant that varies dependent on whether seed producing trees are present (α=6) or absent (α=20)
Equation 35: Probability of regeneration occurring at a biodiversity stewardship site
P(𝐵𝐵) = 1 − (1 − 𝑈𝑈)16 where:
P(R) = the probability of at least one successful regeneration event in 20 years
S = the probability of a successful regeneration event in any successive 5-year period from Equation 34
Stem size class Stem size class is estimated from the number of stem size classes present excluding the <5cm DBH (regeneration) and the large tree class. Changes in stem size class are not assessed as changing at the biodiversity stewardship site. The current score for stem size class is used to determine the future function score.
Length of logs The rate of increase for length of logs is modified by multiplying ir x PR (resilience modifier).
Effect of high threat exotic vegetation on active restoration management actions The high threat weed (HTW) modifier is fixed at 1 for tree richness and tree cover and all functional attributes (i.e. the risk weightings for these attributes are not modified with HTW cover). The HTW modifier is positively correlated with HTW cover for all other attributes according to Equation 36.
Equation 36: Determine the modifier for high threat exotic vegetation
𝐻𝐻𝑃𝑃𝐵𝐵𝑁𝑁 = 𝑎𝑎((𝑥𝑥/60)2.5×−ln2) where:
HTWm = the effect of exotic vegetation on the intrinsic rate of increase ir
x = the average observed value for cover of high threat exotic vegetation in the vegetation zone at time = 0

112 Biodiversity Assessment Method
Figure 8: Relationship between the cover of high threat exotic vegetation (HTW) and the modifier used to calculate the maximum allowable active restoration gains

Appendix 10: Requirements for a BDAR or BCAR – major projects & strategic biodiversity certification proposals 113
Appendix 10: Requirements for a Biodiversity Development Assessment Report (major projects) and a Biodiversity Certification Assessment Report (strategic biodiversity certification proposals)
There are three stages to the BAM: Stage 1 – Biodiversity assessment Stage 2 – Impact assessment Stage 3 – Improving biodiversity values The Biodiversity Development Assessment Report (BDAR) and Biodiversity Certification Assessment Report (BCAR) is prepared to document the first two of these three stages and is submitted as part of an application for development (BDAR) or a biodiversity certification proposal (BCAR). The minimum information requirements for the BDAR, depending on its specific purpose, are detailed in the following tables:
• Table 25: Stage 1 Biodiversity Assessment – when part of an application for development or a biodiversity certification proposal
• Table 26: Stage 2 Impact Assessment – when part of an application for development or a biodiversity certification proposal.
Stage 3 of the BAM is included in a Biodiversity Stewardship Site Assessment Report (BSSAR), the requirements for which are detailed in Appendix 11, Table 27.

114 B
iodiversity Assessm
ent Method
Table 25: Minimum information requirements for the Biodiversity Development Assessment Report and the Biodiversity Certification Assessment Report – Stage 1: Biodiversity assessment
Report section Information Maps & data BAM reference
Introduction Introduction to the biodiversity assessment including: • identification of development/biodiversity stewardship site footprint,
including: ○ operational footprint ○ construction footprint indicating clearing associated with
temporary construction facilities and infrastructure • general description of development/biodiversity stewardship site • sources of information used in the assessment, including reports
and spatial data.
• Site Map (as described in Section 4.2)
• Location Map (as described in Section 4.2)
• Digital shape files for all maps and spatial data
Chapters 3 and 4
Landscape features
Identification of landscape features at the development/biodiversity stewardship site, including: • IBRA bioregions and subregions, NSW landscape region and area (ha) • native vegetation extent in the buffer area • cleared areas • evidence to support differences between mapped vegetation extent
and aerial imagery • rivers and streams classified according to stream order • wetlands within, adjacent to and downstream of the site • connectivity features • areas of geological significance and soil hazard features • site context components, including:
○ identification of method applied (i.e. linear or site-based) ○ percent native vegetation cover in the landscape (development
site and biodiversity stewardship site).
• IBRA bioregions and subregions (as described in Paragraphs 4.2.1.3–4.2.1.4)
• NSW landscape regions (as described in Paragraph 4.2.1.5)
• Rivers and streams (as described in Paragraph 4.2.1.6)
• Wetlands (as described in Paragraph 4.2.1.7)
• Connectivity of different areas of habitat (as described in Paragraphs 4.2.1.8–4.2.1.11)
• Areas of geological significance and soil hazard features (as described in Paragraphs 4.2.1.12–4.2.1.15)
• Native vegetation extent (as described in Subsection 4.3.2)
Sections 4.2 and4.3, Appendix 3

Appendix 10: Requirem
ents for a BDAR
/BCAR
(major projects & strategic biodiversity certification proposals) 115
Report section Information Maps & data BAM reference
Native vegetation
Identify native vegetation extent within the development/biodiversity stewardship site, including cleared areas and evidence to support differences between mapped vegetation extent and aerial imagery. Describe PCTs within the development/biodiversity stewardship site, including: • vegetation class • vegetation type • area (ha) for each vegetation type • species relied upon for identification of vegetation type and relative
abundance • justification of evidence used to identify a PCT (as outlined in
Paragraph 5.2.1.12) • TEC status (as outlined in Paragraphs 5.2.1.14–5.2.1.15) • estimate of percent cleared value of PCT(as outlined in Paragraph
5.2.1.16)
Perform a vegetation integrity assessment of the development/biodiversity stewardship site, including: • mapping vegetation zones (Subsection 5.3.1) • patch size (development site and biodiversity stewardship site) • assessing vegetation integrity using benchmark data (Subsection
5.3.3) • survey effort as described in Subsection 5.3.4 (number of plots) • determining the vegetation integrity score (Appendix 6):
○ composition condition score ○ structure condition score ○ function condition score ○ vegetation integrity score.
Where use of local data is proposed: • identify relevant vegetation type • identify source of information for local benchmark data • justify use of local data in preference to database values.
• Map of native vegetation extent within the development/biodiversity stewardship site (as described in Section 5.1)
• Map of PCTs within the development/biodiversity stewardship site (as described in Section 5.2)
• Map of plot locations relative to PCTs
• Map of TECs • Plot field data (MS Excel format) • Plot field data sheets • Patch size of intact native
vegetation (as described in Subsection 5.3.2)
• Table of current vegetation integrity scores for each vegetation zone within the development/biodiversity stewardship site.
Chapter 5 and Appendix 6

116 B
iodiversity Assessm
ent Method
Report section Information Maps & data BAM reference
Threatened species
Identify ecosystem credit species associated with PCTs on both the development site and biodiversity stewardship site as outlined in Section 6.2, including: • list of species derived • justification for exclusion of any ecosystem credit species predicted
above. Identify species credit species on both the development site and the biodiversity stewardship site as outlined in Sections 6.3 to 6.5, including: • list of candidate species • justification for inclusions and exclusions based on habitat features • indication of presence based on targeted survey or expert report • details of targeted survey technique, effort, timing and weather • species polygons • biodiversity risk weighting for the species • threatened species survey • additional requirements for wind farm developments. Where use of local data is proposed: • identify relevant species • identify aspect of species data • identify source of information for local data • justify use of local data in preference to database values. Where expert reports are used in place of targeted survey: • identify the relevant species • justify the use of an expert report • indicate and justify the likelihood of presence of the species and
information considered in making this assessment • estimate the number of individuals or area of habitat (whichever unit
of measurement applies to the species/individual) for the development site or biodiversity stewardship site, including a description of how the estimate was made
• identify the expert and provide evidence of their expert credentials.
• Table of habitats or habitat components and their sensitivity classes
• Table detailing the list of species credit species and presence status on site as determined by targeted survey, indicating also where presence was assumed and/or where presence was determined by expert report
• Species credit species polygons (as described in Paragraph 6.4.1.33)
• Table detailing species and habitat feature/component associated with species and its abundance on site (as described in Paragraph 6.4.1.34)
• Table detailing biodiversity risk weighting for species on site (as described in Section 6.6)
• For wind farm developments: maps of habitual flight paths for nomadic and migratory species likely to fly over the site and maps of likely habitat for threatened aerial species resident on the site
Chapter 6

Appendix 10: Requirem
ents for a BDAR
/BCAR
(major projects & strategic biodiversity certification proposals) 117
Table 26: Minimum information requirements for the BDAR or BCAS (Application for a development consent or biodiversity certification – Stage 2: Impact assessment (biodiversity values))
Report section Information Maps & data BAM reference
Avoid and minimise impacts
Demonstration of efforts to avoid and minimise impact on biodiversity values in accordance with Chapter 8.
Assessment of direct and indirect impacts unable to be avoided at the development site in accordance with Sections 9.1 and 9.2. The assessment would include but not be limited to: type, frequency, intensity, duration and consequence of impact.
For major projects: details of the adaptive management strategy proposed to monitor and respond to impacts on biodiversity values that are uncertain (Section 9.4).
• Table of measures to be implemented before, during and after construction to avoid and minimise the impacts of the project, including action, outcome, timing and responsibility
• Map of final project footprint, including construction and operation
• Maps demonstrating indirect impact zones where applicable
Chapter 8
Impact summary Identification and an assessment of the impacts which are potential serious and irreversible impacts, in accordance with Subsections 10.2.2 for impacts on CEECs and 10.2.3 for threatened species.
Identification of impacts requiring offset in accordance with Section 10.3.
Identification of impacts not requiring offset in accordance with Paragraph 10.3.2.2.
Identification of areas not requiring assessment in accordance with Section 10.4.
• Map showing the location of serious and irreversible impacts
• Map of impacts requiring offset
• Map of impacts not requiring offset
• Map of areas not requiring assessment
Chapter 10
Impact summary Ecosystem credits and species credits that measure the impact of the development on biodiversity values, including: • future vegetation integrity score for each vegetation zone at the development
site (Equations 17 and 18 in Appendix 6) • change in vegetation integrity score (Subsection 9.1.3) • number of required ecosystem credits for the impact of development on each
vegetation zone at a development site (Subsection 11.2.3)
• Table of PCTs requiring offset and the number of ecosystem credits required
• Table of threatened species requiring offset and the number of species credits required
Subsections 11.2.3 and 11.2.4

118 B
iodiversity Assessm
ent Method
Report section Information Maps & data BAM reference • number of required species credits for each threatened species that is
impacted on by development (Subsection 11.2.4). • Submitted proposal in the Credit
Calculator
Biodiversity credit report
Credit classes for ecosystem credits and species credits at the development site.
• Table of credit class and matching credit profile
Subsection 11.3

Appendix 11: R
equirements for a B
iodiversity Stew
ardship Site A
ssessment R
eport 119
Appendix 11: Requirements for a Biodiversity Stewardship Site Assessment Report
Table 27: Minimum information requirements for the Biodiversity Stewardship Site Assessment Report (Application for a biodiversity stewardship agreement – Stage 3: Improving biodiversity values)
Report section Information Maps & data BAM reference
Biodiversity stewardship site identification
Biodiversity stewardship site (s) details, including: • location • general description of biodiversity stewardship site • land-use history • lot and DP numbers.
• Location of biodiversity stewardship site
• Biodiversity stewardship site boundary map
• Cadastral map of biodiversity stewardship site
Improving biodiversity at the biodiversity stewardship site report
Ecosystem credits and species credits created at a biodiversity stewardship site, including: • future vegetation integrity score for each vegetation zone at the biodiversity
stewardship site • preparation of a management plan for the biodiversity stewardship site
(Section 13.2) • management actions to improve biodiversity values (Section 13.3) • change in vegetation integrity score (Section 13.4) • future value of vegetation integrity attributes without management, including
averted loss at the biodiversity stewardship site (Section 13.5) • future value of vegetation integrity attributes with management (Section
13.6) • future vegetation integrity score with management (Equations 25 and 26 in
Appendix 6) • gain in vegetation integrity score for vegetation zones at a biodiversity
stewardship site (Equation 28 in Appendix 6) • number of ecosystem credits created for the improvement in biodiversity
values for each vegetation zone at a biodiversity stewardship site (Section 13.8)
• Table of PCTs at the biodiversity stewardship site and the number of ecosystem credits created
• Table of threatened species at the biodiversity stewardship site and the number of species credits created
• Submitted proposal in the Credit Calculator
Chapter 13

120 B
iodiversity Assessm
ent Method
Report section Information Maps & data BAM reference • number of species credits created for each threatened species that occurs
on the biodiversity stewardship site (Section 13.9) • full disclosure of existing obligations and management actions and the credit
adjustments relating to these (Section 13.11).
Biodiversity credit report
Credit classes for ecosystem credits and species credits (Section 13.10) created at the biodiversity stewardship site.
• Table of credit class and matching credit profile produced by the Credit Calculator
Section 13.10

Appendix 12: R
equirements for a B
DA
R – stream
lined assessment m
odules 121
Appendix 12: Requirements for a Biodiversity Development Assessment Report – streamlined assessment modules
Table 28: Minimum information requirements for the Biodiversity Development Assessment Report – streamlined assessment modules
Report section Information Maps & data BAM reference
Introduction Introduction to the biodiversity assessment including: • identification of development/ footprint, including the operational footprint • general description of development • sources of information used in the assessment, including reports and
spatial data (optional).
• Site Map (as described in Section 4.2)
• Location Map (as described in Section 4.2)
• Digital shape files for all maps and spatial data
Landscape features
Identification of landscape features at the development site including: • IBRA bioregions and subregions • any landscape feature • site context components, including percent native vegetation cover in the
buffer area.
• IBRA bioregions and subregions (as described in Paragraphs 4.2.1.3–4.2.1.4)
Sections 4.2 and 4.3, Appendix 3
Native vegetation
Identify the PCTs within the development site, including: • vegetation class • vegetation type • area (ha) for each PCT • information used to identify a PCT being field assessment or best
available native vegetation map (as outlined in Paragraph 5.2.1.12) • Identify each TEC and area (as outlined in Paragraphs 5.2.1.14–
5.2.1.15) • patch size (development site and biodiversity stewardship site) • table showing the vegetation integrity score for each vegetation zone.
• Map of PCTs within the development /biodiversity stewardship site
• Map of EECs • Table of plot data for each attribute • Patch size of intact native vegetation
(as described in Subsection 5.3.2) • Table of current vegetation integrity
scores for each vegetation zone
Chapter 5

122 B
iodiversity Assessm
ent Method
Report section Information Maps & data BAM reference
Threatened species
Identify ecosystem credit species associated with PCTs on both the development site and biodiversity stewardship site as outlined in Section 6.2, including: • list of species derived • justification for exclusion of any ecosystem credit species predicted
above. Where required, identify species credit species on both the development site and the biodiversity stewardship site as outlined in Sections 6.3 to 6.5, including: • list of candidate species assessed • justification for inclusions and exclusions based on habitat features • indication of presence based on targeted survey or expert report • details of targeted survey • species polygons • biodiversity risk weighting for the species • threatened species survey. Table detailing species and habitat feature/component associated with species and its abundance on site (as described in Paragraph 6.4.1.34 Expert report if it was used in place of targeted survey.
• Table of habitats or habitat components and their sensitivity classes for each species
• Species credit species polygons (as described in Paragraph 6.4.1.33)
Chapter 6
Avoid and minimise impacts
Demonstration of efforts to avoid and minimise impact on biodiversity values in accordance with Section 8. Assessment of direct and indirect impacts unable to be avoided at the development site in accordance with Sections 9.1 and 9.2.
• Table of measures to be implemented before, during and after construction to avoid and minimise the impacts of the project, including action, outcome, timing and responsibility
Chapter 8
Impact summary
Description of the impact on PCTs/TECs Description of the impact on threatened species Table showing for each PCT/TEC for each vegetation zone at the development site: • current vegetation integrity score
• Table of PCTs requiring offset and the number of ecosystem credits required
Subsections 11.2.3 and 11.2.4

Appendix 12: R
equirements for a B
DA
R – stream
lined assessment m
odules 123
Report section Information Maps & data BAM reference • future vegetation integrity score (Equations 17 and 18 in Appendix 6) • change in vegetation integrity score (Subsection 9.1.3) • biodiversity risk weighting • BC Act listing status • number of required ecosystem credits for each PCT (Subsection 11.2.3) • name of each species assessed for species credits and the number of
credits required for species (Subsection 11.2.4).
• Table of threatened species requiring offset and the number of species credits required
Biodiversity credit report
Credit classes for ecosystem credits and species credits at the development site.
• Produced by the BAM Credit Calculator
Section 11.3