Embed Size (px)
Citation preview

BIOE 301
Lecture Eleven
Four Questions
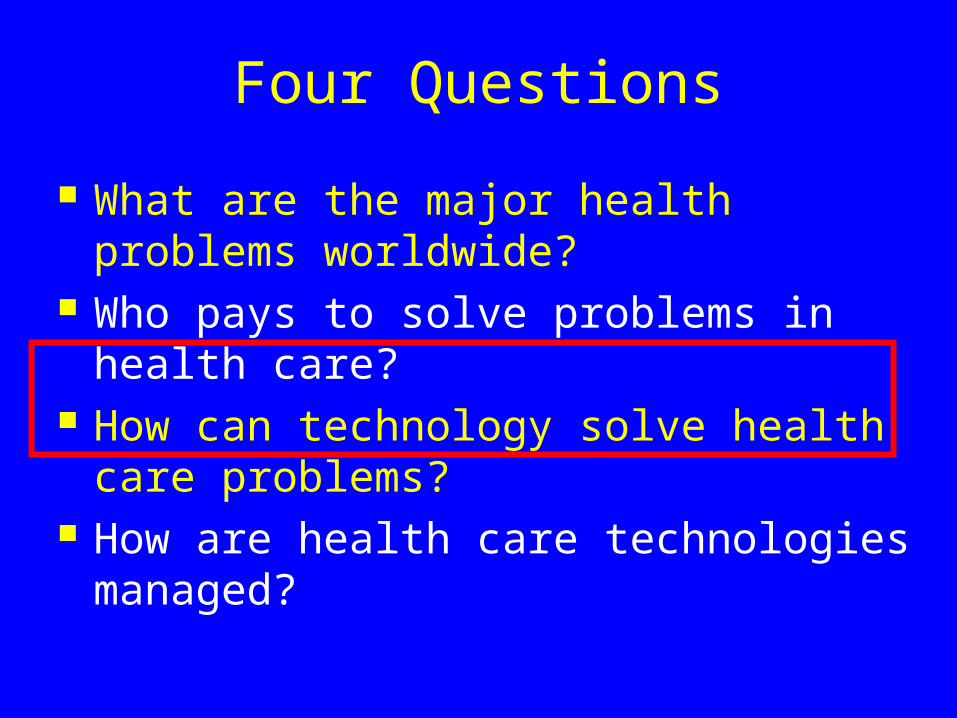
What are the major health problems worldwide?
Who pays to solve problems in health care?
How can technology solve health care problems?
How are health care technologies managed?
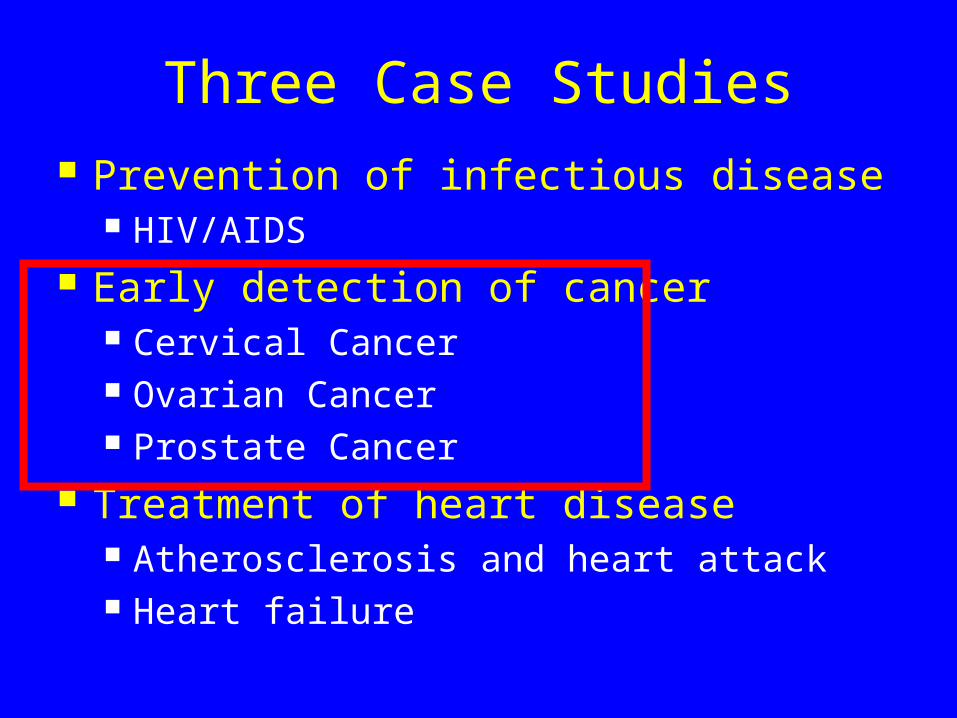
Three Case Studies Prevention of infectious disease
HIV/AIDS Early detection of cancer
Cervical Cancer Ovarian Cancer Prostate Cancer
Treatment of heart disease Atherosclerosis and heart attack Heart failure
Outline
The burden of cancer How does cancer develop? Why is early detection so important? Strategies for early detection Example cancers/technologies
Cervical cancer Ovarian cancer Prostate cancer
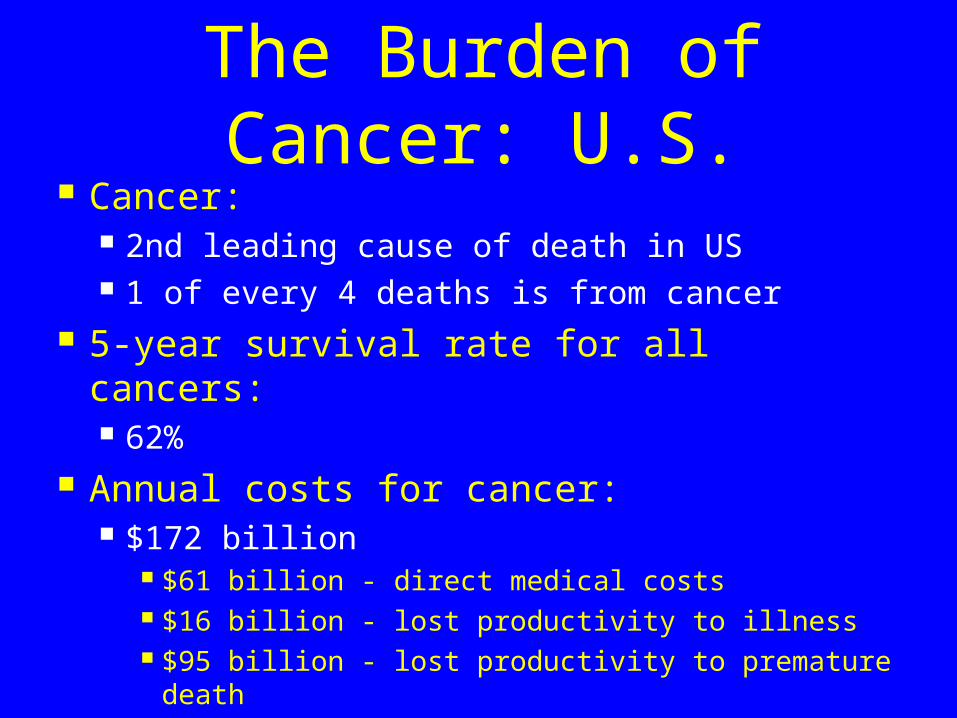
The Burden of Cancer: U.S.
Cancer: 2nd leading cause of death in US 1 of every 4 deaths is from cancer
5-year survival rate for all cancers: 62%
Annual costs for cancer: $172 billion
$61 billion - direct medical costs $16 billion - lost productivity to illness $95 billion - lost productivity to premature
death
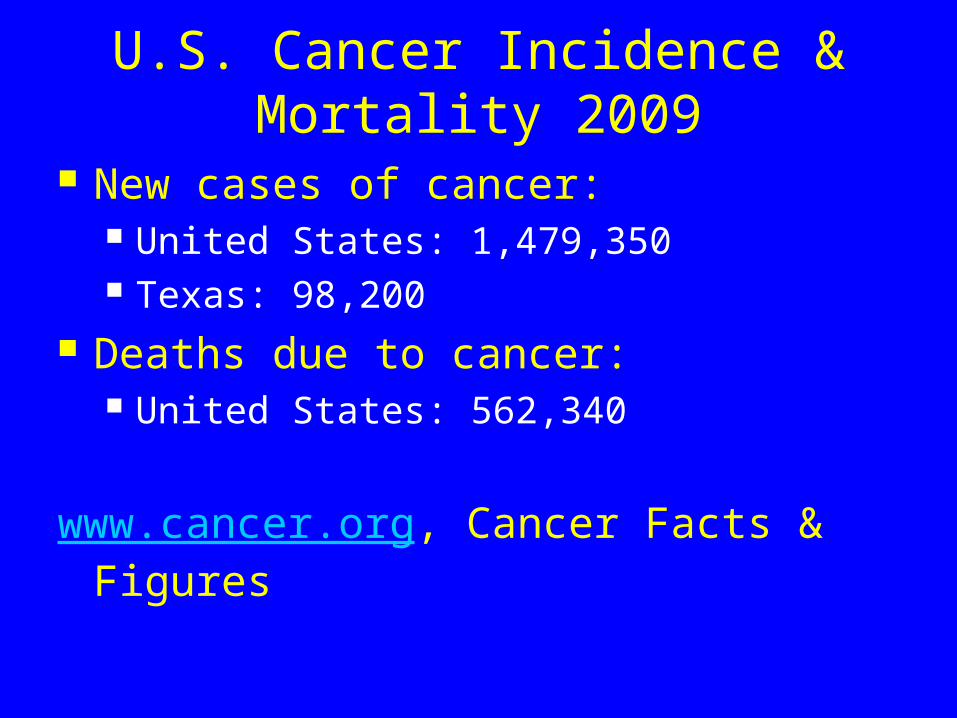
U.S. Cancer Incidence & Mortality 2009
New cases of cancer: United States: 1,479,350 Texas: 98,200
Deaths due to cancer: United States: 562,340
www.cancer.org, Cancer Facts & Figures
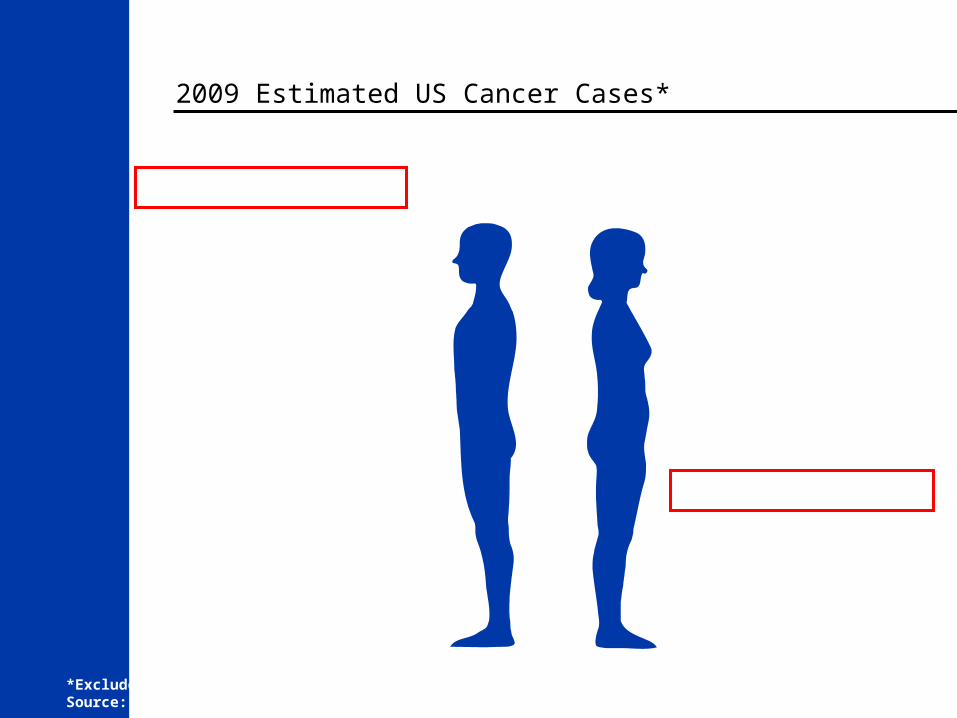
2009 Estimated US Cancer Cases*
*Excludes basal and squamous cell skin cancers and in situ carcinomas except urinary bladder.Source: American Cancer Society, 2009.
Men766,130
Women713,220
27% Breast
14% Lung & bronchus
10% Colon & rectum
6% Uterine corpus
4% Non-Hodgkin lymphoma
4% Melanoma of skin
4% Thyroid
3% Kidney & renal pelvis
3% Ovary
3% Pancreas
20% All Other Sites
Prostate 25%
Lung & bronchus 15%
Colon & rectum 10%
Urinary bladder 7%
Melanoma of skin 5%
Non-Hodgkin lymphoma5%
Kidney & renal pelvis 5%
Leukemia 3%
Oral cavity 3%
Pancreas 3%
All Other Sites 19%
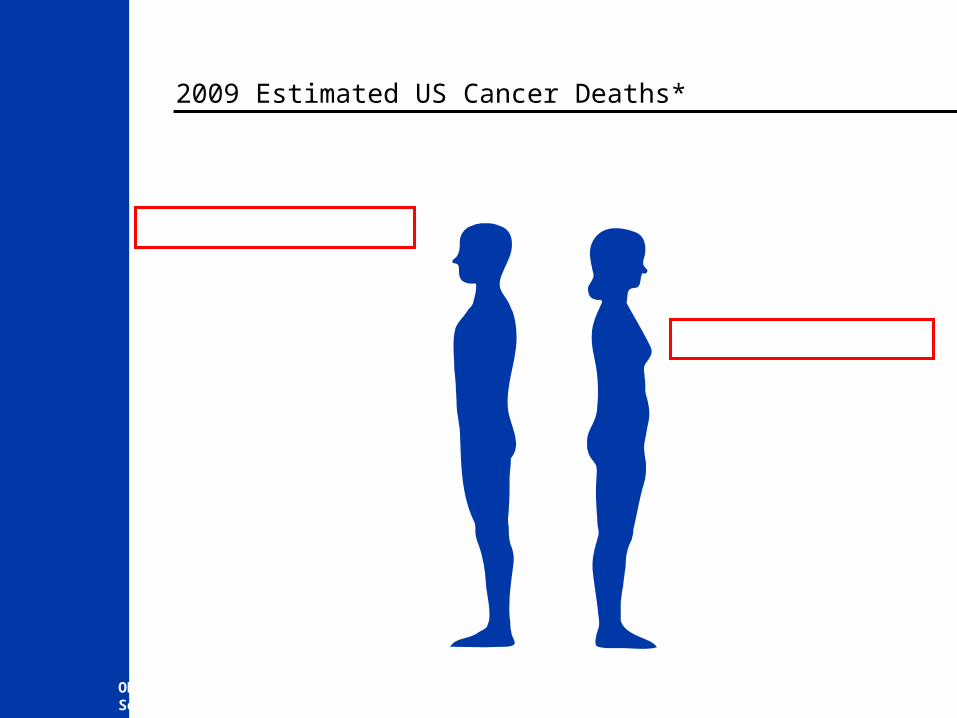
2009 Estimated US Cancer Deaths*
ONS=Other nervous system.Source: American Cancer Society, 2009.
Men292,540
Women269,800
26% Lung & bronchus
15% Breast
9% Colon & rectum
6% Pancreas
5% Ovary
4% Non-Hodgkin lymphoma
3% Leukemia
3% Uterine corpus
2% Liver & intrahepaticbile duct
2% Brain/ONS
25% All other sites
Lung & bronchus 30%
Prostate 9%
Colon & rectum 9%
Pancreas 6%
Leukemia 4%
Liver & intrahepatic 4%bile duct
Esophagus 4%
Urinary bladder 3%
Non-Hodgkin 3%lymphoma
Kidney & renal pelvis 3%
All other sites 25%
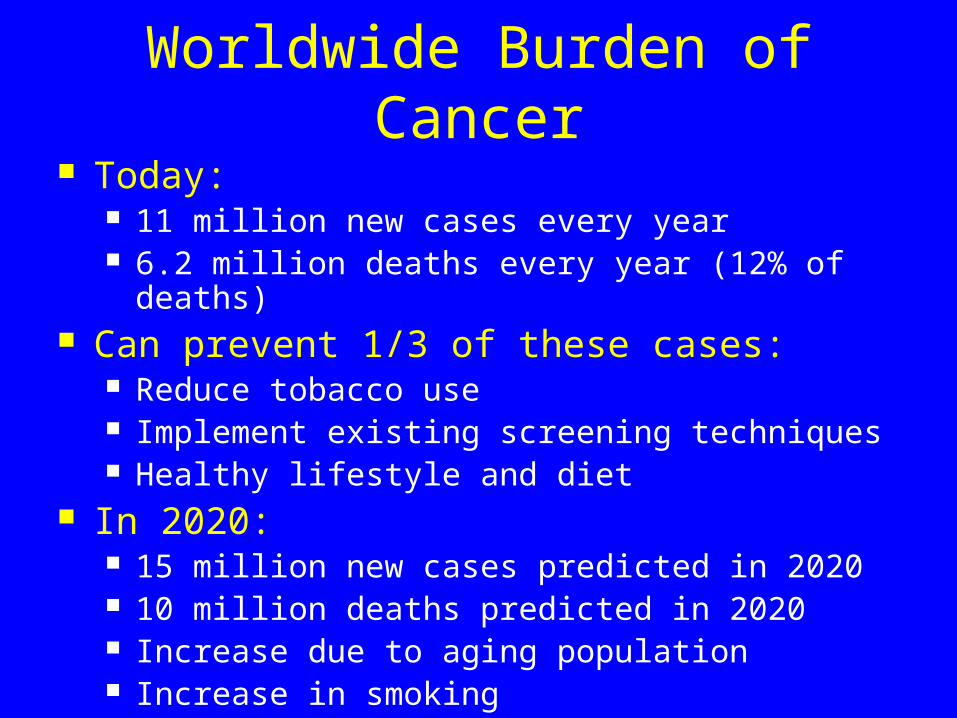
Worldwide Burden of Cancer Today:
11 million new cases every year 6.2 million deaths every year (12% of deaths)
Can prevent 1/3 of these cases: Reduce tobacco use Implement existing screening techniques Healthy lifestyle and diet
In 2020: 15 million new cases predicted in 2020 10 million deaths predicted in 2020 Increase due to aging population Increase in smoking
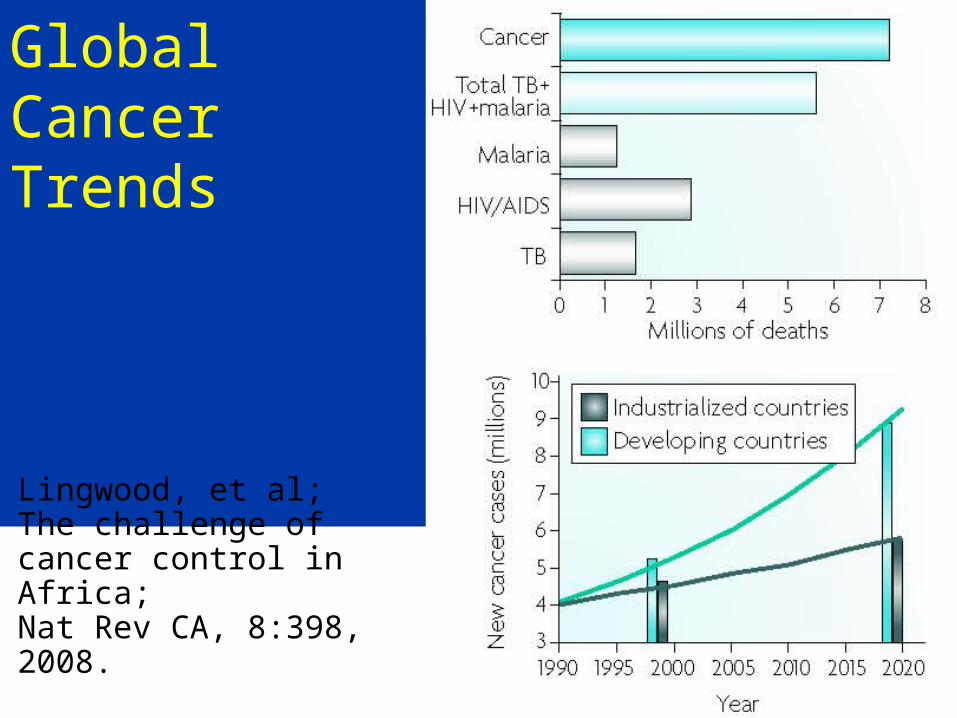
Lingwood, et al;The challenge of cancer control in Africa; Nat Rev CA, 8:398, 2008.
Global Cancer Trends
Worldwide Burden of Cancer
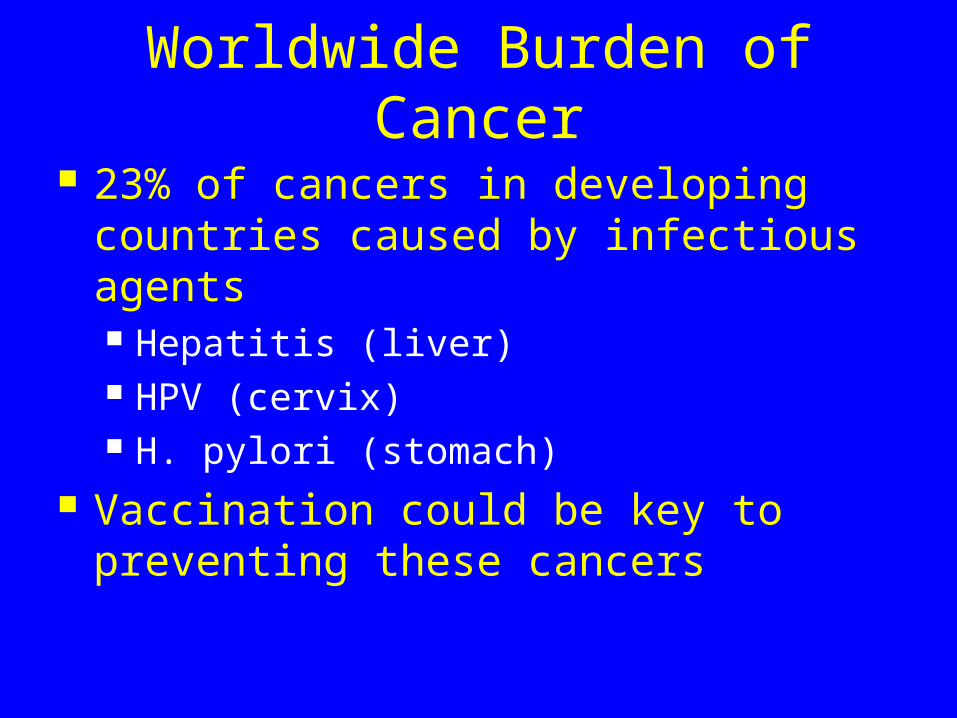
23% of cancers in developing countries caused by infectious agents Hepatitis (liver) HPV (cervix) H. pylori (stomach)
Vaccination could be key to preventing these cancers
What is Cancer?
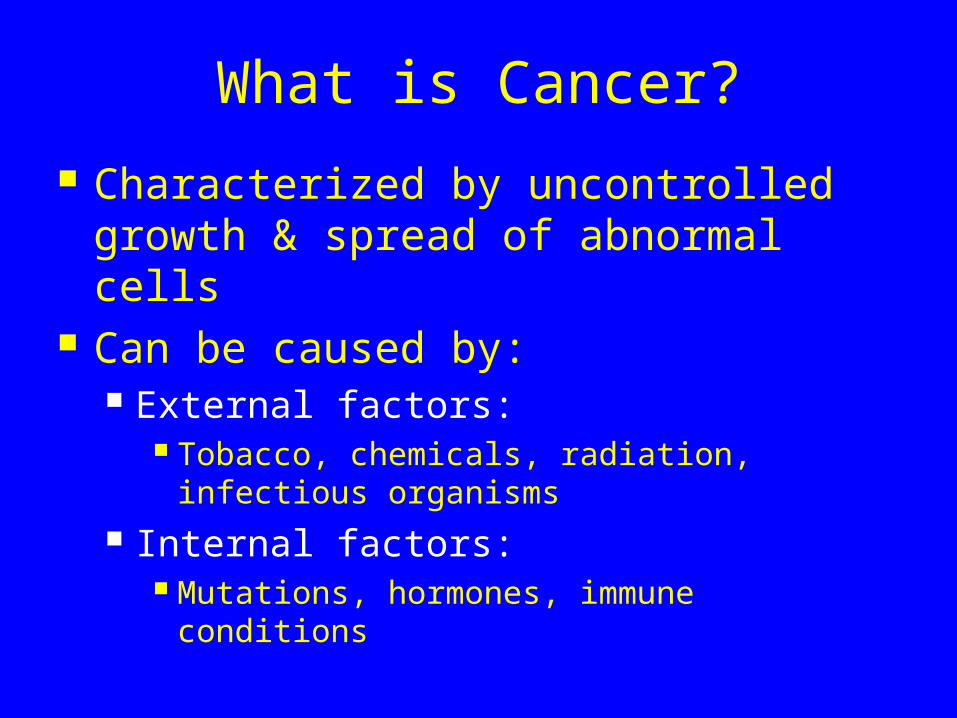
Characterized by uncontrolled growth & spread of abnormal cells
Can be caused by: External factors:
Tobacco, chemicals, radiation, infectious organisms
Internal factors: Mutations, hormones, immune conditions

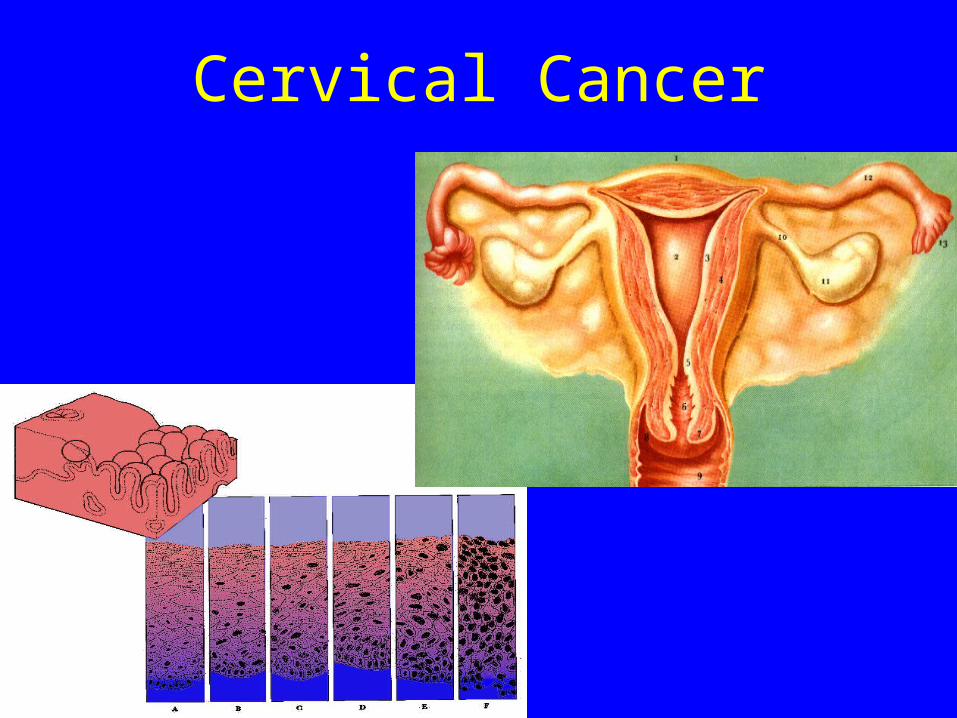
Squamous Epithelial Tissue
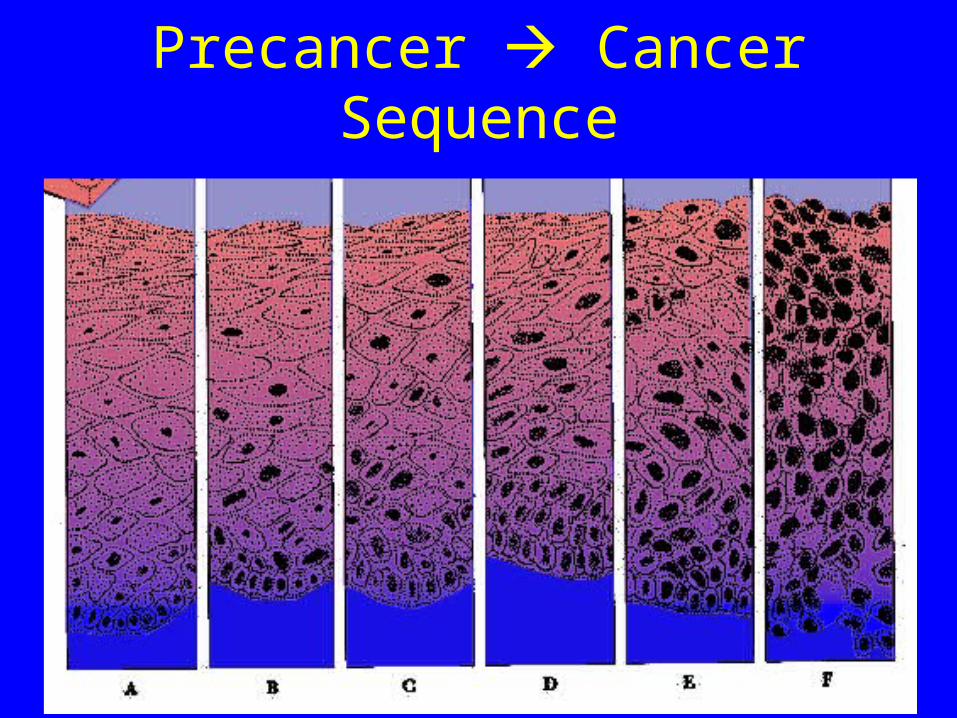
Precancer Cancer Sequence
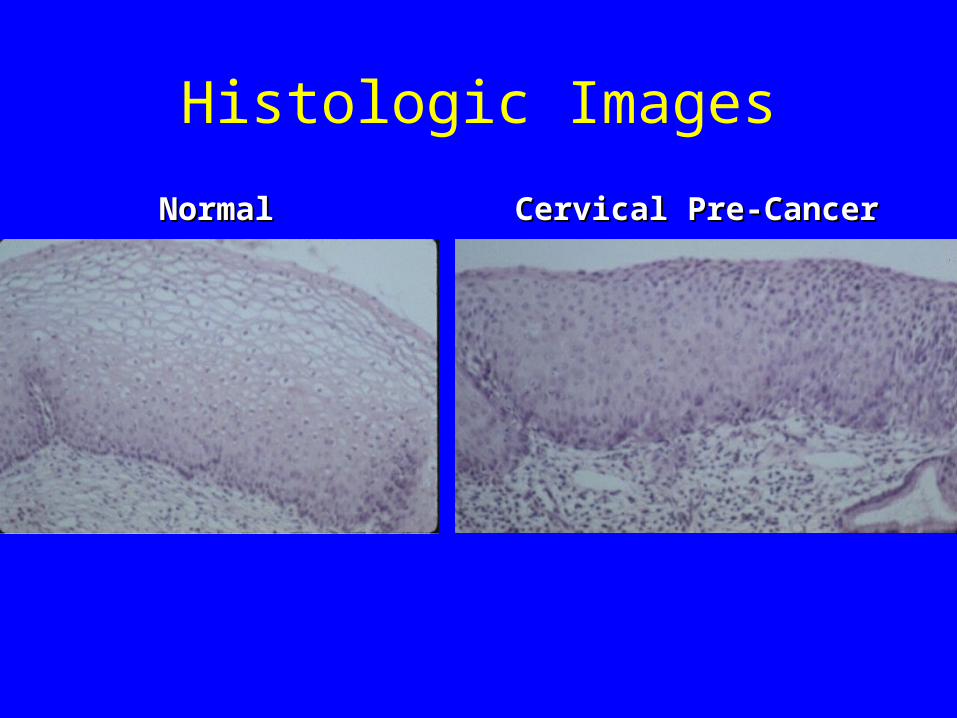
Histologic Images
NormalNormal Cervical Pre-CancerCervical Pre-Cancer

http://www.gcarlson.com/images/metastasis.jpg
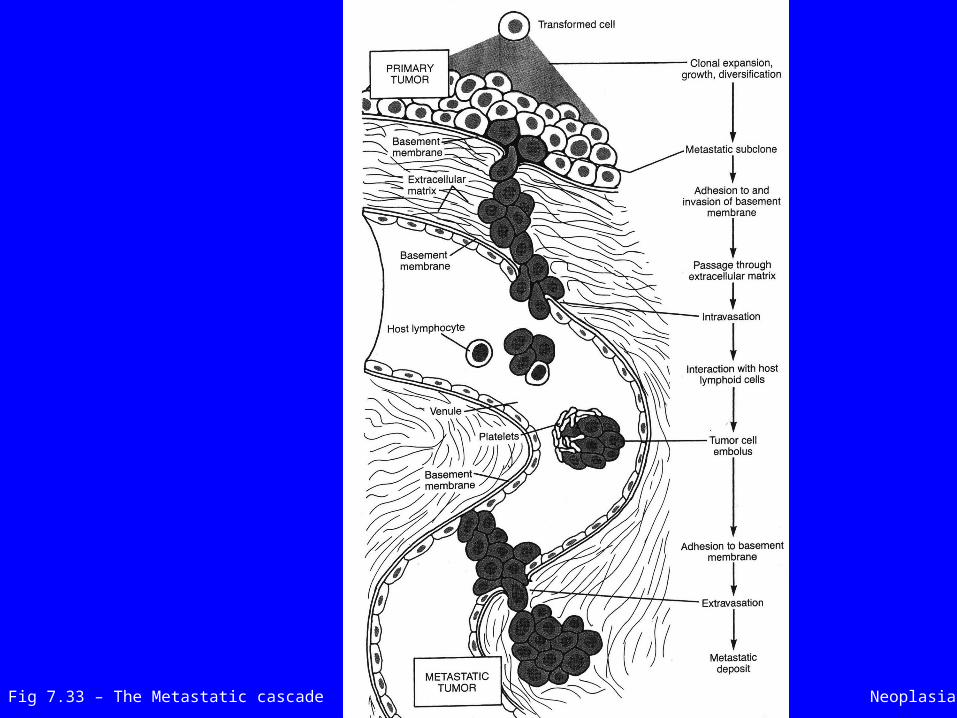
Fig 7.33 – The Metastatic cascade Neoplasia
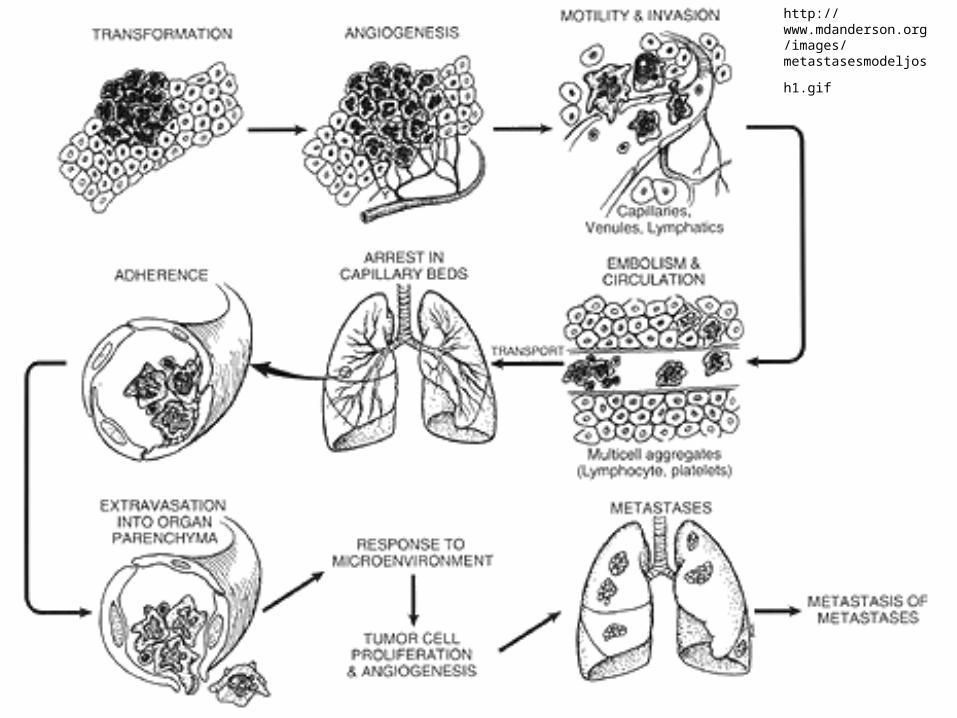
http://www.mdanderson.org/images/metastasesmodeljosh
1.gif
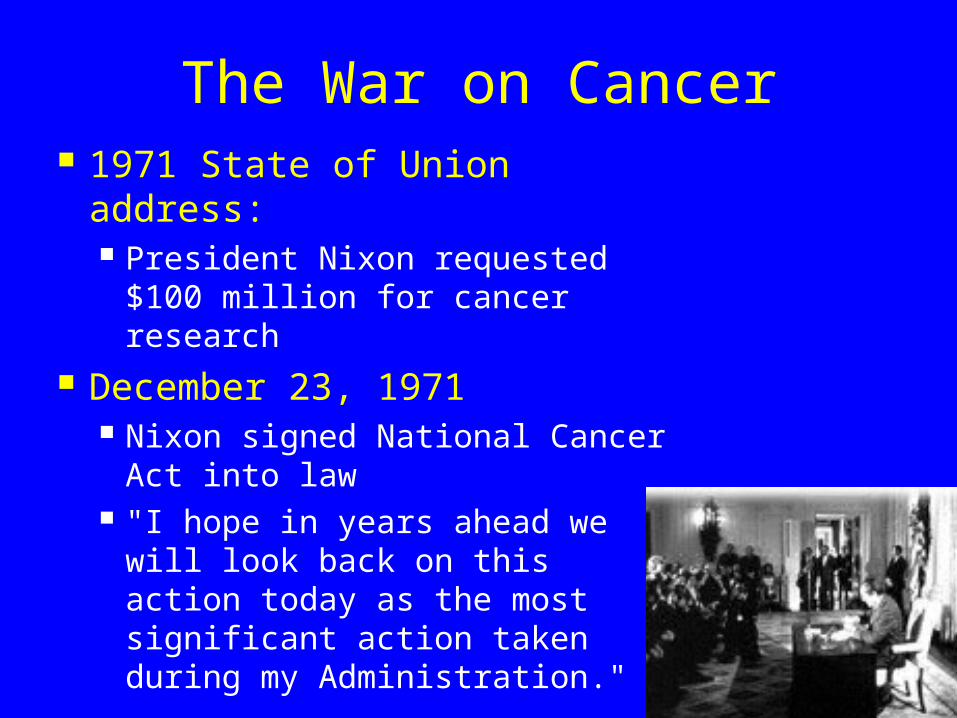
The War on Cancer 1971 State of Union address:
President Nixon requested $100 million for cancer research
December 23, 1971 Nixon signed National Cancer
Act into law "I hope in years ahead we will
look back on this action today as the most significant action taken during my Administration."
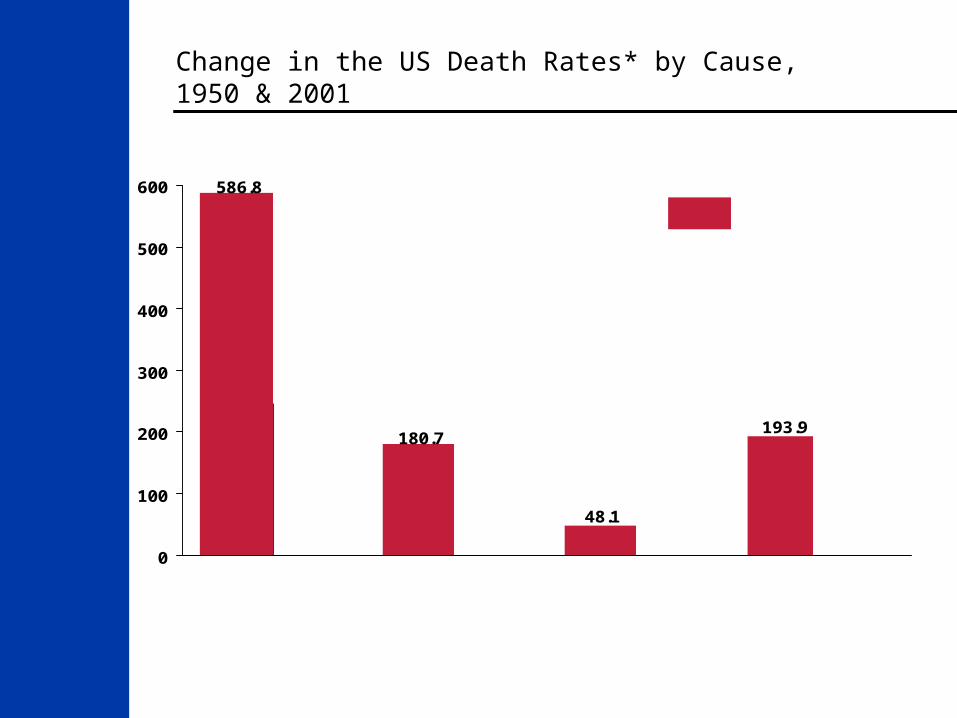
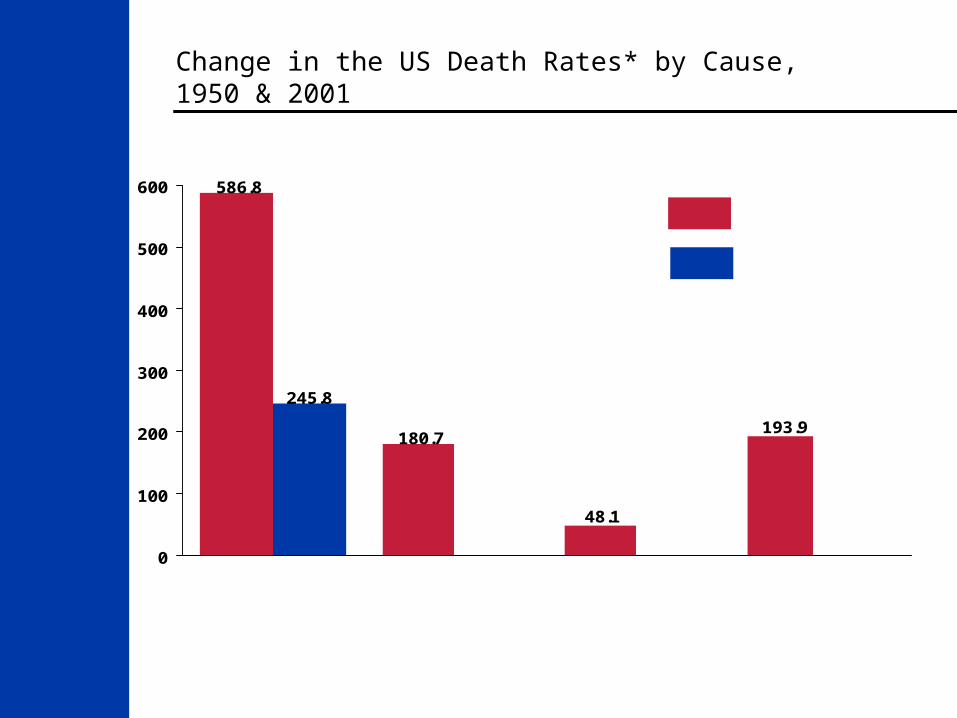
Change in the US Death Rates* by Cause, 1950 & 2001
* Age-adjusted to 2000 US standard population.Sources: 1950 Mortality Data - CDC/NCHS, NVSS, Mortality Revised.2001 Mortality Data–NVSR-Death Final Data 2001–Volume 52, No. 3. http://www.cdc.gov/nchs/data/nvsr/nvsr52/nvsr52_03.pdf
21.8
180.7
48.1
586.8
193.9
57.5
194.4
245.8
0
100
200
300
400
500
600
HeartDiseases
CerebrovascularDiseases
Pneumonia/Influenza
Cancer
1950
2001
Rate Per 100,000
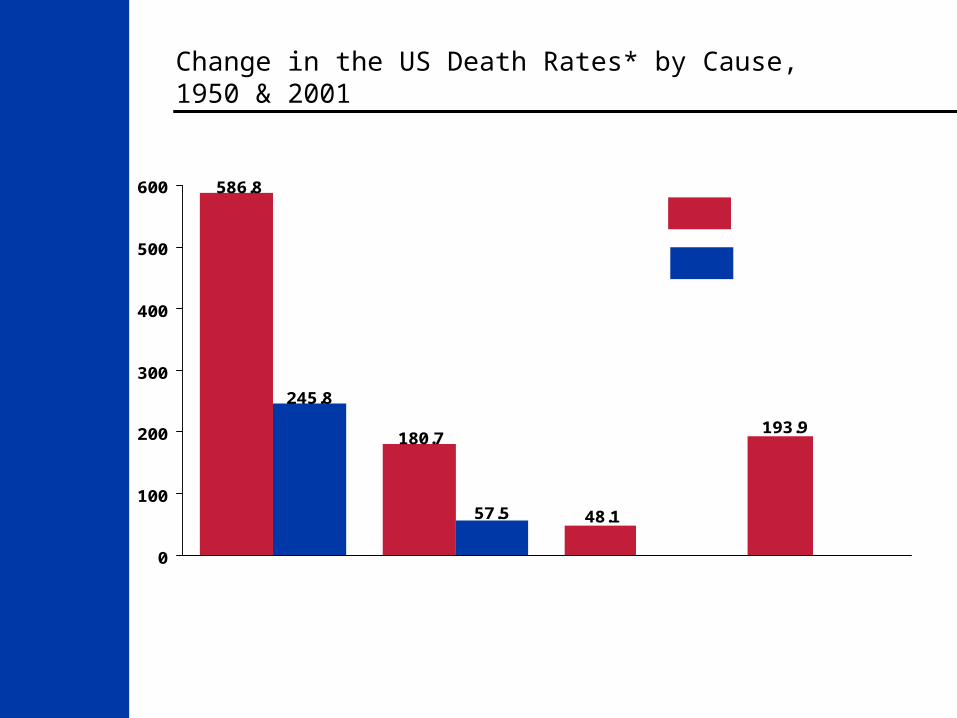
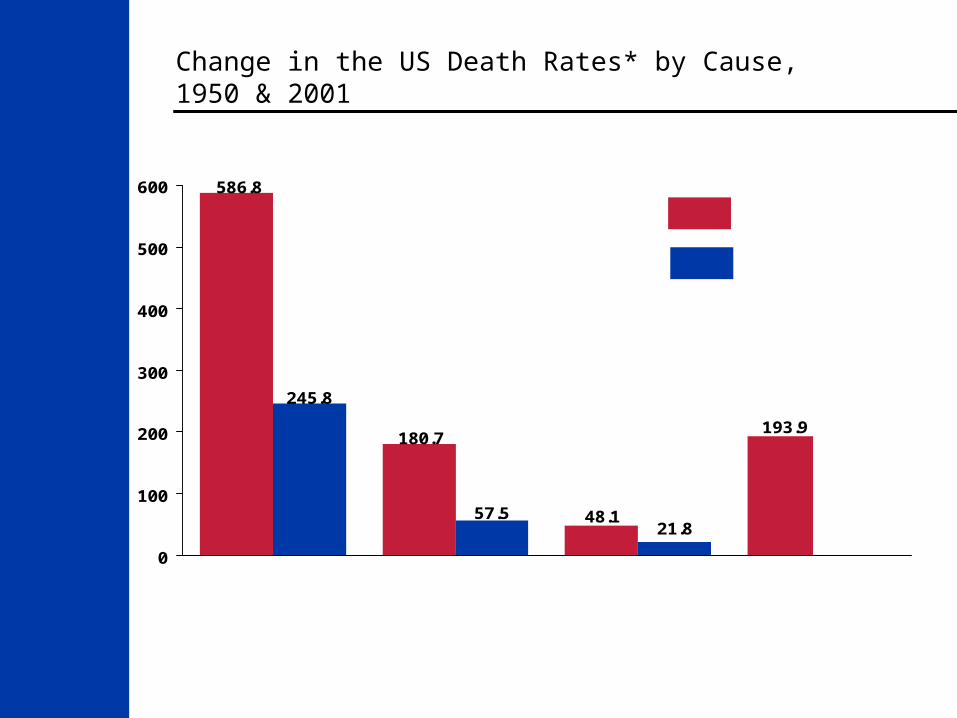
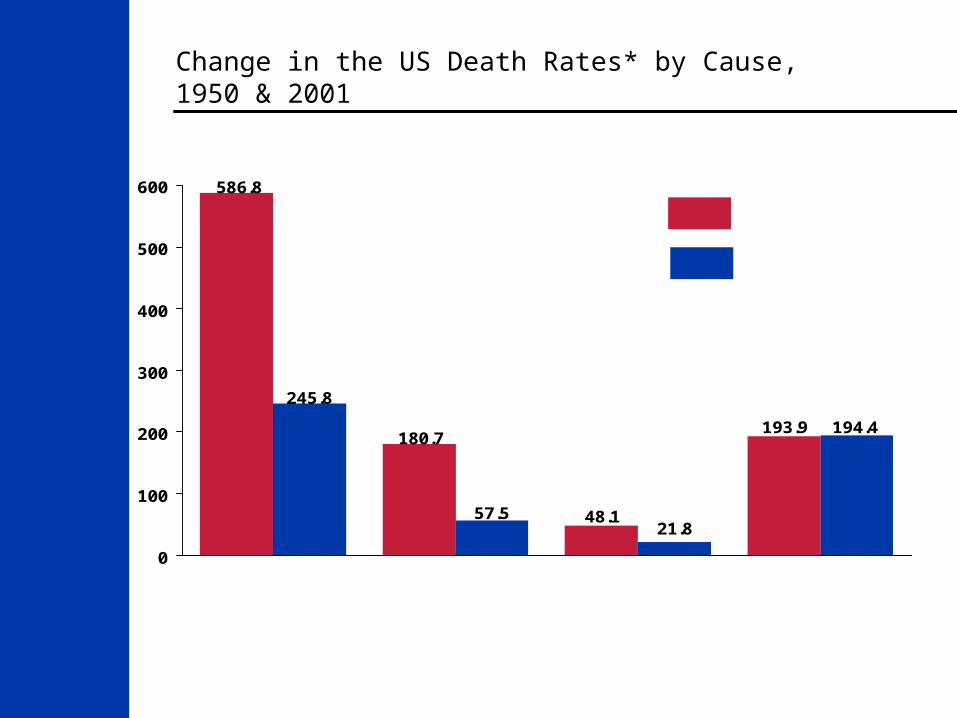
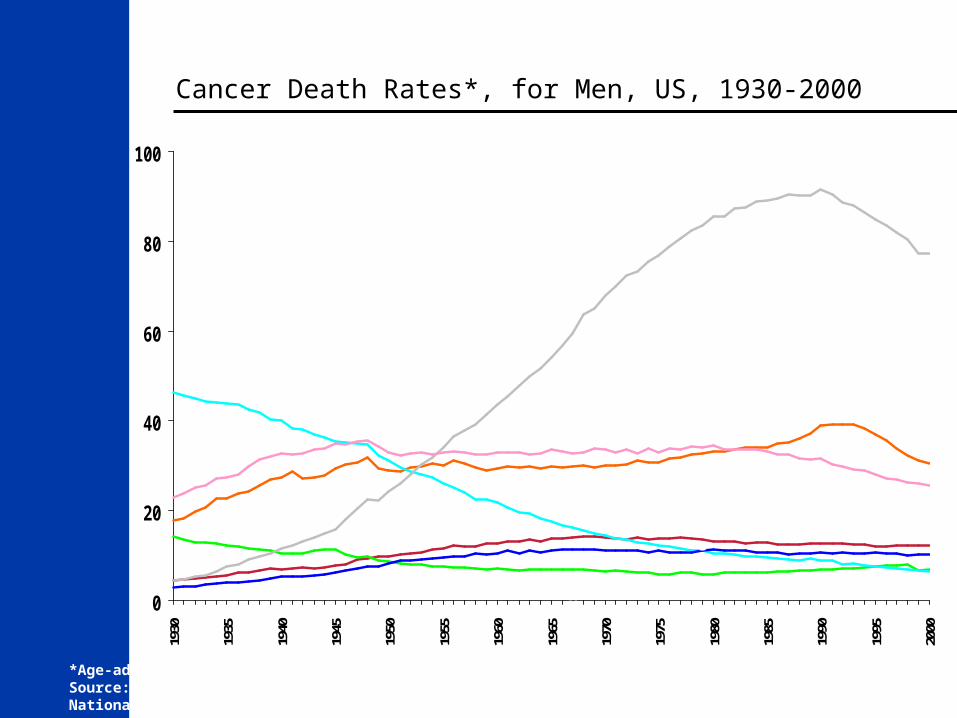
Cancer Death Rates*, for Men, US, 1930-2000
*Age-adjusted to the 2000 US standard population.Source: US Mortality Public Use Data Tapes 1960-2000, US Mortality Volumes 1930-1959, National Center for Health Statistics, Centers for Disease Control and Prevention, 2003.
0
20
40
60
80
10019
30
1935
1940
1945
1950
1955
1960
1965
1970
1975
1980
1985
1990
1995
2000
Lung
Colon & rectum
Prostate
Pancreas
Stomach
Liver
Rate Per 100,000
Leukemia
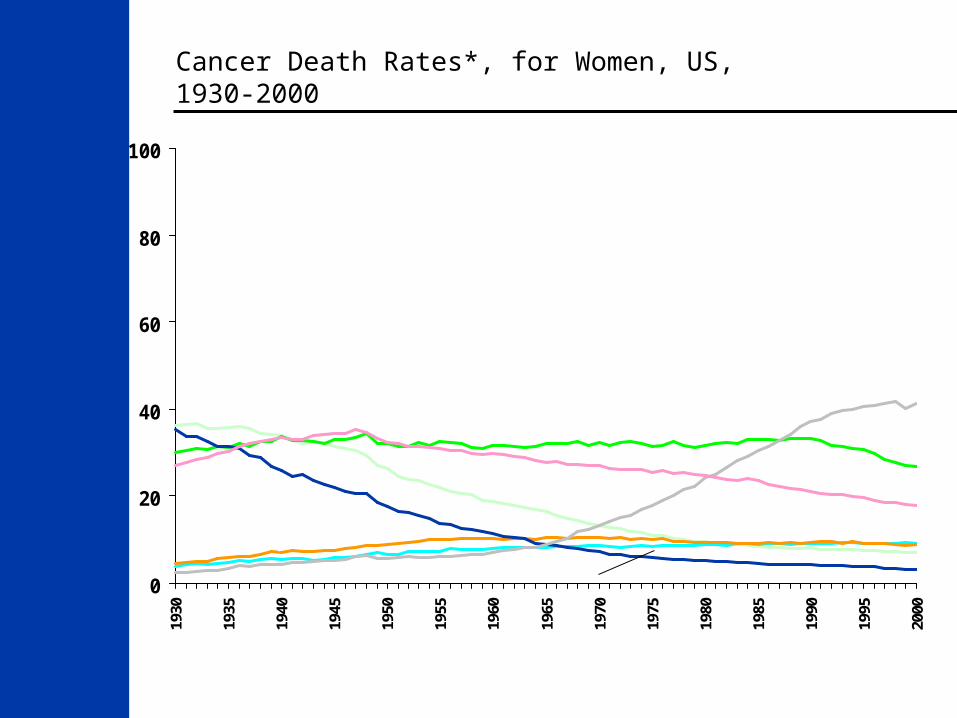
Cancer Death Rates*, for Women, US, 1930-2000
*Age-adjusted to the 2000 US standard population.Source: US Mortality Public Use Data Tapes 1960-2000, US Mortality Volumes 1930-1959,National Center for Health Statistics, Centers for Disease Control and Prevention, 2003.
0
20
40
60
80
10019
30
1935
1940
1945
1950
1955
1960
1965
1970
1975
1980
1985
1990
1995
2000
Lung
Colon & rectum
Uterus
Stomach
Breast
Ovary
Pancreas
Rate Per 100,000
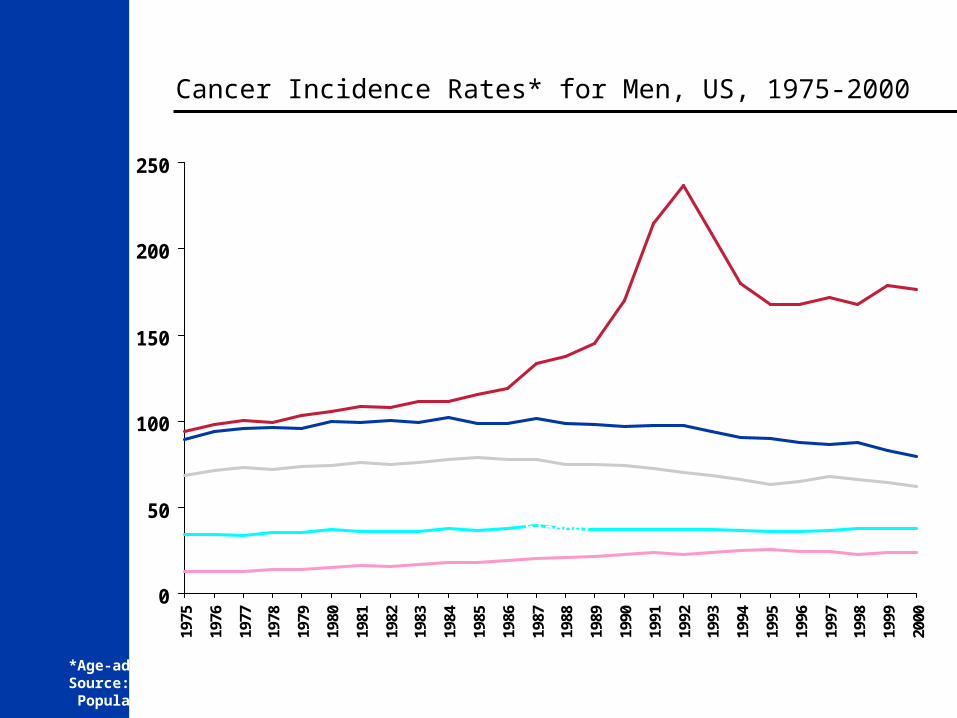
Cancer Incidence Rates* for Men, US, 1975-2000
*Age-adjusted to the 2000 US standard population.Source: Surveillance, Epidemiology, and End Results Program, 1975-2000, Division of Cancer Control and Population Sciences, National Cancer Institute, 2003.
0
50
100
150
200
25019
75
1976
1977
1978
1979
1980
1981
1982
1983
1984
1985
1986
1987
1988
1989
1990
1991
1992
1993
1994
1995
1996
1997
1998
1999
2000
Prostate
Lung
Colon and rectum
Urinary bladder
Non-Hodgkin lymphoma
Rate Per 100,000
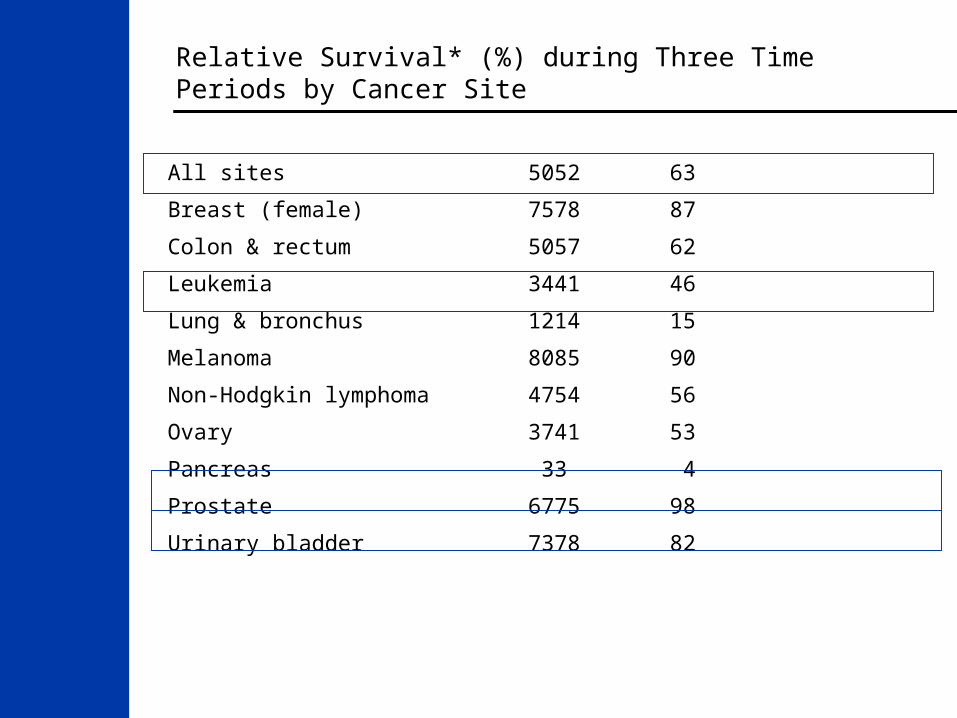
Relative Survival* (%) during Three Time Periods by Cancer Site
*5-year relative survival rates based on follow up of patients through 2000. Source: Surveillance, Epidemiology, and End Results Program, 1975-2000, Division of Cancer Control andPopulation Sciences, National Cancer Institute, 2003.
Site 1974-1976 1983-1985 1992-1999
All sites 50 52 63
Breast (female) 75 78 87
Colon & rectum 50 57 62
Leukemia 34 41 46
Lung & bronchus 12 14 15
Melanoma 80 85 90
Non-Hodgkin lymphoma 47 54 56
Ovary 37 41 53
Pancreas 3 3 4
Prostate 67 75 98
Urinary bladder 73 78 82
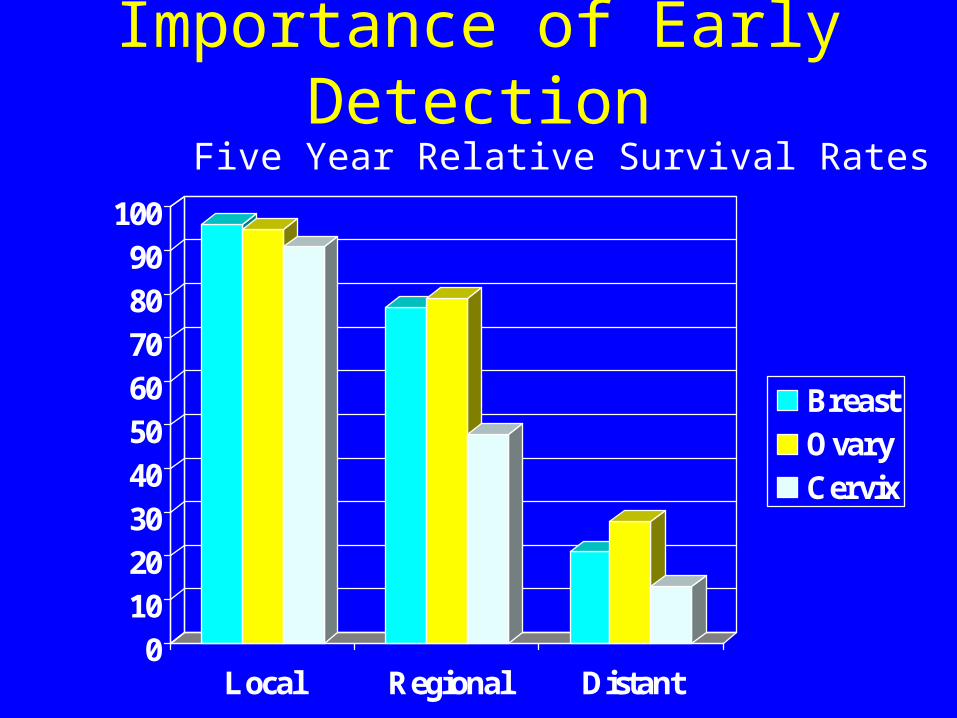
Importance of Early Detection
Five Year Relative Survival Rates
0102030405060708090100
Local Regional Distant
BreastOvaryCervix
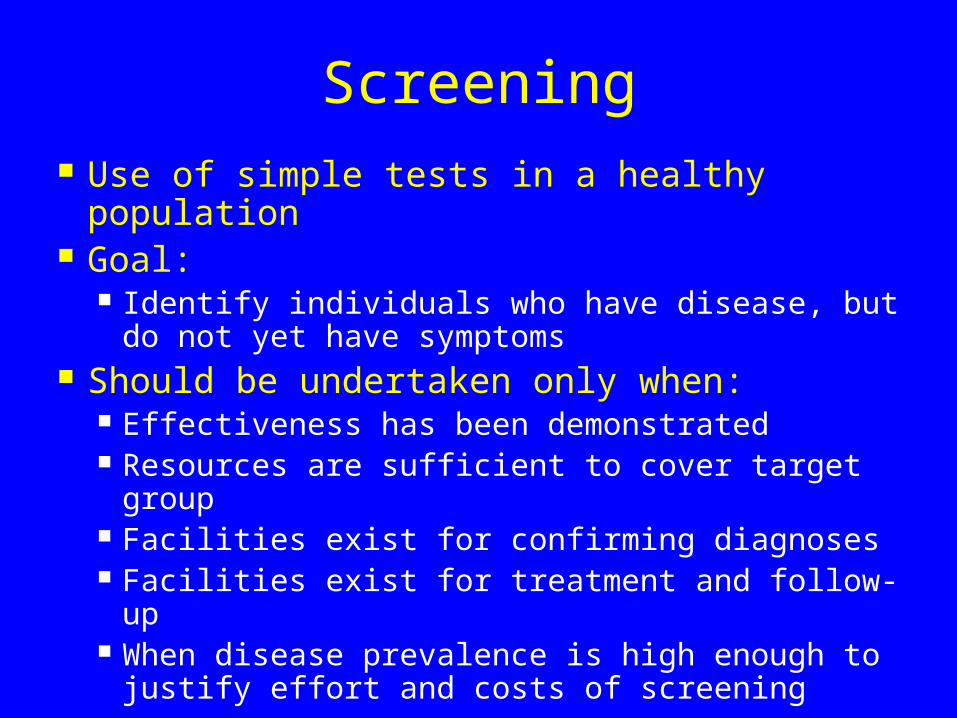
Screening Use of simple tests in a healthy
population Goal:
Identify individuals who have disease, but do not yet have symptoms
Should be undertaken only when: Effectiveness has been demonstrated Resources are sufficient to cover target
group Facilities exist for confirming diagnoses Facilities exist for treatment and follow-up When disease prevalence is high enough to
justify effort and costs of screening
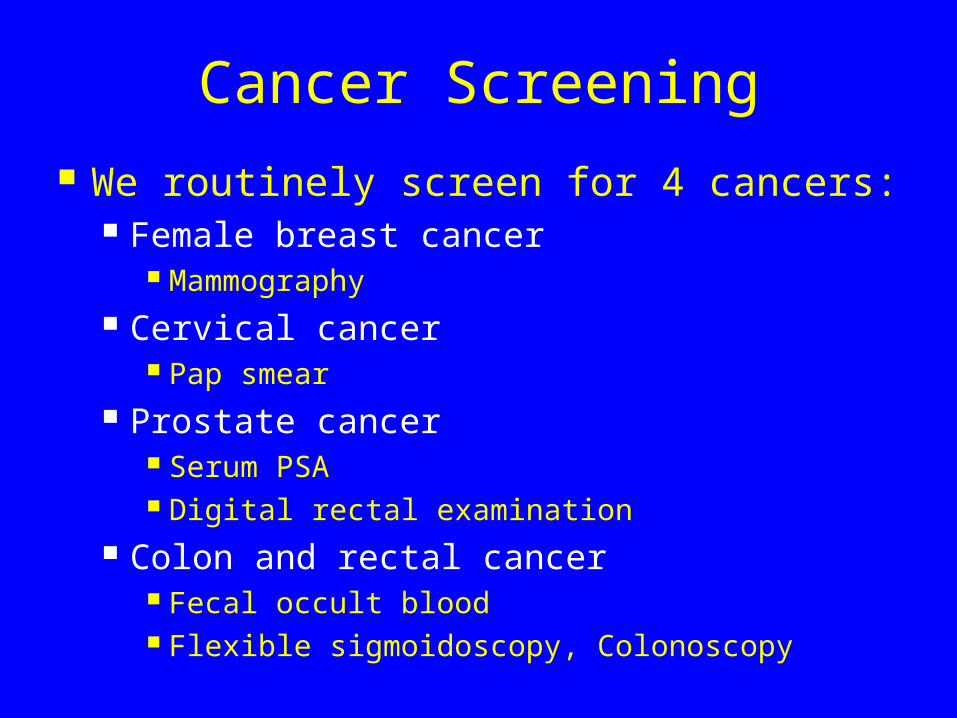
Cancer Screening
We routinely screen for 4 cancers: Female breast cancer
Mammography Cervical cancer
Pap smear Prostate cancer
Serum PSA Digital rectal examination
Colon and rectal cancer Fecal occult blood Flexible sigmoidoscopy, Colonoscopy
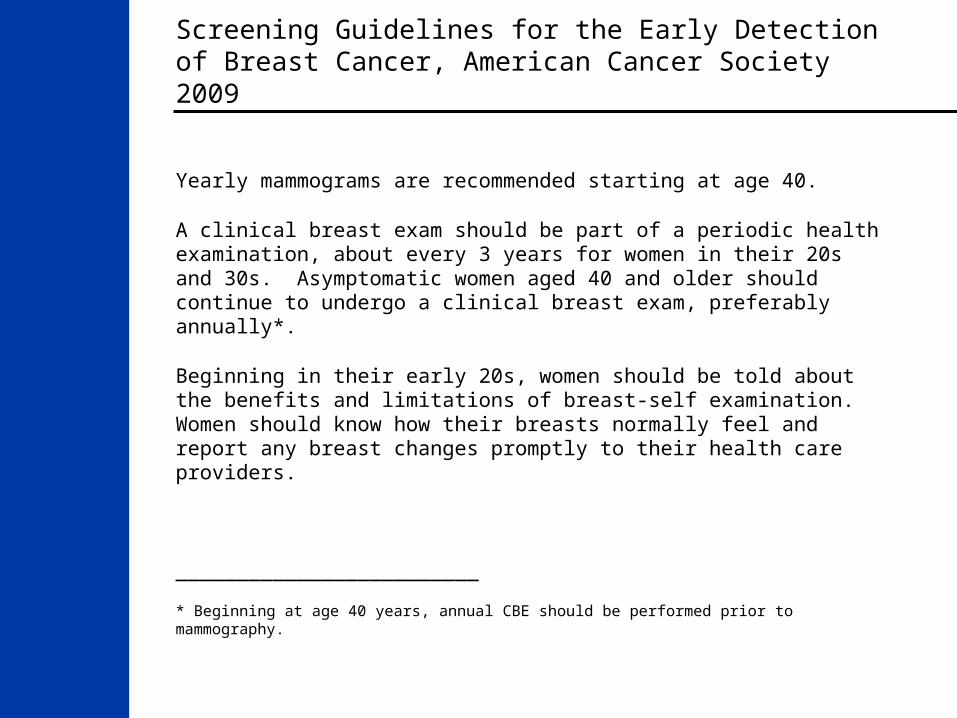
Screening Guidelines for the Early Detection of Breast Cancer, American Cancer Society 2009
Yearly mammograms are recommended starting at age 40.
A clinical breast exam should be part of a periodic health examination, about every 3 years for women in their 20s and 30s. Asymptomatic women aged 40 and older should continue to undergo a clinical breast exam, preferably annually*.
Beginning in their early 20s, women should be told about the benefits and limitations of breast-self examination. Women should know how their breasts normally feel and report any breast changes promptly to their health care providers.
_________________________
* Beginning at age 40 years, annual CBE should be performed prior to mammography.
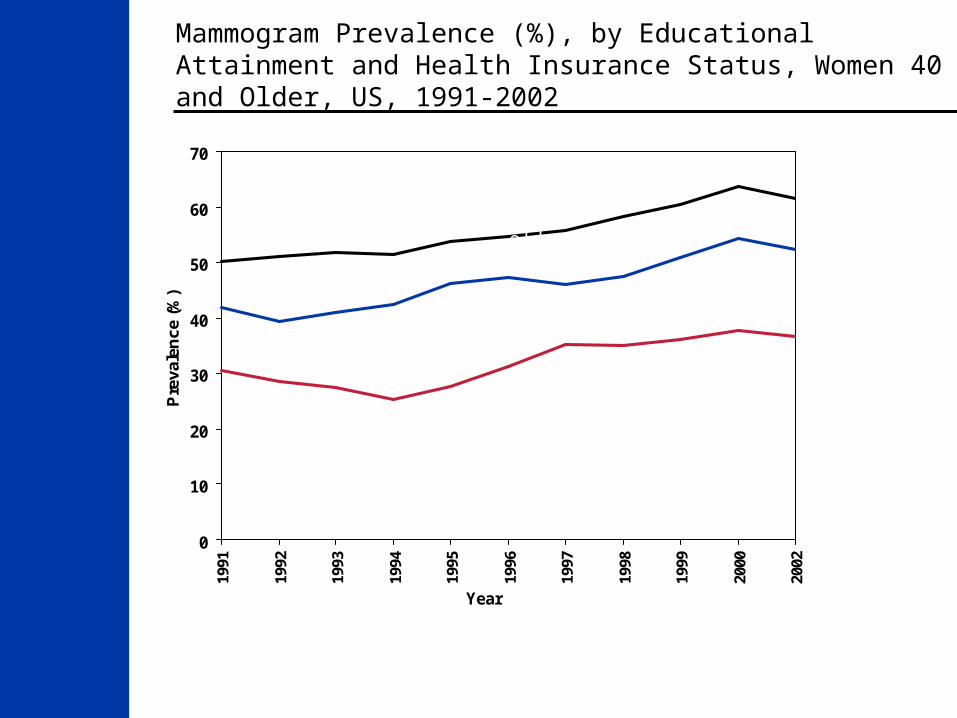
Mammogram Prevalence (%), by Educational Attainment and Health Insurance Status, Women 40 and Older, US, 1991-2002
* A mammogram within the past year. Note: Data from participating states and the District of Columbia were aggregated to represent the United States.Source: Behavior Risk Factor Surveillance System CD-ROM (1984-1995, 1996-1997, 1998, 1999) and Public Use Data Tape (2000, 2002), National Centers for Chronic Disease Prevention and Health Promotion, Centers for Disease Control and Prevention 1997, 1999, 2000, 2000, 2001,2003.
0
10
20
30
40
50
60
70
1991
1992
1993
1994
1995
1996
1997
1998
1999
2000
2002
Year
Pre
vale
nce
(%)
Women with less than a high school education
Women with no health insurance
All women 40 and older

How do we judge efficacy of a screening
test?Sensitivity/Specificity
Positive/Negative Predictive Value
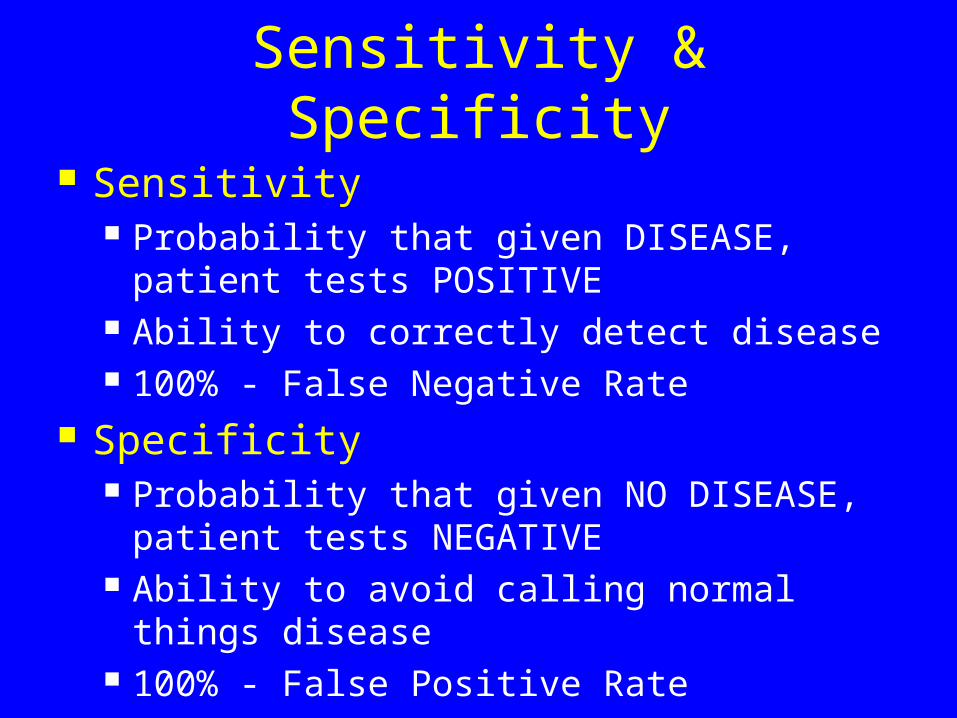
Sensitivity & Specificity
Sensitivity Probability that given DISEASE, patient
tests POSITIVE Ability to correctly detect disease 100% - False Negative Rate
Specificity Probability that given NO DISEASE,
patient tests NEGATIVE Ability to avoid calling normal things
disease 100% - False Positive Rate
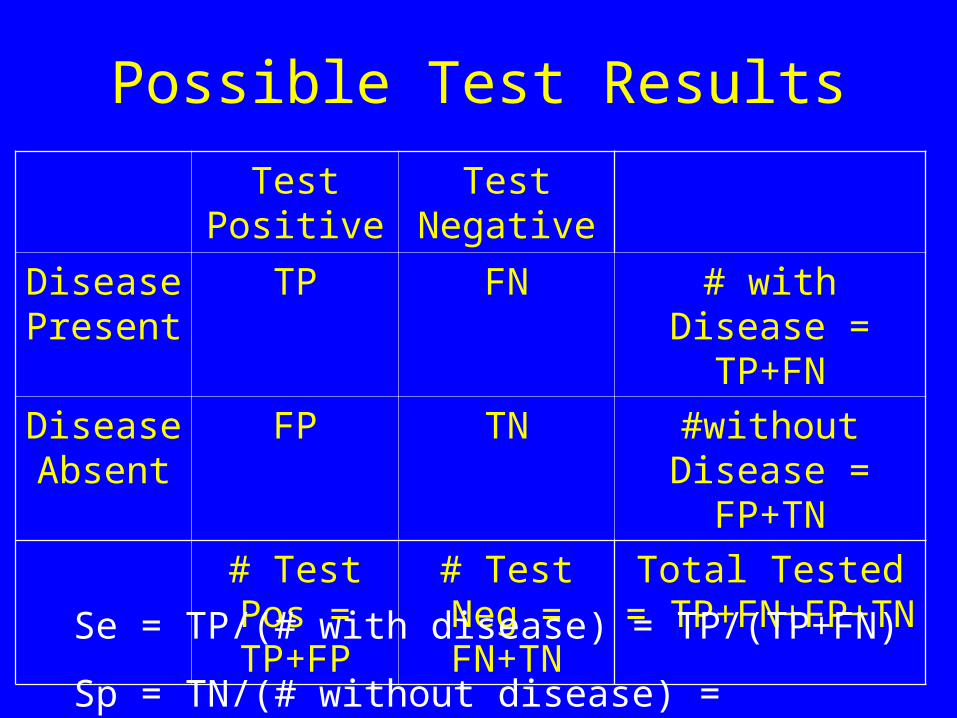
Possible Test Results
Test Positive
Test Negative
Disease Present
TP FN # with Disease = TP+FN
Disease Absent
FP TN #without Disease =
FP+TN
# Test Pos = TP+FP
# Test Neg = FN+TN
Total Tested = TP+FN+FP+TN
Se = TP/(# with disease) = TP/(TP+FN)
Sp = TN/(# without disease) = TN/(TN+FP)
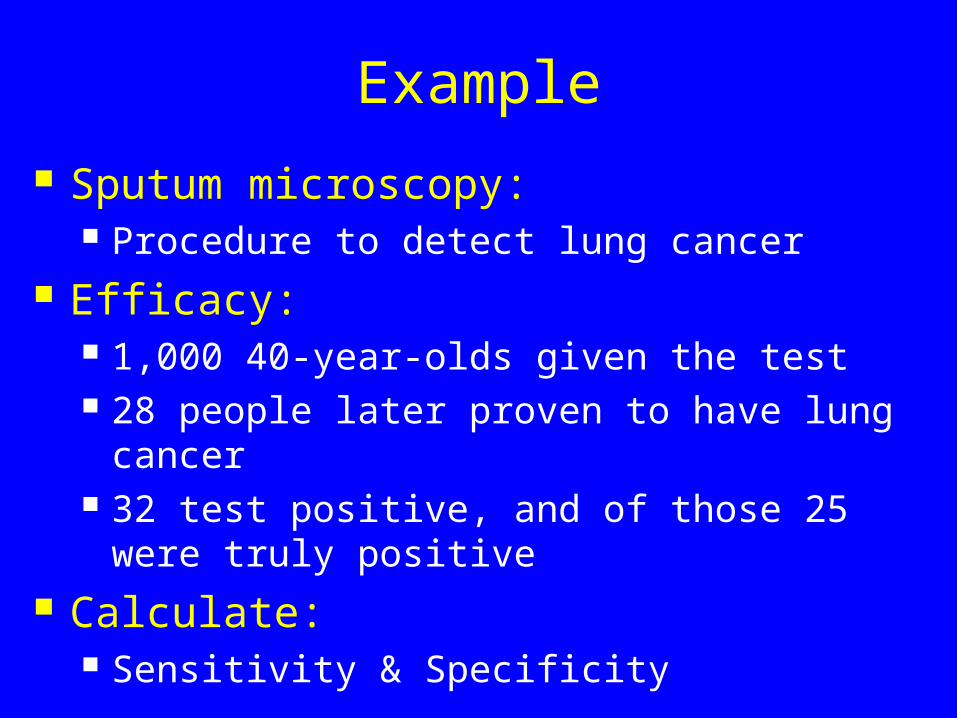
Example
Sputum microscopy: Procedure to detect lung cancer
Efficacy: 1,000 40-year-olds given the test 28 people later proven to have lung cancer 32 test positive, and of those 25 were truly
positive Calculate:
Sensitivity & Specificity
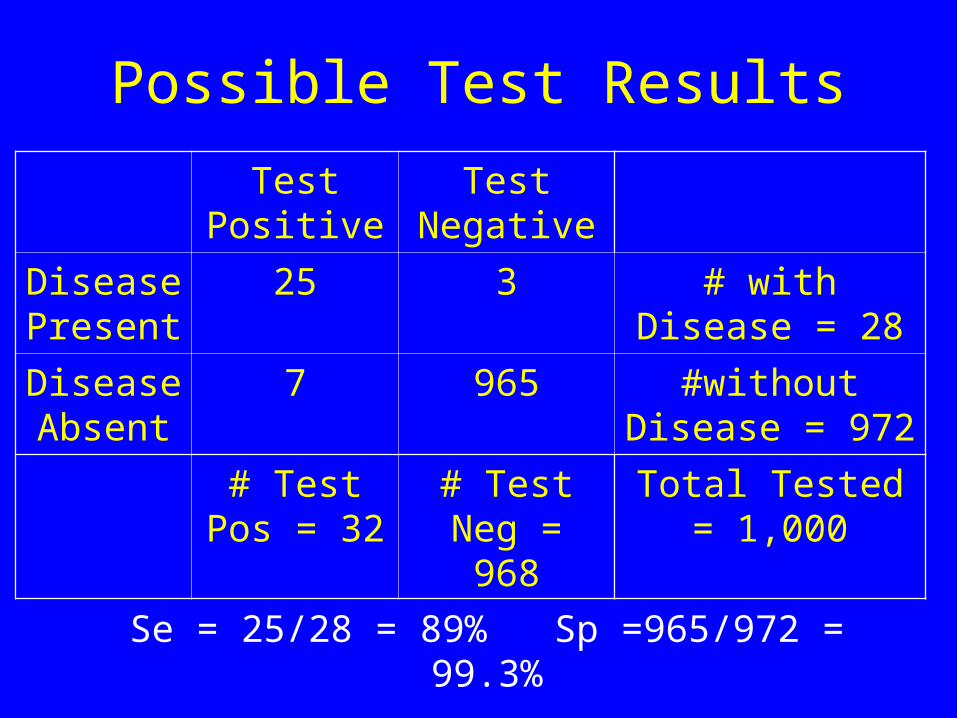
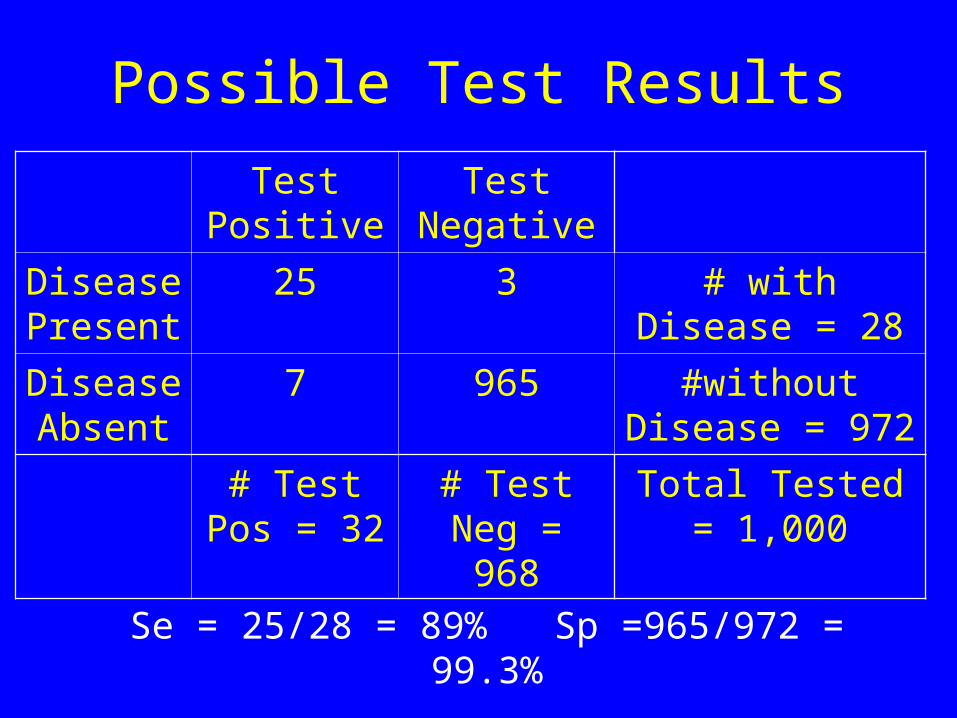
Possible Test Results
Test Positive
Test Negative
Disease Present
25 3 # with Disease = 28
Disease Absent
7 965 #without Disease = 972
# Test Pos = 32
# Test Neg = 968
Total Tested = 1,000
Se = 25/28 = 89% Sp =965/972 = 99.3%

As a patient:
What Information Do You Want?
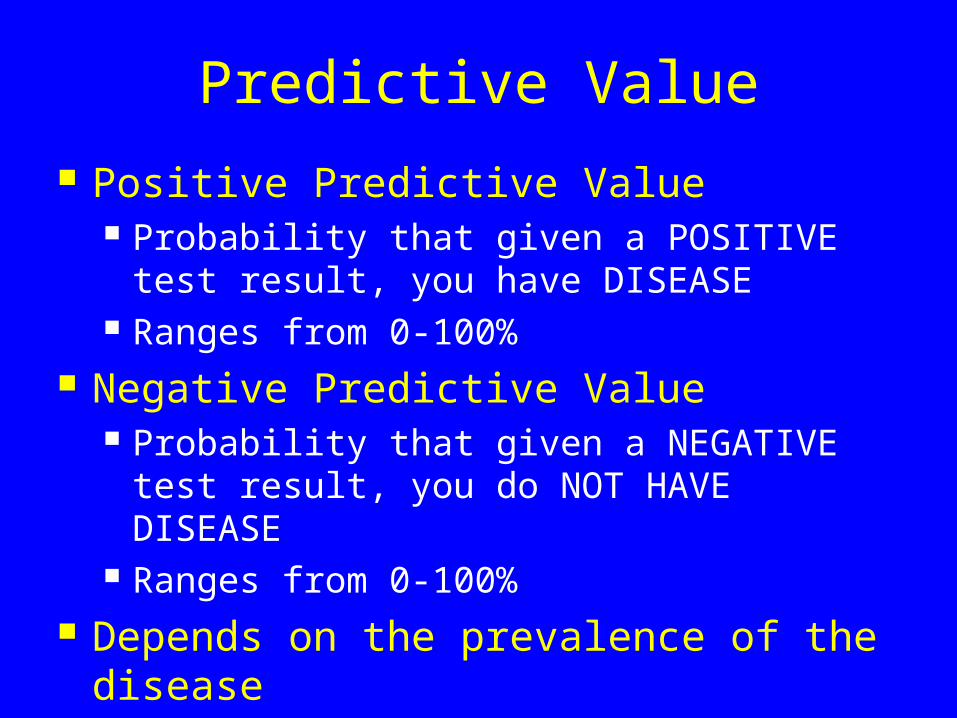
Predictive Value
Positive Predictive Value Probability that given a POSITIVE test
result, you have DISEASE Ranges from 0-100%
Negative Predictive Value Probability that given a NEGATIVE test
result, you do NOT HAVE DISEASE Ranges from 0-100%
Depends on the prevalence of the disease
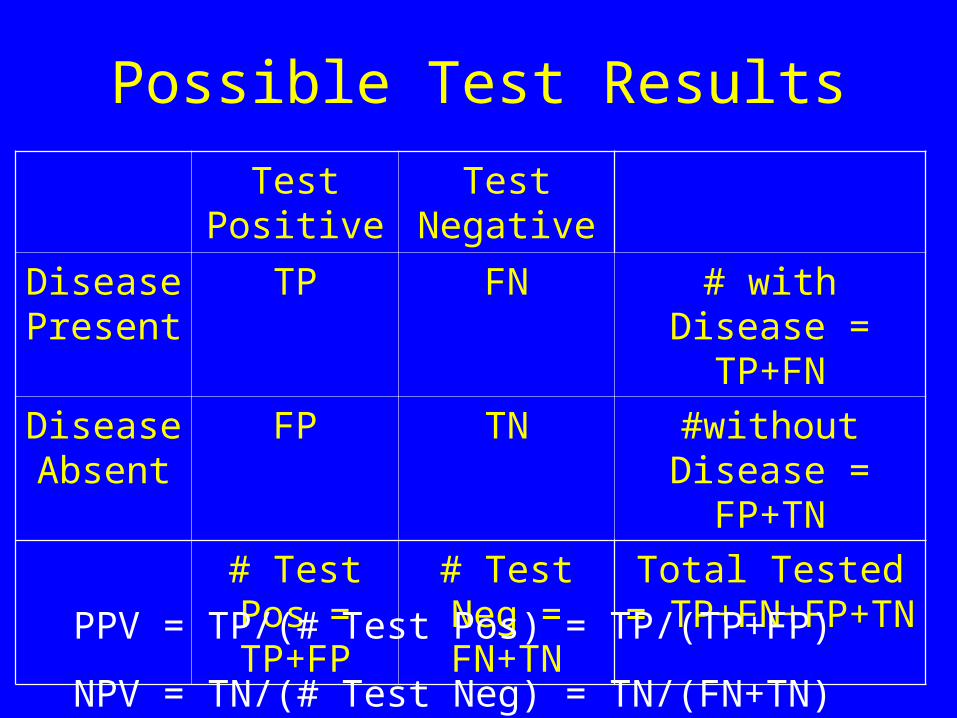
Possible Test Results
Test Positive
Test Negative
Disease Present
TP FN # with Disease = TP+FN
Disease Absent
FP TN #without Disease =
FP+TN
# Test Pos = TP+FP
# Test Neg = FN+TN
Total Tested = TP+FN+FP+TN
PPV = TP/(# Test Pos) = TP/(TP+FP)
NPV = TN/(# Test Neg) = TN/(FN+TN)
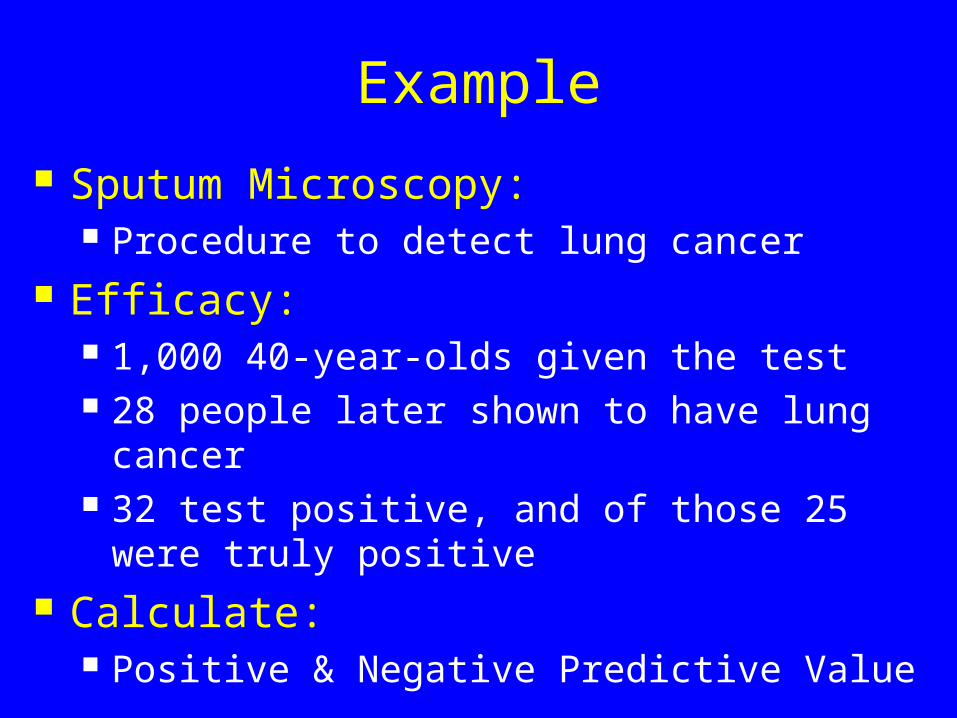
Example
Sputum Microscopy: Procedure to detect lung cancer
Efficacy: 1,000 40-year-olds given the test 28 people later shown to have lung cancer 32 test positive, and of those 25 were truly
positive Calculate:
Positive & Negative Predictive Value
Possible Test Results
Test Positive
Test Negative
Disease Present
25 3 # with Disease = 28
Disease Absent
7 965 #without Disease = 972
# Test Pos = 32
# Test Neg = 968
Total Tested = 1,000
Se = 25/28 = 89% Sp =965/972 = 99.3%
PPV = 25/32 = 78% NPV =965/968 = 99.7%
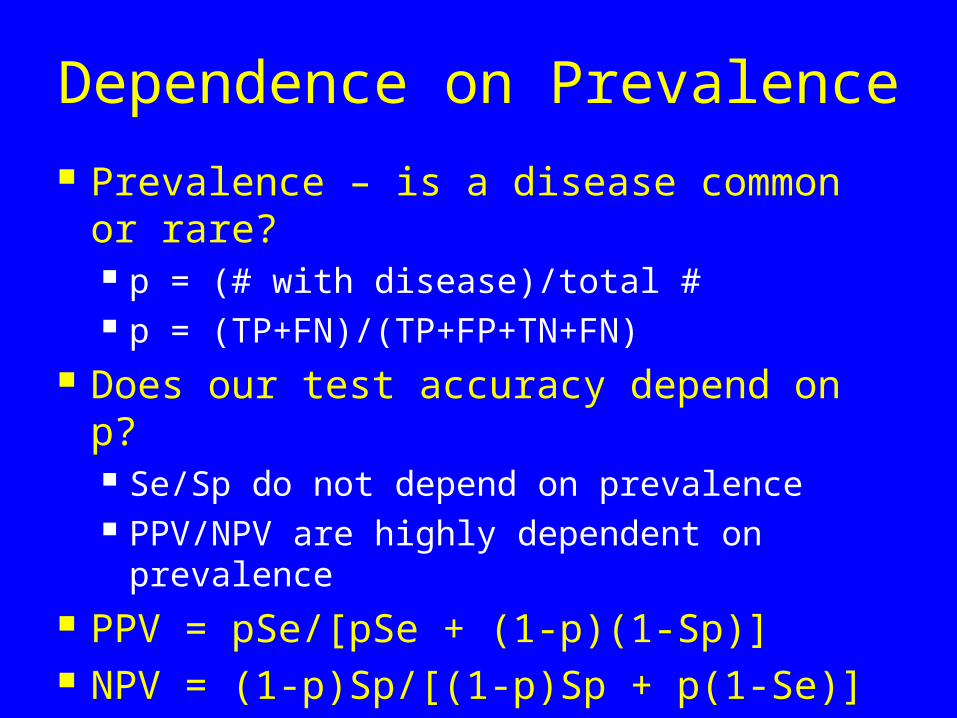
Dependence on Prevalence
Prevalence – is a disease common or rare? p = (# with disease)/total # p = (TP+FN)/(TP+FP+TN+FN)
Does our test accuracy depend on p? Se/Sp do not depend on prevalence PPV/NPV are highly dependent on
prevalence PPV = pSe/[pSe + (1-p)(1-Sp)] NPV = (1-p)Sp/[(1-p)Sp + p(1-Se)]
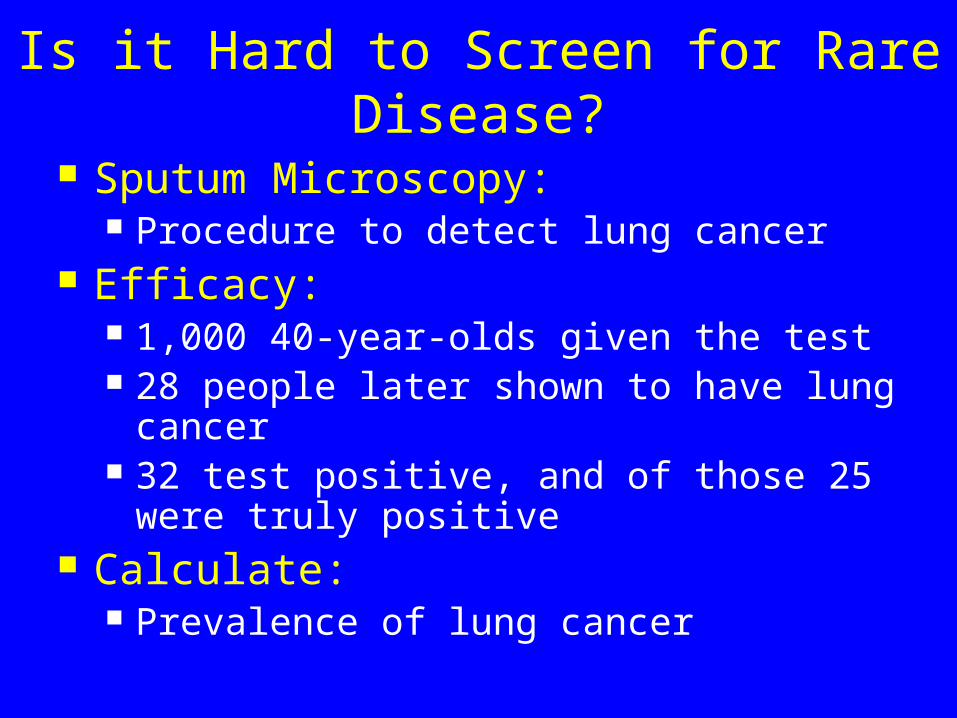
Is it Hard to Screen for Rare Disease?
Sputum Microscopy: Procedure to detect lung cancer
Efficacy: 1,000 40-year-olds given the test 28 people later shown to have lung
cancer 32 test positive, and of those 25 were
truly positive Calculate:
Prevalence of lung cancer
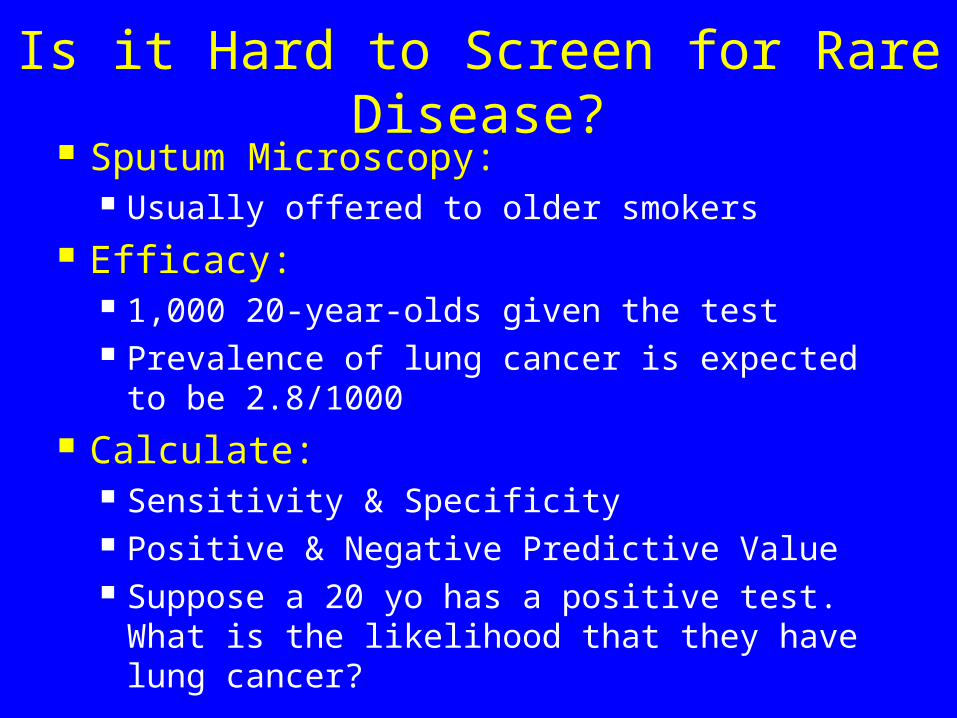
Is it Hard to Screen for Rare Disease?
Sputum Microscopy: Usually offered to older smokers
Efficacy: 1,000 20-year-olds given the test Prevalence of lung cancer is expected to be
2.8/1000 Calculate:
Sensitivity & Specificity Positive & Negative Predictive Value Suppose a 20 yo has a positive test. What is
the likelihood that they have lung cancer?
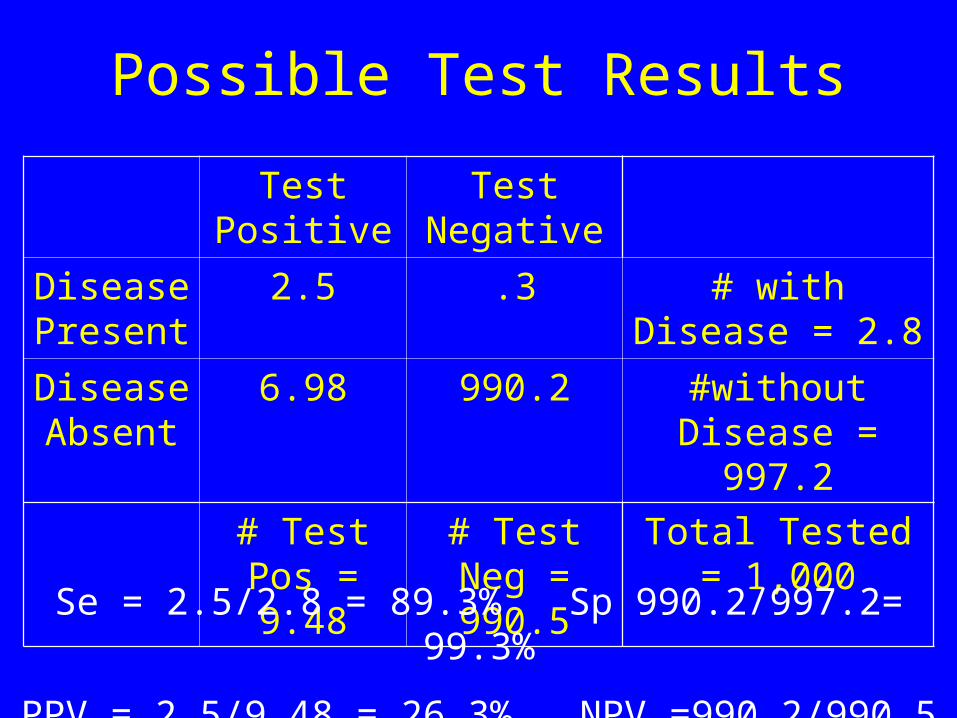
Possible Test Results
Test Positive
Test Negative
Disease Present
2.5 .3 # with Disease = 2.8
Disease Absent
6.98 990.2 #without Disease =
997.2
# Test Pos = 9.48
# Test Neg = 990.5
Total Tested = 1,000
Se = 2.5/2.8 = 89.3% Sp 990.2/997.2= 99.3%
PPV = 2.5/9.48 = 26.3% NPV =990.2/990.5 = 99.97%
Cervical Cancer
Early Detection
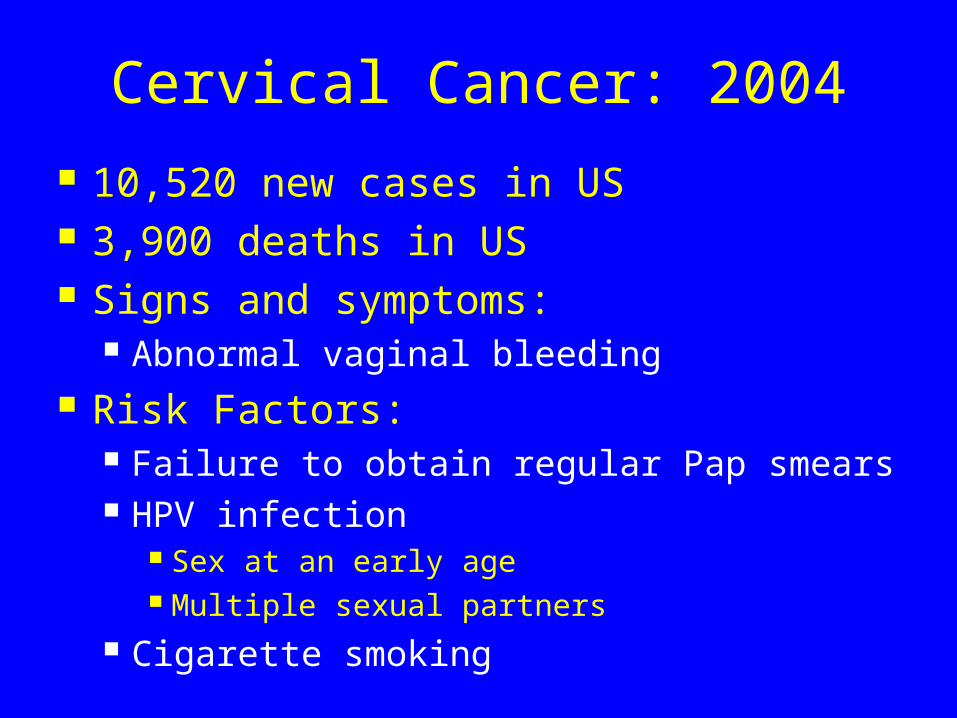
Cervical Cancer: 2004
10,520 new cases in US 3,900 deaths in US Signs and symptoms:
Abnormal vaginal bleeding Risk Factors:
Failure to obtain regular Pap smears HPV infection
Sex at an early age Multiple sexual partners
Cigarette smoking
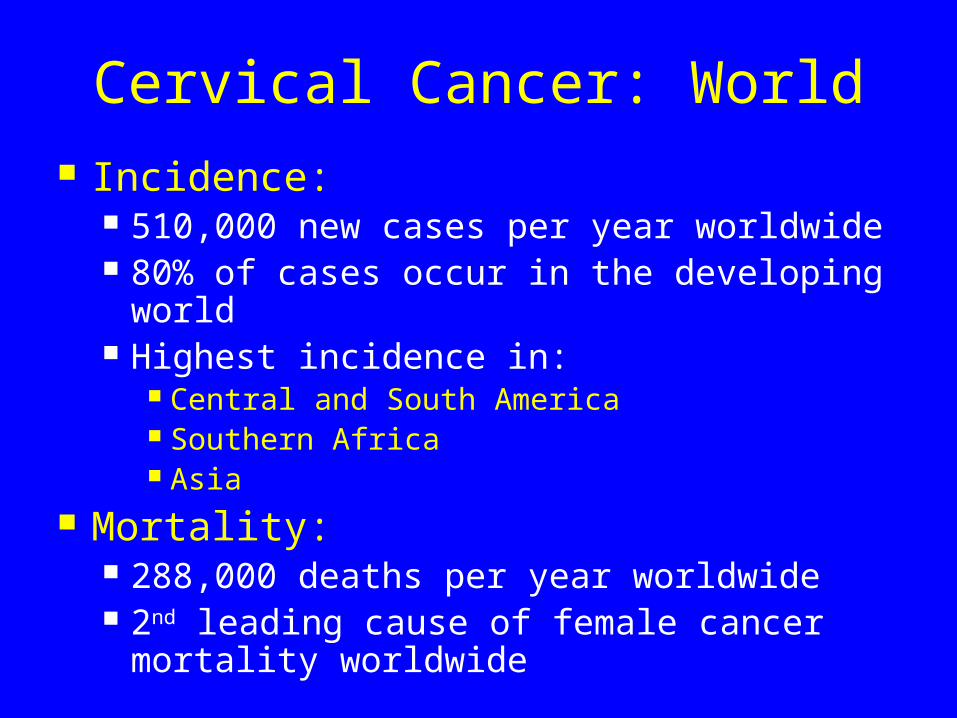
Cervical Cancer: World Incidence:
510,000 new cases per year worldwide 80% of cases occur in the developing
world Highest incidence in:
Central and South America Southern Africa Asia
Mortality: 288,000 deaths per year worldwide 2nd leading cause of female cancer
mortality worldwide
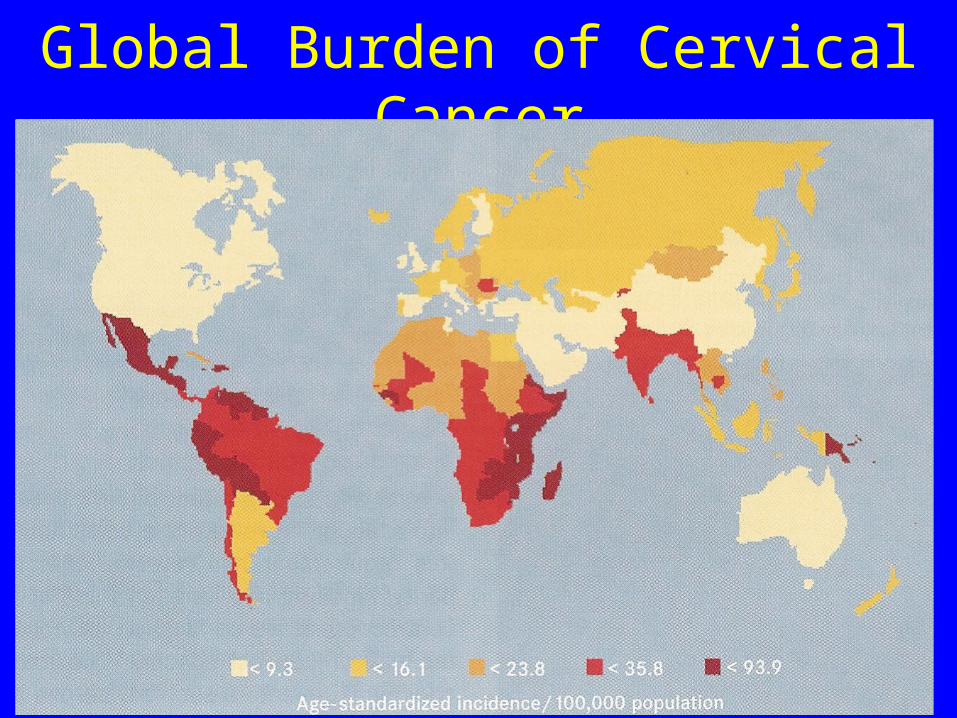
Global Burden of Cervical Cancer
Cervical Cancer
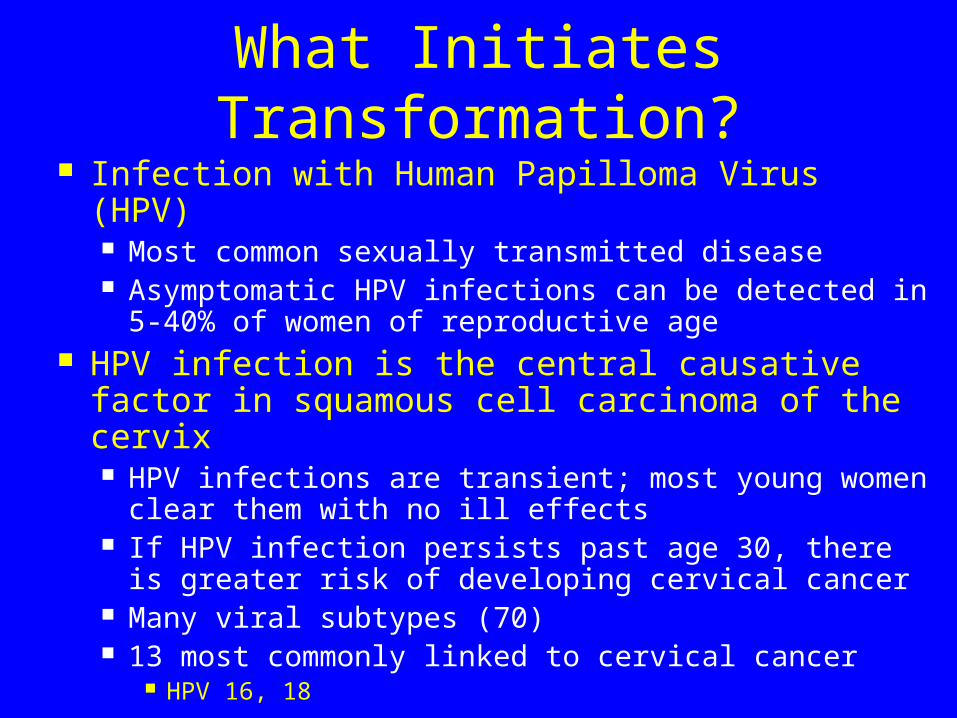
What Initiates Transformation?
Infection with Human Papilloma Virus (HPV) Most common sexually transmitted disease Asymptomatic HPV infections can be detected in
5-40% of women of reproductive age HPV infection is the central causative factor
in squamous cell carcinoma of the cervix HPV infections are transient; most young women
clear them with no ill effects If HPV infection persists past age 30, there is
greater risk of developing cervical cancer Many viral subtypes (70) 13 most commonly linked to cervical cancer
HPV 16, 18
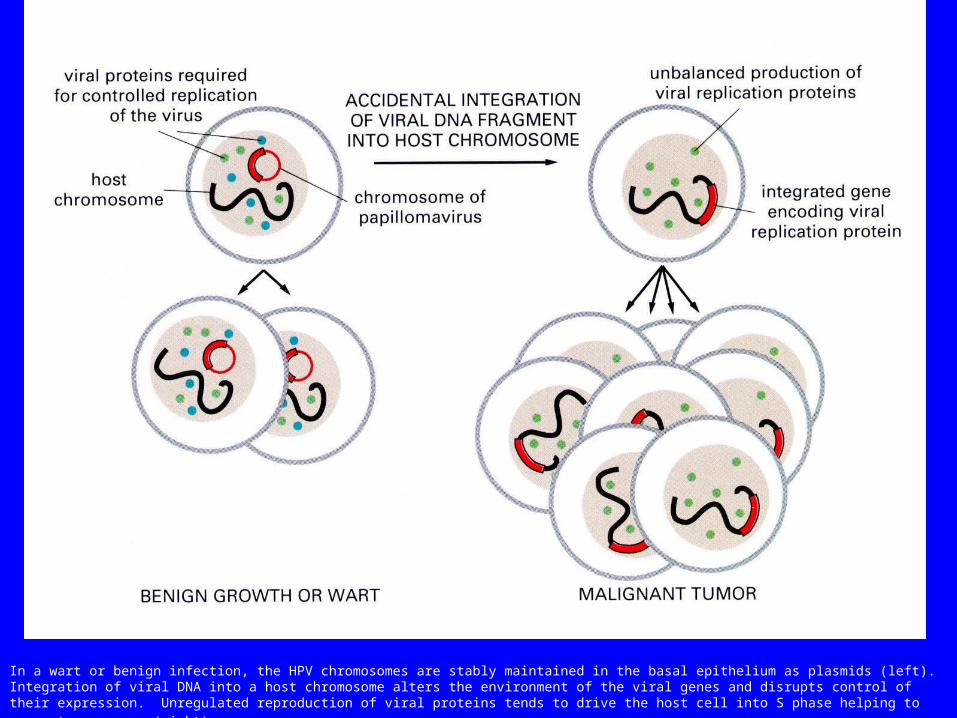
In a wart or benign infection, the HPV chromosomes are stably maintained in the basal epithelium as plasmids (left). Integration of viral DNA into a host chromosome alters the environment of the viral genes and disrupts control of their expression. Unregulated reproduction of viral proteins tends to drive the host
cell into S phase helping to generate a cancer (right).
How Do We Detect Early Cervical
Cancer?Pap Smear
(The most successful cancer-screening test in medical history)
Colposcopy +Biopsy
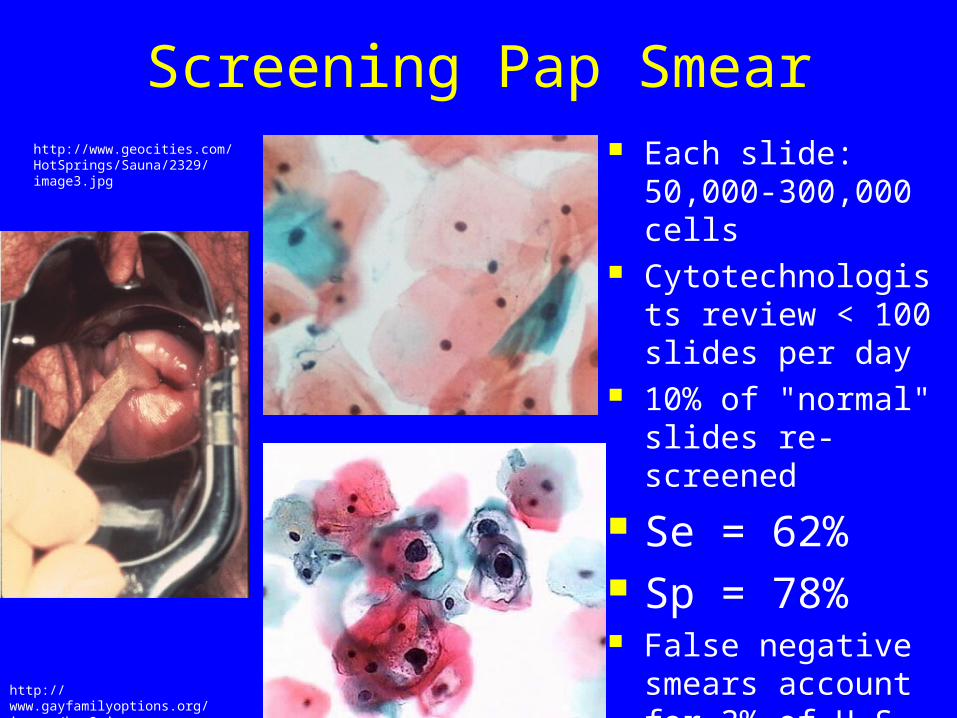
Screening Pap Smear
Each slide:
50,000-300,000 cells
Cytotechnologists review < 100 slides per day
10% of "normal" slides re-screened
Se = 62% Sp = 78% False negative
smears account for 3% of U.S. Cervical Cancer cases/year
http://www.gayfamilyoptions.org/images/hpv3.jpg
http://www.geocities.com/HotSprings/Sauna/2329/image3.jpg
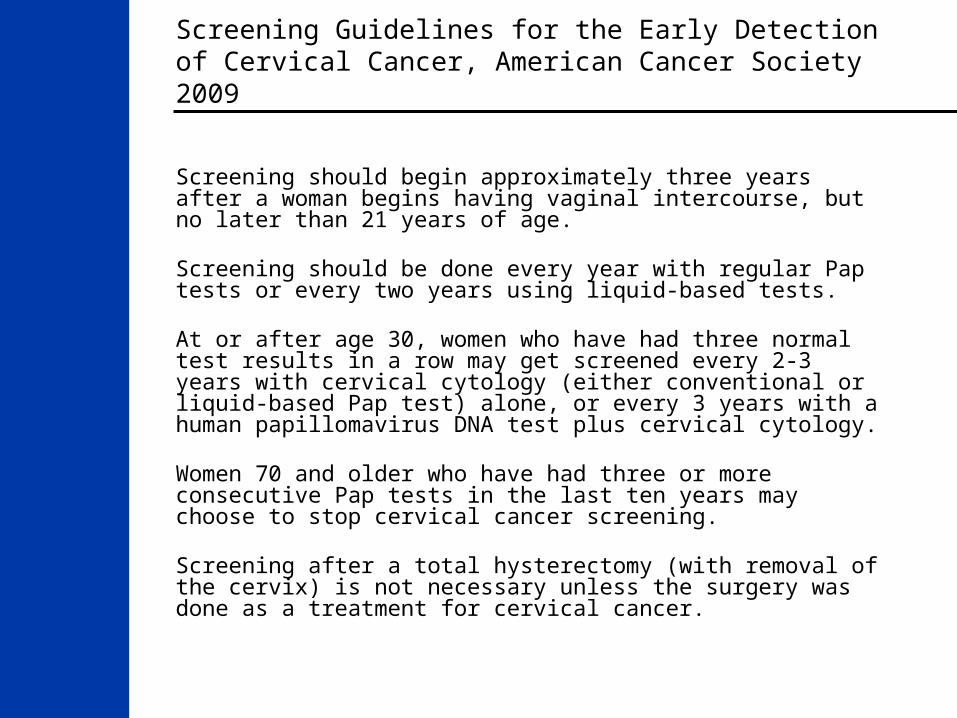
Screening Guidelines for the Early Detection of Cervical Cancer, American Cancer Society 2009
Screening should begin approximately three years after a woman begins having vaginal intercourse, but no later than 21 years of age.
Screening should be done every year with regular Pap tests or every two years using liquid-based tests.
At or after age 30, women who have had three normal test results in a row may get screened every 2-3 years with cervical cytology (either conventional or liquid-based Pap test) alone, or every 3 years with a human papillomavirus DNA test plus cervical cytology.
Women 70 and older who have had three or more consecutive Pap tests in the last ten years may choose to stop cervical cancer screening.
Screening after a total hysterectomy (with removal of the cervix) is not necessary unless the surgery was done as a treatment for cervical cancer.

Trends in Recent* Pap Test Prevalence (%), by Educational Attainment and Health Insurance Status, Women 18 and Older, US, 1992-2002
* A Pap test within the past three years. Note: Data from participating states and the District of Columbia were aggregated to represent the United States. Educational attainment is for women 25 and older.Source: Behavior Risk Factor Surveillance System CD-ROM (1984-1995, 1996-1997, 1998, 1999) and Public Use Data Tape (2000, 2002), National Center for Chronic Disease Prevention and Health Promotion, Center for Disease Control and Prevention,1997, 1999, 2000, 2000, 2001, 2003.
0
20
40
60
80
100
1992
1993
1994
1995
1996
1997
1998
1999
2000
2002
Year
Pre
vale
nce
(%)
Women with no health insurance
Women with less than a high school education
All women 18 and older
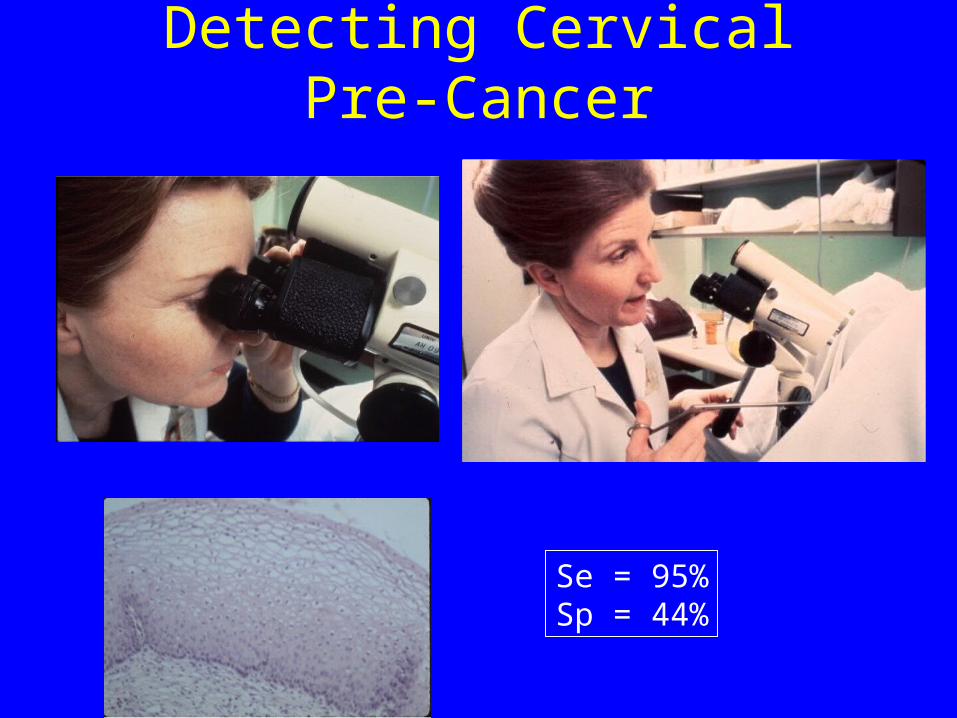
Detecting Cervical Pre-Cancer
Se = 95%Sp = 44%
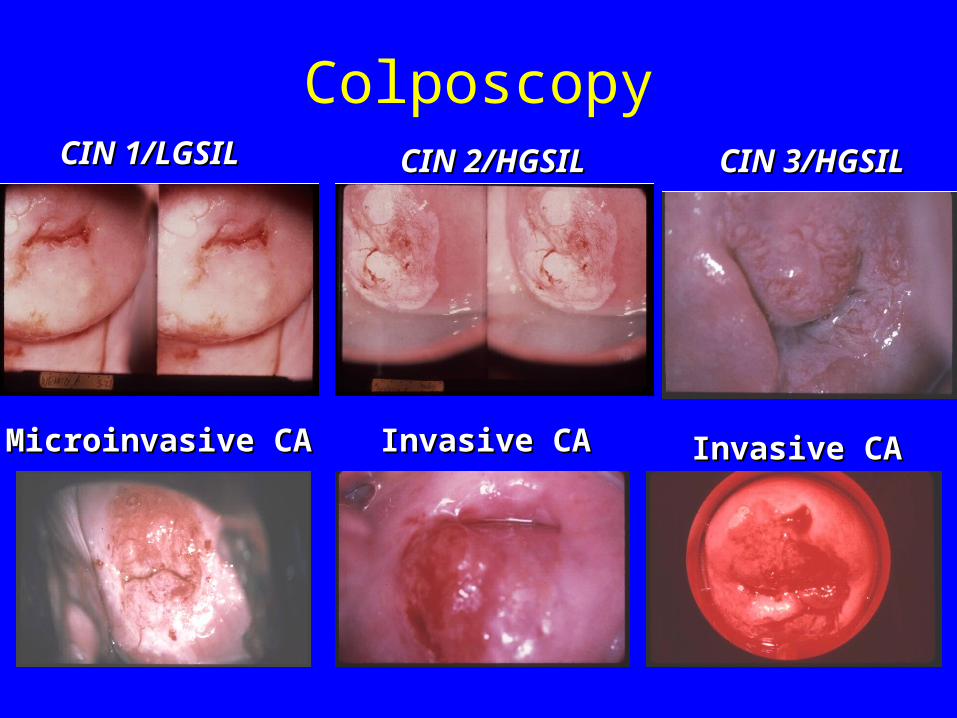
ColposcopyCIN 1/LGSILCIN 1/LGSIL CIN 2/HGSILCIN 2/HGSIL CIN 3/HGSILCIN 3/HGSIL
Microinvasive CAMicroinvasive CA Invasive CAInvasive CAInvasive CAInvasive CA
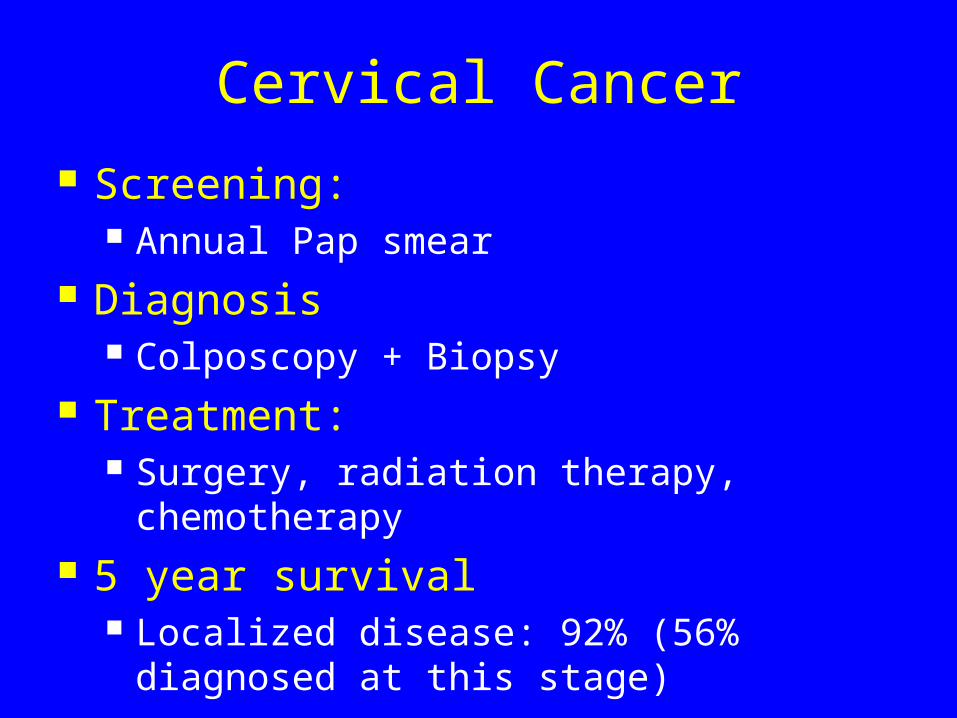
Cervical Cancer
Screening: Annual Pap smear
Diagnosis Colposcopy + Biopsy
Treatment: Surgery, radiation therapy,
chemotherapy 5 year survival
Localized disease: 92% (56% diagnosed at this stage)
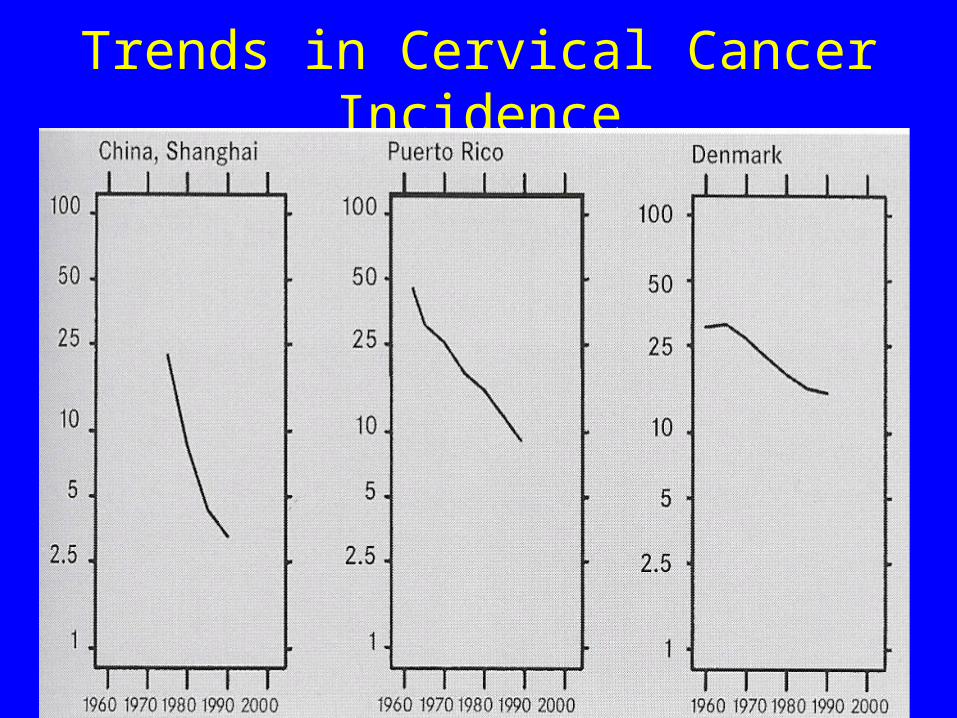
Trends in Cervical Cancer Incidence
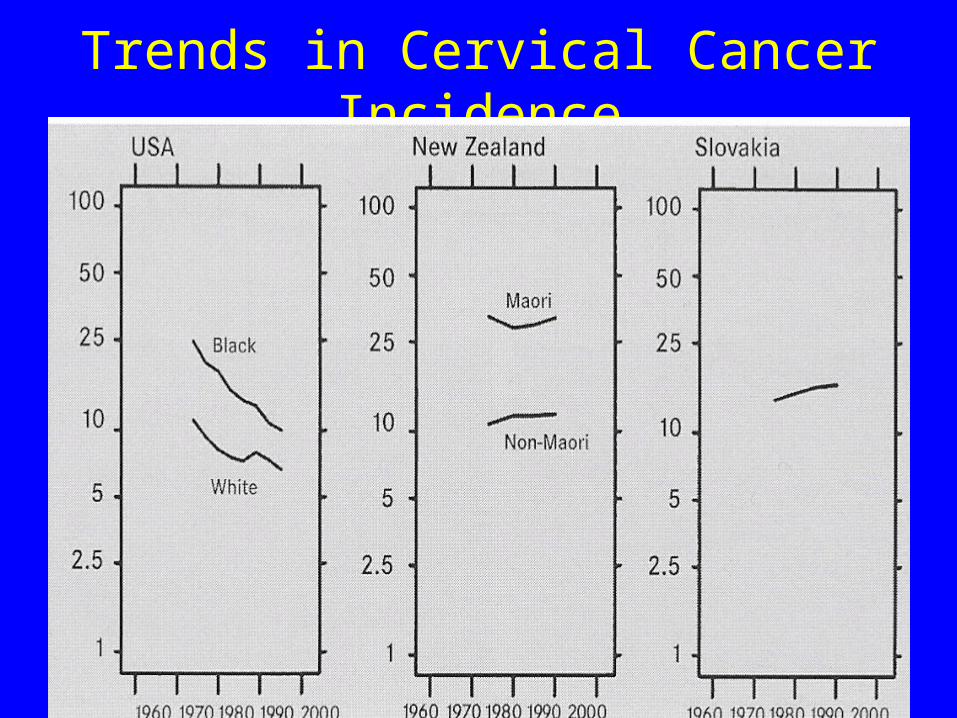
Trends in Cervical Cancer Incidence
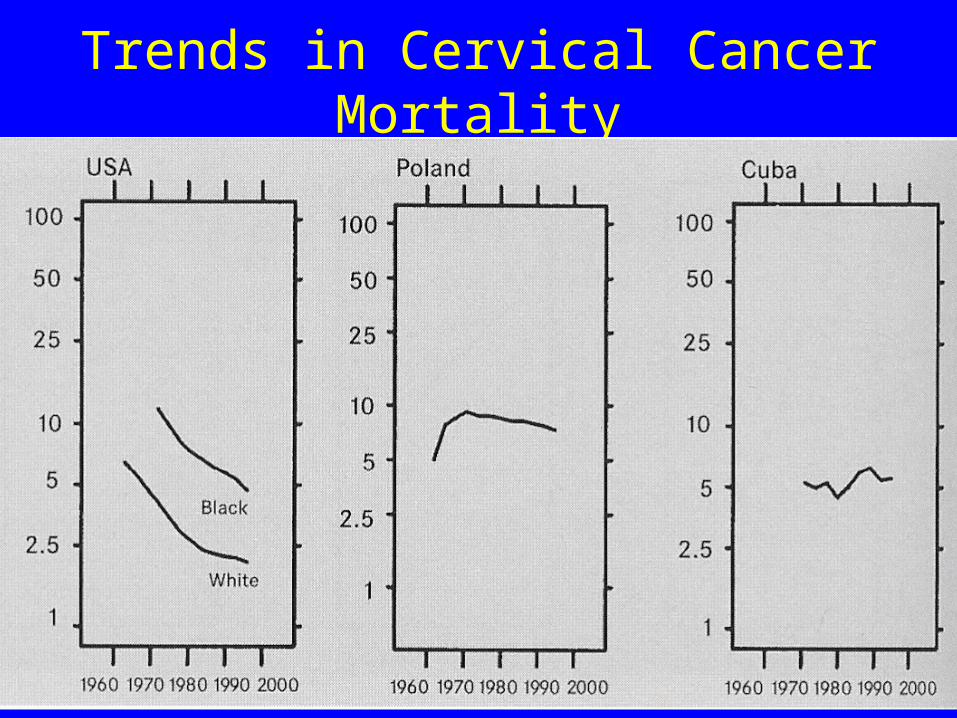
Trends in Cervical Cancer Mortality
New Technologies for Cervical Cancer
Liquid Based Pap testing Automated Pap smear screening HPV Testing VIA HPV Vaccine
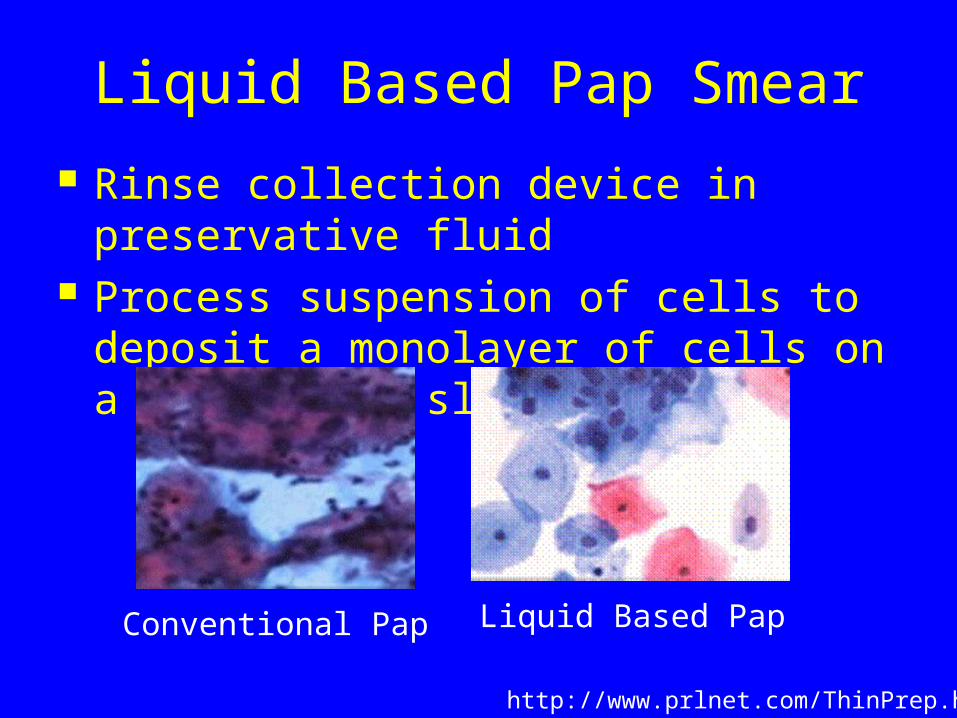
Liquid Based Pap Smear
Rinse collection device in preservative fluid
Process suspension of cells to deposit a monolayer of cells on a microscope slide
Conventional Pap Liquid Based Pap
http://www.prlnet.com/ThinPrep.htm
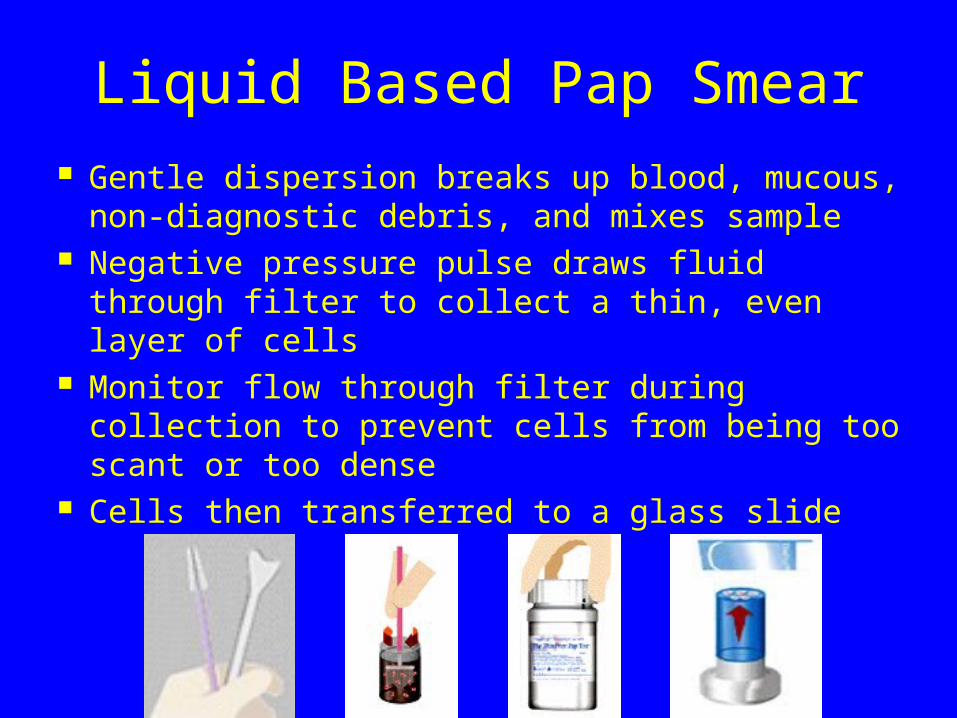
Liquid Based Pap Smear Gentle dispersion breaks up blood, mucous,
non-diagnostic debris, and mixes sample Negative pressure pulse draws fluid through
filter to collect a thin, even layer of cells Monitor flow through filter during collection to
prevent cells from being too scant or too dense Cells then transferred to a glass slide
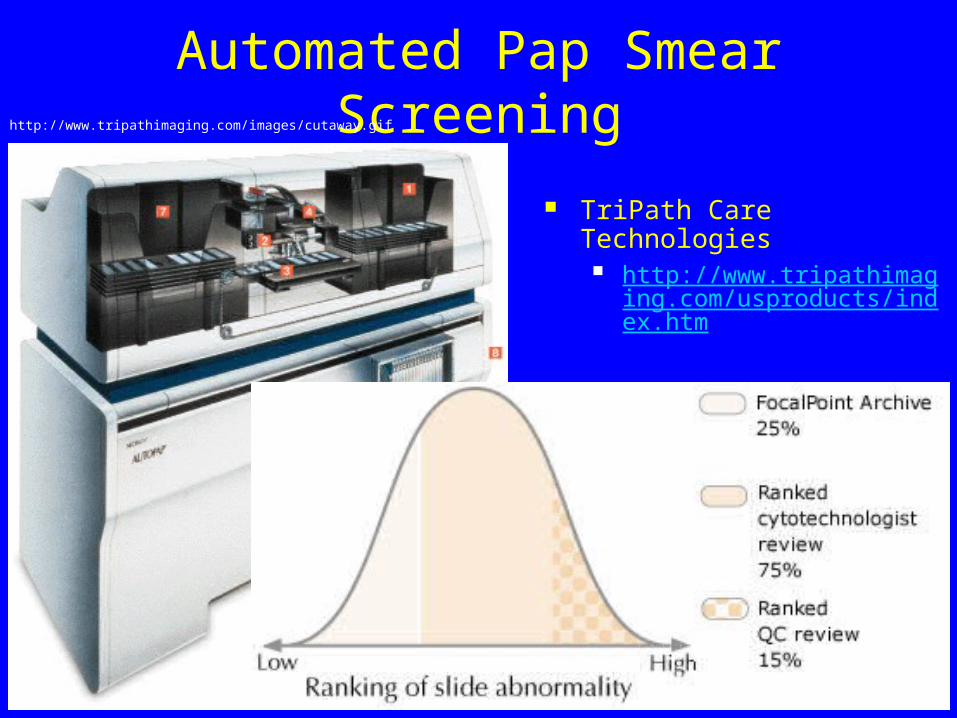
Automated Pap Smear Screening
TriPath Care Technologies http://www.tripathimaging.
com/usproducts/index.htm
http://www.tripathimaging.com/images/cutaway.gif
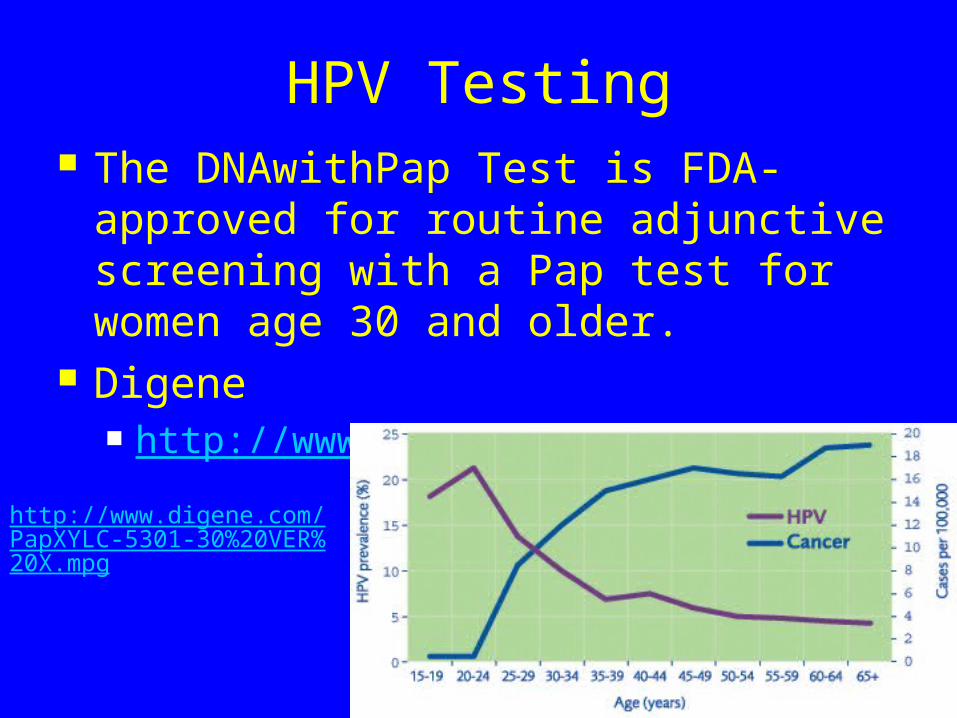
HPV Testing The DNAwithPap Test is FDA-
approved for routine adjunctive screening with a Pap test for women age 30 and older.
Digene http://www.digene.com
http://www.digene.com/PapXYLC-5301-30%20VER%20X.mpg
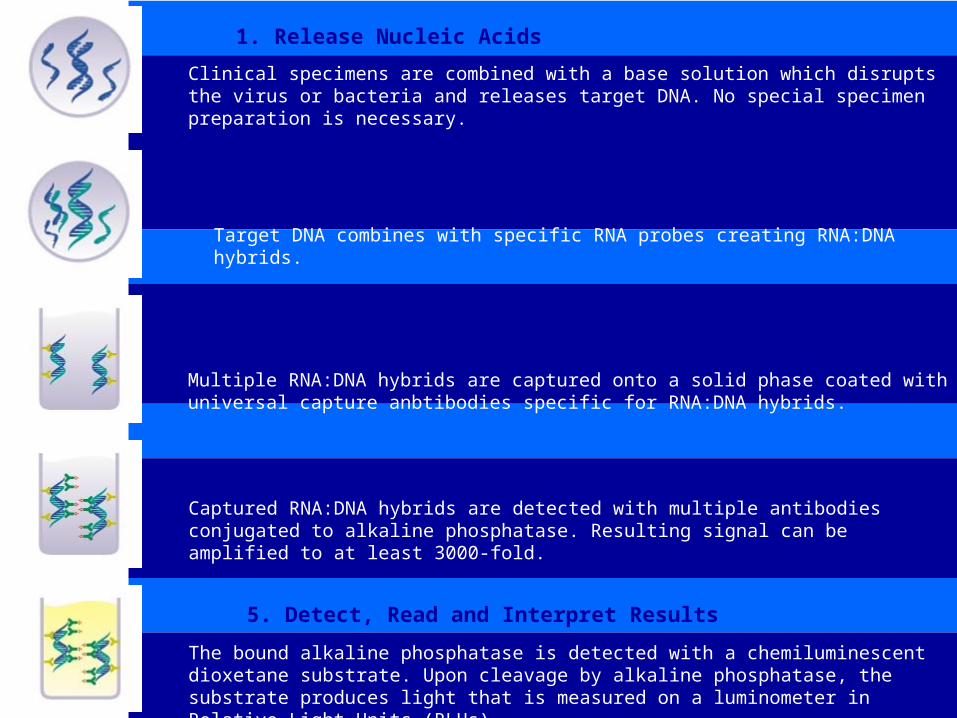
1. Release Nucleic Acids
Clinical specimens are combined with a base solution which disrupts the virus or bacteria and releases target DNA. No special specimen preparation is necessary.
2. Hybridize RNA Probe with Target DNA
Target DNA combines with specific RNA probes creating RNA:DNA hybrids.
3. Capture Hybrids
Multiple RNA:DNA hybrids are captured onto a solid phase coated with universal capture anbtibodies specific for RNA:DNA hybrids.
4. Label for Detection
Captured RNA:DNA hybrids are detected with multiple antibodies conjugated to alkaline phosphatase. Resulting signal can be amplified to at least 3000-fold.
5. Detect, Read and Interpret Results
The bound alkaline phosphatase is detected with a chemiluminescent dioxetane substrate. Upon cleavage by alkaline phosphatase, the substrate produces light that is measured on a luminometer in Relative Light Units (RLUs).
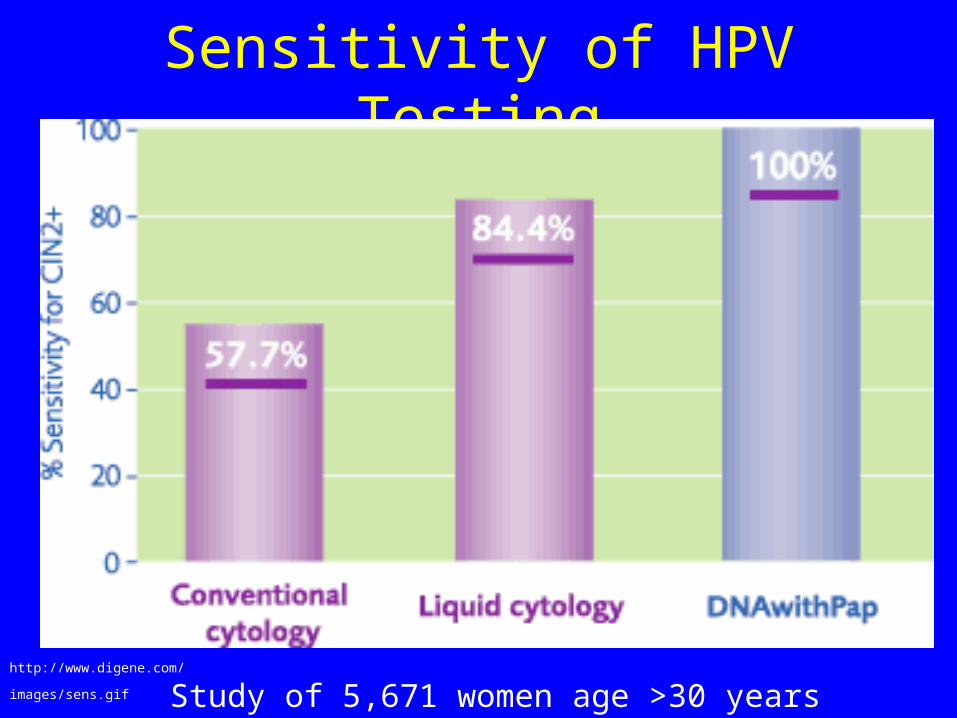
Sensitivity of HPV Testing
Study of 5,671 women age >30 years http://www.digene.com/
images/sens.gif
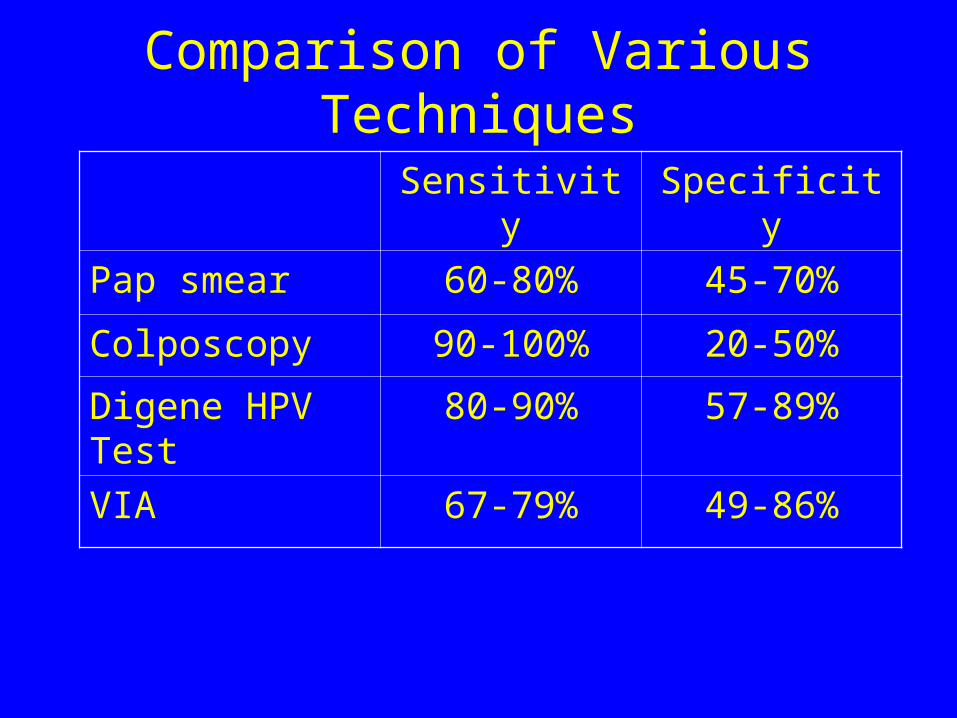
Comparison of Various Techniques
Sensitivity Specificity
Pap smear 60-80% 45-70%
Colposcopy 90-100% 20-50%
Digene HPV Test
80-90% 57-89%
VIA 67-79% 49-86%
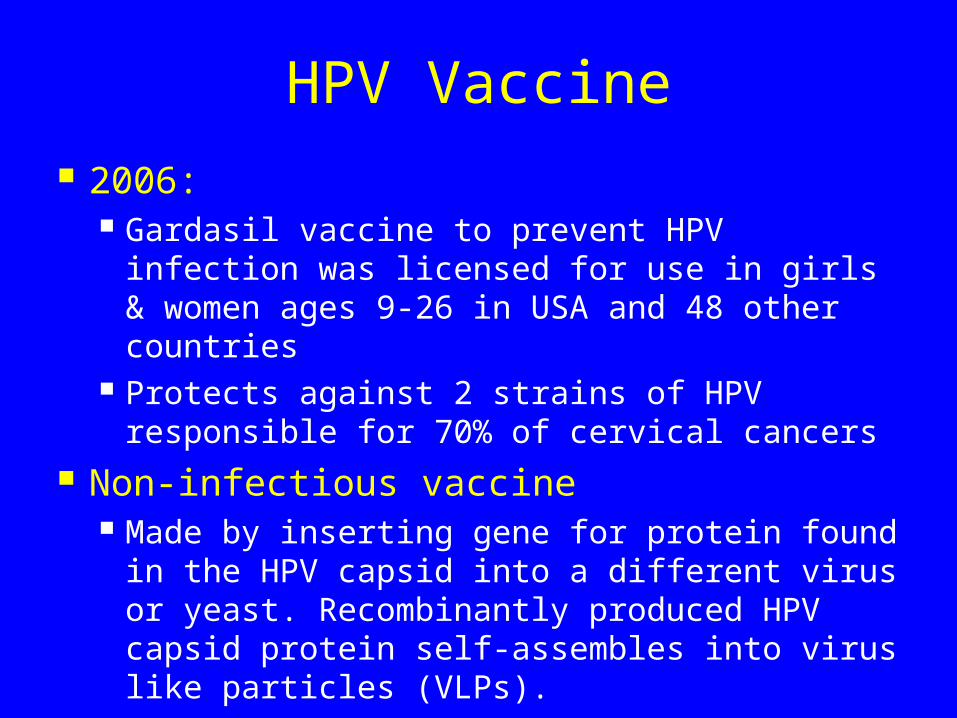
HPV Vaccine 2006:
Gardasil vaccine to prevent HPV infection was licensed for use in girls & women ages 9-26 in USA and 48 other countries
Protects against 2 strains of HPV responsible for 70% of cervical cancers
Non-infectious vaccine Made by inserting gene for protein found in
the HPV capsid into a different virus or yeast. Recombinantly produced HPV capsid protein self-assembles into virus like particles (VLPs).
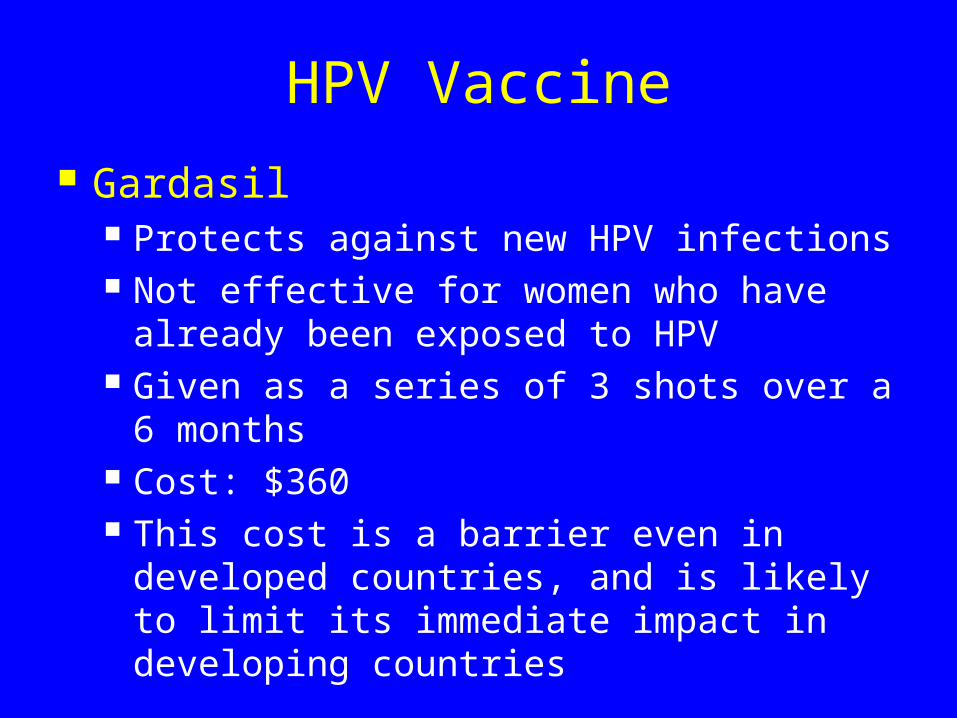
HPV Vaccine
Gardasil Protects against new HPV infections Not effective for women who have
already been exposed to HPV Given as a series of 3 shots over a 6
months Cost: $360 This cost is a barrier even in developed
countries, and is likely to limit its immediate impact in developing countries
HPV & Cervical Cancer
Do condoms prevent HPV?
Do we still need to screen women who have been
vaccinated?
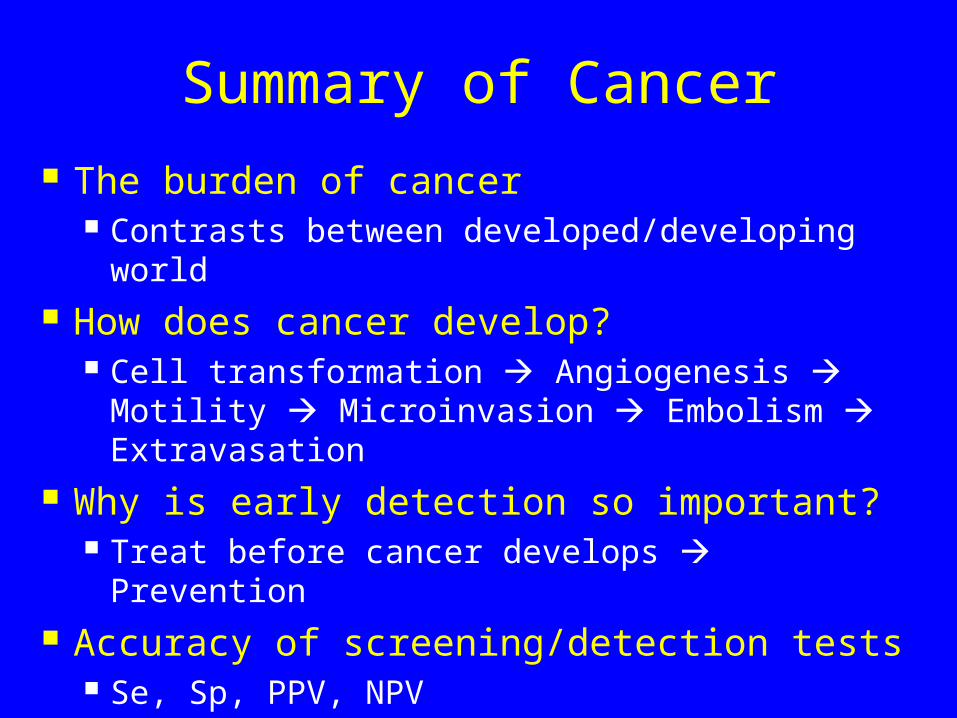
Summary of Cancer The burden of cancer
Contrasts between developed/developing world
How does cancer develop? Cell transformation Angiogenesis
Motility Microinvasion Embolism Extravasation
Why is early detection so important? Treat before cancer develops Prevention
Accuracy of screening/detection tests Se, Sp, PPV, NPV
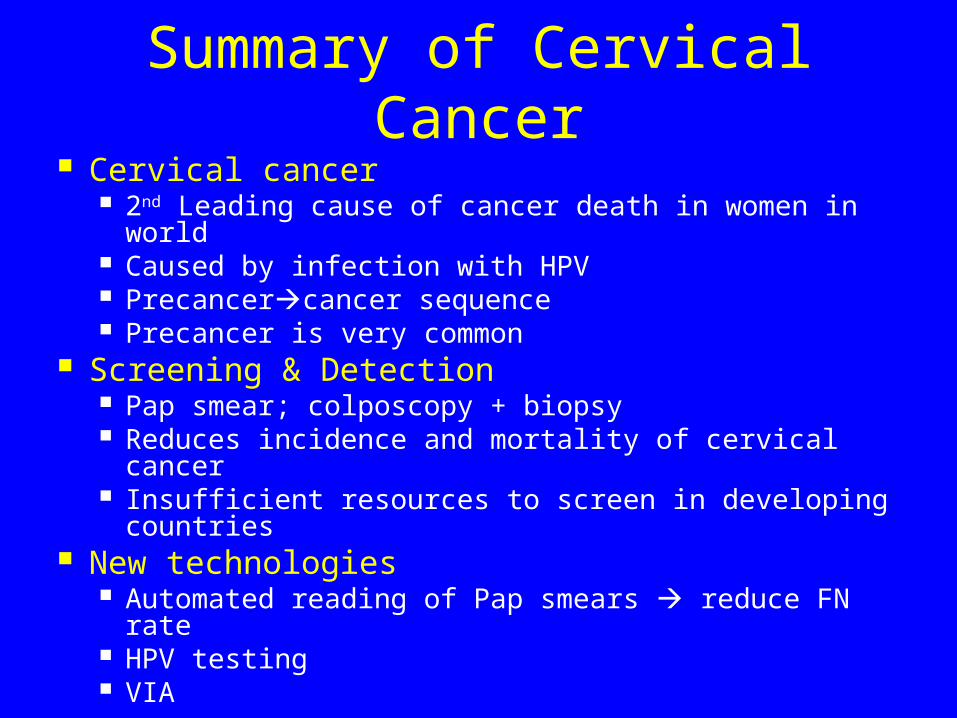
Summary of Cervical Cancer Cervical cancer
2nd Leading cause of cancer death in women in world
Caused by infection with HPV Precancercancer sequence Precancer is very common
Screening & Detection Pap smear; colposcopy + biopsy Reduces incidence and mortality of cervical cancer Insufficient resources to screen in developing
countries New technologies
Automated reading of Pap smears reduce FN rate
HPV testing VIA