Embed Size (px)
Citation preview

Master Thesis, Department of Geosciences
Bivariate Statistical Analysis of Landslide Susceptibility in
Western Nepal
Mina Adhikari

Bivariate Statistical Analysis of Landslide Susceptibility in Western
Nepal
Mina Adhikari
Master Thesis in Geosciences
Discipline: Environmental Geology
Department of Geosciences
Faculty of Mathematics and Natural Sciences
University of Oslo
1 June 2011

© "[Mina Adhikari]", 2011
Supervisors: Farrokh Nadim (University of Oslo, Blindern, and Norwegian Ge-
otechnical Institute, Oslo), and Dr. José Mauricio Cepeda (Norwegian Geotechnical Institute,
Oslo).
This work is published digitally through DUO – Digitale Utgivelser ved UiO
http://www.duo.uio.no
It is also catalogued in BIBSYS (http://www.bibsys.no/english)
All rights reserved. No part of this publication may be reproduced or transmitted, in any
form or by any means, without permission.

Master Thesis: Bivariate Statistical Analysis of Landslide Susceptibility in Western Nepal i
ABSTRACT
Landslide susceptibility mapping is very crucial for planning and development in a
disaster prone region in Nepal. Nepal is one of the landslide prone countries of the World.
Very high relief, steep slopes, complex geology and diverse vegetation cover has made
Nepal vulnerable to landslides. Some national level and individual research initiatives
have been published about landslide process, mechanisms and hazard zonation. But there
are a few studies carried out in the Western region of Nepal which is one of the landslide
affected regions of the country.
The main purpose of the study was to prepare landslide susceptibility maps of the
five sample sites of Western Nepal (Palpa/Gulmi, Palpa, Baglung/Myagdi, Parbat and
Kaski) and validate the result by model replication. A number of qualitative and quantita-
tive landslide susceptibility assessment methods exist to evaluate the landslide susceptibil-
ity. They are briefly reviewed here. In this study, a bivariate statistical method-Landslide
Nominal Susceptibility Factor (LNSF) is employed to analyze the data. Database of related
landslide casual factor maps: slope, lithology and land cover were derived in Arc GIS envi-
ronment. Landslide Susceptibility Index (LSI) maps were generated by establishing a rela-
tionship between landslides and the factor maps. Distinct color variations between bounda-
ries of the lithology were visible in the maps. The reason for this was the weighting pro-
cess.
The analysis of relationship between landslide inventory and the thematic maps in-
ferred that casual factors such as slope gradients, lithology and land use pattern contributed
to landslide process. But the contribution of each parameter was site dependent. The opti-
mum range of slope gradient from where the landslide distribution recessed varied between
study areas. The landslides in sedimentary rocks failed in lower angles. Terai, Siwaliks,
Lower Nuwakot, Upper Nuwakot and Tansen lithological zones composed of alluvial soils,
sedimentary and metamorphic rock; were prone to landslides. Although Higher Himalayan
zone consists of relative stable rock masses; it consisted of some landslides. High slope
gradients and bare rocks induce landslide in this zone. The intensive land use in fragile
geology also contributed positively for landslide failure in lower slope angles. In Pal-
pa/Gulmi and Palpa, Parbat and Kaski cropland and forests were most sensitive to land-
slides. Large proportions of landslides were confined to cropland and forests. The forests

Master Thesis: Bivariate Statistical Analysis of Landslide Susceptibility in Western Nepal ii
in these areas are intensively used as a result forests are degraded. The other most im-
portant aspect is that presence of forests in highly prone lithology might induce landslides
due to added canopy and stem weights of trees during monsoons. Another reason is that the
vegetated areas in steep slopes with little soil also affects the soil-root anchorage of the
vegetation and consequently affect the landslide process.
The effect of each parameter was analyzed using rating curves. The analyses indi-
cated that the effect of susceptibility parameters is site specific. The effect of lithology was
distinct in Palpa/Gulmi, Palpa and Baglung/Myagdi while slope, lithology and land cover
had similar effect for Parbat and Kaski. Including an input parameter in susceptibility anal-
ysis does change the output. The exclusion of land cover when susceptibility mapping did
not show any changes in the rating curves. Therefore, identifying the most influential pa-
rameter is important for susceptibility modeling.
Model replication proved moderately successful for areas of similar lithology con-
ditions. The rating curves were slightly higher than the hypothetical diagonal curve of 0
to1. The first 20% high susceptibility zone occupied around 38% and 39% of the landslides
in Palpa/Gulmi and Parbat respectively.
Model validation produced moderately satisfactory results when area distribution
by susceptibility class between calibrated and validated model was compared. An increase
in percentage of area in very low and low susceptibility classes in both replications was
observed. In Palpa/Gulmi, calibrated map occupied 33% of the total area while model rep-
licated map yielded 37% of the total area. In Parbat, calibrated map hosted 6% of the total
whereas model replicated map owned 36% of the total area. Larger areas in lower suscep-
tibility zones have implications over land use management. Larger area in lower suscepti-
bility zones means large proportion of area can be used. Similarly, it improved the predic-
tive capacity of the model by reducing the area of most susceptible zones by 32% com-
pared to the area predicted in the original map (susceptibility map developed using the
landslides of the same area) in Parbat.

Master Thesis: Bivariate Statistical Analysis of Landslide Susceptibility in Western Nepal iii
ACKNOWLEDGEMENT
I am grateful to my supervisors Professor Farrokh Nadim and Dr. José Mauricio
Cepeda for their constructive guidance and supervision throughout the research period.
I would like to thank Bård Romstad, Trond Eiken and Helge Christian Smebye for
their advices in data analysis in Arc GIS.
My thanks go to University of Oslo and Norwegian Geotechnical Institute
(NGI)/International Centre for Geohazards (ICG) for providing me data and space to con-
duct the research.
Finally, I am grateful to my family for their enormous and continuous moral sup-
port to complete my study.
Last but not the least, I wish to submit my gratitude to all my friends who contrib-
uted in miscellaneous ways for the completion of this work.
Master Thesis: Bivariate Statistical Analysis of Landslide Susceptibility in Western Nepal iv
TABLE OF CONTENTS
ABSTRACT .......................................................................................................................... 1
ACKNOWLEDGEMENT ................................................................................................. III
TABLE OF CONTENTS .................................................................................................... IV
LIST OF TABLES ............................................................................................................. VI
LIST OF FIGURES ........................................................................................................... VII
1. INTRODUCTION ............................................................................................. 1
2. BRIEF OVERVIEW OF LANDSLIDE INVESTIGATION IN NEPAL ......... 3
3. LANDSLIDE DEFINITION AND THEORY .................................................. 4
4. FACTORS CAUSING LANDSLIDE SUSCEPTIBILITY IN NEPAL ........... 7
4.1 TOPOGRAPHY ............................................................................................ 8
4.2 LITHOLOGY ................................................................................................ 8
4.3 LAND COVER AND VEGETATION ........................................................ 10
4.4 SOIL MOISTURE ....................................................................................... 11
4.5 CLIMATE ................................................................................................... 12
5. AIM OF THE STUDY .................................................................................... 13
6. LIMITATIONS OF THE STUDY .................................................................. 13
7. DESTRIPTION OF THE STUDY AREA ...................................................... 13
8. METHODOLOGY .......................................................................................... 21

Master Thesis: Bivariate Statistical Analysis of Landslide Susceptibility in Western Nepal v
8.1 LANDSLIDE SUSCEPTIBILITY ANALYSIS METHODS ...................... 21
8.2 LANDSLIDE NOMINAL SUSCEPTIBILITY FACTOR .......................... 22
8.3 VALIDATION STRATEGY ....................................................................... 25
8.4 DATA COLLECTION AND PREPARATION .......................................... 26
8.4.1 Slope map preparation ........................................................................ 26
8.4.2 Lithology map preparation .................................................................. 27
8.4.3 Land cover map preparation ............................................................... 32
8.4.4 Landslide inventory database preparation .......................................... 35
9. RESULTS AND DISCUSSION ...................................................................... 35
9.1 RELATIONSHIP BETWEEN LANDSLIDES AND CASUAL FACTORS
36
9.1.1 Landslide distribution in slope gradient .............................................. 36
9.1.2 Landslide distribution in lithology class ............................................. 37
9.1.3 Landslide distributions in land cover class ......................................... 39
9.2 LANDSLIDE SUSCEPTIBILITY MAPPING ............................................ 41
9.3 PARAMETRIC EFFECT ANALYSIS ........................................................ 45
9.4 MODEL REPLICATION TO TEST VALIDITY ........................................ 49
10 CONCLUSIONS ............................................................................................. 54
REFERENCES .................................................................................................................... 57
APPENDICES ..................................................................................................................... 65
Master Thesis: Bivariate Statistical Analysis of Landslide Susceptibility in Western Nepal vi
LIST OF TABLES
Table 1 Geomorphic units of Nepal ...................................................................................... 9
Table 2 Land use classification of Nepal............................................................................. 11
Table 3 Database of study areas .......................................................................................... 26
Table 4 Lithology units of study areas ................................................................................ 28
Table 5 Land cover classification. ....................................................................................... 32
Table 6 Landslides records of study areas ........................................................................... 35
Table 7 Susceptibility class and values ............................................................................... 42
Table 8 Landslide susceptibility zones and percentage of area in calibrated and model
replicated map of Palpa/Gulmi ............................................................................................ 52
Table 9 Landslide susceptibility zones and percentage of area in calibrated and model
replicated map of Parbat ...................................................................................................... 53

Master Thesis: Bivariate Statistical Analysis of Landslide Susceptibility in Western Nepal vii
LIST OF FIGURES
Figure 1 Map of the study area ............................................................................................ 16
Figure 2 DEM of Palpa/Gulmi and Palpa with landslide inventory .................................... 17
Figure 3 DEM of Baglung/Myagdi and Parbat with landslide inventory .......................... 18
Figure 4 DEM of Kaski with landslide inventory .............................................................. 19
Figure 5 Slope maps of Parbat, and Kaski .......................................................................... 19
Figure 6 Slope maps of Palpa/Gulmi, Palpa and Baglung/Myagdi ..................................... 20
Figure 7 Flow chart of landslide susceptibility analysis by bivariate statistical method .... 24
Figure 8 Classified lithology maps of Palpa/Gulmi, Palpa, Baglung/Myadgi, Parbat and
Kaski. ................................................................................................................................... 31
Figure 9 Classified lithology maps of Palpa/Gulmi, Palpa, Baglung/Myadgi, Parbat and
Kaski by NGI classification ................................................................................................. 31
Figure 10 Classified land cover map of Palpa/Gulmi, Palpa and Baglung/Myadgi ............ 33
Figure 11 Classified land cover map of Parbat and Kaski .................................................. 34
Figure 12 Landslide distribution according to slope class. ................................................. 37
Figure 13 Landslide distribution according to lithology class ............................................ 38
Figure 14 Landslide distribution according to lithology class ............................................ 40
Figure 15 Susceptibility maps of Palpa/Gulmi, Palpa, Baglung/Myadgi ........................... 43
Figure 16 Susceptibility maps of Parbat and Kask .............................................................. 44

Master Thesis: Bivariate Statistical Analysis of Landslide Susceptibility in Western Nepal viii
Figure 17 Landslide susceptibility index ranked (x-axis) and cumulative percentage of
landslide occurrence (y-axis) of Palpa/Gulmi ..................................................................... 46
Figure 18 Landslide susceptibility index ranked (x-axis) and cumulative percentage of
landslide occurrence (y-axis) of Palpa ................................................................................ 47
Figure 19 Landslide susceptibility index ranked (x-axis) and cumulative percentage of
landslide occurrence (y-axis) of Baglung/Myadgi .............................................................. 47
Figure 20 Landslide susceptibility index ranked (x-axis) and cumulative percentage of
landslide occurrence (y-axis) of Parbat ............................................................................... 48
Figure 21 Landslide susceptibility index ranked (x-axis) and cumulative percentage of
landslide occurrence (y-axis) of Kaski ................................................................................ 49
Figure 22 Landslide susceptibility maps of Palpa/Gulmi and Parbat .................................. 51
Figure 23 Cumulative frequency of susceptibility area and landslide occurrence of .......... 51
Figure 24 Cumulative frequency of susceptibility area and landslide occurrence of Parbat
............................................................................................................................................. 52
Master Thesis: Bivariate Statistical Analysis of Landslide Susceptibility in Western Nepal 1
1. INTRODUCTION
Nepal is a mountainous country in between India and China constituting one third
of the Himalayan arc that resulted from Indian and Eurasian plate collision (Powell and
Conaghan 1973, Molnar and Tapponnier 1975, Bilham et al. 1997). The distinct features of
the Nepal are steep slopes, extreme relief, rugged topography, and high elevation ranging
from 60m to 8848 m from a.s.l. within around 200 km north-south extent (Duncan et al.
2003). Presence of complex geology, diverse climatic conditions and floral diversity within
a small elevation range makes Nepal a unique place of the world. However, these distinct
physiography and biogeography, which are the consequence of seismic, tectonic, hydro-
logic and geomorphologic processes, have made it vulnerable to natural disaster
(Hasegawa et al. 2009, Pokhrel et al. 2009).
Nepal experiences various geohazards such as earthquakes, landslides, flood, forest
fire, windstorm, avalanche, and epidemics. Landslides are the most common natural haz-
ards affecting people and property (Upreti 1999, Lave et al. 2005, Petley et al. 2007,
Hasegawa et al. 2009, Pokhrel et al. 2009, Poudyal et al. 2010).These are scale dependent
ranging from massive failure of single peaks to small slopes failures (Shroder Jr and
Bishop 2004).
Landslides occur due to a combination of trigger mechanisms and susceptibility
factors such as fragile and complex geology, steep slopes, rugged topography, variable
climatic and microclimatic conditions, rainfall, earthquake and vegetation degradation
(Gerrard and Gardner 2002, Wobus et al. 2003, Hasegawa et al. 2009). Landslide suscepti-
bility varies from one region to another in Nepal. This variation is often attributed to rain-
fall. Rainfall-induced landslides occur almost annually during monsoon and distribution of
rainfall is uneven throughout Nepal (Kansakar et al. 2004). Similarly, human activities
have also aggravated landslide susceptibility due to improper land use practices, unplanned
infrastructure development and over exploitation of natural resources (Kienholz et al.
1983, Mahat et al. 1986, Tiwari 2000).
Landslides affect people, infrastructures and property regularly in Nepal. Unfortu-
nately, the effects of landslides are poorly quantified in terms of economic costs (Petley et
Master Thesis: Bivariate Statistical Analysis of Landslide Susceptibility in Western Nepal 2
al. 2004). Even many susceptible sites are not identified yet. Therefore, understanding
landslides susceptibility and their effects is a crucial issue given the cost of landslides.
Different research and implementation efforts are in progress to address the land-
slide process and its causes and consequences. For example World Bank sponsored land-
slide mapping in Nepal (NGI 2004), rural access programs, Disaster Management and
Early Warning System (organized by different local organization but funded by donor
agencies).
However, the national and international efforts to address the landslide vulnerabil-
ity have been less successful. Heavy investment is being made in Nepal by many interna-
tional organizations including Department for International Development-UK (DFID-UK),
Japan International Cooperation Agency (Japan), and Deutsche Gesellschaft fur Internatio-
nale Zusammenarbeit (GTZ-Germany), World Bank, Asian Development Bank for pro-
grams such as rural access program where landslide occurrence is a key issue (Dahal et al.
2006). But, in the majority of cases international supports are confined to collaborative
road projects in specific locations where the road is being built. The government effort is
limited to post disaster support programs.
Within the last two decades, several papers have been published on geomorphic,
tectonic and seismic activities in the Himalayas. Although landslides are also the result of
these seismic and tectonic processes these papers are either not giving sufficient explana-
tion on the linkages of these processes with landslides or their effects were considered as
seismic events such as earthquake in most cases (Caine and Mool 1982, Gerrard 1994,
Dhakal et al. 1999, Hasegawa et al. 2009, Poudyal et al. 2010). Similarly, in case of flood
studies, landslides were not distinguished from flood events because they occurred in tan-
dem. Consequently, landslides were under estimated in these studies (Paudel et al. 2003,
NGI 2004).
A number of research case studies have been published about different aspects of
landslides but they are scattered in different locations. Most of these case studies cover a
very small part of a place as a study unit (Ives and Messerli 1981, Wagner 1983,
Heuberger et al. 1984, Gerrard 1994, Upreti and Dhital 1996, Gerrard and Gardner 2002,
Petley et al. 2007, Hasegawa et al. 2009, Poudyal et al. 2010). The findings of the case

Master Thesis: Bivariate Statistical Analysis of Landslide Susceptibility in Western Nepal 3
studies are yet to be synthesized and integrated in local and national landslide planning and
management. Therefore, many potential areas are yet to be explored about landslides. Par-
ticularly, regions and sites with large population density and valuable resources are in ur-
gent need of the landslide susceptibility evaluation.
2. BRIEF OVERVIEW OF LANDSLIDE INVESTIGATION IN NEPAL
In Nepal, landslides occur due to combined effects of landslide-inducing and causal
factors (Gerrard 1994, Gerrard and Gardner 2002, Hasegawa et al. 2009, Ghimire 2011).
These landslide activating agents such as rainfall, earthquake and seismic events are also
called trigger mechanisms. Susceptibility factors include intrinsic material properties of
earth and physical topography such as steep slopes, rugged topography, sparse vegetation
cover, fragile geological formations and structurally fragmented rock materials (Wieczorek
1996). In addition to, human activities also aggravate landslide susceptibility due to insuf-
ficient attention being given in the land use practices, infrastructure development and over
exploitation of natural resources (Paudel et al. 2003, Petley et al. 2004, Petley et al. 2007).
Natural factors causing landslides in Nepal are discussed in section 4. A short summary of
landslide studies in Nepal is discussed in this section.
In Nepal, landslides have occurred since prehistoric times. Moraines and rock min-
eral deposits are the evidence of past landslides. For example, the Langtang landslide oc-
curred during the last glacial and inter glacial periods and landslide deposits as moraines
and different forms of rock minerals from the same period are found in the Langtang val-
ley. But records of these prehistoric landslides are scarcely available (Heuberger et al.
1984).
Laban (1979) pioneered the task of landslide investigation in Nepal. The next land-
slide investigation initiative started when the Mountain Hazards Mapping Project, spon-
sored by the Nepal National Committee for Man and Biosphere (MAB) and the United
Nations University was established in 1980s (Caine and Mool 1982). The main objectives
of the project were (1) the production of prototype maps to show slope stability and moun-
tain hazards in Nepal and (2) the development of corresponding methods for assessing
mountain hazards.

Master Thesis: Bivariate Statistical Analysis of Landslide Susceptibility in Western Nepal 4
A number of papers have been published about landslides that significantly con-
tribute to the knowledge of landslide processes, mechanisms, causes and associated haz-
ards (Laban 1979, Ives and Messerli 1981, Caine and Mool 1982, Kienholz et al. 1983,
Wagner 1983, Heuberger et al. 1984, Gerrard 1994, Rowbotham and Dudycha 1998,
Dhakal et al. 1999, Gerrard and Gardner 2002, Gabet et al. 2004b, Petley et al. 2004,
Petley et al. 2007, Hasegawa et al. 2009, Poudyal et al. 2010, Ghimire 2011).
But a few studies on landslide hazard, causes and its impact are focused on the
Western Region of Nepal (Waltham 1996, Rowbotham and Dudycha 1998, Dhittal et al.
2008, Regmi et al. 2010, Gurung et al. 2011). Western Region of Nepal is one of the land-
slide prone regions of the country.
Recently, a national level landslide hazard mapping process has been initiated in
Nepal. This process was executed by Norwegian Geotechnical Institute, Norway and spon-
sored by World Bank (NGI 2004). Landslide Hazard Maps for Nepal are being prepared
using the global datasets. Therefore, once finalized they can certainly provide an extent of
general hazard situation of Nepal.
Prior to this study, an assessment of landslide hazards and risk for SAR countries
including Nepal was conducted by Norwegian Geotechnical Institute (NGI) and World
Bank in 2004 (NGI 2004). The study concluded that Nepal is one of the highly landslide
exposed countries of the world due to its topography, geology, climatic factors and human
interference such as urbanization and deforestation.
This initiative started as a result of World Bank sponsored ‘‘Global landslide and
avalanche hotspots study’’. The study identified the most exposed countries of the world to
landslide hazard. South Asia Region (SAR) including India and Nepal were identified as
highest risk areas on the basis of risk maps developed using hazard maps and population
exposure maps (Nadim et al. 2006).
3. LANDSLIDE DEFINITION AND THEORY
The term ‘landslide’ refers to geological phenomena which include a wide range of
ground movements. It also describes processes that involve downward and outward

Master Thesis: Bivariate Statistical Analysis of Landslide Susceptibility in Western Nepal 5
movement of earth materials including rocks and soils that result in slope modification.
Various authors have attempted to explain the term landslide including many types of mass
movements.
Cruden (1991) defined ‘‘landslide as the movement of a mass of rock, earth or de-
bris down a slope’’. The joint ISSMGE, ISRM and IAEG Technical Committee on land-
slides and Engineered Slopes (JTC-1) defined ‘‘landslides as the downslope movement of
mass of rocks, debris and soil or earth’’ (Fell et al. 2008). All these definitions describe the
movement of earth material without any landslides inducing agents. These processes are
categorized on the basis of i) kind of material involved ii) type of movement, and iii) state
of phenomena.
Cruden and Varnes (1996) provided a classification of slope movement on the ba-
sis of nature of material and type of movement. Type of material involved in slope move-
ment is grouped into rock, debris and earth. ‘Rock’ is- a hard mass that was intact and in its
natural place before the initiation of movement. ‘Earth’ -constitutes soil material with 80
percent or more particles smaller than 2mm in size. ‘Debris’- contains coarse material with
20-80 percent of the particles larger than 2mm in size.
According to Cruden and Varnes (1996) mass movement types include fall, topple,
slide, spread and flow. Falls and topples are sudden movement of mass of earth material
mainly induced by gravity. Falls are abrupt movement of mass of rocks and/or soils from
steep slopes or cliffs. Falls occur by free fall and rolling which are highly influenced by
gravity, mechanical weathering and inertial water. Falls occur along discontinuities such as
fractures, faults, joints and bedding planes. Topple is the forward rotation out of the slope
of a mass of soil or rock about a point or axis below the center of gravity of the displaced
mass. Topple is driven by gravity and ice or water present in the mass.
Other types of mass movements are slide, spread and flow. Slide is the mass
movement from a distinct zone of weakness that separates the slide material from stable
underlying material. Two main types of slides are rotational slide and translational slide. In
rotational slide the surface of rupture is curved concavely upward and the slide movement
is roughly rotational about an axis that is parallel to the ground surface and transverse to
across the slide. In translational slide the landslide mass moves nearly in planer surface

Master Thesis: Bivariate Statistical Analysis of Landslide Susceptibility in Western Nepal 6
with little or backward tilting. Spread slow movement of cohesive mass of rock or soil
combined with subsidence of the fractured mass of cohesive material into softer underlying
material. Spreads occur due to liquefaction of flow of softer material. Flow is a continuous
movement of soil or rock materials in which surface of shear are short lived. Combining
the type of movement and materials involved in landslide process different names are
formed. The most common types slope movements based on the type of material moved
are rock fall, debris flow and landslide.
Landslides can be grouped into three types based on the state of phenomena: active,
passive and reactivated. Active landslide is a landslide that is moving at present either for
the first time or reactivated. Passive landslide is that which occurred in the past such as
prehistoric landslide but bears a potentiality to be reactivated. Reactivated landslide is a
landslide that is active after being inactive (Fell et al. 2008).
Since this study assesses landslide susceptibility, it is important to define the term
susceptibility also. The term landslide susceptibility refers to qualitative or quantitative
assessment of future landslide occurrence. The probability of landslide occurrence is de-
fined on the basis of correlation between the controlling factors for slope instability and the
spatial distribution of landslide that occurred in the past (Lee and Min 2001, Fell et al.
2008) . Spatial distribution of landslides is evaluated on the basis of existing landslides or
potential landslides that may occur in near future. These are identified on the basis of their
sources. The location of landslide source could be in the area or may have their source out-
side the area but may travel onto or regress into the area.
The basic principle behind landslides is slope instability. Slope stability expresses a
balanced relationship between shear stress and shear strength (Duncan 1996). In every
slope gravity-induced shear stress exists which increases with slope height, slope inclina-
tion, and unit weight of the materials forming slope. Shear stresses are also added due to
thermal expansion and contraction of surface zones, freezing-thawing actions and other
factors. Under normal conditions, slope surfaces are in equilibrium between the shear
stress and shear resistance. A loss of balance between the resisting and driving forces can
create a landslide (Duncan 1996, Holtz and Schuster 1996).
Master Thesis: Bivariate Statistical Analysis of Landslide Susceptibility in Western Nepal 7
Driving forces are those forces which move earth materials downslope. These in-
clude components of weight of material including fill material, vegetation, or buildings.
Resisting forces are those forces which oppose the movement. These include strength of
material.
Shear stresses increases by steepening slopes due to removal of material from bot-
tom of slopes, by imposition of surcharges, by transitory stresses resulting from explosions
or seismic activities or uplifting or tilting of land surfaces (Holtz and Schuster 1996).
Shear strength affects slope stability. Shear strength of a rock and/or soil material is
reduced by physical (such as weathering) and chemical processes. Material properties in-
cluding composition and arrangement of particles affect landslide process. Material proper-
ty may be naturally weak or may become weak due to natural process such as water satura-
tion. For example organic materials and clays have low natural strengths. Mass properties
of soils and rocks can be weakened by discontinuities such as faults, foliation, bedding
surfaces, cleavages, joints, fissures, shears, and sheared zones (Keaton and Beckwith
1996).
These parameters that increase shear stress and reduce shear strength of the slope
could be categorized into external and internal factors. Internal factors include topographic
parameters such as slope, ground water, soil moisture, lithology; geological structures such
as faults, joints, bedding planes. Most common external factors influencing landslides are
the vibrations due to earthquakes, blasting due to explosives and volcanic eruptions etc.
In this study, landslide susceptibility is evaluated on the basis of relationship be-
tween landslide causal factors and past landslides. The internal factors influencing slope
stability in Nepal are summarized below.
4. FACTORS CAUSING LANDSLIDE SUSCEPTIBILITY IN NEPAL
Natural and man-made factors contribute to landslide occurrence in Nepal (Gerrard
1994, Gerrard and Gardner 2002, Hasegawa et al. 2009, Ghimire 2011). These elements
are called trigger mechanisms (for example rainfall, earthquake and seismic events) and
susceptibility factors (such as steep slopes, rugged topography, sparse vegetation cover,
Master Thesis: Bivariate Statistical Analysis of Landslide Susceptibility in Western Nepal 8
fragile geological formations and structurally fragmented rock materials) (Wieczorek
1996). Human activities also aggravate landslide susceptibility due to insufficient attention
being given in the land use practices, infrastructure development and over exploitation of
natural resources (Paudel et al. 2003, Petley et al. 2004, Petley et al. 2007). In this study,
however, the important natural factors responsible to induce landslides such as topography,
lithology, land cover, soil moisture and climate are included. These factors are discussed as
follows:
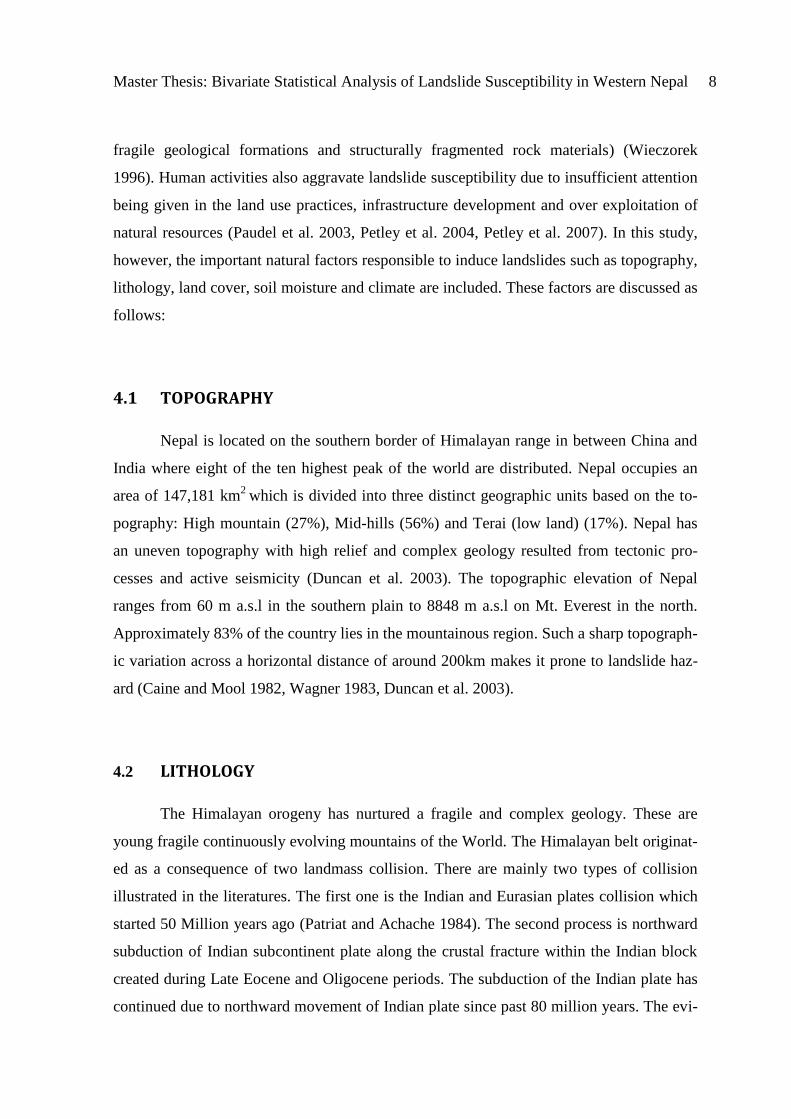
4.1 TOPOGRAPHY
Nepal is located on the southern border of Himalayan range in between China and
India where eight of the ten highest peak of the world are distributed. Nepal occupies an
area of 147,181 km2
which is divided into three distinct geographic units based on the to-
pography: High mountain (27%), Mid-hills (56%) and Terai (low land) (17%). Nepal has
an uneven topography with high relief and complex geology resulted from tectonic pro-
cesses and active seismicity (Duncan et al. 2003). The topographic elevation of Nepal
ranges from 60 m a.s.l in the southern plain to 8848 m a.s.l on Mt. Everest in the north.
Approximately 83% of the country lies in the mountainous region. Such a sharp topograph-
ic variation across a horizontal distance of around 200km makes it prone to landslide haz-
ard (Caine and Mool 1982, Wagner 1983, Duncan et al. 2003).
4.2 LITHOLOGY
The Himalayan orogeny has nurtured a fragile and complex geology. These are
young fragile continuously evolving mountains of the World. The Himalayan belt originat-
ed as a consequence of two landmass collision. There are mainly two types of collision
illustrated in the literatures. The first one is the Indian and Eurasian plates collision which
started 50 Million years ago (Patriat and Achache 1984). The second process is northward
subduction of Indian subcontinent plate along the crustal fracture within the Indian block
created during Late Eocene and Oligocene periods. The subduction of the Indian plate has
continued due to northward movement of Indian plate since past 80 million years. The evi-
Master Thesis: Bivariate Statistical Analysis of Landslide Susceptibility in Western Nepal 9
dences of this subduction process can be seen as detached Himalayan thrust belt in the
south of suture zone which delineates the Indian and Eurasian plate boundaries (Powell
and Conaghan 1973). The mountain building process and the continuity of the collision
activity is manifested in the present day northward movement of India at the rate of around
5cm per year (Bilham et al. 1997, Pandey et al. 1999).
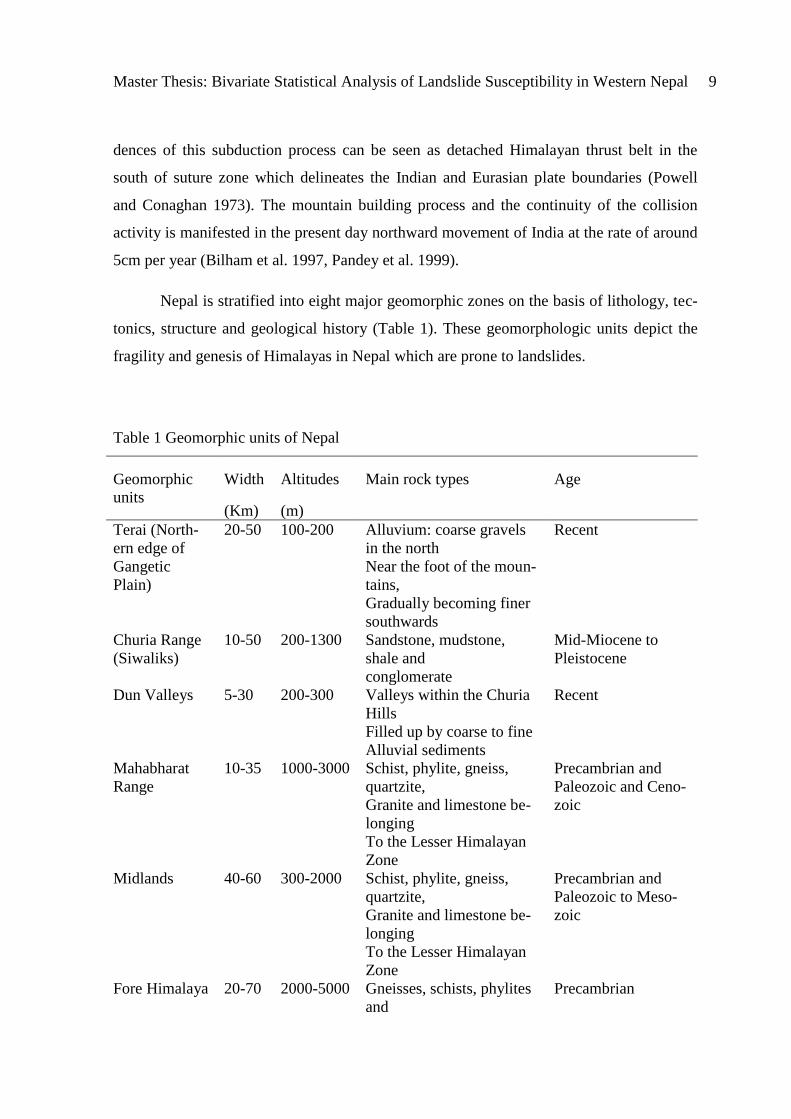
Nepal is stratified into eight major geomorphic zones on the basis of lithology, tec-
tonics, structure and geological history (Table 1). These geomorphologic units depict the
fragility and genesis of Himalayas in Nepal which are prone to landslides.
Table 1 Geomorphic units of Nepal
Geomorphic
units
Width
(Km)
Altitudes
(m)
Main rock types Age
Terai (North-
ern edge of
Gangetic
Plain)
20-50 100-200 Alluvium: coarse gravels
in the north
Near the foot of the moun-
tains,
Gradually becoming finer
southwards
Recent
Churia Range
(Siwaliks)
10-50 200-1300 Sandstone, mudstone,
shale and
conglomerate
Mid-Miocene to
Pleistocene
Dun Valleys
5-30 200-300 Valleys within the Churia
Hills
Filled up by coarse to fine
Alluvial sediments
Recent
Mahabharat
Range
10-35 1000-3000 Schist, phylite, gneiss,
quartzite,
Granite and limestone be-
longing
To the Lesser Himalayan
Zone
Precambrian and
Paleozoic and Ceno-
zoic
Midlands 40-60 300-2000 Schist, phylite, gneiss,
quartzite,
Granite and limestone be-
longing
To the Lesser Himalayan
Zone
Precambrian and
Paleozoic to Meso-
zoic
Fore Himalaya 20-70 2000-5000 Gneisses, schists, phylites
and
Precambrian

Master Thesis: Bivariate Statistical Analysis of Landslide Susceptibility in Western Nepal 10
Marbles mostly belonging
to the
Northern edge of the Less-
er
Himalayan zone
Higher
Himalaya
10-60 >5000 Gneisses, schists, phylites
and
Marbles mostly belonging
to the
Northern edge of the Less-
er
Himalayan zone
Precambrian
Inner and trans
Himalaya
5-50 2500-4500 Gneisses, schists, and
marbles of the
Higher Himalayan Zone
and
Tethyan sediments (lime-
stone,
Shale, sandstone etc.)
Belonging to Tibetan-
Tethys Zone
Precambrian and
Cambrian to Creta-
ceous
Source:adopted from Upreti (Upreti 1999)
4.3 LAND COVER AND VEGETATION
Nepal covers sub-tropical to alpine zones with around 29% of vegetation to the to-
tal area of Nepal. Biodiversity is very high in Nepal due to topography and climatic varia-
tions. Vegetation types changes with altitude and topography from south to north (Vetaas
and Grytnes 2002, Bhattarai and Vetaas 2003).
Many studies have highlighted the positive and negative effects of vegetation on
landslides. However, the main effects of vegetation on slope stability are mechanical stabi-
lization of soil due to presence of roots, soil moisture reduction by transpiration, surcharge
from the weight of the trees and wind breaking (Lawrance et al. 1996).
Vegetation plays an important role in slope stability and soil erosion control in Ne-
pal. The vegetative cover prevents the surface erosion by increased shear strength of the
soil with its root network through mechanical reinforcement, anchoring and compaction;
reduce surface flow by evapotranspiration and absorption of ground water (Gilmour et al.

Master Thesis: Bivariate Statistical Analysis of Landslide Susceptibility in Western Nepal 11
1987, Sharma et al. 2000, Shrestha and Zinck 2001). However, landslides increase during
monsoons as the sub soil becomes saturated with soil moisture. If the landslide is deeper
than the root penetration zones; than the slope failure occurs even in the presence of good
vegetation cover.
In this study, land cover is referred as different kinds of land use for example urban
areas (settlements), bare land, forest land, shrub land, grass land etc. Vegetation composi-
tion is the proportion of land occupied by different vegetation types such as trees, herbs,
and shrubs, grasses occurring in natural areas, plantations and cultivated lands. Land cover
composition of Nepal is given in table 2. Nepal occupies an area of 141718 square kilome-
ters of which 5% is covered with snow. Forests occupy approximately 29% of the total
land cover, while 18% of the total land area is under agriculture (Table 2).
Table 2 Land use classification of Nepal
Category Area (in million hectares)
Agriculture land cultivated 3091
Agriculture land uncultivated 1030
Forest 4268
Shrub land 1560
Grass and pasture land 1766
Water 383
Others 2620
Total 14718
Source (CBS 2008)
4.4 SOIL MOISTURE
A landslide is sudden failure of slope with or without the influence of water. Prior
to slope failure, there is a slope movement. Sometimes the slope movement turns into land-
slide and sometimes it does not. Most of the slope failures are caused by soil moisture or
ground water that increases pore water pressure and decreases shear strength of soil. Land-
slides are generally resulted from a combined effect of intense rainfall and antecedent wet
soil moisture conditions (Gabet et al. 2004a, Dahal and Hasegawa 2008). For slope failure
soil moisture plays an important role because water reduces the soil strength and increases

Master Thesis: Bivariate Statistical Analysis of Landslide Susceptibility in Western Nepal 12
stress. Increase in pore water pressure results into increased shear stress and decrease in
shear strength of the soil. In addition, saturation level of soil moisture content is considered
as key cause for landslides. For example landslides are caused by surface and subsurface
layer saturation (Ray & Jacobs, 2007). Since soil moisture is a very crucial factor for trig-
gering landslides, it is therefore an important parameter for landslide studies.
The soils of Nepal are highly variable and are derived mainly from young parent
material (Kaddah 1967, CBS 2008). Soils have been classified on the basis of soil texture,
mode of transportation, and color, and are broadly classified into:
Alluvial soil
Sandy and alluvial soil
Gravelly soil
Residual Soil
Glacial soil
4.5 CLIMATE
The climate of Nepal varies from subtropical to arctic, all within a distance of approx-
imately 200 kilometers. In addition to the large variations in climate, there is a great variety of
micro climatic conditions, resulting in a diversity of land use and land practices within the
country. In general, the climate of the Terai, Dun valleys, and part of the Siwaliks (up to 1000
m) is subtropical. The climate of the Middle Mountains (1000-3000 m) ranges from warm
temperate to cool temperate, and the high Mountains (2600-4000 m) from cool temperate to
sub-alpine.
The snowline lies in approximately 2500 meters during the winter. Snow rarely falls
below the 1500 meters level. On shaded north slopes, snow lingers on considerably longer
than on south facing slopes. Sources of many of the Nepal’s perennial river systems are snow
covered mountains. Farmers make use of this unique water storage and realizing feature since
these river systems supply irrigation water in a steady pace. In this way, many of the higher
snow fields supply irrigation water to the lower agricultural land during most of the year
(Sharma 1993).

Master Thesis: Bivariate Statistical Analysis of Landslide Susceptibility in Western Nepal 13
5. AIM OF THE STUDY
The main aim of the study is to prepare landslide susceptibility maps of Pal-
pa/Gulmi, Palpa, Baglung/Myadgi, Parbat and Kaski using bivariate statistical method
(LNSF) and validate the results by model replication. The specific objectives include:
1. To prepare landslide susceptibility maps of the selected study areas using bivariate
statistical method (Landslide Nominal Susceptibility Factor-LNSF) in Arc GIS en-
vironment.
2. To validate the results by split sample and model replication strategy.
6. LIMITATIONS OF THE STUDY
Accuracy of the landslide susceptibility maps depends on the nature of the data-
base. In this study, to prepare the landslide susceptibility maps of the study areas, the pub-
lished global database were used. These databases such as DEM-SRTM3, lithology and
land cover - GLOVECOVER v2.v have lower resolution but these were the only published
database freely available for Nepal. Landslide inventory database contained landslides pol-
ygons without any supporting details. Time factor posed another limitation to the study.
7. DESTRIPTION OF THE STUDY AREA
Nepal is divided into five development regions: Eastern, Central, Western, Mid-
Western and Far-Western Region. This study is concentrated in parts of Western Region.
The Western Region extends from low land (150m) to Himalayas (Annapurna and Dhaula-
giri). The climate in the hills and mountains is warm temperate and with heavy monsoon
rains in between June and September (Kansakar et al. 2004). The Western Region receives
larger amount of rainfall compared to other regions of Nepal. However, the total quantity
of rainfall varies widely depending on altitude and topography. The amount of rainfall
ranges from 1000 mm to 2000 mm at altitudes of around 1000 m (Ichiyanagi et al. 2007).
The geology consists of phyllites, shales, quartzites, schists, granites, limestone, weathered
rocks, boulders, sand and clay. Vegetation varies with altitude and topography: in altitudes
Master Thesis: Bivariate Statistical Analysis of Landslide Susceptibility in Western Nepal 14
less than 1000 m, mixed, evergreen broadleaved and deciduous forests prevail. At higher
altitudes, mixed deciduous broadleaved forest and evergreen conifer forests are dominant.
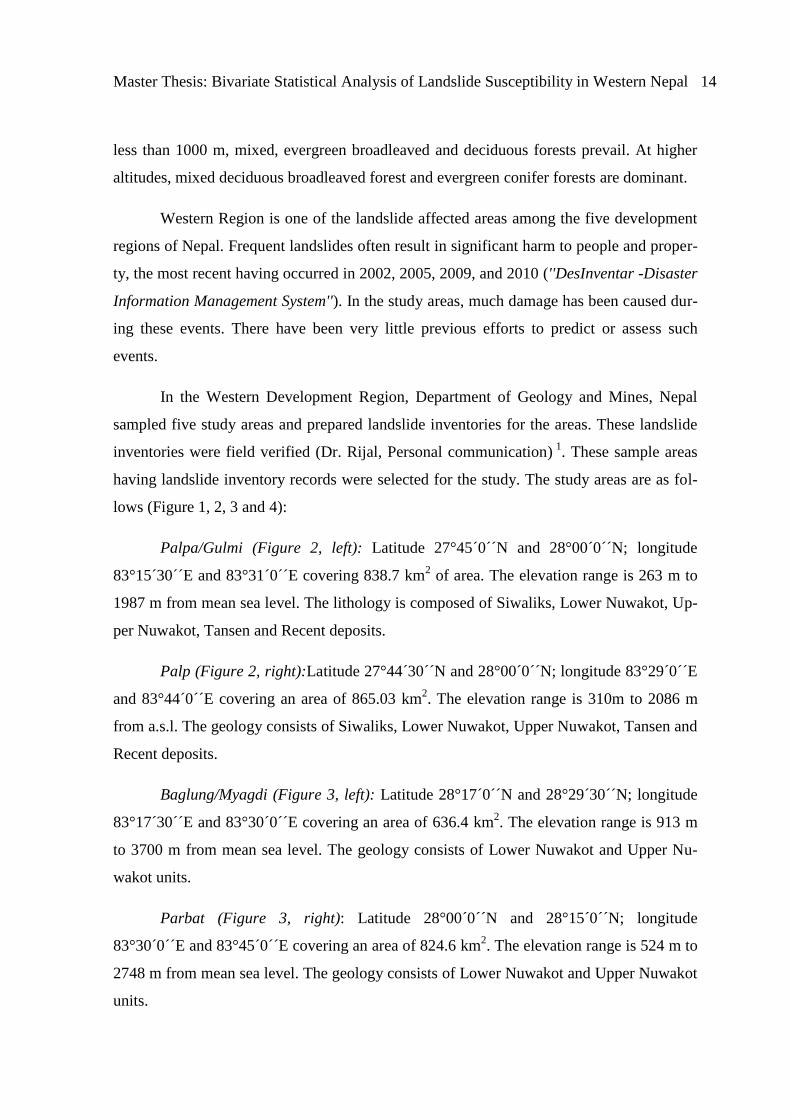
Western Region is one of the landslide affected areas among the five development
regions of Nepal. Frequent landslides often result in significant harm to people and proper-
ty, the most recent having occurred in 2002, 2005, 2009, and 2010 (''DesInventar -Disaster
Information Management System''). In the study areas, much damage has been caused dur-
ing these events. There have been very little previous efforts to predict or assess such
events.
In the Western Development Region, Department of Geology and Mines, Nepal
sampled five study areas and prepared landslide inventories for the areas. These landslide
inventories were field verified (Dr. Rijal, Personal communication) 1
. These sample areas
having landslide inventory records were selected for the study. The study areas are as fol-
lows (Figure 1, 2, 3 and 4):
Palpa/Gulmi (Figure 2, left): Latitude 27°45´0´´N and 28°00´0´´N; longitude
83°15´30´´E and 83°31´0´´E covering 838.7 km2 of area. The elevation range is 263 m to
1987 m from mean sea level. The lithology is composed of Siwaliks, Lower Nuwakot, Up-
per Nuwakot, Tansen and Recent deposits.
Palp (Figure 2, right):Latitude 27°44´30´´N and 28°00´0´´N; longitude 83°29´0´´E
and 83°44´0´´E covering an area of 865.03 km2. The elevation range is 310m to 2086 m
from a.s.l. The geology consists of Siwaliks, Lower Nuwakot, Upper Nuwakot, Tansen and
Recent deposits.
Baglung/Myagdi (Figure 3, left): Latitude 28°17´0´´N and 28°29´30´´N; longitude
83°17´30´´E and 83°30´0´´E covering an area of 636.4 km2. The elevation range is 913 m
to 3700 m from mean sea level. The geology consists of Lower Nuwakot and Upper Nu-
wakot units.
Parbat (Figure 3, right): Latitude 28°00´0´´N and 28°15´0´´N; longitude
83°30´0´´E and 83°45´0´´E covering an area of 824.6 km2. The elevation range is 524 m to
2748 m from mean sea level. The geology consists of Lower Nuwakot and Upper Nuwakot
units.

Master Thesis: Bivariate Statistical Analysis of Landslide Susceptibility in Western Nepal 15
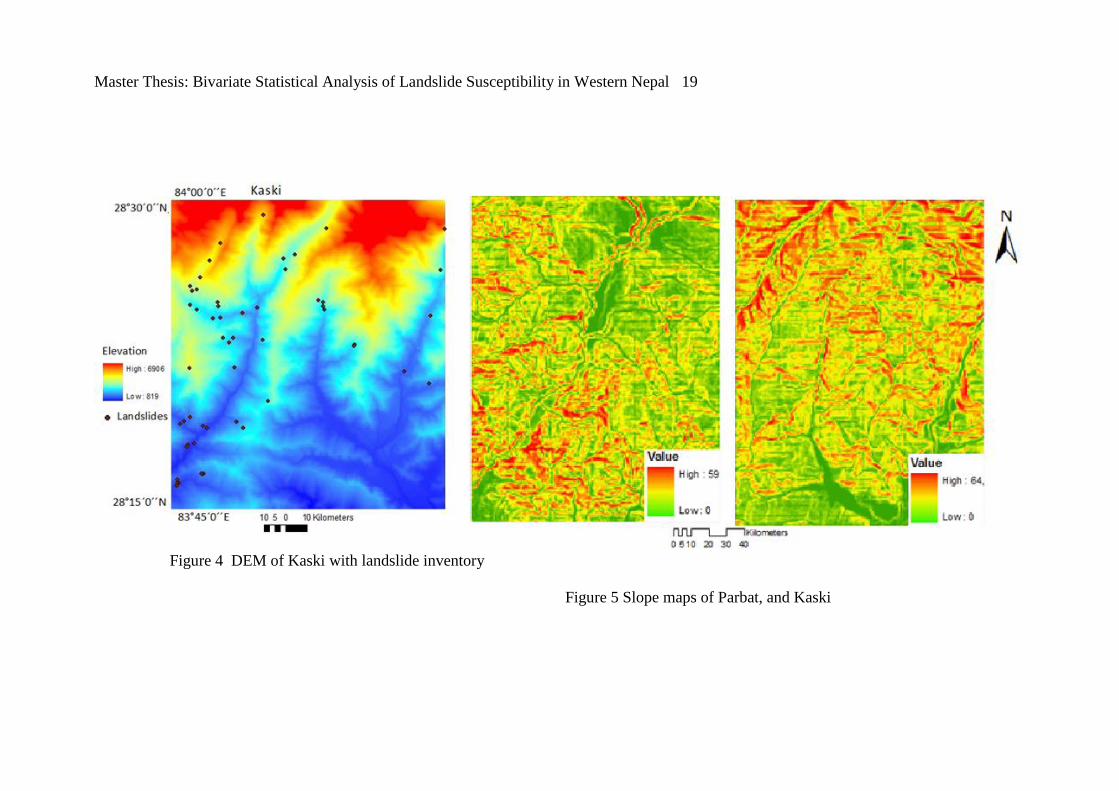
Kaski (Figure 4): Latitude 28°15´0´´N and 28°30´0´´N; longitude 83°45´0´´E and
84°00´0´´E covering an area of 881.4 km2. The elevation range is 819 m to 6906 m from
a.s.l. The Lower Nuwakot and Higher Himalayan zone were the geological units of this
area.

Master Thesis: Bivariate Statistical Analysis of Landslide Susceptibility in Western Nepal 16
Figure 1 Map of the study area

Master Thesis: Bivariate Statistical Analysis of Landslide Susceptibility in Western Nepal 17
Figure 2 DEM of Palpa/Gulmi and Palpa with landslide inventory

Master Thesis: Bivariate Statistical Analysis of Landslide Susceptibility in Western Nepal 18
Figure 3 DEM of Baglung/Myagdi and Parbat with landslide inventory
Master Thesis: Bivariate Statistical Analysis of Landslide Susceptibility in Western Nepal 19
Figure 4 DEM of Kaski with landslide inventory
Figure 5 Slope maps of Parbat, and Kaski

Master Thesis: Bivariate Statistical Analysis of Landslide Susceptibility in Western Nepal 20
Figure 6 Slope maps of Palpa/Gulmi, Palpa and Baglung/Myagdi

Master Thesis: Bivariate Statistical Analysis of Landslide Susceptibility in Western Nepal 21
8. METHODOLOGY
8.1 LANDSLIDE SUSCEPTIBILITY ANALYSIS METHODS
Several landslide susceptibility assessment methods are presented in the literature.
These methods can be broadly grouped into direct and indirect and qualitative and quantita-
tive (Van Westen et al. 1997, Van Westen et al. 2006). In direct method, the researcher de-
termines the degree of susceptibility based on her/his knowledge and experience. But in indi-
rect mapping, the researcher uses either statistical models or deterministic models to predict
landslide prone areas, based on the information obtained from the interrelation between land-
slide controlling factors and landslide distribution (Van Westen et al. 2003).
Qualitative assessment method evaluates the landslide susceptibility without landslide
inventories. This method evaluates the actual landslide based on the spatial distribution of
landslide controlling factors. This method is dependent on the experience and skills of the
expert preparing the map. It requires a prior knowledge on factors controlling landslides. Heu-
ristic method is example of qualitative method (Soeters and Van Westen 1996). Quantitative
methods include statistical and deterministic modeling of landslide susceptibility combining
landslide inventory and landslide controlling factors (Van Westen et al. 1997).
Landslide inventory also called frequency method are the simplest form of landslide
mapping. The susceptibility estimation is based on the number of landslide occurrence
(Wright et al. 1974). Landslide inventory maps provide quantitative measure on landslide
distribution. They provide straight forward comparison of different regions. However, land-
slide inventories assume continuous landslide density in space and cannot provide estimates
on future landslides. An inventory of landslide can be prepared by collecting the historical
information on individual landslide events and by using satellite images and aerial photo-
graphs and field survey (Soeters and Van Westen 1996, Duman et al. 2005).
In physically based models, the landslide susceptibility is determined using slope sta-
bility models resulting in the calculation of factor of safety (Soeters and Van Westen 1996).
These models provide the best quantitative information on landslide susceptibility that can be
directly used in the engineering works.

Master Thesis: Bivariate Statistical Analysis of Landslide Susceptibility in Western Nepal 22
Physically based models are based on sound physical models and are capable of pre-
dictive landslide analysis. They render information on landslide hazards. However, these
methods require high accuracy of input parameters. These predictive models are difficult to
evaluate. It involves complex modeling and is hard to perform at smaller scales (Soeters and
Van Westen 1996).
In statistical methods, landslide casual factors or parameters are derived and combined
with the landslide inventories to predict the future occurrence of landslides (Carrara et al.
1991, Guzzetti et al. 1999, Dai et al. 2001). Statistical methods can be distinguished into mul-
tivariate and bivariate.
In multivariate method, all relevant landslide casual factors or parameters are treated
together (Carrara 1983, Carrara et al. 1991, Lee and Min 2001, Süzen and Doyuran 2004a).
As a result, interaction effects of multiple factors are displayed by this method. Logistic re-
gression (Dai et al. 2001) and determinant analysis are the main types of multivariate statistics
used in landslide susceptibility analysis. Artificial neural network (ANN) classifiers are an-
other type of multivariate method.
In bivariate statistical method, each landslide casual factor map (for example geology,
slope, land use, vegetation) is combined with the landslide inventory. The weights are derived
from either landslide abundance or densities in each attribute class within each factor (Gupta
and Joshi 1990, Van Westen et al. 1997, Süzen and Doyuran 2004b). Mainly three types of
weight estimation methods have been employed in bivariate statistical method: Information
value method, weight-of-evidence modeling and landslide nominal susceptibility factor
(LNSF).
8.2 LANDSLIDE NOMINAL SUSCEPTIBILITY FACTOR
This study employs landslide susceptibility factor (LNSF) – a form of bivariate statis-
tical method to evaluate the landslide susceptibility of the study areas.
Gupta and Joshi (1990) proposed Landslide Nominal Susceptibility Factor (LNSF)
method as Landslide Nominal Risk Factor (LNRF). But Saha et.al (2005) modified it into
Landslide Nominal Susceptibility Factor (LNSF). They also improved the weight assignment

Master Thesis: Bivariate Statistical Analysis of Landslide Susceptibility in Western Nepal 23
process by the direct use of weights to the factor maps. LNSF is related to each attribute class
of the factor map by equation 1.
∑
(1)
Where, is the number of cells values with landslides in th thematic class of
a respective factor map and n is the number of classes in the factor map.
Gupta and Joshi (1990) explained an LNSF value greater than 1 as high susceptibility
to landslides and a value less than 1 as low susceptibility. An LNSF value equal to 1 refers to
average landslide susceptibility. They reclassified the LNSF values into 0, 1 and 2 for LNSF
<0.67 (low susceptibility), 0.67 <LNSF<1.33 (moderate susceptibility and LNSF>1.33 (high
susceptibility). Saha et.al (2005) suggested direct use of the weights to the thematic maps in-
stead of classifying them into 0, 1 and 2. Then, the weighted thematic layers are summed to
prepare a landslide susceptibility index (LSI) map. The LSI map is classified into low, moder-
ate and high susceptibility zones (Gupta and Joshi 1990).
To evaluate the landslide susceptibility of the study areas, a bivariate statistical meth-
od in Arc GIS environment was followed as presented in figure 7. To evaluate the contribu-
tion of each factor towards landslide susceptibility, thematic factor maps separately overlayed
with landslide inventory. The number of landslide pixels falling on each class of the thematic
factor map was recorded and weights calculated based on the LNSF method using equation
(1). The weights were directly assigned to the respective thematic layers to produce the
weighted thematic maps. The weighted thematic maps were summed up to produce a land-
slide susceptibility index (LSI) map according to equation (2).
Where, is the Landslide Susceptibility Index
, and are landslide distribution derived weights for slope, lithology and land-
cover. LSI classification was done using standard deviation ± 1 to reduce the subjectivity in
the analysis.

Master Thesis: Bivariate Statistical Analysis of Landslide Susceptibility in Western Nepal 24
Figure 7 Flow chart of landslide susceptibility analysis by bivariate statistical method
DEM Derive Slope maps
Published data : Lithology
Land cover
Field verified data:
Landslide Inventory Maps
Classify
Thematic class
Slope class
Lithology class
Land cover class
Overlay the-
matic class and
Landslide In-
ventory
Estimate
weights based
on LNSF and
Assign weights
to thematic
maps
Weighted thematic maps
Sum all thematic maps
And classify
Landslide susceptibility index map
Validation test by model replication

Master Thesis: Bivariate Statistical Analysis of Landslide Susceptibility in Western Nepal 25
8.3 VALIDATION STRATEGY
There are different ways to test the validity of the model. In landslide susceptibility
analysis; the same landslide inventory databases that were used for preparing landslide sus-
ceptibility maps may be used to test the goodness of fit. The basic assumption underlying the
goodness of fit test is that future landslides will occur in the same places as the past or exist-
ing movements in the study areas. If the susceptibility maps coincide well with the landslides
then the maps are considered as satisfactory.
However, map validation is considered best when they are tested using independent
population of landslides (Lee and Min 2001, Lee 2007, Pradhan and Buchroithner 2010). In-
dependent landslide data samples can be obtained by a) sample split strategy in which the
landslide inventory are split into two parts, one for analysis and one for validation; b) model
replication in which the analysis is done in one part of the study area and the results obtained
are replicated in other parts with different landslides; and c) Validation with respect to time:
In this validation method the model is prepared with a landslide database that occurred in a
certain period and is validated by using the landslides that occurred in a different period
(Remondo et al. 2003, Pradhan and Buchroithner 2010). In this study model b) is used to vali-
date the model.
To test the goodness of fit of the replicated models; the cumulative percentage of land-
slide occurrence with respect to susceptibility class were plotted in a graph called as rating
curve. To prepare the rating curves, the landslide susceptibility index maps were sorted in
descending order and were sliced into100 equal-area classes. Similarly, the landslide database
was also sliced into 100 equal-area classes. Then, the cumulative percentages of the suscepti-
bility class corresponding to cumulative percentage of landslides were plotted in graphs.
The rating curves are analyzed based on two assumptions: a) a hypothetical validation
curve coinciding with a diagonal of 0 to 1 would be equivalent to total random prediction. The
further up and away the validation curve from the diagonal the better the predictability of the
model and susceptibility map (Remondo et al. 2003, Lee 2007). And b) The higher the pro-
portion of landslides in most susceptible zones the better the predictability of the model
(Remondo et al. 2003).
Master Thesis: Bivariate Statistical Analysis of Landslide Susceptibility in Western Nepal 26
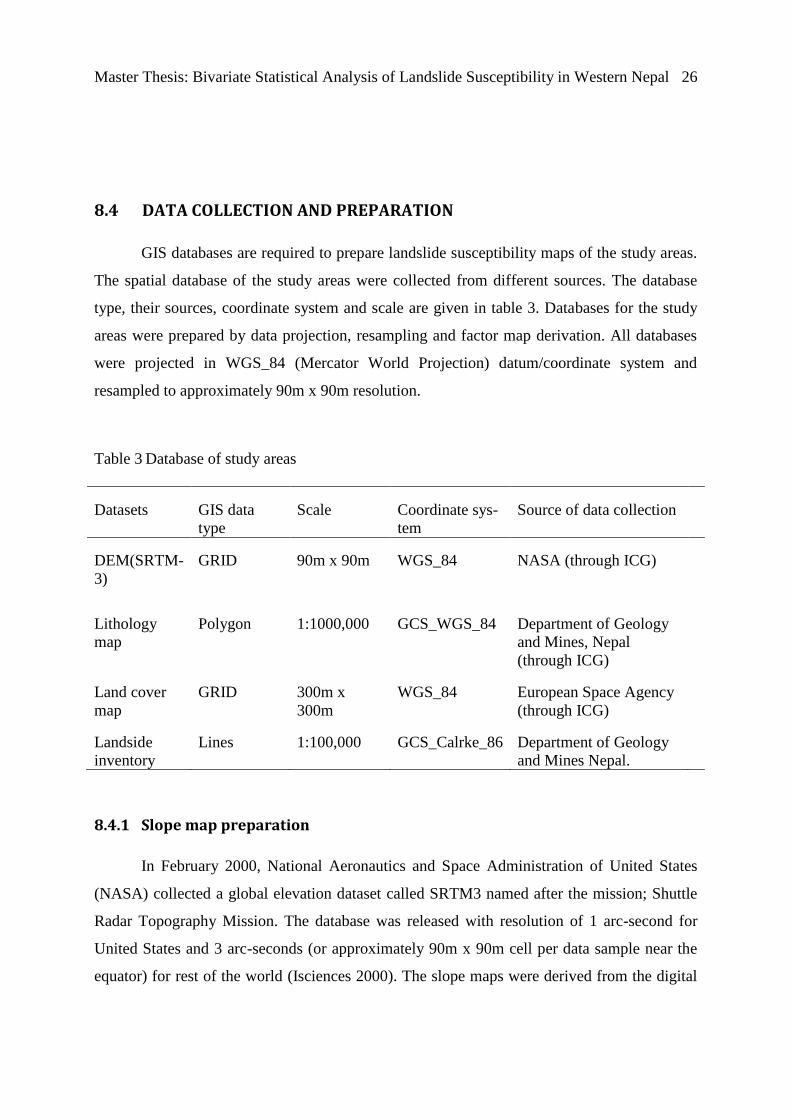
8.4 DATA COLLECTION AND PREPARATION
GIS databases are required to prepare landslide susceptibility maps of the study areas.
The spatial database of the study areas were collected from different sources. The database
type, their sources, coordinate system and scale are given in table 3. Databases for the study
areas were prepared by data projection, resampling and factor map derivation. All databases
were projected in WGS_84 (Mercator World Projection) datum/coordinate system and
resampled to approximately 90m x 90m resolution.
Table 3 Database of study areas
Datasets GIS data
type
Scale Coordinate sys-
tem
Source of data collection
DEM(SRTM-
3)
GRID 90m x 90m
WGS_84 NASA (through ICG)
Lithology
map
Polygon 1:1000,000 GCS_WGS_84 Department of Geology
and Mines, Nepal
(through ICG)
Land cover
map
GRID 300m x
300m
WGS_84 European Space Agency
(through ICG)
Landside
inventory
Lines 1:100,000 GCS_Calrke_86 Department of Geology
and Mines Nepal.
8.4.1 Slope map preparation
In February 2000, National Aeronautics and Space Administration of United States
(NASA) collected a global elevation dataset called SRTM3 named after the mission; Shuttle
Radar Topography Mission. The database was released with resolution of 1 arc-second for
United States and 3 arc-seconds (or approximately 90m x 90m cell per data sample near the
equator) for rest of the world (Isciences 2000). The slope maps were derived from the digital
Master Thesis: Bivariate Statistical Analysis of Landslide Susceptibility in Western Nepal 27
elevation model (DEM) of the study areas (Appendix 1). The DEM of the study areas were
extracted from SRTM3.
Classification of continuous variables such as slope has remained an issue. No specific
guidelines exist for the classification of continuous parameters. Different methods of continu-
ous data classification have been suggested by different researchers. Slope parameter was
classified into 10 classes based on the natural breaks (Figure 5 and 6).
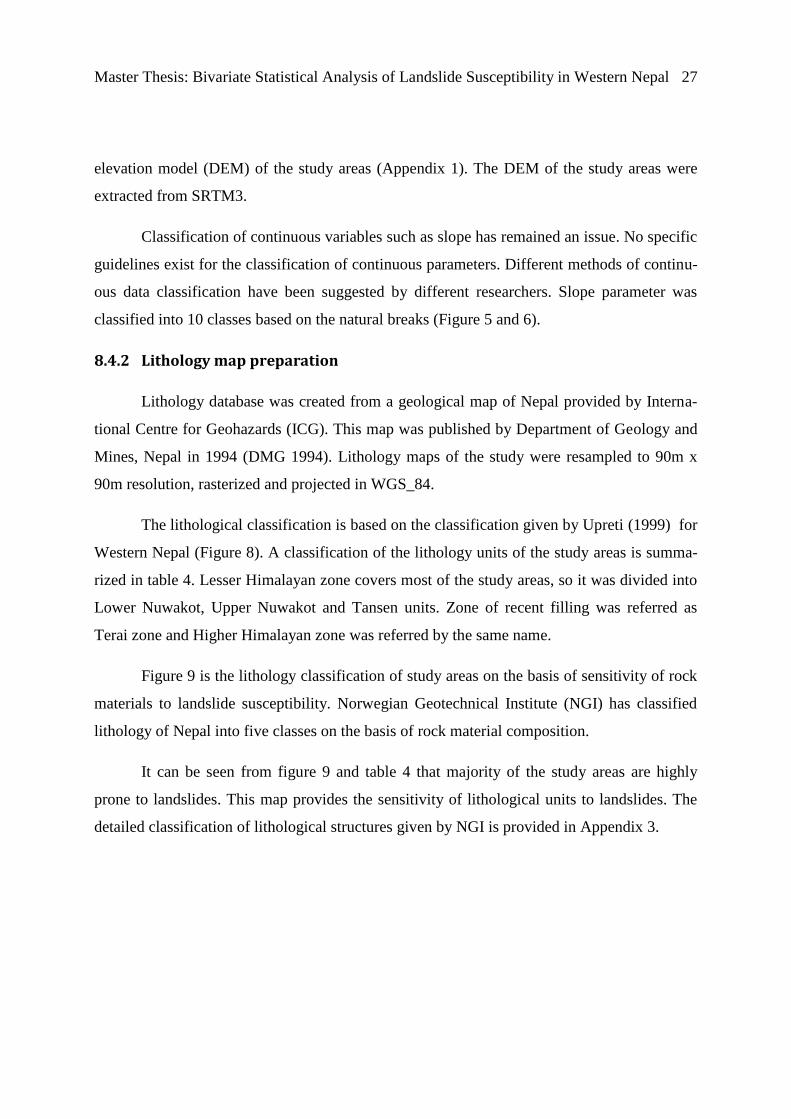
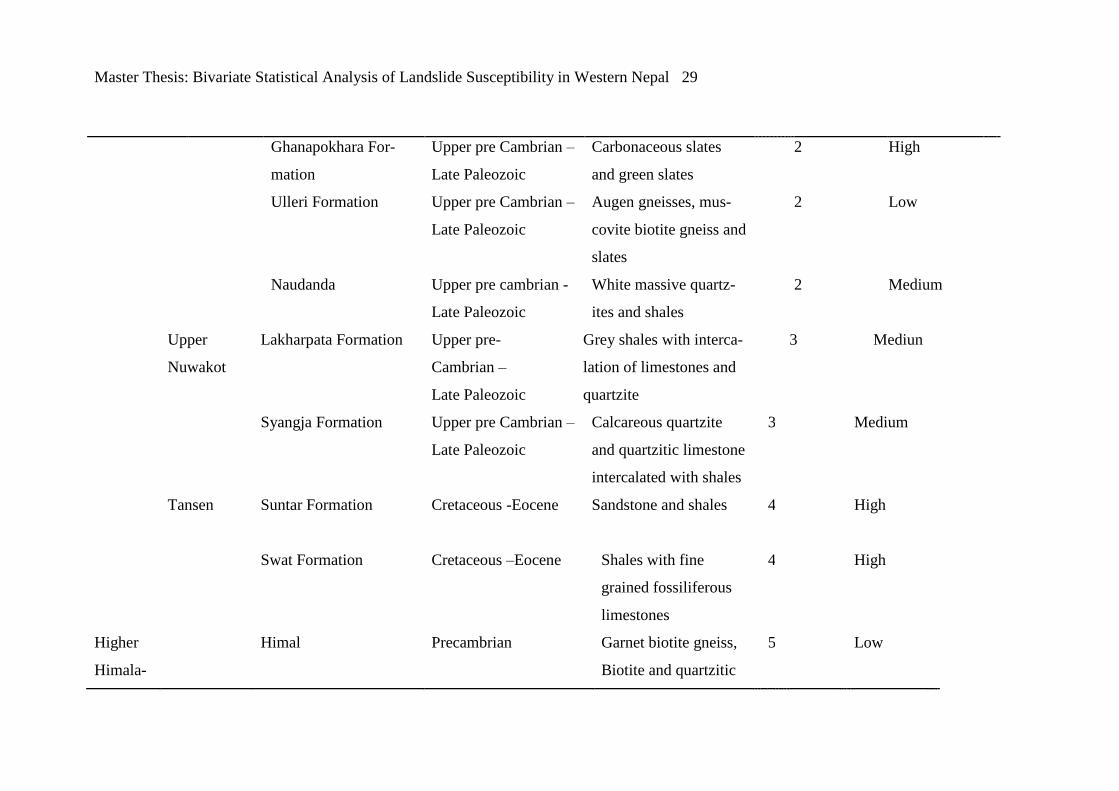
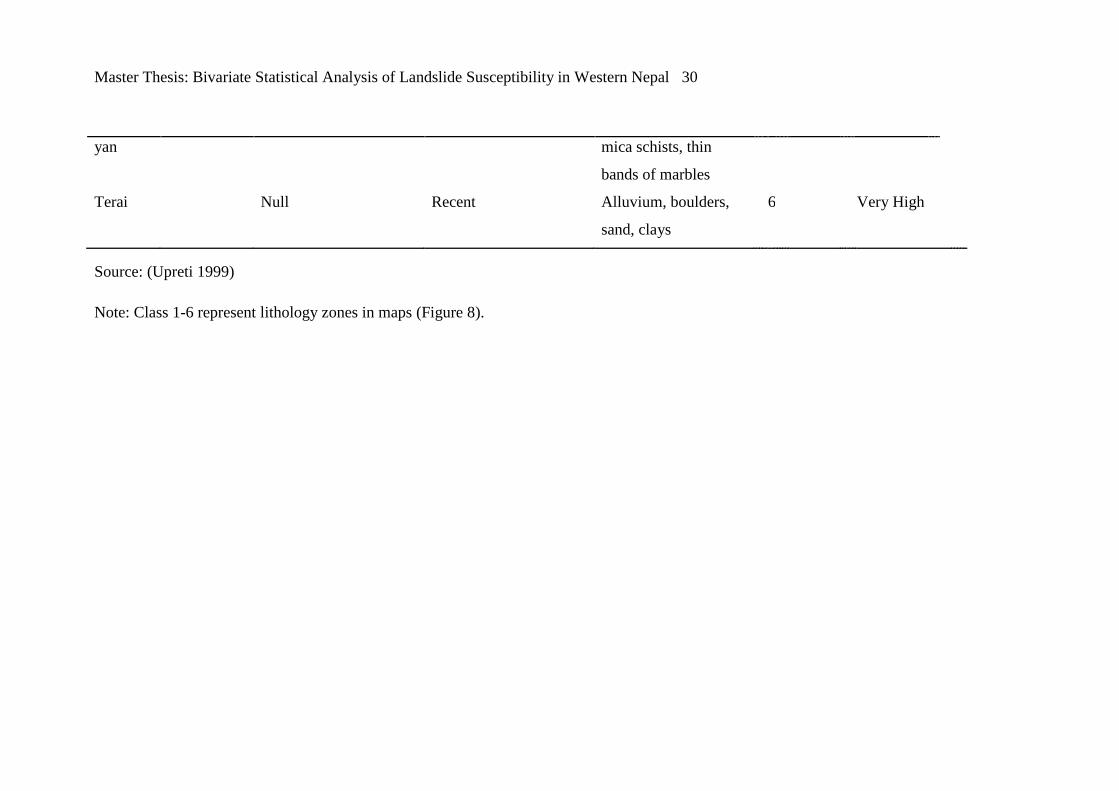
8.4.2 Lithology map preparation
Lithology database was created from a geological map of Nepal provided by Interna-
tional Centre for Geohazards (ICG). This map was published by Department of Geology and
Mines, Nepal in 1994 (DMG 1994). Lithology maps of the study were resampled to 90m x
90m resolution, rasterized and projected in WGS_84.
The lithological classification is based on the classification given by Upreti (1999) for
Western Nepal (Figure 8). A classification of the lithology units of the study areas is summa-
rized in table 4. Lesser Himalayan zone covers most of the study areas, so it was divided into
Lower Nuwakot, Upper Nuwakot and Tansen units. Zone of recent filling was referred as
Terai zone and Higher Himalayan zone was referred by the same name.
Figure 9 is the lithology classification of study areas on the basis of sensitivity of rock
materials to landslide susceptibility. Norwegian Geotechnical Institute (NGI) has classified
lithology of Nepal into five classes on the basis of rock material composition.
It can be seen from figure 9 and table 4 that majority of the study areas are highly
prone to landslides. This map provides the sensitivity of lithological units to landslides. The
detailed classification of lithological structures given by NGI is provided in Appendix 3.

Master Thesis: Bivariate Statistical Analysis of Landslide Susceptibility in Western Nepal 28
Table 4 Lithology units of study areas
Stratigraphic
zones
Units Group Geological age Main rock types Class Prone to land-
slides
Lesser Him-
alayan
Siwaliks
Lower Siwalik Mid Miocene – Pleis-
tocene
Sandstones, shales,
clays, conglomerates
1 Medium
Middle Siwaliks 1 Mid Miocene – Pleis-
tocene
Sandstone, Shales,
mudstones, conglomer-
ates
1 Medium
Upper Siwaliks Mid Miocene – Pleis-
tocene
Coarse boulders, sand-
stone and clays
1 High
Lower
Nuwakot
Galyan Formation Upper pre Cambrian –
Late Paleozoic
Slates and carbonates 2 Medium
Kushma Formation Upper pre Cambrian –
Late Paleozoic
White massive quartzite
and green phyllites
2 Medium
Sangram Formation Upper pre Cambrian –
Late Paleozoic
Green shales, lime-
stones and quartzite
2 High
Seti Formation Upper pre Cambrian –
Late Paleozoic
Phyllites and quartzite 2 Medium
Master Thesis: Bivariate Statistical Analysis of Landslide Susceptibility in Western Nepal 29
Ghanapokhara For-
mation
Upper pre Cambrian –
Late Paleozoic
Carbonaceous slates
and green slates
2 High
Ulleri Formation Upper pre Cambrian –
Late Paleozoic
Augen gneisses, mus-
covite biotite gneiss and
slates
2 Low
Naudanda Upper pre cambrian -
Late Paleozoic
White massive quartz-
ites and shales
2 Medium
Upper
Nuwakot
Lakharpata Formation Upper pre-
Cambrian –
Late Paleozoic
Grey shales with interca-
lation of limestones and
quartzite
3 Mediun
Syangja Formation Upper pre Cambrian –
Late Paleozoic
Calcareous quartzite
and quartzitic limestone
intercalated with shales
3 Medium
Tansen
Suntar Formation Cretaceous -Eocene Sandstone and shales 4 High
Swat Formation Cretaceous –Eocene Shales with fine
grained fossiliferous
limestones
4 High
Higher
Himala-
Himal Precambrian Garnet biotite gneiss,
Biotite and quartzitic
5 Low
Master Thesis: Bivariate Statistical Analysis of Landslide Susceptibility in Western Nepal 30
yan
mica schists, thin
bands of marbles
Terai
Null Recent Alluvium, boulders,
sand, clays
6 Very High
Source: (Upreti 1999)
Note: Class 1-6 represent lithology zones in maps (Figure 8).

Master Thesis: Bivariate Statistical Analysis of Landslide Susceptibility in Western Nepal 31
Figure 8 Classified lithology maps of Palpa/Gulmi, Palpa, Baglung/Myadgi, Parbat and Kaski.
Figure 9 Classified lithology maps of Palpa/Gulmi, Palpa, Baglung/Myadgi, Parbat and Kaski by NGI classification

Master Thesis: Bivariate Statistical Analysis of Landslide Susceptibility in Western Nepal 32
8.4.3 Land cover map preparation
The GLOBCOVER v2.2 is a global land cover database with approximately 300 m
ground resolution collected by European Space Agency from 2004 -2006 using Envisat’s Me-
dium Resolution Imaging Spectrometer-MENRIS (ESA 2008). This global land cover map
with 300 m resolution was released in 2008.
The GLOBECOVER v2.2 database has classified land cover of the world into 22 main
classes. In this study, land cover system for global and continental application was used
(Bicheron et al. 2008). This classification system has classified land cover types into 220
types and it includes the main land cover types of Asia region.
Land cover maps of the study were resampled to 90m x 90m resolution, and projected
in WGS_84. Then, the land cover of the study areas was classified into eight main types (table
5 and figure 10 and 11).
Table 5 Land cover classification.
Land cover type Class
values
Cropland 1
Mosaic of crop and vegetation 2
Mosaic of forest and grassland 3
Forest 4
Shrubland 5
Bare land 6
Grassland 7
Snow/ice 0

Master Thesis: Bivariate Statistical Analysis of Landslide Susceptibility in Western Nepal 33
Figure 10 Classified land cover map of Palpa/Gulmi, Palpa and Baglung/Myadgi

Master Thesis: Bivariate Statistical Analysis of Landslide Susceptibility in Western Nepal 34
Figure 11 Classified land cover map of Parbat and Kaski

Master Thesis: Bivariate Statistical Analysis of Landslide Susceptibility in Western Nepal 35
8.4.4 Landslide inventory database preparation
Landslide inventory database were collected from Department of Geology and Mines,
Nepal. The database included polylines in a scale of 1:250,000 in GCS_Clarke_1886 coordi-
nate system. The landslide inventory maps were transformed to WGS_84 (Mercator World
Projection) coordinate system from GCS_Clarke 1866.Slope, land cover, and lithology data-
base were in WGS_84. The datasets were resampled to a resolution of 90m x 90m grid size.
The landslide inventory database was prepared by Department of Geology and Mines, Nepal.
These datasets were collected from aerial photo interpretation and satellite images and field
verified during a pilot study in the region (Dr. Rizal, personal communication) 1
.
Table 6 Landslides records of study areas
Study area No. of land-
slides record-
ed
Data collec-
tion year
Area of landslides
(Km2)
Number of landslide
pixels
Palpa/Gulmi 230 2008 2,138 264
Palpa 302 1992/2006 4,042 499
Parbat 156 2006 1,466 123
Kaski 54 2005 2,049 181
Baglung/Myadgi 45 2009 0,996 253
A total of 787 landslides were recorded in these five study sites with an area of approximately
10.7 km2.
9. RESULTS AND DISCUSSION
The main aim of the study was to prepare landslide susceptibility maps of Pal-
pa/Gulmi, Palpa, Baglung/Myadgi, Parbat and Kaski using bivariate statistical method
(LNSF) and validate the results by model replication. The thematic (slope, lithology and land
use) maps and landslide inventory maps were converted to polygons, resampled to approxi-
mately 90mx90m resolution and projected in WGS_84 coordinate system. Then the percent-

Master Thesis: Bivariate Statistical Analysis of Landslide Susceptibility in Western Nepal 36
ages of landslide distribution in each thematic class of the slope, lithology and land cover
were estimated. This provides an idea of how the landslides are distributed over the thematic
classes in each thematic map. Landslide susceptibility index (LSI) maps were generated using
equation (1 and 2). Rating curves were plotted to analyze the effect of each parameter on sus-
ceptibility. Maps were validated by model replication.
9.1 RELATIONSHIP BETWEEN LANDSLIDES AND CASUAL FACTORS
The relationship between landslide distribution and the casual factor was compared
and percentage of landslides within each class of the slope, lithology and land cover map was
estimated.
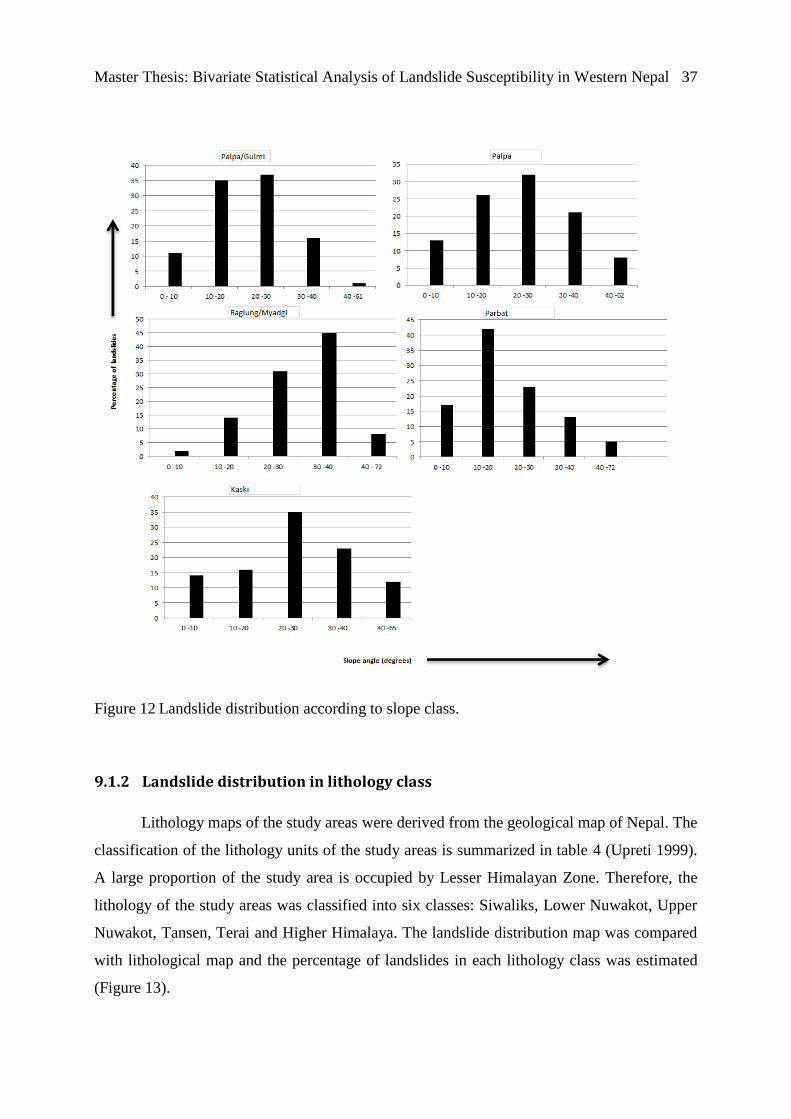
9.1.1 Landslide distribution in slope gradient
Slope maps of the study areas were extracted from DEM (SRTM3). Slope parameter
was classified into 10 classes based on the natural breaks (Figure 6). For better comparison of
landslide distribution according to slope class between five study areas, 10 slope classes were
regrouped into five classes. This regrouping is limited only to this section. In rest of the anal-
ysis 10 slope classes are used. The slope angle and landslide distribution was compared and
percentage of landslides within each slope class was estimated. Figure 12 shows an initial
increase in percentage of landslides with increased slope gradient.
But the range of slope gradient from where the landslide distribution decreased varied
between study areas. Landslide percentage increased with increase in slope gradient up to 30
degrees in Palpa/Gulmi, Palpa, and Kaski. After 30 degrees the landslides distribution de-
creases. In Baglung/Myagdi the percentage of landslides increased with increased slope gra-
dient up to 40 degrees followed by sudden drop in the landslide percentage after 40 degrees.
In contrast, Parbat showed increased percentage of landslides up to a slope gradient of 20 de-
grees and then the distribution of landslide percentage decreased. Further analysis indicated
that landslides in sedimentary rocks failed in lower angles. The land use for crop production
and human settlement and roads construction in sedimentary rocks also contributed positively
for landslide failure in lower slope angles.
Master Thesis: Bivariate Statistical Analysis of Landslide Susceptibility in Western Nepal 37
Figure 12 Landslide distribution according to slope class.
9.1.2 Landslide distribution in lithology class
Lithology maps of the study areas were derived from the geological map of Nepal. The
classification of the lithology units of the study areas is summarized in table 4 (Upreti 1999).
A large proportion of the study area is occupied by Lesser Himalayan Zone. Therefore, the
lithology of the study areas was classified into six classes: Siwaliks, Lower Nuwakot, Upper
Nuwakot, Tansen, Terai and Higher Himalaya. The landslide distribution map was compared
with lithological map and the percentage of landslides in each lithology class was estimated
(Figure 13).

Master Thesis: Bivariate Statistical Analysis of Landslide Susceptibility in Western Nepal 38
Figure 13 Landslide distribution according to lithology class
Palpa/Gulmi and Palpa contained five lithology classes while Baglung/Myadgi, Parbat
and Kaski owned two lithology classes in each (Figure 8). Palpa/Gulmi, and Palpa have simi-
lar lithology and landslides are concentrated in Silwaliks, Upper Nuwakot and Tansen. The
distribution of landslides in Siwaliks and Tansen was reduced in the Palpa compared to Pal-
pa/Gulmi.
Lower Nuwakot hosted highest proportion of the landslides in Baglung/Myadgi, and
Parbat while it occupied small proportion of landslides in Palpa/Gulmi and Palpa. This might
be due to large proportion of area covered by Lower Nuwakot in Baglung/Myadgi and Parbat
(Figure 8).
Master Thesis: Bivariate Statistical Analysis of Landslide Susceptibility in Western Nepal 39
The lithologies that are susceptible to slope instability were Terai, Siwaliks, Lower
Nuwakot, Upper Nuwakot and Tansen except the Higher Himalayan zone. Terai constitutes
recent deposits of alluvial soil, sand and boulders which are very highly prone to landslides.
Siwaliks are composed of sedimentary rocks and are highly prone to landslides.
In Lower Nuwakot sensitivity of rock materials to landslide varies from high to low. It
consists of white massive quartzites, shales, green phyllites, carbonaceous slates and green
slates. In addition it also has augen gneisses and muscovite biotite gneiss in very small areas.
These rock minerals are less prone to landslides.
Upper Nuwakot is medium prone to landslides. The lithology composition of Upper
Nuwakot included sedimentary and metamorphic rocks. This lithology unit has grey shales
with intercalation of limestones and quartzite, calcareous quartzite and quartzitic limestone
intercalated with shales. Shales and limestones are sedimentary rocks while quartzites are
mixed with sedimentary rocks.
Tansen is composed of sedimentary rocks which are highly prone to landslides. The
rock materials of this lithology unit are sandstone and shales with fine grained fossiliferous
limestones.
Higher Himalayan zone consists of relative stable rock masses. But the high slope gra-
dients with bare rocks induce landslide process in this zone. This lithology zone has garnet
biotite gneiss, biotite and quartzitic mica schists, thin bands of marbles.
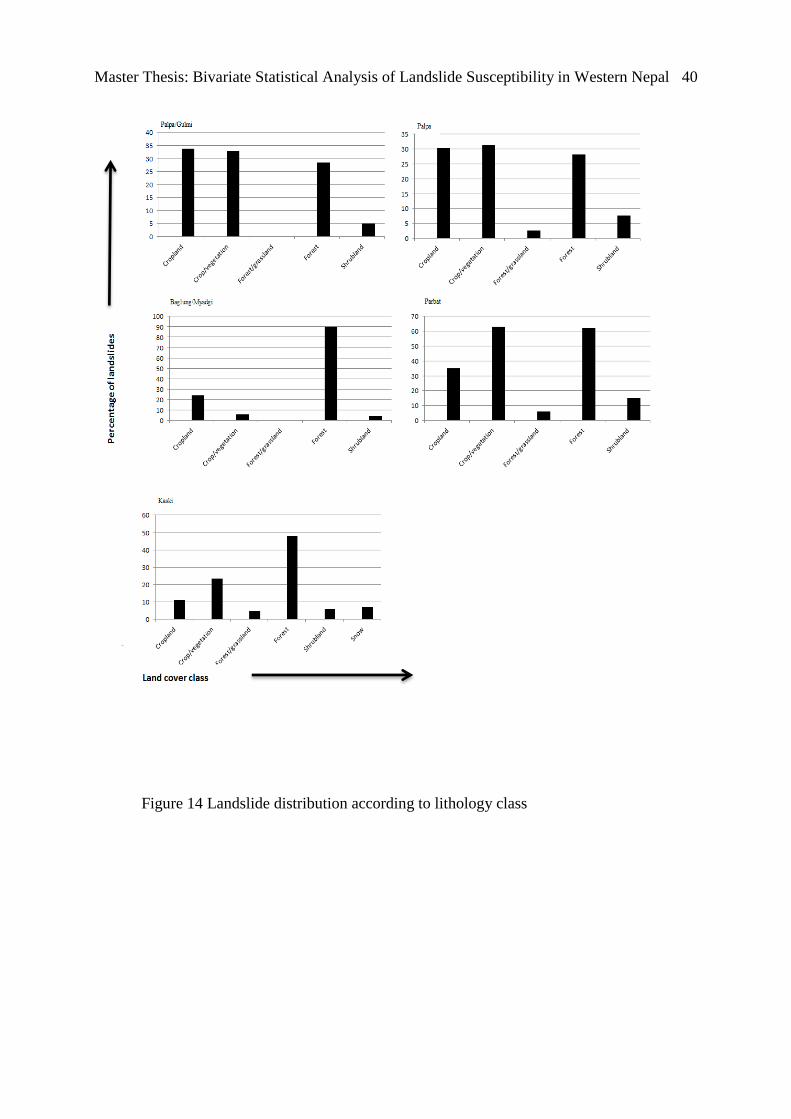
9.1.3 Landslide distributions in land cover class
Land use maps of the study areas were derived from the GLOBCOVER v2.v map. The
land use of the study areas were classified into eight classes. Landslide distribution map was
compared with the land cover map and a percentage of landslides within each land use class
were calculated (Figure 14).
Master Thesis: Bivariate Statistical Analysis of Landslide Susceptibility in Western Nepal 40
Figure 14 Landslide distribution according to lithology class

Master Thesis: Bivariate Statistical Analysis of Landslide Susceptibility in Western Nepal 41
The land use pattern influence the landslide susceptibility of an area. The areas with
thick vegetation are usually less prone to slope failure than areas devoid of vegetation. Pres-
ence of vegetation on the ground decreases quick over land flow by gradual infiltration of
water through soil down to bedrock. This prevents buildup of pore water pressure in the soil,
thereby reducing the risk of slope failure. The root of the plants increases the shear strength of
the soil.
In contrast, agricultural fields and forests were the most susceptible areas in the study
areas (Figure 14). In Palpa/Gulmi and Palpa, cropland and forests were most sensitive to land-
slides. Cultivated land covered approximately 65% of the total area and grassland and Shrub-
land occupied around around 8% area. Forests covered remaining 27% of the area. In Bag-
lung/Myadgi around 70% of landslides were distributed in forests. This area included around
70% of forests, around 10% of grass and shrubland and 20% of cropland. In Parbat and Kaski
also cultivated land and forests were most susceptible to landslides. The forests in these areas
are intensively used as a result forests are degraded. The other most important aspect is that
presence of forests in highly prone lithology might induce landslides due to added canopy and
stem weights of trees during monsoons. Another reason is that the vegetated areas are steep
slopes with little soil which affect the soil-root anchorage of the vegetation and consequently
affect the landslide process.
9.2 LANDSLIDE SUSCEPTIBILITY MAPPING
The landslide susceptibility maps of the study areas were prepared in Arc GIS version
9.3. LNSF – a bivariate statistical method was employed to prepare the landslide susceptibil-
ity index (LSI) maps. LSI values were classified using mean standard deviation. The classi-
fied maps were grouped into five susceptibility classes as very low, low, medium, high and
very high susceptibility class.
The maps of Baglung/Myagdi and Kaski produced six and seven classes by standard
deviation. They were regrouped into five classes by summing up those classes that contained
smallest number of pixels. The susceptibility classes with percentage of pixels closer to zero
Master Thesis: Bivariate Statistical Analysis of Landslide Susceptibility in Western Nepal 42
were added together to form a new class. The resulted susceptibility maps of the study areas
are presented in figure (15 and 16).
Table 7 Susceptibility class and values
Susceptibility class Value
Very Low 1
Low 2
Medium 3
High 4
Very High 5

Master Thesis: Bivariate Statistical Analysis of Landslide Susceptibility in Western Nepal 43
Figure 15 Susceptibility maps of Palpa/Gulmi, Palpa, Baglung/Myadgi
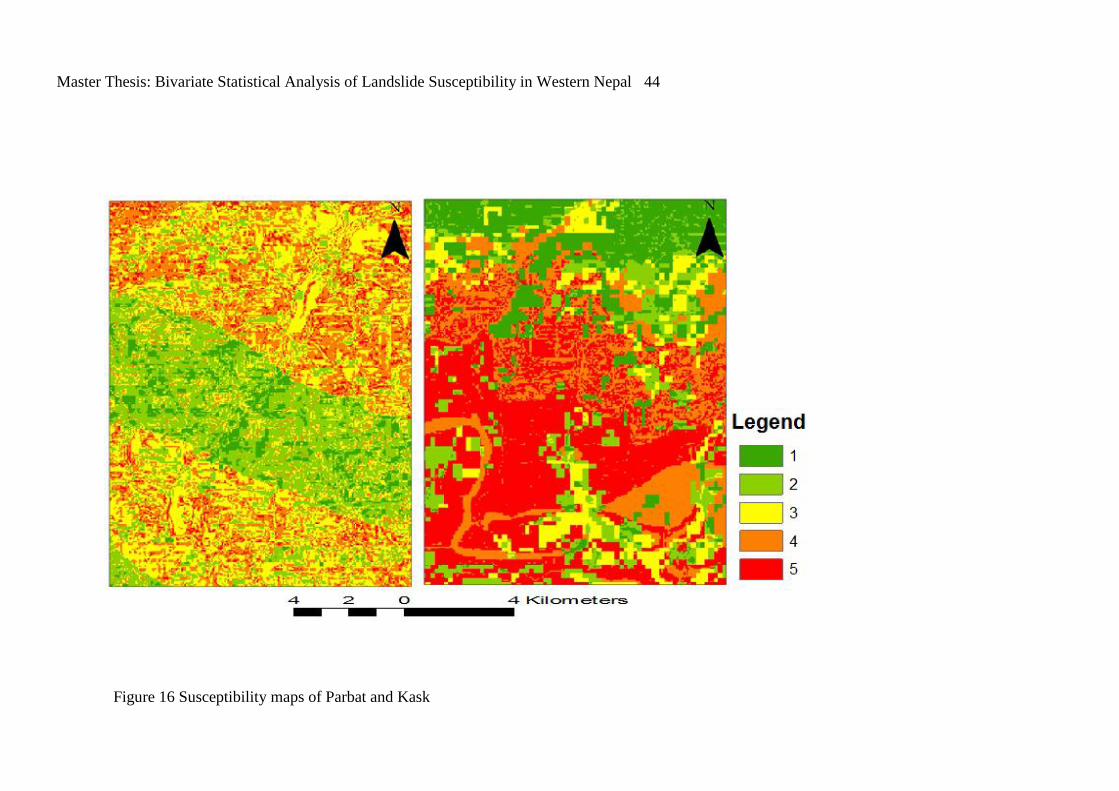
Master Thesis: Bivariate Statistical Analysis of Landslide Susceptibility in Western Nepal 44
Figure 16 Susceptibility maps of Parbat and Kask
Master Thesis: Bivariate Statistical Analysis of Landslide Susceptibility in Western Nepal 45
Landslide susceptibility maps of Palpa/Gulmi, Palpa and Parbat showed color transi-
tions between lithology classes while Baglung/Myagdi and Kaski do not show any distinct
transitions. There may be many reasons for this. But the main reason was theoretical basis of
the analysis. The weights are assigned based on the abundance of the landslides in each at-
tribute class of the thematic maps. The class in which the landslides are concentrated that
class receives the highest weight. That particular class has influence over the parameter class
with lower weights.
9.3 PARAMETRIC EFFECT ANALYSIS
Input parameters have effect on the susceptibility analysis. Effect analysis shows how
susceptibility changes when the input factors are changed. If a selected factor results in a rela-
tively large change in the outcome, then the outcome is said to be affected by that factor. Ef-
fect analysis quantifies the uncertainty of each factor. The factors that have the greatest im-
pact on calculated landslide susceptibility map can, therefore, be identified using effect analy-
sis (Lee 2007).
To estimate the effect of each factor on the susceptibility, landslide susceptibility for
four combinations were calculated and plotted in graphs (rating curves) excluding each factor
at a time. The exclusion of factors was conducted when summing up the weights using equa-
tion (2).
The contribution of three factors (slope, lithology and land cover) was evaluated by
creating a rating curve. The rating curves represent the cumulative percentage of landslides
with respect to susceptibility classes. To prepare the rating curves, the landslide susceptibility
index maps were sorted in descending order and were sliced into100 equal-area classes. Simi-
larly, the landslide database was also sliced into 100 equal-area classes. Then, the cumulative
percentages of the susceptibility class corresponding to cumulative percentage of landslides
were plotted in graphs (Figure 17-21).
Figures 17-21; show the rating curves obtained by plotting cumulative percentage of
landslide susceptibility area and cumulative percentage of landslide occurrence. The curves
for all (three) variables combination and two variables combination excluding each variable at
a time are presented.

Master Thesis: Bivariate Statistical Analysis of Landslide Susceptibility in Western Nepal 46
Influence of lithology on the landslide susceptibility is visible from rating curve. The
curve except lithology is under estimated compared to the curve of the all variables (com-
bined) for Palpa/Gulmi (Figure 17). Influence of lithology is visible in map with distinct color
transition between susceptibility zones. Exclusion of slope and land cover did not show any
changes in the rating curve. The curves excluding slope and land cover are aligned close to
the curves of the all variables in all the study areas.
Figure 17 Landslide susceptibility index ranked (x-axis) and cumulative percentage of
landslide occurrence (y-axis) of Palpa/Gulmi
Influence of slope, lithology and land cover on the landslide susceptibility is visible
from rating curve. The curves produced with two parameters combination has better results
compared to the curve of all variables for Palpa (Figure 18). But the difference between these
curves is very small.
0
0,2
0,4
0,6
0,8
1
0 0,2 0,4 0,6 0,8 1
Lan
dsl
ide
in c
um
ula
tive
per
cen
tage
VHS VLS Landslide susceptibility area in cumulative percentage
All thematic maps
Except land cover
Except lithology
Except slope

Master Thesis: Bivariate Statistical Analysis of Landslide Susceptibility in Western Nepal 47
Figure 18 Landslide susceptibility index ranked (x-axis) and cumulative percentage of
landslide occurrence (y-axis) of Palpa
Influence of lithology on the landslide susceptibility is visible from rating curve. The
curve except lithology is under estimated compared to the curve of the all variables (com-
bined) for Baglung/Myadgi (Figure 19). Exclusion of slope and land cover did not show any
changes in the rating curve. The curves excluding slope and land cover are aligned close to
the curves of the all variables.
Figure 19 Landslide susceptibility index ranked (x-axis) and cumulative percentage of
landslide occurrence (y-axis) of Baglung/Myadgi
0
0,2
0,4
0,6
0,8
1
0 0,2 0,4 0,6 0,8 1
Lan
dsl
ide
in c
uu
lati
ve p
erce
nta
ge
VHS VLS Landslide susceptibility area in cumulative percentage
All thematic maps
Except land cover
Except lithology
Except slope
0
0,2
0,4
0,6
0,8
1
0 0,2 0,4 0,6 0,8 1
Lan
dsl
ide
in c
um
ula
tive
per
cen
tage
VHS VLS Landslide susceptibility area in cumulative percentage
All thematic maps
Except land cover
Except lithology
Except slope

Master Thesis: Bivariate Statistical Analysis of Landslide Susceptibility in Western Nepal 48
Influence of slope, lithology and land cover on the landslide susceptibility is visible
from rating curve. The curves produced with two parameters combination and curve with all
variables combined has no difference for Parbat (Figure 20). This indicates that combination
of any two parameters represent the susceptibility of the study area.
Figure 20 Landslide susceptibility index ranked (x-axis) and cumulative percentage of land-
slide occurrence (y-axis) of Parbat
Influence of slope, lithology and land cover on the landslide susceptibility is visible
from rating curve. The curves produced with two parameters combination and curve with all
variables combined has no difference for Parbat (Figure 15). This indicates that combination
of any two parameters represent the susceptibility of the study area.
0
0,2
0,4
0,6
0,8
1
0 0,2 0,4 0,6 0,8 1
Lan
dsl
ide
in c
um
ula
tive
per
cen
tage
VHS VLS Landslide susceptibility area in cumulative percentage
All thematic maps
Except land cover
Except lithology
Except slope

Master Thesis: Bivariate Statistical Analysis of Landslide Susceptibility in Western Nepal 49
Figure 21 Landslide susceptibility index ranked (x-axis) and cumulative percentage of
landslide occurrence (y-axis) of Kaski
Effect analysis results indicated that the effect of parameter on susceptibility is site
specific. The effect of the same parameters changed with site. Lithology exerted influence on
Palpa/Gulmi, and Baglung/Myadgi. In Palpa slight difference in the all variable combined
curve and two variables curves was visible. In contrast, all four combinations yielded similar
curves in case of Parbat and Kaski.
Including a number of input parameters does not necessarily improve model perfor-
mance or produce better susceptibility maps. Therefore, identifying the major influential pa-
rameter is important to produce a better landslide susceptibility map.
9.4 MODEL REPLICATION TO TEST VALIDITY
Map validation is considered best when they are tested using independent population
of landslides (Lee and Min 2001, Lee 2007, Pradhan and Buchroithner 2010). Model valida-
tion was conducted by model replication in which the analysis was done in one part of the
study area (Palpa and Baglung/Myagdi) and the results obtained were replicated in other parts
(Palpa/Gulmi and Parbat) with different landslides. The basic assumption underlying the
goodness of fit test is that future landslides will occur in the same places as the past or exist-
0
0,2
0,4
0,6
0,8
1
0 0,2 0,4 0,6 0,8 1
Lan
dsl
ide
in c
um
ula
tive
per
cen
tage
VHS VLS Landslide susceptibility area in cumulative percentage
All thematic maps
Except land cover
Except lithology
Except slope

Master Thesis: Bivariate Statistical Analysis of Landslide Susceptibility in Western Nepal 50
ing movements in the study areas. If the susceptibility maps coincide well with the landslides
then the maps are considered as satisfactory.
The model calibrated for Palpa and Baglung/Myadgi was replicated in Palpa/Gulmi
and Parbat. The weights obtained for Palpa and Baglung/Myadgi were applied to thematic
maps of Palpa/Gulmi and Parbat. The weighted thematic maps were summed up to produce
the susceptibility maps using equation (2). Then the susceptibility maps were classified into
very low, low, medium, high and very high susceptibility classes.
To test the goodness of fit of the replicated models; the cumulative percentage of land-
slide occurrence with respect to susceptibility class were plotted in a graph called as rating
curve. The landslide susceptibility index maps were sorted in descending order and were
sliced into100 equal-area classes. Similarly, the landslide database was also sliced into 100
equal-area classes. Then, the cumulative percentages of the susceptibility class corresponding
to cumulative percentage of landslides were plotted in graphs.
The rating curves were analyzed based on two assumptions: a) a hypothetical valida-
tion curve coinciding with a diagonal of 0 to 1 would be equivalent to total random predic-
tion. The further up and away the validation curve from the diagonal the better the predictabil-
ity of the model and susceptibility map (Remondo et al. 2003, Lee 2007). And b) The higher
the proportion of landslides in most susceptible zones the better the predictability of the mod-
el (Remondo et al. 2003).
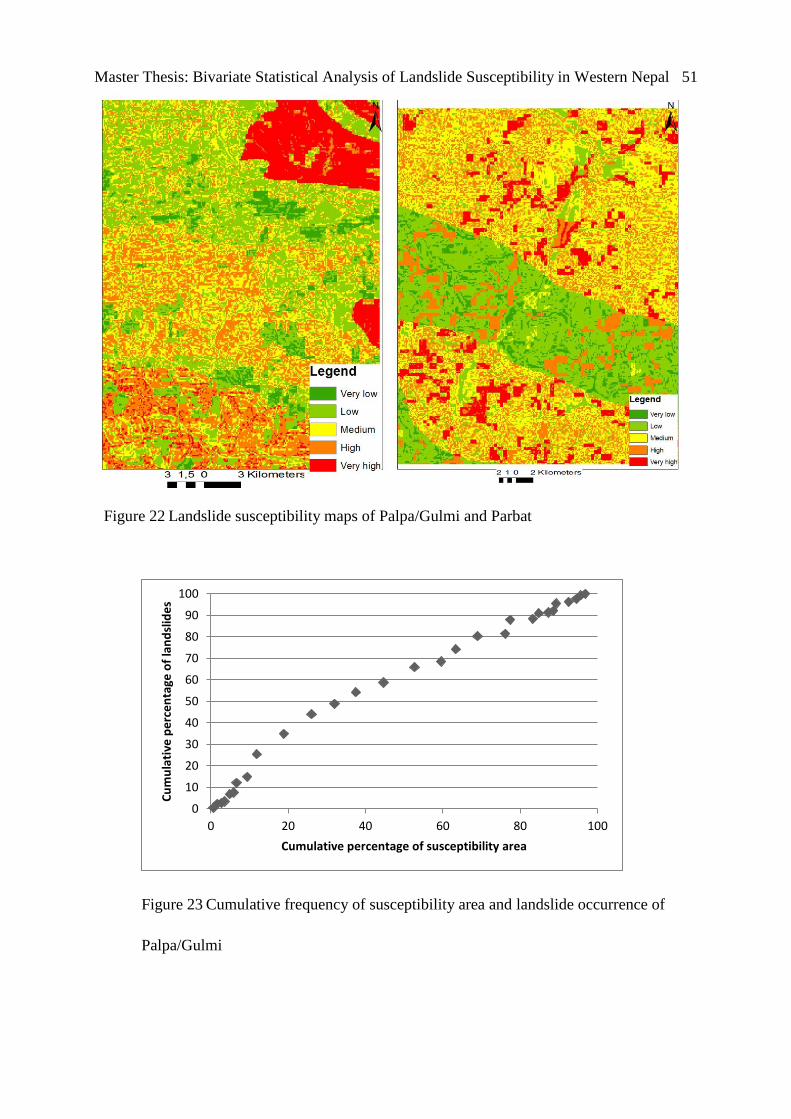
Master Thesis: Bivariate Statistical Analysis of Landslide Susceptibility in Western Nepal 51
Figure 22 Landslide susceptibility maps of Palpa/Gulmi and Parbat
Figure 23 Cumulative frequency of susceptibility area and landslide occurrence of
Palpa/Gulmi
0
10
20
30
40
50
60
70
80
90
100
0 20 40 60 80 100
Cu
mu
lati
ve p
erc
en
tage
of
lan
dsl
ide
s
Cumulative percentage of susceptibility area

Master Thesis: Bivariate Statistical Analysis of Landslide Susceptibility in Western Nepal 52
The first 20% high susceptibility zone occupied around 38% of the landslides in Pal-
pa/Gulmi (Figure 23). This indicates that the model performed moderately well when repli-
cated. The curve is slightly higher than the hypothetical diagonal curve of 0 to1.
Figure 24 Cumulative frequency of susceptibility area and landslide occurrence of
Parbat
The first 20% high susceptibility zone hosted around 39% of the landslides (Figure
24). This indicates that the model performed moderately well. The curve is slightly higher
than the hypothetical diagonal curve of 0 to1.
Table 8 Landslide susceptibility zones and percentage of area in calibrated and model repli-
cated map of Palpa/Gulmi
Landslide susceptibility zone Calibrated map area percent Percentage of area in map
(model replication)
Very low 4 5
Low 29 32
Medium 39 26
High 20 28
Very High 7 9
In Palpa/Gulmi area distribution by susceptibility class varied in calibrated and model
replicated map (Table 8). In model replicated map, very low and low susceptibility zone oc-
0
10
20
30
40
50
60
70
80
90
100
0 20 40 60 80 100
Lan
dsl
die
s in
cu
mu
lati
ve p
erc
en
tage
Cumulative percentage of Susceptibility area
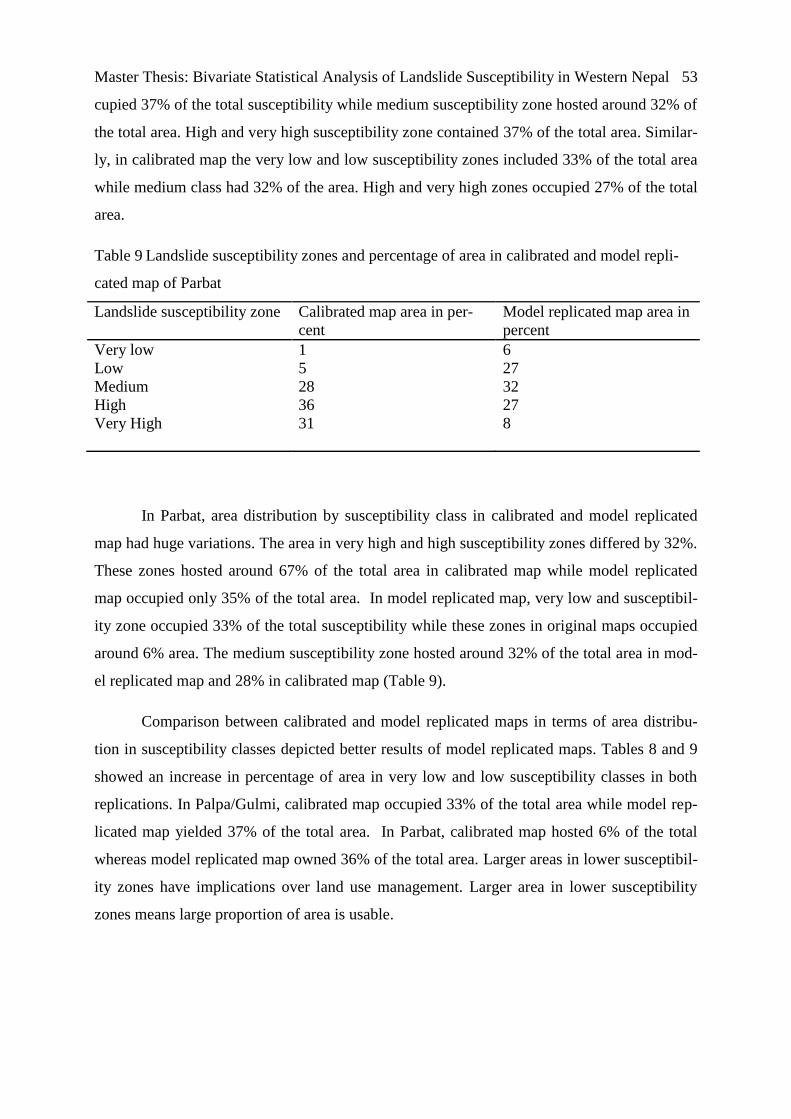
Master Thesis: Bivariate Statistical Analysis of Landslide Susceptibility in Western Nepal 53
cupied 37% of the total susceptibility while medium susceptibility zone hosted around 32% of
the total area. High and very high susceptibility zone contained 37% of the total area. Similar-
ly, in calibrated map the very low and low susceptibility zones included 33% of the total area
while medium class had 32% of the area. High and very high zones occupied 27% of the total
area.
Table 9 Landslide susceptibility zones and percentage of area in calibrated and model repli-
cated map of Parbat
Landslide susceptibility zone Calibrated map area in per-
cent
Model replicated map area in
percent
Very low 1 6
Low 5 27
Medium 28 32
High 36 27
Very High 31 8
In Parbat, area distribution by susceptibility class in calibrated and model replicated
map had huge variations. The area in very high and high susceptibility zones differed by 32%.
These zones hosted around 67% of the total area in calibrated map while model replicated
map occupied only 35% of the total area. In model replicated map, very low and susceptibil-
ity zone occupied 33% of the total susceptibility while these zones in original maps occupied
around 6% area. The medium susceptibility zone hosted around 32% of the total area in mod-
el replicated map and 28% in calibrated map (Table 9).
Comparison between calibrated and model replicated maps in terms of area distribu-
tion in susceptibility classes depicted better results of model replicated maps. Tables 8 and 9
showed an increase in percentage of area in very low and low susceptibility classes in both
replications. In Palpa/Gulmi, calibrated map occupied 33% of the total area while model rep-
licated map yielded 37% of the total area. In Parbat, calibrated map hosted 6% of the total
whereas model replicated map owned 36% of the total area. Larger areas in lower susceptibil-
ity zones have implications over land use management. Larger area in lower susceptibility
zones means large proportion of area is usable.

Master Thesis: Bivariate Statistical Analysis of Landslide Susceptibility in Western Nepal 54
10 CONCLUSIONS
Nepal is one of the landslide prone countries of the World. Very high relief, steep
slopes, complex geology and diverse vegetation cover has made Nepal vulnerable to land-
slides. Landslide susceptibility mapping is very crucial for planning and development in a
disaster prone region of Nepal. Some national level and individual research initiatives have
been published about landslide process, mechanisms and hazard zonation. But there are a few
studies carried out in the Western region of Nepal which is one of the landslide affected re-
gions of the country.
The main aim of the study was to prepare landslide susceptibility maps of five sample
sites (Palpa/Gulmi, Palpa, Baglung/Myagdi, Parbat and Kaski) of Western Nepal and test the
validity of the model. Landslide Nominal Susceptibility Factor (LNSF)-a bivariate statistical
method was employed to analyze the data in Arc GIS version 9.3. The main reason for choos-
ing these sites was availability of landslide inventory database. The results obtained were val-
idated by sample split and model replication.
A total of 787 landslides were recorded in these five study sites with an area of ap-
proximately 10.7 km2. The study sites covered an area of approximately 838.7 km
2 (Pal-
pa/Gulmi), 865.03 km2 (Palpa), 636.4 km
2 (Baglung/Myagdi), 824.6 km
2 (Parbat) and 881.4
km2
(Kaski). Similarly, these sites occupied around 2.1 km2 (Palpa/Gulmi), 4 km
2 (Palpa), 1
km2 (Baglung/Myagdi), 1.5 km
2 (Parbat) and 2 km
2 (Kaski) of landslide area.
Landslide susceptibility maps of the Palpa/Gulmi, Palpa, Baglung/Myagdi, Parbat and
Kaski were made by establishing the relationship between landslides and each casual factor in
Arc GIS environment. For this, the database of landslide inventory and slope, lithology and
land cover were collected and preprocessed. The preprocessing steps included data conversion
to raster format, resampling to 90mx90m resolution and projection in WGS_84 coordinate
system. Resampling of landslide inventory resulted in loss of 3 landslide points in Bag-
lung/Myagdi and one in each of Palpa/Gulmi and Palpa. The size of the landslide was small.
The relationship between landslide distribution and the thematic factors was compared
by estimating percentage of landslides within each class of the slope, lithology and land cover
map. Percentage of landslides increased with increased slope gradient. But the range of slope
gradient from where the landslide distribution fell varied between study areas. . The landslides

Master Thesis: Bivariate Statistical Analysis of Landslide Susceptibility in Western Nepal 55
in sedimentary rocks failed in lower angles. The intensive land use in fragile geology also
contributed positively for landslide failure in lower slope angles.
Terai, Siwaliks, Lower Nuwakot, Upper Nuwakot and Tansen except the Higher Him-
alayan zone were susceptible to landslides. These lithological zones are composed of rock
materials such as alluvial soils, sedimentary rocks (sandstone and shales with fine grained
fossiliferous limestones, shales etc) and metamorphic rocks (white massive quartzites, carbo-
naceous slates and green slates, green phyllites etc). Higher Himalayan zone consists of rela-
tive stable rock masses such as garnet biotite gneiss, biotite and quartzitic mica schists, thin
bands of marbles. But high slope gradients with bare limestone and metamorphic rocks in-
duce landslide process in this zone.
In Palpa/Gulmi and Palpa, Parbat and Kaski cropland and forests were most sensitive
to landslides. Large proportions of landslides were confined to cropland and forests. These
areas have intensive land use for agriculture. For example, cultivated land covered approxi-
mately 65% of the total area and grassland and Shrubland occupied around 8% of the total
area while forests occupied remaining 27% of the area in Palpa/Gulmi. In Baglung/Myadgi
around 70% of landslides were distributed in forests. This area included around 70% of for-
ests, 10% of grass and shrubland and 20% of cropland. The forests in these areas are inten-
sively used as a result forests are degraded. The other most important aspect is that presence
of forests in highly prone lithology might induce landslides due to added canopy and stem
weights of trees during monsoons. Another reason could be vegetated areas in steep slopes
with little soil also affects the soil-root anchorage of the vegetation and consequently affect
the landslide process.
To evaluate the contribution of each factor towards landslide susceptibility, each the-
matic factor map was separately overlayed with landslide inventory map of respective area.
Then a weightage for each thematic class was estimated using equation (1). The estimated
weights were directly assigned to the respective thematic layers to produce the weighted the-
matic maps. The weighted thematic maps were summed up to produce a landslide susceptibil-
ity index (LSI) map according to equation (2). The LSI values were classified into five sus-
ceptibility classes using mean standard deviation.
Distinct color variations between lithological boundaries were visible in the maps. The
reason for this was the weighting process. The effect of each parameter on landslide suscepti-
bility was analyzed by creating rating curves. Parametric effect analysis indicated that the
Master Thesis: Bivariate Statistical Analysis of Landslide Susceptibility in Western Nepal 56
effect of susceptibility parameters is site specific. The effect of lithology was distinct in Pal-
pa/Gulmi, Palpa and Baglung/Myadgi where the abrupt changes in color between lithology
boundaries were seen in the maps. There was very slight difference between rating curves
excluding slope, lithology and land cover in Parbat and Kaski.
Including an input parameter in susceptibility analysis does change the output. The ex-
clusion of land cover did not show any changes in the rating curves in all cases. Therefore,
identifying the most influential parameter is important.
Model validation was performed by model replication. The goodness of fit of the rep-
licated model was evaluated with rating curves. The rating curves were analyzed based on two
assumptions: a) a hypothetical validation curve coinciding with a diagonal of 0 to 1 would be
equivalent to total random prediction. The further up and away the validation curve from the
diagonal the better the predictability of the model and susceptibility map (Remondo et al.
2003, Lee 2007). And b) The higher the proportion of landslides in most susceptible zones the
better the predictability of the model (Remondo et al. 2003).
Model replication proved moderately successful for areas of similar lithology condi-
tions. The rating curves were slightly higher than the hypothetical diagonal curve of 0 to1.
The first 20% high susceptibility zone occupied around 38% and 39% of the landslides in
Palpa/Gulmi and Parbat respectively.
Comparison between calibrated and replicated models by area in susceptibility class
showed better results of model replication. An increase in percentage of area in very low and
low susceptibility classes was observed in both replications. In Palpa/Gulmi, calibrated map
occupied 33% of the total area while model replicated map yielded 37% of the total area. In
Parbat, calibrated map hosted 6% of the total whereas model replicated map owned 36% of
the total area. Larger areas in lower susceptibility zones have implications over land use man-
agement. Larger area in lower susceptibility zones means large proportion of area is usable.
The model replication strategy proved better for Parbat as it improved the predictive capacity
of the model by reducing the area of most susceptible zones by 32% compared to the area
predicted in the original map (susceptibility map developed using the landslides of the same
area).

Master Thesis: Bivariate Statistical Analysis of Landslide Susceptibility in Western Nepal 57
References
Bhattarai, K.R. and Vetaas, O.R. 2003. Variation in plant species richness of different life forms along a subtropical elevation gradient in the Himalayas, east Nepal. Global Ecology and Biogeography 12, 327-340.
Bicheron, P., Defourny, P., Brockmann, C., Schouten, L.I., Vancutsem, C., Huc, M., Bontemps, S. and Leroy, M. 2008. GLOBCOVER: Products Description and Validation Report. 18, avenue E. Belin, bpi 2102, 31401 Toulouse Cedex 9, France
Bilham, R., Larson, K., Freymueller, J., Jouanne, F., Le Fort, P., Leturmy, P., Mugnier, J., Gamond, J., Glot, J. and Martinod, J. 1997. GPS measurements of present-day convergence across the Nepal Himalaya. Nature 386, 61-64.
Caine, N. and Mool, P.K. 1982. Landslides in the Kolpu Khola drainage, middle mountains, Nepal. Mountain Research and Development, 157-173.
Carrara, A. 1983. Multivariate models for landslide hazard evaluation. Mathematical Geology 15, 403-426.
Carrara, A., Cardinali, M., Detti, R., Guzzetti, F., Pasqui, V. and Reichenbach, P. 1991. GIS techniques and statistical models in evaluating landslide hazard. Earth surface processes and landforms 16, 427-445.
CBS, C.B.o.S. 2011. Environment Statistics of Nepal, Government of Nepal, National Planning Comminsion Secretariat, 14 Sept 2010 2008 [Accsessed: 30 Jan 2011]. Available at http://www.cbs.gov.np/es.pdf.
Cruden, D. 1991. A simple definition of a landslide. Bulletin of Engineering Geology and the Environment 43, 27-29.
Cruden, D. and Van Westen, C. 1996. Landslide Types and Processes. In A.Keith, T. and Schuster, R.L. (eds). Lanslides: Investigation and Mitigation Special Report. 247: Transportation Research Board National Research Council, 673.

Master Thesis: Bivariate Statistical Analysis of Landslide Susceptibility in Western Nepal 58
Dahal, R.K. and Hasegawa, S. 2008. Representative rainfall thresholds for landslides in the Nepal Himalaya. Geomorphology 100, 429-443.
Dahal, R.K., Hasegawa, S., Masuda, T. and Yamanaka, M. 2006. Roadside slope failures in Nepal during torrential rainfall and their mitigation. Disaster mitigation of debris flow, slope failures and landslides,(Interpraevent 2007), Universal Academy Press, Tokyo 2, 503–514.
Dai, F., Lee, C., Li, J. and Xu, Z. 2001. Assessment of landslide susceptibility on the natural terrain of Lantau Island, Hong Kong. Environmental Geology 40, 381-391.
''DesInventar -Disaster Information Management System''. 2011. LA RED (Network of Social Studies in the Prevention of Disasters in Latin America (Red de Estudios Sociales en Prevención de Desastres en América Latina); United Nations Development Programme (UNDP) and United Nations International Strategy for Risk Reduction (UNISDR),
[Accsessed: 7 Mai 2011]. Available at http://www.desinventar.net/DesInventar/profiletab.jsp?countrycode=np.
Dhakal, A.S., Amada, T. and Aniya, M. 1999. Landslide hazard mapping and the application of GIS in the Kulekhani watershed, Nepal. Mountain Research and Development 19, 3-16.
Dhittal, M.R., Thapa, P.B., Dahal, R.K., Aryal, A. and Ando, H. 2008. Status of Landslide Hazard in the Kusma-Syagja Area of Western Nepal Lesser Himalaya. Bulletin of the Department of Geology 9, 61-76.
DMG, D.o.M.a.G. 2010. Geological Map of Nepal Government of Nepal 1994 [Accsessed: 1 Jan 2010]. Available at http://www.dmgnepal.gov.np/index.php?
Duman, T.Y., Can, T., Emre, O., Keçer, M., Dogan, A., Ates, S. and Durmaz, S. 2005. Landslide inventory of northwestern Anatolia, Turkey. Engineering geology 77, 99-114.
Duncan, C., Masek, J. and Fielding, E. 2003. How steep are the Himalaya? Characteristics and implications of along-strike topographic variations. Geology 31, 75.
Duncan, J.M. 1996. Soil Slope Stability Analysis. In A.Keith, T. and Schuster, R.L. (eds). Lanslides: Investigation and Mitigation Special Report. 247. Washington , D.C.: Transportation Research Board National Research Council, 673.
Master Thesis: Bivariate Statistical Analysis of Landslide Susceptibility in Western Nepal 59
ESA, E.S.A. 2011. GLOBCOVER map European Space Agency (the GOFC-GOLD Implementation Team Project Office), 2010 2008 [Accsessed: 01 Jan 2011]. Available at http://www.esa.int/esaEO/SEMGSY2IU7E_index_0.html.
Fell, R., Corominas, J., Bonnard, C., Cascini, L., Leroi, E. and Savage, W.Z. 2008. Guidelines for landslide susceptibility, hazard and risk zoning for land-use planning. Engineering geology 102, 99-111.
Gabet, E.J., Burbank, D.W., Putkonen, J.K., Pratt-Sitaula, B.A. and Ojha, T. 2004a. Rainfall thresholds for landsliding in the Himalayas of Nepal. Geomorphology 63, 131-143.
Gabet, E.J., Pratt-Sitaula, B.A. and Burbank, D.W. 2004b. Climatic controls on hillslope angle and relief in the Himalayas. Geology 32, 629.
Gerrard, J. 1994. The landslide hazard in the Himalayas: geological control and human action. Geomorphology 10, 221-230.
Gerrard, J. and Gardner, R. 2002. Relationships between landsliding and land use in the Likhu Khola drainage basin, Middle Hills, Nepal. Mountain Research and Development 22, 48-55.
Ghimire, M. 2011. Landslide occurrence and its relation with terrain factors in the Siwalik Hills, Nepal: case study of susceptibility assessment in three basins. Natural Hazards, 1-22.
Gilmour, D., Bonell, M. and Cassells, D. 1987. The effects of forestation on soil hydraulic properties in the Middle Hills of Nepal: a preliminary assessment. Mountain Research and Development 7, 239-249.
Gupta, R. and Joshi, B. 1990. Landslide hazard zoning using the GIS approach--A case study from the Ramganga catchment, Himalayas. Engineering geology 28, 119-131.
Gurung, N., Haneberg, W.C., Ramana, G. and Datta, M. 2011. Engineering Geology and Stability of the Laprak Landslide, Gorkha District, Western Nepal. Environmental and Engineering Geoscience 17, 23.
Guzzetti, F., Carrara, A., Cardinali, M. and Reichenbach, P. 1999. Landslide hazard evaluation: a review of current techniques and their application in a multi-scale study, Central Italy. Geomorphology 31, 181-216.

Master Thesis: Bivariate Statistical Analysis of Landslide Susceptibility in Western Nepal 60
Hasegawa, S., Dahal, R.K., Yamanaka, M., Bhandary, N.P., Yatabe, R. and Inagaki, H. 2009. Causes of large-scale landslides in the Lesser Himalaya of central Nepal. Environmental Geology 57, 1423-1434.
Heuberger, H., Masch, L., Preuss, E. and Schröcker, A. 1984. Quaternary landslides and rock fusion in Central Nepal and in the Tyrolean Alps. Mountain Research and Development 4, 345-362.
Holtz, R.D. and Schuster, R.L. 1996. Stabilization of Soil Slopes. In A.Keith, T. and Schuster, R.L. (eds). Lanslides: Investigation and Mitigation Special Report. 247. Washington, D.C.: Transportation Research Board National Research Council, 673.
Ichiyanagi, K., Yamanaka, M.D., Muraji, Y. and Vaidya, B.K. 2007. Precipitation in Nepal between 1987 and 1996. International Journal of Climatology 27, 1753-1762.
Isciences. 2011. Elevation data (SRTM3) ISCIENCES, L.L.C., makers of TerraViva!, 2000 [Accsessed: 01 Jan 2011]. Available at http://www.isciences.com/index.html.
Ives, J.D. and Messerli, B. 1981. Mountain Hazards Mapping in Nepal Introduction to an Applied Mountain Research Project. Mountain Research and Development 1, 223-230.
Kaddah, M.T. 1967. Land Form and Use and Chracteristics of Some Soils in Nepal. Soil Science 104, 350.
Kansakar, S.R., Hannah, D.M., Gerrard, J. and Rees, G. 2004. Spatial pattern in the precipitation regime of Nepal. International Journal of Climatology 24, 1645-1659.
Keaton, J.R. and Beckwith, G.H. 1996. Important Considerations in Slope Design. In A.Keith, T. and Schuster, R.L. (eds). Lanslides: Investigation and Mitigation Special Report. 247. Washington, D.C.: Transportation Research Board National Research Council, 673.
Kienholz, H., Hafner, H., Schneider, G. and Tamrakar, R. 1983. Mountain Hazards Mapping in Nepal's Middle Mountains Maps of Land Use and Geomorphic Damages (Kathmandu-Kakani Area). Mountain Research and Development 3, 195-220.
Laban, P. 1979. Landslide occurrences in Nepal. FO: NEP/74/020, IWM/WP/13 Kathmandu, FAO.

Master Thesis: Bivariate Statistical Analysis of Landslide Susceptibility in Western Nepal 61
Lave, J., Yule, D., Sapkota, S., Basant, K., Madden, C., Attal, M. and Pandey, R. 2005. Evidence for a great Medieval earthquake (~ 1100 AD) in the central Himalayas, Nepal. Science 307, 1302.
Lawrance, C., Rickson, R. and Clark, J. 1996. The effect of grass roots on the shear strength of colluvial soils in Nepal. Advances in Hillslope Processes, Anderson, MG and SM Brooks (Eds) John Wiley and Sons, USA, ISBN: 0-471-96774-2, 857-868.
Lee, S. 2007. Comparison of landslide susceptibility maps generated through multiple logistic regression for three test areas in Korea. Earth surface processes and landforms 32, 2133-2148.
Lee, S. and Min, K. 2001. Statistical analysis of landslide susceptibility at Yongin, Korea. Environmental Geology 40, 1095-1113.
Mahat, T.B.S., Griffin, D.M. and Shepherd, K. 1986. Human impact on some forests of the middle hills of Nepal 1. Forestry in the context of the traditional resources of the state. Mountain Research and Development 6, 223-232.
Molnar, P. and Tapponnier, P. 1975. Cenozoic tectonics of Asia: effects of a continental collision. Science 189, 419-426.
Nadim, F., Kjekstad, O., Peduzzi, P., Herold, C. and Jaedicke, C. 2006. Global landslide and avalanche hotspots. Landslides 3, 159-173.
NGI, N.G.I. 2004. Landslide hazard and risk assessment in Nepal. Unpublished report.
Pandey, M., Tandukar, R., Avouac, J., Vergne, J. and Héritier, T. 1999. Seismotectonics of the Nepal Himalaya from a local seismic network. Journal of Asian Earth Sciences 17, 703-712.
Patriat, P. and Achache, J. 1984. India–Eurasia collision chronology has implications for crustal shortening and driving mechanism of plates.
Paudel, P.P., Omura, H., Kubota, T. and Morita, K. 2003. Landslide damage and disaster management system in Nepal. Disaster Prevention and Management 12, 413-419.

Master Thesis: Bivariate Statistical Analysis of Landslide Susceptibility in Western Nepal 62
Petley, D., Hearn, G.J. and Hart, A. 2004. Towards the development of a landslide risk assessment for rural roads in Nepal. Landslide hazards and risk, 597-619.
Petley, D.N., Hearn, G.J., Hart, A., Rosser, N.J., Dunning, S.A., Oven, K. and Mitchell, W.A. 2007. Trends in landslide occurrence in Nepal. Natural Hazards 43, 23-44.
Pokhrel, D., Bhandari, B. and Viraraghavan, T. 2009. Natural hazards and environmental implications in Nepal. Disaster Prevention and Management 18, 478-489.
Poudyal, C.P., Chang, C., Oh, H.J. and Lee, S. 2010. Landslide susceptibility maps comparing frequency ratio and artificial neural networks: a case study from the Nepal Himalaya. Environmental Earth Sciences, 1-16.
Powell, C.M.A. and Conaghan, P. 1973. Plate tectonics and the Himalayas. Earth and Planetary Science Letters 20, 1-12.
Pradhan, B. and Buchroithner, M.F. 2010. Comparison and Validation of Landslide Susceptibility Maps Using an Artificial Neural Network Model for Three Test Areas in Malaysia. Environmental & Engineering Geoscience 16, 107-126.
Regmi, N.R., Giardino, J.R., Vitek, J.D. and Dangol, V. 2010. Mapping Landslide Hazards in Western Nepal: Comparing Qualitative and Quantitative Approaches. Environmental and Engineering Geoscience 16, 127.
Remondo, J., Gonzalez, A., De Teran, J.R.D., Cendrero, A., Fabbri, A. and Chung, C.J.F. 2003. Validation of landslide susceptibility maps; Examples and applications from a case study in northern Spain. Natural Hazards 30, 437-449.
Rowbotham, D.N. and Dudycha, D. 1998. GIS modelling of slope stability in Phewa Tal watershed, Nepal. Geomorphology 26, 151-170.
Sharma, K. 1993. Role of meltwater in major river systems of Nepal. IAHS Publications-Publications of the International Association of Hydrological Sciences 218, 113-122.
Master Thesis: Bivariate Statistical Analysis of Landslide Susceptibility in Western Nepal 63
Sharma, K.P., Vorosmarty, C.J. and Moore, B. 2000. Sensitivity of the Himalayan hydrology to land-use and climatic changes. Climatic Change 47, 117-139.
Shrestha, D.P. and Zinck, J.A. 2001. Land use classification in mountainous areas: integration of image processing, digital elevation data and field knowledge (application to Nepal). International Journal of Applied Earth Observation and Geoinformation 3, 78-85.
Shroder Jr, J.F. and Bishop, M.P. 2004. Mountain geomorphic systems. Geographic information science and mountain geomorphology, 33–73.
Soeters, R. and Van Westen, C. 1996. Slope instability recognition, analysis, and zonation. Landslides: Investigation and Mitigation Special Report. 247: Transportation Research Board National Research Council, 129 - 173.
Süzen, M.L. and Doyuran, V. 2004a. A comparison of the GIS based landslide susceptibility assessment methods: multivariate versus bivariate. Environmental Geology 45, 665-679.
Süzen, M.L. and Doyuran, V. 2004b. Data driven bivariate landslide susceptibility assessment using geographical information systems: a method and application to Asarsuyu catchment, Turkey. Engineering geology 71, 303-321.
Tiwari, P. 2000. Land-use changes in Himalaya and their impact on the plains ecosystem: need for sustainable land use. Land Use Policy 17, 101-111.
Upreti, B.N. 1999. An overview of the stratigraphy and tectonics of the Nepal Himalaya. Journal of Asian Earth Sciences 17, 577-606.
Upreti, B.N. and Dhital, M. 1996. Landslide studies and management in Nepal.
Van Westen, C., Rengers, N. and Soeters, R. 2003. Use of geomorphological information in indirect landslide susceptibility assessment. Natural Hazards 30, 399-419.
Van Westen, C., Van Asch, T.W.J. and Soeters, R. 2006. Landslide hazard and risk zonation—why is it still so difficult? Bulletin of Engineering Geology and the Environment 65, 167-184.

Master Thesis: Bivariate Statistical Analysis of Landslide Susceptibility in Western Nepal 64
Van Westen, C.J., Rengers, N., Terlien, M. and Soeters, R. 1997. Prediction of the occurrence of slope instability phenomenal through GIS-based hazard zonation. Geologische Rundschau 86, 404-414.
Vetaas, O.R. and Grytnes, J.A. 2002. Distribution of vascular plant species richness and endemic richness along the Himalayan elevation gradient in Nepal. Global Ecology and Biogeography 11, 291-301.
Wagner, A. 1983. The principal geological factors leading to landslides in the foothills of Nepal: a statistical study of 100 landslides—steps for mapping the risk of landslides. HELVETAS–Swiss Technical Cooperation and ITECO–Company for International Cooperation and Development, unpublished, 58.
Waltham, T. 1996. Very large landslides in the Himalayas. Geology Today 12, 181-185.
Wieczorek, G.F. 1996. Landslide Triggering Mechanisms. In A.Keith, T. and Robert.L, S. (eds). Landslides: Investigation and Mitigation Special Report. 247: Transportation Research Board National Research Council, National Academy Press, Washington, D.C. , 675.
Wobus, C.W., Hodges, K.V. and Whipple, K.X. 2003. Has focused denudation sustained active thrusting at the Himalayan topographic front? Geology 31, 861.
Wright, R.H., Campbell, R.H. and Nilsen, T.H. 1974. Preparation and use of isopleth maps of landslide deposits. Geology 2, 483.

Master Thesis: Bivariate Statistical Analysis of Landslide Susceptibility in Western Nepal 65
APPENDICES
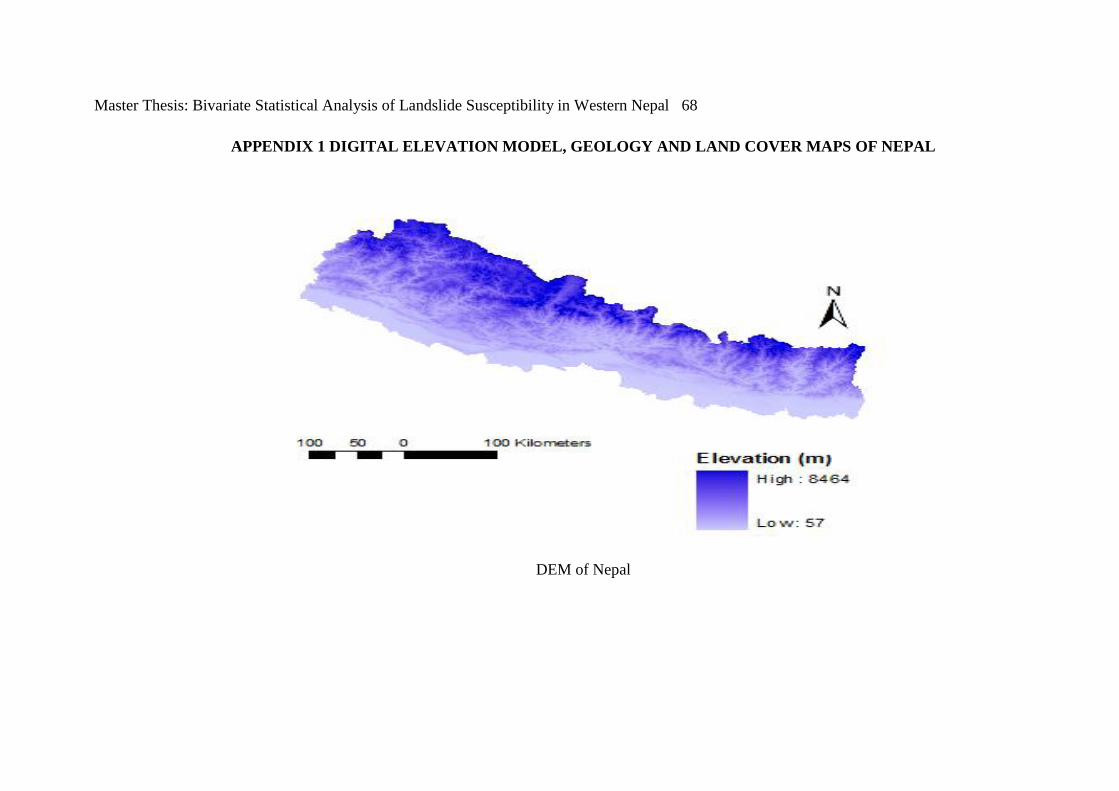
Master Thesis: Bivariate Statistical Analysis of Landslide Susceptibility in Western Nepal 68
APPENDIX 1 DIGITAL ELEVATION MODEL, GEOLOGY AND LAND COVER MAPS OF NEPAL
DEM of Nepal

Master Thesis: Bivariate Statistical Analysis of Landslide Susceptibility in Western Nepal 69
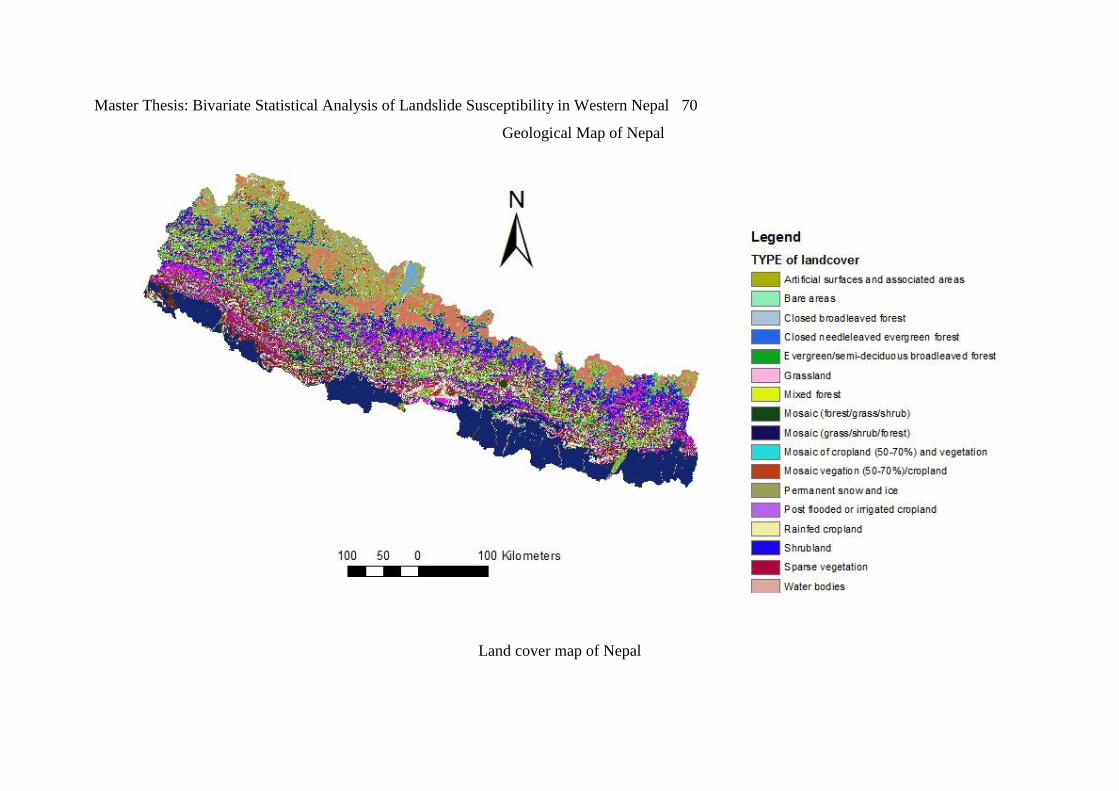
Master Thesis: Bivariate Statistical Analysis of Landslide Susceptibility in Western Nepal 70
Geological Map of Nepal
Land cover map of Nepal

Master Thesis: Bivariate Statistical Analysis of Landslide Susceptibility in Western Nepal 71
APPENDIX 2 Lithology classification of Nepal
OBJECT
ID
Class Symbol Name Group Sub_
Group
Age Description of the geological unit
1 (blank)
2 Ba Ba Baitadi
Beds
Midland
Group
Lakharpat
a
Upper pre cambrian -
Late Paleozoic
Thick beds of grey siliceous dolomites
3 Basic
Rocks
Bs "perhaps basalt and extrusive rocks from sea origin
4 Bb Bb Balbang
schists
Midland
Group
Jal Jala Pre Cambrian Schist quartz mica schist interbedded with calcareous
quartzites and thinly laminated crystalline limestones
5 Bh Bh Bhimphedi
Group
Bhimphedi Precambrian Green schists metamorphosed rocks. Schists, quartzites
and few marble horizons. Locally migmatized and
gneissified. Granite intrusions present. Equivalent to
Precambrian rocks of the Higher Himalayan Crystallines
6 Bu Bu Budhi
Ganga
Gneiss
Dadelhura Pre Cambrian Augen gneisses, granitic gneisses, and feldsphatic
schists
7 Chandragir
i
Formation
Ca Chandragir
i
Formation
Kathmand
u
Phulcoki Pre Cambiran -
Devonian
Light fine grained cyrstalline limestones partly siliceous
thick to massively bedded quartzites in upper parts.
Wavy limestones contain late ordovician schinoderms
8 Chitlang
Formation
Ch Chitlang
Formation
Kathmand
u
Phulcoki Pre Cambiran -
Devonian
Dark slates with white quartzites at the base impure
limestones and two ferrugenous beds containing
trilobites
9 Cr Cr Chour- Midland Dailekh Upper pre cambrian - Chour carbonates white to gray compact dolomite and

Master Thesis: Bivariate Statistical Analysis of Landslide Susceptibility in Western Nepal 72
Ghanapok
hara
Formation
Group Late Paleozoic dolomitic limestones interbedded with shales beds
10 Cs Cs Calc.
Silicate
rocks
(member
of Sarung
Khola)
Kathmand
u
Bimphedi Pre Cambiran -
Devonian
Calcareous silicate rocks and marble bands
11 Damgad
Formation
Da Damgad
Formation
Dadelhura Pre Cambrian Grey to greenish grey quartzites, calcareous quartzites,
and crystalline limestones
12 Du Du Dunga
Quartzites
beds
Midland
Group
Lakharpat
a
Upper pre cambrian -
Late Paleozoic
Quartzites
13 Dware
kharka
Schist
Dk Dware
kharka
Schists
Himal Pre Cambrian Medium to coarse grained quartz muscovite biotite
schists garnetiferous schistose gneisses and kyanite
schists
14 Galyang
Formation
Gl Galyang
Formation
Midland
Group
Lakharpat
a
Upper pre cambrian -
Late Paleozoic
Dark gray slates intercalated with thin grey calcareous
slates and lamillae of carbonates
15 Gh Gh Ghatte Gad
Carbonates
Dadelhura Pre Cambrian Bluish crystalline limestones, calcareous schists, and
quartz biotite schists
16 Ghanapok
hara
Formation
Gp Ghanapok
hara
Formation
Midland
Group
Dailekh Upper pre cambrian -
Late Paleozoic
Black to gray carbonaceous slates and green shales
17 Gn Gn Augen
gneisses Augen gneisses, banded gneisses
18 Granites Gr Granites
19 Himal Hg Himal Himal Pre Cambrian Two mica gneisses, granitic gneisses, banded gneisses,

Master Thesis: Bivariate Statistical Analysis of Landslide Susceptibility in Western Nepal 73
Gneiss gneisses kyanite bearing gneisses, migmatites, and thin bands of
marbles
20 Himal
Group
Hm Himal
Group
Himal Pre Cambrian Garnet biotite gneisses, kyanite biotite gneisses,
garnetiferous mica schists augen gneisses, micaceous
quatzites, and thin bands of marbles
21 Kalikot
Formation
Kk Kalikot
Formation Garnetiferous biotite schists and micaceous quartzites
with gneisses
22 Kushma
Formation
Ks Kushma
Formation
Midland
Group
Dailekh Upper pre cambrian -
Late Paleozoic
Greenish grey, White fine to medium grained at places
ripple marked massive quartzite intercalated with green
phyllites. Basic intrusions are abundant
23 Lakharpata
Formation
Lk Lakharpata
Formation
Midland
Group
Lakharpat
a
Upper pre cambrian -
Late Paleozoic
Fine grained, light blue, grey limestones and dolomites
with thin intercalations of grey shales, White, pink
dolomitic limestones, purple quartzites and green shales
at the top. Algal structure and stromatolites are present
24 Lower
Siwalik
Ls Lower
Siwalik
Siwalik Mid Miocene -
Pleistocene
Fine grained, hard, grey sandstones interbedded with
purple and chocolate coloured shales, nodular maroon
clays and pseudo conglomerates
25 Maksang
Formation
Mk Maksang
Formation
Kathmand
u
Bimphedi Pre Cambiran -
Devonian
White fine grained quartzites cross bedded
26 Markhu
Formation
Mr Markhu
Formation
Kathmand
u
Bimphedi Pre Cambiran -
Devonian
Massive coarse to medium grained crystalline marble
changin northward to dark fine biotites schists
interbedded with impur marbles and quartzites.
Stromatolites are found
27 Melmura
Formation
Me Melmura
Formation
Dadelhura Pre Cambrian Grey to dark grey phyllites quartzites and phyllitic
schists
28 Melpani
Formation
Mp Melpani
Formation
Surkhet Cretaceous - Eocene White, grey, ferruginous well bedded massive or the
quartzites interbedded with grey carbonaceous crumpled
and reddish brown shales and occasional conglomerates
and fossiliferous limestones gastropodes (Promothilida),

Master Thesis: Bivariate Statistical Analysis of Landslide Susceptibility in Western Nepal 74
pelecypods (Modiolo, Peuromya, Homom
29 Middle
Siwalik
Ms Middle
Siwalik
Siwalik Mid Miocene -
Pleistocene
Fine to medium grained arkosic pebbly sandstones with
rare to dark grey clays, siltstones and conglomerates and
coarse grained friable arkosic sandstones hard massive
grey sandstones, interbedded with green to greenish grey
shales and mudstones. Plant an
30 Middle
Siwalik1
Ms1 Middle
Siwalik1
Siwalik Mid Miocene -
Pleistocene
Fine to medium grained friable arkosic sandstones and
hard compact massive sandstones intercalated with
green to greenish grey clays, thin bands of pseudo-
conglomerates and mudstones. Plant and animal fossils
are present in clays
31 Middle
Siwalik2
Ms2 Middle
Siwalik2
Siwalik Mid Miocene -
Pleistocene
Medium to coarse grained, arkosic, pebbly sandstones
with rare grey to dark greys clays and occassionally silty
sandstones and conglomerates
32 Mz Mz Sandstone
Tibetan Triassic to Lower
Cretaceous
Mainly sahllow continental plateform sediments with
local pro-delta facies in the Early Cretacious.
Sandstones, slates, shales with glauconite. Mainly
ammonites and belemnites in Jurrassic limestone
33 Naudanda
Formation
Nd Naudanda
Formation
Midland
Group
Dailekh Upper pre cambrian -
Late Paleozoic
White massive fine to medium grained quartzites with
ripple marks interbedded with shales beds
34 Pa Pa Pandrang
(member
of Tawa
Khola
Fm.)
Kathmand
u
Bimphedi Pre Cambrian -
Devonian
light green quartzites
35 Panglema
Quartizite
Pg Panglema
Quartzite
Himal Pre Cambrian Fine grained compact quartzitic schists and quartzites
occassionally cyrstalline limestones
36 ph ph Phulchauki
Group
Phulchauki Early to Middle
Paleozoic
Fossiliferous (crinoids and trilobites) calcareous rocks
with subordinate siliceous and argilaceous sediments in
the upper part. Lower part consists of clastic and feebly

Master Thesis: Bivariate Statistical Analysis of Landslide Susceptibility in Western Nepal 75
metamorphosed rocks (phyllites, quartzites and
siltstones)
37 Phulchowk
i
Formation
Ph Phulchowk
i
Formation
Kathmand
u
Phulcoki Pre Cambrian -
Devonian
Light brown dolomite underlain by crinoidal limestones
38 Pz Pz Limestone
Tibetan Cambrian to Permian Lower part mainly calcareous, middle part pelagic and
upper part is rich in detrital sediments. Limestone,
sandstone and shale. Early Permian tilloid beds with
platn fossils and focal spilitic lava flows.
39 Qh Qh Quaternary
Himalaya Plio-Pleistocene Mainly fluvial and fluvio terrential sediments with local
lacustrine clays and marlstones
40 Quaternary Q Quaternary Quatenary Alluvium, boulders, gravels, sands and clays
41 Ranimatta
Formation
Rm Ranimatta
Formation
Midland
Group
Dailekh Upper pre cambrian -
Late Paleozoic
Grey greenish grey gritty phyllites grilstones with
conglomerates and white massive quartzites. In the
upper parts basic instrusion are noted
42 Rb Rb Robang
Formation
Midland
Group
Lakharpat
a
Upper pre cambrian -
Late Paleozoic
Green chlorotic phyllites layers of basic rocks
43 Recent Rec Recent Recent Alluvium, boulders, gravels, sands and clays
44 Sallyani
Gad
Formation
Sl Salyani
Gad
Dadelhura Pre Cambrian Aplites granite gneisses, augen gneisses, and biotite
gneisses
45 Sangram
Formation
Sg Sangram
Formation
Midland
Group
Lakharpat
a
Upper pre cambrian -
Late Paleozoic
Black, dark gray to greenish grey shales with
intercalation of limestones and quartzites
46 Sarung
Khola
Formation
Sk Sarung
Khola
Formation
Kathmand
u
Bimphedi Pre Cambiran -
Devonian
Fine grained dark green grey biotite and quartzitic mica
schists occassionally garnetiferous interbedded with
impure strongly micaceous quartzites
47 Seti St Seti Midland Pokhara Upper pre cambrian - Grey to greenish grey phyllites, gritty phyllites and

Master Thesis: Bivariate Statistical Analysis of Landslide Susceptibility in Western Nepal 76
Formation Formation Group (Dailekh?) Late Paleozoic quartzites with minor conglomeratic layers. Basic
intrusions are also noted
48 Sh Sh Schists
quartzites
gneisses
Kathmand
u
Bimphedi Pre Cambiran -
Devonian
Undeferentiated schists quartzites gneisses and
calcareous silicate rocks (cs) of Bhimpedi sub group and
Tistung Formation in rarious stages of migmatization
49 Shiprin
Khola
Formation
Sp Siphirn
Khola
Formation
Kathmand
u
Phulcoki Pre Cambiran -
Devonian
Coarse crystalline highly garnetiferous muscovite biotite
quartz schists quartzites, green chlorites schists at the
base
50 Siuri
Formation
Sr Siuri
Formation
Midland
Group
Jal Jala Pre Cambrian Garnetiferous quartz biotite schists, garnetiferous
chlorite-quartz schists, muscovite biotite schists,
calcareous schists, massive quartzites with rare graphitic
schists. Intrusion of basic rocks and granites are found
51 Sopyang
Formation
So Sopyang
Formation
Kathmand
u
Phulcoki Pre Cambiran -
Devonian
Dark argillaceous and marly slates with thin limestones
52 Suntar
Formation
Sn Suntar
Formation
Surkhet Cretaceous - Eocene Fine to medium grained, greenish grey sandstones and
purple shales with intercalations of green splintary
shales
53 Surbang
Formation
Sb Surbang Midland
Group
Jal Jala Pre Cambrian Grey to brown cherty crystalline limestones interbedded
with calcareous schist, calcareous quartzites and biotite
quartz schists
54 Swat
Formation
Sw Swat
Formation
Surkhet Cretaceous - Eocene Grey to dary grey, carbonaceous, shales with lenses of
fine grained fossiliferous limestones (Nummulites sp.,
Assilina sp., etc.)
55 Syangja
Formation
Sy Syanja
Formation
Midland
Group
Lakharpat
a
Upper pre cambrian -
Late Paleozoic
White pale orange pinkish or purplish calcareous
quartzites and quartzitic limestones intercalated with
dark grey purple and green shales strongly ripply
marked quartzites at the base
56 Takure
Formation
Tk Takure
Formation
Midland
Group
Gondwana Permo -
Carboniferous
Sandstones, quartzitic sandstones, graphitic coals,
chloritic phyllites, lamprophyre sills and at some places
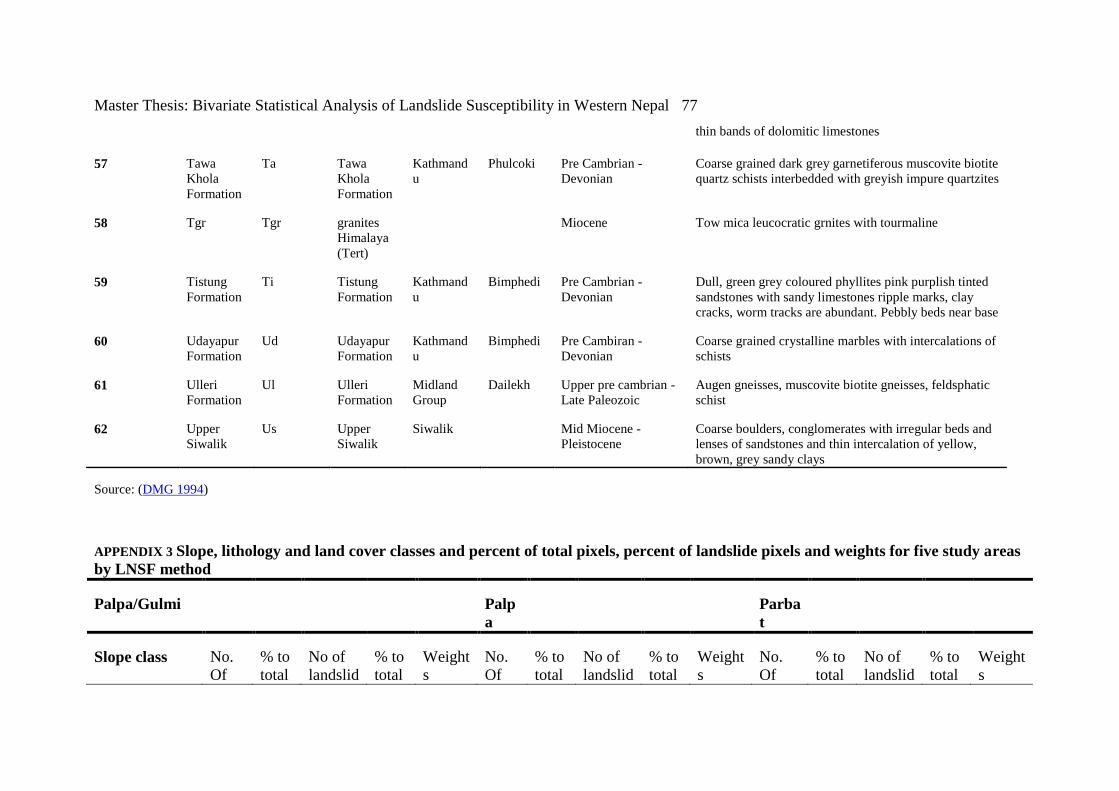
Master Thesis: Bivariate Statistical Analysis of Landslide Susceptibility in Western Nepal 77
thin bands of dolomitic limestones
57 Tawa
Khola
Formation
Ta Tawa
Khola
Formation
Kathmand
u
Phulcoki Pre Cambrian -
Devonian
Coarse grained dark grey garnetiferous muscovite biotite
quartz schists interbedded with greyish impure quartzites
58 Tgr Tgr granites
Himalaya
(Tert)
Miocene Tow mica leucocratic grnites with tourmaline
59 Tistung
Formation
Ti Tistung
Formation
Kathmand
u
Bimphedi Pre Cambrian -
Devonian
Dull, green grey coloured phyllites pink purplish tinted
sandstones with sandy limestones ripple marks, clay
cracks, worm tracks are abundant. Pebbly beds near base
60 Udayapur
Formation
Ud Udayapur
Formation
Kathmand
u
Bimphedi Pre Cambiran -
Devonian
Coarse grained crystalline marbles with intercalations of
schists
61 Ulleri
Formation
Ul Ulleri
Formation
Midland
Group
Dailekh Upper pre cambrian -
Late Paleozoic
Augen gneisses, muscovite biotite gneisses, feldsphatic
schist
62 Upper
Siwalik
Us Upper
Siwalik
Siwalik Mid Miocene -
Pleistocene
Coarse boulders, conglomerates with irregular beds and
lenses of sandstones and thin intercalation of yellow,
brown, grey sandy clays
Source: (DMG 1994)
APPENDIX 3 Slope, lithology and land cover classes and percent of total pixels, percent of landslide pixels and weights for five study areas
by LNSF method
Palpa/Gulmi Palp
a
Parba
t
Slope class No.
Of
% to
total
No of
landslid
% to
total
Weight
s No.
Of
% to
total
No of
landslid
% to
total
Weight
s No.
Of
% to
total
No of
landslid
% to
total
Weight
s

Master Thesis: Bivariate Statistical Analysis of Landslide Susceptibility in Western Nepal 78
total
pixel
s
pixel
s e pixels pixel
s total
pixel
s
pixel
s e pixels pixel
s total
pixels pixel
s e pixels pixel
s
1 7544 7 8 3 0,30 1024
3 8 20 4 0,4 4496 6 3 2 0,24
2 1256
3 12 21 8 0,80 1593
2 12 43 9 0,9 9223 12 7 6 0,57
3 1485
9 14 47 18 1,78 1970
3 15 59 12 1,2 12992 16 10 8 0,81
4 1774
0 16 45 17 1,70 2048
7 16 69 14 1,4 13811 17 22 18 1,79
5 1637
2 15 35 13 1,33 1908
7 15 83 17 1,7 12745 16 16 13 1,30
6 1366
6 13 31 12 1,17 1608
8 12 77 15 1,5 10686 13 25 20 2,03
7 1101
3 10 32 12 1,21 1294
6 10 55 11 1,1 7619 10 11 9 0,89
8 7975 7 31 12 1,17 8963 7 54 11 1,1 4908 6 19 14 1,54
9 4663 4 12 5 0,45 4478 3 36 7 0,7 2677 3 3 2 0,24
10 1137 1 2 1 0,11 1273 1 3 1 0,1 559 1 8 7 0,57
Geology class
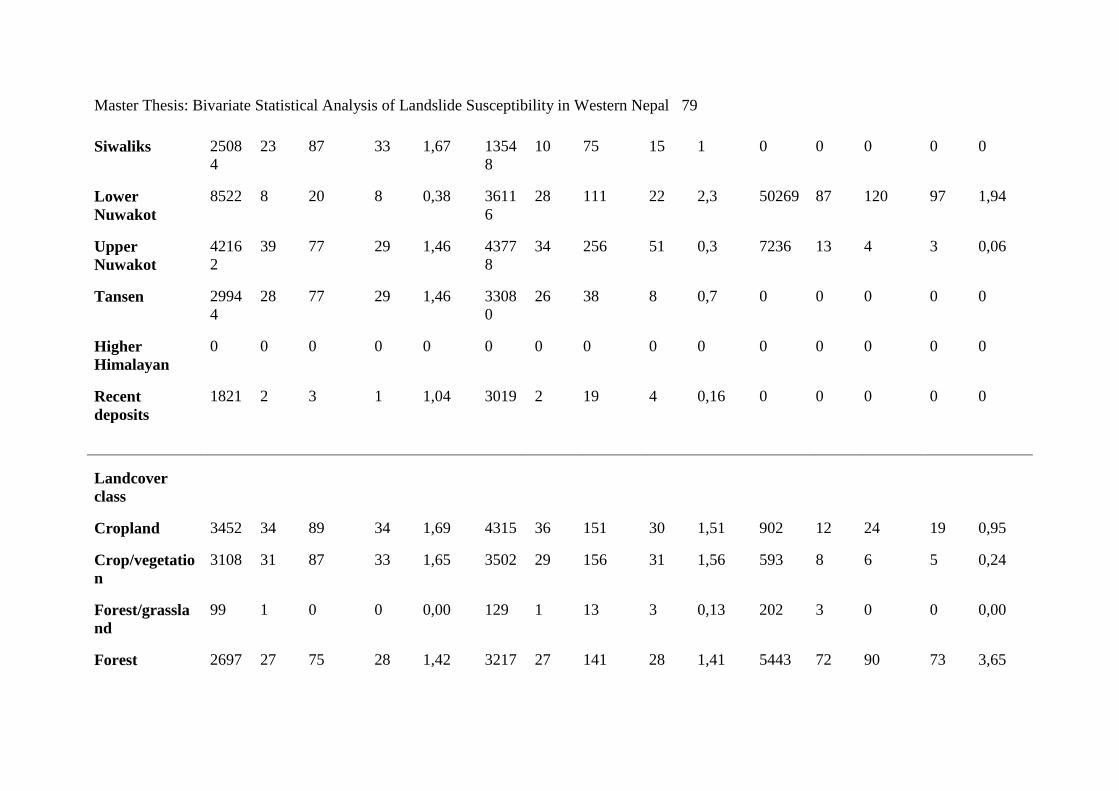
Master Thesis: Bivariate Statistical Analysis of Landslide Susceptibility in Western Nepal 79
Siwaliks 2508
4 23 87 33 1,67 1354
8 10 75 15 1 0 0 0 0 0
Lower
Nuwakot
8522 8 20 8 0,38 3611
6 28 111 22 2,3 50269 87 120 97 1,94
Upper
Nuwakot
4216
2 39 77 29 1,46 4377
8 34 256 51 0,3 7236 13 4 3 0,06
Tansen 2994
4 28 77 29 1,46 3308
0 26 38 8 0,7 0 0 0 0 0
Higher
Himalayan
0 0 0 0 0 0 0 0 0 0 0 0 0 0 0
Recent
deposits
1821 2 3 1 1,04 3019 2 19 4 0,16 0 0 0 0 0
Landcover
class
Cropland 3452 34 89 34 1,69 4315 36 151 30 1,51 902 12 24 19 0,95
Crop/vegetatio
n
3108 31 87 33 1,65 3502 29 156 31 1,56 593 8 6 5 0,24
Forest/grassla
nd
99 1 0 0 0,00 129 1 13 3 0,13 202 3 0 0 0,00
Forest 2697 27 75 28 1,42 3217 27 141 28 1,41 5443 72 90 73 3,65

Master Thesis: Bivariate Statistical Analysis of Landslide Susceptibility in Western Nepal 80
Shrubland 714 7 13 5 0,25 785 7 38 8 0,38 420 6 4 3 0,16
Bareland 0 0 0 0 0,00 0 0 0 0 0,00 0 0 0 0 0,00
Grassland 0 0 0 0 0,00 0 0 0 0 0,00 0 0 0 0 0,00
Snow 0 0 0 0 0,00 0 0 0 0 0,00 0 0 0 0 0,00

Master Thesis: Bivariate Statistical Analysis of Landslide Susceptibility in Western Nepal 81
Kasi Baglung/Myadgi
Slope class No. Of
total
pixels
% to
total
pixels
No of
landslide
pixels
% to
total
pixels
Weights No. Of
total
pixels
% to
total
pixels
No of
landslide
pixels
% to
total
pixels
Weights
1 6578 6 10 6 0,55 6374 6 5 2 0,20
2 12108 11 20 11 1,10 11635 11 31 12 1,23
3 15660 15 45 25 2,49 16440 15 43 17 1,70
4 17442 16 32 18 1,77 18218 17 46 18 1,82
5 16266 15 26 14 1,44 16686 15 32 13 1,26
6 14053 13 17 9 0,94 14356 13 34 13 1,34
7 11530 11 12 7 0,66 11161 10 29 11 1,15
8 7989 7 10 6 0,55 7348 7 16 6 0,63
9 4530 4 6 3 0,33 4379 4 13 5 0,51
10 1376 1 3 2 0,17 1903 2 4 2 0,16
Geology class
Siwaliks 0 0 0 0 0 0 0 0 0 0
Lower Nuwakot 72214 67 155 86 2,6 60052 56 166 66 1,06
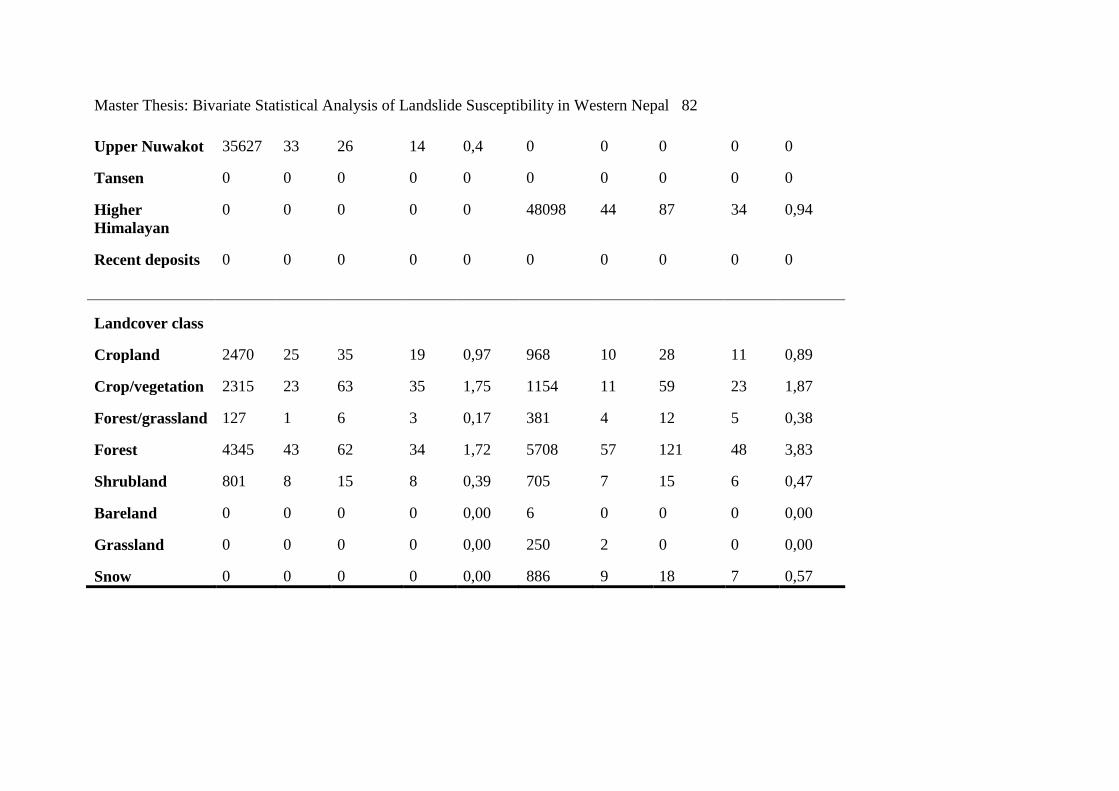
Master Thesis: Bivariate Statistical Analysis of Landslide Susceptibility in Western Nepal 82
Upper Nuwakot 35627 33 26 14 0,4 0 0 0 0 0
Tansen 0 0 0 0 0 0 0 0 0 0
Higher
Himalayan
0 0 0 0 0 48098 44 87 34 0,94
Recent deposits 0 0 0 0 0 0 0 0 0 0
Landcover class
Cropland 2470 25 35 19 0,97 968 10 28 11 0,89
Crop/vegetation 2315 23 63 35 1,75 1154 11 59 23 1,87
Forest/grassland 127 1 6 3 0,17 381 4 12 5 0,38
Forest 4345 43 62 34 1,72 5708 57 121 48 3,83
Shrubland 801 8 15 8 0,39 705 7 15 6 0,47
Bareland 0 0 0 0 0,00 6 0 0 0 0,00
Grassland 0 0 0 0 0,00 250 2 0 0 0,00
Snow 0 0 0 0 0,00 886 9 18 7 0,57

Master Thesis: Bivariate Statistical Analysis of Landslide Susceptibility in Western Nepal 83
APPENDIX 4 STRATIGRAPHY OF THE WESTERN HIMALAYAN ADOPTED FROM UPRETI
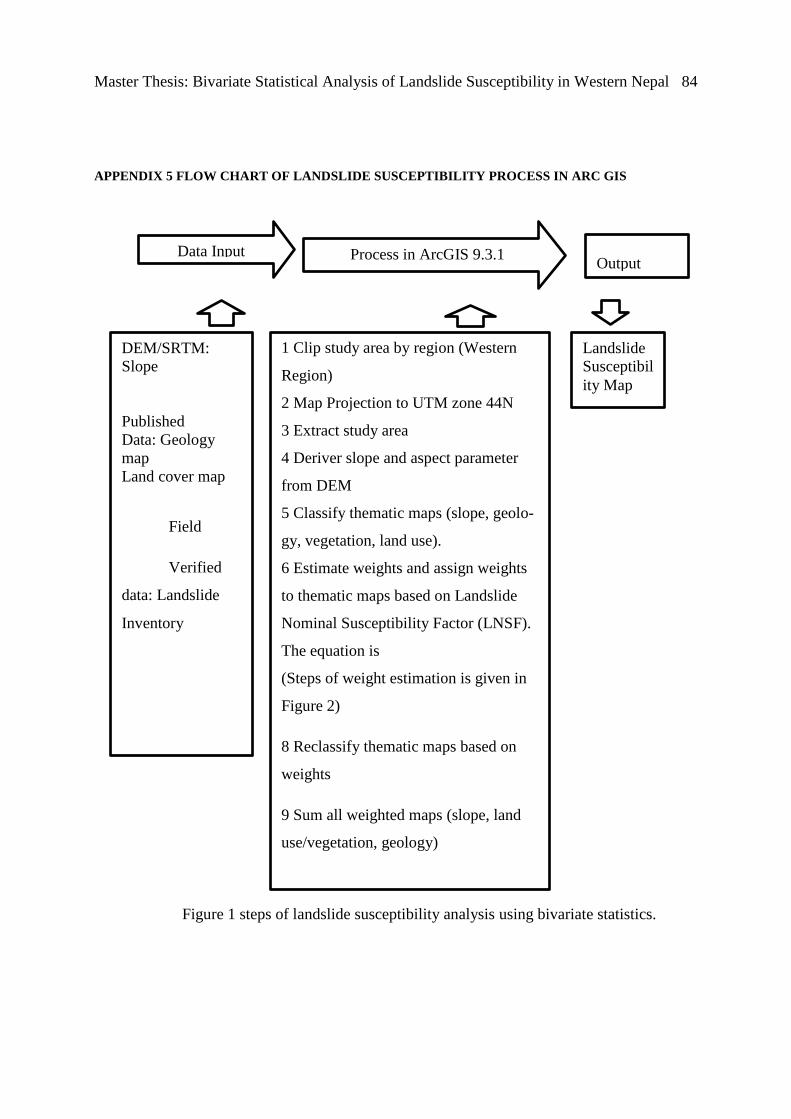
Master Thesis: Bivariate Statistical Analysis of Landslide Susceptibility in Western Nepal 84
APPENDIX 5 FLOW CHART OF LANDSLIDE SUSCEPTIBILITY PROCESS IN ARC GIS
Figure 1 steps of landslide susceptibility analysis using bivariate statistics.
Landslide
Susceptibil
ity Map
G
La
Ve
Ro
Riv
Land
slide
DEM/SRTM:
Slope
Published
Data: Geology
map
Land cover map
Field
Verified
data: Landslide
Inventory
1 Clip study area by region (Western
Region)
2 Map Projection to UTM zone 44N
3 Extract study area
4 Deriver slope and aspect parameter
from DEM
5 Classify thematic maps (slope, geolo-
gy, vegetation, land use).
6 Estimate weights and assign weights
to thematic maps based on Landslide
Nominal Susceptibility Factor (LNSF).
The equation is
(Steps of weight estimation is given in
Figure 2)
8 Reclassify thematic maps based on
weights
9 Sum all weighted maps (slope, land
use/vegetation, geology)
Data Input Process in ArcGIS 9.3.1 Output

Master Thesis: Bivariate Statistical Analysis of Landslide Susceptibility in Western Nepal 85
Step7 and step8 Flow chart of weight calculation
Slope class
(Spatial analyst-reclass-reclassify)
Multiply / overlay (Spatial analyst-Math-Times)
Slope class with slides and non-slide
Extract cells with slides for slope class
(Spatial analyst-extraction-extract by attributes)
Estimate weights based on the distribu-
tion of slides cells in slope class
Reclass extracted slope class with slides cells by count.
Divide (1) by using Raster calculator
Weights with float value is obtained
Assign weight to slope class
(Zonal statistics-zonal dataset (slope) and
value raster (estimated weights for slope class)
Join table to slope layer
Spatial analyst-Reclass-Reclassify-weights
Thematic map (e.g. Landslide Inventory
Assign cell value to
non-slide cells
(Spatial analyst-Math-logical – Is

Master Thesis: Bivariate Statistical Analysis of Landslide Susceptibility in Western Nepal 86
APPENDIX 6 LITHOLOGY CLASSIFICATION GIVEN BY NGI (ADOPTED FROM
NGI REPORT)
Description of lithology and
geologic units
Age Sl
Quartzites
Augen gneisses, banded
gneisses
Granites
Tow mica leucocratic
granites with tourmaline
Upper Pre Cambrian
–
Late Paleozoic - De-
vonian
Miocene
Grey siliceous do-
lomites
Augen gneisses,
1
Grey siliceous dolomites
Augen gneisses, granitic
gneisses, and feldsphatic schists
Crystalline limestones
Grey to greenish grey quartz-
ites, calcareous quartzites
Gneisses and thin bands of
marbles
Quartzitic schists
Dolomite underlain by cri-
noidal limestones
Muscovite biotite quartz
schists
Crystalline marbles
Upper Pre Cambrian
–
Late Paleozoic
Pre Cambrian
Pre Cambrian - De-
vonian
Pre Cambrian
Pre Cambrian
Pre Cambrian
Pre Cambrian - De-
vonian
Pre Cambrian - De-
vonian
Pre Cambrian –
Devonian
2
Quartz mica schist
Schists metamorphosed rocks
Dark slates with white
Pre Cambrian
Pre Cambrian
Pre Cambrian - De-
3

Master Thesis: Bivariate Statistical Analysis of Landslide Susceptibility in Western Nepal 87
quartzites
Calcareous silicate rocks and
marble bands
Dark gray slates
Crystalline marble
Phyllites quartzites and phyl-
litic schists
Sandstones
Limestone, sandstone and
shale
Phyllites grilstones with con-
glomerates and
white massive quartzites.
Biotite and quartzitic mica
schists
Schists quartzites gneisses
and calcareous silicate rocks
Muscovite biotite quartz
schists quartzites
Schists
Crystalline limestones
Sandstones, chloritic phyl-
lites, lamprophyre sills
Sandstones
vonian
Pre Cambrian - De-
vonian
Upper pre cambrian
–
Late Paleozoic
Pre Cambrian - De-
vonian
Pre Cambrian
Mid Miocene - Pleis-
tocene
Cambrian to Permi-
an
Upper Pre Cambrian
–
Late Paleozoic
Pre Cambiran - De-
vonian
Pre Cambrian - De-
vonian
Pre Cambrian - De-
vonian
Pre Cambrian
Pre Cambrian
Permo - Carbonifer-
ous
Pre Cambrian -
Devonian
Carbonates and dolomitic
limestones
Carbonaceous slates and
green shales
Sandstones
Upper pre cambrian
–
Late Paleozoic
Upper pre cambrian
–
4

Master Thesis: Bivariate Statistical Analysis of Landslide Susceptibility in Western Nepal 88
Continental plateform sedi-
ments
Quartzites with ripple marks
interbedded with shales beds
Calcareous rocks
Grey shales with intercala-
tion of limestones and quartzites
Slates with thin limestones
Sandstones
Shales with lenses of fine
grained fossiliferous limestones
Calcareous quartzites and
quartzitic limestones
Coarse boulders, conglomer-
ates
Late Paleozoic
Mid Miocene –
Pleistocene
Triassic to Lower
Cretaceous
Upper pre cambrian
–
Late Paleozoic
Early to Middle
Paleozoic
Upper pre cambrian
–
Late Paleozoic
Pre Cambiran - De-
vonian
Cretaceous - Eocene
Cretaceous - Eocene
Upper pre cambrian
–
Late Paleozoic
Mid Miocene –
Pleistocene
Mainly fluvial and fluvio ter-
rential sediments with local
lacustrine clays and marl-
stones
Alluvium, boulders, gravels,
sands and clays
Alluvium, boulders, gravels,
sands and clays
Plio-Pleistocene
Quaternary
Recent
5