Embed Size (px)
Citation preview

®
®
InternationalColor Consortium
White Paper 40Level: Intermediate
Black-point compensation: theory and application
Black Point Compensation (BPC) is a technique commonly used in color-managed workflows based on ICC profiles. This paper provides a general explanation of the BPC concept and its use in ICC systems. The paper begins, in Sections 1 and 2, with a description of the context in which BPC first appeared — in particular, the provision of multiple Rendering Intents in the ICC profile specification. Section 3 introduces BPC as a solution to certain problems that can arise in that context. In Sections 4 through 8, BPC is examined in greater depth and detail, along with its effects on color reproduction with respect to the different ICC Rendering Intents. Finally, Section 9 makes recommendations for the application of BPC in typical systems.
1. Tone and Color Reproduction in Different ProcessesThe central challenge of color-management systems is the reproduction of colors by a destination process that differs from the source process. It is apparent that different color-reproduction devices – such as monitors, film writers, and printers – may have very different capabilities. In some cases, reproductions made by different devices and processes may even be intended for different viewing environments: different illumination levels, different illuminant chromaticity, different amounts of stray light (flare), and different surround conditions. In most cases, the optimal rendering of a color image conforms to the limitations of, and exploits the capabilities of, a particular reproduction process and its intended viewing conditions.
As a result, the colors that are appropriately rendered for the source may not be satisfactory for the destination and must be modified. For instance, the destination process might have a smaller dynamic range than the source: the lightest white may be darker than in the source, and the darkest black may be lighter than in the source. Thus, the reproduction of tone (luminance) may have to be adjusted, and this adjustment involves a trade-off between the lightness and contrast of the midtones, the contrast in the highlight region, and the contrast in the shadow region. The trade-off is often difficult and may depend on the preferences of the user.

Page 2
2. Rendering Intents in the ICC ParadigmIn the ICC system, the user’s preference is called Rendering Intent (RI). The profile specification includes 4 RIs: Perceptual, Saturation, Relative Colorimetric, and Absolute Colorimetric. In order to understand these choices, it will be helpful to concentrate on the reproduction of tone (luminance), which is only one aspect of color, in order to simplify the discussion. To begin with, consider the tone-reproduction characteristics for a case where the destination process has a smaller dynamic range than the source. A particular example of this kind might involve a source process where the luminance (Y) can range between 0.1 and 0.9 and a destination process where Y can range between 0.3 and 0.7. These values are hypothetical and do not correspond to any real color-reproduction processes; they were chosen in order to illustrate and distinguish the options more clearly.
The Absolute Colorimetric RI is intended to produce a perfect copy of the original. This choice is especially important for proofing applications. For instance, one may wish to use a laser printer to proof an offset press. Initially, one may verify the accuracy of the procedure by viewing the proof next to the press sheet in a controlled viewing environment. If the proof is accurate, it will be a close visual match to the press sheet. Once verified, the proof can be used with confidence as a preview of the printed page. The science of colorimetry, as defined by the CIE, is designed to obtain accurate color matches and can be successfully applied to the implementation of this RI.
However, if the dynamic range of the destination device is smaller than that of the source device, there may be some colors that cannot be matched. In the current example, Figure 1 shows that the midtones are accurately reproduced (0.3 ≤ Y ≤ 0.7), but the highlight and shadow information is lost: Luminances above 0.7 are all reproduced by 0.7, and luminances below 0.3 are all reproduced by 0.3. (The dotted line is included as a reference, indicating a perfect match; the solid line indicates
0 0.1 0.2 0.3 0.4 0.5 0.6 0.7 0.8 0.9 10
0.1
0.2
0.3
0.4
0.5
0.6
0.7
0.8
0.9
1
Ysource
Y des
t
Absolute Colorimetric
Figure 1: Absolute Colorimetric RI with limited dynamic range

Page 3
the actual tone reproduction for this example.)
There is no perfectly satisfactory solution in this case. The destination process is simply not capable of reproducing all the colors of the source, so it cannot serve as a perfect proofing system.
On the other hand, if the user’s intention is to produce a pleasing reproduction of the source image, without regard for whether it is a perfect visual match, there are some useful compromises to consider. In most cases, the best results can be obtained through the choice of the Perceptual RI, which tries to establish a satisfactory compromise over the tonal range. Typically, the value and contrast of the original can be retained in the midtones. There may be some loss of contrast in the highlights and shadows, but without losing all the information. See Figure 2 for an example.
Here, the highlights and shadows are smoothly compressed, and information is retained, although with reduced contrast. Considerable art is involved in shaping a tone curve to achieve the desired compromise.
Saturation RI can have a similar tone reproduction. The main difference between Perceptual and Saturation has to do with the colorfulness of the reproduction. In both cases, aesthetic considerations influence the results, since trade-offs are involved, but Perceptual is typically preferred for photographic images, while Saturation is preferred for graphics. Note that the shape of the tone-reproduction curve is not defined by the ICC and is left to the profile creator.
The fourth RI in the ICC system is Relative Colorimetric. The original purpose of this RI was similar to that of Absolute Colorimetric — to achieve a color match between two hard-copy prints —, but without the loss of highlight detail that can result when Absolute Colorimetric is used for a destination process of limited dynamic range, as is evident in Figure 1 above. Technically, this was accomplished by
Figure 2: Perceptual Rendering Intent with limited dynamic range
0 0.1 0.2 0.3 0.4 0.5 0.6 0.7 0.8 0.9 10
0.1
0.2
0.3
0.4
0.5
0.6
0.7
0.8
0.9
1
Ysource
Ydest
Perceptual

Page 4
mapping the luminance values linearly in such a way that the maximum Y of the source is reproduced by the maximum Y of the destination. In a hard-copy proofing application, this means that blank areas (0% dot) on the source medium are reproduced by blank areas on the destination medium, and areas that have low dot percentages in the source have low dot percentages in the destination. Thus, highlight detail is preserved. Unfortunately, if the paper substrates don’t match tonally, the side-by-side visual match will be inaccurate. For instance, if the destination substrate is darker than the source substrate, the entire proof will be darker than the original.
Furthermore, there may be even more loss of detail in the shadows. Figure 3 illustrates the problem. In comparison with Figure 1, it is clear that the clipping region has been extended from 0.30 to 0.39.
The dotted black line in this figure indicates a perfect copy, as before. The dotted red line indicates the desired tone reproduction based on the Relative Colorimetric mapping of luminance. However, the reproduction is too dark overall, the contrast has been lowered, and much shadow detail has been lost. The only advantage of this RI is that highlight detail has been retained. This is not a very satisfactory trade-off for many users. The main exception occurs when the substrate luminances are a close match and the dynamic range of the destination process is equal to or exceeds that of the source process. In this case, the Relative Colorimetric rendering is quite similar to the Absolute Colorimetric rendering, but has the advantage of eliminating any residual amounts of colorant (“scum dots”) that might appear in blank areas of the output image to simulate the substrate of the source process.
Figure 3: Relative Colorimetric Rendering Intent with limited dynamic range
0 0.1 0.2 0.3 0.4 0.5 0.6 0.7 0.8 0.9 10
0.1
0.2
0.3
0.4
0.5
0.6
0.7
0.8
0.9
1
Ysource
Yde
st
Relative Colorimetric

Page 5
3. Black-Point CompensationAn improvement to the Relative Colorimetric RI is described by Adobe Systems in an ICC White Paper (http://www.color.org/AdobeBPC.pdf). In addition to mapping the maximum luminance of the source to the maximum luminance of the destination, the Adobe method maps the minimum luminance of the source to the minimum luminance of the destination. That is, the white point of the original is rendered by the white point of the reproduction, and the black point of the original is rendered by the black point of the reproduction, with intermediate levels mapped to produce a pleasing, smooth result. They called this technique Black-Point Compensation, or BPC.
Figure 4 shows the BPC modification to the Relative Colorimetric RI.
Like the preceding figures, Figure 4 shows the mapping in Y (luminance) between source and destination, to emphasize the simplicity of the BPC method; the more familiar, but more complicated, mapping of L* (lightness) will be presented later.
The mapping is linear (in luminance) between the black point and the white point. In the example given, there is a general reduction of contrast throughout the tonal range, but no information is lost. The resulting reproduction may not be as aesthetically pleasing as that of the Perceptual or Saturation RI, because of the loss of contrast. And it may not be an accurate visual match in the midtones, like that of the Absolute Colorimetric RI. But it has the advantage of retaining and presenting all the information in the source image in a satisfactory manner, which is important to many users. Thus, BPC has become a popular choice in the user community, and it is an option that has been made available in many imaging applications and CMMs. In a sense, the combination of BPC with the Relative Colorimetric RI has found a use not anticipated in the original ICC specification.
Figure 4: Black-Point Compensation with limited dynamic range
0 0.1 0.2 0.3 0.4 0.5 0.6 0.7 0.8 0.9 10
0.1
0.2
0.3
0.4
0.5
0.6
0.7
0.8
0.9
1
Ysource
Yde
st
Relative Colorimetric with BPC

Page 6
It is a rendering that displays the content of the original image in a simple and straightforward manner; it may be satisfactory in itself or may provide a starting point for the user to edit and enhance the image.
For the sake of comparison, Figure 5 shows the tone-reproduction curves for the various RIs.
This was a hypothetical case, but the same concept can be applied to real reproduction processes, standard color spaces and standard printing conditions. In Figure 6, the source is the U. S. Sheetfed Coated printing condition and the destination is the ISO Uncoated printing condition. The various Rendering Intents are bunched closer together, but are still distinguishable, and the curves for the colorimetric Intents are linear (or piecewise-linear) even in this realistic example.
The color coding is as before. Note that the Perceptual curve is quite different from the one in Figure 5. Since the shape of this curve is unspecified, it is dependent on the choices made by the creators of the profiles and is a matter of aesthetic taste and preference.
So far in this paper, tone reproduction has been plotted in terms of luminance (Y), which is proportional to radiant flux and can be directly measured by a laboratory instrument. Theoretically, in these plots the Absolute Colorimetric and Relative Colorimetric (with and without BPC) curves are straight lines; only the Perceptual is truly curved. For that reason, the presentation in terms of luminance has simplified the discussion. However, the human visual system Figure 6: Various Rendering Intents (realistic example)
0 0.1 0.2 0.3 0.4 0.5 0.6 0.7 0.8 0.9 10
0.1
0.2
0.3
0.4
0.5
0.6
0.7
0.8
0.9
1
Ysource
Yde
st
Black: Absolute ColorimetricRed: Relative ColorimetricGreen: Rel. Col. with BPCBlue: Perceptual/Saturation
U. S. Sheetfed Coated to ISO Uncoated
Figure 5: Various Rendering Intents with limited dynamic range
0 0.1 0.2 0.3 0.4 0.5 0.6 0.7 0.8 0.9 10
0.1
0.2
0.3
0.4
0.5
0.6
0.7
0.8
0.9
1
Ysource
Yde
st
Black: Absolute ColorimetricRed: Relative ColorimetricGreen: Relative Colorimetric with BPCBlue: Perceptual/Saturation
Rendering−Intent Comparison
Page 7
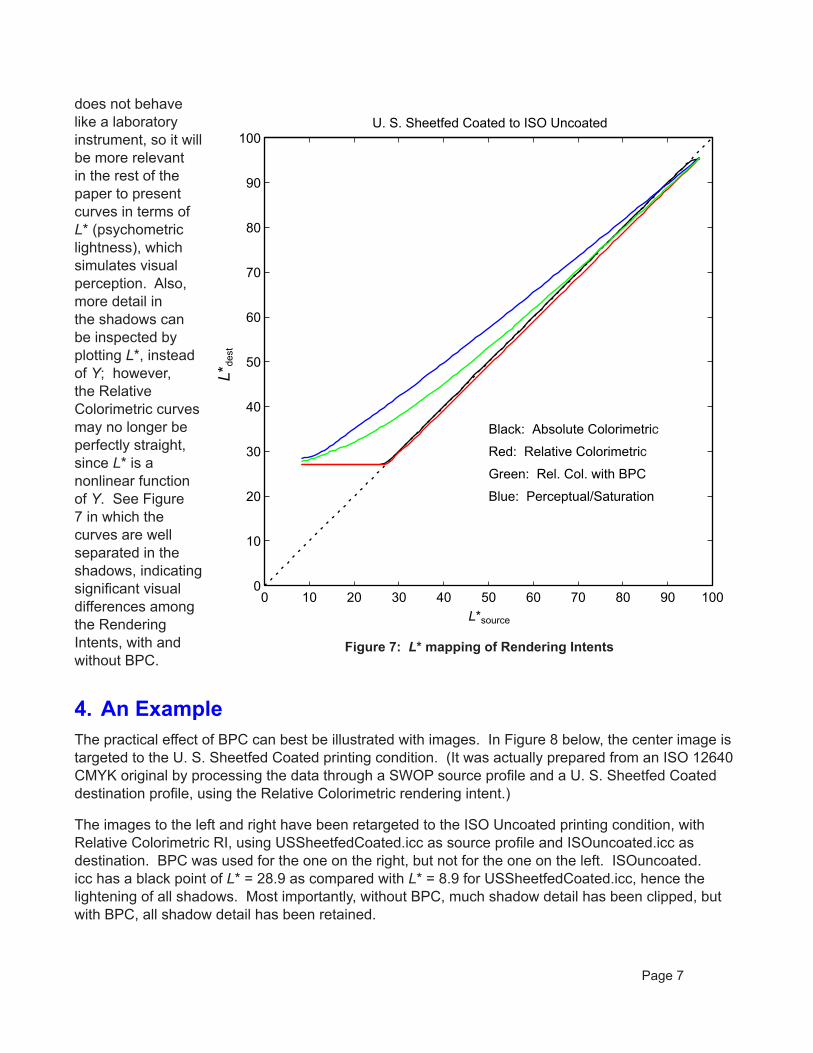
does not behave like a laboratory instrument, so it will be more relevant in the rest of the paper to present curves in terms of L* (psychometric lightness), which simulates visual perception. Also, more detail in the shadows can be inspected by plotting L*, instead of Y; however, the Relative Colorimetric curves may no longer be perfectly straight, since L* is a nonlinear function of Y. See Figure 7 in which the curves are well separated in the shadows, indicating significant visual differences among the Rendering Intents, with and without BPC.
4. An ExampleThe practical effect of BPC can best be illustrated with images. In Figure 8 below, the center image is targeted to the U. S. Sheetfed Coated printing condition. (It was actually prepared from an ISO 12640 CMYK original by processing the data through a SWOP source profile and a U. S. Sheetfed Coated destination profile, using the Relative Colorimetric rendering intent.)
The images to the left and right have been retargeted to the ISO Uncoated printing condition, with Relative Colorimetric RI, using USSheetfedCoated.icc as source profile and ISOuncoated.icc as destination. BPC was used for the one on the right, but not for the one on the left. ISOuncoated.icc has a black point of L* = 28.9 as compared with L* = 8.9 for USSheetfedCoated.icc, hence the lightening of all shadows. Most importantly, without BPC, much shadow detail has been clipped, but with BPC, all shadow detail has been retained.
Figure 7: L* mapping of Rendering Intents
0 10 20 30 40 50 60 70 80 90 1000
10
20
30
40
50
60
70
80
90
100
L*source
L*de
st
Black: Absolute Colorimetric
Red: Relative Colorimetric
Green: Rel. Col. with BPC
Blue: Perceptual/Saturation
U. S. Sheetfed Coated to ISO Uncoated

Page 8
5. The Mathematics of BPCAdobe Systems developed the BPC technique for ICC workflows in which an image is processed through a given source profile and a given destination profile. Accordingly, the algorithm has 3 main steps: (1) Estimate the black point of the source profile; (2) Estimate the black point of the destination profile; (3) Compute the mapping from the source black point to the destination black point. Steps (1) and (2) are performed before the image is processed; Step (3) is performed on the image data as an intermediate process between the source-profile transform and the destination-profile transform. In this section, the discussion will focus on Step (3); Steps (1) and (2) will be deferred to the next section.
The source profile transforms the input data (usually RGB or CMYK) to the Profile Connection Space (PCS), and the destination profile transforms the PCS data to the output space (again, usually RGB or CMYK). Hence, as an intermediate operation, BPC modifies color data within the PCS. In the ICC system the PCS can be either XYZ or L*a*b*. The formulas are expressed in XYZ, so conversions may be needed if either profile uses the L*a*b* PCS. These conversions proceed according to the standard CIE formulas, which are well known, so the XYZ-space can be used for the BPC formulas without loss of generality.
Accordingly, (Xs, Ys, Zs) will be used here to designate a color produced by the source profile and (Xd, Yd, Zd) to designate the modified color submitted to the destination profile. (These colors are given in “media-relative colorimetry” — that is, relative to the Media White Point of the source and destination.) The black-point luminances of the source and destination will be designated by Ysbp and Ydbp, respectively.
The black-point values are used to calculate a scale factor r:
Figure 8: Demonstration of BPC
Converted to ISO Uncoated, using RC without BPC, which corre-sponds with the red line in Figure 7.
Patch L*: 27, 51, 96
Converted to ISO Uncoated, using RC with BPC, which corresponds with the green line in Figure 7.
Patch L*: 28, 55, 96
U. S. Sheetfed CoatedPatch L*: 8, 52, 97
Page 9
r = (1 – Ydbp) / (1 – Ysbp)
The modification of the PCS colors can then be expressed by the equations:
Xd = rXs + (1 – r)XD50
Yd = rYs + (1 – r)YD50
Zd = rZs + (1 – r)ZD50
in terms of the scale factor r and the PCS white point of D50 (XD50, YD50, ZD50).
By introducing the vector notation T = (X, Y, Z), these equations can be written more simply as:
Td = rTs + (1 – r)TD50
This form of the equation makes it clear that the algorithm consists of blending the source color with a small amount of white (D50). If r < 1, this has the effect of lightening the colors slightly — just enough to map the black point of the source to the black point of the destination. But it also has the effect of desaturating the chromatic colors slightly. The result has a natural appearance. It is similar to the effect of fog in an outdoor scene, which adds a diffuse white component to all colors. However, if the black point of the destination is darker than the black point of the source, r will be greater than 1, and the effect will be to subtract a small amount of white, thus darkening and saturating the colors, as if a fog had cleared. Indeed, the BPC formula resembles a simple mathematical model of optical flare (stray light, veiling glare, etc.).
6. Black-Point EstimationAs outlined above, the BPC transform depends on the scale factor r, which is defined in terms of two numbers — Ysbc, the luminance of the source black point, and Ydbc, the luminance of the destination black point. (See the formula defining r in Section 5 above.) Since, in most cases, the computation has no access to the original colorimetric data on the source and destination processes, it must estimate these numbers from the given profiles. Indeed, most of the complexity in Adobe’s published algorithm has to do with Steps (1) and (2) — the estimation of a black point from a profile.
The estimation procedure can be effectively simplified as follows: The black point is first specified in device space and then processed through the Relative Colorimetric input transform to determine its color in the PCS. The luminance (Y) of this color can then be used as the black-point luminance in the calculation of r (see above in Section 5).
How does Adobe specify the black point in device space? The simplest case is an RGB device; the black point is just R = G = B = 0. For CMYK devices the analogous approach would be to set C = M = Y = K = 1. This is usually not realistic, since most printing processes cannot operate at 400% dot. So the Adobe procedure is to determine the black point CMYK by processing the PCS black point (L* = a* = b* = 0, or X = Y = Z = 0) through the Perceptual output transform (the BToA0Tag), so that gamut compression will map this point to the darkest neutral CMYK that the transform employs. (If there is no BToA0Tag, then C = M = Y = K = 1 is used instead.)
This procedure can be used for the source profile — Step (1) — and the destination profile — Step (2).

Page 10
7. Other Rendering IntentsAs originally conceived, BPC is an improved version of the Relative Colorimetric RI. It is possible, however, to generalize the concept so that it applies to Perceptual and Saturation RIs as well. This can be done through a small change in the procedure for estimating the black point.
As outlined above, the procedure consists of processing the device coordinates of the black point through the Relative Colorimetric input transform to compute the corresponding PCS coordinates. In the generalized procedure, the Perceptual or Saturation input transform can be used instead, according to preference.
For profiles using the Matrix/TRC tags as transforms, the choice of RI will make no difference, as there is only one such set of tags, which are used for all RIs. For LUT-based profiles, on the other hand, there can be a distinct difference. The AToB1Tag is used for Relative Colorimetric, the AToB0Tag for Perceptual, and AToB2Tag for Saturation. The AToB1Tag, since it is supposed to be colorimetric, can be expected to produce the PCS coordinates defining the colorimetry associated with the given device coordinates. (This is an approximation, of course, subject to interpolation error and round-off error. It is also “media-relative” colorimetry — that is, relative to the substrate.) However, the AToB0Tag is supposed to be the inverse of the BToA0Tag, the Perceptual output transform. Any gamut mapping inherent in the BToA0Tag is supposed to be reversed in the AToB0Tag — at least for in-gamut colors. Thus, the AToB0Tag should produce the PCS coordinates which are mapped to the given device coordinates by the BToA0Tag — rather than their actual colorimetry.
In a normal CMYK profile, the device coordinates will be determined (as described above) by passing the PCS black point through the BToA0Tag. To determine the Perceptual black point, Figure 9: Normal sRGB → CMYK
0 10 20 30 40 50 60 70 80 90 1000
10
20
30
40
50
60
70
80
90
100
L*source
L*dest
sRGB_IEC61966−2−1_black_scaled.icc to ISOuncoated.icc
Black: Absolute Colorimetric
Red: Relative Colorimetric
Green: Rel. Col. with BPC
Blue: Perceptual/Saturation

Page 11
these device coordinates will then be passed through the AToB0Tag. Theoretically, this operation will be a perfect “round trip”, producing the PCS black point as a result. Accordingly, BPC will have no effect in the Perceptual case. (A similar argument applies to the Saturation RI.)
In practice, the results may not be exactly according to theory. Typically, though, BPC has little or no effect on the Perceptual and Saturation RIs. (BPC is generally disallowed for the Absolute Colorimetric RI, since it is contrary to the spirit in which that RI is defined.)
Thus, BPC has no adverse effect on the Perceptual and Saturation transforms of properly formed profiles. There are atypical profiles (Adobe calls them “malformed”), however, in which BPC may actually be beneficial for Perceptual or Saturation processing. An example of this is provided by one of the sRGB profiles, sRGB_IEC61966-2-1_no_black_scaling.icc which is available on the ICC website, http://www.color.org/srgbprofiles.html.
This is a partial-range profile, in the sense that the dynamic range extends only over the range 10.9 < L* < 100, instead of the full range 0 < L* < 100. The partial range is based on an assumed amount of flare in the sRGB viewing environment. This profile was mostly intended for use as a destination profile for soft proofing, but it may sometimes be used as a source profile, in which case the shadows will be unnecessarily lightened if the Perceptual or Saturation RI is employed.
Figures 9 and 10 show the tone-reproduction curves for processing sRGB data into CMYK. The destination profile is ISOuncoated.icc. In Figure 9, the source profile is a normal, full-range sRGB profile, in which the device black point (R = G = B = 0) is mapped to the PCS black point (L*source = 0). The curves behave as expected, given that the output process has a black point L*dest = 27.3.
However, in Figure 10, the partial-range “no black scaling” sRGB Figure 10: Malformed sRGB → CMYK
0 10 20 30 40 50 60 70 80 90 1000
10
20
30
40
50
60
70
80
90
100
L*source
L*dest
sRGB_IEC61966−2−1_no_black_scaling.icc to ISOuncoated.icc
Black: Absolute Colorimetric
Red: Relative Colorimetric
Green: Rel. Col. with BPC
Blue: Perceptual/Saturation
Blue dotted: Perceptual with BPC
Page 12
profile has been used, in which the device black point is mapped to L* = 10.9.
As expected, all the curves are compressed to the right, so that the black point occurs at L*source = 10.9, far above the PCS black point. Unfortunately, the Perceptual curve (in blue) is not compressed, but is cut off at that point, such that L*dest = 31.7, and it does not cover the entire dynamic range of the output process. That is because the destination profile has been constructed so that the PCS black point (L* = 0) is mapped to the CMYK black point and lighter points in the PCS are mapped to lighter CMYK points. This error in the Perceptual tone reproduction is a direct consequence of the malformation of the source profile.
The dashed blue curve shows the effect of BPC on the Perceptual RI. At the RGB black point, BPC maps the incorrect L*source = 10.9 to the PCS black point, which addresses the output profile at L* = 0, yielding the true CMYK black point, having L*dest = 27.3.
8. An ExampleFigure 11, on the next page, provides an example of the use of the “no black scaling” profile as a source profile in an imaging workflow. All color conversions were carried out by the Convert to Profile (CTP) command in Adobe Photoshop. The starting RGB image, shown on the top left, was created by assigning a SWOP profile to the cropped ISO 12640 N1.TIF image and converting to RGB using the sRGB IEC61966-2.1.icm profile with Relative Colorimetric plus BPC. It is a full-range image in the sense that equal RGB code values ranging from 0 to 255 correspond to L* values ranging from 0 to 100. In the image, the original sRGB profile was replaced with the sRGB_IEC61966-2-1_no_black_scaling.icc profile, which re-defined the meaning of the image RGBs, resulting in the image on the top center. The RGB values of 0, 0, 0 now map to the L* value of 10.9 (which was rounded by Photoshop to 11.)
Three images on the bottom row demonstrate the effects of various conversions to ISO Uncoated CMYK.
• The bottom left image has been converted from sRGB (sRGB IEC61966-2.1) to ISO Un-coated using the Perceptual rendering intent. Whether BPC is on or off makes no differ-ence in this conversion. Note that the identical result would be obtained if the top left image were assigned the “black scaled” profile.
• The bottom center image has been generated by converting to ISO Uncoated from the “no black scaling” profile using Perceptual without BPC. Notice the excessive lightening in the shadows.
• The bottom right image has been generated by converting to ISO Uncoated from the “no black scaling” profile using Perceptual with BPC. This image is almost identical with the bottom left image.
Therefore, the excessively light shadows caused by the malformed profile, sRGB_IEC61966-2-1_no_black_scaling.icc, can be corrected by the use of BPC.

Page 13
Figure 11: The ICC sRGB_IEC61966-2-1_no_black_scaling.icc Profile.
Adobe Photoshop, Convert to Profile (CTP) was used for all conversions from sRGB to ISO Uncoated CMYK.
This image has the profile sRGB_IEC61966-2-1_no_black_scaling.icc as source.
Patch L*: 11, 54, 100
This full range sRGB image (with sRGB IEC61966-2.1.icm profile) has code values ranging from 0 to 255.Three neutral patches had been inserted into the image: RGB cv are 0, 127 255. The correspond-ing L*: 0, 53, 100
CTP to ISO Uncoated, Perceptual, without BPC, which corresponds with the blue line in Figure 9.
Patch L*: 27, 59, 96
CTP to ISO Uncoated, Perceptual, with BPC, which corresponds with the blue dotted line in Figure 10.
Patch L*: 28, 59, 96
CTP to ISO Uncoated, Perceptual, without BPC, which corresponds with the blue line in Figure 10.
Patch L*: 32, 60, 96
9. RecommendationsIn the light of these considerations, the following recommendations appear reasonable for the use of BPC in ICC systems. These systems are of several different types and are intended for different users. For instance, ICC color management can be embedded in the hardware of a printing system serving a community of naive users, or it can be provided in an interactive environment for the use of highly

Page 14
expert practitioners. Only the designers of these systems can make the actual choices, but here are some things for them to bear in mind:
• BPC makes an important contribution to the ICC workflow and can be implemented with minimal change to existing color architectures. It adds value that many users have come to depend on, particularly for Relative Colorimetric RI, which has little value without BPC. This is particularly important for proofing.
• It should be available for Perceptual and Saturation RIs as well, since it can correct problems presented by certain atypical profiles and is otherwise harmless.
• In non-interactive environments, where the user has no direct control over this option, BPC should be activated by default. Even in interactive environments, it may be appropriate to activate BPC by default, depending on the sophistication of the intended user community.