Embed Size (px)
Citation preview
Louisiana State University Louisiana State University
LSU Digital Commons LSU Digital Commons
LSU Doctoral Dissertations Graduate School
7-16-2021
#BlackGirlMathMagic: A Mixed Methods Study Examining African #BlackGirlMathMagic: A Mixed Methods Study Examining African
American Girls in Standardized MathematicsTesting American Girls in Standardized MathematicsTesting
RaKeema Thomas Toussaint Louisiana State University and Agricultural and Mechanical College
Follow this and additional works at: https://digitalcommons.lsu.edu/gradschool_dissertations
Recommended Citation Recommended Citation Toussaint, RaKeema Thomas, "#BlackGirlMathMagic: A Mixed Methods Study Examining African American Girls in Standardized MathematicsTesting" (2021). LSU Doctoral Dissertations. 5610. https://digitalcommons.lsu.edu/gradschool_dissertations/5610
This Dissertation is brought to you for free and open access by the Graduate School at LSU Digital Commons. It has been accepted for inclusion in LSU Doctoral Dissertations by an authorized graduate school editor of LSU Digital Commons. For more information, please [email protected].
#BLACKGIRLMATHMAGIC: A MIXED METHODS STUDY EXAMINING AFRICAN AMERICAN GIRLS IN STANDARDIZED
MATHEMATICS TESTING
A Dissertation
Submitted to the Graduate Faculty of the Louisiana State University and
Agricultural and Mechanical College in partial fulfillment of the
requirements for the degree of Doctor of Philosophy
in
The College of Human Sciences and Education
by RaKeema Thomas Toussaint
B. S., Louisiana State University, 2011 M. Ed., Louisiana State University, 2015 Ed. S., Louisiana State University, 2018 M. A., Louisiana State University, 2020
August 2021
ii
© 2021
RaKeema Thomas Toussaint
iii
In Memory of Ruby Lee Morales March 11, 1929 – June 6, 2012
For you are always with me, pushing me to do my best, I would not be where I am today without
your love and guidance. Thank you for everything, Grandma!
Dedicated to Marcus and Miles Toussaint
iv
ACKNOWLEDGEMENTS
First, I would like to praise God for seeing me through this journey! Thank you, Lord,
for blessing me with the words to fill these pages. Thank you for putting the right people in my
life at the right time! I know that I am beyond blessed and grateful for all that you do!
To my husband, Marcus, thank you for standing beside me throughout this life
experience. You have listened to me endlessly, given feedback when I was lost, and kept me
grounded to the end. Thank you for everything you do, bae!
To my son, Miles, I pray you see that through my life’s experiences and accomplishments
that you can do anything your heart desires! You are my greatest achievement, and mommy
loves you so much! On days when I did not feel like pushing through, you were my motivation.
This is all for you, baby boy!
I would like to thank my family for consistently holding me up and helping me stay
focused on the mission. To my mom and aunt, Angela Morales and Rosemary Morales, thank
you both for being my biggest cheerleaders! As for my sisters, RaQuita Weathers and Zori
Morales, I appreciate both of you for pushing me to always do my best and never give up on my
goals.
Thank you to my committee members, Dr. Keena Arbuthnot, Dr. Eugene Kennedy, Dr.
Kim Skinner, and Dr. Cassandra Chaney. I am grateful for your continued support and guidance
throughout this process in my life. I appreciate all your suggestions, feedback, brainstorming
sessions, and more. You all have truly helped to make #BlackGirlMathMagic possible!
Last, but certainly not least, thank you to my tribe for holding me up and seeing me
through what I started! A special thanks to my KST family: Hazel Regis-Buckels, Myranda

v
Moncrief, and Hasan Suzuk. Finally, thank you to my LSU brothers and sisters that helped me
every step of the way: Dr. Micah Glenn, Dr. Craig Marcus, Dr. Marvin Dupiton, Roman
Mitchell, Dr. Christianne Ricard, and all of Project PHinisheD!
vi
TABLE OF CONTENTS
ACKNOWLEDGEMENTS ........................................................................................................... iv
LIST OF TABLES ....................................................................................................................... viii
LIST OF FIGURES ....................................................................................................................... ix
ABSTRACT .................................................................................................................................... x
CHAPTER 1. INTRODUCTION ................................................................................................... 1 Background ................................................................................................................................. 1 Purpose and Research Questions .............................................................................................. 13 Study Contribution & Significance ........................................................................................... 14 Definition of Terms................................................................................................................... 15 Summary and Organization of the Document .......................................................................... 16
CHAPTER 2. LITERATURE REVIEW ...................................................................................... 17 Theoretical Frameworks ........................................................................................................... 17 Black Girls and Women in Mathematics .................................................................................. 23 Mathematics Assessments ........................................................................................................ 34 Testwiseness in Mathematics .................................................................................................... 49 Literature Review Conclusion .................................................................................................. 62
CHAPTER 3. RESEARCH DESIGN & METHODOLOGY....................................................... 64 Positioning of the Researcher ................................................................................................... 65 Research Design........................................................................................................................ 66 Participants ................................................................................................................................ 67 Procedures for Data Collection ................................................................................................. 71 Instruments ................................................................................................................................ 72 Data Analysis Procedures ......................................................................................................... 73 Legitimation .............................................................................................................................. 77 Limitations ................................................................................................................................ 79
CHAPTER 4. RESULTS AND FINDINGS ................................................................................. 81 Quantitative Results .................................................................................................................. 81 Qualitative Findings .................................................................................................................. 87 Mixed Methods Results .......................................................................................................... 112
CHAPTER 5. CONCLUSIONS AND DISCUSSION ............................................................... 118 Introduction ............................................................................................................................. 118 Conclusions ............................................................................................................................. 120 Implications............................................................................................................................. 134 Recommendations for Future Research .................................................................................. 138 Limitations of the Study.......................................................................................................... 139 Conclusion .............................................................................................................................. 140
APPENDIX A. IRB Approval Form .......................................................................................... 143
vii
APPENDIX B. Description of Study .......................................................................................... 145
APPENDIX C. Mathematics Assessment................................................................................... 148
APPENDIX D. Retrospective Think Aloud Protocol ................................................................. 151
APPENDIX E. Teacher Interview Protocol................................................................................ 153
APPENDIX F. School Administrator Form ............................................................................... 154
APPENDIX G. Parental Permission Form ................................................................................. 157
APPENDIX H. Child Assent Form ............................................................................................ 160
APPENDIX I. Teacher Consent Form ........................................................................................ 161
APPENDIX J. Mixed Methods Research Design Diagram ........................................................ 162
REFERENCES ........................................................................................................................... 163
VITA ........................................................................................................................................... 172
viii
LIST OF TABLES
3.1. Frequency Table for All Student Demographics ................................................................... 69
4.1. Summary Statistics................................................................................................................. 82
4.2. Shapiro-Wilk Test Results ..................................................................................................... 84
4.3. Friedman Nonparametric Test ............................................................................................... 85
4.4. Pairwise Comparisons for the rank-sums of MC, MS, and CR ............................................. 86
4.5. Multiple-Select Multiple-Choice Answers From Think-Aloud Interviews ........................... 88
4.6. MSMC Item Scores varied by Scoring Methods ................................................................... 89
4.7. Interview Participants’ Pronunciation of p3 ............................................................................ 92
4.8. Interview Participants’ Pronunciation of 2(d - 6) .................................................................. 93
4.9. Interview Participants’ Rationale for Not Selecting Answer Choices ................................... 95
4.10. Interview Participant's Statements Showing Difficulty ....................................................... 98
4.11. Important Test-Taking Skills to Teach Students ............................................................... 116
ix
LIST OF FIGURES
4.1. Boxplot for MC, MS, and CR Item Types ............................................................................. 85
4.2. MS1 ........................................................................................................................................ 91
4.3. MS2 ........................................................................................................................................ 92
4.4. MS3 ........................................................................................................................................ 93
4.5. MS4 ........................................................................................................................................ 95
4.6. MS5 ........................................................................................................................................ 96
4.7. Student Interview Themes ..................................................................................................... 99
4.8. Merged Interpretation of Results and Findings ................................................................... 113
x
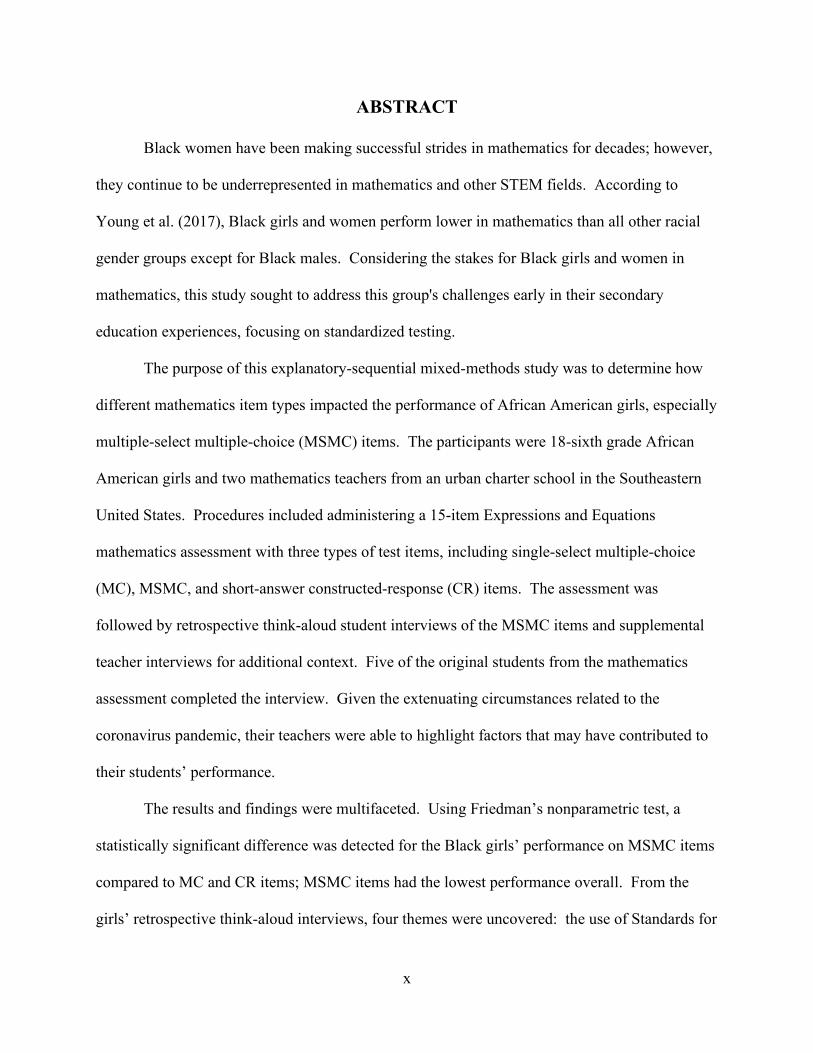
ABSTRACT
Black women have been making successful strides in mathematics for decades; however,
they continue to be underrepresented in mathematics and other STEM fields. According to
Young et al. (2017), Black girls and women perform lower in mathematics than all other racial
gender groups except for Black males. Considering the stakes for Black girls and women in
mathematics, this study sought to address this group's challenges early in their secondary
education experiences, focusing on standardized testing.
The purpose of this explanatory-sequential mixed-methods study was to determine how
different mathematics item types impacted the performance of African American girls, especially
multiple-select multiple-choice (MSMC) items. The participants were 18-sixth grade African
American girls and two mathematics teachers from an urban charter school in the Southeastern
United States. Procedures included administering a 15-item Expressions and Equations
mathematics assessment with three types of test items, including single-select multiple-choice
(MC), MSMC, and short-answer constructed-response (CR) items. The assessment was
followed by retrospective think-aloud student interviews of the MSMC items and supplemental
teacher interviews for additional context. Five of the original students from the mathematics
assessment completed the interview. Given the extenuating circumstances related to the
coronavirus pandemic, their teachers were able to highlight factors that may have contributed to
their students’ performance.
The results and findings were multifaceted. Using Friedman’s nonparametric test, a
statistically significant difference was detected for the Black girls’ performance on MSMC items
compared to MC and CR items; MSMC items had the lowest performance overall. From the
girls’ retrospective think-aloud interviews, four themes were uncovered: the use of Standards for
xi
Mathematical Practices (SMPs), inaccurate mathematics language, mathematical
misunderstandings, and lack of testwiseness strategies. Next, regarding the pandemic school
year, teachers revealed an overall lack of student participation, high student absences, technical
difficulties with online learning, and the limited capacity to meet student needs either in-person
or virtually. The cumulative findings supported the quantitative assessment results. Overall, the
findings suggest that Black girls are currently disadvantaged, even more so during the pandemic,
due to lack of instructional support, minimal to late testwiseness training, and misaligned
assessment experiences.
1
CHAPTER 1. INTRODUCTION
Background
Every time we have a chance to get ahead, they move the finish line. -- Mary Jackson Hidden Figures
Mathematics is a gatekeeper to countless opportunities throughout society. As a
fundamental subject, the understanding and application of mathematics is an everyday task,
regardless of one’s age, role, or status. The core of mathematics is problem-solving and critical
thinking, which are necessary components that are not often acknowledged or echoed (Kitchen,
2016). For people that do excel in the subject, opportunities for advancement in academia and
society are possible.
When thinking of a mathematician, the first image that may come to one’s mind may be
that of a White male. Well, women can do mathematics, too, even Black women. Today,
mathematics is and continues to be a driving factor in the success of scholars and practitioners in
the science, technology, engineering, and mathematics (STEM) field; however, some racial and
gender groups are more displaced in the field compared to others (Gholson, 2016; Ireland et al.,
2018; Joseph, 2017; Joseph et al., 2017; McGee, 2013; McGee & Bentley, 2017).
For decades now, Black women have been making strides in mathematics; however, they
continue to be underrepresented in mathematics and other STEM areas. As mentioned by
Ireland et al. (2018), “As of 2014, the proportion of Black women earning degrees in biological
sciences (4.23%), computer sciences (2.61%), physical sciences (2.83%), mathematics and
statistics (2.35%), and engineering (0.99%) remain disproportionately low” (pp. 227-228).
According to Joseph et al. (2017), “until very recently, the national discourse about Black girls’
and women’s academic mathematics performance has come from a deficit-based perspective,
2
exacerbating poor performance and underrepresentation (Solorzano & Yosso, 2001), and
creating and sustaining a negative master narrative (Giroux, 1991)” (p. 204).
The opening quote by Janelle Monáe, an African American actress featured in the movie
Hidden Figures, describes the sentiment of several Black girls and women. She mentions,
“Every time we have a chance to get ahead, they move the finish line.” Today, that finish line
comes with a test score — a standardized test score used to quantify and categorize people based
on ability. Black girls and women perform lower in mathematics than all other racial gender
groups except for Black males (Young et al., 2017). There exists a vast amount of research of
Black males in mathematics compared to Black girls and women; henceforth, there is a need to
create and sustain a space in literature for this group (Gholson, 2016).
With a few exceptions, standardized testing has become a required component for
admissions into colleges or universities and other organizations that may host STEM
opportunities; henceforth, an investigation into the testing of mathematics is warranted.
Standardized mathematics tests come with unique characteristics, including the testing
environment, how the tests are formatted, and the type of items on the assessments. Given the
rise of innovative test items, such as multiple-select multiple-choice (MSMC) and technology-
enhanced items, which are considered more difficult and more cost-efficient for test companies
due to their convenient grading than single-answer multiple-choice (MC) items (Hohensinn &
Kubinger, 2011), an investigation into the performance and specific testwiseness strategies used
to answer such problems could shed light on how to improve performance on such items.
This study initially sought to illuminate Black girls and women in mathematics from an
anti-deficit lens (Gholson & Martin, 2014); the researcher focused on their mental processes and
test-taking strategies on multiple-select multiple-choice (MSMC) mathematics test items. A
3
guide to the rationale and need for this study includes the landscape for students’ performance in
mathematics at both secondary and postsecondary levels of school. Next up is an investigation
into the history of standardized testing, explicitly delving into the status of mathematics
education and achievement for African American students on those standardized tests. This
section then examines the rise of Black girls and women making strides towards excellence,
otherwise referred to as the #BlackGirlMagic movement (Barker, 2018), leading into
#BlackGirlMathMagic. Finally, this section presents an overview of the pandemic that directly
impacted the education system during the time of this study, COVID-19.
The History of Standardized Testing
For centuries, standardized testing has been used to determine applicability for a variety
of opportunities. For instance, in the 200s, China used standardization to qualify individuals for
civil service through the examination of “their proficiency in music, archery, horsemanship,
calligraphy, arithmetic, and ceremonial knowledge” (Himelfarb, 2019, p. 151). Fast forward to
the early twentieth century, Alfred Binet, an experimental psychologist, was selected to study
developmental capabilities in school-aged children (2019). Along with a colleague, Binet
designed an instrument to test reasoning, judgment, and understanding ability among the students
to identify the students that would benefit from special education services (2019). During 1914-
1918, which was the First World War, standardized testing became primary for selecting
professional personnel for the armed forces; the impact of these assessments led to the use of
civilian testing advocacy (2019). The United States started using large-scale assessments during
the twentieth century for school accountability and college admissions (2019). As mentioned by
Himelfarb (2019), “the reliance on standardized tests for college admission was a response to the
increasing number of students applying to colleges, and it became a tool to tighten the gates in
4
the face of limited resources” (p. 152). Although its intended use has changed, standardized
testing is still very prevalent.
Standardized testing has taken many forms over the past centuries and is currently
heavily used in education. According to Gardner (2006), “formal testing is a contemporary
means of comparing the performance of hundreds of thousands of students who are being
educated in schools” (p. 168). In today’s world, standardized assessments have become second
nature as a part of schooling norms and requirements for admission, inclusion, and engagement
throughout multiple facets within education and more. Research has shown that even though
standardized tests have become commonplace, performance trends have remained the same for
racial-ethnic groups over the years.
The State of Mathematics – Standardized Assessments
In mathematics education, national data has shown that African American students have
struggled to compete at similar levels as White and Asian American students (U.S. Department
of Education, 2014, 2017a, 2017b, 2018a). According to the National Center for Education
Statistics (NCES; 2018a), the achievement gap between White and Black students in the fourth
grade shrunk from 32 to 24 points between the years of 1990 and 2015. For eighth graders, the
32-point gap in White-Black achievement had little to no change during the same time frame
(2018a). Although there has been a decrease in the gender gap among males and females, there
continues to be a racial gap between White and Black students (U.S. Department of Education,
2017a, 2018a; Young et al., 2018).
For most students, standardized mathematics tests become more critical later in their
educational careers. The College Board (2019) administers several SAT standardized
assessments nationally; students can start taking SAT-like assessments as early as eighth grade.
5
PSAT 8/9 was administered to 1,773,153 total eighth- and ninth-grade students with a mean
mathematics score of 421. Of those students, 203,394 (11%) were African American students in
2019. For all African American students on the PSAT 8/9, the mean math score was 380.
Eighth-grade African American students had a mean math score of 369, with only 20% of
students meeting grade-level benchmarks. For eighth-grade Asian and White students, their
mean math scores were 477 and 435, respectively, with 69% and 53% meeting benchmark goals.
As for African American ninth graders, the mean math score was 389, of which 24% met grade-
level benchmark goals. Asian ninth graders had a mean math score of 510, 74% meeting
benchmarks; White ninth graders had a mean math score of 466, and 60% met benchmark goals.
The subsequent versions of the SAT were only for 10th and 11th-grade students, PSAT/NMSQT
and PSAT 10. The mean math score for all students was 478. Of those students, 444,343 (10%)
were African American, with a mean score of 424. The 10th and 11th grade African American
students scored 415 and 438, respectively, with only 21% and 20% of African American students
meeting benchmark goals. Asian and White students averaged 74% and 57% of students
achieving benchmark goals in 10th and 11th grade, respectively.
College admissions are contingent upon performance on primarily one of two nationally
recognized standardized assessments, the SAT (College Board, 2019) or ACT (2019). The 2019
administration of the SAT included 2,220,087 students, of which 271,178 (12%) were African
American. The mean math score for all students was 528, with 48% of students meeting
benchmark goals; the mean math score for African American students was 457, with only 22%
meeting benchmark goals. Asian and White students averaged math scores of 637 and 553,
respectively; 80% of Asian students and 59% of White students met their math benchmark goals.
6
For the ACT administration of 2018, approximately 1,914,817 students took the
assessment; 243,080 (13%) African American students were reported in the administration. The
ACT score for all students averaged about 21 out of 36 points from 2014 to 2018; African
American students averaged a score of 17 out of 36 for each administration of the ACT exam
over the same time frame. The mathematics section of the 2018 ACT exam showed a 16.9-point
average score for African American students; the average for all students, White, and Asian
students were 20.5, 21.7, and 25.1, respectively. The data presented was not disaggregated into
intersectional racial and gender groups for either the SAT or ACT assessments.
The State of Mathematics – Course Taking Trends
In the early years, students are predisposed to factors and conditions that determine their
educational trajectory in mathematics. More precisely, “The middle grades are a critical
transition period in students’ mathematics trajectories, as students move from arithmetic to the
more complex and abstract concepts of algebra” (Mowrey & Farran, 2016, p. 61). It has been
found that African American students are less likely to be placed in higher-level classes, such as
algebra, by the eighth grade compared to other racial groups (Faulkner et al., 2014; U.S.
Department of Education, 2018a). The lack of enrollment in higher-level courses has
tremendous effects on students’ performance in later grade levels.
In high school, “a higher percentage of Asian students (45 percent) than of students of
any other racial/ethnic group earned their highest math course credit in calculus” (U.S.
Department of Education, 2018a). As for other racial groups, the percentages of students earning
calculus credit in high school were six percent for Black students, ten percent for Hispanic
students, and 18 percent for White students (2018a). From this information, African American
students received the least credit for an advanced math course in high school compared to other
7
racial/ethnic groups. Some researchers have found that African American students tend to
decline in mathematics course participation in middle and high school grades (Allen & Schnell,
2016; Faulkner et al., 2014; Mowrey & Farran, 2016; West-Olatunji et al., 2007).
At the postsecondary level, NCES has found significant discrepancies between the
different types of baccalaureate degrees among males and females (U.S. Department of
Education, 2018a, 2018b). At the undergraduate level, “a greater percentage of undergraduates
were female than male across all racial/ethnic groups” (2018a) in 2014. The racial group with
the most substantial gap was African American males and females, 38 and 62 percent,
respectively (2018a); the slightest difference was between Asian students. NCES also
discovered that women earned more baccalaureate degrees for the 2013-2014 school year than
men overall, yet they had lower percentages of degrees in STEM fields than men (2018a); this
trend held constant for all racial/ethnic groups. Among gender groups, African American
women held more degrees in general than White women at all postsecondary degree levels
ranging from associate to doctoral degrees as of 2008 (2018b).
Black Girls and Women in Mathematics Education
Not all STEM opportunities are created equal. As mentioned by McGee and Bentley
(2017), “Martin (2009) …developed a racial hierarchy of mathematics that places Whites and
Asians on top and Blacks, Latinos, and Native Americans squarely on the bottom” (p. 267).
Henceforth, some of these STEM opportunities are limited beyond mathematical ability. African
American or Black girls face additional barriers compared to other gender-racial groups because
they are both Black and female. Young et al. (2018) mention, “because Black girls exist as both
Black and female, they can be exposed to marginalization based on their gender and racial
identity in the mathematics classroom” (p. 162).
8
While African American girls have served as comparison measures for other racial and
gender groups (Chavous & Cogburn, 2007; Gholson, 2016; Ricks, 2014, Young et al., 2018),
limited research studies have exclusively focused on African American girls in mathematics
(Booker & Lim, 2018; Crenshaw et al., 2015; Gholson, 2016; Gholson & Martin, 2014; Ireland
et al., 2018; Joseph, 2017; Joseph et al., 2017; West-Olatunji et al., 2007; Young et al., 2017).
For instance, Gholson (2016) states, “Black girls and women lurk in the proverbial shadows of
inquiry in mathematics education and become visible only briefly to illuminate the status of
Black boys and men or White girls and women” (p. 298).
Despite the negative stereotypes and obstacles, some Black girls and women excel in the
mathematics domain. Nevertheless, the problem persists that they are limited in access to more
extensive, exclusive, and respected professional and social networks; thus, their social mobility
is restricted. These professional and social networks typically have societal and political
influences imperative to providing and enhancing change for many minority people.
Additionally, history has shown countless times that Black girls and women are not valued in
society (i.e., historical stereotyping of Black women and limited opportunities over the years);
even more so, Black girls and women are unwelcome and unappreciated in the STEM field.
Despite these hindrances, Black girls and women have embraced a self-started revolution to
make their own space and place in society and the STEM field.
The Birth of #BLACKGIRLMATHMAGIC
According to Collins (2014), “African-American women have long realized that
ignorance doomed Black people to powerlessness” (p. 210). Henceforth, Black women have
taken a stand to ensure that their children and/or they personally receive a quality education.
Women of many generations continue to pass down the belief that education is the way out of
9
this cycle of oppression (Ricks, 2014). Now that there are more opportunities for people of color,
especially Black women, to take part in education, there exist possibilities for positive change in
a centuries-old corrupt system.
In the past, “Denying African American women the credentials to become literate
certainly excluded most African American women from positions as scholars, teachers, authors,
poets, and critics” (Collins, 2014, p. 5). Now that they may assume such titles, there is a gap in
the number of Black women in leadership roles within education, especially in mathematics
(Joseph et al., 2017). Collins adds, “until recently these women have not held leadership
positions in universities, professional associations, publishing concerns, broadcast media, and
other social institutions of knowledge validation” (p. 5). With these discrepancies in mind, one
must wonder what role the educational system plays in continuing this trend among society.
For some African Americans, it was once believed that to attain educational success, they
had to disown their racial and cultural identity; this social mobility strategy has been coined the
term “racelessness” (Barrie et al., 2016; Fordham, 1988). Instead of denying the characteristics
and cultural markers that make African American women unique, Black women today embody
and embrace those identifiers. Holistically, Black women are proud of their racial and cultural
heritage. Black women nowadays are presenting themselves confidently in a multitude of
contexts; from classrooms to boardrooms, Black women are changing. The movement
encompassing these positive images and stories of Black girls and women has become known as
#BlackGirlMagic (Barker, 2018).
#BlackGirlMagic is more than a hashtag; it is a movement (Joseph et al., 2017; Thomas,
2016). In 2013, Cashawn Thompson started a nationwide campaign when she introduced the
hashtag #BlackGirlsAreMagic which later transformed to #BlackGirlMagic (Barker, 2018). In a
10
2018 interview with Cate Barker, Thompson mentioned how and why she created the term.
According to Thompson, “Sometime in 2013, I noticed that there were a lot of negative things
being said about Black women online and through other media outlets” (2018). Negative
statements that Thompson recalled included “Black women were unmarriageable” (2018) and
“least attractive of all the women on the planet” (2018). To increase not only her own self-image
and self-esteem but that of other Black females as well, Thompson focused on the positives that
surrounded Black women, from being strong and independent to just being exceptional beings.
The #BlackGirlMagic hashtag has become “a rallying cry and affirmation for Black women all
over” (Barker, 2018). From everyday women making strides academically (Joseph et al., 2017)
to superstars such as Beyoncé performing songs like “Formation” at the Super Bowl half-time
show (Gammage, 2017), the #BlackGirlMagic movement is continually proving that Black
females of all ages and socioeconomic statuses are resilient and triumphant in the face of
adversity and hardships.
What about #BlackGirlMagic in education, or even mathematics education? Not to
disregard any past achievements or acknowledgments of African American women, but the
movie, Hidden Figures (Gigliotti et al., 2017), sparked the most recent nationwide conversation
about Black women in the STEM fields in the 21st century. Based on the book by African
American female author Margot Lee Shetterly, Hidden Figures shares the real-life stories of
three women that made remarkable contributions to the nation’s history in STEM. Katherine
Johnson, Dorothy Vaughan, and Mary Jackson—easily three of the most influential women in
the National Aeronautics and Space Administration (NASA) that just so happened to be African
American—were acknowledged for their historic achievements as human computers; human
computers were women that did the number crunching for NASA’s engineers (2017). Each
11
excelling beyond their supervisors’ expectations, these three Black women changed how Black
women were viewed in mathematics.
The introduction of the Hidden Figures movie (Gigliotti et al., 2017) in 2017 has
impacted mathematics education since its debut (Ireland et al., 2018; Joseph, 2017). The
conversation and research surrounding the increase of Black girls and women participating in
STEM is paramount to changing the landscape of mathematics education. Using role models
such as Katherine Johnson, Dorothy Vaughn, and Mary Jackson, educators have amplified entry
points to encourage students, especially African American girls, to reach goals that may have
once seemed unattainable. Joseph et al. (2017) state, “[The history related to Hidden Figures]
gives mathematics teachers a way to center and engage Black girls in mathematics in a
meaningful way—helping Black girls understand the greatness from which they come and can
draw upon” (p. 49).
Researchers have shown that Black females are making strides in mathematics education
(Joseph et al., 2017); however, there continues to be a long way to the equality of opportunities
for African American girls and women in mathematics (2017). One of the roadblocks towards
reaching the mantles of success in mathematics is the defeat of the standardized testing battle, a
battle that can be trained for and beaten. As more and more students engage in standardized
mathematics testing, lessons can be learned from their process to improve the battle for more
Black girls and women in the content area.
COVID-19: The Pandemic That Changed the World
The year 2020 would be known as the year that the world stopped. Due to the novel
coronavirus, known as COVID-19 or SARZ CoV-2, the United States and the rest of the world
fell victim to a virus that changed life as people knew it. Starting in Wuhan, China, the COVID-
12
19 virus made its way to the United States as early as December 2019. By March 2020, the virus
had been detected nationwide across the U.S. According to the Centers for Disease Control and
Prevention (CDC), “people with COVID-19 have had a wide range of symptoms reported –
ranging from mild symptoms to severe illness” (2021). Symptoms could range from fever or
chills to sore throat to muscle aches, among several other symptoms, and could be present two to
fourteen days after exposure to the virus (2021). As shared by CNN (Hernandez et al., 2021),
the Johns Hopkins University Center for Systems Science and Engineering had reported over 33
million cases of the COVID-19 virus and nearly 600,000 related deaths in the United States by
June 2021.
At the height of the pandemic, schools were forced to close their doors, families were
required to quarantine at home, and all other facets of life, from grocery shopping to doctor
visits, were disrupted due to the highly infectious virus. The education system took a resounding
hit as the COVID-19 pandemic took a foothold across the world. For most students, March 2020
would be the last time they stepped inside a classroom until the next academic school year; in
other cases, students decided to stay virtual the following school year. The pandemic resulted in
the loss of instructional time, unfinished learning, and the re-acknowledgment of the resource
gap among students.
One of the outcomes of the pandemic was a switch to distance learning—teachers and
students across the globe adjusted to instructing and learning virtually. For most people, this was
the first time they had to work or learn in such an environment. Students and teachers worked on
computers, or other internet-enabled devices, from home or community spaces if possible. For
families without internet or computers, schools and local companies chipped in to provide access
to such resources so students could continue to learn outside of their school buildings.
13
At the start of the 2020-2021 school year, circa August 2020, educators and families
wanted students to attend school in person. With the virus still being a primary concern, social
distancing, handwashing, and wearing face masks had become the new normal as people tried to
return to a pre-pandemic learning environment. Teachers and students have had to learn how to
adjust to teaching and learning during a pandemic. The present study happens to take place
during this novel experience.
Purpose and Research Questions
High-stakes standardized testing in mathematics can be the crux of one’s impending
goals. Most institutions and organizations rely heavily on standardized test measures, as well as
grade point average (GPA) and personal statements, to determine the admittance of individuals
into their programs. Given the difficulty associated with Black girls and women in mathematics,
standardized testing seemed the most appropriate path of investigation to irradiate the present
context of Black girls and women in mathematics.
The purpose of this study was to determine how different mathematics item types
impacted the performance of African American girls during a pandemic, of specific interest,
were the multiple-select multiple-choice (MSMC) items. MSMC items have been referred to as
more cost-efficient (Hohensinn & Kubinger, 2011; Kastner & Stangl, 2011) for vendors of
standardized tests and reduce the amount of error in human scoring. With this intent, this study
pursued evidence that may impact the future structure of standardized mathematics assessments,
curricular decisions for mathematics, and instructional practices and guidance for educators.
Given a more in-depth insight into African American girls’ experiences and cognitive processes
with standardized mathematics test items, the goal of this study was to ultimately help create
more opportunities for #BlackGirlMathMagic, which includes the advancement of African
American girls and women in revered professional and societal communities.
14
Research Questions
The overarching research questions guiding this study are as follows:
1. How do sixth-grade African American girls at an urban charter school perform on
multiple-select multiple-choice (MSMC) mathematics test items compared to single-
select multiple-choice (MC) and short-answer constructed-response (CR) items?
2. How do sixth-grade African American girls at an urban charter school process MSMC
items cognitively?
3. How has teaching during a pandemic impacted the mathematical trajectory of sixth-grade
African American girls at an urban charter school?
4. What insights into the sixth-grade African American girls’ cognitive processes and
experiences during a pandemic do the interviews offer about the results from the
mathematics assessment?
Study Contribution & Significance
Although some studies have examined student differences in mathematics testing
(Arbuthnot, 2009; Davies et al., 2016; Gallagher et al., 2000), Black girls and women are faint in
comparison to other racial and gender groups in research literature related to standardized
assessments, including testing conditions, test composition, and item-level performance. A vast
majority of the studies guiding this research were predominantly focused on non-Black students;
several were international. This study adds to the limited literature on African American girls
and women and standardized educational testing in mathematics, even more so during a global
health pandemic. There was also limited research on multiple-select multiple-choice test items
(Kastner & Stangl, 2011; Moon et al., 2019), especially from an intersectional approach. Lastly,
this study will add to the literature on education during the peak of the COVID-19 pandemic.
15
This study was critical because African American girls and women are underrepresented
in presumably prestigious professions and organizations. Moreover, since standardized testing is
now a norm requirement, and mathematics is the gatekeeper to all STEM-related professions, an
investigation into African American girls and women and standardized mathematics testing was
warranted. Specifically, examining the type of test items used in mathematics assessments could
provide more guidance on improving testing performance for more African American girls and
women in mathematics, leading to increased opportunities or #BlackGirlMathMagic. Finally, by
examining the impact of the pandemic on the participants’ learning experiences, this study also
may provide direct insight into how future mathematics trajectories are affected for African
American girls and women in years to come.
Definition of Terms
a) Black/African American: used interchangeably; Black refers to race; African American
refers to ethnicity
b) Testwiseness: According to Arbuthnot (2011), “testwiseness refers to an individual’s
ability to use the testing situation to increase his/her score, independent of the construct
being measured by the test” (p. 62).
c) Different item types
• Multiple-choice items: items with answer choices
• Multiple-choice, single response (MC): items with answer choices with only one
correct answer
• Multiple-select multiple-choice (MSMC or MS): items with answer choices with
more than one correct answer
• Constructed response (CR): items requiring the respondent to produce an answer
16
• Short-answer constructed-response: items requiring the respondent to produce an
answer, usually fill in the blank or a numerical response only
• Extended-answer constructed-response: items requiring the respondent to explain
or show their work in their answer
d) Multiple solutions: problems have numerous paths to get to an answer
e) Conventional items: problems that require the use of algorithms to solve
f) Unconventional items: problems that require the use of insight or logic to solve
g) Solve problems (see conventional items)
h) Comparison problems (see unconventional items)
i) Standardized testing: the process of assessing individuals using a standard instrument
and scoring process
j) High-stakes testing: the use of assessments for placement or inclusion in an academic or
vocational setting
k) Cognitive processing: the act of thinking
Summary and Organization of the Document
This paper reviews the guiding theoretical frameworks— intersectionality theory
(Crenshaw, 1991), Black Feminist Thought (Collins, 2014; Collins & Bilge, 2016), and multiple
approaches to understanding (Gardner, 2009) — existing literature regarding Black girls and
women in mathematics, mathematics assessments, and the use of testwiseness in mathematics.
Following the literature review, the methodology of the study is described, including the research
design, participants, instruments, and procedures for data collection and analysis. The following
section discloses the results and findings. The final section includes the discussion and
conclusion of the study, which includes implications and recommendations for future research.
17
CHAPTER 2. LITERATURE REVIEW
The literature review defines background information and summarizes the findings from
other scholars to best support the purpose of the study, which is to identify trends among African
American girls in mathematics by understanding their performance on various item formats in
standardized mathematics assessments. In addition, this literature review includes the overview
of theoretical frameworks and the summary of scholarly research related to Black girls and
women in mathematics, mathematics assessments, and testwiseness in mathematics. The
conclusion of this chapter provides the overall findings as well as suggestions for further
research.
Theoretical Frameworks
A theoretical framework is a foundation for a study. According to Grant and Isanloo
(2014), “[The theoretical framework] serves as the guide on which to build and support your
study, and also provides the structure to define how you will philosophically, epistemologically,
methodologically, and analytically approach the dissertation as a whole” (p. 13). The theoretical
frameworks guiding this study include intersectionality theory (Crenshaw, 1991), Black Feminist
Thought (BFT; Collins, 2014), and multiple approaches to understanding (Gardner, 2009). Each
framework was chosen for its unique perspective and complementary properties towards one
another.
Intersectionality Theory
In mathematics education, an under-examined domain is the intersectionality (Crenshaw,
1991) among racial and gender groups. According to Collins and Bilge (2016),
“Intersectionality is a way of understanding and analyzing the complexity in the world, in
people, and in human experiences” (p. 2). For African American women specifically, there has
18
been lackluster attention to the distinction of their unique experiences. Collins and Bilge state,
“Because African American women were simultaneously black and female and workers, these
single-focus lenses on social inequity left little space to address the complex social problem that
they face” (p. 3). Several scholars continue to examine intersectionality among African
American girls and women in education (Gholson, 2014, 2016; Harrison, 2017; Ireland et al.;
Morris & Perry, 2017; Young et al., 2018). The need for this analysis can be seen within student
performance data in mathematics and disciplinary information across the nation.
Black Feminist Thought
Sister to the intersectionality framework, the critical framework that accounts for the
“distinct experiences of Black women in the United States” (Joseph et al., 2016) is Black
Feminist Thought (BFT). Joseph et al. (2016) conceive, “Black feminism foregrounds Black
women’s and girls’ lived experiences, which may not conform to the essentialist view of
feminism or normative female experiences” (p. 208). According to Collins (2014), the overall
purpose of BFT is to combat oppression. Collins states, “As a critical social theory, Black
Feminist Thought aims to empower African American women within the context of social
injustice sustained by intersecting oppressions” (p. 22). This matrix of domination (2014), or the
experience of intersecting oppressions, leads to a common way of thinking and acting as a Black
woman. For example, a Black woman may have experienced a lack of opportunities growing up
due to her race and gender; by recognizing those limitations, she may act accordingly so that her
child may have opportunities that she was not afforded.
In addition to the premise of empowerment within social injustice for African American
women, four other components construct Black feminist thought: outsider-within, Black female
intellectualism, controlling images, and self-definition (Collins, 2014). The outsider-within
19
concept highlights the reality that Black women are in society but are not a central part of
society. For example, back in the twentieth century, when Black women could only get jobs in
domestic labor, Black women could be in the presence of White people, yet they could not
partake in the same activities or reap the same benefits as their counterparts (Gholson, 2016). To
be seen, not heard or respected, is the epitome of this concept.
Black female intellectualism is the educating of oneself to grow individually and as a
community of Black women through activism. Collins (2014) states, “One key task for Black
women intellectuals of diverse ages, social classes, educational backgrounds, and occupations
consists of asking the right questions and investigating all dimensions of a Black women’s
standpoint with and for African American women” (p. 33). For BFT to enhance the Black
female community experience, Black women must first recognize their place, power, and
potential in society. Once Black women accept their role, they can better identify their part in
making a societal change for and with the Black female community. Collins describes this
leadership as requiring “collaboration among diverse Black women to think through what would
constitute Black women’s autonomy” (p. 36). The goal here is to get Black women to work
together to combat the ever-so-present systems of oppression and negative stereotypes placed
upon them.
The last two features of Black feminist thought include controlling images of Black
women and their self-definitions (Collins, 2016). Negative images of Black females are
plastered across television screens, magazines, internet articles, and other forms of social media.
These images are captured in the historical stereotypes of Black females. Although there are still
contradictory portrayals of Black women that shape their image, one could argue that the image
of Black women is changing with movements such as #BlackGirlMagic. More and more Black
20
women are claiming their own narratives through books, film, and music. For instance, consider
the critically acclaimed power characters created by Shonda Rhimes, namely Olivia Pope
(played by Kerry Washington) in Scandal and Annalise Keating (played by Viola Davis) in How
to Get Away with Murder; these women, including Michelle Obama, Oprah Winfrey, and Yara
Shahidi, have become some of the idolized role models for Black girls and women around the
nation. Black females are seeing increasingly more positive images that assist in defining and
reaffirming their race and culture. Not only are these images enhancing racial and cultural
development, but they are also assisting in academic identity development. The images of Black
females defying negative educational stereotypes have impacted the interest in once taboo
content areas for African American girls such as mathematics or science. One may recall real-
life stories such as the inspiration behind Hidden Figures (Gigliotti et al., 2017) as an example of
this interest.
Multiple Approaches to Understanding
The final theoretical framework guiding this study is the multiple approaches to
understanding, a concept presented by Howard Gardner, a Harvard psychologist responsible for
the theory of multiple intelligences (Gardner, 1983). Before we can process the multiple
approaches to understanding, we must first consider the multiple intelligences proposed by
Gardner. Gardner (2006) defines intelligence as “a computational capacity—a capacity to
process a certain kind of information—that originates in human biology and human psychology”
(p. 6). From a psychometric perspective, Gardner (2006) posits, “intelligence is defined
operationally as the ability to answer items on tests of intelligence” (p. 6).
Originally, Gardner introduced seven intelligences that met his criteria for inclusion:
musical, bodily-kinesthetic, logical-mathematical, linguistic, spatial, interpersonal, and
21
intrapersonal (1983). Before the end of the twentieth century, Gardner (1999) introduced two
additional intelligences, existential and naturalist. Of particular interest to this study is Gardner’s
logical-mathematical intelligence. As summarized by Kurt, “individuals with this developed
intelligence demonstrate excellent reasoning skills, abstract thought, and the ability to infer based
on patterns” (2020, para. 7).
When considering assessments, test writers want to ensure that students understand the
material, or content, being assessed. Gardner (2009) mentioned, “sheer memorization or faithful
paraphrase…does not count for understanding” (p. 107). Henceforth, we notice various question
types and items included in an assessment to get the most transparent picture possible for a
student’s understanding. From a learning aspect, Gardner introduced the concept of multiple
approaches to understanding with three overarching steps: 1) find an entry point, 2) tell an
analogy, and 3) approach the core (2009).
To bring imagery to these steps, consider learning about Expressions and Equations, a
topic presented later in this study. In the first step, we want to get the student interested or
invested in the topic that he or she will be learning. In our example with Expressions and
Equations, we want to consider an entry point through prior learning or make a connection to the
student’s personal or educational experiences. Gardner (2009) considered six different kinds of
entry points: 1) narrative—telling a story, 2) quantitative—using numbers or making patterns, 3)
foundational—determining the point of existence or “bottom line” (p. 108), 4) aesthetic—
appealing to the eyes through some form of art, 5) hands-on—experiencing in the moment, and
6) social—learning from others. In the second step, Gardner proposes making an analogy with
something the student could already relate to by bringing in a real-world context. Once the
student has been allowed to make a connection to an experience they are familiar with, the next
22
step would be to provide multiple experiences and opportunities for trial and error; in the
classroom, this is typically referred to as guided and independent practice. The significance of
the final step, called approaching the core, “is the recognition that a concept can only be well
understood – and can only give rise to convincing performances of understanding – if an
individual is capable of representing that core in more than one way, indeed, in several ways” (p.
111).
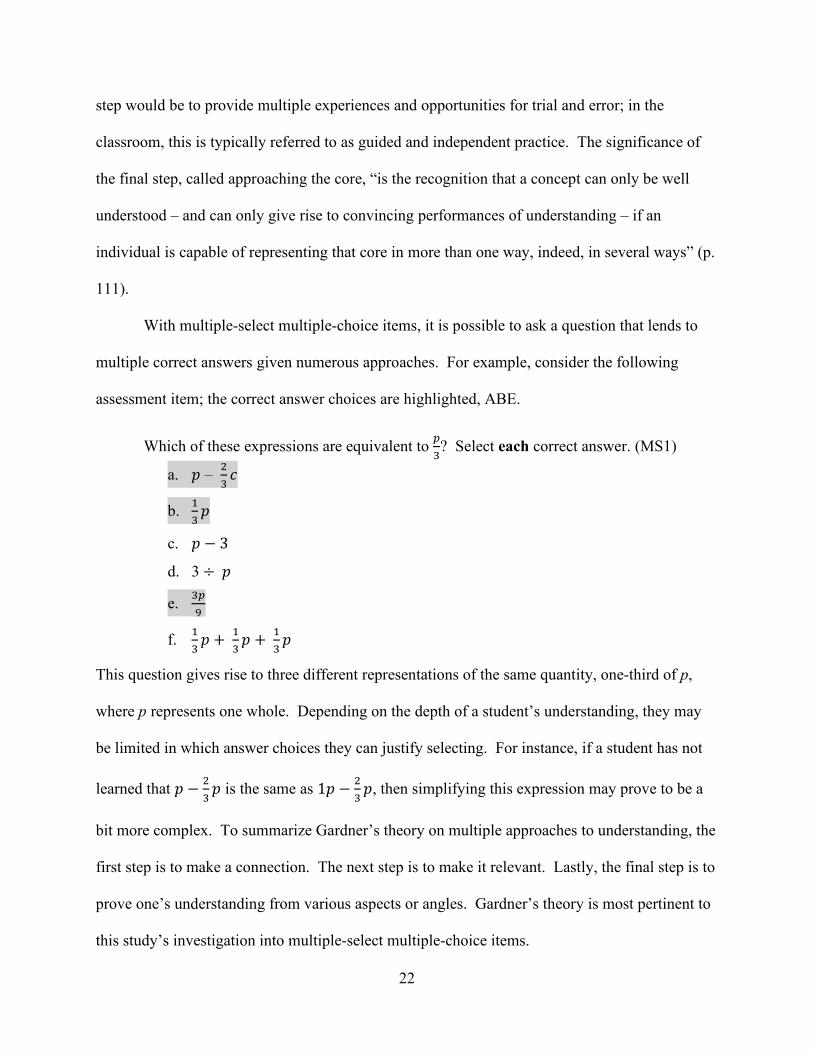
With multiple-select multiple-choice items, it is possible to ask a question that lends to
multiple correct answers given numerous approaches. For example, consider the following
assessment item; the correct answer choices are highlighted, ABE.
Which of these expressions are equivalent to 𝑝𝑝3? Select each correct answer. (MS1)
a. 𝑝𝑝 – 23𝑐𝑐
b. 13𝑝𝑝
c. 𝑝𝑝 − 3
d. 3 ÷ 𝑝𝑝
e. 3𝑝𝑝9
f. 13𝑝𝑝 + 1
3𝑝𝑝 + 1
3𝑝𝑝
This question gives rise to three different representations of the same quantity, one-third of p,
where p represents one whole. Depending on the depth of a student’s understanding, they may
be limited in which answer choices they can justify selecting. For instance, if a student has not
learned that 𝑝𝑝 − 23𝑝𝑝 is the same as 1𝑝𝑝 − 2
3𝑝𝑝, then simplifying this expression may prove to be a
bit more complex. To summarize Gardner’s theory on multiple approaches to understanding, the
first step is to make a connection. The next step is to make it relevant. Lastly, the final step is to
prove one’s understanding from various aspects or angles. Gardner’s theory is most pertinent to
this study’s investigation into multiple-select multiple-choice items.
23
Black Girls and Women in Mathematics
The following section establishes a foundation for focusing on African American girls
and women in mathematics based on previous scholarly literature. Several of the studies below
explore the experiences of Black girls and women in either secondary, undergraduate, and
graduate school. Criteria for selection required the target sample to be exclusively African
American girls or women. Sample search terms included Black, African American,
mathematics, middle school, high school, secondary, and STEM.
The first section looks exclusively at Black girls in mathematics in either middle or high
school (Booker & Lim, 2018; Joseph et al., 2019; Morton, 2014; Young et al., 2018) and
includes qualitative (Booker & Lim, 2018), quantitative (Young et al., 2018) and mixed methods
(Morton, 2014) studies. Many of the participants throughout the studies were in middle school;
however, some of the studies included elementary (Young et al., 2018) and high school students
(Joseph et al., 2019). The overall findings for the secondary mathematics articles echoed several
similarities. For instance, some studies say that Black girls need more sincere teacher attention
during instruction; they need to feel welcomed and accepted by both students and peers, and
Black girls need teachers to be authentic educators (Booker & Lim, 2018). Also, it was found
that Black girls tend to have a stronger sense of pride in themselves with mathematics earlier in
school and a decline in that same pride as school progressed.
The second section involves only Black women in college (Borum & Walker, 2012;
Joseph, 2017; McGee & Bentley, 2017; Moody, 2004); of the women mentioned, they either had
or were working towards a degree in mathematics or some other STEM-related field. All the
studies included in this section were qualitative phenomenological studies. Each study
mentioned that participants experienced low expectations from others, feelings of isolation and
24
discrimination, a need to prove their worth to others, and more substantial support in more black-
influenced environments (Borum & Walker, 2012; Joseph, 2017; McGee & Bentley, 2017;
Moody, 2004).
Black Girls in Mathematics
In an explanatory mixed methods study, Morton (2014) examines African American
female students' mathematical problem-solving abilities and perceptions through proportional
reasoning. The study consisted of 52 sixth through eighth graders in the southeastern United
States; these students participated in a three-year longitudinal study called Mathematical Identity
Development and Learning Project (MIDDLE). There were two phases to the study; the first
phase was an administration of proportional reasoning task. The second stage consisted of
interviews and autobiographies of nine of the participants. Morton tested the following research
questions: “What strategies do African American female students employ during mathematical
problem-solving? How do African American female students understand proportionality
concepts? How do African American female students perceive themselves as mathematics
learners?” (p. 236).
The study results showed that more than half of the participants did not perform
satisfactorily on the proportional reasoning task over the three-year time frame. Precisely,
86.5%, 69.2%, and 68.6% of students received a score of 0 or 1 in years one, two, and three,
respectively; a score of 0 or 1 indicated failure to try or little to no understanding. Participants
also expressed greater belief in their mathematics abilities than they demonstrated. For instance,
approximately one-fourth of the students each year indicated a confidence level of at least four
out of six in their mathematical abilities but scored a 0 or 1 on the proportional reasoning task.
According to Morton (2014), Black female participants used strategies that mimicked those of
25
their White peers on the same task. Morton posited that there must be underlying factors outside
of student thinking that impact African American female students’ mathematical performance,
given their strategy use, healthy regard for mathematics, and confidence in their mathematics
abilities. Henceforth, future studies could examine those potential factors with a larger sample
size than those used in the present study.
In a study by Booker and Lim (2018), researchers investigated the instructional and
personal relationships of African American girls and their teachers. Additionally, the researchers
were interested in how teachers created belongingness amongst their students; belongingness
refers to a sense of connectedness (2018). In this phenomenological study, participants included
eight high-achieving middle school African American girls from the southeastern United States,
each of which had one of three White female teachers. The girls participated in two in-depth
interviews, and their teachers were interviewed on one occasion.
In their study, Booker and Lim (2018) observe school belongingness through the
relationship between African American girls and their teachers. This qualitative study identified
two major themes associated with positive interactions between students and teachers and a
strong sense of belongingness for African American girls in the classroom, encouraging
relationships and authentic pedagogy. For students, being able to relate to their teachers became
one of the underlying conditions for developing positive relationships. The girls perceived that
teachers were “not only caring toward them but also highly regarded them on a personal level”
(p. 1044). Strong relationships with their teachers allowed the girls to participate more in class,
help fellow peers, and create and sustain positive energy in the classroom (2018). Teachers
perceived as “firm yet caring” (p. 1045) experienced the best interactions and outcomes with
26
their students; these teachers were both nurturing and strict about expectations with their students
(2018).
The second theme, authentic pedagogy, constitutes appropriate instructional strategies to
meet the demands of student needs. Teachers in this study understood the inequities for African
American students and ensured that they provided the best support socially and mathematically
for their students. The teacher participants were described as using differentiated instruction,
culturally relevant teaching, and incorporating real-world situations. Booker and Lim (2018)
concluded their study with the following premise, “For African American students, in particular,
feeling their teachers’ support and encouragement is paramount to their success” (p. 1048).
Given the study’s findings, future studies could explore similar phenomena with older African
American students.
To offset negative narratives regarding Black girls in mathematics, Young et al. (2018)
conducted an anti-deficit examination of Black girls using National Assessment of Educational
Progress (NAEP) data from 2005 to 2015. Known chiefly in literature for gap gazing, or the act
of comparing groups based on achievement gaps, Black girls were given their own space in this
single group focus article. Using the National Center for Educational Statistics (NCES) data
management tool, Young et al. compiled NAEP Mathematics data on Black girls to determine
the achievement trends and to see if there were any differences between the two grade levels’
achievements. Odds ratios were calculated to address the research questions guiding the study.
The assumption leading the analysis was that an odds ratio greater than one signifies more
exposure to mathematics since fourth grade would lead to higher performance in mathematics for
eighth-grade girls.
27
The findings of Young et al. (2018) were somewhat alarming. The odds ratios were all
less than one, indicating that math exposure did not increase eighth-grade performance. In fourth
grade, there was a significant decrease in performance in Data Analysis and Probability
subscales on the NAEP assessment; the most significant increase was in Number and Operations.
As for the eighth graders, overall performance increased from 2005 to 2015 in all areas; the most
substantial increase was in the Measurement subscale category. When considering all Black
girls who took the NAEP assessment from 2005 to 2015, there was a 16% performance increase
overall. Trends from the data showed that Algebra was the greatest area of strength for fourth
graders, yet it was an area of concern for eighth graders. Considering the decrease in
performance between fourth- and eighth-grade Black girls, one could seek to investigate why
performance decreased for Black eighth-grade girls in mathematics.
In a more recent study, Joseph et al. (2019) explored the experiences of Black girls in
secondary mathematics classrooms with their teachers. As reinforced by the authors, Black girls
have been overlooked and dehumanized in mathematics classrooms for decades. Joseph et al.
study focused on Black girls’ humanity, defined by the authors “as a composite of their personal
experiences, backgrounds, histories, languages, intellect, personalities, bodies, and physical and
emotional well-being” (p. 133). This study served the purpose of carefully attending to the
Black girls' voices and how their mathematics experiences could be improved for them by their
teachers. This phenomenological qualitative study centered on (n = 10) Black girls in either
sixth (n = 2) or ninth grade (n = 8); the age range was between 12 and 17 for the New Jersey
participants. Using Tuitt’s (2003) inclusive pedagogy (IP) model as the theoretical framework,
Joseph et al. used social interaction and sharing power as two tenets to position their study. Data
28
collection consisted of 60-90-minute semi-structured interviews with the participants. Post
transcription, data were coded for patterns and themes.
Based on the findings, Joseph et al. (2019) found a complex reality among the
participants’ mathematics learning experiences. Common themes among the girls included the
praise of one-on-one instructional time, positive social interaction among teachers and students,
teachers’ strong mathematics content knowledge coupled with positive interactions, and group
work in class that allowed for collaboration among peers. For teachers that acknowledged their
students as human beings and showed respect for their personhood, the girls tended to flourish in
their classroom environments. These findings suggest that the students need a human aspect to
the classroom to counteract the negative dispositions that Black girls and women have in
mathematics. Although this study addresses Black girls in mathematics, it does not give
attention to mathematics performance or differences in experiences among the students in the
honors classes compared to students in the general education classes. Further investigation could
yield compelling findings.
Black Women in Mathematics and STEM
To determine the role of social and cultural realities on the mathematical experiences of
African American students, Moody (2004) conducted a qualitative phenomenological study in a
southeastern city. Participants for the study included two African American college students.
The first student, Ashley (pseudonym), was an undergraduate mathematics major in her junior
year at an HBCU (Historically Black Colleges and Universities). The second student, Sheila
(pseudonym), was a graduate student nearly at the completion of her master’s degree in
mathematics education at a PWI (predominately white institution). The two students were
selected based on criterion-based sampling for the study; Moody set the criteria for participants
29
based on proposed success in mathematics and the completion or near obtainment of a degree in
mathematics or a related field. Moody’s study had three primary objectives: “a) identify African
American students’ perceptions of their mathematics classroom experiences, b) determine how
their social and cultural orientations affected their experiences, and c) identify factors that
contributed to their success in mathematics” (p. 139). For data collection, interviews, surveys,
and autobiographies were obtained and analyzed from the participants. Themes were derived
from the samples collected.
The findings from Moody’s (2004) study varied for each student. For the first
participant, Ashley expressed several struggles with mathematics, mostly stemming from self-
perceived racist experiences. According to Ashley, she was one of very few, if any, African
American students in higher-level mathematics courses in high school. She believed the lack of
representation in those classes was because African Americans were expected to “think a certain
way” (p. 140), which most African American students were unaccustomed to thinking. Moody
characterized Ashley as an “alternator” (Ogbu, 1990), a person known to accommodate their
surroundings to fit in, even if they must deny parts of their identity; alternators in the context of
African Americans were seen as “acting White” (1990). Other than her undergraduate
experience, Ashley attended predominantly White schools in grade school. Unlike Ashley, the
second participant, Sheila, attended mostly Black schools until her time in her graduate program.
She expressed that seeing role models of African Americans, especially African American
women, helped her see that mathematics was doable. Having always been at the top of her class
throughout school, Sheila struggled with the lack of African American students enrolled in
higher-level mathematics courses at each level. This phenomenon was a motivator for her to
30
become a mathematics educator to directly support more African Americans in seeing that math
is possible, that they are supported, and they belong just like everyone else.
Moody (2004) supposed that because the two students were African American, their
experiences would have been similar. Quite the contrary, the two women expressed vastly
different views and experiences. The environment played a primary factor in their view of
themselves and mathematics. For instance, both women expressed receiving greater support at
predominantly Black schools compared to primarily White schools. Ashley showcased
sentiments of superiority from her success at predominantly White schools when attending her
HBCU college. Sheila, on the other hand, expressed more difficulty when attending the PWI,
given that most of her prior educational experiences had been at predominantly Black
institutions. In sum, the stories from the two participants demonstrate the need for more African
American educators in mathematics to increase the enrollment and experiences of African
American students wanting to engage more in-depth in the content area and pursue advanced
opportunities. The number of participants limited this study. By including more students in the
study, a more holistic picture can be derived from the experiences of African American students
in mathematics as it relates to their social and cultural veracities.
In 2012, Borum and Walker gathered 12 Black women with doctoral degrees in
mathematics to capture their experiences throughout their undergraduate and graduate programs.
This grounded theory study utilized a BFT framework to highlight the positive and negative
experiences of these women. Of the 12 women that ranged from 30 to more than 60 years of
age, seven of them attended an HBCU for their undergraduate experience; the remaining five
women attended a PWI. Most of the women, especially those that attended an HBCU, expressed
positive feelings and attitudes associated with mentorship and group support as factors that led to
31
their persistence and advancement to complete their degrees. Contrarily, issues of isolation,
discrimination, and lack of support were mentioned as barriers that almost led to some of their
exits from their programs. Some of the women transferred to other institutions to complete their
degrees due to the negative environment during their time in graduate school. Historically,
mathematics has been a White, male-dominated space. Borum and Walker (2012) suggest,
“Building structures that alleviate the norms of a mathematics culture, which can ultimately
hinder the progression of women and minorities, is necessary to increase the participation of
these groups in mathematics” (p. 374). Although this study addresses concerns related to Black
women in mathematics, the focus was on women that have already received their doctoral
degrees. It would be interesting for a study to address the experiences of Black girls related to
standardized testing in mathematics.
To uncover experiences of Black girls and women in mathematics, Joseph (2017)
conducted a qualitative study investigating mathematics identity among seven Black women that
were STEM-major undergraduates. The research the women participated in included individual
semi-structured interviews, the development of an artifact symbolizing their mathematical
identities, and a focus group interview about the movie Hidden Figures. The findings from the
study showed that two major themes emerged from the multi-step data collection from the
participants. The first theme was “limited access to high-quality mathematics instruction” (p.
48). The girls stressed how teachers were not exemplary and did not invest as much effort in
mathematics instruction as they would have liked. Due to the traditional teaching of
mathematics, the girls may have missed several opportunities for advancement. According to the
author, “mathematics teachers can play a role in changing the type of instruction Black girls
receive in their classrooms, as well as promoting Black girls’ enrollment into advanced
32
mathematics courses” (p. 48). The second theme was the “low expectations from others” (p. 48).
The women perceived that their school personnel doubted their mathematical abilities, which
could negatively affect one’s performance and outcomes. An issue with this study is that the
participants in this study are undergraduates; however, the findings are meant to be generalized
for K-12 students.
In a phenomenological study examining the troubled success of Black women in STEM,
McGee and Bentley (2017) share the experiences of three Black women. The women comprise
three different stages in postsecondary school: undergraduate, doctoral, and post-doctoral. The
first participant was a junior undergraduate, double majoring in mathematics and computer
science, from an HBCU school in the southeast United States. The second participant was a
mechanical engineering post-doctoral student from a PWI in the South. The final participant was
a fourth-year computer engineering doctoral student at a mid-southern HBCU. Using interviews
from case studies, the researchers investigated how structural racism, sexism, and race-gender
bias infiltrated these women’s lives and how the women responded to such phenomena.
McGee and Bentley’s (2017) findings from the women’s interviews included multiple
themes, such as isolation within their degree programs, overcompensating for being Black and
female, academic discrimination including inferiority stereotypes, and physical and mental
illnesses related to the stress of negating stereotypes about Black women. The summary of this
study calls for changes in colleges and universities to address the detrimental effects of racism,
gender bias, and discrimination of Black women in ostracized majors such as science,
technology, engineering, and mathematics (STEM). Additionally, the researchers charged
postsecondary schools to hold themselves accountable for providing adequate support, such as
mental health services and mentoring programs, for Black women in STEM. The case studies
33
included in the study were quite in-depth and shared meaningful findings related to Black
women’s experiences in STEM. However, one layer that could enhance the findings is the
standardized testing experience and its implications on Black women in STEM majors,
specifically mathematics.
Conclusion for Black Girls and Women in Mathematics
In summary of the articles related to Black girls and women in mathematics, several
themes emerged. At the secondary level, we have seen that mastery in mathematics decrease for
Black girls as they get further through school (Moody, 2004; Young et al., 2018). Since they
started stronger in math at an earlier age, some Black girls continue to express how well they are
in the subject, even though performance has decreased in the more advanced mathematics classes
(Morton, 2014). Studies that examined relationships with Black girls and teachers resounded
comments about caring teachers and meaningful mathematics experiences that acknowledged
their Blackness (Booker & Lim, 2018; Joseph et al., 2019).
Although there existed similar sentiments in older women, a few different themes arose
based on how earlier mathematics experiences directly impacted the participants’ views of
themselves. First, Black girls and women have experienced isolation and discrimination based
on racial and gender bias (Borum & Walker, 2012; McGee & Bentley, 2017; Moody, 2004). Not
only were Black girls and women forced to work harder than their peers due to historical
stereotypes, especially the Black Lady stereotype (Nunn, 2018), but they also had to carry the
burden of operating in silos and under more pressure than most others. The second theme,
structural support, led to varying experiences for the participants. In college, the women who
attended HBCUs expressed more positive attitudes and experiences than women who attended
PWIs (Borum & Walker, 2012; McGee & Bentley, 2017; Moody, 2004). Structural supports that
34
were deemed beneficial included mentorship, allyship among other students, and high
expectations from others. Lastly, the theme of male dominance in mathematics seeped through
the literature, specifically White males (McGee & Bentley, 2017). By viewing mathematics as a
taboo subject area for non-White males, Black women consistently expressed issues of
overcompensation and self-doubt (Joseph, 2017).
Although these articles were not inclusive of every Black girl’s and woman’s experiences
in school, they did represent similar discoveries. Essentially, Black females are
underrepresented and underappreciated in mathematics and related fields. According to Joseph
(2017), “Our nation must work to disrupt deficit narratives about Black girls and the associated
myths about mathematics” (p. 50). Henceforth, building confidence in one’s mathematical
abilities, or mathematical self-concept, could remedy increasing interest, performance, and
resiliency in mathematics. Increasing Black girls’ and women’s mathematical self-concepts
could be done by improving mathematics experiences and equipping them with tools and
strategies to succeed in mathematics, both inside and out of the classroom.
Mathematics Assessments
Although there are varying types of assessments administered in school, such as
diagnostic, formative, and summative assessments, only one holds the most significant impact on
students’ futures, standardized testing. In mathematics, standardized tests are summative
assessments that measure students’ conceptual, procedural, and application of mathematical
knowledge. One issue in research is the feasibility or access that researchers may have to actual
standardized testing sessions and environments. Several researchers simulate their own
standardized testing conditions to conduct their research. The following section of this literature
35
review will highlight issues in high-stakes standardized testing, including testing conditions and
test composition.
The first section directly addresses how gender and the type of mathematics questions on
an assessment are related. The articles that comprise this section include primarily quantitative-
focused studies with some use of think-alouds. Think-alouds are how a researcher can hear how
a participant processes given stimuli aloud rather than interpreting their thought process from an
artifact. As described by Arbuthnot (2009), “using think-aloud protocols can assist in further
understanding mathematical problem solving” (p. 460). Although each study below addresses a
similar concept, each uses different terminology. Gallagher et al. (2000) refer to two different
mathematics question types as either unconventional or conventional, and students use either
algorithmic or insight strategies; Arbuthnot used similar language. Davies et al. (2016) used the
terms solve and comparison to describe mathematics question types in their international study.
Each article had similar findings related to gender. Females performed better on conventional
problems that used algorithmic strategies; the reverse was true for males.
The second section addresses the test format and item format for mathematics
assessments, except for one study that addressed standardized testing item formats in science
(Wan & Henly, 2012). All these studies were quantitative, with mostly international studies
(Hohensinn & Kubinger, 2011; Kan, Bulut, & Cormier, 2019; Kastner & Stangl, 2011; Sangwin
& Jones, 2017). Several item types were explored in these articles, primarily multiple-choice
(MC) single-response, constructed-response (CR), and multiple-select multiple-choice items
(MSMC) (Hohensinn & Kubinger, 2011; Kan et al., 2019; Kastner & Stangl, 2011; Moon et al.,
2019; Reardon et al., 2018; Sangwin & Jones, 2017; Wan & Henly, 2012). The studies
presented below present similar findings and recommendations. For instance, different item
36
formats directly impact students’ selection behaviors (Moon et al., 2019). Also, how a question
is structured could influence what is being measured, such as mathematical or reading ability
(Kan et al., 2019). Lastly, more researchers are pushing for the use of more MSMC test items
due to their increased difficulty from MC items and cost-efficiency compared to CR items
(Hohensinn & Kubinger, 2011; Kastner & Stangl, 2011; Sangwin & Jones, 2017).
Gender and Math Question Types
In a mixed-method study by Gallagher et al. (2000), the goal was to analyze strategy
flexibility among high school and graduate students in the northeastern United States. The
article consisted of three different studies, each built upon the previous one. Strategies used
throughout the studies were classified under two umbrella categories, algorithmic and insight.
The algorithmic strategy group included using an algorithm or formula, assigning values to
variables, and plugging in options. The insight strategy group included the use of insight with an
algorithm and the use of logic, estimation, or insight.
The first two studies included students that had taken the Scholastic Assessment Test-
Mathematics (SAT-M); the third study used results from the quantitative section of the Graduate
Record Examination (GRE-Q). In the first study, 14 male and 14 female public and private high-
achieving students, 83% White, participated in think-aloud interviews while answering 12
questions that were either all multiple-choice or all free-response or constructed-response items.
In the second study, participants ranged in ability level and consisted of 60 male and 94 female
junior and senior private high school students. Test timing was examined in this study, with
students being put in one of two conditions, either one minute per item or five minutes per item
group. The final study included GRE-Q responses from a total of 48,426 males and 59,295
females within a year. The undergraduate students were grouped based on their respective
37
majors in either arts and humanities, social sciences, or technical sciences. In this study, the
researchers were interested in the theorized performance of males and females on test items
deemed to favor one gender group over the other. Overall, there were 84 female-favored items
and 92 male-favored mathematics test items.
In the first two studies, Gallagher et al. (2000) had similar findings, such as more
unsatisfactory performance on free-response items and abundant use of algorithmic strategies.
The first study found that, for free-response items, female students performed better on
conventional problems in the multiple-choice condition and better on unconventional problems
in the free-response condition. An alarming finding was the performance of female students on
unconventional multiple-choice items with a mean of 1 out of a score of 6. In the second study
that included a time condition, the researchers found an average score of 3.36 correct for the MC
condition and 1.91 in the free-response condition out of 10 points. The findings also showed a
significant interaction between time condition (1- or 5-min condition) and problem type
(conventional vs. unconventional). In the final study, Gallagher et al. found that males
outperformed females on both gender-favored test items; the most substantial performance gap
was on the male-favored test items.
The findings supported prior research and suggested that standardized testing leading to
college admissions and graduate programs should consider the cognitive demand of test items
when making critical decisions. The researchers suggested great attention to solution strategies
as they may favor one gender group over another. Overall, question types must be considered
for their cognitive demands and how certain gender groups may perform. An assessment that is
primarily unconventional and loaded with spatial representation-like items may disadvantage
female students in relation to male students. The article only addressed the participants' racial
38
makeup for high school students, which were primarily White students. The intersection of race
and gender, coupled with cultural dynamics, could yield varying results than those found in this
study.
Arbuthnot (2009) conducted an explanatory sequential mixed-methods study linking both
quantitative and qualitative data. The first study investigated differences between Black students
in one of two testing conditions, high- or low-stereotype threat conditions. Participants consisted
of 257 eighth-grade students; however, the researcher only focused on the 159 Black non-
Hispanic students for this study. All the students were recruited from four urban metropolitan
magnet schools. Arbuthnot partitioned the students into three categories: low, moderate, and
high achievers. Students were placed in their corresponding categories contingent upon their
performance on the Iowa Test of Basic Skills (ITBS) standardized mathematics test, mathematics
course enrollment in eighth grade, and their current GPA.
The 30-item mathematics test instrument included 15 DIF (differential item functioning)
(Dorans & Holland, 1993) and 15 NoDif items. Differential item functioning examines the
differences in performance among two supposedly comparable groups; if the groups perform
differently, then the item is assumed to possess DIF. Using multivariate analysis of variance
(MANOVA), Arbuthnot conducted a 2 x 2 between-subjects analysis with treatment condition
and achievement levels as independent variables and item type (DIF or NoDIF) as the dependent
variables. The findings only showed a significant main effect for achievement and treatment
conditions but not for their interaction. Although none of the results were statistically
significant, there was an almost significant difference in DIF items for high-achieving Black
students in the two stereotype condition groups.
39
After completing the first study, Arbuthnot (2009) followed up the quantitative
assessment using a nested sample of participants for qualitative think-aloud protocols and
follow-up interviews. The second study consisted of 17 students randomly selected based on
their mathematics achievement level, out of the original 159 Black non-Hispanic students. The
think-alouds and interviews were intended to gauge how participants used various strategies to
solve mathematics problems (Gallagher and De Lisi, 1994) and determine if cognitive
disorganization was present in their thinking. Think-aloud protocols are used as a way for
students to vocalize their thought processes when solving problems; this technique was quite
useful for the researcher since she wanted to know how students processed the mathematics
problems unfiltered by autocorrection, a tenet of the think-aloud process. Data from the think-
alouds and interviews were audiotaped, followed by a transcription. The text data was then
blindly coded for strategy choices implemented. Any data implying difficulties was coded under
cognitive disorganization.
Results from the second study showed that students in the high-stereotype-threat
condition used unconventional, or unorthodox, strategy choices less often than students in the
low-stereotype-threat condition. Henceforth, the students in the high-stereotype-threat condition
were more conservative or conventional with their answers. Conventional problem-solving was
a safer approach since it uses algorithmic, or formulaic, procedures; unconventional strategies
are more logic-based test items. Arbuthnot (2009) found no differences in cognitive
disorganization for either treatment condition.
Based on the results and findings from Arbuthnot’s (2009) study, it was conveyed that
the threat of a testing situation, either high- or low-threat condition, orchestrated the type of
strategies that Black students tend to use in problem-solving. The studies used for this research
40
were administered in low-stereotype-threat and perceived high-stereotype-threat conditions. For
future studies, researchers should try to examine the hypotheses of this study on students in an
actual standardized testing environment. Since this may be unlikely due to access concerns, it
may be more feasible to use practice test administrations as simulators of the actual standardized
test environment. Additionally, the information provided in this study examines Black students
holistically and does not relay information disaggregated by gender groups. An analysis of
Black girls could prove beneficial for future studies.
Using a quantitative approach, Davies et al. (2016) used a quasi-experimental design to
conduct two experiments to answer questions related to gender stereotypes and mathematics
question types. Davies et al. used a sample of 210 British Caucasian undergraduate women (age
range between 18 and 21 years old) and 191 middle and high school students (94 girls, age range
between 14 and 16 years old). Using ANOVA as the premier statistical analysis strategy for
both experiments, Davies et al. found in the first experiment that testing condition and question
type both significantly impacted the women’s performance in mathematics. Multiple-choice
solve question types (require formulas or procedural algorithms) had higher performance than
multiple-choice comparison question types (questions requiring logic) in both testing conditions.
In the second experiment between boys and girls, gender was not significant; however,
question type was significant. Results were most like the findings in the first experiment.
Overall, the researchers found that the type of questions, not difficulty level, were factors in
debilitating female students’ mathematics performance. Unfortunately, Davies et al.’s (2016)
study uses a demographic (British Caucasian students) that may not be generalizable to African
American girls and women in the United States. Further research should consider examining
41
mathematics question types and their effect on the performance of diverse cultural groups,
specifically African American students.
Test Format & Item Types
In efforts with the Educational Testing Service (ETS), Moon et al. (2019) conducted a
research study examining the differences in participants’ responses under uncertainty given
various affirmative-seeking test items, items seeking true statements. The quasi-experimental
design study tested the affordance theory (Gibson, 1979), given the following test item formats:
nonforced-choice (NFC), forced-choice grid (FC), multiple-selection multiple-choice (MSMC),
forced-choice grid with do-not-know (DK), and grid with all possible options (APO). The
participants for this study were recruited online through Amazon Mechanical Turk; the 1,091
randomly assigned adults were between 20 and 40 years old and held at least a bachelor’s
degree. The study’s hypotheses investigated the visual layout of test items with affirmative
responses from test-takers.
For Moon et al. (2019), the findings showed that, for forced-choice items, having a do-
not-know option significantly lowered performance for test-takers; henceforth, participants did
not attempt to guess whether a statement was true or not. Participants selected more true
responses in NFC for nonforced-choice items compared to multiple-select multiple-choice
(MSMC) items. Participants had a higher affirmative selection rate when given all possible
options (APO) compared to NFC items but a lower reliability measure. The researchers
concluded that having various item formats or layouts led to differing selection behaviors from
participants. Future studies should “identify test-wiseness strategies in these new item formats to
minimize their potential negative effects on measurement” (p. 60). Given the findings from this
study, it seems worth exploring the differences in performance and test-taking behaviors of
42
standardized testing school-aged students while considering cultural context and diverse
backgrounds.
In a quantitative study by Kan et al. (2019), the researchers examined the relationship
between item stem formats, such as mathematical expression (ME) or Word Problems (WP), and
the dimensionality of mathematics assessments. The participants consisted of 671 sixth-grade
students from 10 middle schools in Turkey; most schools were public schools. The instruments
for this study included two 25-item mathematics assessments comprised of pre-algebra topics,
including algebraic expressions. All test items had five response options, including four
incorrect answers or distractors and one correct answer.
Kan et al. (2019) used principal component analysis (PCA) and multidimensional item
response theory (MIRT) modeling in this study. The findings showed that most test items loaded
on three principal components with eigenvalues greater than one; 29.42% of the variance was
explained by one component. Correlations between the individual test items on the ME and WP
forms were between .17 and .54, with an average of .36 and a standard deviation of .09. As
related to mathematical ability and mathematical language, the researchers found that when ME
and WP items measured mathematics achievement, there was “a strong composite with reading
and mathematics language abilities” (pp. 25-26). Unfortunately, findings also showed that
“reading and mathematical language abilities cannot be completely separated from the overall
mathematical ability” (p. 26). Additionally, Kan et al. found that reading ability was highly
associated with mathematical ability instead of mathematical language ability (2019).
One hindrance of the study was the sample, which consisted of only monolingual
Turkish-speaking sixth graders. These findings may not be generalizable under different cultural
settings and with a diverse demographic of students. Regardless of the student demographics,
43
the overall suggestion does agree with the theory that mathematical ability is dependent upon the
type of items included in an assessment as well as the language included in the items, such as
mathematical and reading language. The conclusion of the study emphasizes the need for more
exploration into the dimensionality among test items.
Reardon et al. (2018) examined test scores from roughly eight million fourth and eighth-
grade students from the 2008-2009 school year. Using the data, the researchers sought to
determine if there was a relationship between test item format and male-female gender
differences in state achievement tests. Additionally, they wanted to test if there was an
association across grade levels and ELA and mathematics. The findings from the quantitative
study showed that the test item format could explain about 25% of the variation in state/district
level male-female achievement gaps. Additionally, the researchers found a negative relationship
between the gender achievement gap and the proportion of constructed-response items across
fourth- and eighth-grade students for ELA and mathematics. Since the study used data from
2008-2009 national assessments, such as the National Assessment of Educational Progress
(NAEP) and Northwest Evaluation Association (NWEA), the findings may not apply to more
recent testing. The study's primary purpose was to examine gender differences; racial
distinctions could have led to additional discoveries or differences among the students’
performance but were not reported.
In a quantitative study, Sangwin and Jones (2017) designed a study to test whether item
format, such as CR or MC items, and process direction, either direct or inverse, had an
interaction given reversible mathematics problems. Participants in the study included 26 females
and 90 males at a United Kingdom university; the race of the 116 participants was not
mentioned. The researchers measured two different mathematical processes on a 47-item
44
instrument with MC and CR, specifically, the verify/solve and expand/factor processes; only 40
items were analyzed for the study. The items included in the instrument tested only reversible
mathematics processes in items with exponential equations or linear equations in a single
variable. The researchers removed the answer choices and reworded some of the MC items to
create comparable CR items.
In Sangwin and Jones (2017), the findings from the analysis showed high internal
consistency with the test items, given a Cronbach’s alpha of α = .91. All the items loaded on one
component using explanatory factor analysis, reaching unidimensionality. The mean test score
for the participants was 68.8%, with a standard deviation of 19.1%. Using a 2 x 2 ANOVA,
Sangwin & Jones found format to be statistically significant at p < .001 and with an 11%
difference between MC and CR items. As predicted, the mean scores were higher for MC test
items compared to CR test items, 75.7% and 64.7%, respectively. Also, direct test items had a
higher percent accuracy than inverse test items; this difference was more pronounced in the CR
format than in the MC format. Sangwin and Jones noted, “when faced with an item involving
the inverse direction of a reversible mathematical process, students commonly solve a MC
version by verifying the options using a direct method, and not by undertaking the actual
calculation” (p. 218). Guessing could also aid students in the MC format, giving them an
advantage over CR items. The researchers suggest test developers implement more easily scored
CR items on high-stakes assessments compared to MC items. Some limitations of this study
included a small sample size with primarily male students; also, race information was not
provided. The study was conducted in the UK, and the results may not be generalizable to
students in the US. Lastly, the MC questions involved only had one answer as opposed to
multiple-correct solutions.
45
To test the reliability and efficiency of standardized test items, Wan and Henly (2012)
used data from a computer-based state standardized science achievement test for fifth-grade,
eighth-grade, and high school students. The researchers were interested in various traditional
and innovative item types. Traditional item types included multiple-choice (MC) items, and
innovative items included figural response (FR) and multiple constructed-response (CR) item
types. FR items include some graphic kind of functioning in the problem, such as images and
graphs.
Using confirmatory factor analysis, Wan and Henly (2012) found that CR items did not
discriminate as well as FR and MC test items. For eighth grade and high school students, MC
items were not as complicated as the FR items. As for the level of information obtained from the
varying item types, the researchers found that some items may be more beneficial to some levels
of test-takers than others. Examining the item types by grade levels, the findings were as
follows: the fifth-grade three-factor model showed that FR, MC, and CR items were highly
correlated, implying similar construct measurement (p. 71); for eighth grade, MC and CR had a
stronger correlation at .94 than CR and FR at .84; FR and CR measured somewhat different
constructs; lastly, high school level FR and MC items were shown to measure similar constructs
with an almost perfect correlation at .99 (p. 72).
Suggestions for key stakeholders related to standardized testing included providing more
CR items, both short- and extended-response items, since they provide more informative data for
educators (Wan & Henly, 2012). Although this study did examine standardized test items based
on item type, the focus was on science test items and not mathematics test items. There was no
indication that the findings from this study may be generalizable to other content areas such as
mathematics.
46
In a quantitative study by Kastner and Stangl (2011), constructed-response (CR) and
multiple-choice multiple-response tests were investigated. The research study conducted in
Vienna, Austria, included 13 graduate students in a Marketing course between the ages of 24 and
47; 62% of the students were female. The researchers used the Many-Facet Rasch Measurement
(MFRM; Linacre, 1994) approach to answer research questions gauged at identifying trends
among question format and scoring methods. Per MFRM, the FACETS analysis tool (Linacre,
2009a, 2009b) was used to compare the CR test with the MC multiple-response test using three
different scoring rules.
The scoring rules for the Kastner and Stangl (2011) study included the following: 1) All-
or-Nothing (AN), either the student selected only the correct responses or got a score of zero for
the item; 2) Number Correct (NC), which only counted the correct responses and ignored
incorrect responses; 3) University-Specific (WU), which rewarded partial credit considering
incorrect response selections. The study’s findings showed that CR and MC tests were
equivalent when using the NC scoring method. In addition, the NC scoring method was easier
for students since it did not penalize them for incorrect or non-selected items. However, AN and
WU scoring methods were more critical on student scores since students could be penalized for
over-or under-selecting answer choices.
Kastner and Stangl (2011) recommended using WU grading for multiple-choice multiple-
response items since it proved best for discriminating between students with varying ability
levels. Thus, Kastner and Stangl provided a compelling argument for examining the scoring
methods used for analyzing multiple-choice multiple-response test items. Unfortunately, the
study had a small sample size, and CR grading could be deemed inconsistent depending on the
47
test graders. Therefore, a study with a larger sample size, different demographics of students,
and various content measures should be investigated, specifically mathematics.
Hohensinn and Kubinger (2011) conducted a quantitative study to determine if different
response formats measured different latent traits and if the format of responses altered the item
difficulty level. Using a sample of 2,285 students in Austria, with 51.11% males and 48.89%
females, the researchers administered an 18-item German Language awareness test with three
different response formats: constructed response, multiple-choice with one out of six correct
responses, and multiple-choice with two out of five correct responses. The researchers
implemented two approaches for testing the first hypothesis regarding response format and latent
traits, a consecutive unidimensional approach based on the Rasch model (Rasch, 1980) and a
multidimensional approach using conditional maximum likelihood (CML). The findings from
the consecutive unidimensional approach showed that 17 out of the 18 items demonstrated a
good model fit, indicating the measurement of the same latent traits. Additionally, the
multidimensional approach had similar findings, all of which led to the rejection of the first
hypothesis.
Using the 17 good fit items for the model, Hohensinn and Kubinger (2011) proceeded to
test the second hypothesis focusing on item difficulty with the linear logistic test model (LLTM;
Fischer, 1995). The results of the LLTM did not fit the data well and instead suggested that
another factor influenced the item difficulty level for the assessment. The findings echoed
previous studies, with single-correct multiple-choice items deemed more accessible than
constructed response or multiple response test items. Henceforth, the study recommended test
developers consider multiple response items due to their increased difficulty over single-answer
multiple-choice items and economic advantage over scoring constructed response items.
48
Although the article covers the comparison of varying item response formats, including multiple-
select items, the content studied is under language and not mathematics. Additionally, the
context of the study may not be generalizable due to the lack of information regarding
participants’ race and age and differences in geographic location.
Conclusion for Mathematics Assessments
In the conclusion of this section related to mathematics assessments, several issues were
uncovered related to testing conditions and test format, including item types. Although most of
the studies were related to mathematics, a few focused on other content areas such as language
and science (Hohensinn & Kubinger, 2011; Kastner & Stangl, 2011; Wan & Henly, 2012).
Themes that arose from the studies mentioned above include the following: 1) educators, test
developers, and researchers should consider the cognitive properties of test items when
constructing an assessment; 2) some questions require more cognitive demand than others
(Gallagher et al., 2000). Next, the type of questions and item formats were more indicative of
student performance as opposed to the difficulty of the mathematics test items (Arbuthnot, 2009;
Davies et al., 2016; Gallagher et al., 2000; Moon et al., 2019; Reardon et al., 2018). Lastly, item
types other than single-select multiple-choice items should be included in assessments
(Hohensinn & Kubinger, 2011; Kastner & Stangl, 2011; Sangwin & Jones, 2017; Wan & Henly,
2012).
Limitations of these studies include the context and sample/population of students under
observation. Several of the studies were international (Davies et al., 2016; Hohensinn &
Kubinger, 2011; Kan, Bulut, & Cormier, 2019; Kastner & Stangl, 2011), not in a standardized or
high-stakes testing situation (Kastner & Stangl, 2011; Moon et al., 2019; Sangwin & Jones,
2017), and a limited number of studies explicitly examined multiple-select multiple-choice items
49
(Hohensinn & Kubinger, 2011; Moon et al., 2019). Given the lack of research related to MSMC
items, there presents a space for this current study to explore with a group of students that are
also underrepresented in mathematics literature.
Testwiseness in Mathematics
After reviewing the structure and context of standardized mathematics testing, it is
essential to explore the mental requirements for testing and problem-solving and other factors
that may contribute to the success of Black girls and women in mathematics. Mathematics is not
just about skill. According to several researchers, there are paramount factors that contribute to
an individual's success in mathematics. This section will explore the different strategies that
students could practice that positively impact performance in math. Additionally, this section
will examine instructional and personal variables that could affect the success of students
mathematically.
This section provides an overview of studies examining testwiseness and other predictors
of success in mathematics. Although the term testwiseness is not well known to most people, it
is something enacted often. Some students have developed such a skill to master an assessment
without even knowing all the content. According to Arbuthnot (2011), “testwiseness refers to an
individual’s ability to use the testing situation to increase his/her score, independent of the
construct being measured by the test” (p. 62). Examples of strategies involved in testwiseness
include test-taking, test preparation, problem-solving, and metacognitive strategies (Hong et al.,
2006; Peng et al., 2014). The studies summarized here address high school students; one study
focused on the United States (Hong et al., 2006), the other on China (Peng et al., 2014). Both
articles shared similar findings; for instance, planning out a strategy during testing and using
time management were among the few factors that led to increased mathematics performance.
50
In addition to math ability, some researchers have proposed other predictors of success in
mathematics such as instructional, demographic, and personal variables that directly influence
one’s performance in mathematics (Bancroft et al., 2017; Calderón-Tena, 2016; Kling et al.,
2012; McVoy, 2005; Schukajlow & Krug, 2014; Siegler et al., 2012; You & Sharkey, 2012). In
the context of this study, instructional variables include teaching methods, content selection, and
interventions. The articles related to instructional strategies suggest heavily teaching fractions
and division in elementary school (Siegler et al., 2012), teaching multiple solutions regularly
(Schukajlow & Krug, 2014), and offering affirmation lessons (Bancroft et al., 2017) to increase
students potential for success in mathematics. For demographic and personal variables, SES, and
ethnicity (McVoy, 2005), coursetaking history (You & Sharkey, 2012), and mental capabilities
(Calderón-Tena, 2016; Kling et al., 2012) were all factors suggested that impact one’s success in
mathematics.
Testwiseness Strategies in Mathematics
Hong et al. (2006) conducted a sequential exploratory mixed methods study to measure
the mathematical test-preparation and test-taking strategies of high-school students (n = 156)
from two private urban schools in the southwest region of the United States. The researchers
also observed differences between high-achieving and low-achieving students that were either
enrolled in Algebra II or a more advanced course. The first phase of their study included a
survey, the Activities and Accomplishment Inventory: Math (Milgram & Hong, 2002), followed
by student interviews.
The administered survey precisely measured Test-Preparation Strategies, Test-
Preparation Awareness, and Test-Taking Strategies. The responses for the Test-Preparation
Strategies section showed that reviewing (75%) and solving practice problems (59%) were the
51
most frequent cognitive strategies; all other strategies had no more than 26% selection rates. The
Test-Preparation Awareness section had the highest responses for competence (66%) and study
behavior (41%) in the Cognitive Awareness category; all other responses were insignificant.
Lastly, Test-Taking Strategies had the highest responses for sequencing (56%) in the Structural
Organization category and 46% for checking responses in the Cognitive Strategies category;
assessing and allocating time (30%) was the next most frequent response in this section. As for
differences between high- and low-achieving students, high-achieving students used more
cognitive strategies, managed study time better, felt more prepared for assessments content-wise,
considered structural organization for problem-solving more, and assessed the difficulty of test
items more than the low-achieving group.
The findings from the study showed that there were substantial differences between high-
and low-achieving students. Obtaining high test scores seemed more related to “systematic
approaches, such as assessing and sequencing” (Hong et al., 2006, p. 153). Although,
testwiseness and deep-level strategies seemed to be critical factors in student achievement, they
were not primarily examined in this study. An investigation into these constructs may prove to
be more imperative for future research studies. A more intentionally selected group of students
may also yield additional meaningful results for marginalized students, especially since race and
gender were not essential factors in this study.
In a 2014 quantitative study by Peng, Hong, and Mason, tenth-grade Chinese students
were tested for metacognitive and motivational strategies on a 16-item survey. The participants
included 182 males and 256 female students from Guangzhou, China. The researchers used
structural equation modeling to examine how test value, perceived effort, self-efficacy, test
tactics, test anxiety, and test performance were related based on student responses to the Test-
52
Taking Strategies Questionnaire (Hong & Peng, 2004). The significant findings from this study
showed that test tactics were directly affected by metacognitive strategies such as self-checking
one’s work, selecting appropriate strategies, and planning wisely. The researchers indicated that
effective strategies for test-taking included avoiding errors, omitting answer choices, proper time
management, and using context clues such as hints. Also, motivation proved to be a vital and
decisive factor in mathematics test performance. Suggestions for future studies included the
observation of such test-taking strategies in action on a standardized mathematics assessment. A
constraint of this study is that the sample students were from China, which might not be
generalizable to African American students in the United States.
Predictors of Success in Mathematics – Instructional Strategies
Siegler et al. (2012) conducted a quantitative study examining the effect of one’s earlier
knowledge of fractions around age ten and how that could determine mathematics achievement
in adolescents. Siegler et al. used two different samples, one derived from a British Cohort
Study (BCS; Butler & Bynner, 1980, 1986; Bynner, Ferri, & Shepherd, 1997) with 3,677
children from the United Kingdom, and another sample compiled from the Panel Study of
Income Dynamics-Child Development Supplement (PSID-CDS; Hofferth et al., 1998) in the
United States with 599 children. Children involved in the study were measured around age 10 to
12 in the first phase of the study and around age 15 to 17 in the second phase. According to the
researchers, the primary hypothesis tested “was that knowledge of fractions at age ten would
predict algebra knowledge and overall mathematics achievement in high school, above and
beyond the effects of general intellectual ability, other mathematical knowledge, and family
background” (p. 693).
53
After conducting bivariate and multiple regression analyses, Siegler et al. (2012) found
the data between the two samples were quite similar in that fraction mastery was a more
significant predictor of overall mathematics achievement for high school students, even more so
than algebra knowledge, respectively, r = .81 versus r = .73 in the United Kingdom and r = .87
versus r = .80 in the United States (2012). These findings support the researchers’ original
hypothesis that the development of fractions knowledge is critical to overall mathematics
achievement later in students’ lives. Furthermore, division was found to be the next most
significant factor in that success. Henceforth, Siegler et al. push for more robust instruction of
fractions and division early on in students’ academic lives for greater mastery of mathematics
content later in life. However, the data used in this study is relatively old; the latest test was
conducted in 2002 in the United States. Additionally, the demographics of the participants in
scarce; information regarding gender and race was not mentioned. A more in-depth look into
such factors could prove beneficial to students in today’s world.
In 2014, Schukajlow and Krug conducted a quantitative study in Germany across three
schools to determine if instructional strategies impacted the use of multiple solutions in
mathematics task problems. A sample of 145 ninth-grade students was included in one of two
conditions, multiple-solutions instruction or single-solution instruction. The mean age of the
participants was 15.2 years old, and 43% of the students were female. Students were randomly
assigned to a treatment condition while controlling for the ratio of males to females in each
group. The study included four instructors that taught both conditional groups for three sessions
of a five-lesson unit. The first two sessions were doubled and consisted of four lessons, roughly
85 minutes per session; the final session was a single class. In the multiple-solutions condition,
54
students were prompted to provide two solutions for each task; only one solution was required in
the alternative condition group.
According to Schukajlow and Krug (2014), the students’ performance in the different
conditions was statistically significant at p < .05, d = 1.08 in a regression analysis. Students in
the single-solution condition produced fewer multiple-solution answers compared to students in
the multiple-solutions condition. For instance, 75% and 38% of students found one solution in
the single- and multiple-solution conditions, respectively. As for more than one solution, 20%
and 58% of students found two or more solutions in the single- and multiple-solution conditions,
respectively. Confirming the researchers’ hypothesis, students in the single-solution condition
produced fewer multiple-solution answers than the students in the multiple-solution treatment
groups. The findings from this study supported other researchers' findings that students in the
multiple-solution teaching groups expressed higher competence, interest, and autonomy levels
than students in the single-solution groups. A limitation of this study was that the participants
were from Germany. It would be worth studying solution choices in mathematics amongst
students in the United States, especially African American female students, an under-researched
group.
In 2017, Bancroft et al. conducted a quantitative study amongst three public high schools
in Houston, TX. The researchers sought to determine if an intervention requiring students to
acknowledge and expand upon positive affirmations would increase mathematics performance.
The hypothesis for the study was that students in the treatment group, those undergoing positive
affirmation activities, would outperform students in the control group, with students asked to
write about insignificant values. The three high schools were quite diverse in student
demographics, each a member of the Houston Independent School District (HISD). Of the ninth-
55
grade students participating in the study, 200 Hispanic and 13 African Americans were in the
control group for the first high school; the treatment group had 210 Hispanic and 10 African
American students. In the second high school, there were 88 African American and 17 Hispanic
students in the control group and 95 African American and 13 Hispanic students in the treatment
group. At the final high school, White students were included in the study. There were 109
Hispanic, 84 African American, and 97 White students in the control group. The treatment
group consisted of 129 Hispanic, 84 African American, and 90 White students. Using stratified
random sampling, Bancroft et al. separated the students into two conditions and asked teachers to
lead the experiment.
In Bancroft et al.’s (2017) study, teachers were responsible for ensuring a safe space for
students to openly engage in their writing activities. Students in the treatment group were asked
to focus on writing about two to three values of utmost importance to them and explain why they
were important. Control group students participated in a traditional writing assignment. The
prompt writing activities were administered in four waves across the academic school year, each
before a major exam; only the first and fourth waves were analyzed for this study. The
independent variables were race, gender, and condition (treatment, control); the dependent
variables were student mathematics performance on the PSAT and STAAR Algebra I exams.
Using regression analyses, Bancroft et al. (2017) found no significant findings except for
student track or course enrollment. Treatment group students enrolled in AP/IB and pre-AP/IB
courses outperformed students in the control group; this finding was significant at the p < .001
level. The conclusions of this study negate previous research implying suggestions for future
studies. The researchers recommend administering the study longer than one academic school
year and controlling for student abilities in each condition; specifically, the researchers should
56
ensure similar baseline achievement between the two groups. Since the academic track was
significant, the researchers also suggest that students in higher-performing or more advanced
courses may benefit more from positive affirmation activities than regular education groups. A
further investigation into more advanced mathematics courses is warranted. Additionally, an
inquiry with older students could yield varying results as well.
Predictors of Success in Mathematics – Demographic and Personal Variables
In 2005, McVoy conducted an explanatory sequential mixed-methods study in a large
suburban and urban public school district in the South. McVoy sought to determine how gender,
ethnicity, SES, and attitude affect eighth-grade algebra class achievement. Participants for the
study included randomly selected students from four classes of algebra students from different
schools. Of the 107 participants, 61 girls and 46 boys, 53 White and 54 non-White students, and
76 students whose parents had some college education or more. The independent variables
included attitude towards mathematics, gender, ethnicity, and parents’ highest education level to
measure SES. The dependent variables included the North Carolina State End-of-Course
Algebra I Test and the North Carolina State End-of-Grade Test for Eighth Grade. For the study,
McVoy administered a 36-item, 5-point Likert scale questionnaire and a pre- and post-test during
the school year. Quantitative analyses included two 2 x 2 x 2 x 3 (Gender x Ethnicity x SES x
Attitude) ANOVA tests, a t-test comparing pre- and post-attitude scores about mathematics, and
a one-way ANOVA comparing end-of-course and end-of-grade performance for the four
different teachers’ classes. For additional measures, McVoy conducted student and teacher
interviews to corroborate and interpret the quantitative findings.
In McVoy’s (2005) study, there were several findings. For the end-of-course test, the
results from the 2 x 2 x 2 x 3 ANOVA found SES and ethnicity as having significant main
57
effects at F(1, 89) = 6.997, p < .05, and F(1, 89) = 81.628, p < .05, respectively. For the end-of-
grade test, attitude, F(1, 90) = 3.162, p < .05; SES, F(1, 90) = 9.298, p < .05; and ethnicity, F(1,
90) = 62.785, p < .05, all revealed significant main effects. The t-test found a substantially
greater dislike for mathematics after students completed Algebra I, emphasizing that students
tend to grow an aversion to the subject with more complex material. In the one-way ANOVA
test among teachers, there were differences found among the teachers’ classes, further explained
by the interview data. The qualitative findings showed similarities in curriculum use and class
materials across the four schools; however, teacher quality and experience were an issue at one
of the schools more so than the other three. Of the four teachers in the study, three had
significant experience, while one was a novice. The novice teacher’s students had the lowest
performance on both the end-of-course and end-of-grade tests. Interviews highlighted the lack of
structure, classroom management, and content expertise of the novice teacher. Additionally, the
interviews identified a discrepancy among the proportion of ethnic groups and algebra course-
taking; primarily, “most White students were in the gifted program, and most minority students
were in the regular [education] program” (p. 133).
According to McVoy (2005), ethnicity and SES had the most significant impact on
algebra achievement. This information could be most beneficial to school leaders and
instructors. McVoy suggests, “Researchers should examine the manner in which students learn
particular mathematical processes, such as reasoning and problem solving, to identify strengths
and weaknesses of particular groups” (p. 134). One critique of this study is the sample size; the
researcher could have examined a larger, more diverse sample of participants. Roughly half of
the participants in this study were White; information regarding the number of African American
students was not disclosed.
58
In a quantitative study by Kling et al. (2012), researchers sought to determine the extent
that conscientiousness could predict student achievement as measured by grades. Specifically,
Kling et al. hypothesized that since women have been considered more conscientious than men,
they would earn better grades than men. Using three different samples across the span of 1992
and 2005, the researchers conducted multiple regression analyses to determine if the findings
from the different samples yielded similar results. Sample 1 came from the University of
California at Berkley in 1992. The sample consisted of 56% female and 44% male students
ranging from the ages of 17 to 30. Of the participants, there were 7% African American, 36%
Caucasian, and 43% Asian students. The second sample of students came from a small college
in Minnesota, Carleton College, from the Spring 2000 semester. The 118 participants ranged
from 18 to 24 years old, 84% White, and 58% female. The final sample of students was
recruited from the University of California at Davis between 2002 and 2005. The sample
consisted of 10,492 undergraduate students, 63% female, ranging from 18 to 30 years old. The
demographics were similar to sample 1, with 2% African American, 34% Caucasian, and 42%
Asian students. Each sample used a different instrument containing a conscientiousness scale;
instruments included the NEO-FFI (Costa & McCrae, 1992), NEO-PI-R (Costa & McCrae,
1992), and the Big Five Inventory (John et al., 2008).
Findings from the Kling et al. (2012) study show that conscientiousness played a
significant role in GPA Underprediction and was also mediated by gender at a significant level.
In support of the researchers’ hypothesis, women were found to have higher grades than men, as
explained by their degrees of conscientiousness. The importance of this study should be echoed
in reference to admission decisions, mainly since test scores are used for selection in most cases.
A few issues with this study include the age of the data presented; the data is from 2005 and
59
earlier. Additionally, the number of African American students included was considerably low
in all three samples—7%, 4%, and 2%, respectively.
You and Sharkey (2012) conducted a multi-group logistic regression study to determine
the extent of social and cognitive factors on mathematics coursetaking for male and female
students. Their study uses data collected from the Educational Longitudinal Study of 2002
(ELS:2002; NCES, 2011) and consisted of 16,373 tenth graders in the United States; students
were recruited across 751 public and private schools in the nation. Using social cognitive theory
(Bussey & Bandura, 1999) and expectancy-value theory (Eccles, 2004), You and Sharkey (2012)
investigated equifinality among the students; equifinality was defined as “the same outcome
despite different pathways or groups of factors leading to success” (p. 484). The factors
measured in the study included family background, academic aspirations, parental involvement,
peer influences, cognitive variables such as mathematics self-concept and affection, and
coursetaking outcomes.
For the tenth graders, You and Sharkey (2012) identified advanced mathematics courses
as Trigonometry, Pre-calculus, and Calculus. Of the 16,373 participants, approximately 12%
had taken Calculus, 16% Pre-calculus, and 16% Trigonometry by the end of their sophomore
year in high school. Students most likely to have taken advanced mathematics classes were
native English speakers, Asian, from a two-parent household, and had a high SES. For Calculus,
only 3.6% of African American students completed the course compared to 30.4% Asian and
14.1% White students; by the completion of their 10th grade year, 65.4% of African Americans
did not take an advanced mathematics course. Additional findings showed that female students
surpassed boys in advanced mathematics coursetaking behaviors and college aspirations, yet they
fell slightly short in mathematics performance. Mathematics coursetaking was strongly
60
associated with one’s mathematics self-concept. You and Sharkey suggest “interventions [that]
might focus on group learning experiences that allow [girls] to develop their math self-concept
with other girls who also value advanced mathematics coursetaking” (p. 488). Given future
studies, it would be interesting to see the individual group differences in coursetaking patterns
and mathematics performance further explored for African American female students.
Calderón-Tena (2016) conducted a quantitative study examining 447 special education
students from an urban elementary school district in the southwest United States. The
participants had a mean of 10.23 years of age. Twenty-seven percent of the students were female
students, and 73% male students. A majority of the students were White (45%), 35% were
Hispanic, and 9% were African American. The study examined the different types of
intelligences, cognitive factors influencing students’ learning processes and behaviors and tested
how these factors affect mathematics achievement. The two main types of intelligence guiding
this study were fluid and crystallized intelligence. Fluid intelligence comes from using reasoning
and logic in novel experiences. Crystallized intelligence is the product of a culmination of
practicing and repetition.
Using structural equation modeling, Calderón-Tena found that long-term retrieval and
working memory predicted calculation complexity (2016). Phonetic coding synthesis, visual
processing, and perceptual processing speed predicted calculation fluency. Both calculation
fluency and complexity were highly correlated. Problem-solving was positively and highly
correlated with calculation fluency and complexity. It was also projected by perceptual
processing speed, working memory, crystallized knowledge, and fluid reasoning (2016).
For Calderón-Tena’s (2016) study, all hypotheses were considered statistically significant
(2016). Problem-solving was considered stronger for younger students using fluid knowledge;
61
the reverse was true for older students, all of whom were driven by crystallized intelligence. A
limitation of this study was that most of the participants were White students, with only a tiny
percentage of African American students. Additionally, this study examined elementary special
education students. This study would require further research if the results were expected to be
generalized to other racial groups and targeted high-ability students.
Conclusion for Testwiseness in Mathematics
In summary of testwiseness in mathematics, a few findings were noteworthy.
Testwiseness, as previously defined, is not necessarily about always knowing the content of the
assessment but rather knowing how to use specific strategies to increase one’s chance of
performance on the assessment (Arbuthnot, 2011). The studies presented here describe several
trends in test-taking, motivation, and test preparation that could lead to higher performance in
mathematics. For instance, Hong et al. (2006) found vast discrepancies between how high-
achieving and low-achieving students used strategies before and during assessments. It was
found that high-achieving students implemented cognitive strategies more frequently than low-
achieving students (Hong et al., 2006); Peng et al. (2014) produced similar findings.
In addition to one’s strategy usage in mathematics, several other factors proved to
indicate student success. The students did not mediate these factors; however, they were enacted
upon them, given certain circumstances. Teachers, parents, and other outside factors tend to
impact students in mathematics. According to the researchers, factors such as race, SES, type of
parent household, instructional methods, conscientiousness, and coursetaking behaviors all
affected students’ experiences in mathematics (Bancroft et al., 2017; Calderón-Tena, 2016; Kling
et al., 2012; McVoy, 2005; Schukajlow & Krug, 2014; Siegler et al., 2012; You & Sharkey,
2012). Limitations for these studies predominantly include the demographic of students
62
involved in the studies. None of the studies presented focus exclusively on African American
students or even have a large African American sample.
Literature Review Conclusion
Based on the literature included in this review, several issues arose that warrant further
investigation and provide the basis for the current study. In the first section focused on Black
girls and women in mathematics, a limited number of empirical studies concentrate specifically
on this group of students. This discovery could imply that Black girls and women are invisible
in mathematics (Joseph, 2017) and deserve more attention for their unique abilities and
experiences outside of a stereotype threat or deficit context. Several of the studies included in
this section were primarily qualitative (Booker & Lim, 2018; Borum & Walker, 2012; Joseph,
2017; Joseph et al., 2019; McGee & Bentley, 2017; Moody, 2004). Black girls and women
deserve to be acknowledged in more quantitative and mixed methods studies (Young et al.,
2018).
The following section regarding mathematics assessments showcased how testing
conditions, test structures, and item types play a significant role in students’ mathematics
performance. With gender and mathematics item types, it was shown that males and females
perform differently depending on the type of strategies required for the test item, either
conventional or unconventional (Arbuthnot, 2009; Davies et al., 2016; Gallagher et al., 2000).
Most students were reported using algorithmic or conventional strategies primarily that are easy
to check for accuracy or require procedures; girls and women used these strategies
predominantly (Arbuthnot, 2011; Gallagher et al., 2000). Several studies also focused on more
traditional items such as single-select multiple-choice and constructed-response items (Kastner &
Stangl, 2011; Reardon et al., 2018; Sangwin & Jones, 2017; Wan & Henly, 2012). Due to the
63
lack of consideration for multiple-select multiple-choice (MSMC) test items, there should be a
focus on examining these types of items with underrepresented student groups in mathematics,
such as Black girls and women.
For the final section on testwiseness in mathematics, researchers investigated the types of
test strategies and predictors of success in mathematics. According to Hong et al. (2006), the
most common test-taking strategies that lead to success in mathematics require cognition, proper
time management, and assessment of item difficulty levels. Peng et al. (2014) add that
motivation plays an additional key factor in a student’s success in mathematics. Outside of test
strategies and motivation, factors such as gender, race, socioeconomic status, classroom
instructional choices, and coursetaking behaviors were mentioned to impact student success in
mathematics (Bancroft et al., 2017; Kling, McVoy, 2005; Schukajlow & Krug, 2014; Siegler et
al., 2012; Engel et al., 2012; You & Sharkey, 2012). Unfortunately, most of these studies did not
have an intersectional focus on Black girls or women in mathematics testing. Henceforth, this
present study provides a platform for examining cognitive processing and testwiseness of Black
girls and women on multiple-select multiple-choice (MSMC) test items in mathematics.
64
CHAPTER 3. RESEARCH DESIGN & METHODOLOGY
This study aimed to determine how to increase African American girls’ and women’s
performance in mathematics using multiple-select multiple-choice (MSMC) items in
standardized mathematics assessments. To do so, the researcher had to understand how African
American girls processed and performed on MSMC mathematics test items compared to other
test item types. The research questions previously mentioned that guided this study include the
following:
1. How do sixth-grade African American girls at an urban charter school perform on
multiple-select multiple-choice (MSMC) mathematics test items compared to single-
select multiple-choice (MC) and short-answer constructed-response (CR) items?
2. How do sixth-grade African American girls at an urban charter school process MSMC
items cognitively?
3. How has teaching during a pandemic impacted the mathematical trajectory of sixth-grade
African American girls at an urban charter school?
4. What insights into the sixth-grade African American girls’ cognitive processes and
experiences during a pandemic do the interviews offer about the results from the
mathematics assessment?
To answer the research questions, a mixed methods research design was most appropriate. The
following section defines and describes the researcher’s position, specific research design used,
the study participants, procedures for data collection, instruments, procedures for data analysis,
and study limitations.
65
Positioning of the Researcher
As researchers, we all bring individual perspectives and experiences to the research
process. Due to those individual differences, how we approach, conduct, and interpret mixed-
methods research will always be dependent upon the individual. According to Plano Clark and
Ivankova (2016), three major topics are critical to the personal contexts associated with mixed
methods research practices: philosophical assumptions, theoretical models, and background
knowledge. Philosophical assumptions are defined as “beliefs and values about the nature of
reality” (p. 196). Theoretical models are characterized as “assumptions about the nature of a
substantive topic, including how it works in the world” (p. 197). The last factor is background
knowledge, defined as the “personal and professional experiences and expertise…that provide
the experiential foundation for a mixed methods research study” (p. 204).
Three major components of a philosophical assumption are ontology (reality),
epistemology (way of knowing), and axiology (values). Of the major philosophies, pragmatism
seems to associate best with the research questions. Pragmatism can be described by diverse
viewpoints about reality, the belief that knowledge is gained through “iterations of independent
observations and subjective constructions” (Plano Clark & Ivankova, 2016, p. 199), and how
research questions and conclusions are directly tied to the researcher’s values. Studying a
phenomenon of any kind can always be strengthened by using multiple methods of inquiry. For
instance, seeking to understand Black girls in mathematics by using a mathematics assessment
and interviews allows for a deeper understanding as opposed to using only one of these methods.
As for the research process, research questions guide everything about a study and require the
utmost consideration.
66
Theoretical frameworks are critical to a research study and provide the overall
foundation. Considering the research topic, employing multiple theories to better understand
Black girls in mathematics allows theoretical frameworks such as Black Feminist Thought,
intersectionality, and multiple approaches to understanding, to be utilized as a basis for this
research study. As for background knowledge, the studies that researchers choose to pursue are
most likely tied to that person’s own experiences and areas of interest, as suggested by Plano
Clark and Ivankova (2016). The foci of the researcher surround Black students, mathematics,
females, and standardized testing. As a Black woman in mathematics, these interests are based
on personal experiences working directly with standardized mathematics testing as an educator.
In summary, philosophical assumptions, theoretical orientations, and background knowledge are
all critical in research. By identifying one’s stance on each of these concepts, researchers should
be better able to justify how they approach their research and how their research adds to existing
knowledge.
Research Design
A research design is a procedure for collecting and analyzing data to study the research
problem and answer the related research questions. In a mixed-methods research design, both
quantitative and qualitative data are collected and analyzed. According to Creswell (2012), “The
basic assumption is that the uses of both quantitative and qualitative methods, in combination,
provide a better understanding of the research problem and question than either method by itself”
(p. 535). Johnson et al. (2007) add that mixed methods should be used “for the broad purposes
of breadth and depth of understanding and corroboration” (p. 123). This study explored African
American girls and women in mathematics testing using MSMC items by employing quantitative
and qualitative data. Specifically, this study utilized an explanatory sequential mixed methods
67
design (see APPENDIX J), in which quantitative data were collected and analyzed first, followed
by qualitative data to explain the quantitative results (Creswell & Plano Clark, 2018). The
quantitative component consisted of a 15-item Expressions and Equations mathematics
assessment with three mathematics item types (i e., MC, MSMC, and CR). The qualitative
component comprised retrospective think-aloud interviews with African American girls
describing their thought processes for answering specific mathematics assessment items. An
additional qualitative component included interviews of the mathematics teachers to provide
supporting context and information regarding the school year.
Participants
Participants for this study included sixth-grade students and their mathematics teachers in
the southeastern United States. Nonprobalistic sampling was used to capture the study
participants; non-probability sampling encompasses “selecting individuals who are available and
can be studied” (Creswell & Plano Clark, 2018, p. 177). Unfortunately, due to the COVID-19
pandemic, the researcher could not meet with the students to discuss participation in the study.
Instead, student participation was solicited through teachers. Although the primary analysis
focused on African American female students, all sixth graders were provided access to
participate in the study, approximately 120 students. For any male or female student
volunteering their time to take the mathematics assessment, they were rewarded with a gift
certificate to Chick-Fil-A, Raising Cane’s, or Amazon. Additionally, their teachers were
provided with assessment feedback on their students’ overall test performance for the
Expressions and Equations domain.
68
Quantitative
Due to a lack of participation initially, there were two rounds of data collection among
the participants. In the first round, 23 participants completed a parallel sixth-grade Ratios and
Proportions assessment; although 62 students opened the assessment, only data for completed
assessments were retained. For female students, eight identified as Black or African American
(62%), two as Hispanic American (15%), and three as White American (23%), for a total of 13
females. As for the ten male participants, nine identified as Black or African American (90%),
and one identified as Asian American (10%). As for age, the youngest participants were ten
years old (n = 2, 9%), most of the participants were 11 years old (n = 14, 61%), and the
remaining participants were either 12 or 13 years old (n = 7, 30%). Other issues identified with
the first administration were the length of time students took the assessment and multiple
attempts. Some students started the assessment in one sitting and returned to finish it over
multiple days; other students took the assessment more than once. Using the first round of the
assessment administration as a pilot, another administration was given to the sixth graders
adjusting the permissions of the assessment in Qualtrics. Data from the first administration was
not included in this study’s analysis.
In the second round of testing, 57 participants completed the sixth-grade Expressions and
Equations assessment (see Table 3.1). Of the 57 participants, 24 students were female (42%),
and 33 were male (58%). As for racial-ethnic groups, 39 students identified as Black or African
American (68%), 12 students identified as Hispanic American (21%), and the remaining students
identified as White American (n = 3, 5%), Asian American (n = 1, 2%), or did not provide an
answer (n = 2, 4%). Out of the 24 female students, 18 were Black or African American (75%),
four were Hispanic American (17%), and two were White American (8%). Out of the 33 male
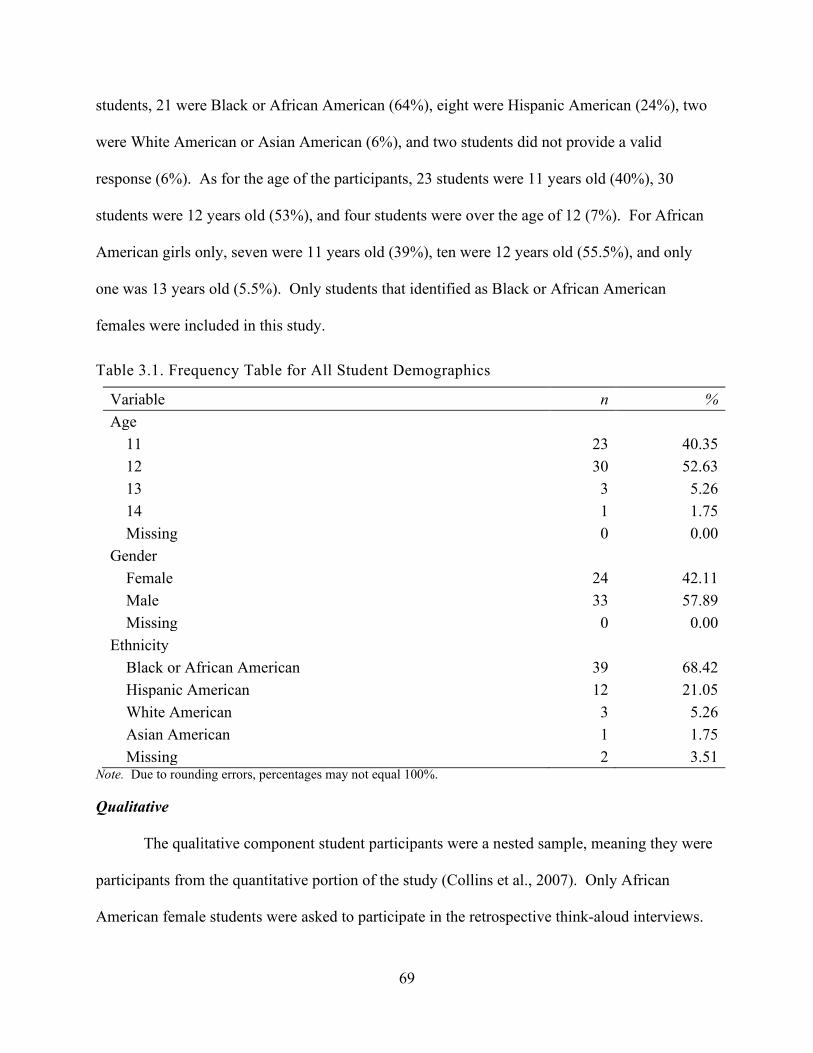
69
students, 21 were Black or African American (64%), eight were Hispanic American (24%), two
were White American or Asian American (6%), and two students did not provide a valid
response (6%). As for the age of the participants, 23 students were 11 years old (40%), 30
students were 12 years old (53%), and four students were over the age of 12 (7%). For African
American girls only, seven were 11 years old (39%), ten were 12 years old (55.5%), and only
one was 13 years old (5.5%). Only students that identified as Black or African American
females were included in this study.
Table 3.1. Frequency Table for All Student Demographics
Variable n % Age 11 23 40.35 12 30 52.63 13 3 5.26 14 1 1.75 Missing 0 0.00 Gender Female 24 42.11 Male 33 57.89 Missing 0 0.00 Ethnicity Black or African American 39 68.42 Hispanic American 12 21.05 White American 3 5.26 Asian American 1 1.75 Missing 2 3.51
Note. Due to rounding errors, percentages may not equal 100%.
Qualitative
The qualitative component student participants were a nested sample, meaning they were
participants from the quantitative portion of the study (Collins et al., 2007). Only African
American female students were asked to participate in the retrospective think-aloud interviews.
70
The desired number of think-aloud participants was ten students; however, according to Creswell
(2002), he recommends approximately three to five participants for a case study (as cited in
Collins et al., 2007, p. 273). After completing the assessment, a display logic was used in
Qualtrics to solicit interview interest to Black girls only. Of the 18 students meeting the criteria,
12 girls mentioned they would like to participate in the interview.
Of the 12 girls interested, only ten returned the appropriate parental consent and child
assent forms required for participation. In the end, only five girls completed their interviews; the
others were no longer available. Pseudonyms were used for each student to protect their
identities. Three interviewees were 11 years old: Madison, Allison, and Jasmine; the other two
interviewees were 12 years old, Emma and Tiffany. None of the ten approved interview
participants answered a multiple-select multiple-choice item correctly on the math assessment
using the prescribed scoring method.
The last group of participants consisted of the students’ mathematics teachers. Both
teachers were males between the ages of 25 and 34. The first teacher identified as a White, non-
Hispanic; for anonymity within this study, this teacher will be referred to as Mr. Roberts. Mr.
Roberts is an experienced classroom teacher with more than six years of teaching mathematics.
He earned a Bachelor’s degree in Secondary Education in Mathematics, followed by a Master’s
degree in Education Curriculum. Mr. Roberts has received his certification to teach
mathematics; although he is currently teaching sixth-grade mathematics, he has also taught
fourth- through eighth-grade Math, Algebra, Algebra II, and Precalculus. The second male
teacher identified as Black or African American, non-Hispanic; he will be referred to as Mr.
Smith for this study. Mr. Smith received his Bachelor’s degree in Political Science and is
currently working on his Master’s degree in Mental Health Counseling. He is within his first
71
five years in the classroom and is not a certified teacher. Before teaching sixth-grade
mathematics, Mr. Smith served as a mathematics tutor at the current school. Both teachers
provide relevant context to this study, considering they worked alongside our participants during
the global health pandemic of COVID-19.
Procedures for Data Collection
For this study, data were collected through two means, a mathematics assessment
followed by a retrospective think-aloud interview with select students and follow-up teacher
interviews.
Quantitative
The procedures for the quantitative phase of the study included first gaining access to
administer the assessment to the students. Upon agreement to participate from the school
leaders, sixth-grade mathematics teachers were given the link to the mathematics assessment to
share with their students. Then, voluntarily, all students were instructed to take the Ratios and
Proportions mathematics assessment outside of class time in the pilot administration before they
left for Winter Break. A second round of testing was administered a few months after the pilot
administration but during class time with a parallel assessment in Expressions and Equations.
Qualitative
The procedures for the interviews included soliciting consent from the students
volunteering to be interviewed. Following the mathematics assessment, African American girls
were given the option to participate in a follow-up interview. For those interested, parental
consent and child assent forms were shared and requested to be returned within a week. Of the
12 students, only ten returned the appropriate forms. Once forms were received, parents were
contacted to schedule interview times with students. Students were provided with a Zoom link
72
for the interview in which they were presented with the multiple-select multiple-choice items
from the original Expressions and Equations assessment in PowerPoint format. Students were
asked to vocalize their thought processes and strategies for solving each MSMC test item during
the think-aloud interviews.
Participants were reminded of the anonymity of their responses and their right to
withdraw from the interview at any time; all participants that started the interview completed the
task. While an interview protocol was used, the interviews were semi-structured. Some student
interviews required additional prompting when students either got quiet or failed to explain their
thought processes or thinking fully. Although Zoom was used to record and transcribe student
responses, additional notes were taken throughout each interview. After the interviews, notes
were reviewed, and transcriptions were analyzed alongside audio recordings to ensure
consistency of interviewees’ responses.
In the final phase of the study, mathematics teachers were asked to provide additional
context regarding the pandemic school year. The procedures for the teacher interviews included
emailing to discuss interest and availability. Upon confirmed interest, teachers were provided
with a consent form and asked to provide demographic information regarding their educational
and professional backgrounds. The semi-structured teacher interviews were scheduled outside of
school time and conducted via Zoom with the researcher. During the interviews, additional
questions were prompted based on participant responses for clarity. Following the interviews, all
Zoom transcripts were verified to ensure consistency with auditory statements.
Instruments
Instruments necessary for this study included the mathematics assessment, internet-
enabled devices, the assessment platform such as Qualtrics, and a virtual recording tool such as
73
Zoom. The mathematics assessment focused on content from the Expressions and Equations
domain in sixth-grade mathematics; all items were aligned to the Louisiana Student Standards
for Mathematics (LSSM; Louisiana Department of Education, 2017), the Louisiana version of
the Common Core State Standards for Mathematics (CCSSM; Common Core State Standards
Initiative, 2009). The assessment consisted of five topics within the Expressions and Equations
domain: Equivalent Expressions, Verbal Expressions, Distributive Property, Solving
Equations/Inequalities, and Equation/Inequality Word Problems. Each topic consisted of three
different versions: single-select multiple-choice (MC), multiple-select multiple-choice (MSMC),
and short answer constructed response (CR) items. Following the mathematics assessment,
African American female students responded to an interviewer via Zoom with how they solved
the MSMC items from the assessment. PowerPoint was also used as a slideshow for participants
to read the MSMC items aloud from the screen and then solve verbally. Once student interviews
were completed, teachers responded to follow-up questions via Zoom using PowerPoint to
present the interview questions.
Data Analysis Procedures
Quantitative
For quantitative data analysis, participant data from the mathematics assessment was
exported to and analyzed in Statistical Package for Social Sciences (SPSS). Data was first
screened and cleaned, ensuring no missing data and proper scoring; only completed responses
were analyzed. For the multiple-select test items, Qualtrics scored the items giving partial credit.
These items had to be re-scored manually using the All-or-Nothing (Kastner & Stangl, 2011)
criteria relative to the LEAP 2025 assessment; specifically, credit may only be given if a student
74
selects only the correct answer choices. According to the Louisiana Department of Education
(2020), the exact language describing methods for multiple select items is as follows:
Multiple Select (MS) – This item type asks students to choose more than one correct answer and may appear as a one-part question, as part of a two-part question, or as a part of a CR item. Whenever this item type is used, the question always identifies in boldface print that more than one answer is required. The question may or may not specify the exact number of correct answers. The MS items are worth one point. Students must choose all correct answers and no incorrect answer can be chosen. (p. 9)
Next, participant responses were scored into four item response categories: MC, MSMC, CR,
and Total scores. Each category consisted of the sum of the correct responses for each item type;
for instance, a respondent’s score for MC was the sum of the correct responses out of the five
total MC items. An example of this scoring metric is that if a student answered only MC1 and
MC3 correctly, their score for the MC item type was two out of five. Descriptive statistics and
frequencies were ran based on demographic information provided by the participants.
Black Girls’ Mathematics Performance. The first research question examined only
Black or African American girls and their performance on the three different item types,
multiple-choice, multiple-select, and constructed response items. The null hypothesis for the
first research question is that there is no difference in performance for any of the three item
types. The alternative hypothesis is that there is a difference in performance on the three
different item types. The statistical analysis to answer the first research question was a repeated-
measures analysis of variance (ANOVA). The model consisted of one sample (Black girls) with
the within-subjects factor of the three different test item types: MC, MSMC, and CR. Each item
type had a maximum possible score of 5 points. Black girls served as their own control in this
repeated-measures design since they answered items from each item type group. Since the test
items within each topic were designed to only differ in item response, performance differences
could be attributed to item type.
75
Before running the repeated-measures ANOVA, the following assumptions had to be
tested: independence, normality, and sphericity. All participants were independent of one
another. For testing the assumption of sphericity, Mauchly’s Test of Sphericity’s p-value was
greater than .05 (p = .072); the assumption of sphericity held. As for normality, Kolmogorov-
Smirnov and Shapiro-Wilk tests were violated since p-values were less than .05 for all item
types. Tests for normality assume that the data is normally distributed. If the null hypothesis is
rejected, then the data is not normally distributed. Since p < .05 for all variables for both tests,
the null hypothesis was rejected, and a nonparametric test was justified. Since it was determined
that the data violated the normality assumption, Friedman’s non-parametric alternative to the
repeated measures ANOVA was used instead.
Qualitative
For the qualitative component of the study, retrospective think-alouds of student
responses solving MSMC test items and teacher interviews providing additional context were
transcribed from Zoom and cleaned for accuracy of respondents’ statements. The student
transcriptions were coded for themes in how students processed and then approached solving the
multiple-select test items. Additionally, various scoring methods were applied to test how they
impacted the participants’ performance on the multiple-select multiple-choice test items. The
teacher interviews were coded for themes about how the pandemic impacted the school year,
mathematics instruction and assessment, and student learning for the domain, Expressions and
Equations.
Mathematics Cognition. The second research question explored how African American
girls processed the multiple-select multiple-choice mathematics test items cognitively. For this
research question, the unit of analysis was each of the African American girls. For analyzing a
76
collective case study, Creswell and Poth (2018) recommended two analyses: within-case and
cross-case analyses. In within-case analysis, the researcher provides a “detailed description of
each case and themes within the case” (p. 100). After each participant receives a within-case
analysis, then “a thematic analysis across the cases” (p. 100) is conducted; Creswell and Poth
refer to this thematic analysis as a cross-case analysis. In this study, each African American girl
participant was analyzed individually for their responses to the five multiple-select multiple-
choice items first, followed by a cross-case analysis for common themes among their collective
responses.
Teacher Context. The third research question investigated additional context from the
teachers’ perspectives. Once the student participants’ data were analyzed, teacher follow-up was
warranted to provide additional context. According to Lawrence-Lightfoot and Davis (1997),
context “is used to put people and action in time and space and as a resource for understanding
what they say and do” (p. 41). Considering the unorthodox school year due to the novel
coronavirus, teachers had a unique perspective and could provide valuable information that could
highlight findings among the student responses. Like the analysis in research question two, the
teacher interviews were analyzed individually first (i.e., within-case analysis) and then compared
for thematic cross-case analysis.
Mixed Methods
The final research question guiding this study is a mixed-method research question. This
question used the participants and data from both the quantitative and qualitative components of
this study combined.
Integration of Results and Findings. The final research question sought to use the
interviews from the teachers and students to explain the results from the 15-item mathematics
77
assessment on Expressions and Equations. Per explanatory sequential mixed methods research,
the findings from the student think-alouds and teacher interviews were used to support the results
from the mathematics assessment. According to Creswell and Plano Clark (2018), there are
three phases of data analysis for the integration procedures for an explanatory sequential design.
In the first phase, the researcher analyzes the results from the quantitative data (2018). In the
second phase, the qualitative data is analyzed (2018). Finally, the last phase consists of
analyzing “how the qualitative data helps to explain the quantitative data to answer the mixed
method question” (p. 235).
Legitimation
In mixed methods research, researchers must take precautions to ensure the legitimation
or validity of the information collected and analyzed. Collins et al. (2007) mentioned that
legitimation is one of four challenges in conducting mixed methods research; the other
challenges include representation, integration, and politics (p. 268). Additionally, legitimation
has been deemed a more significant challenge in mixed methods research compared to
monomethod studies, such as solely qualitative or quantitative (2007). According to
Onwuegbuzie and Johnson (2006, as cited in Collins et al., 2007), “The challenge of legitimation
refers to the difficulty in obtaining findings and/or making inferences that are credible,
trustworthy, dependable, transferable, and/or confirmable” (p. 269).
Quantitative
For the mathematics assessment, the goal was to ensure the accuracy of the data.
Therefore, student responses from the mathematics assessment were imported directly from
Qualtrics to Excel. Since Qualtrics did not provide a representative score for the multiple-select
multiple-choice items, these items were hand scored by the researcher and verified by the
78
teachers that the scores matched their students’ responses. As mentioned previously, a student
could only receive a point for an MSMC item if they selected only the correct answer choices.
For instance, if the correct answers were A and B, but a student selected A, B, and C or only
selected A, then the student received a score of 0 for that item. Once all items were adequately
scored, the data were then imported into SPSS for analysis. A feature of Qualtrics used for this
study to ensure no missing was the selection of only complete responses; henceforth, if a student
did not complete the assessment, their data was not recorded. Additionally, a student could only
insert demographic information and select a gift certificate at the end of the assessment to ensure
the assessment items were completed, a lesson learned from the pilot study.
Qualitative
As for the qualitative section of this study, all interviews for both teachers and students
were recorded on Zoom. After each interview, the researcher replayed the audio and verified
that the transcriptions matched the recording of the interview participants and interviewer. In
addition, after each interview was transcribed for accuracy, the transcripts were imported into
Word documents and analyzed physically by the researcher then recorded in ATLAS.ti; this
qualitative data analysis computer program allows for the organization of codes, memos, themes,
and additional findings (Creswell & Poth, 2018).
Mixed Methods
In a mixed-methods study, a researcher is given the added benefit of using multiple forms
of data collection and analysis to capture a larger picture of a phenomenon or study; in this case,
that phenomenon examined African American girls in mathematics. According to Yin (2018),
there are four principles for data collection; of those principles, the first one requires the
researcher to “use multiple sources of evidence” (p. 126). Yin adds, “A major rationale for using
79
multiple sources of evidence in case study research relates to the basic motive for doing a case
study in the first place: to do an in-depth study of a phenomenon in its real-world context” (p.
127). For ensuring the whole picture is captured in this study of African American girls in
mathematics, the student and teacher interviews will provide supporting evidence and context to
the results from the mathematics assessment. In essence, the triangulation of quantitative and
qualitative data collected within this study will help to enhance the construct validity overall to
strengthen the results and findings.
Limitations
The limitations of this study were abundant. First, the health concerns related to the
novel coronavirus (COVID-19) have caused constraints on access to students in person. The
solution was to construct a virtual-only study. Second, due to the complications with school
schedules, virtual instruction, and student participation, the introduction of the concepts to be
tested from the assessment in this study was later in the academic school year compared to
previous years. Finally, issues related to proper or sufficient instructional practices for
addressing unfinished learning and mathematical deficits also played a factor in student
responses.
Additionally, administering a virtual-only study had its restrictions. The limitations of
the virtual environment included finding access to online platforms conducive to collecting the
appropriate data, technology device availability, and scheduling concerns with participants. In
addition, schools have experienced challenges with students participating fully while being
virtual; the same was witnessed with this assessment administration. Another limitation to the
study was the access or participation of African American girls that correctly solved the
multiple-select multiple-choice items.
80
Other limits to this study include the future of standardized assessments. There may be a
shift in the use of standardized testing for college admissions, threatened by COVID-19. The
long-term status of using standardized assessments is unknown; however, it is assumed they will
be continued to be used in secondary education for course placement. For the 2021-2022
academic school year, some colleges and universities are not requiring standardized tests for
admissions, also referred to as test-optional (McGee, 2021; Vigdor & Diaz, 2020). One last
limitation to consider was the researcher’s previous relationship with the school site. As a
former employee, the researcher had to be as objective as possible.
81
CHAPTER 4. RESULTS AND FINDINGS
In this explanatory sequential mixed-methods study, both quantitative and qualitative
data were collected and analyzed to determine how various item types affected the mathematics
performance of middle school students, specifically African American girls. In the quantitative
phase of the study, all participants were assessed on 15 items from the Expressions and
Equations domain. All assessment items were aligned to the Louisiana Students Standards for
Mathematics (LSSM). Quantitative methods were used to answer the first research question.
The methods implemented helped determine the descriptive of the participants and the students'
mathematics performance overall and for each item type. Following the mathematics
assessment, African American girls were asked to participate in a retrospective think-aloud
interview in which they recounted how to solve the multiple-select multiple-choice items from
the assessment. In the final phase of the study, the mathematics teachers were interviewed to
provide additional context into the school year during a pandemic. Qualitative methods were
used to explore how African American girls processed multiple-select multiple-choice items
cognitively and how teaching during a pandemic impacted that performance. During the
qualitative analysis, interviews were transcribed and then coded for within-case and cross-case
thematic analyses. In the final phase of the study, the results from the quantitative analysis and
findings from the qualitative analysis were integrated for the mixed-method analysis.
Quantitative Results
The quantitative section of this mixed-methods study looks solely at mathematics
performance on a 15-item assessment. The total number of participants completing the
assessment was 57-sixth graders (see Table 4.1). Of those students, the mean performance score
was 20%, with a standard deviation of 17.64, indicating that students answered roughly three out
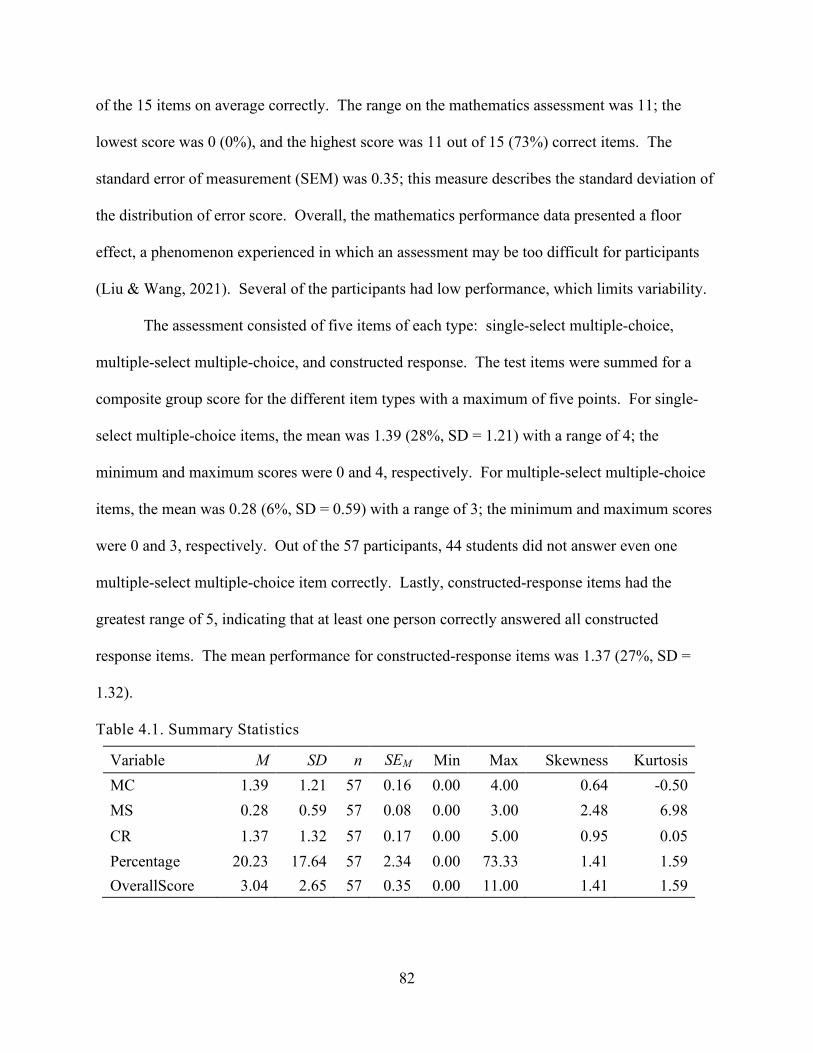
82
of the 15 items on average correctly. The range on the mathematics assessment was 11; the
lowest score was 0 (0%), and the highest score was 11 out of 15 (73%) correct items. The
standard error of measurement (SEM) was 0.35; this measure describes the standard deviation of
the distribution of error score. Overall, the mathematics performance data presented a floor
effect, a phenomenon experienced in which an assessment may be too difficult for participants
(Liu & Wang, 2021). Several of the participants had low performance, which limits variability.
The assessment consisted of five items of each type: single-select multiple-choice,
multiple-select multiple-choice, and constructed response. The test items were summed for a
composite group score for the different item types with a maximum of five points. For single-
select multiple-choice items, the mean was 1.39 (28%, SD = 1.21) with a range of 4; the
minimum and maximum scores were 0 and 4, respectively. For multiple-select multiple-choice
items, the mean was 0.28 (6%, SD = 0.59) with a range of 3; the minimum and maximum scores
were 0 and 3, respectively. Out of the 57 participants, 44 students did not answer even one
multiple-select multiple-choice item correctly. Lastly, constructed-response items had the
greatest range of 5, indicating that at least one person correctly answered all constructed
response items. The mean performance for constructed-response items was 1.37 (27%, SD =
1.32).
Table 4.1. Summary Statistics
Variable M SD n SEM Min Max Skewness Kurtosis
MC 1.39 1.21 57 0.16 0.00 4.00 0.64 -0.50
MS 0.28 0.59 57 0.08 0.00 3.00 2.48 6.98
CR 1.37 1.32 57 0.17 0.00 5.00 0.95 0.05
Percentage 20.23 17.64 57 2.34 0.00 73.33 1.41 1.59 OverallScore 3.04 2.65 57 0.35 0.00 11.00 1.41 1.59
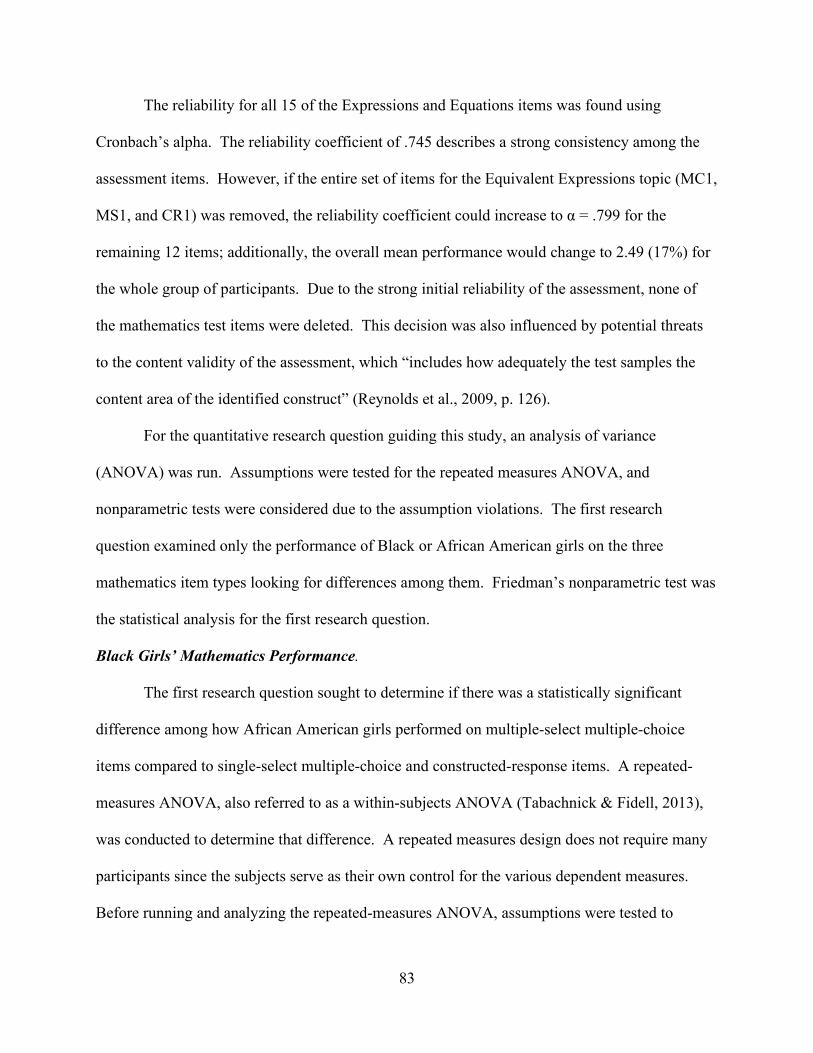
83
The reliability for all 15 of the Expressions and Equations items was found using
Cronbach’s alpha. The reliability coefficient of .745 describes a strong consistency among the
assessment items. However, if the entire set of items for the Equivalent Expressions topic (MC1,
MS1, and CR1) was removed, the reliability coefficient could increase to α = .799 for the
remaining 12 items; additionally, the overall mean performance would change to 2.49 (17%) for
the whole group of participants. Due to the strong initial reliability of the assessment, none of
the mathematics test items were deleted. This decision was also influenced by potential threats
to the content validity of the assessment, which “includes how adequately the test samples the
content area of the identified construct” (Reynolds et al., 2009, p. 126).
For the quantitative research question guiding this study, an analysis of variance
(ANOVA) was run. Assumptions were tested for the repeated measures ANOVA, and
nonparametric tests were considered due to the assumption violations. The first research
question examined only the performance of Black or African American girls on the three
mathematics item types looking for differences among them. Friedman’s nonparametric test was
the statistical analysis for the first research question.
Black Girls’ Mathematics Performance.
The first research question sought to determine if there was a statistically significant
difference among how African American girls performed on multiple-select multiple-choice
items compared to single-select multiple-choice and constructed-response items. A repeated-
measures ANOVA, also referred to as a within-subjects ANOVA (Tabachnick & Fidell, 2013),
was conducted to determine that difference. A repeated measures design does not require many
participants since the subjects serve as their own control for the various dependent measures.
Before running and analyzing the repeated-measures ANOVA, assumptions were tested to
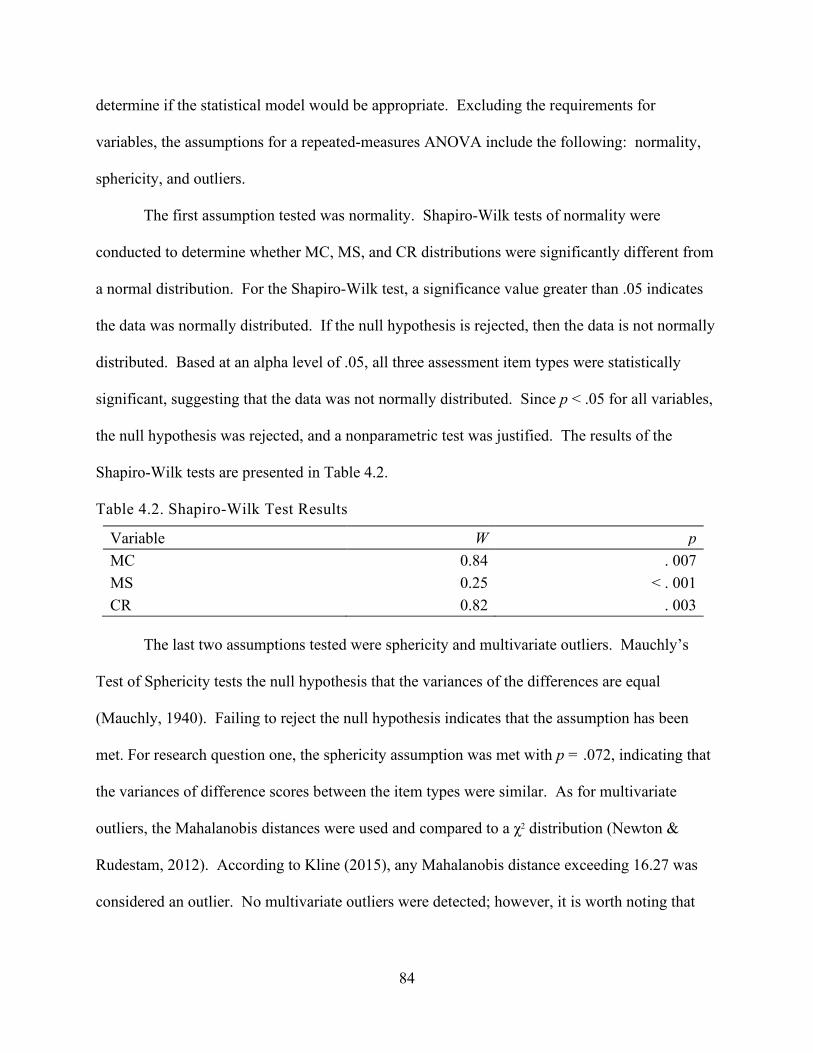
84
determine if the statistical model would be appropriate. Excluding the requirements for
variables, the assumptions for a repeated-measures ANOVA include the following: normality,
sphericity, and outliers.
The first assumption tested was normality. Shapiro-Wilk tests of normality were
conducted to determine whether MC, MS, and CR distributions were significantly different from
a normal distribution. For the Shapiro-Wilk test, a significance value greater than .05 indicates
the data was normally distributed. If the null hypothesis is rejected, then the data is not normally
distributed. Based at an alpha level of .05, all three assessment item types were statistically
significant, suggesting that the data was not normally distributed. Since p < .05 for all variables,
the null hypothesis was rejected, and a nonparametric test was justified. The results of the
Shapiro-Wilk tests are presented in Table 4.2.
Table 4.2. Shapiro-Wilk Test Results
Variable W p
MC 0.84 . 007
MS 0.25 < . 001
CR 0.82 . 003
The last two assumptions tested were sphericity and multivariate outliers. Mauchly’s
Test of Sphericity tests the null hypothesis that the variances of the differences are equal
(Mauchly, 1940). Failing to reject the null hypothesis indicates that the assumption has been
met. For research question one, the sphericity assumption was met with p = .072, indicating that
the variances of difference scores between the item types were similar. As for multivariate
outliers, the Mahalanobis distances were used and compared to a χ2 distribution (Newton &
Rudestam, 2012). According to Kline (2015), any Mahalanobis distance exceeding 16.27 was
considered an outlier. No multivariate outliers were detected; however, it is worth noting that
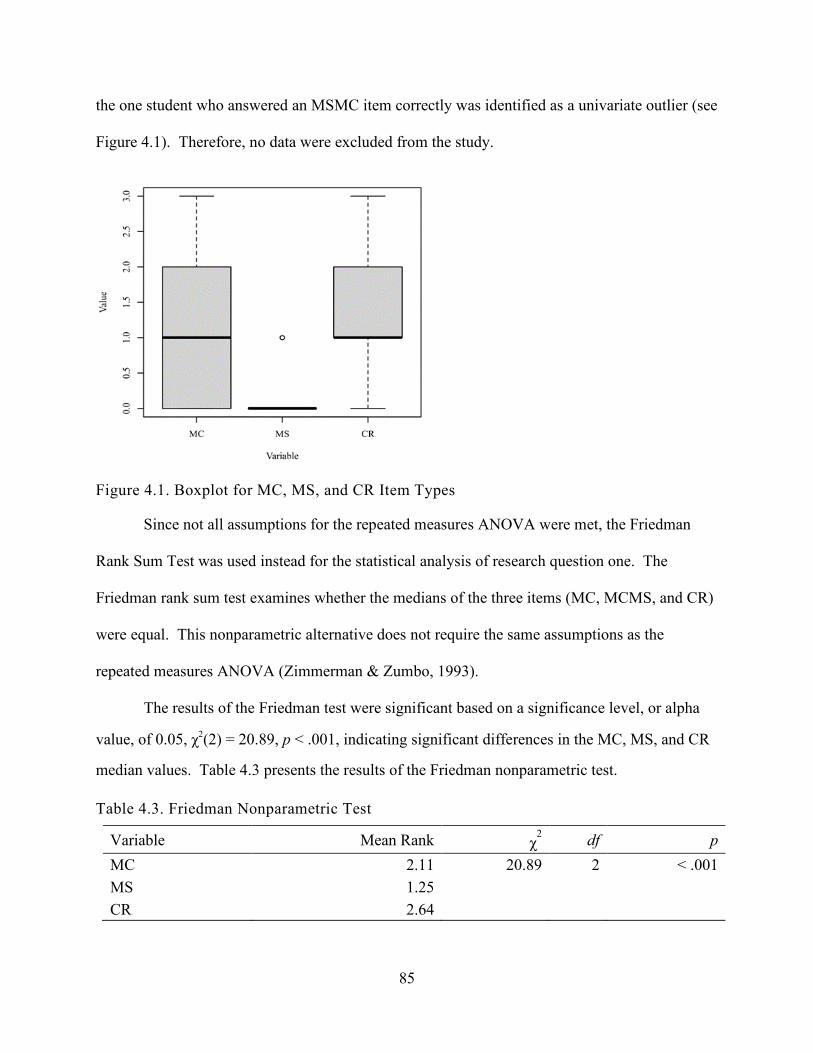
85
the one student who answered an MSMC item correctly was identified as a univariate outlier (see
Figure 4.1). Therefore, no data were excluded from the study.
Figure 4.1. Boxplot for MC, MS, and CR Item Types
Since not all assumptions for the repeated measures ANOVA were met, the Friedman
Rank Sum Test was used instead for the statistical analysis of research question one. The
Friedman rank sum test examines whether the medians of the three items (MC, MCMS, and CR)
were equal. This nonparametric alternative does not require the same assumptions as the
repeated measures ANOVA (Zimmerman & Zumbo, 1993).
The results of the Friedman test were significant based on a significance level, or alpha
value, of 0.05, χ2(2) = 20.89, p < .001, indicating significant differences in the MC, MS, and CR
median values. Table 4.3 presents the results of the Friedman nonparametric test.
Table 4.3. Friedman Nonparametric Test
Variable Mean Rank χ2 df p
MC 2.11 20.89 2 < .001 MS 1.25 CR 2.64
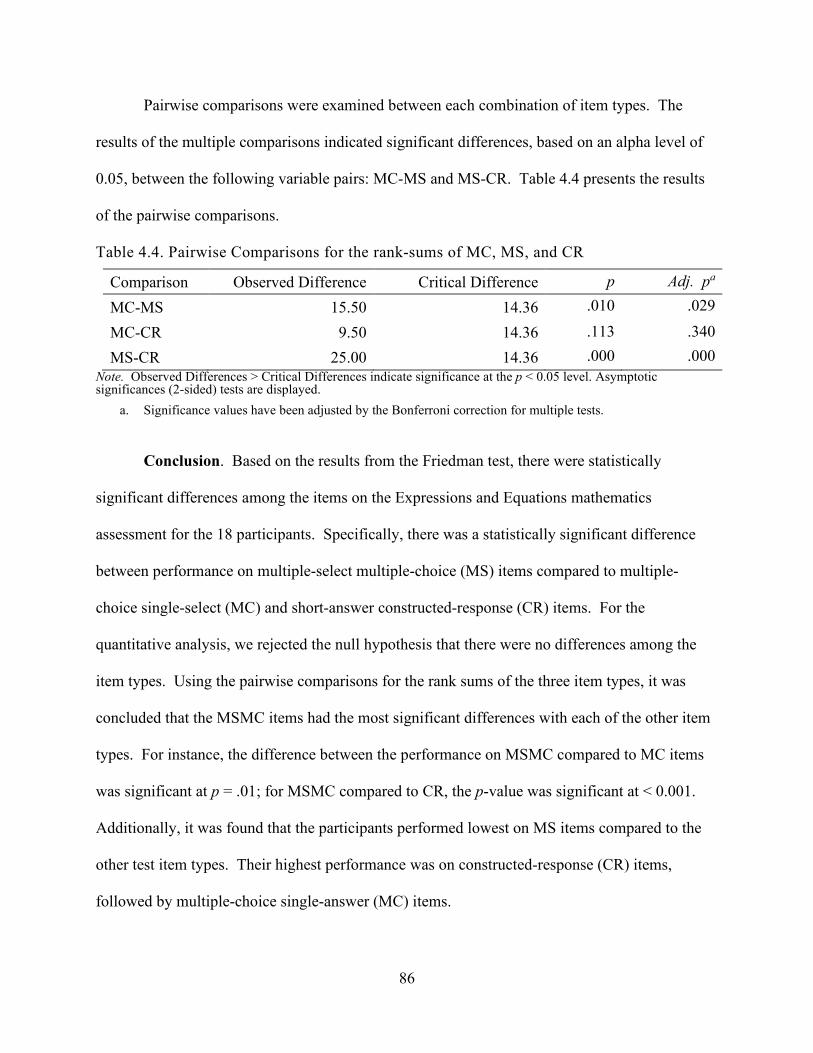
86
Pairwise comparisons were examined between each combination of item types. The
results of the multiple comparisons indicated significant differences, based on an alpha level of
0.05, between the following variable pairs: MC-MS and MS-CR. Table 4.4 presents the results
of the pairwise comparisons.
Table 4.4. Pairwise Comparisons for the rank-sums of MC, MS, and CR
Comparison Observed Difference Critical Difference p Adj. pa
MC-MS 15.50 14.36 .010 .029
MC-CR 9.50 14.36 .113 .340 MS-CR 25.00 14.36 .000 .000
Note. Observed Differences > Critical Differences indicate significance at the p < 0.05 level. Asymptotic significances (2-sided) tests are displayed.
a. Significance values have been adjusted by the Bonferroni correction for multiple tests.
Conclusion. Based on the results from the Friedman test, there were statistically
significant differences among the items on the Expressions and Equations mathematics
assessment for the 18 participants. Specifically, there was a statistically significant difference
between performance on multiple-select multiple-choice (MS) items compared to multiple-
choice single-select (MC) and short-answer constructed-response (CR) items. For the
quantitative analysis, we rejected the null hypothesis that there were no differences among the
item types. Using the pairwise comparisons for the rank sums of the three item types, it was
concluded that the MSMC items had the most significant differences with each of the other item
types. For instance, the difference between the performance on MSMC compared to MC items
was significant at p = .01; for MSMC compared to CR, the p-value was significant at < 0.001.
Additionally, it was found that the participants performed lowest on MS items compared to the
other test item types. Their highest performance was on constructed-response (CR) items,
followed by multiple-choice single-answer (MC) items.
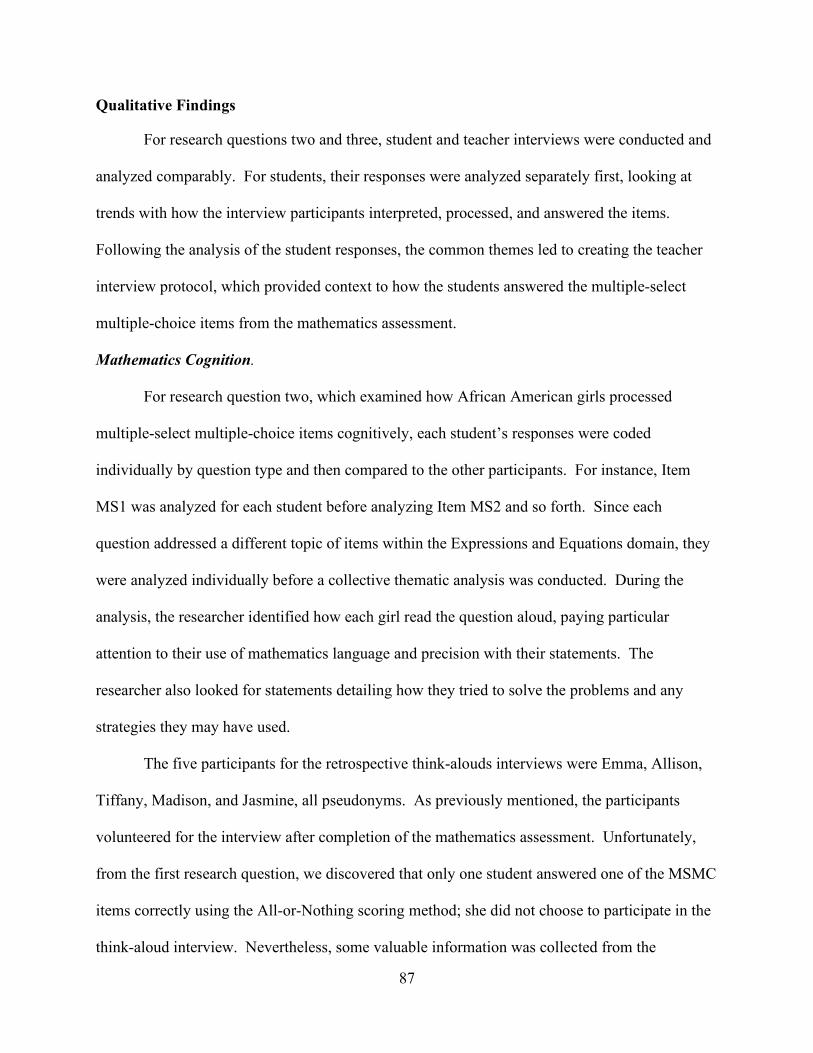
87
Qualitative Findings
For research questions two and three, student and teacher interviews were conducted and
analyzed comparably. For students, their responses were analyzed separately first, looking at
trends with how the interview participants interpreted, processed, and answered the items.
Following the analysis of the student responses, the common themes led to creating the teacher
interview protocol, which provided context to how the students answered the multiple-select
multiple-choice items from the mathematics assessment.
Mathematics Cognition.
For research question two, which examined how African American girls processed
multiple-select multiple-choice items cognitively, each student’s responses were coded
individually by question type and then compared to the other participants. For instance, Item
MS1 was analyzed for each student before analyzing Item MS2 and so forth. Since each
question addressed a different topic of items within the Expressions and Equations domain, they
were analyzed individually before a collective thematic analysis was conducted. During the
analysis, the researcher identified how each girl read the question aloud, paying particular
attention to their use of mathematics language and precision with their statements. The
researcher also looked for statements detailing how they tried to solve the problems and any
strategies they may have used.
The five participants for the retrospective think-alouds interviews were Emma, Allison,
Tiffany, Madison, and Jasmine, all pseudonyms. As previously mentioned, the participants
volunteered for the interview after completion of the mathematics assessment. Unfortunately,
from the first research question, we discovered that only one student answered one of the MSMC
items correctly using the All-or-Nothing scoring method; she did not choose to participate in the
think-aloud interview. Nevertheless, some valuable information was collected from the
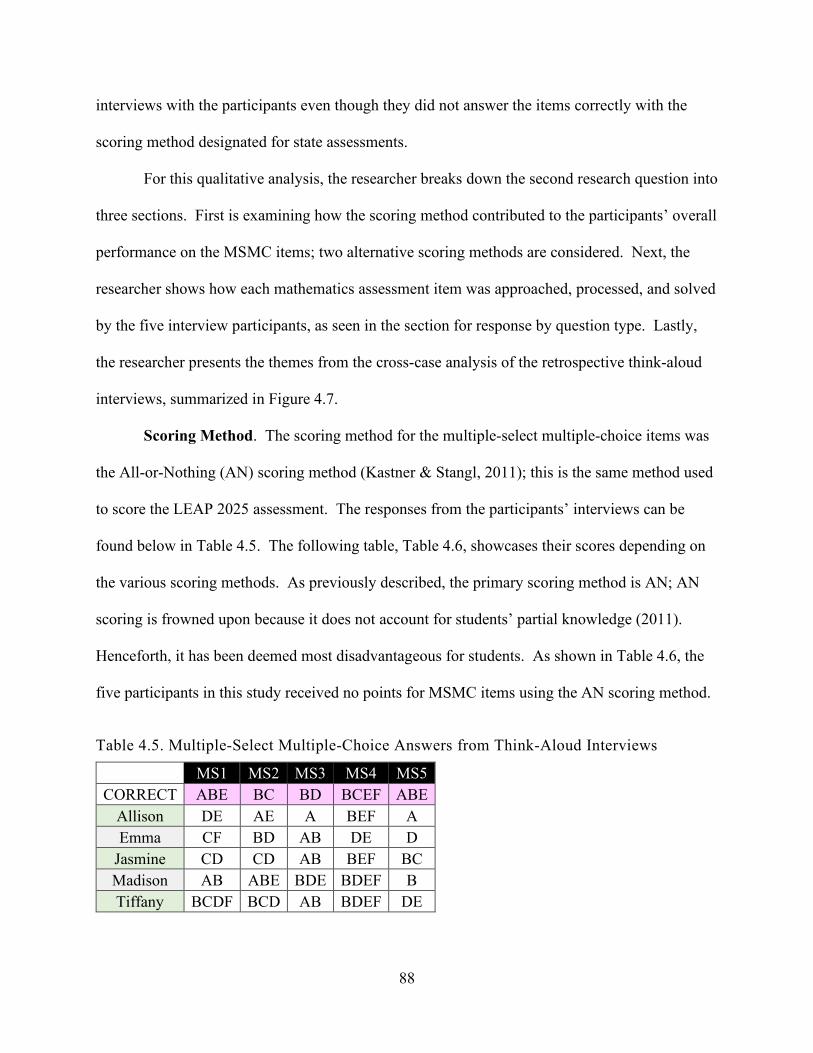
88
interviews with the participants even though they did not answer the items correctly with the
scoring method designated for state assessments.
For this qualitative analysis, the researcher breaks down the second research question into
three sections. First is examining how the scoring method contributed to the participants’ overall
performance on the MSMC items; two alternative scoring methods are considered. Next, the
researcher shows how each mathematics assessment item was approached, processed, and solved
by the five interview participants, as seen in the section for response by question type. Lastly,
the researcher presents the themes from the cross-case analysis of the retrospective think-aloud
interviews, summarized in Figure 4.7.
Scoring Method. The scoring method for the multiple-select multiple-choice items was
the All-or-Nothing (AN) scoring method (Kastner & Stangl, 2011); this is the same method used
to score the LEAP 2025 assessment. The responses from the participants’ interviews can be
found below in Table 4.5. The following table, Table 4.6, showcases their scores depending on
the various scoring methods. As previously described, the primary scoring method is AN; AN
scoring is frowned upon because it does not account for students’ partial knowledge (2011).
Henceforth, it has been deemed most disadvantageous for students. As shown in Table 4.6, the
five participants in this study received no points for MSMC items using the AN scoring method.
Table 4.5. Multiple-Select Multiple-Choice Answers from Think-Aloud Interviews
MS1 MS2 MS3 MS4 MS5 CORRECT ABE BC BD BCEF ABE
Allison DE AE A BEF A Emma CF BD AB DE D
Jasmine CD CD AB BEF BC Madison AB ABE BDE BDEF B Tiffany BCDF BCD AB BDEF DE
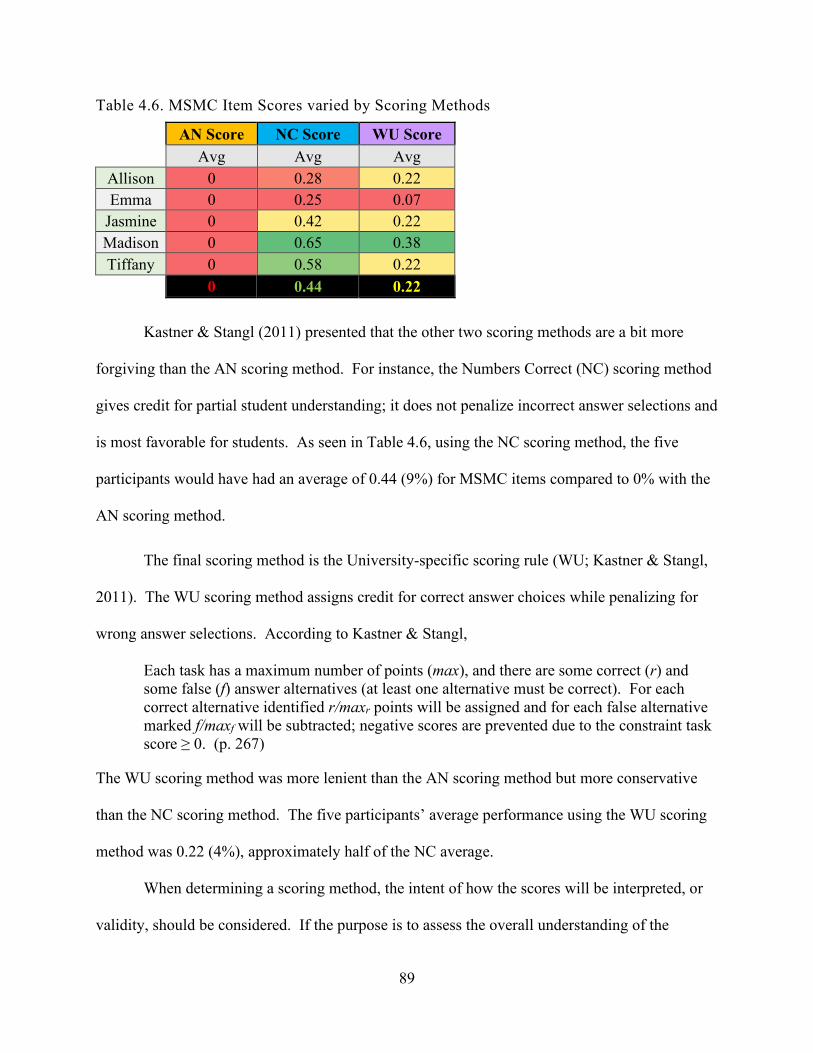
89
Table 4.6. MSMC Item Scores varied by Scoring Methods
AN Score NC Score WU Score
Avg Avg Avg Allison 0 0.28 0.22 Emma 0 0.25 0.07
Jasmine 0 0.42 0.22 Madison 0 0.65 0.38 Tiffany 0 0.58 0.22
0 0.44 0.22
Kastner & Stangl (2011) presented that the other two scoring methods are a bit more
forgiving than the AN scoring method. For instance, the Numbers Correct (NC) scoring method
gives credit for partial student understanding; it does not penalize incorrect answer selections and
is most favorable for students. As seen in Table 4.6, using the NC scoring method, the five
participants would have had an average of 0.44 (9%) for MSMC items compared to 0% with the
AN scoring method.
The final scoring method is the University-specific scoring rule (WU; Kastner & Stangl,
2011). The WU scoring method assigns credit for correct answer choices while penalizing for
wrong answer selections. According to Kastner & Stangl,
Each task has a maximum number of points (max), and there are some correct (r) and some false (f) answer alternatives (at least one alternative must be correct). For each correct alternative identified r/maxr points will be assigned and for each false alternative marked f/maxf will be subtracted; negative scores are prevented due to the constraint task score ≥ 0. (p. 267)
The WU scoring method was more lenient than the AN scoring method but more conservative
than the NC scoring method. The five participants’ average performance using the WU scoring
method was 0.22 (4%), approximately half of the NC average.
When determining a scoring method, the intent of how the scores will be interpreted, or
validity, should be considered. If the purpose is to assess the overall understanding of the
90
concept by examining multiple approaches to possible solutions, then multiple-select multiple-
choice items are a good option. However, if the purpose is to assess the concept for any
understanding, partial credit should be utilized. One of the challenges with multiple-choice
options in the MSMC items is that they may provide the students with an advantage. For
instance, by having answer choices versus creating a response, such as in constructed-response
items, students could guess and get partial credit if one of the alternative scoring methods were
to be implemented. For example, Madison describes selecting answer choice B for MS2 as
follows:
I chose B because it's the difference of four and six times two. And the difference of four and six times two is um four and six. Wait, hold on. Six. . . [Background noise]. Okay, and B because if you do [pause]. Um four times, four, wait… four times two and that's eight and six times two is 12. And then you minus 12 from. . . 12 from eight, it equals. It equals six.
Madison would have received partial credit for this selection using the NC or WU scoring
methods by having answer choices provided; given a constructed-response item, Madison most
likely would have missed this item given her rationale above. When comparing her performance
on the aligned constructed-response item for MS2, Madison answered Item CR2 incorrectly.
The three scoring methods presented above show how this study’s participants are
viewed on mathematics assessments. For instance, none of the students that participated in the
think-aloud interviews would have received any credit or points using the AN scoring method,
which does not allow for over-or-under selecting answer choices. Thus, by subscribing to this
scoring method, the validity of the test items is called into question; validity is defined as “the
appropriateness or accuracy of the interpretations of test scores” (Reynolds et al., 2009, p. 124).
Furthermore, it is unclear what the participants knew pertaining to these test items since partial
credit was not considered. One advantage of the think-aloud interviews was the availability of
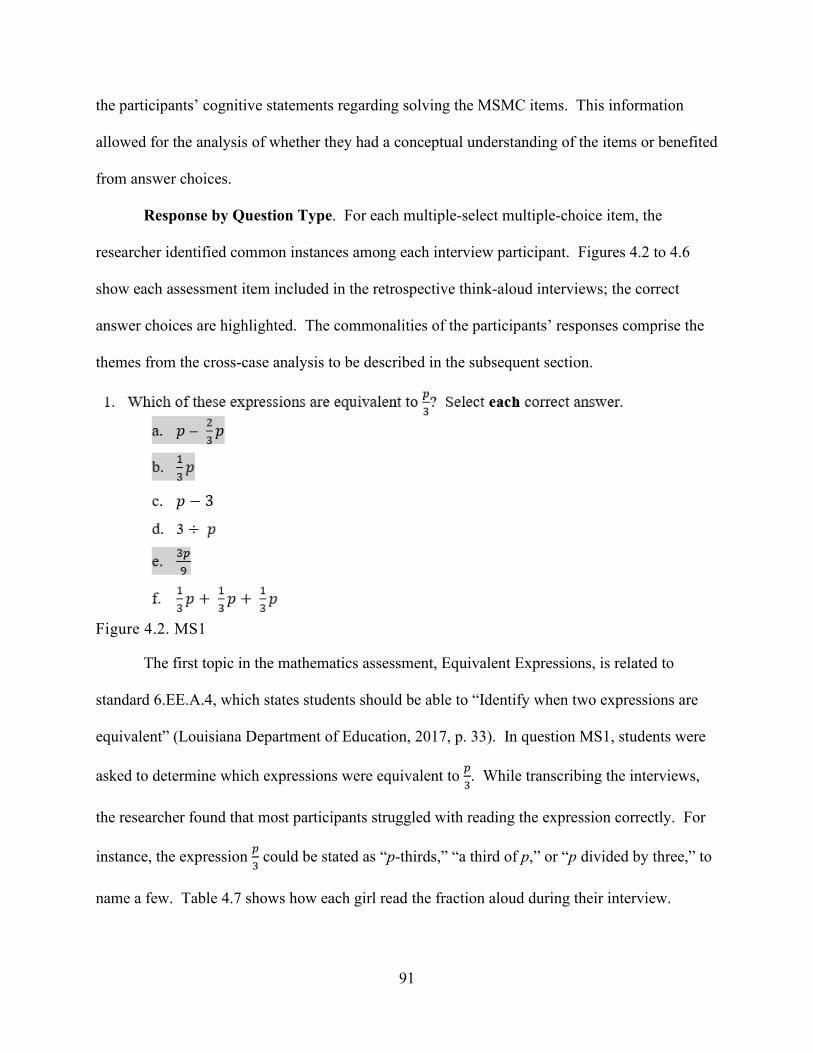
91
the participants’ cognitive statements regarding solving the MSMC items. This information
allowed for the analysis of whether they had a conceptual understanding of the items or benefited
from answer choices.
Response by Question Type. For each multiple-select multiple-choice item, the
researcher identified common instances among each interview participant. Figures 4.2 to 4.6
show each assessment item included in the retrospective think-aloud interviews; the correct
answer choices are highlighted. The commonalities of the participants’ responses comprise the
themes from the cross-case analysis to be described in the subsequent section.
Figure 4.2. MS1
The first topic in the mathematics assessment, Equivalent Expressions, is related to
standard 6.EE.A.4, which states students should be able to “Identify when two expressions are
equivalent” (Louisiana Department of Education, 2017, p. 33). In question MS1, students were
asked to determine which expressions were equivalent to 𝑝𝑝3. While transcribing the interviews,
the researcher found that most participants struggled with reading the expression correctly. For
instance, the expression 𝑝𝑝3 could be stated as “p-thirds,” “a third of p,” or “p divided by three,” to
name a few. Table 4.7 shows how each girl read the fraction aloud during their interview.
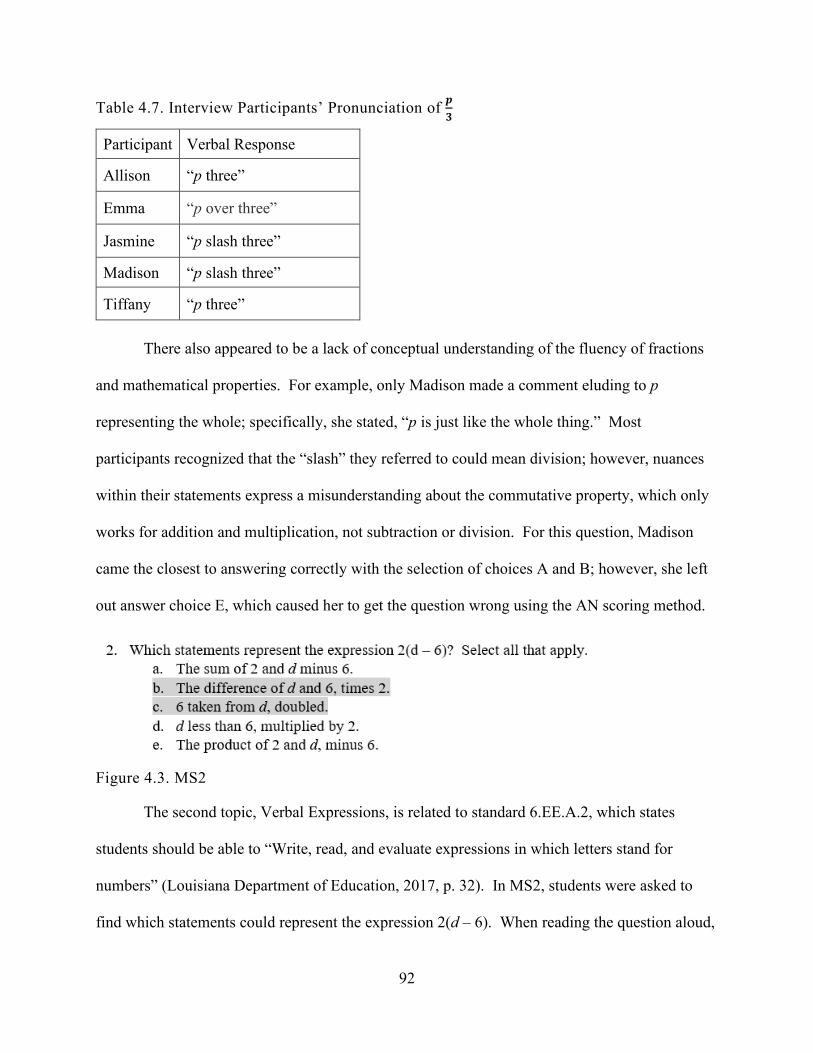
92
Table 4.7. Interview Participants’ Pronunciation of 𝒑𝒑𝟑𝟑
Participant Verbal Response
Allison “p three”
Emma “p over three”
Jasmine “p slash three”
Madison “p slash three”
Tiffany “p three” There also appeared to be a lack of conceptual understanding of the fluency of fractions
and mathematical properties. For example, only Madison made a comment eluding to p
representing the whole; specifically, she stated, “p is just like the whole thing.” Most
participants recognized that the “slash” they referred to could mean division; however, nuances
within their statements express a misunderstanding about the commutative property, which only
works for addition and multiplication, not subtraction or division. For this question, Madison
came the closest to answering correctly with the selection of choices A and B; however, she left
out answer choice E, which caused her to get the question wrong using the AN scoring method.
Figure 4.3. MS2
The second topic, Verbal Expressions, is related to standard 6.EE.A.2, which states
students should be able to “Write, read, and evaluate expressions in which letters stand for
numbers” (Louisiana Department of Education, 2017, p. 32). In MS2, students were asked to
find which statements could represent the expression 2(d – 6). When reading the question aloud,
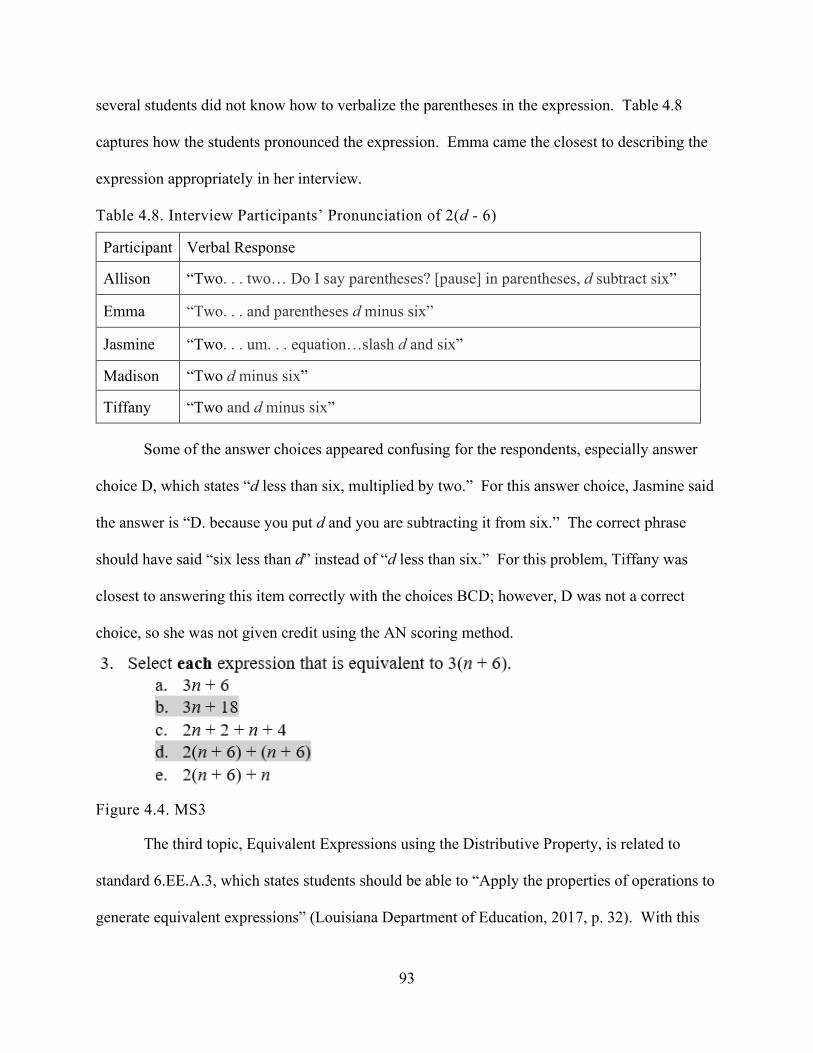
93
several students did not know how to verbalize the parentheses in the expression. Table 4.8
captures how the students pronounced the expression. Emma came the closest to describing the
expression appropriately in her interview.
Table 4.8. Interview Participants’ Pronunciation of 2(d - 6)
Participant Verbal Response
Allison “Two. . . two… Do I say parentheses? [pause] in parentheses, d subtract six”
Emma “Two. . . and parentheses d minus six”
Jasmine “Two. . . um. . . equation…slash d and six”
Madison “Two d minus six”
Tiffany “Two and d minus six”
Some of the answer choices appeared confusing for the respondents, especially answer
choice D, which states “d less than six, multiplied by two.” For this answer choice, Jasmine said
the answer is “D. because you put d and you are subtracting it from six.” The correct phrase
should have said “six less than d” instead of “d less than six.” For this problem, Tiffany was
closest to answering this item correctly with the choices BCD; however, D was not a correct
choice, so she was not given credit using the AN scoring method.
Figure 4.4. MS3
The third topic, Equivalent Expressions using the Distributive Property, is related to
standard 6.EE.A.3, which states students should be able to “Apply the properties of operations to
generate equivalent expressions” (Louisiana Department of Education, 2017, p. 32). With this
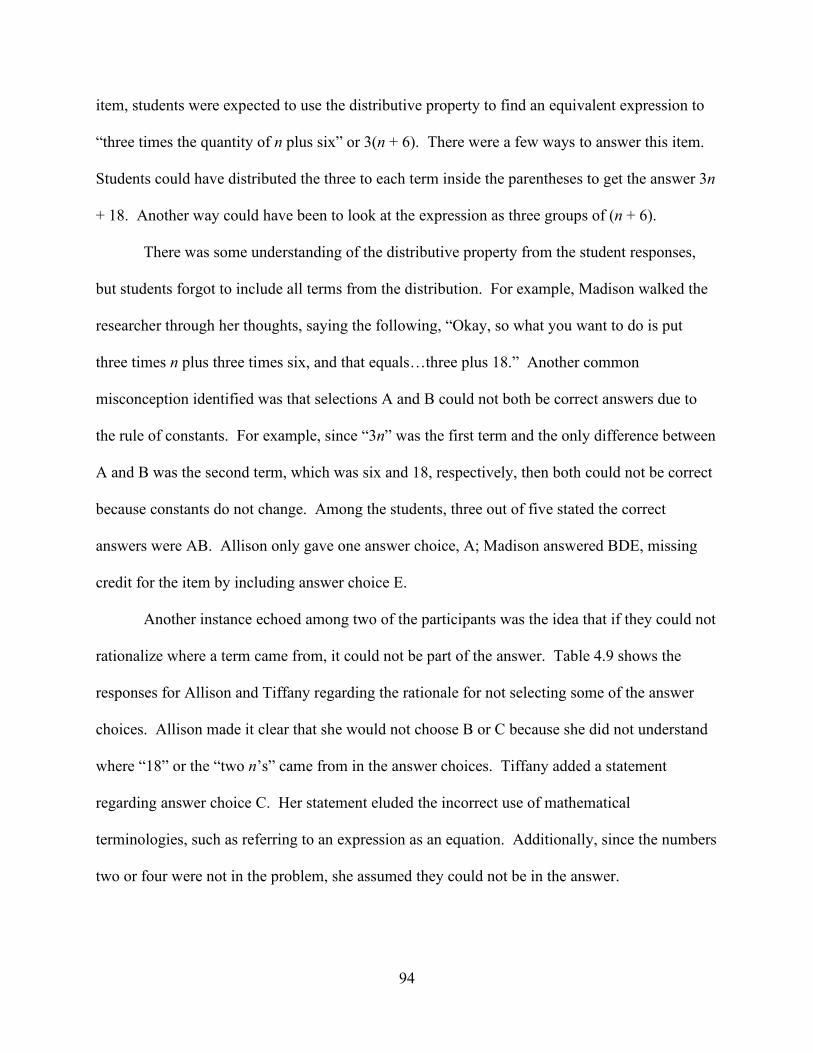
94
item, students were expected to use the distributive property to find an equivalent expression to
“three times the quantity of n plus six” or 3(n + 6). There were a few ways to answer this item.
Students could have distributed the three to each term inside the parentheses to get the answer 3n
+ 18. Another way could have been to look at the expression as three groups of (n + 6).
There was some understanding of the distributive property from the student responses,
but students forgot to include all terms from the distribution. For example, Madison walked the
researcher through her thoughts, saying the following, “Okay, so what you want to do is put
three times n plus three times six, and that equals…three plus 18.” Another common
misconception identified was that selections A and B could not both be correct answers due to
the rule of constants. For example, since “3n” was the first term and the only difference between
A and B was the second term, which was six and 18, respectively, then both could not be correct
because constants do not change. Among the students, three out of five stated the correct
answers were AB. Allison only gave one answer choice, A; Madison answered BDE, missing
credit for the item by including answer choice E.
Another instance echoed among two of the participants was the idea that if they could not
rationalize where a term came from, it could not be part of the answer. Table 4.9 shows the
responses for Allison and Tiffany regarding the rationale for not selecting some of the answer
choices. Allison made it clear that she would not choose B or C because she did not understand
where “18” or the “two n’s” came from in the answer choices. Tiffany added a statement
regarding answer choice C. Her statement eluded the incorrect use of mathematical
terminologies, such as referring to an expression as an equation. Additionally, since the numbers
two or four were not in the problem, she assumed they could not be in the answer.
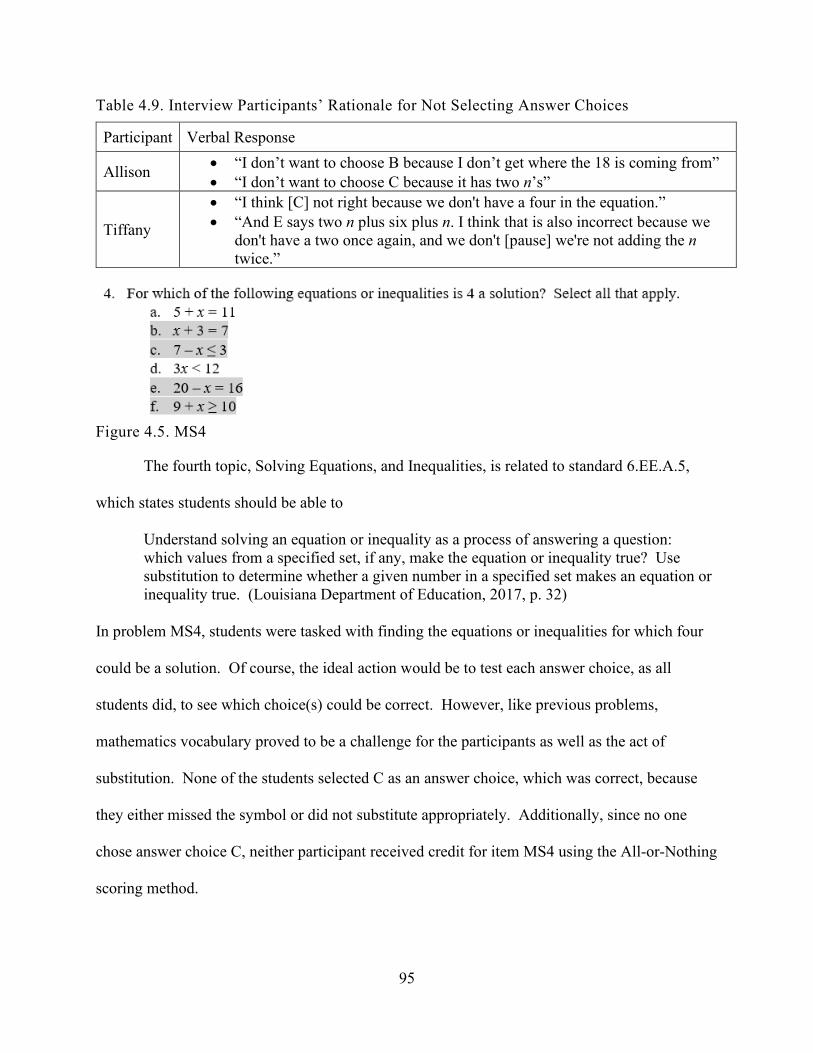
95
Table 4.9. Interview Participants’ Rationale for Not Selecting Answer Choices
Participant Verbal Response
Allison • “I don’t want to choose B because I don’t get where the 18 is coming from” • “I don’t want to choose C because it has two n’s”
Tiffany
• “I think [C] not right because we don't have a four in the equation.” • “And E says two n plus six plus n. I think that is also incorrect because we
don't have a two once again, and we don't [pause] we're not adding the n twice.”
Figure 4.5. MS4
The fourth topic, Solving Equations, and Inequalities, is related to standard 6.EE.A.5,
which states students should be able to
Understand solving an equation or inequality as a process of answering a question: which values from a specified set, if any, make the equation or inequality true? Use substitution to determine whether a given number in a specified set makes an equation or inequality true. (Louisiana Department of Education, 2017, p. 32)
In problem MS4, students were tasked with finding the equations or inequalities for which four
could be a solution. Of course, the ideal action would be to test each answer choice, as all
students did, to see which choice(s) could be correct. However, like previous problems,
mathematics vocabulary proved to be a challenge for the participants as well as the act of
substitution. None of the students selected C as an answer choice, which was correct, because
they either missed the symbol or did not substitute appropriately. Additionally, since no one
chose answer choice C, neither participant received credit for item MS4 using the All-or-Nothing
scoring method.
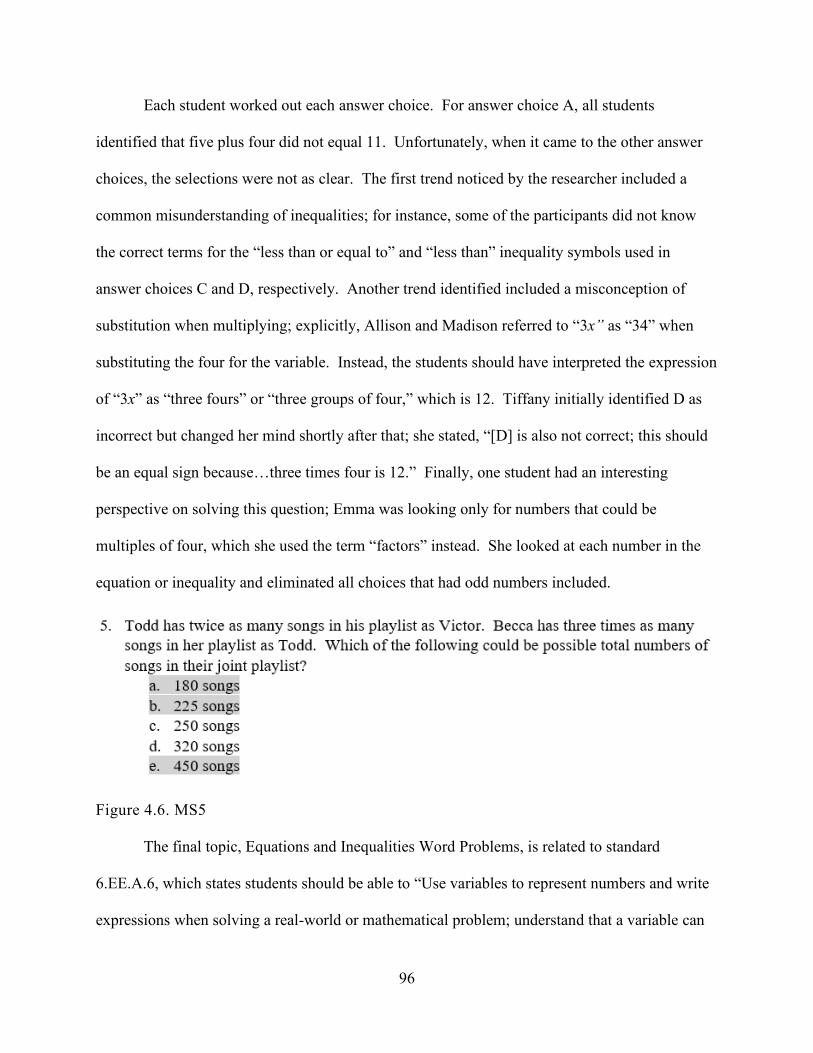
96
Each student worked out each answer choice. For answer choice A, all students
identified that five plus four did not equal 11. Unfortunately, when it came to the other answer
choices, the selections were not as clear. The first trend noticed by the researcher included a
common misunderstanding of inequalities; for instance, some of the participants did not know
the correct terms for the “less than or equal to” and “less than” inequality symbols used in
answer choices C and D, respectively. Another trend identified included a misconception of
substitution when multiplying; explicitly, Allison and Madison referred to “3x” as “34” when
substituting the four for the variable. Instead, the students should have interpreted the expression
of “3x” as “three fours” or “three groups of four,” which is 12. Tiffany initially identified D as
incorrect but changed her mind shortly after that; she stated, “[D] is also not correct; this should
be an equal sign because…three times four is 12.” Finally, one student had an interesting
perspective on solving this question; Emma was looking only for numbers that could be
multiples of four, which she used the term “factors” instead. She looked at each number in the
equation or inequality and eliminated all choices that had odd numbers included.
Figure 4.6. MS5
The final topic, Equations and Inequalities Word Problems, is related to standard
6.EE.A.6, which states students should be able to “Use variables to represent numbers and write
expressions when solving a real-world or mathematical problem; understand that a variable can
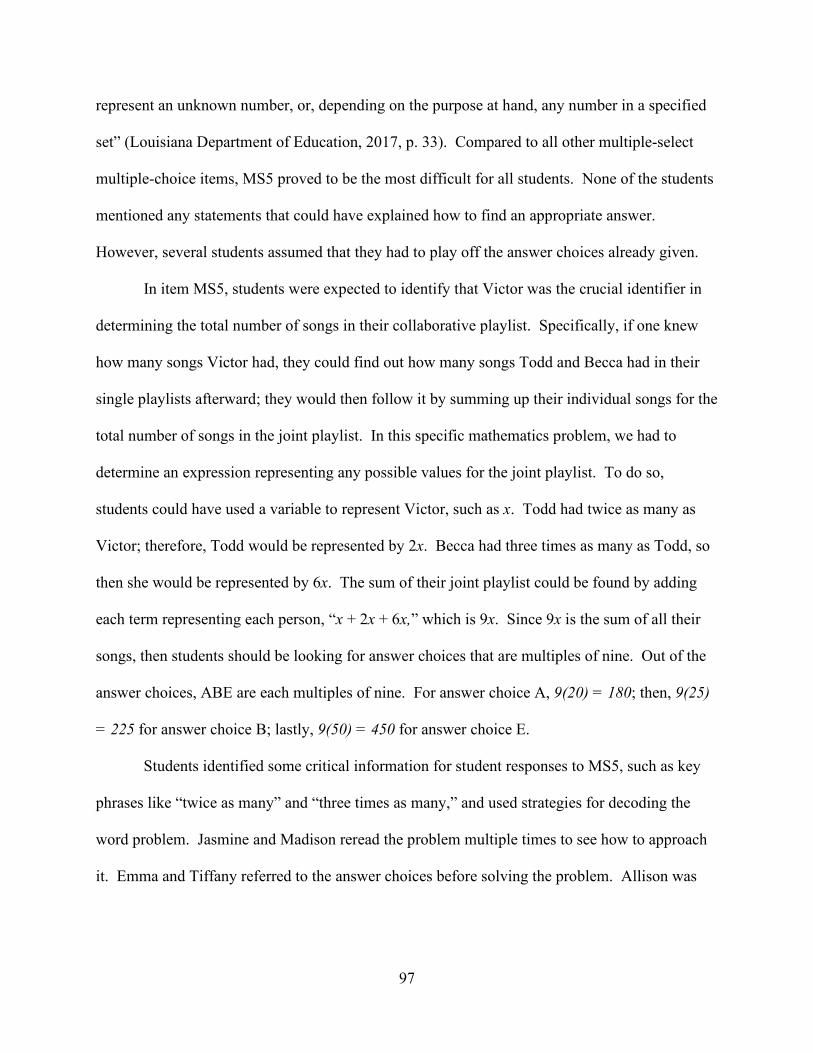
97
represent an unknown number, or, depending on the purpose at hand, any number in a specified
set” (Louisiana Department of Education, 2017, p. 33). Compared to all other multiple-select
multiple-choice items, MS5 proved to be the most difficult for all students. None of the students
mentioned any statements that could have explained how to find an appropriate answer.
However, several students assumed that they had to play off the answer choices already given.
In item MS5, students were expected to identify that Victor was the crucial identifier in
determining the total number of songs in their collaborative playlist. Specifically, if one knew
how many songs Victor had, they could find out how many songs Todd and Becca had in their
single playlists afterward; they would then follow it by summing up their individual songs for the
total number of songs in the joint playlist. In this specific mathematics problem, we had to
determine an expression representing any possible values for the joint playlist. To do so,
students could have used a variable to represent Victor, such as x. Todd had twice as many as
Victor; therefore, Todd would be represented by 2x. Becca had three times as many as Todd, so
then she would be represented by 6x. The sum of their joint playlist could be found by adding
each term representing each person, “x + 2x + 6x,” which is 9x. Since 9x is the sum of all their
songs, then students should be looking for answer choices that are multiples of nine. Out of the
answer choices, ABE are each multiples of nine. For answer choice A, 9(20) = 180; then, 9(25)
= 225 for answer choice B; lastly, 9(50) = 450 for answer choice E.
Students identified some critical information for student responses to MS5, such as key
phrases like “twice as many” and “three times as many,” and used strategies for decoding the
word problem. Jasmine and Madison reread the problem multiple times to see how to approach
it. Emma and Tiffany referred to the answer choices before solving the problem. Allison was
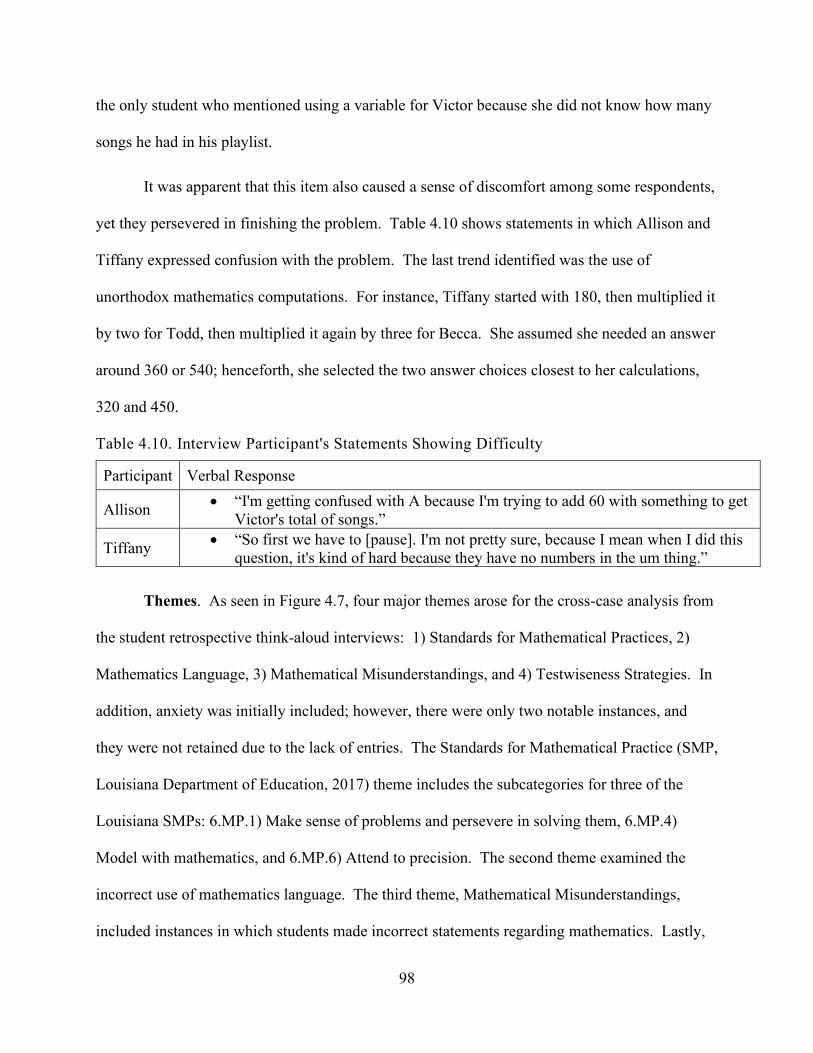
98
the only student who mentioned using a variable for Victor because she did not know how many
songs he had in his playlist.
It was apparent that this item also caused a sense of discomfort among some respondents,
yet they persevered in finishing the problem. Table 4.10 shows statements in which Allison and
Tiffany expressed confusion with the problem. The last trend identified was the use of
unorthodox mathematics computations. For instance, Tiffany started with 180, then multiplied it
by two for Todd, then multiplied it again by three for Becca. She assumed she needed an answer
around 360 or 540; henceforth, she selected the two answer choices closest to her calculations,
320 and 450.
Table 4.10. Interview Participant's Statements Showing Difficulty
Participant Verbal Response
Allison • “I'm getting confused with A because I'm trying to add 60 with something to get Victor's total of songs.”
Tiffany • “So first we have to [pause]. I'm not pretty sure, because I mean when I did this question, it's kind of hard because they have no numbers in the um thing.”
Themes. As seen in Figure 4.7, four major themes arose for the cross-case analysis from
the student retrospective think-aloud interviews: 1) Standards for Mathematical Practices, 2)
Mathematics Language, 3) Mathematical Misunderstandings, and 4) Testwiseness Strategies. In
addition, anxiety was initially included; however, there were only two notable instances, and
they were not retained due to the lack of entries. The Standards for Mathematical Practice (SMP,
Louisiana Department of Education, 2017) theme includes the subcategories for three of the
Louisiana SMPs: 6.MP.1) Make sense of problems and persevere in solving them, 6.MP.4)
Model with mathematics, and 6.MP.6) Attend to precision. The second theme examined the
incorrect use of mathematics language. The third theme, Mathematical Misunderstandings,
included instances in which students made incorrect statements regarding mathematics. Lastly,
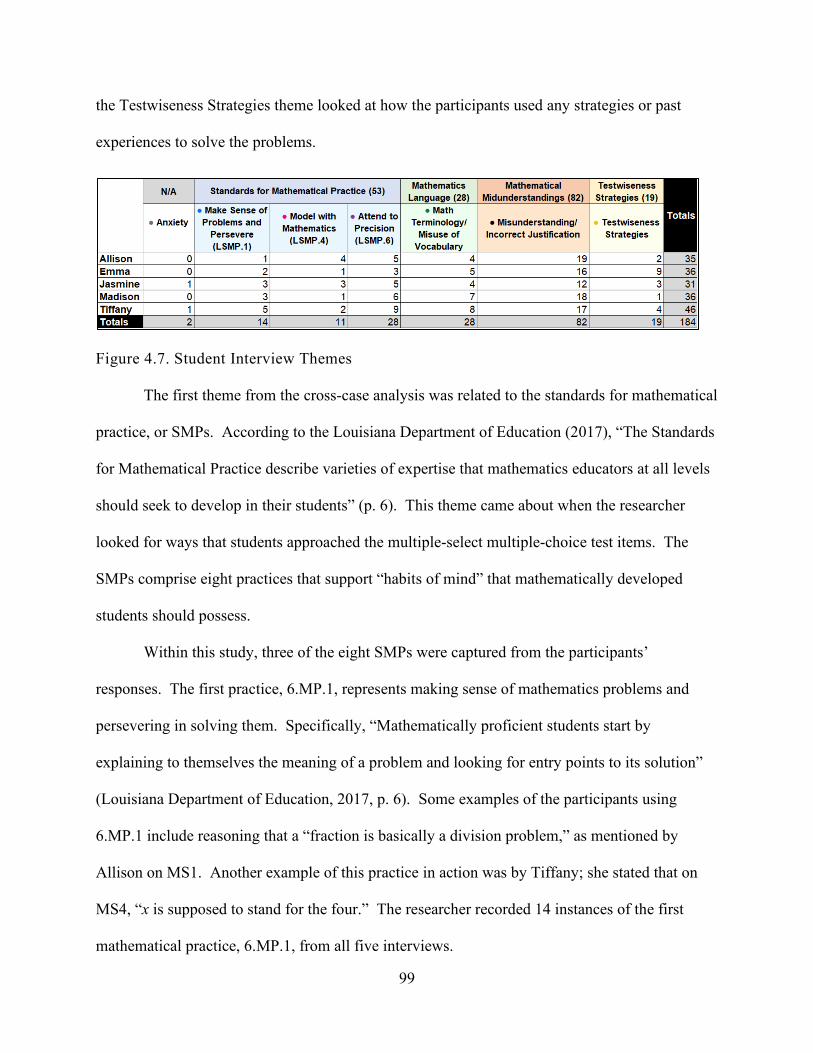
99
the Testwiseness Strategies theme looked at how the participants used any strategies or past
experiences to solve the problems.
Figure 4.7. Student Interview Themes
The first theme from the cross-case analysis was related to the standards for mathematical
practice, or SMPs. According to the Louisiana Department of Education (2017), “The Standards
for Mathematical Practice describe varieties of expertise that mathematics educators at all levels
should seek to develop in their students” (p. 6). This theme came about when the researcher
looked for ways that students approached the multiple-select multiple-choice test items. The
SMPs comprise eight practices that support “habits of mind” that mathematically developed
students should possess.
Within this study, three of the eight SMPs were captured from the participants’
responses. The first practice, 6.MP.1, represents making sense of mathematics problems and
persevering in solving them. Specifically, “Mathematically proficient students start by
explaining to themselves the meaning of a problem and looking for entry points to its solution”
(Louisiana Department of Education, 2017, p. 6). Some examples of the participants using
6.MP.1 include reasoning that a “fraction is basically a division problem,” as mentioned by
Allison on MS1. Another example of this practice in action was by Tiffany; she stated that on
MS4, “x is supposed to stand for the four.” The researcher recorded 14 instances of the first
mathematical practice, 6.MP.1, from all five interviews.
100
The second practice identifies from the retrospective think-aloud interviews included
6.MP.4, Model with Mathematics. As described by the Louisiana Department of Education
(2017), “Mathematically proficient students can apply the mathematics they know to solve
problems arising in everyday life, society, and the workplace” (p. 7). In this study, the students
modeled their thinking with numerical statements using the four operations. There were 11
recorded instances of 6.MP.4 in the interviews. For instance, Jasmine made a simple comment
such as “two times three is six” on MS5. Allison added in her interview, “It's not A because five
plus six equals eleven.”
The last mathematical practice identified in the interviews was 6.MP.6, otherwise known
as attending to precision. This practice requires the use of accurate vocabulary and the ability to
communicate reasoning to others. According to the Louisiana Department of Education,
mathematically proficient students “state the meaning of the symbols they choose” (p. 7) and
“express numerical answers with a degree of precision appropriate for the problem context” (p.
7). Madison and Tiffany captured some examples of these practices regarding MS4. As
mentioned by Madison, “the greater than sign is pointing to the 12.” Tiffany added in her
statement, “nine plus four equals 13, so that means 13 is greater than the ten, and then the greater
sign is going to be left, which means its right.” There were 28 instances of attending to precision
throughout the five participants’ interviews.
The second theme from the cross-case analysis included the incorrect use of mathematics
language. The researcher examined how the students read the questions aloud as well as how
they formulated their responses. Given the domain under study, Expressions and Equations,
several vocabulary words become critical in communicating mathematics. For instance, the
second item in the interview protocol, MS2, asked the respondents to find statements
101
representing the expression 2(d – 6). Unfortunately, several students either skipped over
mentioning the parentheses or did not know how to say them, as seen in Table 4.8. The
researcher recorded 28 instances of the incorrect use of mathematical language throughout the
participants’ interviews.
The third theme from the cross-case analysis from the retrospective think-aloud
interviews on the multiple-select multiple-choice items included mathematical
misunderstandings or incorrect justifications. This theme is very much like mathematical
cognitive disorganization; as defined by Arbuthnot (2009), “Cognitive disorganization is defined
as…when [test-takers] have difficulties [when taking a test] and feel confused approaching test
items” (p. 469). Within this section of statements, the researcher coded responses that included
incorrect computations, inaccurate mathematical statements, and misuse of symbols or
information. For instance, Allison commented that “sum and product means the same thing.”
Similarly, Emma stated that “product means division.” On item MS1, Jasmine referred to the
slash in a division problem; she said it “could also mean subtraction as well.” The researcher
coded 82 comments from the think-aloud interviews that were considered either a mathematical
misunderstanding or incorrect explanation to solving a problem.
The final theme from the cross-case analysis among the interview participants included
the use of testwiseness strategies. As referenced in the literature review, testwiseness strategy
examples include test-taking, test preparation, problem-solving, and metacognition (Hong et al.,
2006; Peng et al., 2014). In this study, the researcher recorded any strategy used to increase
one’s chance of answering the question correctly as testwiseness. Examples of testwiseness from
this study include underlining keywords, circling words in the problem, reading over the answer
choices, rereading the question, and eliminating answer choices. The researcher referenced 19
102
instances of testwiseness strategies throughout the interviews, eight of which were from Emma.
For example, Emma said, “I would underline three and in parentheses n plus six” for MS3.
Overall, the use of testwiseness strategies throughout the interviews was minimal and
underutilized.
Conclusion. As previously mentioned, one of the theories guiding this study is
Gardner’s theory of multiple approaches. The items included in this section of the research study
capture the students’ ability, or lack thereof, to approach a mathematical concept from multiple
points of entry. Based on the students’ performance on the mathematics assessment and the
responses from the retrospective think-aloud interviews, additional information was required to
understand better the experiences of the sixth-grade African American girl participants as it
relates to a pandemic school year and the Expressions and Equations domain. The themes from
the cross-case analysis were the basis for the interviews with their teachers.
Teacher Context.
After examining the students’ responses from the retrospective think-aloud interviews for
the multiple-select multiple-choice items from mathematics assessment, several questions arose
about how the current school year could have affected their mathematics performance and
trajectory in mathematics moving forward. For this question, the participants’ mathematics
teachers could provide context as to how the pandemic school year was a factor. As previously
mentioned, the two teachers included Mr. Roberts and Mr. Smith. Each teacher participated in a
Zoom interview with the researcher answering a semi-structured interview protocol (see
APPENDIX E) with additional questions prompted from their responses. The interview
questions had three main topics: teaching and learning during a pandemic, general mathematics
103
instruction and assessment, and their experience teaching the domain of interest, Expressions and
Equations.
Teaching and Learning During a Pandemic. The first group of interview questions
looked explicitly at the experience of teaching during a pandemic and its perceived impact on
student learning. Based on teacher responses, there were some common sentiments. First,
teaching during a pandemic has been difficult for both teachers. Mr. Roberts described the
school year as “stressful” due to technical issues and lack of student participation; he proclaimed,
“sometimes, students don’t do work.” Mr. Smith added in his interview that this year was
challenging, and they were unable to implement support like they were able to do in previous
years, such as in small groups effectively. According to Mr. Smith, “Teaching virtual was a new
thing for me…it was new in which you didn’t really know best strategies, best techniques to
actually teach kids while they are virtual.” In reference to small groups, Mr. Smith added, “We
could do small groups on Zoom, but it wasn’t as effective, in my opinion, as it would be in
person, especially.”
In addition to several unknowns in the virtual teaching realm, the teachers described
impacts on students’ learning experiences. Mr. Smith expressed that his students were not able
to get the full scope of services like in previous years. Already starting below grade level in
most cases, Mr. Smith mentioned his students would generally receive additional support from
staff members either in small groups or one-on-one. Specifically, he stated, “I could work with
students or have another staff member come work with some groups to kind of get them to sixth-
grade level.” The current school year proved challenging due to the quarantine restrictions and
social distancing requirements for in-person instruction. Mr. Smith also added that a significant
difference for this school year was the increased number of absences. According to Mr. Smith,
104
“I also noticed a lot of absences this year compared to last, a lot or more missing time.” He
attributed these absences to possible home situations; for example, Mr. Smith said, “it could be a
lot of things going on, [such as] having siblings at home they’d have to watch.” In summary for
how a pandemic impacted student learning, Mr. Smith expressed that his students “didn’t get the
full scope of the services like they normally would get like last year,” and he was not able to
provide them with adequate or timely feedback to support meaningful learning experiences.
According to Mr. Smith, “I’m giving feedback, but not when they did it, maybe in a week or
so…later that week or something like that, so they’re not getting it in the same moment.”
Mr. Roberts described similar situations as Mr. Smith with his students. One common
statement was that participation dwindled for online students; however, when students came
back to school for in-person learning, participation increased. Mr. Roberts attributed some of the
lack of online participation was due to internet issues; he said, “some students, they don’t have
access, especially Hispanic students.” He then added, “I see the difference between like some of
them [that] started with online, they don’t have any work done; but when they come to in-person,
they were smart.” He then told the story of one of his female students. He described her as a
great participant in class; however, while working at home, she was unable to finish her work
due to helping with her grandma. In addition to the lack of student participation, Mr. Roberts
added that virtual instruction was also taught at a slower pace than in-person instruction. For
instance, “the pacing is very slow; normally, I finish a lesson in 45 minutes, but online it takes
myself sometimes 60 minutes.”
To summarize, issues related to teaching and learning in a pandemic included the lack of
student participation, technical issues, and difficulties providing adequate student supports.
Participation was primarily affected by access to instruction and outside factors, such as home
105
responsibilities. In addition, as described by both teachers, students had internet issues and
challenges with virtual instruction. Lastly, the quality of instruction that students received,
whether in-person or virtually, was stifled by guidelines related to the pandemic. For instance,
due to social distancing in the classroom, small groups were limited or absent altogether.
Additionally, students were not able to receive timely instructional support or feedback in virtual
settings.
General Mathematics Instruction and Assessment. To understand the landscape for
how mathematics was taught and accessed, teachers answered interview questions on instruction
and assessment. The first question explored mathematics instruction related to vocabulary and
the curriculum implemented. Next, the interviewer queried the teachers about units, or modules,
taught throughout the academic year. Lastly, the teachers provided an overview of assessments
throughout the year and any test-taking strategies they covered with their students.
Prompted from the participants’ retrospective think-aloud interviews, the researcher
asked the teachers to provide information regarding the teaching and use of vocabulary words in
their instruction. According to Mr. Smith, he introduced vocabulary words to his students at the
beginning of a unit before instruction. His students were responsible for defining their
vocabulary words independently. He also used Khan Academy, which presents content through
online instructional videos, as a means to introduce new vocabulary to his students. Mr. Smith
stated the following regarding his support for his students’ mathematical vocabulary
development:
Normally, what I do with my math vocabulary, I introduce it to them ahead of time, so they could go define. I let them do it themselves. They define what the terms are, so they are getting it ahead of time. Also, I assign Khan Academy problems that gives…, that they hear and see these vocabulary words ahead of time as well. So, when they do come to me, for the first time teaching the lesson, I do this with all my lessons when you first come to me, I introduce, hey what did you learn about expressions? Like what's an
106
expression? I tried to see first based on their independent learning they did by themselves, maybe prior knowledge from fifth grade, “Hey, what's an expression?” They give me some answers; they are not going in deep. “Hey, this is an expression, this is an equation, these are examples,” and I give them, what I call, Word Wall. I upload to their Schoology account so they can always go back to be able to compare theirs to mine, also go back to look at as well. Also, I show them how to use this. So, I used this, so when I introduce a new term, that's the term that I use. I don't use no other term to kind of like... Hey, we're going to use this until we get to it. No, I'm going to use this term until you all get familiarized with it. We're going to hear it over and over.
When asked if there was a difference between in-person and virtual students learning vocabulary,
Mr. Smith expressed that his virtual students seemed to have more exposure to the sixth-grade
terms than his in-person students. Lastly, Mr. Smith included that their curriculum, Eureka
Math, teaches students how to describe vocabulary terms appropriately. For instance, Mr. Smith
added,
…just from the curriculum itself, like the Eureka curriculum, it exposes them to it that way. It says, you know, how to use proper terminology in math class. Well, that's, that's the main thing; it will teach you how to do the problems, but also how to build that proper vocabulary and mathematical terms as well.
Mr. Roberts echoed similar statements as Mr. Smith in his interview.
When asked about teaching vocabulary to his students, Mr. Roberts mentioned that he
used similar strategies and resources as Mr. Smith. Specifically, they both teach vocabulary at
the beginning. Mr. Roberts stated in his interview, “We introduced them like in the beginning of
the lesson, and I constantly use like, this is the term we will be using.” He also mentioned the
use of Khan Academy as an instructional tool for teaching vocabulary. When asked about the
use of manipulatives, neither teacher mentioned their usage with vocabulary introduction, at least
for the Expressions and Equations domain.
Mr. Smith provided the researcher with context regarding the units and assessments
throughout the school year. He mentioned that students started the school year off virtually with
the first module, or unit, in Eureka, which was on ratios. The first module was approximately
107
from mid-August to September. The second module, Fractions and Decimals, was from
September to late October; several students returned to campus for in-person instruction by this
time. The last module they taught prior to the winter break was Module Three, Coordinate
Planes. After winter break, teachers taught the fourth module, Equations, and Inequalities, from
January to April. According to Mr. Smith, Module Four was the most extended module. The
start of their fourth module was virtual for all students at the beginning, and some students
returned to campus during the first half of the second semester. Mr. Smith added for module
four that “We wrapped up with the module before Spring Break but took our test after within a
couple days of being back.” Adding a bit more context, the students took the assessment used in
this study before leaving for Spring Break and before their module assessment.
Throughout the school year, students were responsible for taking multiple types of
assessments. First, they started the school year off with a diagnostic of sorts that assessed their
performance on fifth-grade standards. Mr. Smith described the following regarding their first
assessment:
The first week of school, we gave an assessment from last year's ANet assessment. Pretty much, that was kind of like a benchmark, but it wasn't a benchmark. This one was pretty much to see like what have you learned? So, they put some standards from fifth grade that they would need to know to be ready for sixth grade and tested them on that at the first week of school. We used that information to pretty much kind of create an intervention plan.
Then, after each module was covered, students partook in a unit test. Lastly, students were
administered benchmark assessments sporadically throughout the year through a partner
company, ANET.
Before addressing the Expressions and Equations domain, teachers also provided
information about their cultivation of test-taking strategies among their students. Although he
108
had not started reviewing test-taking strategies yet by the time of the interview, Mr. Roberts
mentioned the following:
I'm planning to you know, go over some strategies like showing the test tools, like sometimes they don't know how to put formulas. Like when they get stuck, you know, mark like the question that you can come back to it, elimination methods. I'm also planning to like go over some open-ended questions. As you answer, what is the question asking you? Some reading questions, like highlighting the key, key information. So that's what I'm thinking of. I'll find something more productive from the other websites, to be able to present.
He also added that he would focus on test-taking strategies, most likely a few days before the
LEAP 2025 assessment. Mr. Roberts also added that one central area of concern he had for his
students was open-ended questions. The assessment items Mr. Roberts was referring to include
the extended constructed-response items. Unlike the short-answer constructed-response items
included in the mathematics assessment in this study, extended constructed-response items
require students to provide detailed answers, explain their reasoning, justify their responses,
among other requirements. These items also include a rubric, and students can receive up to six
points on one of these items on the LEAP 2025 assessment (Louisiana Department of Education,
2020, p. 5).
Mr. Smith mentioned that he also did not focus on teaching many test-taking strategies to
his students yet. He did, however, review two strategies, some of which his students used in
their retrospective think-aloud interviews. Mr. Smith mentioned the following regarding test-
taking strategies:
The main ones, I didn’t focus on testing strategies yet, up to this point. Now I am because we're getting close to LEAP. But the main one that I did for benchmark, I taught them to, I taught them how to use process of elimination, which is a big one. I also taught them the read-write-draw method. Especially with math terms, because I noticed most of my students, they struggle with word problems; like it's a lot of information, how to pull out what I need. So, I did show them um, I did show them those two test-taking strategies. Mainly those two, and then we still got more coming up before LEAP. But those are the main two.
109
When asked about what he noticed about his students on certain item types, Mr. Smith responded
that he believed two-part items, referred to as Part A – Part B questions, were a struggle for his
students. Students would use their answer from Part A to solve Part B in most cases with these
problems.
Mr. Smith mentioned that his students also struggled with the ANET assessments
because they were not close to the other assessments they had seen throughout the year. ANET
assessments were described as more difficult than Eureka assessments and even the LEAP, in
Mr. Smith’s opinion. As stated by Mr. Smith, “To me…they're more advanced than anything
you would get from like an Eagle or LEAP question bank or anything you find on Edulastic.”
Mr. Smith also included that he examined the test items to see if he could find the difference
between how his students performed on those in ANET compared to those in other item banks.
Mr. Smith mentioned specifically,
I did put constructed responses on my test to see if the questions from Eureka are different, if it was the question that was the issue, or was it just the kind of question? And they did relatively better on Eureka questions, constructed response questions than the benchmark, ANET constructed-response questions. So, I'm thinking it's the question itself.
Mr. Smith also included in his statement that the constructed-response items on ANET proved to
be more challenging for his students than the Eureka or LEAP-aligned test items, like Mr.
Roberts. Neither teacher mentioned a careful examination of multiple-select multiple-choice
items. However, they did provide context regarding the scoring of multiple-select items.
Students receive partial credit for multiple-select multiple-choice items on their Eureka
assessments; neither teacher mentioned if they knew how multiple-select items were scored on
their ANET assessments.
Expressions and Equations. The last set of interview questions were around the topic
of Expressions and Equations. In this set of questions, teachers were asked to provide
110
information pertaining to their students' strengths and areas of need within the unit.
Additionally, teachers were asked to reexamine the assessment from the study and determine its
fairness and alignment with the material taught within the unit. Finally, teachers were offered a
moment to share any additional context they would like to present about the school year,
themselves, their students, or the unit in question.
Teachers were asked to share information regarding how their students did well with the
unit on Expressions and Equations and areas in which they may have struggled. Mr. Roberts
described using the distributive property as a strength for his students; he also added, “I had
problems from the past, so they always forget to do the second part, multiplication.” Solving
one-step equations was also another strength identified by Mr. Roberts. He mentioned,
“Students like can easily figure out what to put…most of the students like they know like x
represents unknown and they can figure out what number it should be.” When asked about areas
in which his students struggled, Mr. Roberts mentioned complex equations as a concern. Mr.
Roberts shared that his students struggled using the opposite operations when solving equations.
In some cases, they could substitute a value and determine the missing variable on easy
equations, but students had difficulty working the problem backward with more complex
equations. For instance, Mr. Roberts stated, “I can say 90 percent [of students] can figure it out
with easy numbers once, but when you make it a little bit challenging, they can struggle because
they’re still transitioning to algebraic thinking like.”
As for Mr. Smith, he expressed varying strengths and areas of need for his students.
Specifically, Mr. Smith stated that this unit was a lot more fun for his students. For instance, he
mentioned how “they want to solve equations;” it was something they had been waiting to do. In
addition, Mr. Smith included that his students did well with the vocabulary and translating word
111
problems into expressions and equations in the Expressions and Equations related module.
Although he mentioned having “ups and downs with it,” Mr. Smith stated that his students
“really worked hard, and they really were buying into what I was teaching.” When describing
areas in which his students struggled, Mr. Smith mentioned exponents as a great area of concern.
He mentioned, “They constantly got confused with repeated addition and repeated
multiplication.” Another area in which they struggled included equations. Mr. Smith stated the
following regarding equations:
When solving one-step equations, they may solve them with mental math, so it's like they can solve them with mental math. But when you start getting into it, I want them to think algebraically. So, when they get to those two-step equations or three-step equations in seventh grade, they're going to be completely lost.
Mr. Smith did add that one way he might help his students in the future with equations is by
using a balance or scale as a tool; essentially, students would use a balance beam to show that
every operation used must keep the terms equal on both sides of the equal sign. This method
was described to him by a seventh-grade teacher, he added.
Before their interviews, the mathematics teachers were sent another copy of the
mathematics assessment used in this study. Teachers were then asked to consider the items on
the assessment with what was taught to their students to determine if it was a fair assessment or
not. According to Mr. Smith, he believed the 15-item mathematics assessment used in this study
was a fair representation of what his students should be able to do. Specifically, Mr. Smith
stated, “we went over it way ahead of time, so yeah, I feel it was fair.” He even agreed that the
assessment used in this study was almost like a pre-test for their module assessment. Mr. Smith
mentioned how his students used the study assessment as an opportunity to consider any
questions they may have had before their module test. As for Mr. Roberts, he, too, agreed that
the assessment was fair; however, he did notice some differences with how the students were
112
taught and how the assessment measured their use of equivalent expressions. Mr. Roberts stated,
“So it is fair, but our curriculum doesn’t include like distributing and combining like terms at the
same time;” he then added, “It’s a little bit challenging for them.”
Lastly, teachers were asked to provide any additional context for the study. Mr. Smith
included one thing that he noticed specifically about the Black girls that he taught was the
number of absences was profound this year. As stated by Mr. Smith,
Only thing I will say is, just knowing my students, the Black girls that I do teach, I don't teach that many, but the ones that I do teach, I will say, the only thing, attendance would be, as a whole, attendance would be lower compared to the boys and then everybody else, I will say. Yeah, so attendance probably a little bit low compared to everybody else, and then that's probably it.
Mr. Roberts did not have any additional information that he wanted to provide.
Conclusion. The two teachers provided context around the academic school year in
which this study took place. The big takeaways from their interviews include the challenges
faced with teaching during a pandemic, most notably of which include the following: lack of
student participation, high student absences, technical difficulties with online learning, and the
limited capacity to meet student needs either in-person or virtually. Test preparation was also
mentioned as being a focus for the latter part of the academic school year. The impact of these
challenges alone could prove detrimental to the trajectory of their students’ mathematical futures.
Mixed Methods Results
According to Creswell and Plano Clark (2018), a promising approach for an explanatory
sequential mixed methods design is “to determine how the qualitative themes and codes provide
additional insight into and nuanced about the quantitative database” (p. 238). Following the
analysis procedures for explanatory sequential mixed methods, the researcher analyzed the
quantitative results of the assessment first. Next, the researcher used the results to select the
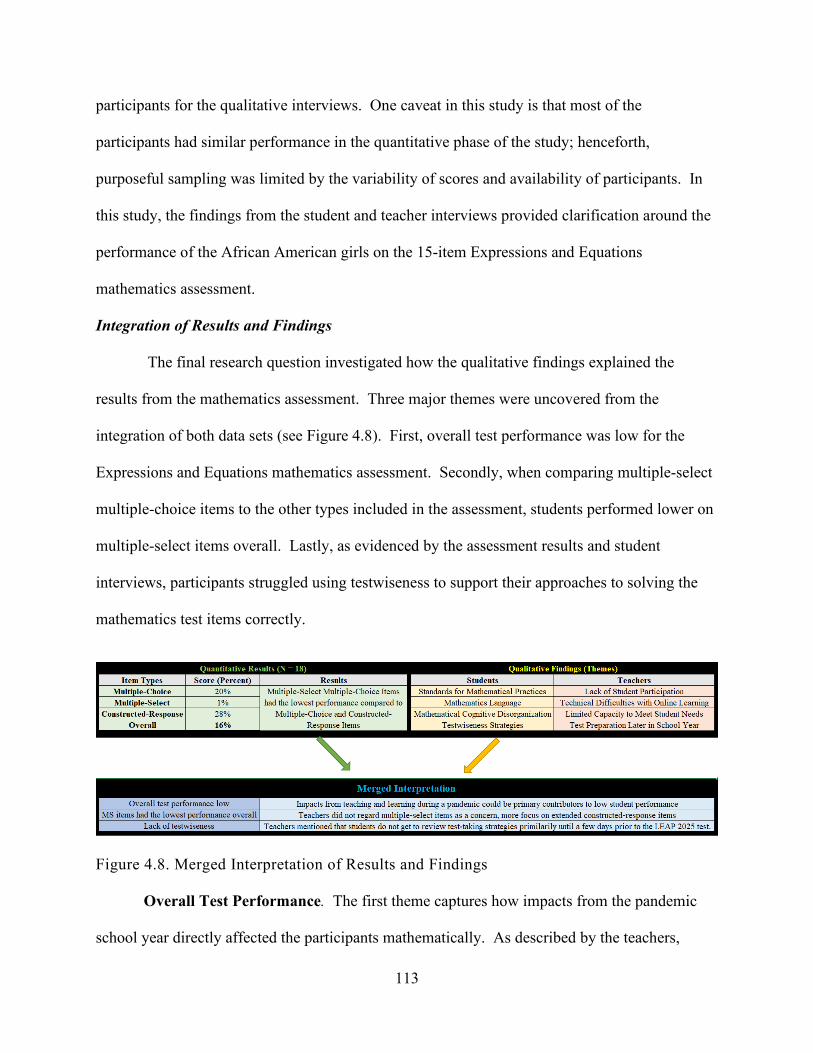
113
participants for the qualitative interviews. One caveat in this study is that most of the
participants had similar performance in the quantitative phase of the study; henceforth,
purposeful sampling was limited by the variability of scores and availability of participants. In
this study, the findings from the student and teacher interviews provided clarification around the
performance of the African American girls on the 15-item Expressions and Equations
mathematics assessment.
Integration of Results and Findings
The final research question investigated how the qualitative findings explained the
results from the mathematics assessment. Three major themes were uncovered from the
integration of both data sets (see Figure 4.8). First, overall test performance was low for the
Expressions and Equations mathematics assessment. Secondly, when comparing multiple-select
multiple-choice items to the other types included in the assessment, students performed lower on
multiple-select items overall. Lastly, as evidenced by the assessment results and student
interviews, participants struggled using testwiseness to support their approaches to solving the
mathematics test items correctly.
Figure 4.8. Merged Interpretation of Results and Findings
Overall Test Performance. The first theme captures how impacts from the pandemic
school year directly affected the participants mathematically. As described by the teachers,
114
several factors impacted teaching and learning due to the COVID-19 pandemic. For instance,
students had higher than usual absences; teachers had difficulties transitioning back and forth
between in-person and virtual instruction; students were delayed feedback for their assignments
due to the virtual limitations and challenges placed upon their educators. Teachers also
attributed lack of student participation as an issue throughout the school year as well.
As evidenced by the data for the 15-item mathematics assessment, all participants
struggled with the test items; of most substantial concern were the multiple-select multiple-
choice items. For instance, the students had an overall score of 16% for the entire assessment;
for the different item types on the assessment, they answered 20%, 1%, and 28% of the MC,
MSMC, and CR items correctly, respectively. Even though the teachers agreed that the
instrument used in this study was a fair assessment of what was covered instructionally with
students, they were not alarmed when discussing their students’ test results. The scoring method
for the MSMC items was also a factor in their overall performance.
Multiple-Select Multiple-Choice Items. According to the findings from the student and
teacher interviews, students struggled when faced with multiple-select multiple-choice test items
within the Expressions and Equations domain. Additionally, the teachers did provide context
around the lack of attention to these items throughout the school year. Specifically, the priority
items of concern for teachers were the extended constructed-response items; again, these item
types were not assessed in this study for multiple reasons.
Another area of concern with the MSMC items was the scoring method. As mentioned in
the teacher interviews, the teachers do not adhere to All-or-Nothing scoring, the method used to
score the LEAP 2025 assessment, on class assessments. The teachers also did not seem to know
how the MSMC items were scored on the state assessment. Lack of transparency around the
115
type of items students will see and how those items are scored could negatively impact students.
Additionally, the scoring method could also hinder students, especially Black girls, as seen in
Table 4.6. Finally, by using the All-or-Nothing scoring method, issues of validity are raised.
For instance, it is not certain that students who received a score of zero did not know the content;
however, they may have had partial knowledge of the assessed topic and did not received credit
for that understanding due to the scoring method.
Lack of Testwiseness. In addition to the hindrances associated with COVID-19 on
instruction and learning, another common practice expressed by the teachers is the lack of
assessment support until state testing at the end of the academic year. For instance, both teachers
proclaimed that they would get into covering test-taking strategies a few days before the LEAP
2025 assessment. However, by waiting to review or introduce such strategies, the teachers may
have missed some learning opportunities for their students throughout the school year.
Students were assessed multiple times during the school year; however, only one
assessment carried the weight of accountability, the LEAP 2025 state assessment. It is highly
likely that the students participating in this study did not approach the 15-item mathematics
assessment with the conviction that they may have used on their actual state standardized
assessment. With that in mind, teachers also eluded that other assessments taken throughout the
year paled compared to the LEAP 2025 test. These connotations can be observed with responses
mentioning the review of test-taking strategies being carefully covered right before state testing
instead of earlier in the school year.
There are several testwiseness strategies that teachers could have engaged their students
in earlier in the school year. In addition, the teachers could have created opportunities to practice
or share testwiseness strategies with students to help them perform better on their assessments
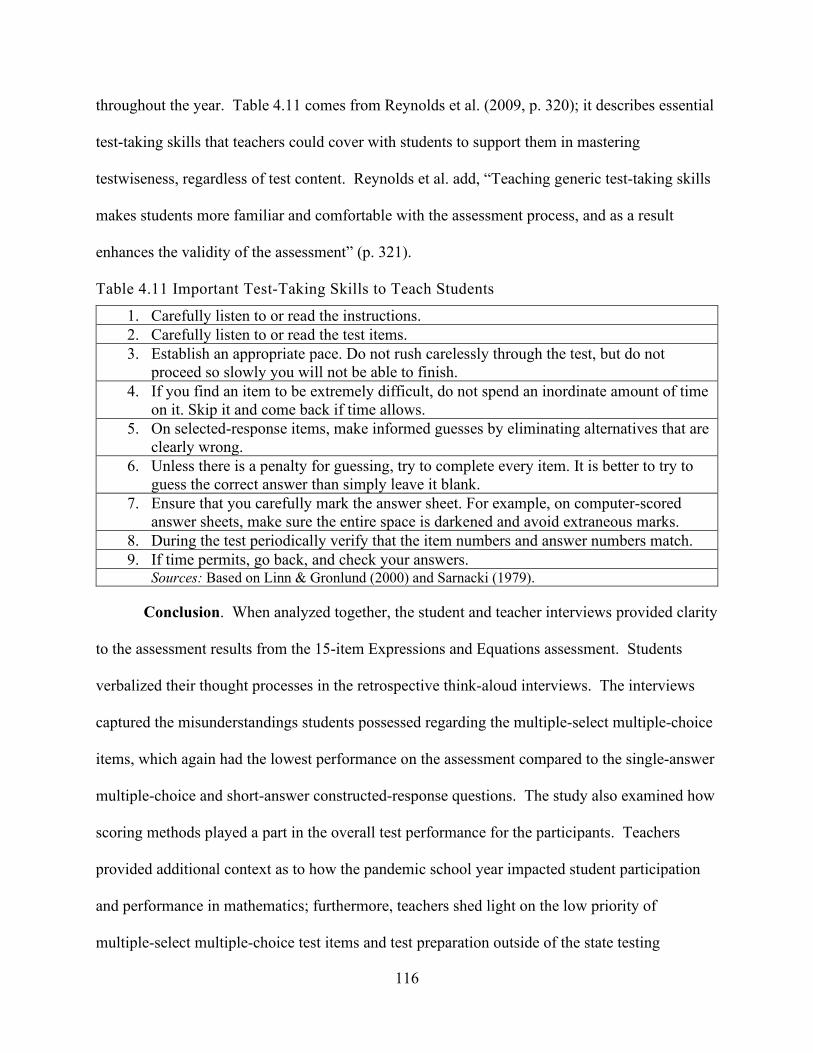
116
throughout the year. Table 4.11 comes from Reynolds et al. (2009, p. 320); it describes essential
test-taking skills that teachers could cover with students to support them in mastering
testwiseness, regardless of test content. Reynolds et al. add, “Teaching generic test-taking skills
makes students more familiar and comfortable with the assessment process, and as a result
enhances the validity of the assessment” (p. 321).
Table 4.11 Important Test-Taking Skills to Teach Students
1. Carefully listen to or read the instructions. 2. Carefully listen to or read the test items. 3. Establish an appropriate pace. Do not rush carelessly through the test, but do not
proceed so slowly you will not be able to finish. 4. If you find an item to be extremely difficult, do not spend an inordinate amount of time
on it. Skip it and come back if time allows. 5. On selected-response items, make informed guesses by eliminating alternatives that are
clearly wrong. 6. Unless there is a penalty for guessing, try to complete every item. It is better to try to
guess the correct answer than simply leave it blank. 7. Ensure that you carefully mark the answer sheet. For example, on computer-scored
answer sheets, make sure the entire space is darkened and avoid extraneous marks. 8. During the test periodically verify that the item numbers and answer numbers match. 9. If time permits, go back, and check your answers.
Sources: Based on Linn & Gronlund (2000) and Sarnacki (1979).
Conclusion. When analyzed together, the student and teacher interviews provided clarity
to the assessment results from the 15-item Expressions and Equations assessment. Students
verbalized their thought processes in the retrospective think-aloud interviews. The interviews
captured the misunderstandings students possessed regarding the multiple-select multiple-choice
items, which again had the lowest performance on the assessment compared to the single-answer
multiple-choice and short-answer constructed-response questions. The study also examined how
scoring methods played a part in the overall test performance for the participants. Teachers
provided additional context as to how the pandemic school year impacted student participation
and performance in mathematics; furthermore, teachers shed light on the low priority of
multiple-select multiple-choice test items and test preparation outside of the state testing

117
window. Overall, the qualitative findings from both teachers and students supported the
quantitative results of the mathematics assessment.
118
CHAPTER 5. CONCLUSIONS AND DISCUSSION
Introduction
According to several researchers, Black girls and women are underrepresented in
scholarly research pertaining to mathematics (Gholson, 2016; Joseph, 2017; Joseph, Hailu, &
Boston, 2017); this study sought to tip that scale. Furthermore, Mowrey and Farran (2016)
revealed that mathematics in middle school is one of the more crucial times for students; during
these years, students make decisions that impact course-taking trends later in their academic
careers, such as high school and postsecondary school. Therefore, this study aimed to shed light
on Black girls in mathematics at the middle school level.
The purpose of this study was to determine how various item types impacted
mathematics performance among middle school African American girls. Of specific interest
were multiple-select multiple-choice (MSMC) test items, which were preferred for their rigor,
cost-efficiency, and reduced scorer error compared to extended constructed-response items
(Hohensinn & Kubinger, 2011; Kastner & Stangl, 2011). This explanatory sequential mixed-
methods study consisted of two phases, a quantitative mathematics assessment followed by two
rounds of interviews with students followed by teachers, respectively. The findings from the
students’ and teachers’ interviews were used to explain the results from the mathematics
assessments.
The research questions that guided this study include:
1. How do sixth-grade African American girls at an urban charter school perform on
multiple-select multiple-choice (MSMC) mathematics test items compared to single-
select multiple-choice (MC) and short-answer constructed-response (CR) items?
119
2. How do sixth-grade African American girls at an urban charter school process MSMC
items cognitively?
3. How has teaching during a pandemic impacted the mathematical trajectory of sixth-grade
African American girls at an urban charter school?
4. What insights into the sixth-grade African American girls’ cognitive processes and
experiences during a pandemic do the interviews offer about the results from the
mathematics assessment?
In this study, 18 African American girls at an urban charter school in the southeastern
United States participated in a 15-item Expressions and Equations mathematics assessment. On
the assessment, the girls answered five similar questions with three different versions of test
items: single-answer multiple-choice (MC), multiple-select multiple-choice (MSMC), and short-
answer constructed-response (CR). After the assessment, the students were asked to participate
in a retrospective think-aloud interview in which they verbalized their thought processes solving
only the MSMC items from the 15-item mathematics assessment. Unfortunately, only five of the
18 students returned the appropriate forms to participate and were available for interview.
Following the participants’ interviews, their two mathematics teachers were also questioned to
provide additional context for the study. Given the extenuating circumstances surrounding the
academic school year with the coronavirus pandemic, their teachers were able to highlight
factors that may have contributed to their underperformance.
This mixed-methods study required both quantitative and qualitative methods to answer
the four research questions guiding the investigation. For the first quantitative research question,
the researcher collected the students’ responses to the 15-item mathematics assessment then
analyzed the data using a repeated-measures ANOVA; due to assumption violations, the
120
researcher used Friedman’s nonparametric alternative to the repeated-measures ANOVA. Next,
the researcher conducted individual interviews with five participants from the first phase of the
study to answer the second qualitative research question. The participants’ responses were coded
individually initially for a within-case analysis for each participant, and then the codes were
compared for a cross-case thematic analysis. The third research question, also qualitative,
consisted of the teacher interviews, which were analyzed for themes that supported findings from
the student interviews. The final mixed-method research question used the findings from the
qualitative phase of the study to support the results from the quantitative phase.
This final chapter discusses the conclusions for each research question, implications for
policy and practice, recommendations for future research, and study limitations. First, the
conclusions section reiterates the findings and results from the previous chapter and tying the
present study back to the literature review. Next, the researcher considers the implications for
policy and practice regarding African American girls and multiple-select multiple-choice items
in middle school mathematics. Finally, before concluding, the recommendations for future
research section will provide suggestions that expand beyond the limitations of this study.
Conclusions
Quantitative Conclusions.
The results and conclusions for the quantitative component of the study include the
statistical analysis of research question one. The first research question determined if there were
any significant differences among the mathematics item types for the African American girls on
the 15-item mathematics assessment. Due to assumption violations, Friedman’s nonparametric
test was as opposed to the repeated-measures ANOVA. This study’s quantitative analysis results
were compared to the previously discussed literature at the end of this section.
121
Black Girls’ Mathematics Performance. The findings for the first research question
confirm that there were significant differences among the three different types of test items for
African American girls. The analysis also showed that Black girls had the lowest performance of
MSMC compared to both MC and CR items. Furthermore, they had the highest performance on
constructed-response (CR) items, followed by multiple-choice single-answer (MC) items.
These findings lend positively to the literature, primarily because this exclusive analysis
of African American girls within mathematics on specific types of test items is exceptionally
narrow. As mentioned by featured scholars in the literature review, Black girls are
underrepresented and overlooked in mathematics literature unless highlighted as comparison
measures for other gender-racial groups (Gholson, 2016; Joseph, 2017; Young et al., 2018). This
finding regarding the MSMC test items for Black girls does not exist in the literature before this
study. However, one study reported in the literature had similar findings when comparing
scoring methods for multiple-select multiple-choice items.
Kastner and Stangl (2011) compared CR and MS items for 13 graduate students in a
marketing course in Vienna, Austria. The researchers found that CR and MS had similar
performance when MS items were scored for Number Correct (NC) scoring; this scoring method
allows the student to receive credit for correct responses selected and ignores incorrect
selections. Additionally, Kastner and Stangl’s study also found that when using All or Nothing
(AN) scoring, the same scoring used in the present research study in which students only receive
credit for correct answer selections, students were penalized more for over-or-under-selecting
answer choices. The researcher selected the AN scoring method in the present study due to
scoring metrics for the LEAP 2025 mathematics assessment.
122
In accordance with Reardon et al.’s (2018) study, item type matters in standardized
testing. Recall from the literature review that Reardon et al. found that girls tend to perform
better on constructed-response items compared to multiple-choice items. Those same findings
were true for this study’s participants. Although the difference was not statistically significant,
the Black girls did have a higher score on CR items compared to both MC and MSMC items.
In a separate, older research study examining the performance of MC and CR items, the
findings were contradictory. For instance, in the study by Gallagher et al. (2000), 14 high-school
girls performed better on MC items (34% correct) than free-response, or CR, items (19%
correct). However, those findings were inconsistent with the present study; the 18 African
American girls had slightly higher CR item performance than MC item performance, 28%
correct compared to 20% correct, respectively. The difference between MC and CR items was
not statistically significant according to the statistical analysis.
In summary of the conclusion for the first research question, this study agrees with
similar studies related to item type format and difficulty of test items. Recall that each item on
the assessment was mirrored with three versions: MC, MSMC, and CR. This study found that
regardless of item topic, MS items had lower performance overall than the other two versions of
item types. This finding is supported with previous literature; aforementioned, the item formats
and question types were more suggestive of student performance as opposed to the difficulty of
the mathematics test items (Arbuthnot, 2009; Davies et al., 2016; Gallagher et al., 2000; Moon et
al., 2019; Reardon et al., 2018).
Qualitative Conclusions
The findings and conclusions for the qualitative section of this study answered the second
and third research questions. The second research question examined how five African
123
American girls processed MSMC items cognitively in a retrospective think-aloud interview. The
third research question explored the additional context that their mathematics teachers could
provide regarding teaching and learning during a pandemic, general mathematics instruction and
assessment, and teaching the Expressions and Equations unit. The findings from both qualitative
research questions were compared to the literature guiding this study.
Mathematics Cognition. The following research question uncovered four overarching
themes for how the African American girls processed the MSMC items cognitively. The first
theme was the use of the Standards for Mathematical Practice (SMPs). The second theme was
incorrect mathematical language. The third and fourth themes were mathematical
misunderstandings and the use of testwiseness strategies, correspondingly.
Standards for Mathematical Practice. As previously mentioned, the SMPs represent
habits of mind for mathematically proficient students. The participants in this study modeled
three of the eight practices during their retrospective think-aloud interviews. The first was
6.MP.1, the ability to make sense of problems and persevere in solving them. Although the girls
did not answer any assessment items correctly based on the scoring method, there was evidence
that they could justify their reasoning for some of the correct answer choices selected. The
second SMP captured was 6.MP.4, modeling with mathematics. With this practice, students
modeled their thinking using numerical statements and the four operations of mathematics.
Lastly, 6.MP.6 was revealed; this final SMP can be described as attending to precision.
Attending to precision includes defining symbols appropriately and expressing mathematically
sound rationales appropriate for the context of the problem they are solving. The researcher
found 53 instances of SMPs used throughout the five participants’ interviews.
124
Mathematical Language. In the second theme from the participants’ think-aloud
interviews, the researcher captured instances in which the students misused mathematical terms.
From identifying parts of an expression to reading an equation aloud, vocabulary is an integral
part of developing algebraic proficiency. There were 28 instances of inaccurate terminology
recorded within this theme. Examples of incorrect mathematical language included misstating
mathematical expressions or symbols. For instance, several of the students read the expression
2(d – 6), which could be stated as “twice the quantity of d minus six,” as “two d minus six” or
“two and d minus six.”
Mathematical Misunderstandings. The third theme highlighted improper mathematical
statements or justifications. For instance, some participants made comments misrepresenting
facts such as inaccurate computations or the incorrect use of symbols and operations. One
example of this occurrence was when Emma described multiplication and division as the same
thing; specifically, she mentioned that “product means division” another statement from Emma
included the incorrect use of the term “factors.” For instance, she stated, “20 and 16 is basically
like factors of four;” the term she should have used was multiples instead of factors. The
researcher recorded 82 uses of incorrect mathematical justifications or statements.
Testwiseness Strategies. The final theme for the retrospective think-aloud interviews
with the five students included testwiseness strategies. As previously stated, testwiseness
captures a student’s ability to use the testing situation to their benefit; this includes using
strategies typically referred to as test preparation and test-taking strategies (Hong et al., 2006;
Peng et al., 2014). Although each student interview participant was recorded using at least one
example of testwiseness strategies, Emma was found to use these strategies more often than the
other participants. There were 19 occurrences of testwiseness strategies among the five
125
interview participants. For instance, the researcher captured the following uses of testwiseness
from the interview participants: underlining keywords, reading over the answer choices, circling
words in the problem, eliminating answer choices, and rereading the question.
In connection to the literature review, there were a few common themes. For example,
one study with similar bearings was Peng, Hong, and Mason (2014), which found among a group
of Chinese 10th-grade students that effective test-taking strategies included avoiding errors,
omitting answer choices, and using context clues. Likewise, the five interview participants in the
present study were recorded using similar strategies such as eliminating answer choices when
able and using question context to try to help them solve the problems, especially for the last
MSMC item. Unfortunately, the rate of such strategies was low overall for all five interview
participants in this study.
A separate study looked at confidence and mathematics performance levels. In Morton’s
(2014) study, eighth-grade African American female students were measured on proportional
reasoning through an assessment, interviews, and autobiographies. Like the present study,
Morton found the girls in the study were positive or confident in their mathematical abilities
even though their performance demonstrated otherwise. As witnessed by the researcher, the
tones of the participants’ voices while answering some of the items were primarily positive, even
though their statements were incorrect. Moreover, Jasmine was one of the only students that
showed signs of anxiety or stress while testing.
In addition to the research from the literature review related to mathematics testing,
conventional and unconventional strategies were identified among the five interview
participants. As referenced by Arbuthnot (2009), “Gallagher and colleagues (2000) explain that
conventional strategies are those solutions that are primarily computational strategies that are
126
taught in school and are systematic in nature” (p. 462). The conventional strategies identified in
this study were captured within the Standards for Mathematical Practice theme, specifically
standard 6.MP.4, modeling with mathematics. Unfortunately, any attempt at unconventional
strategies, defined as “problem-solving techniques that use logic, estimation, or insight” (p. 462),
was coded under the theme of mathematical misunderstandings. For instance, the students tried
to estimate and rationalize how they could solve the word problem, MS5; however, each attempt
was far from logical.
In summary, the participants from the retrospective think-aloud interviews offered insight
into how they interpreted, processed, and perceived the MSMC test items. Unlike most of the
research studies included in the literature review, this present study provided a space for
examining multiple-select multiple-choice items in an under-examined group within
mathematics, Black girls. The findings from the girl participants were strengthened when
coupled with additional context from their teachers.
Teacher Context. The third research question sought to provide additional context to the
students’ interviews from research question two. Again, the two math teachers answered
interview questions that stemmed from the participants’ responses. The questions were grouped
into three categories: teaching and learning during a pandemic, general mathematics instruction
and assessment, and Expressions and Equations. For this analysis, the researcher coded
statements from the teachers looking for commonalities then combined them to create the four
themes derived from the semi-structured interviews: lack of student participation and increased
student absences, technical difficulties with virtual learning, limited capacity to meet students’
instructional needs, and delayed test preparation.
127
Lack of Student Participation. COVID-19 required the implementation of new school
structures to provide safe learning conditions for all. Unfortunately, this new change looked like
learning in a socially distanced space or a virtual environment for most students. In some cases,
students were taking online classes for the first time in their academic experiences. Some
students were able to keep up with the online or socially distanced learning; others were not.
Two examples of students’ lack of participation were present in the teachers' comments, such as
Mr. Smith mentioning “students don’t do work,” or as Mr. Roberts stated, “they don’t have any
work done.” Both teachers also shared that they noticed an increased number of absences this
year as opposed to previous years. Mr. Smith emphasized that this notice in absences was more
apparent for his female African American students. Explicitly, he stated that for his Black girls,
“attendance would be, as a whole, attendance would be lower compared to the boys and then
everybody else.” Students’ lack of participation and increased absences, in-person and virtually,
could be attributed to factors outside of their control, such as technology or familial
responsibilities.
Technical Difficulties. One of the hallmarks of teaching during a pandemic was the shift
to online instruction and learning. This change in instructional setting from real life to the virtual
environment proved challenging for teachers and students. As Mr. Smith exclaimed, this
“teaching virtual was a new thing for me,” similar for Mr. Roberts as well. Nevertheless,
teachers worldwide learned to adjust their instruction to continue teaching their students,
regardless of where they were learning.
A few drawbacks of supporting students online included the teachers’ inexperience for
virtual instruction, internet access, and connectivity issues. For some students, getting access to
a computer or internet was easy; it was an eye-opener regarding the resource gap among students
128
for others. In addition, teachers had to ensure they provided their students with flexible options
for completing assignments and grading, especially since some factors were not within their
control. The teachers mentioned issues in their interviews regarding the virtual learning
environment, including delayed instruction time in the virtual setting. They also mentioned
delayed feedback for student work that would otherwise be graded in person in a non-COVID
school year. Nonetheless, teachers and students adjusted their daily lives to survive schooling in
a pandemic.
Limited Instructional Support. In addition to the technical concerns with online
learning, the teachers also mentioned not being able to meet their students’ needs to the best of
their abilities due to barriers inflicted upon them from COVID restrictions. For instance, Mr.
Smith emphasized how small groups were one form of differentiated support he was restricted in
implementing with his students. As he stated in the interview, “We could do small groups on
Zoom; but it wasn't as effective, in my opinion, as it would be in person, especially.” He also
mentioned how the number of support staff was lower this school year than in previous years due
to the pandemic. Henceforth, additional targeted intervention activities, such as pullouts or small
groups, were negatively impacted due to the decreased number of staff members available.
Lastly, there was also a disconnect between observed student performance and teacher
perceptions regarding student performance. Without teachers acknowledging their students’
actual performance, learning opportunities may be surpassed or overlooked. As seen in the
teachers’ interviews, they both spoke positively of their students’ mathematics language
development and efforts on the Expressions and Equations domain. They mentioned that this
unit was better for their students than previous units. Unless the students tested drastically
129
different on the assessment included in this study, then mathematically, the students have a far
way to go until reaching proficiency.
Delayed Test Preparation. The last finding from the teachers’ interviews was the delay
in testing preparation. Until the mathematics assessment for this study, only one of the teachers
had covered any testing strategies with their students, Mr. Smith. He mentioned two strategies
he had reviewed, the read-write-draw method and the process of elimination. At least one of his
students, Emma, used both strategies during the retrospective think-aloud interviews. Both Mr.
Roberts and Mr. Smith mentioned they would review test-taking strategies and best practices for
testing a few days before their students took the LEAP 2025 assessment. This finding reiterates
how standardized tests are perceived or treated as more important than other school assessments
for their accountability and high-stakes nature.
The teachers also mentioned how they tend to focus on constructed-response items
compared to other question types, aside from multipart items such as Part A – Part B questions.
Given the tests students are administered throughout the year, from teacher unit assessments to
ANET benchmark assessments, students appeared to perform more poorly on extended
constructed-response items according to their teachers. Again, these items were not included in
this study for multiple reasons, including but not limiting to the length of time for students, time
for grading, scorer reliability, comparability to the other items on the assessment, and more.
Whereas the items selected for this study would have all received one point on the LEAP 2025
test, extended constructed-response items typically are scored for higher points, sometimes up to
six points per item. Multiple-select multiple-choice items seemed to have only been an
afterthought during the interview. This finding may be because the teachers did not score the
MSMC items like the LEAP 2025 assessment throughout the year, using All-or-Nothing (AN)
130
scoring; AN scoring gives credit for only the correct answer choices being selected (Kastner &
Stangl, 2011). Instead, the teachers used Number Correct (NC) scoring. With NC scoring,
students receive partial credit on MSMC items for selecting correct answer choices and are not
penalized for selecting incorrect answer choices (2011).
In contrast to the literature reviewed earlier in this study, the teachers could not
adequately meet the needs of their African American female students. They could not provide
the Black girls, or most other students for that matter, a space that would cultivate or enrich their
learning experiences due to the pandemic, whether due to social distancing or drawbacks to the
virtual learning environment. As previously referenced, Black girls face double oppression
compared to most other minority groups, especially Black boys, and White girls. According to
Joseph et al. (2019), with “the compounded oppression and marginalization many Black girls are
likely to face…more than just understanding concepts and ideas is needed” (p. 144).
Additionally, “some Black girls also tend to be intellectually and emotionally invisible in math
classrooms (Joseph, 2017), so when math teachers give them dedicated time to explain math
ideas, teachers are also acknowledging the girls’ vulnerability as children and adolescents” (p.
144). Mr. Smith did mention that social and emotional needs were not being met during the
pandemic. He stated the following in his interview:
…they're missing that, that social-emotional learning as well. So, it's like, Yes, are they accommodations followed? But did they get, in my opinion, get the full scope of services that I feel like a teacher should give a student regardless? I don't think so.
These findings support the need for special conditions to be in place for the proper social and
academic development for students to take place, especially African American girls. As
mentioned in the literature review, Joseph et al.’s (2019) study suggested that African American
girls need that human aspect to counteract the negative dispositions they face. Moreover, this
131
academic school year allowed for minimal or limited human interaction, as witnessed in this
study.
Mixed-Methods Conclusions
Integration of Results and Findings. The final research question in this study tied both
the quantitative results and qualitative findings together to provide a grander picture of African
American girls and mathematics. The researcher used a mathematics assessment targeting
students’ performance on Expressions and Equations items with three different versions of item
types for the quantitative component. Following the assessment, the researcher conducted two
qualitative phases of data collection. First, the students provided their cognitive thought
processes for the MSMC items, and then after the student interview analysis, their teachers were
interviewed to provide additional context. Three themes were identified after integrating the
quantitative results and qualitative findings: low overall test performance, multiple-select
multiple-choice items were underappreciated and ignored, and testwiseness was limited.
Overall Test Performance. The Expressions and Equations assessment performance was
lower than anticipated overall for the African American girl participants. With an average of
16% correct for all items for Black girls, this score is alarming. Given that mathematics is such a
critical subject in school, and Black girls are disadvantaged from an intersectional lens in the
classroom, such poor performance at the beginning of their middle school experiences could
negatively impact the participants in future grade levels. Algebra and Algebraic Thinking is a
foundational domain in mathematics; lacking the foundations may make learning more complex
concepts more difficult. Even though both teachers reiterated that the 15-item mathematics
assessment was fair, only Mr. Roberts contested one of the items on the assessment. He
described that his students were not required to distribute and combine terms simultaneously
132
within their Eureka curriculum; this finding illuminates discrepancies among district-endorsed
curricular materials and state assessment alignment.
During their interviews, teachers’ statements regarding pandemic procedures and
constraints shed light on why they may not have been surprised with the assessment results. For
instance, both teachers mentioned how their students struggled with other tests, specifically the
ANET benchmark assessments; these assessments were perceived to be more intricate than the
LEAP 2025 assessment. Also, other factors possibly contributing to the students’ overall low
test performance could have been related to students’ increased absences, lack of participation,
and difficulties with instructional platforms during the pandemic.
Multiple-Select Multiple-Choice Items. Both the mathematics assessment and student
retrospective think-aloud interviews highlighted complications with MSMC test items. The
biggest antagonist for students was the scoring method chosen for grading. For some parts of the
test items, students knew how to solve and justify their reasoning; however, with AN scoring, if
a student over-or-under-selects the correct answer choices, they will receive a score of zero for
the test item. Given the other scoring methods introduced by Kastner & Stangl (2011), the five
African American girls from the interviews could have had an average score of 9% using the
Number Correct scoring method, or 4% using the University-specific scoring rule.
It could not be more transparent the importance of the scoring method for multiple-select
multiple-choice items. By enforcing the AN scoring method, students are penalized for selecting
one incorrect answer choice, even if they also selected the actual correct answer choices. This
scoring practice begs whether it would be more advantageous for students to have separate items
for each component of a multiple-select item than one item with multiple correct answers. As
the literature suggests, multiple-select multiple-choice items are recommended because they
133
require higher-level thinking and are more cost-efficient than single-answer multiple-choice
items and constructed-response items (Hohensinn & Kubinger, 2011; Kastner & Stangl, 2011;
Reardon et al., 2018; Sangwin & Jones, 2017; Wan & Henly, 2012).
Teachers also supported the under-appreciation and ignoring of MSMC items in their
interviews. For instance, both mentioned how their primary test item focus was on extended
constructed-response items; these items are worth more points than any other test items on the
state assessment. Constructed response items were also prevalent in the literature for
mathematics assessments (Gallagher et al., 2000; Hohensinn & Kubinger, 2011; Kastner &
Stangl, 2011; Sangwin & Jones, 2017; Wan & Henly, 2012). However, it was the multiple-select
multiple-choice items that needed more attention according to the research literature (Hohensinn
& Kubinger, 2011; Kastner & Stangl, 2011; Sangwin & Jones, 2017; Wan & Henly, 2012).
Lack of Testwiseness. The final theme for the integration of results and findings was the
lack of testwiseness strategies and skills. Although each girl used the strategy of reading over
the answer choices, that was the only strategy that some of them used. Of the teachers, only Mr.
Smith recalled reviewing two strategies with his students by the time students had taken the
mathematics assessment for this study. By the time this study took place, students were more
than three-fourths into the school year. Some testwiseness strategies could have been taught
earlier in the school year so that students may have been practicing them throughout their
module, or unit, and benchmark assessments. For instance, Reynolds et al. (2009) clarify,
“Instruction in general test-taking skills does not increase mastery of the underlying knowledge
and skills, but it does make students more familiar and comfortable with standardized tests” (p.
319).
134
When considering the testwiseness strategies presented earlier in the literature, some
were present in the students’ retrospective think-aloud interviews. For instance, Hong et al.
(2006) mentioned test-taking strategies such as sequencing and checking responses were high
among the respondents in their study. The girls that participated in the interviews did use the
latter strategy a few times. Hong et al. also mentioned the differences between high- and low-
performing students; unfortunately, this study did not capture students who performed well on
the assessment. Henceforth, comparisons by performance level were not possible.
In conclusion, the integration of the mixed methods findings and results exposed how
outside factors could have directly impacted the African American girls’ performance on the
Expressions and Equations assessments. The pandemic negatively impacted the opportunities
available for the female participants throughout the school year; these opportunities included
working in small groups, getting differentiated instruction from their teachers, engaging in a
conducive learning environment, and more. As mentioned previously in the literature review,
one way to increase Black girls’ mathematical abilities is by increasing their math self-concept
(Joseph, 2017); by doing so, Black girls will have the tools to combat the deficit narratives about
them in mathematics.
Implications
The findings from this study show how African American girls at an urban charter school
are impacted by different mathematics test items, scoring methods, and instructional practices
during a pandemic. Although some of the findings related to this study are unique due to the
pandemic, others are more transferable in a non-pandemic school year. Therefore, the
importance of this research can impact more African American girls in middle school and
beyond. The remainder of this section will show how the implications from this study can
135
directly impact school-based educators and administrators, assessment writers, and state testing
agencies.
In regard to impacting practice, classroom teachers and school administrators can directly
benefit from this study. In addition to previous research and this study’s findings, teachers can
ensure they create a space to combat negative narratives about Black girls in mathematics.
Booker and Lim’s (2018) authentic pedagogy is just one example of the type of instructional
support teachers could subscribe to that would support their African American girls. Additional
structural supports include mentorship, allyship among other students, and high expectations
from others (Booker & Lim, 2018; Borum & Walker, 2012; Joseph et al., 2019; McGee &
Bentley, 2017; Moody, 2004). Teachers can also start a #BlackGirlMathMagic club or program
at their school that focuses on the empowerment of Black girls in mathematics. Such a program
could produce a safe space for Black girls to take chances and engage in mathematical
opportunities for advancements. Teachers could also incorporate teaching the history of Black
women in mathematics, such as showing and discussing the film Hidden Figures, at least during
Black History Month. By celebrating the accomplishments of Black women and girls in math,
teachers and students of all racial backgrounds can see what is capable for Black females
mathematically. Lastly, teachers could introduce testwiseness strategies earlier in the school
year compared to at the end near state testing time. By introducing these skills early on, students
have more time to practice and implement such strategies throughout the school year on all
assessments, not just those required for accountability measures.
As for school leaders and administrators, this study also presents multiple implications
for practice. First, as far as professional development for staff, school leaders could require or
suggest training on inclusive pedagogy (Tuitt, 2003) in mathematics, specifically the two tenets:
136
sharing power and social interaction (Joseph et al., 2019). Students benefit in mathematics when
interacting and learning from others and engaging in strong, meaningful conversations. These
practices were limited due to the restrictions with the pandemic; however, school leaders could
ensure that proper training for teachers make such practices possible in a virtual setting or with
social distancing. School leaders could also ensure adequate staff training, especially for
mathematics teachers, focused on course-taking trends impacted by current actions in the
classroom. Next, by clarifying with mathematics teachers how their ability to create strong
mathematics learners can now directly impact future STEM leaders, school leaders can safeguard
a space or path for Black girls that often go under the radar in the classrooms. Finally, school
leaders need to demand alignment among curriculum materials and all students' assessments.
Assessment items and scoring methods should align with the item types and scoring methods
used on state assessments. For instance, Eureka, ANET, and LEAP 2025 assessments should all
measure similar material at the same level of rigor and should be scored the same. By ensuring
similar testing conditions and content, students are not alarmed or confused when presented with
unfamiliar material or realize that their test scores do not match what they have seen on other
assessments. School leaders should also subscribe to training teachers in testwiseness strategies
earlier in the school year to support their students better and in advance of state testing.
This study shows that multiple-select multiple-choice items can have a detrimental
impact on students’ test scores if they are continued to be ignored or undervalued in the
classroom. Teachers, instructional coaches, and other test writers should see the value in MSMC
test items, particularly since they allow for the assessment of deeper understanding than single-
select multiple-choice (MC) items; additionally, MSMC items are easier to grade, have fewer
scorer errors, and are more cost-efficient than constructed response (CR) items (Hohensinn &
137
Kubinger, 2011; Kastner & Stangl, 2011). Assessment writers should consider the scoring
methods and make it well known to practitioners how all items will be scored. Even though the
scoring methods are included in the assessment guides, several teachers do not know how
MSMC items are scored. Lastly, assessment writers should certify that all test items are
culturally appropriate, responsive, and inclusive for all students, especially Black girls in
mathematics. By testing the items used on common assessments to see if there are differences in
gender-racial groups’ performances for certain test items or item types, test writers can make
sure that assessments are fair and free from bias.
The final group that could benefit from the findings from this study includes state testing
agencies. First, state testing agencies could require proper testing training for all stakeholders
related to assessment structure and item scoring. One suggestion is to require a course on
assessment structure and item scoring as part of educators' initial or renewal certification process.
Additionally, agencies could provide training to school leaders and teachers about testwiseness
strategies that support students with a history of discrimination in mathematics. State testing
agencies should also recommend to local education agencies (LEAs) that testing support and
guidance should start earlier in the academic school year instead of the end of the year. Lastly,
state testing agencies should publicize the findings for testing trends among gender-racial groups
at all school sites. Specifically, mathematics assessment data should be disaggregated and
disseminated appropriately so that all stakeholders know how schools perform by gender-racial
groups. Moreover, families may benefit from knowing which schools have better success rates
for African American girls in mathematics if school choice is an option.
138
Recommendations for Future Research
This research study provided a space for a marginalized group in mathematics, African
American girls in middle school. This study examined how Black girls performed on three types
of assessment items—MC, MSMC, and CR, how Black girls processed the multiple-select
multiple-choice items, and how their teachers could provide additional context. Based on the
results and findings presented earlier, the following will present possible research opportunities
and recommendations for future research.
First, future research should seek to expand the sample size or increase student
participants in a similar study. One drawback of this study included the small number of African
American female participants, especially students in honors or gifted programs. Given additional
time and resources, a research team could try to recruit more Black girls in sixth grade and
eventually include more grade levels to participate in a follow-up study looking at differences in
mathematics assessment item types. Future studies should also conduct retrospective think-aloud
interviews for participants, possibly including MC and CR items in the interview protocol.
Next, future research studies could also conduct a deeper investigation of how scoring
methods impact Black girls in mathematics. For instance, there could be a thorough review of
how teachers grade students on class assessments, how schools grade benchmark and other
school-wide assessments, and eventually, compare and contrast those scoring methods with how
state assessments are scored. Future research may conduct a document or content analysis of the
various mathematics assessments and scoring metrics if granted access by school gatekeepers.
Although the focus of the retrospective think-aloud interviews in this study was used to
see how African American girls processed the MSMC items, a closer look into the participants’
experiences in their own words could have shed more light on how they performed on the
assessment. For instance, if given more time with the students, researchers could ask the Black
139
girls to provide statements about how they see themselves in mathematics and how mathematics
plays a part in their current life and future goals.
One more perspective that could be investigated in future research includes analyzing
multiple solutions in mathematics and how they impact mathematics test items. For instance,
this study used Gardner’s theory of multiple approaches to understanding to examine multiple-
select multiple-choice items. With multiple approaches to understanding, the items assessed if
students deeply understood the concept addressed in the mathematics problem. With multiple
solutions, students are asked to show multiple ways to solve a problem. These types of questions
may be more suitable for constructed response questions, but further investigation into multiple
solutions on multiple-select multiple-choice items is highly recommended.
Lastly, future research recommendations include a more quantitative approach to
determining differences in performance on mathematics test item types among multiple gender-
racial groups. As previously mentioned, the sample size was limited in this study due to issues
with the pandemic. With a larger sample size, future research could examine if there are any
differences between how African American girls perform and process multiple item types and
mathematics compared to other groups of students with an intersectional perspective.
Limitations of the Study
As previously discussed, there were several limitations to this study. The main limitation
was the COVID-19 pandemic, which directly impacted the researcher’s access and interaction
with potential participants. Therefore, instead of the intended in-person study, the researcher
made accommodations to construct an all-online study from the mathematics assessment to the
interviews. The participants' performance was also a limitation; the researcher sought to capture
more variability among students.
140
After soliciting participation from the school there were issues in communication ranging
from how the study was introduced to the teachers and students to the completion of the study.
For instance, the researcher could not meet with the teachers or students in person to discuss the
study due to COVID-19 restrictions at the school site. Teachers were able to meet with the
researcher on a Zoom call to talk about the study; however, it is unclear how the messaging was
delivered to students. The pilot round of testing only resulted in responses for 23 students
overall, only eight of which were African American girls. The second round of testing had a
higher participation rate than the pilot round, yet the response rate was still low, considering the
school had about 120 sixth graders. Getting participants for the think-aloud interviews and
scheduling times to have the interviews were also challenges. For example, ten participants said
they were willing to participate in the follow-up retrospective interviews; however, only five
girls followed through to complete the interview.
One of the last limitations was the sample of students. Initially, the goal was to capture
African American girls in honors or gifted programs, or at least high-performing students in
mathematics; however, based on the mathematics assessment in the first phase, only one girl
answered one of the five MSMC items correctly using the All-or-Nothing scoring method. This
result was very shocking and required the researcher to examine how the findings could shed
light on how the girls could have been disadvantaged by the test or outside factors; this finding
also led to their mathematics teachers' involvement in the study.
Conclusion
In summary, the push to acknowledge and support the next generation of African
American female mathematical geniuses is now. The present study has depicted the current
reality of African American students in mathematics and the dire need to address changes in
standardized mathematics performance. By examining the performance and cognitive
141
processing of the students in this study, the researcher has gained insight into how to increase
overall student achievement in mathematics through supporting educators and other key
stakeholders. First, by understanding how African American girls performed on the different
types of mathematics items, mathematics teachers can make instructional decisions to better
prepare them for items with which they struggle. Next, by capturing students’ thought processes
on multiple-select multiple-choice mathematics items, educators can anticipate better ways to
assess material in a way that benefits students overall.
The information provided from this study could be very beneficial to educators and
scholars. As demonstrated in the literature review and the findings and results of this study,
literature is limited on African American girls in math, specifically on MSMC item types. The
participants’ performance was also troubling when specific scoring methods were implemented
on those test items. For the teachers and students involved in the study, the results could be used
almost immediately as a tool to assess instruction and student learning. Results could prove
advantageous for creating and administering future mathematics school assessments and state
standardized testing later in the academic school year. Additionally, the results and findings
from this study could be shared across grade levels and potentially other content areas.
Given the current academic climate, mathematics teachers' instructional class time and
strategies are more imperative than ever before. Since the increased loss of instructional time
and unfinished learning due to the pandemic, students that were once only minimally behind may
now be substantially impacted in mathematics. For African American students, mathematics
does not lean strongly in their favor for content mastery; this study sought to uncover ways to
change that phenomenon for Black girls. By uncovering nuances with cognition and assessment
specific to these students, this study hopes to add to the narrow literature on Black girls in

142
mathematics and provide practitioners support for instructional shifts that may increase students'
opportunities, henceforth creating and highlighting more #BlackGirlMathMagic.
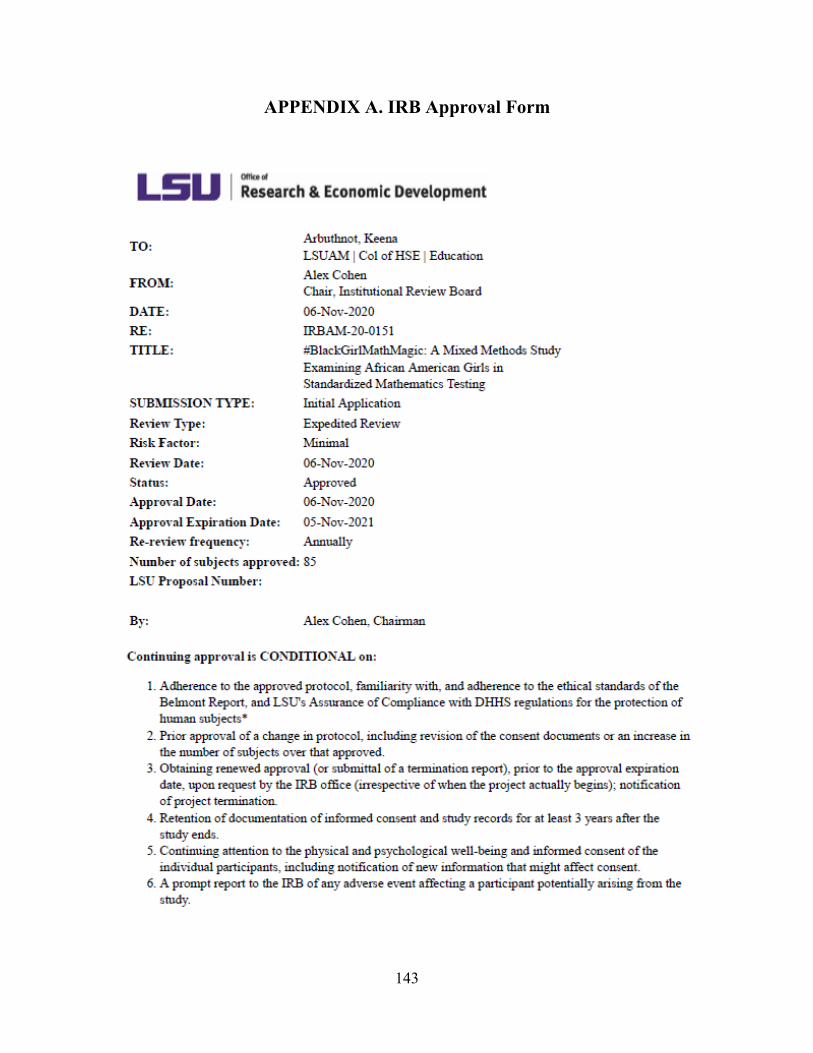
143
APPENDIX A. IRB Approval Form
144
145
APPENDIX B. Description of Study
Study Title: #BlackGirlMathMagic: A Mixed Methods Study Examining African American
Girls in Standardized Mathematics Testing
Purpose: The purpose of this study is to determine how different mathematics item types impact
the performance of African American girls. The target group of students for the study
administration is sixth-grade students. The goal is to collect student data over the course of one
academic school week. Both the assessment and interviews will be conducted virtually using
Qualtrics (assessment) and Zoom (interviews); Zoom interviews will be recorded for voice
transcription. No identifiable student information will be shared or recorded. Teacher
interviews will also be conducted to provide additional supporting information following student
interviews.
Procedures: During one non-instructional class period, all eligible students will take a 30
minute 15-item mathematics assessment with three different types of items: single-answer
multiple-choice (MC) items, multiple-select multiple-choice (MSMC) items, and short-answer
constructed-response (CR) items. All assessment items are aligned to the practice LEAP 2025
mathematics assessment.
Following the test administration, approximately ten African American female students will be
asked to participate in a follow-up interview where they explain their thought process for some
of the MSMC items from the original assessment. The interviews will be conducted within a
week of the initial assessment and will take approximately 15 minutes per student. A separate
interviewer will collect the responses through a recorded Zoom session, excluding student names
and videos. Once student interviews have been completed and transcribed, teachers will be
146
interviewed via Zoom to provide additional context and supporting information regarding
teaching during a pandemic, supporting math instruction and assessments, and the domain of
interest, Expressions and Equations.
Participants: Sixth-grade students and teachers from a charter school in Baton Rouge, LA
Instrument: The instrument for the study will consist of 15 items aligned to the Expressions
and Equations domain for sixth-grade mathematics. The assessment will have five MC items,
five MSMC items, and five CR items. For the interview protocol, students will be asked to
explain their thought process for the five MSMC items only. Teachers will be asked to provide
additional context pertaining to teaching and learning during a pandemic, general mathematics
instruction and assessment practices, and their experience teaching the unit on Expressions and
Equations.
Analysis: For data analysis, participant data from the mathematics assessment will be exported
to and analyzed in SPSS (Statistical Package for Social Sciences). Data will first be screened
and cleaned, ensuring there is no missing data. Descriptive statistics and frequencies will be run
based on demographic information provided by the participants. Next, participant responses will
be scored into four categories: MC, MSMC, CR, and Total performance.
The statistical analysis to answer the first research question regarding performance differences
on the various item types will be a repeated-measures analysis of variance (ANOVA); a non-
parametric test will be considered if the necessary assumptions are not met. The independent
variable is the racial-gender group, African American females. The dependent variables are the
different test item types: MC, MSMC, CR items.
147
For the qualitative component of the study, think-alouds will be transcribed using the online
platform to record student responses solving MSMC test items and teachers’ responses. The
transcription will be coded for themes in how students processed and then approached solving
the selected test items. The teachers’ interviews will provide supporting information to the
findings from the student interviews. Using triangulation and integration, the findings from the
students’ think-alouds and teachers’ interviews will be combined and compared with the results
from the mathematics assessment to answer the remaining research questions guiding the study.
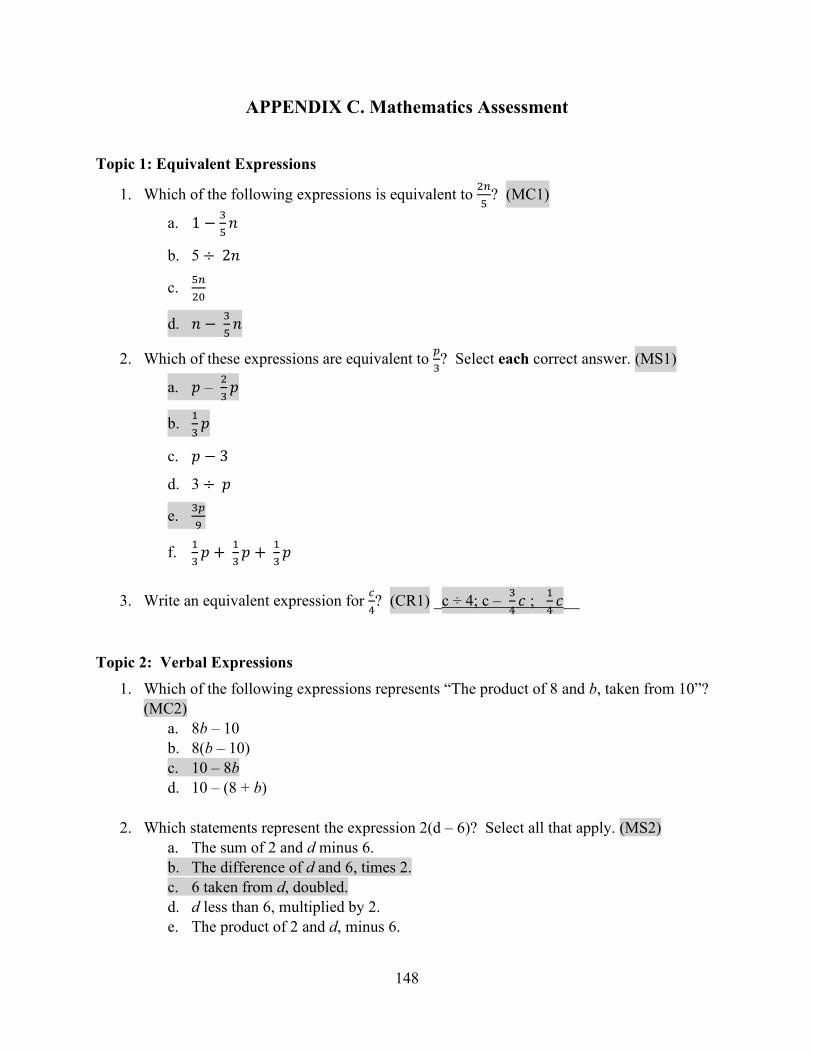
148
APPENDIX C. Mathematics Assessment
Topic 1: Equivalent Expressions
1. Which of the following expressions is equivalent to 2𝑛𝑛5
? (MC1)
a. 1 − 35𝑛𝑛
b. 5 ÷ 2𝑛𝑛
c. 5𝑛𝑛20
d. 𝑛𝑛 − 35𝑛𝑛
2. Which of these expressions are equivalent to 𝑝𝑝3? Select each correct answer. (MS1)
a. 𝑝𝑝 – 23𝑝𝑝
b. 13𝑝𝑝
c. 𝑝𝑝 − 3
d. 3 ÷ 𝑝𝑝
e. 3𝑝𝑝9
f. 13𝑝𝑝 + 1
3𝑝𝑝 + 1
3𝑝𝑝
3. Write an equivalent expression for 𝑐𝑐
4? (CR1) _c ÷ 4; c – 3
4𝑐𝑐 ; 1
4𝑐𝑐__
Topic 2: Verbal Expressions 1. Which of the following expressions represents “The product of 8 and b, taken from 10”?
(MC2) a. 8b – 10 b. 8(b – 10) c. 10 – 8b d. 10 – (8 + b)
2. Which statements represent the expression 2(d – 6)? Select all that apply. (MS2)
a. The sum of 2 and d minus 6. b. The difference of d and 6, times 2. c. 6 taken from d, doubled. d. d less than 6, multiplied by 2. e. The product of 2 and d, minus 6.
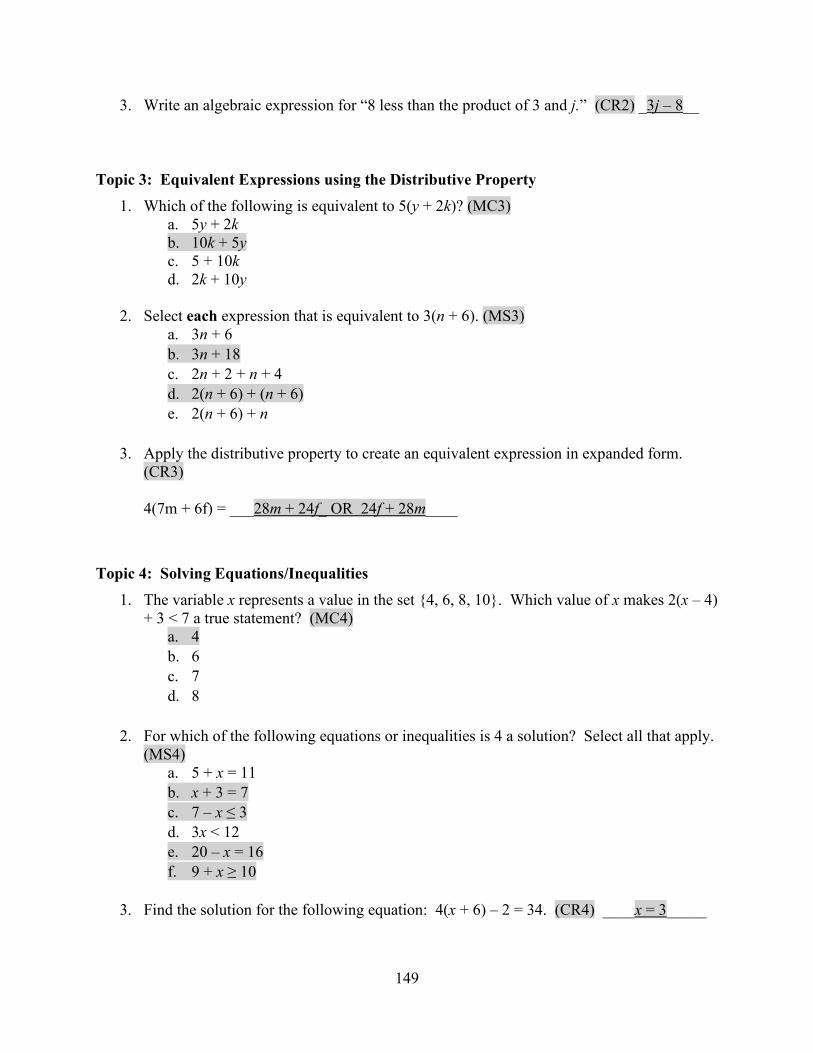
149
3. Write an algebraic expression for “8 less than the product of 3 and j.” (CR2) _3j – 8__
Topic 3: Equivalent Expressions using the Distributive Property
1. Which of the following is equivalent to 5(y + 2k)? (MC3) a. 5y + 2k b. 10k + 5y c. 5 + 10k d. 2k + 10y
2. Select each expression that is equivalent to 3(n + 6). (MS3)
a. 3n + 6 b. 3n + 18 c. 2n + 2 + n + 4 d. 2(n + 6) + (n + 6) e. 2(n + 6) + n
3. Apply the distributive property to create an equivalent expression in expanded form.
(CR3) 4(7m + 6f) = ___28m + 24f_ OR 24f + 28m____
Topic 4: Solving Equations/Inequalities 1. The variable x represents a value in the set {4, 6, 8, 10}. Which value of x makes 2(x – 4)
+ 3 < 7 a true statement? (MC4) a. 4 b. 6 c. 7 d. 8
2. For which of the following equations or inequalities is 4 a solution? Select all that apply.
(MS4) a. 5 + x = 11 b. x + 3 = 7 c. 7 – x ≤ 3 d. 3x < 12 e. 20 – x = 16 f. 9 + x ≥ 10
3. Find the solution for the following equation: 4(x + 6) – 2 = 34. (CR4) ____x = 3_____
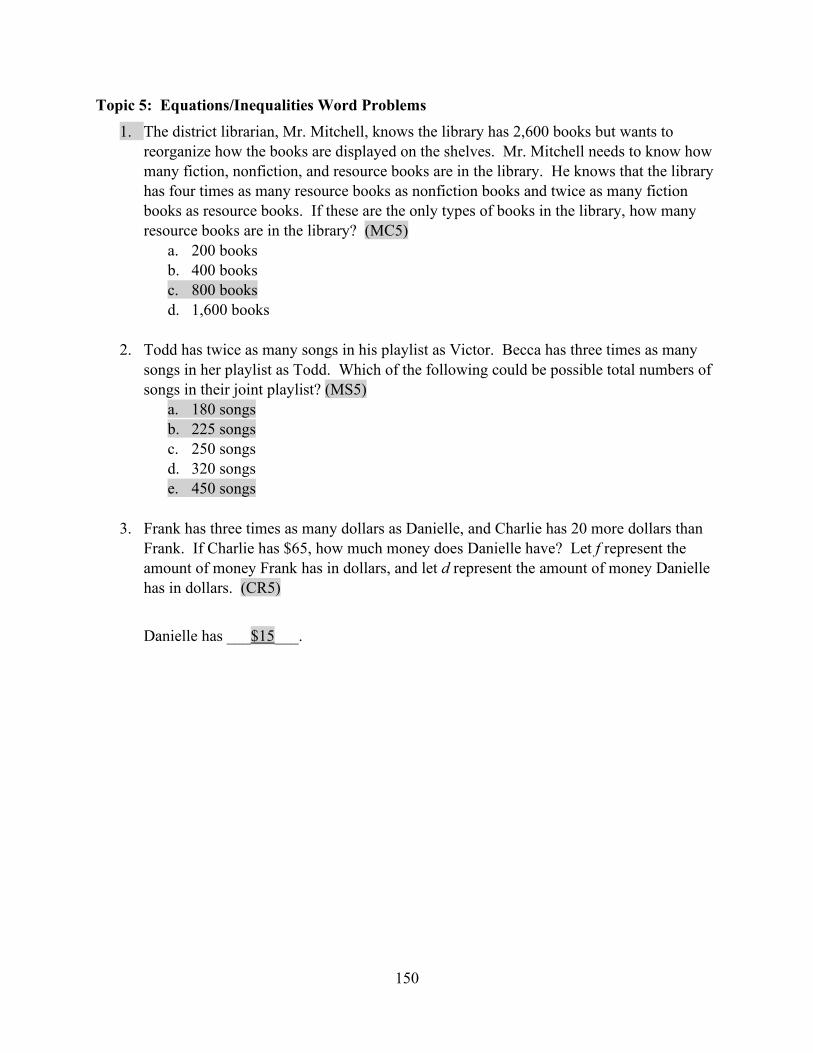
150
Topic 5: Equations/Inequalities Word Problems 1. The district librarian, Mr. Mitchell, knows the library has 2,600 books but wants to
reorganize how the books are displayed on the shelves. Mr. Mitchell needs to know how many fiction, nonfiction, and resource books are in the library. He knows that the library has four times as many resource books as nonfiction books and twice as many fiction books as resource books. If these are the only types of books in the library, how many resource books are in the library? (MC5)
a. 200 books b. 400 books c. 800 books d. 1,600 books
2. Todd has twice as many songs in his playlist as Victor. Becca has three times as many
songs in her playlist as Todd. Which of the following could be possible total numbers of songs in their joint playlist? (MS5)
a. 180 songs b. 225 songs c. 250 songs d. 320 songs e. 450 songs
3. Frank has three times as many dollars as Danielle, and Charlie has 20 more dollars than
Frank. If Charlie has $65, how much money does Danielle have? Let f represent the amount of money Frank has in dollars, and let d represent the amount of money Danielle has in dollars. (CR5)
Danielle has ___$15___.
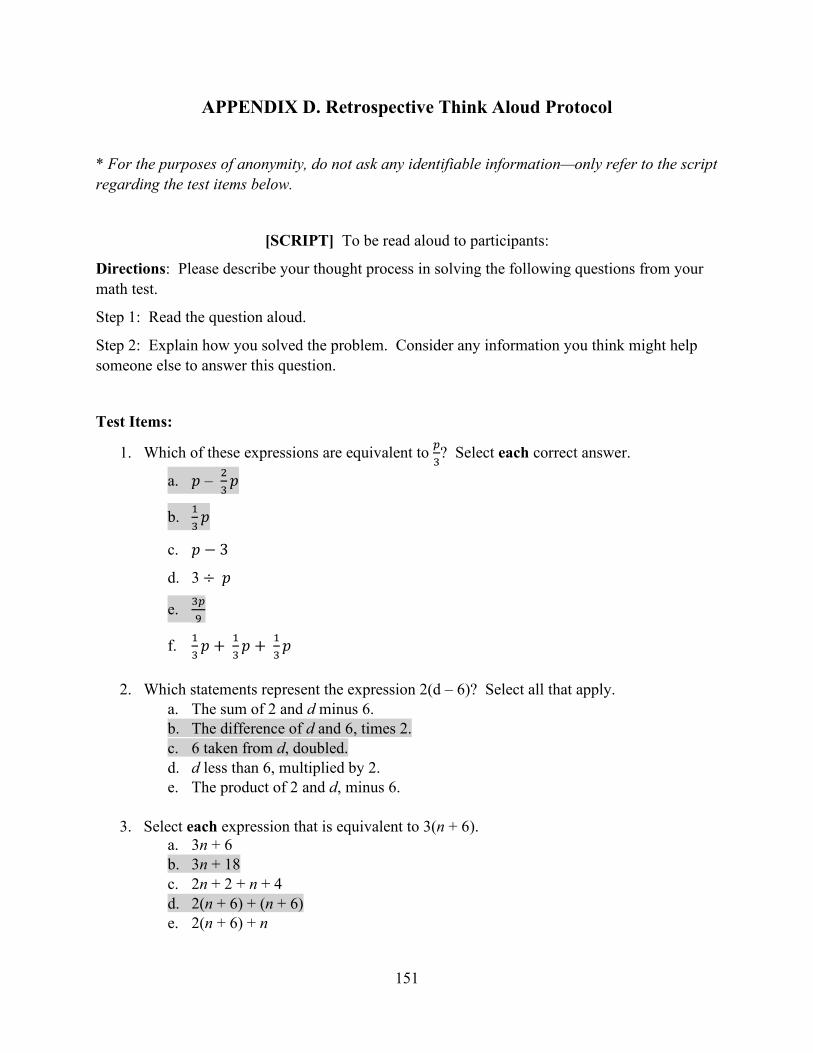
151
APPENDIX D. Retrospective Think Aloud Protocol
* For the purposes of anonymity, do not ask any identifiable information—only refer to the script regarding the test items below.
[SCRIPT] To be read aloud to participants:
Directions: Please describe your thought process in solving the following questions from your math test.
Step 1: Read the question aloud.
Step 2: Explain how you solved the problem. Consider any information you think might help someone else to answer this question.
Test Items:
1. Which of these expressions are equivalent to 𝑝𝑝3? Select each correct answer.
a. 𝑝𝑝 – 23𝑝𝑝
b. 13𝑝𝑝
c. 𝑝𝑝 − 3
d. 3 ÷ 𝑝𝑝
e. 3𝑝𝑝9
f. 13𝑝𝑝 + 1
3𝑝𝑝 + 1
3𝑝𝑝
2. Which statements represent the expression 2(d – 6)? Select all that apply.
a. The sum of 2 and d minus 6. b. The difference of d and 6, times 2. c. 6 taken from d, doubled. d. d less than 6, multiplied by 2. e. The product of 2 and d, minus 6.
3. Select each expression that is equivalent to 3(n + 6).
a. 3n + 6 b. 3n + 18 c. 2n + 2 + n + 4 d. 2(n + 6) + (n + 6) e. 2(n + 6) + n
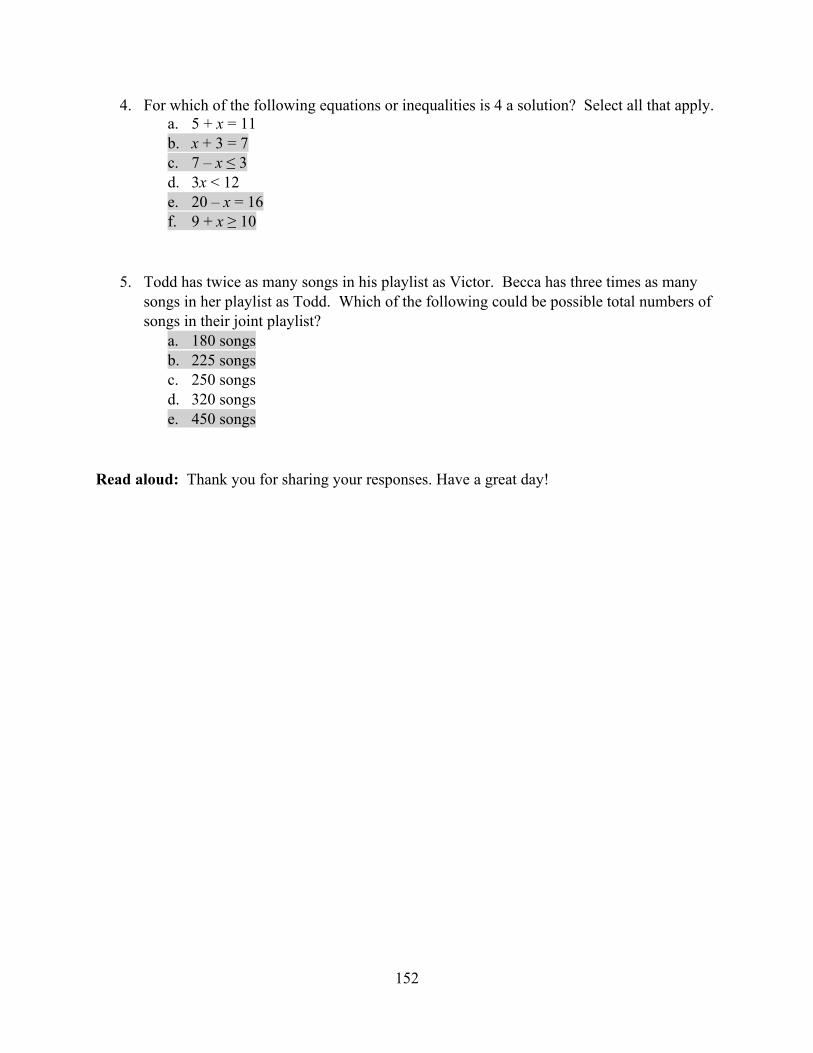
152
4. For which of the following equations or inequalities is 4 a solution? Select all that apply. a. 5 + x = 11 b. x + 3 = 7 c. 7 – x ≤ 3 d. 3x < 12 e. 20 – x = 16 f. 9 + x ≥ 10
5. Todd has twice as many songs in his playlist as Victor. Becca has three times as many songs in her playlist as Todd. Which of the following could be possible total numbers of songs in their joint playlist?
a. 180 songs b. 225 songs c. 250 songs d. 320 songs e. 450 songs
Read aloud: Thank you for sharing your responses. Have a great day!
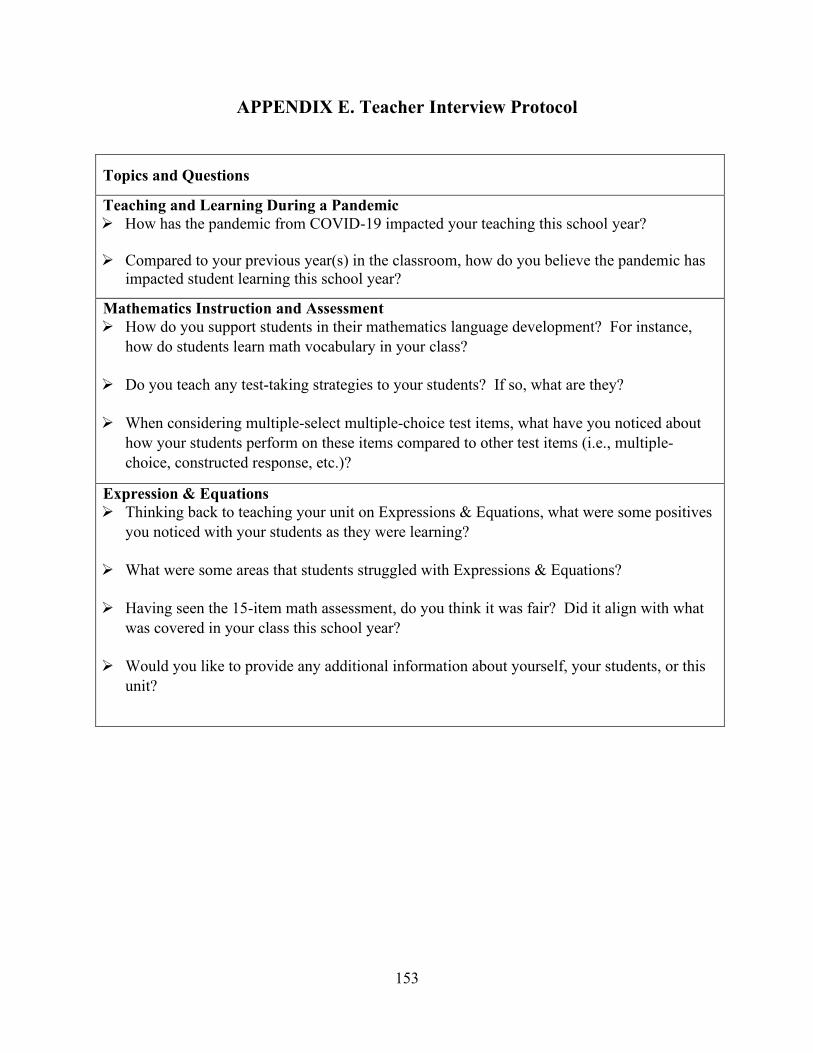
153
APPENDIX E. Teacher Interview Protocol
Topics and Questions
Teaching and Learning During a Pandemic How has the pandemic from COVID-19 impacted your teaching this school year?
Compared to your previous year(s) in the classroom, how do you believe the pandemic has
impacted student learning this school year?
Mathematics Instruction and Assessment How do you support students in their mathematics language development? For instance,
how do students learn math vocabulary in your class?
Do you teach any test-taking strategies to your students? If so, what are they?
When considering multiple-select multiple-choice test items, what have you noticed about how your students perform on these items compared to other test items (i.e., multiple-choice, constructed response, etc.)?
Expression & Equations Thinking back to teaching your unit on Expressions & Equations, what were some positives
you noticed with your students as they were learning?
What were some areas that students struggled with Expressions & Equations?
Having seen the 15-item math assessment, do you think it was fair? Did it align with what was covered in your class this school year?
Would you like to provide any additional information about yourself, your students, or this
unit?
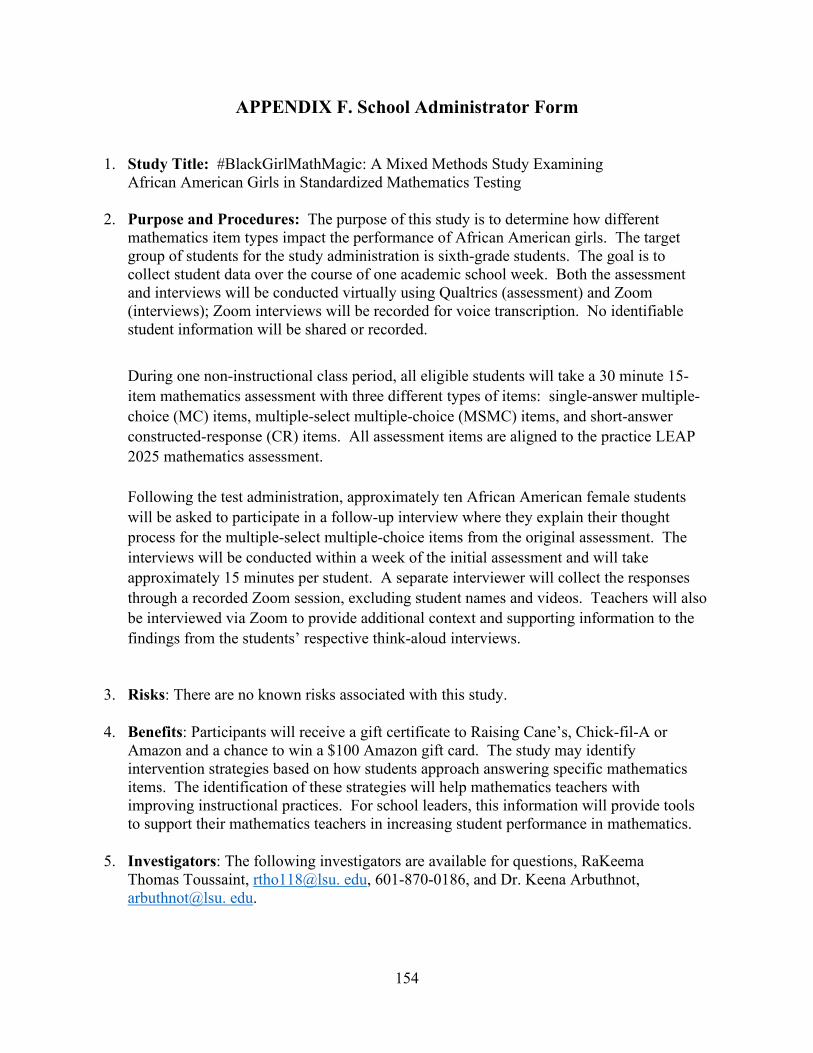
154
APPENDIX F. School Administrator Form
1. Study Title: #BlackGirlMathMagic: A Mixed Methods Study Examining African American Girls in Standardized Mathematics Testing
2. Purpose and Procedures: The purpose of this study is to determine how different
mathematics item types impact the performance of African American girls. The target group of students for the study administration is sixth-grade students. The goal is to collect student data over the course of one academic school week. Both the assessment and interviews will be conducted virtually using Qualtrics (assessment) and Zoom (interviews); Zoom interviews will be recorded for voice transcription. No identifiable student information will be shared or recorded.
During one non-instructional class period, all eligible students will take a 30 minute 15-item mathematics assessment with three different types of items: single-answer multiple-choice (MC) items, multiple-select multiple-choice (MSMC) items, and short-answer constructed-response (CR) items. All assessment items are aligned to the practice LEAP 2025 mathematics assessment. Following the test administration, approximately ten African American female students will be asked to participate in a follow-up interview where they explain their thought process for the multiple-select multiple-choice items from the original assessment. The interviews will be conducted within a week of the initial assessment and will take approximately 15 minutes per student. A separate interviewer will collect the responses through a recorded Zoom session, excluding student names and videos. Teachers will also be interviewed via Zoom to provide additional context and supporting information to the findings from the students’ respective think-aloud interviews.
3. Risks: There are no known risks associated with this study. 4. Benefits: Participants will receive a gift certificate to Raising Cane’s, Chick-fil-A or
Amazon and a chance to win a $100 Amazon gift card. The study may identify intervention strategies based on how students approach answering specific mathematics items. The identification of these strategies will help mathematics teachers with improving instructional practices. For school leaders, this information will provide tools to support their mathematics teachers in increasing student performance in mathematics.
5. Investigators: The following investigators are available for questions, RaKeema
Thomas Toussaint, rtho118@lsu. edu, 601-870-0186, and Dr. Keena Arbuthnot, arbuthnot@lsu. edu.
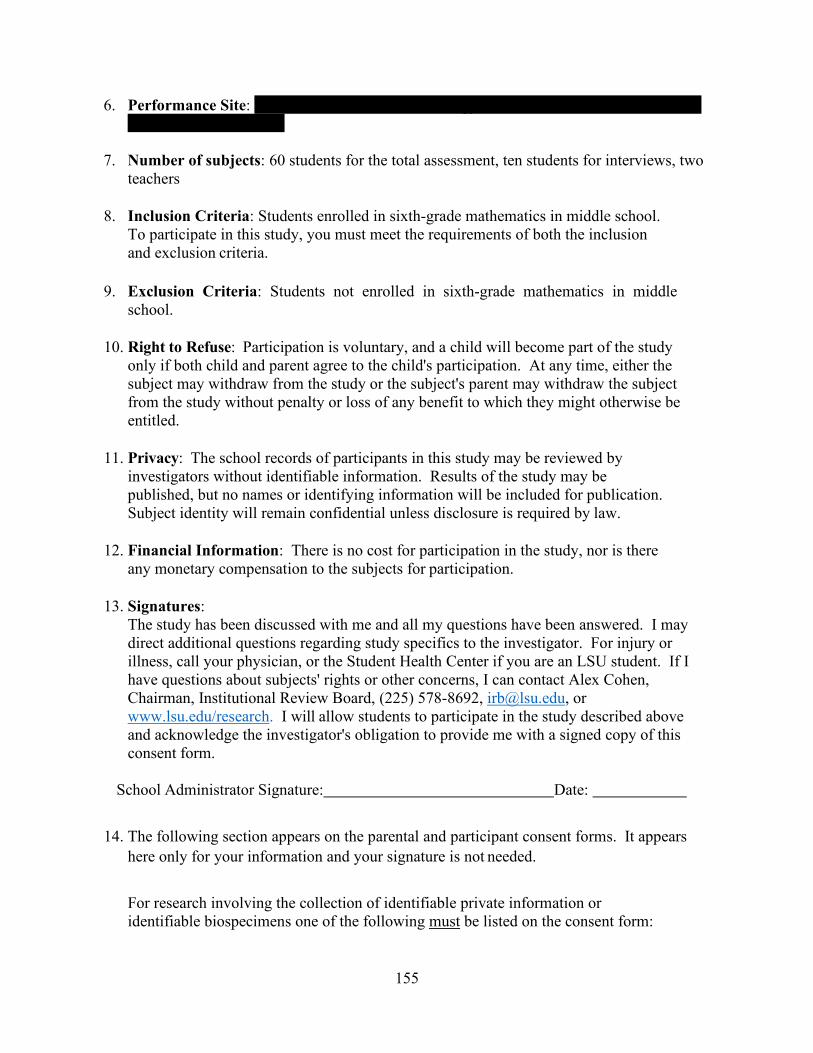
155
6. Performance Site: Kenilworth Science & Technology Charter School, 7600 Boone Ave., Baton Rouge, LA 70808
7. Number of subjects: 60 students for the total assessment, ten students for interviews, two
teachers 8. Inclusion Criteria: Students enrolled in sixth-grade mathematics in middle school.
To participate in this study, you must meet the requirements of both the inclusion and exclusion criteria.
9. Exclusion Criteria: Students not enrolled in sixth-grade mathematics in middle
school. 10. Right to Refuse: Participation is voluntary, and a child will become part of the study
only if both child and parent agree to the child's participation. At any time, either the subject may withdraw from the study or the subject's parent may withdraw the subject from the study without penalty or loss of any benefit to which they might otherwise be entitled.
11. Privacy: The school records of participants in this study may be reviewed by
investigators without identifiable information. Results of the study may be published, but no names or identifying information will be included for publication. Subject identity will remain confidential unless disclosure is required by law.
12. Financial Information: There is no cost for participation in the study, nor is there
any monetary compensation to the subjects for participation. 13. Signatures:
The study has been discussed with me and all my questions have been answered. I may direct additional questions regarding study specifics to the investigator. For injury or illness, call your physician, or the Student Health Center if you are an LSU student. If I have questions about subjects' rights or other concerns, I can contact Alex Cohen, Chairman, Institutional Review Board, (225) 578-8692, [email protected], or www.lsu.edu/research. I will allow students to participate in the study described above and acknowledge the investigator's obligation to provide me with a signed copy of this consent form.
School Administrator Signature: Date:
14. The following section appears on the parental and participant consent forms. It appears here only for your information and your signature is not needed.
For research involving the collection of identifiable private information or identifiable biospecimens one of the following must be listed on the consent form:
156
Your information or biospecimens collected as part of the research, even if identifiers are removed, may be used, or distributed for future research.
Yes, I give permission.
Signature
No, I do not give permission. Signature
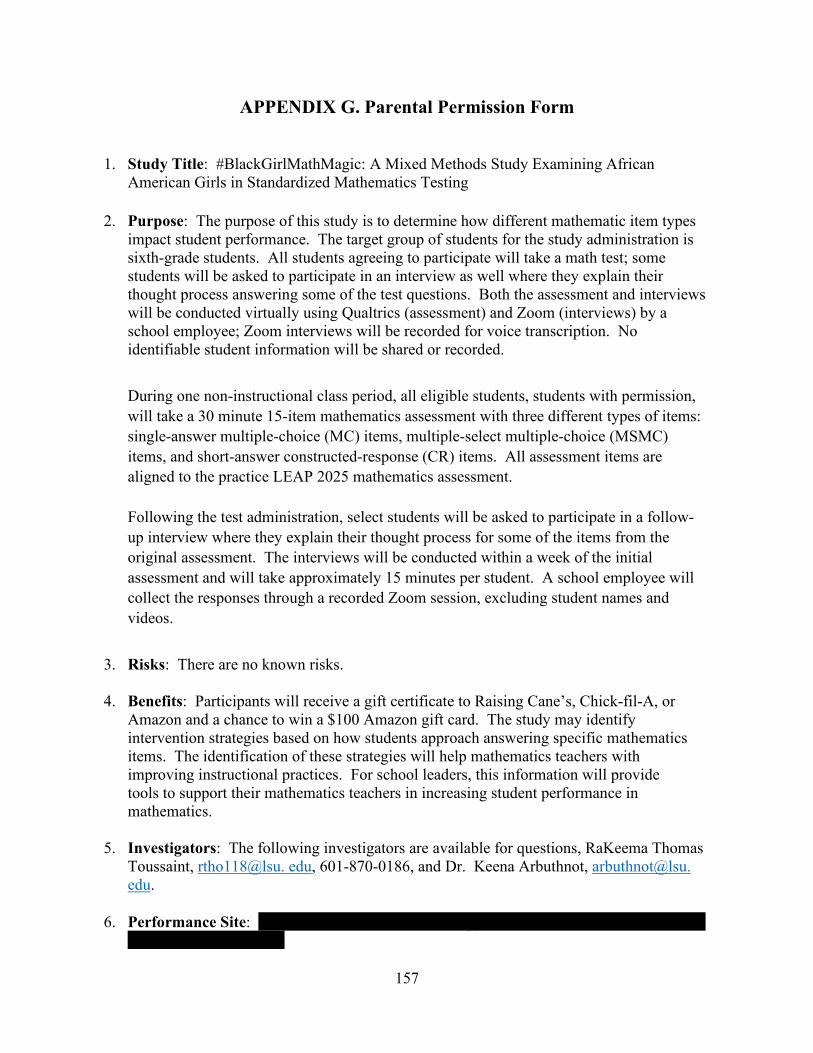
157
APPENDIX G. Parental Permission Form
1. Study Title: #BlackGirlMathMagic: A Mixed Methods Study Examining African American Girls in Standardized Mathematics Testing
2. Purpose: The purpose of this study is to determine how different mathematic item types impact student performance. The target group of students for the study administration is sixth-grade students. All students agreeing to participate will take a math test; some students will be asked to participate in an interview as well where they explain their thought process answering some of the test questions. Both the assessment and interviews will be conducted virtually using Qualtrics (assessment) and Zoom (interviews) by a school employee; Zoom interviews will be recorded for voice transcription. No identifiable student information will be shared or recorded.
During one non-instructional class period, all eligible students, students with permission, will take a 30 minute 15-item mathematics assessment with three different types of items: single-answer multiple-choice (MC) items, multiple-select multiple-choice (MSMC) items, and short-answer constructed-response (CR) items. All assessment items are aligned to the practice LEAP 2025 mathematics assessment. Following the test administration, select students will be asked to participate in a follow-up interview where they explain their thought process for some of the items from the original assessment. The interviews will be conducted within a week of the initial assessment and will take approximately 15 minutes per student. A school employee will collect the responses through a recorded Zoom session, excluding student names and videos.
3. Risks: There are no known risks.
4. Benefits: Participants will receive a gift certificate to Raising Cane’s, Chick-fil-A, or
Amazon and a chance to win a $100 Amazon gift card. The study may identify intervention strategies based on how students approach answering specific mathematics items. The identification of these strategies will help mathematics teachers with improving instructional practices. For school leaders, this information will provide tools to support their mathematics teachers in increasing student performance in mathematics.
5. Investigators: The following investigators are available for questions, RaKeema Thomas
Toussaint, rtho118@lsu. edu, 601-870-0186, and Dr. Keena Arbuthnot, arbuthnot@lsu. edu.
6. Performance Site: Kenilworth Science & Technology Charter School, 7600 Boone Ave.,
Baton Rouge, LA 70808
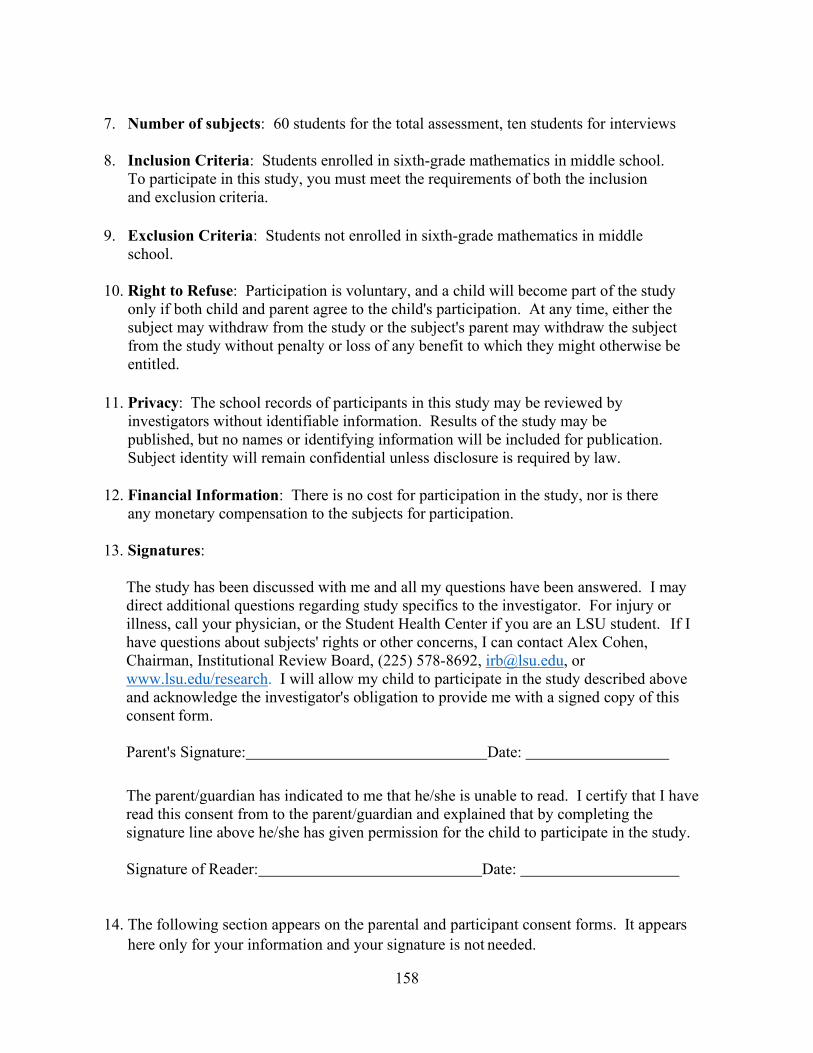
158
7. Number of subjects: 60 students for the total assessment, ten students for interviews
8. Inclusion Criteria: Students enrolled in sixth-grade mathematics in middle school.
To participate in this study, you must meet the requirements of both the inclusion and exclusion criteria.
9. Exclusion Criteria: Students not enrolled in sixth-grade mathematics in middle
school. 10. Right to Refuse: Participation is voluntary, and a child will become part of the study
only if both child and parent agree to the child's participation. At any time, either the subject may withdraw from the study or the subject's parent may withdraw the subject from the study without penalty or loss of any benefit to which they might otherwise be entitled.
11. Privacy: The school records of participants in this study may be reviewed by
investigators without identifiable information. Results of the study may be published, but no names or identifying information will be included for publication. Subject identity will remain confidential unless disclosure is required by law.
12. Financial Information: There is no cost for participation in the study, nor is there
any monetary compensation to the subjects for participation. 13. Signatures:
The study has been discussed with me and all my questions have been answered. I may direct additional questions regarding study specifics to the investigator. For injury or illness, call your physician, or the Student Health Center if you are an LSU student. If I have questions about subjects' rights or other concerns, I can contact Alex Cohen, Chairman, Institutional Review Board, (225) 578-8692, [email protected], or www.lsu.edu/research. I will allow my child to participate in the study described above and acknowledge the investigator's obligation to provide me with a signed copy of this consent form.
Parent's Signature: Date:
The parent/guardian has indicated to me that he/she is unable to read. I certify that I have read this consent from to the parent/guardian and explained that by completing the signature line above he/she has given permission for the child to participate in the study.
Signature of Reader: Date:
14. The following section appears on the parental and participant consent forms. It appears here only for your information and your signature is not needed.
159
For research involving the collection of identifiable private information or identifiable biospecimens one of the following must be listed on the consent form:
Your information or biospecimens collected as part of the research, even if identifiers are removed, may be used, or distributed for future research.
Yes, I give permission.
Signature
No, I do not give permission. Signature
160
APPENDIX H. Child Assent Form
I, , agree to be in a study to find out how different test items impact mathematics performance. I will take a math test and may be asked to participate in an interview. If I am asked to do an interview, I agree to share my thought process for how I solved some of the test problems. I understand that the interview will be voice recorded, and my identity will not be shared with others. I agree to follow all the classroom rules during the test and the interview, if needed. I can decide to stop being in the study at any time without getting in trouble.
Child's Signature: Age: Date: __________
Witness* Date: * (N. B. Witness must be present for the assent process, not just the signature by the minor. )
Institutional Review Board Dr. Alex Cohen, Chair 130
David Boyd Hall Baton Rouge, LA 70803 P: 225.578.8692 F: 225.578.5983
[email protected] | lsu.edu/research
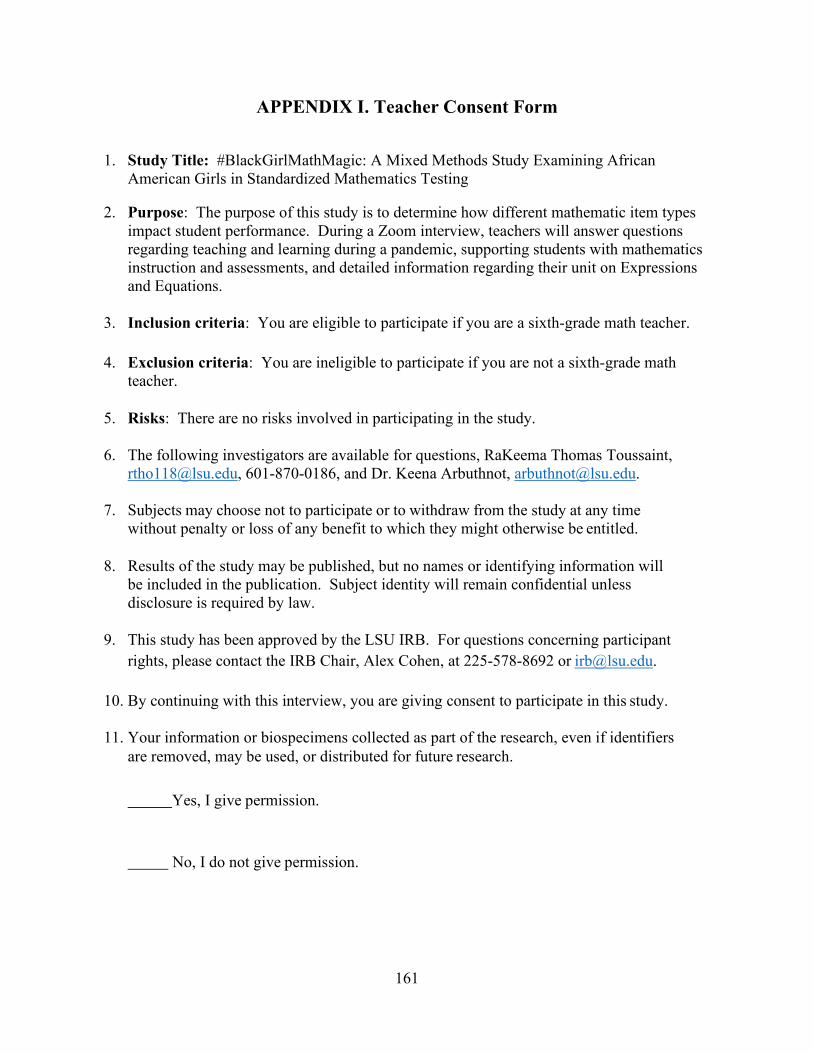
161
APPENDIX I. Teacher Consent Form
1. Study Title: #BlackGirlMathMagic: A Mixed Methods Study Examining African American Girls in Standardized Mathematics Testing
2. Purpose: The purpose of this study is to determine how different mathematic item types impact student performance. During a Zoom interview, teachers will answer questions regarding teaching and learning during a pandemic, supporting students with mathematics instruction and assessments, and detailed information regarding their unit on Expressions and Equations.
3. Inclusion criteria: You are eligible to participate if you are a sixth-grade math teacher.
4. Exclusion criteria: You are ineligible to participate if you are not a sixth-grade math
teacher. 5. Risks: There are no risks involved in participating in the study.
6. The following investigators are available for questions, RaKeema Thomas Toussaint,
[email protected], 601-870-0186, and Dr. Keena Arbuthnot, [email protected]. 7. Subjects may choose not to participate or to withdraw from the study at any time
without penalty or loss of any benefit to which they might otherwise be entitled. 8. Results of the study may be published, but no names or identifying information will
be included in the publication. Subject identity will remain confidential unless disclosure is required by law.
9. This study has been approved by the LSU IRB. For questions concerning participant
rights, please contact the IRB Chair, Alex Cohen, at 225-578-8692 or [email protected]. 10. By continuing with this interview, you are giving consent to participate in this study.
11. Your information or biospecimens collected as part of the research, even if identifiers
are removed, may be used, or distributed for future research.
Yes, I give permission.
No, I do not give permission.
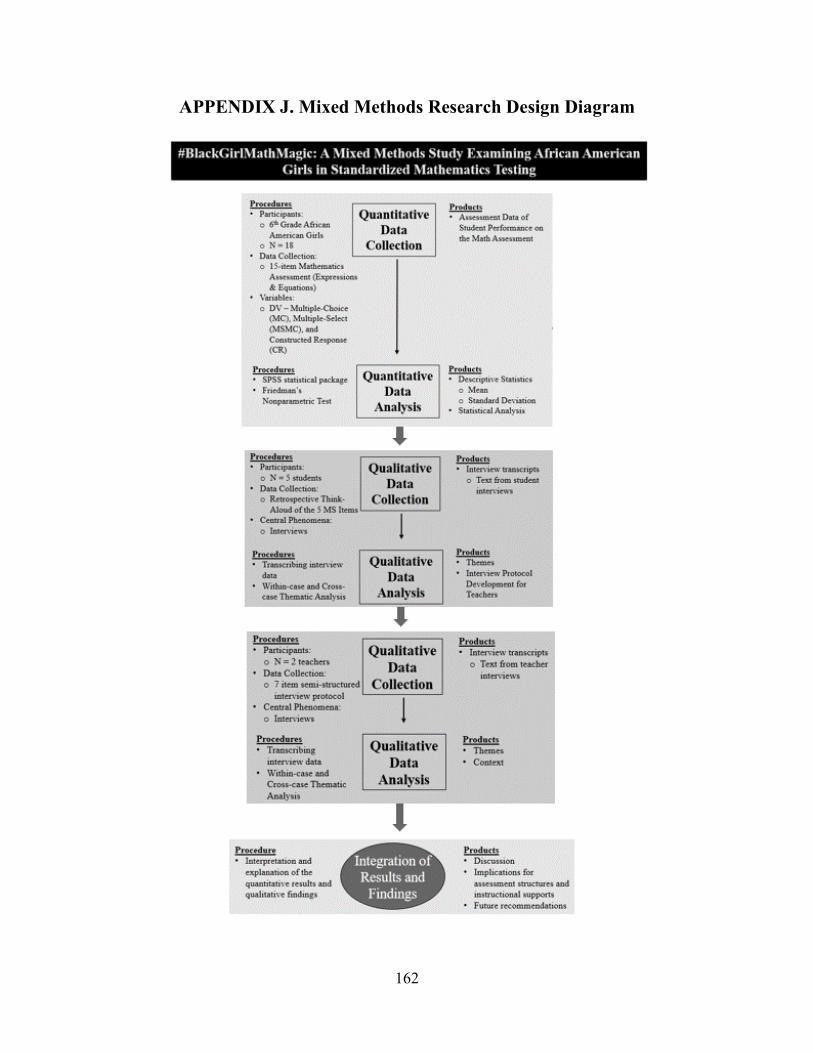
162
APPENDIX J. Mixed Methods Research Design Diagram
163
REFERENCES
ACT. (2019). The ACT profile report – National: Graduating class of 2018. https://www.act.org/content/dam/act/unsecured/documents/cccr2018/P_99_999999_N_S_N00_ACT-GCPR_National. pdf
Allen, K. & Schnell, K. (2016). Developing Mathematical Identity. Mathematics Teaching in the
Middle School, 21(7), 398-405. https://doi.org/10.5951/mathteacmiddscho.21.7.0398 Arbuthnot, K. (2009). The effects of stereotype threat on standardized mathematics test
performance and cognitive processing. Harvard Educational Review, 79(3), 448-472. https://doi.org/10.17763/haer.79.3.43n8521j3rk54221
Arbuthnot, K. (2011). Filling in the blanks: Understanding standardized testing and the Black-
White achievement gap. IAP – Information Age Publishing. Bancroft, A., Bratter, J., & Rowley, K. (2017). Affirmation effects on math scores: The
importance of high school track. Social Science Research, 64(2017), 319-333. https://doi.org/10.1016/j.ssresearch.2016.10.001
Barker, C. (2018, February 9). How one woman started a movement with #BlackGirlMagic.
GoDaddy. https://www.godaddy.com/garage/how-one-woman-started-a-movement-with-blackgirlmagic/
Barrie, R. E., Langrehr, K., Jeremie-Brink, G., Alder, N., Hewitt, A., & Thomas, A. (2016).
Stereotypical beliefs and psychological well-being of African American adolescent girls: Collective self-esteem as a moderator. Counselling Psychology Quarterly, 29(4), 423-442. https://doi.org/10.1080/09515070.2015.1129494
Booker, K. C. & Lim, J. H. (2018). Belongingness and pedagogy: Engaging African American
girls in middle school mathematics. Youth & Society, 50(8), 1037-1055. https://doi.org/10. 1177%2F0044118X16652757
Borum,V. & Walker, E. (2012). What makes the difference? Black women’s undergraduate and
graduate experiences in mathematics. Journal of Negro Education, 81(4), 366-377. https://doi.org/10. 7709/jnegroeducation.81.4.0366
Calderón-Tena, C. O. (2016). Mathematical development: The role of broad cognitive processes.
Educational Psychology in Practice, 32(2), 107-121. https://doi.org/10.1080/02667363.2015. 1114468
Centers for Disease Control and Prevention. (2021). Symptoms of COVID-19. U.S. Department
of Health and Human Services. https://www. cdc. gov/coronavirus/2019-ncov/symptoms-testing/symptoms. html
164
Chavous, T. & Cogburn, C. D. (2007). Superinvisible women: Black girls and women education. Black Women, Gender, and Families, 1(2), 24-51. https://www.jstor.org/stable/10.5406/blacwomegendfami.1.2.0024
College Board. (2019). 2019 SAT suite of assessments annual report.
https://reports.collegeboard.org/pdf/2019-total-group-sat-suite-assessments-annual-report.pdf
Collins, P. H. (2014). Black feminist thought: Knowledge, consciousness, and the politics of
empowerment (2nd ed.). Routledge. Collins, P. H. & Bilge, S. (2016). Intersectionality. Polity Press. Collins, K. T., Onwuegbuzie, A. J., & Jiao, Q. G. (2007). A mixed methods investigation of
mixed methods sampling designs in social and health science research. Journal of Mixed Methods Research, 1(3), 267-294. https://doi.org/10.1177/1558689807299526
Common Core State Standards Initiative (CCSSM). (2009). Mathematics Standards.
http://www.corestandards.org/Math/ Crenshaw, K. W. (1991). Mapping the margins: Intersectionality, identity politics, and violence
against women of color. Stanford Law Review, 46(3), 1241-1299. Crenshaw, K.W., Ocen, P. & Nanda, J. (2015). Black girls matter: Pushed out, overpoliced and
underprotected. African American Policy Forum. Creswell, J. W. (2002). Educational research: Planning, conducting, and evaluating quantitative
and qualitative research. Pearson Education. Creswell, J. W. (2012). Education research: Planning, conducting, and evaluating quantitative
and qualitative research (4th ed.). Pearson Education. Creswell, J. W. & Plano Clark, V. L. (2018). Designing and conducting mixed methods research
(3rd ed.). Sage Publications. Creswell, J. W. & Poth, C. N. (2018). Qualitative inquiry and research design: Choosing among
five approaches (4th ed.). Sage Publications. Davies, L. C., Conner, M., Sedikides, C., & Hutter, R. R. (2016). Math question type and
stereotype threat: Evidence from educational settings. Social Cognition, 34(3), 196-216. https://doi.org/10.1521/soco.2016.34.3.196
Dorans, N. J. & Holland, P. W. (1993). DIF detection and description: Mantel-Haenszel and
Standardization. In P. W. Holland & H. Wainer (Eds.), Differential item functioning (pp. 3-23). Lawrence Erlbaum Associates.
165
Faulkner, V. N., Stiff, L. V., Marshall, P. L., Nietfeld, J., & Crossland, C. L. (2014). Race and teacher evaluations as predictors of algebra placement. Journal for Research in Mathematics Education, 45(3), 288-311. https://doi.org/10.5951/jresematheduc.45.3.0288
Fischer, G. H. (1995). The linear logistic test model. In I. G. H. Fischer & I. W. Molenaar (Eds.),
Rasch models: Foundations, recent developments, and applications (pp. 131-156). Springer.
Fordham, S. (1988). Racelessness as a factor in Black student’s school success: Pragmatic
strategy or pyrrhic victory? Harvard Educational Review, 58(1), 54–84. https://doi.org/10.17763/haer.58.1.c5r77323145r7831
Gallagher, A. M., De Lisi, R. (1994). Gender differences in scholastic aptitude tests:
Mathematics problem solving among high-ability students. Journal of Educational Psychology, 86(2), 204-211. https://psycnet.apa.org/doi/10.1037/0022-0663.86.2.204
Gallagher, A. M., De Lisi, R., Holst, P. C., McGillicuddy-De Lisi, A. V., Morely, M., &
Cahalan, C. (2000). Gender differences in advanced mathematical problem solving. Journal of Experimental Child Psychology, 75(3), 165-190. https://doi.org/10.1006/jecp.1999. 2532
Gammage, M. (2017). Pop culture without culture: Examining the public backlash to Beyonce’s
super bowl 50 performance. Journal of Black Studies, 48(8), 715-731. https://doi.org/10.1177%2F0021934717729504
Gardner, H. (1983). Frames of mind: The theory of multiple intelligences. Basic Books. Gardner, H. (1999). Intelligence reframed: Multiple intelligences for the 21st century. Basic
Books. Gardner, H. (2006). Multiple intelligences: new horizons in theory and practice. Basic Books. Gardner, H. (2009). Multiple approaches to understand. In K. Illeris (Ed.), Contemporary
theories of learning: learning theorists…in their own words (pp. 106-115). Routledge. Gholson, M. L. (2016). Clean corners and algebra: A critical examination of the constructed
invisibility of Black girls and women in mathematics. The Journal of Negro Education, 85(3), 290-301. https://doi.org/10.7709/jnegroeducation.85.3.0290
Gholson, M. & Martin, D. B. (2014). Smart girls, Black girls, mean girls, and bullies: At the
intersection of identities and the mediating role of young girls' social network in mathematical communities of practice. The Journal of Education, 194(1), 19-33. https://doi.org/10.1177%2F002205741419400105
Gibson, J. J. (1979). The ecological approach to visual perception. Houghton Mifflin.
166
Grant, C. & Osanloo, A. (2014). Understanding, selecting, and integrating a theoretical framework in dissertation research: Creating the blueprint for your “house.” Administrative Issues Journal: Connecting Education, Practice, and Research, 4(2), 12-26. https://doi.org/10.5929/2014.4.2.9
Hernandez, S., Manley, B., O’Key, S., & Pettersson, H. (2021, June 7). Tracking Covid-19 cases
in the US. CNN. Retrieved June 7, 2021, from https://www.cnn.com/interactive/2020/health/coronavirus-us-maps-and-cases/
Himelfarb, I. (2019). A primer on standardized testing: History, measurement, classical test
theory, item response theory, and equating. Journal of Chiropractic Education, 33(2), p. 151-163.
Hohensinn, C. & Kubinger, K. D. (2011). Applying item response theory methods to examine
the impact of different response formats. Educational and Psychological Measurement, 71(4), 732-746. https://doi.org/10.1177%2F0013164410390032
Hong, E. & Peng, Y. (2004). Test-Taking Strategies Questionnaire. Unpublished document,
University of Nevada, Las Vegas, NV. Hong, E., Sas, M., & Sas, J. C. (2006). Test-taking strategies of high and low mathematics
achievers. The Journal of Educational Research, 99(3), 144-155. https://doi.org/10.3200/JOER.99.3.144-155
Ireland, D. T., Freeman, K. E., Winston-Proctor, C. E., DeLaine, K. D., Lowe, S. M., &
Woodson, K. M. (2018). (Un)Hidden figures: A synthesis of research examining the intersectional experiences of Black women and girls in STEM education. Review of Research in Education, 42(1), 226-254. https://doi.org/10.3102%2F0091732X18759072
Joseph, N. M. (2017). The invisibility of Black girls in mathematics. Virginia Mathematics
Teacher, 44(1), 46-52. Joseph, N. M., Hailu, M., & Boston, D. (2017). Black women’s and girls’ persistence in the P-20
mathematics pipeline: Two decades of children, youth, and adult education research. Review of Research in Education, 41(1), 203-227. https://doi.org/10.3102%2F0091732X16689045
Joseph, N. M, Hailu, M. F., & Matthews, J. S. (2019). Normalizing Black girls’ humanity in
mathematics classrooms. Harvard Educational Review, 89(1), 132-155. https://doi.org/10.17763/1943-5045-89.1.132
Joseph, N. M., Viesca, K. M., & Bianco, M. (2016). Black female adolescents and racism in
schools: Experiences in a colorblind society. The High School Journal, 100(1), 4-25. https://doi.org/10.1353/hsj.2016.0018
167
Kan, A., Bulut, O., & Cormier, D. C. (2019). The impact of item stem format on the dimensional structure of mathematics assessments. Educational Assessment, 24(1), 13-32. https://doi.org/10.1080/10627197.2018.1545569
Kastner, M., & Stangl, B. (2011). Multiple choice and constructed response tests: Do test format
and scoring matter? Procedia Social and Behavioral Sciences, 12(2011), 263-273. https://doi.org/10.1016/j.sbspro.2011.02.035
Kitchen, M. (2016, March 14). Show students the real purpose of math. National Council of
Teachers of Mathematics. https://www.nctm.org/Publications/MTMS-Blog/Blog/Show-Students-the-Real-Purpose-of-Math/
Kline, R. B. (2015). Principles and practice of structural equation modeling. Guilford
Publications. Kling, K. C., Noftle, E. E., & Robins, R. W. (2012). Why do standardized tests underpredict
women’s academic performance? The role of conscientiousness. Social Psychological and Personality Science, 4(5), 600-606. https://doi.org/10.1177%2F1948550612469038
Kurt, S. (2020, December 19). Theory of multiple intelligences – Gardner. Educational
Technology. https://educationaltechnology.net/theory-of-multiple-intelligences-gardner/ Lawrence-Lightfoot, S. & Davis, J. H. (1997). The art and science of portraiture. Jossey-Bass. Linacre, J. M. (1994). Many-facet Rasch measurement. MESA Press. Linacre, J. M. (2009a). Software: Facets for many-facet Rasch measurement (Version 3.65.0). Linacre, J. M. (2009b). A user’s guide to FACETS: Rasch measurement computer program.
Chicago, IL. Linn, R. L. & Gronlund, N. E. (2000). Measurement and assessment in teacher (2nd ed.).
Prentice Hall. Louisiana Department of Education (2017). K-12 Louisiana Student Standards for Mathematics.
https://www.louisianabelieves.com/docs/default-source/teacher-toolbox-resources/louisiana-student-standards-for-k-12-math.pdf
Louisiana Department of Education (2020). 2020–2021 Assessment Guide for Grade 6
Mathematics. https://www.louisianabelieves.com/docs/default-source/assessment-guidance/leap-2025-assessment-guide-for-grade-6-math.pdf?sfvrsn=f6f8891f_40
Liu, Q. & Wang, L. (2021). t-Test and ANOVA for data with ceiling and/or floor effects.
Behavior Research Methods, 53(1), 264-277. https://doi.org/10.3758/s13428-020-01407-2
168
Mauchly, J. W. (1940). Significance test for sphericity of a normal n-variate distribution. The Annals of Mathematical Statistics, 11(2), 204-209. https://doi.org/10.1214/aoms/1177731915
McGee, E. O. (2013). Young, Black, mathematically gifted, and stereotyped. The High School
Journal, 96(3), 253-263. McGee, E. O., & Bentley, L. (2017). The troubled success of Black women in STEM. Cognition
and Instruction, 35(4), 265-289. https://doi.org/10.1080/07370008.2017.1355211 McGee, K. (2021, February 25). UT-Austin won't require SAT or ACT scores for 2022
applications due to COVID-19. The Texas Tribune. https://www.texastribune.org/2021/02/25/ut-austin-texas-sat-act-application/
McVoy, L. P. (2005). Effect of demographic and personal variables on achievement in eighth-
grade algebra. The Journal of Educational Research, 98(3), 131-135. https://doi.org/10.3200/JOER.98.3.131-135
Melfi, T. (Director). (2017). Hidden figures [Film]. Fox 2000 Pictures. Milgram, R. M., & Hong, E. (2002). Activities and Accomplishments Inventory: Math. Tel Aviv
University, School of Education, and University of Nevada, Las Vegas, College of Education.
Moody, V. R. (2004). Sociocultural orientations and the mathematical success of African
American students. The Journal of Education Research, 97(3), 135-146. https://doi.org/10.3200/JOER.97.3.135-146
Moon, J. A., Keehner, M., Katz, I. R., & Educational Testing Service. (2019). Affordances of
item formats and their effects on test-taker cognition under uncertainty. Educational Measurement: Issues and Practice, 38(1), 54-62. https://doi.org/10.1111/emip.12229
Morton, C. H. (2014). A story of African American students as mathematics learners.
International Journal of Education in Mathematics, Science, and Technology, 2(3), 234-245.
Mowrey, S. C., & Farran, D. C. (2016). Performance and preparation: Alignment between
student achievement, teacher ratings, and parent perceptions in urban middle-grades mathematics classrooms. Journal of Urban Learning Teaching and Research, 12, 61-74.
Newton, R. R., & Rudestam, K. E. (2012). Your statistical consultant. Sage Publications. Nunn, M. N. (2018). Super-girl: Strength and sadness in Black girlhood. Gender & Education,
30(2), 239-258. https://doi.org/10.1080/09540253.2016.1225013 Onwuegbuzie, A. J. & Johnson, R. B. (2006). The validity issue in mixed research. Research in
the Schools, 13(1), 48-63.
169
Peng, Y., Hong, E., & Mason, E. (2014). Motivational and cognitive test-taking strategies and their influence on test performance in mathematics. Educational Research and Evaluation, 20(5), 366-385. https://doi.org/10.1080/13803611.2014.966115
Plano Clark, V. L., & Ivankova, N. V. (2016). Mixed methods research: A guide to the field.
Sage Publications. Rasch, G. (1980). Probabilistic models for some intelligence and attainment tests. University of
Chicago Press. Reardon, S. F., Kalogrides, D., Fahle, E. M., Podolsky, A., & Zarate, R. C. (2018). The
relationship between test item format and gender achievement gaps on math and ELA tests in fourth and eighth grades. Educational Researcher, 47(5), 284-294. https://doi.org/10.3102%2F0013189X18762105
Reynolds, C. R., Livingston, R. B., & Willson, V. (2009). Measurement and assessment in
education. Pearson Education. Ricks, S. A. (2014). Falling through the cracks: Black girls and education. Interdisciplinary
Journal of Teaching and Learning, 4(1), 10-21. Sangwin, C. J., & Jones, I. (2017). Asymmetry in student achievement on multiple-choice and
constructed-response items in reversible mathematics processes. Educational Studies in Math, 94(1), 205-222. https://doi.org/10.1007/s10649-016-9725-4
Sarnacki, R. E. (1979). An examination of test-wiseness in the cognitive domain. Review of
Educational Research, 49(1), 252-279. Schukajlow, S., & Krug, A. (2014). Do multiple solutions matter? Prompting multiple solutions,
interest, competence, and autonomy. Journal for Research in Mathematics Education, 45(4), 497-533. https://doi.org/10.5951/jresematheduc.45.4.0497
Siegler, R. S., Duncan, G. J., Davis-Kean, P. E., Duckworth, K., Claessens, A., Engel, M.,
Susperreguy, M. I., & Chen, M. (2012). Early predictors of high school mathematics achievement. Psychological Science, 23(7), 691-697. https://doi.org/10.1177%2F0956797612440101
Tabachnik, B. G. & Fidell, L. S. (2013). Using multivariate statistics (6th ed.). Pearson
Education. Thomas, J. (2016, February 24). ‘Black girl magic’ is more than a hashtag; It’s a movement.
CNN. http://www.cnn.com/2016/02/24/living/black-girl-magic-feat/ Tuitt, F. (2003). Afterword: Realizing a more inclusive pedagogy. In A. Howell & F. Tuitt
(Eds.), Race and higher education: Rethinking pedagogy in diverse college classrooms (pp. 243-268). Harvard Educational Review.
170
U.S. Department of Education, Institute of Education Sciences, National Center for Education Statistics, National Assessment of Educational Progress (NAEP). (2014). 2014 Technology and Engineering Literacy - TEL Learning Contexts - Overall Results. https://www.nationsreportcard.gov/tel_2014/#results/overall
U.S. Department of Education, Institute of Education Sciences, National Center for Education
Statistics, National Assessment of Educational Progress (NAEP). (2017a). 2017 Mathematics State Snapshot Report: Louisiana – 8th Grade. https://nces.ed.gov/nationsreportcard/subject/publications/stt2017/pdf/2018038LA8.pdf
U.S. Department of Education, Institute of Education Sciences, National Center for Education
Statistics, National Assessment of Educational Progress (NAEP). (2017b). NAEP Data Explorer. https://www.nationsreportcard.gov/ndecore/xplore/NDE
U.S. Department of Education, Institute of Education Sciences, National Center for Education
Statistics (NCES). (2018a). Status and Trends in the Education of Racial and Ethnic Groups Highlights. https://nces.ed.gov/programs/raceindicators/highlights.asp
U.S. Department of Education, Institute of Education Sciences, National Center for Education
Statistics (NCES). (2018b). https://nces.ed.gov/pubs2010/2010015/tables/table_26_1.asp Vigdor, N. & Diaz, J. (2020, May 21). More colleges are waiving SAT and ACT
requirements. The New York Times. https://www.nytimes.com/article/sat-act-test-optional-colleges-coronavirus. html
Wan, L., & Henly, G. A. (2012). Measurement properties of two innovative item formats in a
computer-based test. Applied Measurement in Education, 25(1), 58-78. https://doi.org/10.1080/08957347.2012.635507
West-Olatunji, C., Pringle, R., Adams, T., Baratelli, A., Goodman, R., Maxis, S. (2007). How
African American middle school girls position themselves as mathematics and science learners. The International Journal of Learning, 14(9), 219-227.
Yin, R. K. (2018). Case study research and applications: design and methods (6th ed.). Sage
Publication. You, S. & Sharkey, J. D. (2012). Advanced mathematics course-taking: A focus on gender
equifinality. Learning and Individual Differences, 22(4), 484-489. https://doi.org/10.1016/j.lindif.2012.03.005
Young, J. L, Young, J. R., & Capraro, R. M. (2017). Black girls’ achievement in middle grades
mathematics: How can socializing agents help? Clearing House, 90(3), 70-76. https://doi.org/10.1080/00098655.2016.1270657
171
Young, J. L., Young, J. R., & Capraro, R. M. (2018). Gazing past the gaps: A growth-based assessment of the mathematics achievement of Black girls. Urban Review, 50(1), 156-176. https://doi.org/10.1007/s11256-017-0434-9
Zimmerman, D. W. & Zumbo, B. D. (1993). Relative power of the Wilcoxon test, the Friedman
test, and repeated-measures ANOVA on ranks. The Journal of Experimental Education, 62(1), 75-86.
172
VITA
RaKeema Thomas Toussaint is a native of Vidalia, LA. After graduating from Vidalia
High School in 2007, she pursued a bachelor’s degree in Psychology with a minor in Sociology
at Louisiana State University in Baton Rouge, LA. In search of higher education, RaKeema
returned to Louisiana State University in 2014. She completed her first master’s degree program
in Educational Leadership in 2015. In 2018, RaKeema completed an Education Specialist
degree. She earned her final master’s degree in Curriculum Studies in 2020.
Upon receiving her bachelor’s degree in 2011, RaKeema joined Teach for America as
South Louisiana (SLA) Corps Member. Between 2011 and 2019, RaKeema taught middle
school mathematics for seven years at a charter school in Baton Rouge, LA. She also served in
other capacities, including Assistant Principal, Dean of Academics, Instructional Coach, Grade
Level Leader, and Mathematics Department Chair. As an alumna of Teach for America (TFA),
RaKeema returned to work as a summer staff member between 2014 and 2016 at the TFA Delta
Institute in Cleveland, MS as an Instructional Specialist and Instructional Specialist Coordinator.
In the 2019-2020 academic school year, RaKeema served as a Graduate Teaching and Research
Assistant to Dr. Keena Arbuthnot, a professor in the College of Human Sciences and Education.
In the 2020-2021 academic school year, RaKeema continued to serve as a Graduate Assistant to
Dr. Arbuthnot in the Office of Research and Economic Development for the university.
RaKeema mostly recently serves as a Mathematics Professional Development Specialist for
Curriculum Associates serving the Southeast Region.