Embed Size (px)
Citation preview

1
The University of Texas MD Anderson Cancer Center Division of Quantitative Sciences Department of Biostatistics
BMA-CRM Simulator User’s Guide Version 2.2
John Aven, Richard Herrick , Clift Norris, John Venier and Lin Zhang 1/30/2015
2
Contents
Overview ....................................................................................................................................................... 3
System Requirements ................................................................................................................................... 3
What’s New in V2.2.1? .................................................................................................................................. 4
What was New in V2.1? ................................................................................................................................ 5
Disclaimer...................................................................................................................................................... 5
1.0 Model Parameters ................................................................................................................................. 6
1.1 Model Parameters tab ................................................................................................................... 6
1.2 Using Bayesian Model Averaging ................................................................................................... 9
1.3 Using Data Augmentation .............................................................................................................. 9
2.0 Simulation Run ..................................................................................................................................... 10
2.1 Simulation Run tab ....................................................................................................................... 10
2.2 Simulation Output ........................................................................................................................ 11
3.0 Saving and Opening Files ..................................................................................................................... 21
3.1 Data/File Status ............................................................................................................................ 21
4.0 Input Validation and Errors .................................................................................................................. 23
5.0 Trial Conduct ........................................................................................................................................ 24
5.1 Trial Conduct tab ......................................................................................................................... 24
5.2 Dose Escalation/De-escalation within a Cohort ........................................................................... 24
5.3 Dose Descriptions ......................................................................................................................... 25
5.4 A Trial-in-Progress Trial Conduct tab ........................................................................................... 26
5.5 A Trial-Completed Trial Conduct tab and MTD Reporting ........................................................... 28
Appendix I – Hazard Model with Piecewise Exponentials .......................................................................... 30
3
Overview
The BMA-CRM is an easy-to-use implementation of the BMA-CRM dose-finding method. This document
focuses on how to use the software, not the statistical method itself. A separate document gives some
guidance for using the statistical method, which can be obtained from Help→BMA-CRM Method
Description. Please see “What’s New in v2.2?” for important information about changes in this
program compared to older versions. Also, due to the changes in v2.1 the section “What Was New in
v2.1” has been retained. Indications as to where documentation for each of the design methods can be
obtained will be listed in these two sections.
Text in bold face corresponds to text taken directly from the user interface. Text in italic bold face corresponds to either keys on the keyboard or uses of the mouse. Text in Consolas italics indicates a series of menu commands. BMA-CRM Simulator has three tabs: one for specifying model parameters, one for running simulations
to assess operating characteristics of the model, and one for carrying out an actual clinical trial.
BMA-CRM Simulator provides default model parameters. These defaults are loaded at startup and can
be reloaded from the File→New.
This program is distributed at no cost to the user. However, redistribution of this program is not
permitted. Each person should obtain a copy directly from The University of Texas MD Anderson Cancer
Center at https://Biostatistics.mdanderson.org/SoftwareDownload .
This allows us to keep a record of who may be using the software and allows us to notify all users when
program enhancements become available.
System Requirements
Windows 7 SP1
Microsoft .NET Framework version 4.5.1 (full framework, x86 and x64)
Microsoft Visual C++ 2013 Runtime Libraries (x86)
Windows Installer 4.5
Minimum Screen Resolution 1280x768
If any of the required software components is missing, the installation procedure will install them.
4
What’s New in V2.2?
Data Augmentation: A new mode of usage has been added to the CRM software package.
This new mode, using data augmentation (DA), will allow the simulations to take in to account
the missingness of patient outcomes at the time a new patient is being accrued to help
determine the dose to be administered to the incoming patient.
Further documentation pertaining to the Data Augmentation implementation of CRM can be found in Help→DA-CRM Method Description.
The accrual rate of patients is now a pertinent parameter. The previous method assumed a
complete (or near complete) knowledge of patient outcomes prior to assigning a new patient to
the trial. A near-complete knowledge did not require knowledge of the accrual rate. The new
version, capable of DA, does require the accrual rate be explicitly stated, since the computations
allow for the use of missingness in the data.
Report Formatting: The generated reports have changed very little. The only changes made
are those intended to accommodate the DA usage.
Toxicity Occurrence Prior Probabilities: This is a set of three prior probabilities representing the
likelihoods for a patient to experience a toxicity in the first 3rd, second 3rd and final 3rd of the
evaluation window.
Proportion of Toxicities Observed in Second Half of Assessment Period: The proportion of
toxicities which will be observed in the second half of the Toxicity Assessment Period.
Threading: The computations have been threaded. This enables faster simulations and thus
speedier results. Keep in mind that a single design running on a machine with 4 cores will have
results quantitatively different than on a machine running with 8 cores, or any two differing
number of cores for that matter. The differences though will be statistically identical and should
have very small differences for large enough number of simulated trials. This happens since the
seed for the random number generator will be different for each and every thread, resulting in
differently generated random number sequences.
Trial Duration Simulation: We have added trial time simulation to the computations. This will
allow for a direct analysis of Trial Duration and an additional comparison between Data
Augmentation CRM and ordinary CRM.
The Minimum Number of Observations at the Current Dose Level to Allow DA Escalation
indicates the number of observations required for escalation to occur during a DA enabled dose
assignment. If this minimum number of observations has not been reached, then the simulation
will wait for more information.
Various other updates and bug fixes.
5
What was new in V2.1?
IMPORTANT: The inputs for the sets of prior probability of toxicity at each dose level are user-
specified as prior MEDIANS. Be clear that the software does not use prior means. If, by chance,
you have used an older version of the software which operated with prior means, please convert
them to prior medians. Versions prior to v2.1 use prior means.
For the dose-toxicity model, 𝜋𝑗(𝛼) = 𝑝𝑗exp(𝛼), the inputs for the prior probabilities of toxicity at
each dose level is now used directly as a prior median, 𝑝𝑗. See this technical report for an
explanation of the prior median, and note that the method description document which can be
obtained from the Help→BMA-CRM Method Description describes the old method of using
the inputs as prior means, but is otherwise correct.
NOTE: Simulation files created with older versions will not open in v2.1. If you wish to use an old
trial design you will need to re-enter your design, bearing in mind that the sets of prior
probabilities of toxicity at each dose level are now prior medians. If you use the same input
values with v2.1 as you used with an older version and re-simulate, you may obtain different
results.
Usage statistics and crash reports are occasionally sent to the biostatistics software support
team to improve user experience using it.
Various updates and bug fixes.
Disclaimer
We provide absolutely no warranty of any kind expressed or implied, including but not limited to, the
implied warranties of merchantability and fitness for a particular purpose. The entire risk as to the
quality and performance of the program is with the user.
Should this program prove defective, the user assumes the cost of all necessary servicing, repair, or
correction.
In no event shall The University of Texas or any of its component institutions including MD Anderson
Cancer Center be liable for damages, including any lost profits, lost monies, or other special, incidental
or consequential damages arising out of the use or inability to use (including but not limited to loss of
data or its analysis being rendered inaccurate or losses sustained by third parties) the program.
6
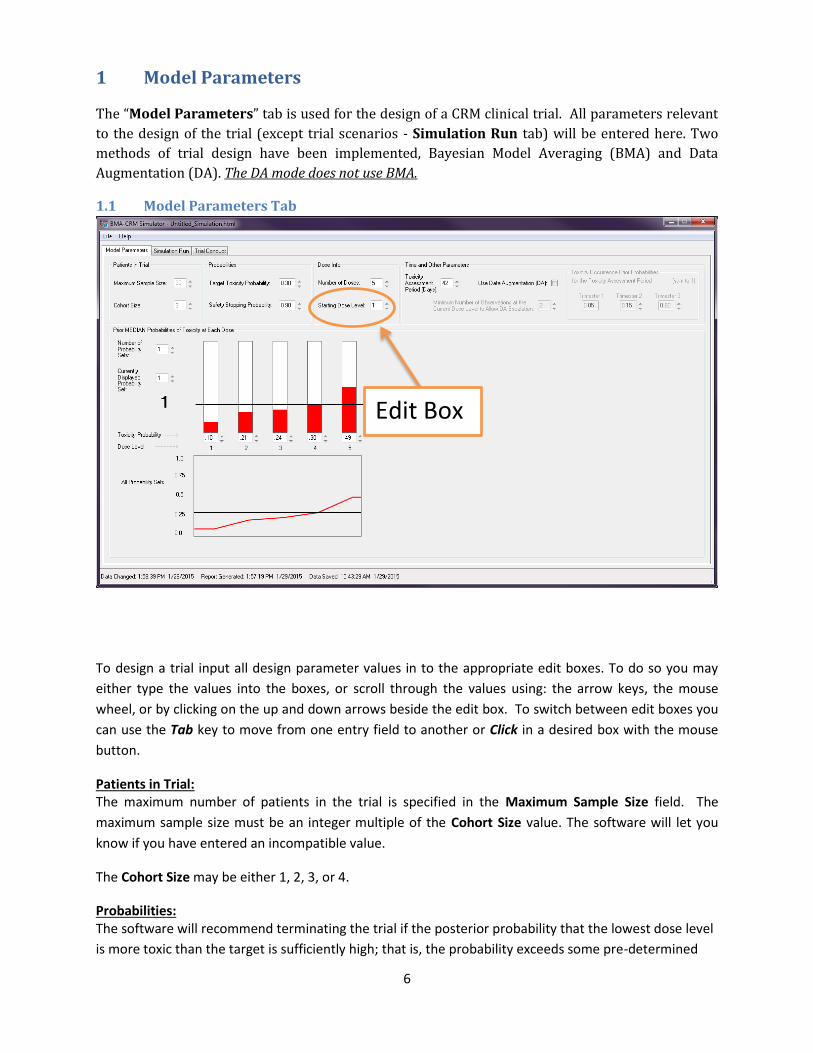
1 Model Parameters
The “Model Parameters” tab is used for the design of a CRM clinical trial. All parameters relevant
to the design of the trial (except trial scenarios - Simulation Run tab) will be entered here. Two
methods of trial design have been implemented, Bayesian Model Averaging (BMA) and Data
Augmentation (DA). The DA mode does not use BMA.
1.1 Model Parameters Tab
To design a trial input all design parameter values in to the appropriate edit boxes. To do so you may
either type the values into the boxes, or scroll through the values using: the arrow keys, the mouse
wheel, or by clicking on the up and down arrows beside the edit box. To switch between edit boxes you
can use the Tab key to move from one entry field to another or Click in a desired box with the mouse
button.
Patients in Trial: The maximum number of patients in the trial is specified in the Maximum Sample Size field. The
maximum sample size must be an integer multiple of the Cohort Size value. The software will let you
know if you have entered an incompatible value.
The Cohort Size may be either 1, 2, 3, or 4.
Probabilities: The software will recommend terminating the trial if the posterior probability that the lowest dose level
is more toxic than the target is sufficiently high; that is, the probability exceeds some pre-determined
Edit Box
7
threshold value. This threshold value is labeled Safety Stopping Probability. Typically this value is
around 0.9 or higher. If it is set much lower than 0.9, then the method will stop frequently. If it is too
high, then the method may not be safe. The user may set the stopping probability as high as 1,
effectively turning off the early trial termination stopping rule. Of course, this would typically be
unethical in an actual clinical trial.
The BMA-CRM method tries to find the dose level with the posterior probability of toxicity closest to a
specified target probability of toxicity without skipping untried dose levels. The method treats all dose
levels below the starting dose level as tried dose levels. The target is labeled Target Toxicity Probability.
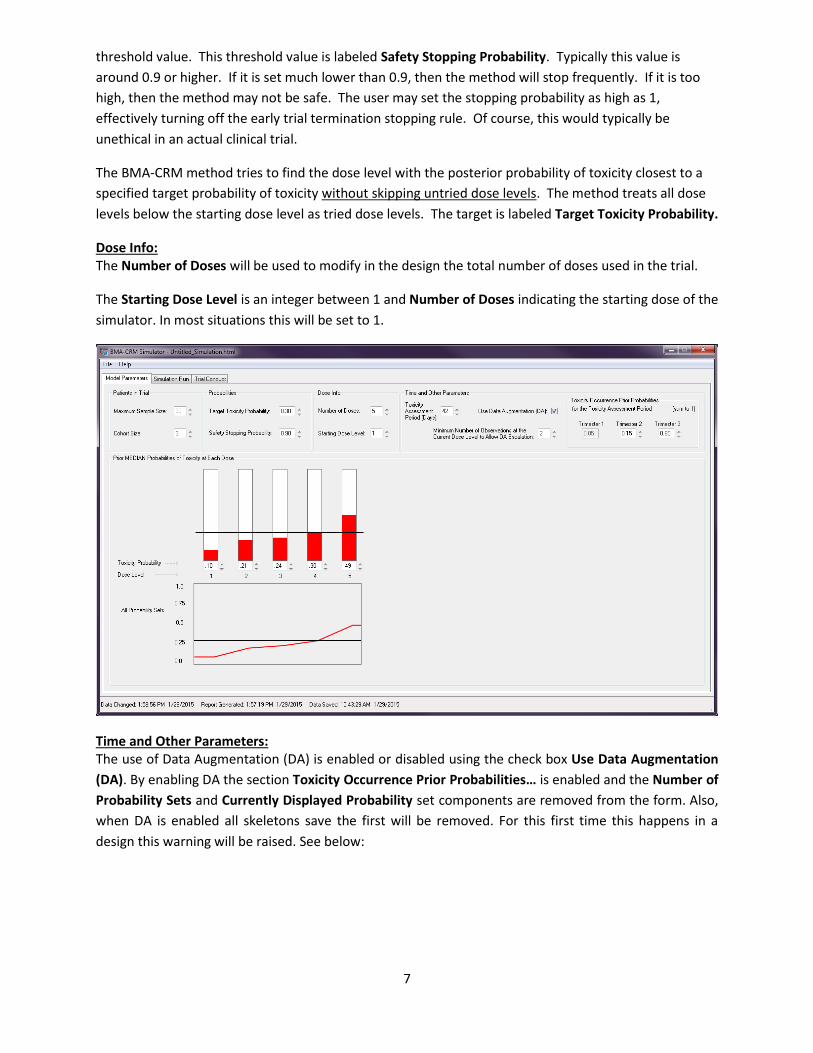
Dose Info: The Number of Doses will be used to modify in the design the total number of doses used in the trial.
The Starting Dose Level is an integer between 1 and Number of Doses indicating the starting dose of the
simulator. In most situations this will be set to 1.
Time and Other Parameters: The use of Data Augmentation (DA) is enabled or disabled using the check box Use Data Augmentation
(DA). By enabling DA the section Toxicity Occurrence Prior Probabilities… is enabled and the Number of
Probability Sets and Currently Displayed Probability set components are removed from the form. Also,
when DA is enabled all skeletons save the first will be removed. For this first time this happens in a
design this warning will be raised. See below:
8
Each patient in the trial will be observed after receiving the treatment for a maximum amount of time,
this is the Total Assessment Period (days).
The Minimum Number of Observations at the Current Dose Level to Allow DA Escalation indicates the
number of observations required for escalation to occur during a DA enabled dose assignment. If this
minimum number of observations has not been reached, then the simulation will wait for more
information.
Toxicity Occurrence Prior Probabilities for the Toxicity Assessment Period: Trimester 1, Trimester 2, and Trimester 3 all correspond to the belief that the prior likelihood of a single
patient
Trimester 1, Trimester 2, and Trimester 3 all correspond to the belief that the prior likelihood of a single
patient experiencing a toxicity in the first, second or final thirds of the Toxicity Assessment Period,
respectively, conditioned on a toxicity having occurred. These three prior probabilities must always sum
to 1.0, as is proper. For further details please confer with Appendix I.
Prior MEDIAN Probabilities of Toxicity at Each Dose: The Number of Probability Sets is the number of skeletons which can be used in the clinical trial design (exactly how these are used varies between BMA and DA as described below). The Currently Displayed Probability Set indicates both which of the Number of Probability Sets is active
for editing but also the choice which will actively be displayed in the bar chart to the right of the edit
box. For clarity a large number indicating the current choice will be displayed below the edit box. When
a value of probability of toxicity is changed by either using a thermometer bar or the edit box below a
thermometer bar, the line graph for the probability set is redrawn to reflect the change.
The bar chart represents the Toxic Probability (prior median probability of toxicity) values in the edit
boxes below the bars. The black line running horizontally through the bars is representative of the
Target Toxicity Probability. The full set of the bars is a single skeleton. Each Currently Displayed
Probability Set will have a different color. Each bar is also decorated with a Dose Level below the
Toxicity Probability edit box. The range for the probability values is from 0.01 through 0.99. Since the
CRM method assumes that the probability of toxicity monotonically increases with respect to the dose
level, the minimum and maximum height of each bar is set to allow at least 0.01 in difference between
neighboring bar heights.
The maximum number of doses is 20.
The line plot All Probability Sets is an alternative (ordinal) representation of the skeletons in the
Probability Sets. This plot, as a visualization tool, allows the user to view all skeletons simultaneously.
This plot also has a black line cutting across the plots horizontally.
9
1.2 Using Bayesian Model Averaging
The Bayesian Model Averaging (BMA) utilizes numerous skeletons of ‘prior median probability of
toxicity’ simultaneously. That means the design will use a total of Number of Probability Sets for each
simulation as described in the
The document describing the BMA-CRM method provides some guidance for setting up multiple
probability sets (found in Help→BMA-CRM Method Description). Note that while it describes them
as prior mean probability sets, the same considerations apply to prior median probability sets.
The use of an accrual rate in the simulation of BMA is not strictly necessary. However, by modeling the
time to event alongside the CRM simulations allows for a direct approximation of the expected length of
a CRM trial. This can be helpful in comparisons to the DA based CRM trials, which generally have shorter
expected trial durations.
The maximum number of probability sets allowed is five.
When using only a single skeleton and not enabling DA the mode of simulation will be a traditional CRM.
1.3 Using Data Augmentation
In contrast the BMA-CRM approach, DA-CRM uses only one probability set at a time. When choosing to
use Data Augmentation the number of skeletons will be reduced to one, all but the first skeleton will be
erased, and switching back to BMA will require reentering all skeletons. Having a single skeleton in
memory will allow switching between standard CRM and DA-CRM for comparative reasons. The accrual
rate parameter is crucial to the design of a DA-CRM trial. This parameter represents the user’s belief in
how frequent new patients can be assigned to this trial.
When using DA the trial design can have built in a constraint dictating how easy it is to escalate from a
current dose to a higher dose with missing toxicities by require some number of known outcomes at the
current dose before escalating to a higher dose. This is a safety rule that requires the trial to wait for
further knowledge of outcomes before making decisions.
Remember that Data Augmentation uses only a single skeleton (Probability Set) and is most desirably
compared to a standard CRM run with a single skeleton. This is the logic behind the design.
The implementation of DA-CRM here will use a traditional CRM whenever possible (lack of missingness
of data) and DA only when it can’t use traditional CRM.
When using DA, the DA based computations will indicate the trial to terminate/stop early. In these
situations the trial will wait for more patient outcomes to occur. Stopping early can only occur in
traditional (full information) CRM.
Further documentation on the Data Augmentation method and a further understanding of its more theoretical underpinnings can be found by reading Help→DA-CRM Method Description.
10
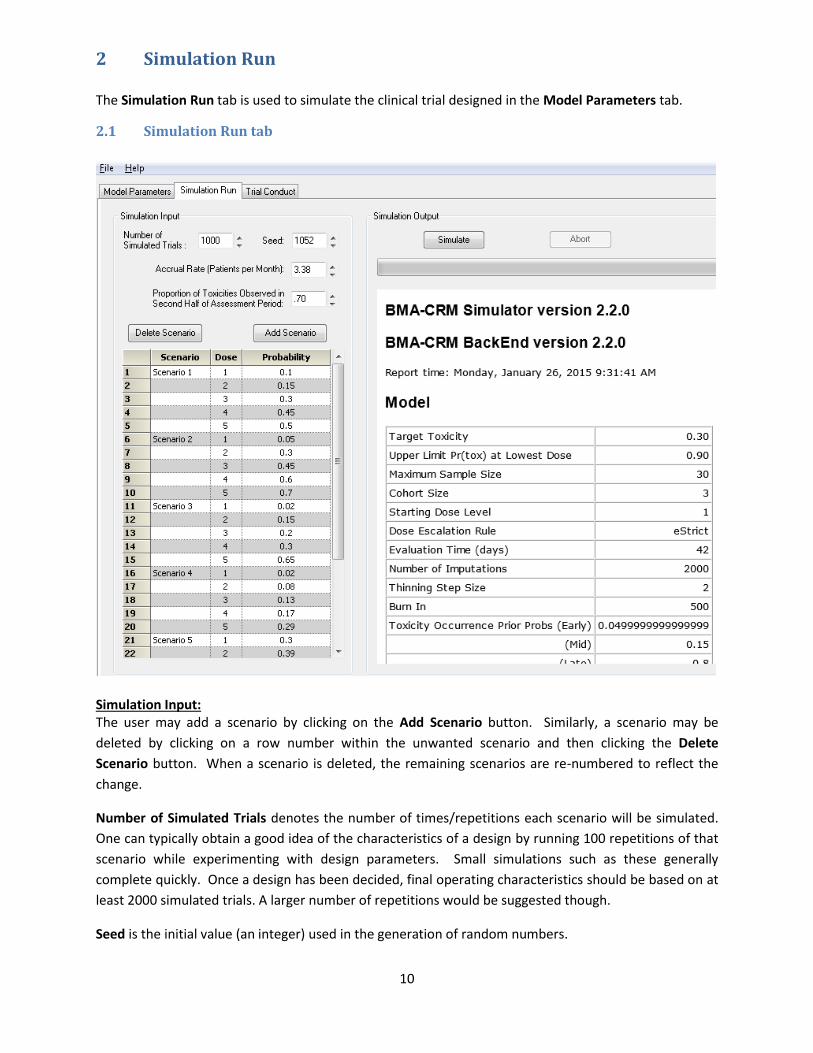
2 Simulation Run The Simulation Run tab is used to simulate the clinical trial designed in the Model Parameters tab.
2.1 Simulation Run tab
Simulation Input: The user may add a scenario by clicking on the Add Scenario button. Similarly, a scenario may be
deleted by clicking on a row number within the unwanted scenario and then clicking the Delete
Scenario button. When a scenario is deleted, the remaining scenarios are re-numbered to reflect the
change.
Number of Simulated Trials denotes the number of times/repetitions each scenario will be simulated.
One can typically obtain a good idea of the characteristics of a design by running 100 repetitions of that
scenario while experimenting with design parameters. Small simulations such as these generally
complete quickly. Once a design has been decided, final operating characteristics should be based on at
least 2000 simulated trials. A larger number of repetitions would be suggested though.
Seed is the initial value (an integer) used in the generation of random numbers.
11
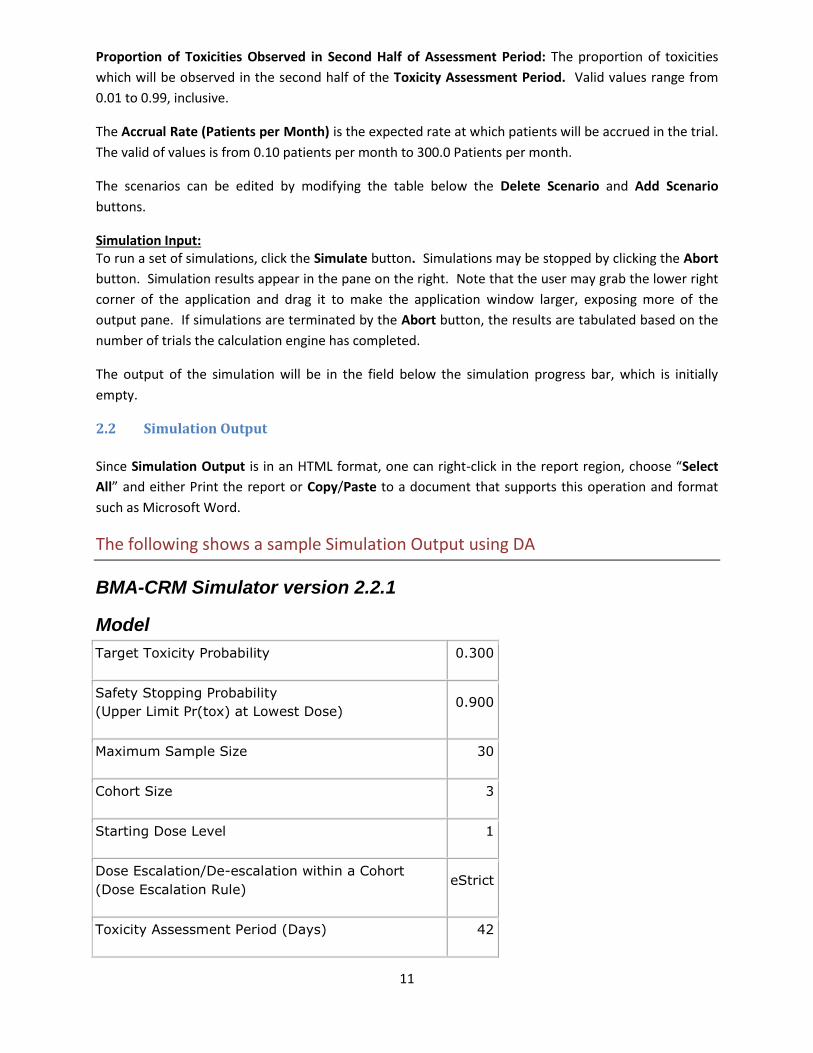
Proportion of Toxicities Observed in Second Half of Assessment Period: The proportion of toxicities
which will be observed in the second half of the Toxicity Assessment Period. Valid values range from
0.01 to 0.99, inclusive.
The Accrual Rate (Patients per Month) is the expected rate at which patients will be accrued in the trial.
The valid of values is from 0.10 patients per month to 300.0 Patients per month.
The scenarios can be edited by modifying the table below the Delete Scenario and Add Scenario
buttons.
Simulation Input: To run a set of simulations, click the Simulate button. Simulations may be stopped by clicking the Abort
button. Simulation results appear in the pane on the right. Note that the user may grab the lower right
corner of the application and drag it to make the application window larger, exposing more of the
output pane. If simulations are terminated by the Abort button, the results are tabulated based on the
number of trials the calculation engine has completed.
The output of the simulation will be in the field below the simulation progress bar, which is initially
empty.
2.2 Simulation Output
Since Simulation Output is in an HTML format, one can right-click in the report region, choose “Select
All” and either Print the report or Copy/Paste to a document that supports this operation and format
such as Microsoft Word.
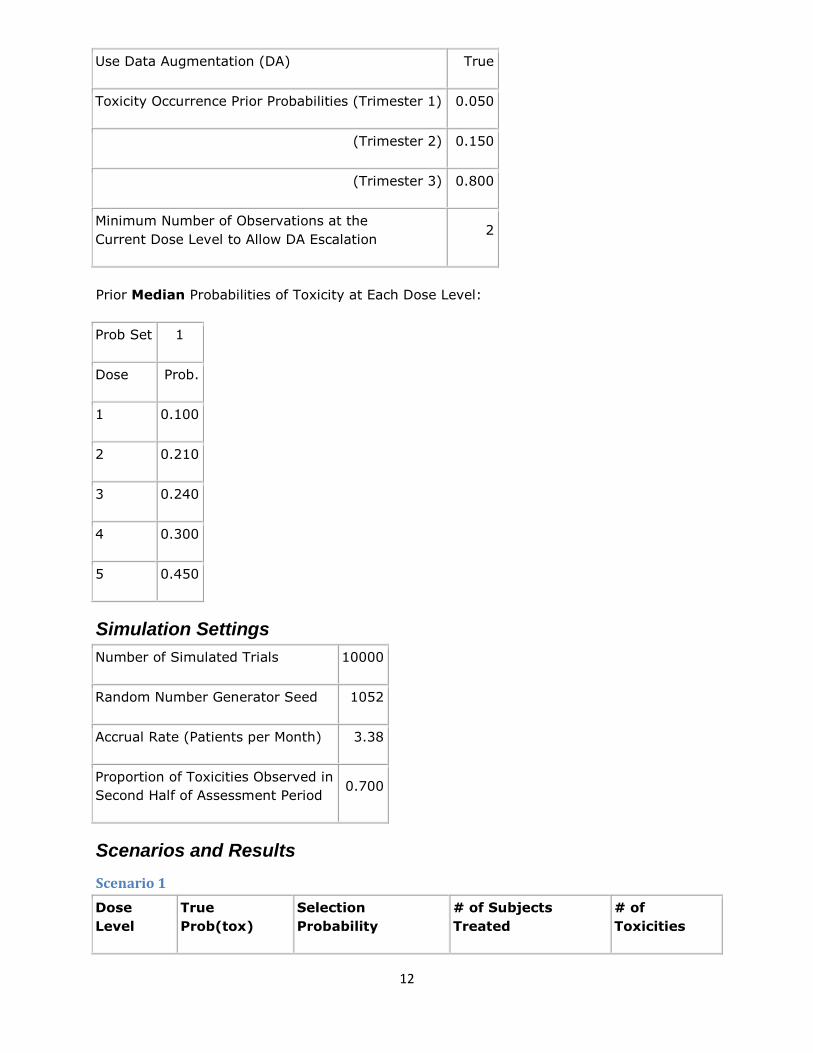
The following shows a sample Simulation Output using DA
BMA-CRM Simulator version 2.2.1
Model
Target Toxicity Probability 0.300
Safety Stopping Probability
(Upper Limit Pr(tox) at Lowest Dose) 0.900
Maximum Sample Size 30
Cohort Size 3
Starting Dose Level 1
Dose Escalation/De-escalation within a Cohort
(Dose Escalation Rule) eStrict
Toxicity Assessment Period (Days) 42
12
Use Data Augmentation (DA) True
Toxicity Occurrence Prior Probabilities (Trimester 1) 0.050
(Trimester 2) 0.150
(Trimester 3) 0.800
Minimum Number of Observations at the
Current Dose Level to Allow DA Escalation 2
Prior Median Probabilities of Toxicity at Each Dose Level:
Prob Set 1
Dose Prob.
1 0.100
2 0.210
3 0.240
4 0.300
5 0.450
Simulation Settings
Number of Simulated Trials 10000
Random Number Generator Seed 1052
Accrual Rate (Patients per Month) 3.38
Proportion of Toxicities Observed in
Second Half of Assessment Period 0.700
Scenarios and Results
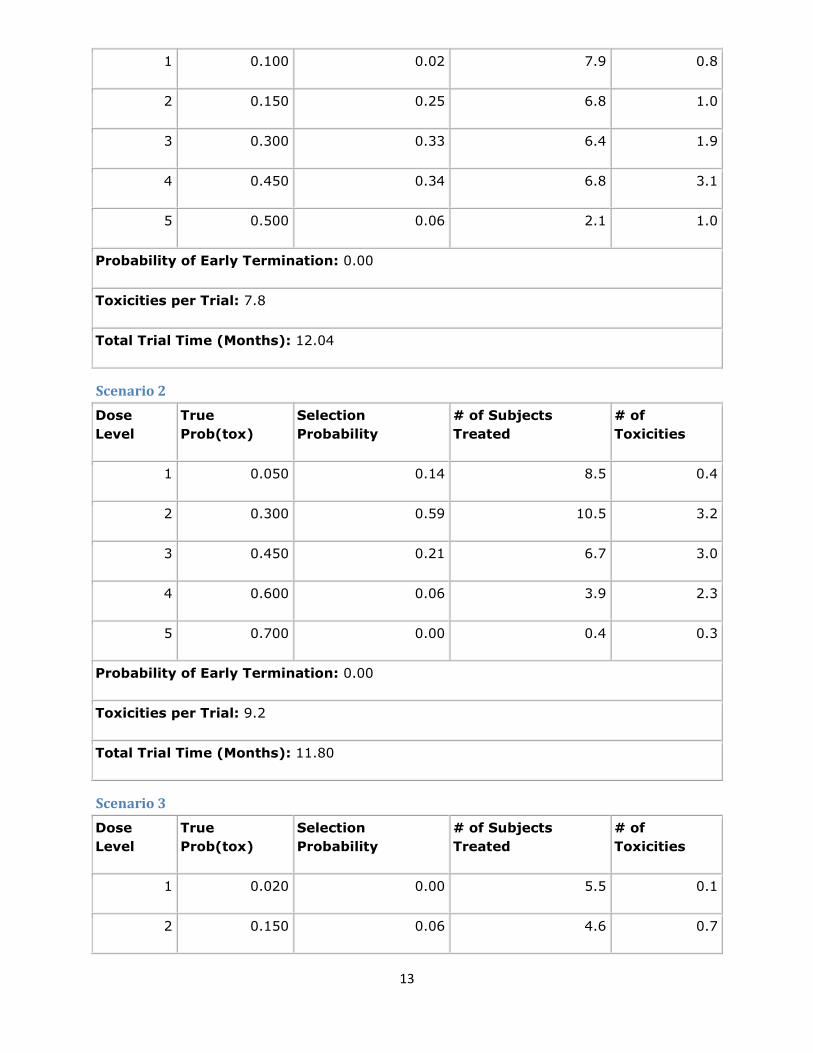
Scenario 1
Dose
Level
True
Prob(tox)
Selection
Probability
# of Subjects
Treated
# of
Toxicities
13
1 0.100 0.02 7.9 0.8
2 0.150 0.25 6.8 1.0
3 0.300 0.33 6.4 1.9
4 0.450 0.34 6.8 3.1
5 0.500 0.06 2.1 1.0
Probability of Early Termination: 0.00
Toxicities per Trial: 7.8
Total Trial Time (Months): 12.04
Scenario 2
Dose
Level
True
Prob(tox)
Selection
Probability
# of Subjects
Treated
# of
Toxicities
1 0.050 0.14 8.5 0.4
2 0.300 0.59 10.5 3.2
3 0.450 0.21 6.7 3.0
4 0.600 0.06 3.9 2.3
5 0.700 0.00 0.4 0.3
Probability of Early Termination: 0.00
Toxicities per Trial: 9.2
Total Trial Time (Months): 11.80
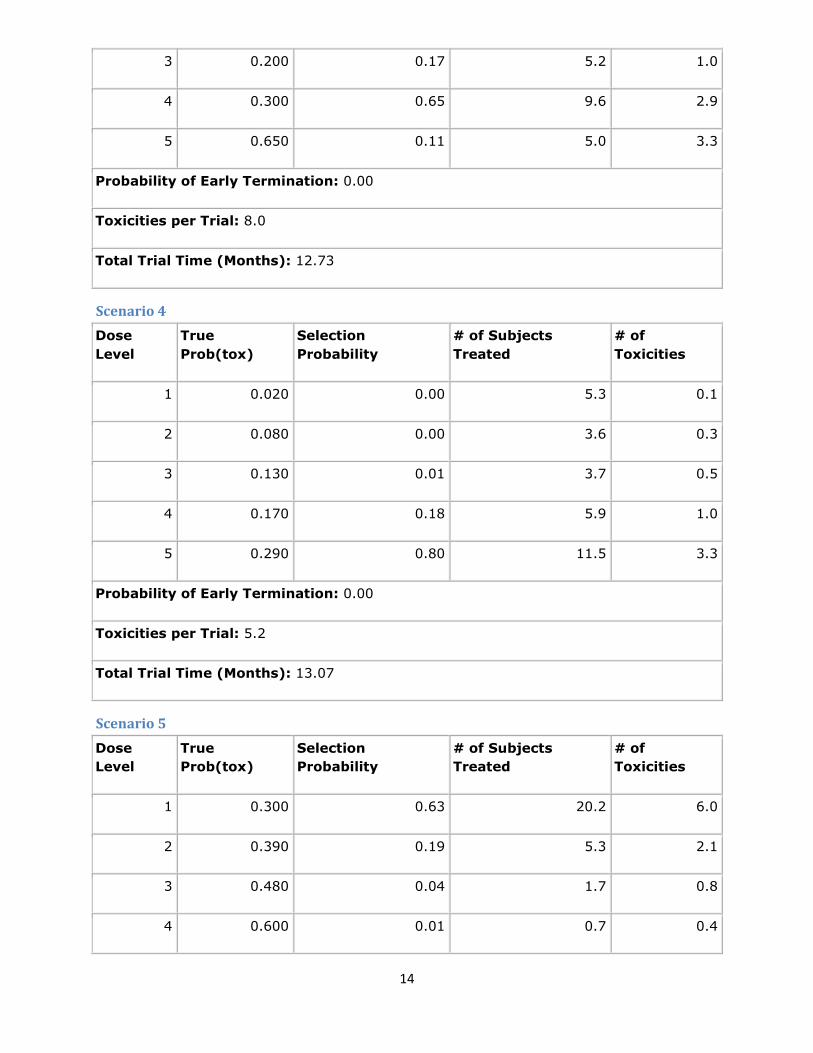
Scenario 3
Dose
Level
True
Prob(tox)
Selection
Probability
# of Subjects
Treated
# of
Toxicities
1 0.020 0.00 5.5 0.1
2 0.150 0.06 4.6 0.7
14
3 0.200 0.17 5.2 1.0
4 0.300 0.65 9.6 2.9
5 0.650 0.11 5.0 3.3
Probability of Early Termination: 0.00
Toxicities per Trial: 8.0
Total Trial Time (Months): 12.73
Scenario 4
Dose
Level
True
Prob(tox)
Selection
Probability
# of Subjects
Treated
# of
Toxicities
1 0.020 0.00 5.3 0.1
2 0.080 0.00 3.6 0.3
3 0.130 0.01 3.7 0.5
4 0.170 0.18 5.9 1.0
5 0.290 0.80 11.5 3.3
Probability of Early Termination: 0.00
Toxicities per Trial: 5.2
Total Trial Time (Months): 13.07
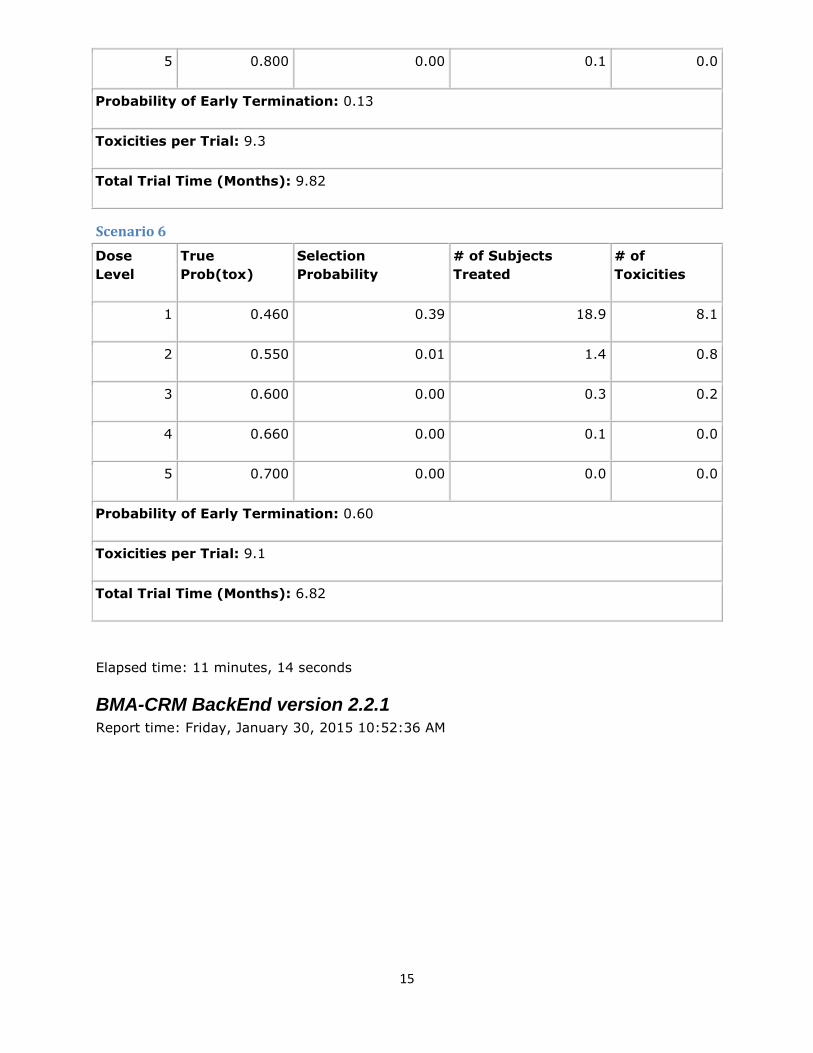
Scenario 5
Dose
Level
True
Prob(tox)
Selection
Probability
# of Subjects
Treated
# of
Toxicities
1 0.300 0.63 20.2 6.0
2 0.390 0.19 5.3 2.1
3 0.480 0.04 1.7 0.8
4 0.600 0.01 0.7 0.4
15
5 0.800 0.00 0.1 0.0
Probability of Early Termination: 0.13
Toxicities per Trial: 9.3
Total Trial Time (Months): 9.82
Scenario 6
Dose
Level
True
Prob(tox)
Selection
Probability
# of Subjects
Treated
# of
Toxicities
1 0.460 0.39 18.9 8.1
2 0.550 0.01 1.4 0.8
3 0.600 0.00 0.3 0.2
4 0.660 0.00 0.1 0.0
5 0.700 0.00 0.0 0.0
Probability of Early Termination: 0.60
Toxicities per Trial: 9.1
Total Trial Time (Months): 6.82
Elapsed time: 11 minutes, 14 seconds
BMA-CRM BackEnd version 2.2.1 Report time: Friday, January 30, 2015 10:52:36 AM
16
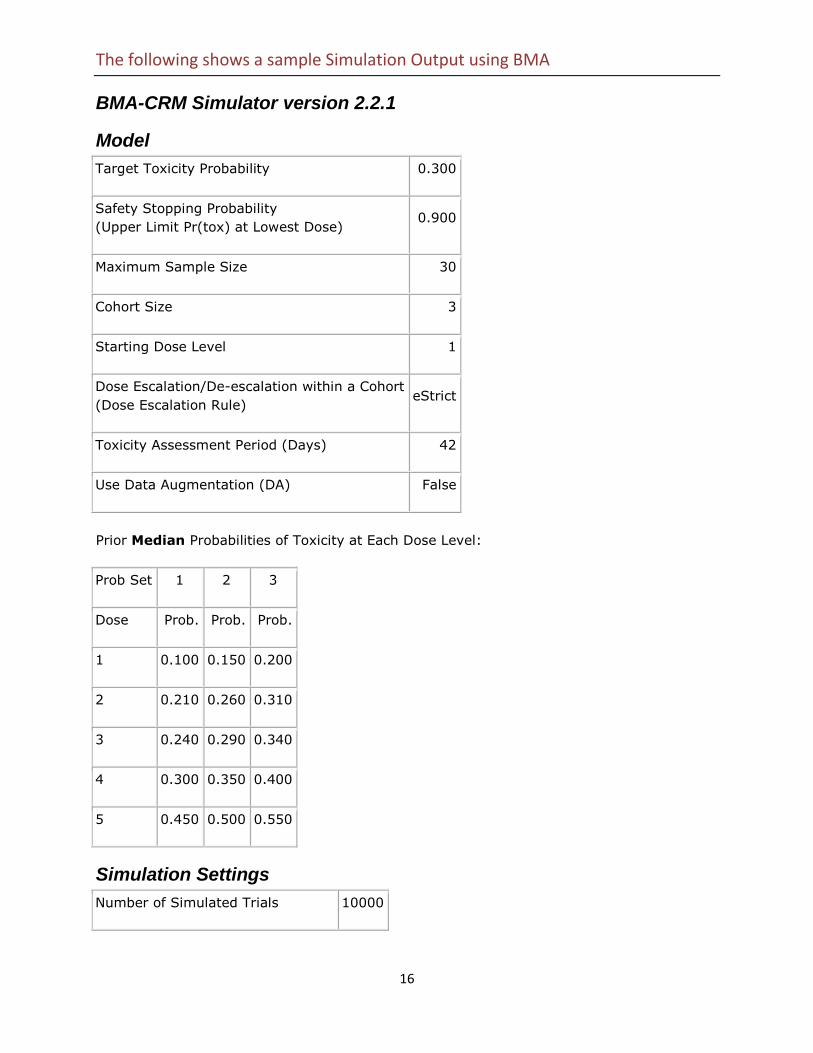
The following shows a sample Simulation Output using BMA
BMA-CRM Simulator version 2.2.1
Model
Target Toxicity Probability 0.300
Safety Stopping Probability
(Upper Limit Pr(tox) at Lowest Dose) 0.900
Maximum Sample Size 30
Cohort Size 3
Starting Dose Level 1
Dose Escalation/De-escalation within a Cohort
(Dose Escalation Rule) eStrict
Toxicity Assessment Period (Days) 42
Use Data Augmentation (DA) False
Prior Median Probabilities of Toxicity at Each Dose Level:
Prob Set 1 2 3
Dose Prob. Prob. Prob.
1 0.100 0.150 0.200
2 0.210 0.260 0.310
3 0.240 0.290 0.340
4 0.300 0.350 0.400
5 0.450 0.500 0.550
Simulation Settings
Number of Simulated Trials 10000
17
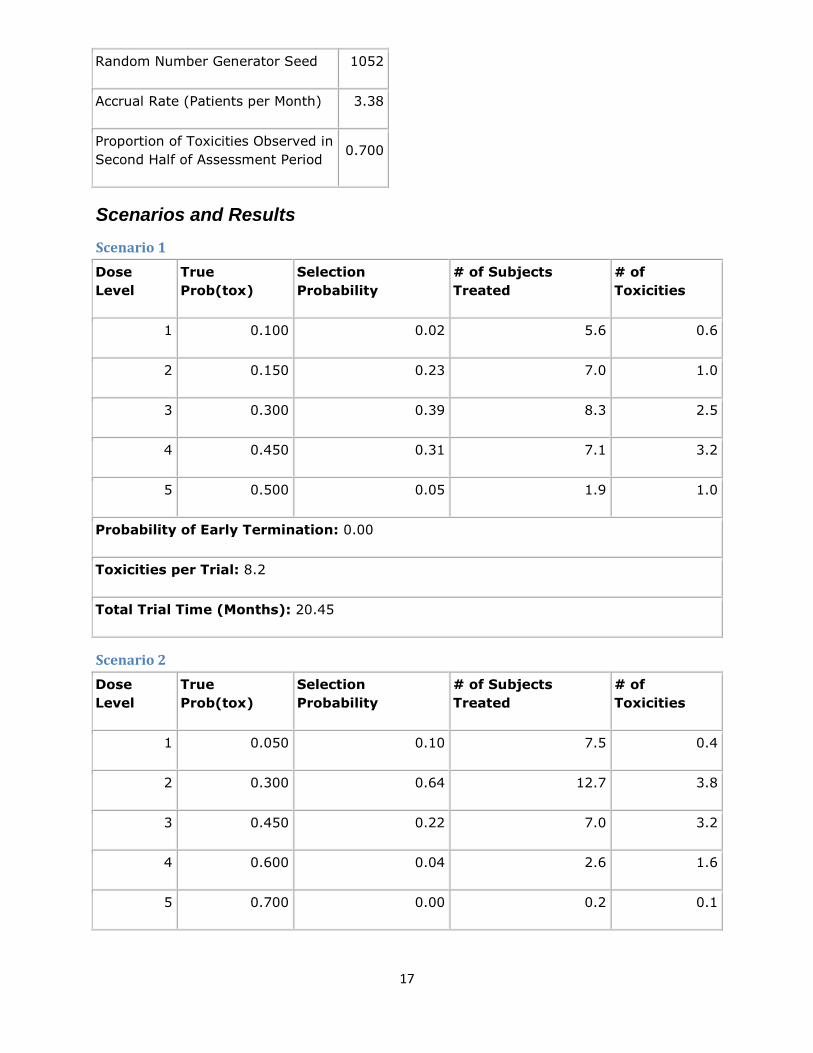
Random Number Generator Seed 1052
Accrual Rate (Patients per Month) 3.38
Proportion of Toxicities Observed in
Second Half of Assessment Period 0.700
Scenarios and Results
Scenario 1
Dose
Level
True
Prob(tox)
Selection
Probability
# of Subjects
Treated
# of
Toxicities
1 0.100 0.02 5.6 0.6
2 0.150 0.23 7.0 1.0
3 0.300 0.39 8.3 2.5
4 0.450 0.31 7.1 3.2
5 0.500 0.05 1.9 1.0
Probability of Early Termination: 0.00
Toxicities per Trial: 8.2
Total Trial Time (Months): 20.45
Scenario 2
Dose
Level
True
Prob(tox)
Selection
Probability
# of Subjects
Treated
# of
Toxicities
1 0.050 0.10 7.5 0.4
2 0.300 0.64 12.7 3.8
3 0.450 0.22 7.0 3.2
4 0.600 0.04 2.6 1.6
5 0.700 0.00 0.2 0.1
18
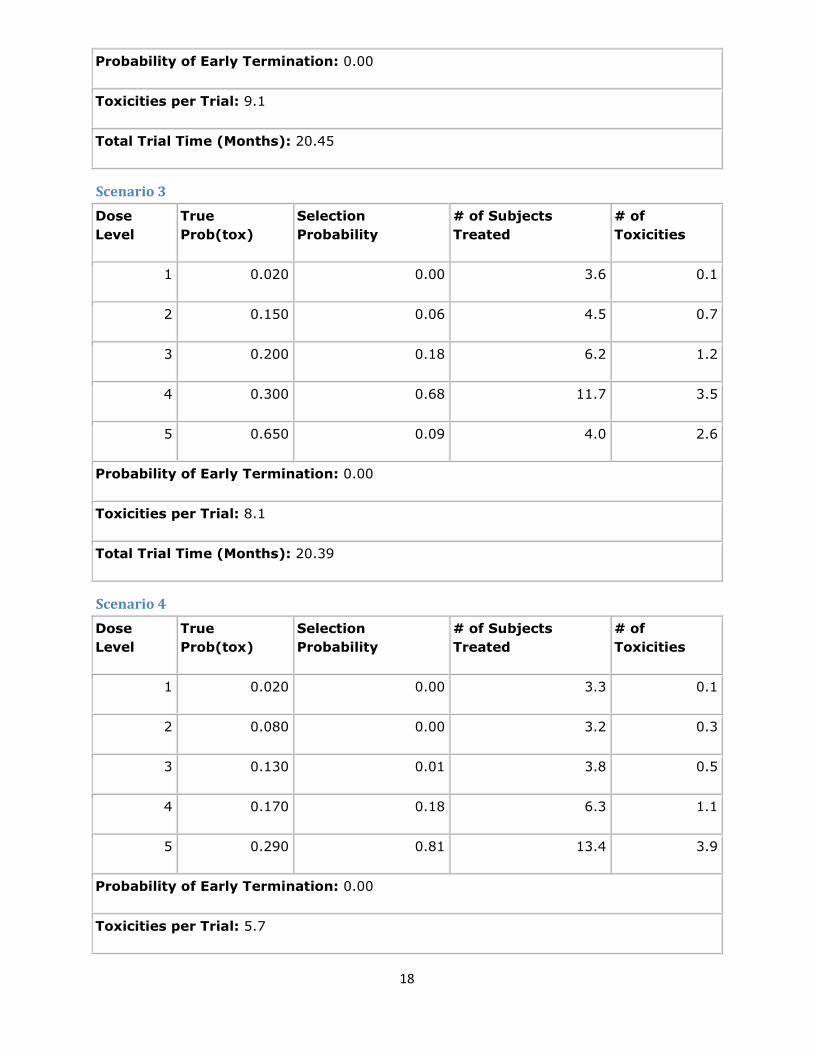
Probability of Early Termination: 0.00
Toxicities per Trial: 9.1
Total Trial Time (Months): 20.45
Scenario 3
Dose
Level
True
Prob(tox)
Selection
Probability
# of Subjects
Treated
# of
Toxicities
1 0.020 0.00 3.6 0.1
2 0.150 0.06 4.5 0.7
3 0.200 0.18 6.2 1.2
4 0.300 0.68 11.7 3.5
5 0.650 0.09 4.0 2.6
Probability of Early Termination: 0.00
Toxicities per Trial: 8.1
Total Trial Time (Months): 20.39
Scenario 4
Dose
Level
True
Prob(tox)
Selection
Probability
# of Subjects
Treated
# of
Toxicities
1 0.020 0.00 3.3 0.1
2 0.080 0.00 3.2 0.3
3 0.130 0.01 3.8 0.5
4 0.170 0.18 6.3 1.1
5 0.290 0.81 13.4 3.9
Probability of Early Termination: 0.00
Toxicities per Trial: 5.7
19
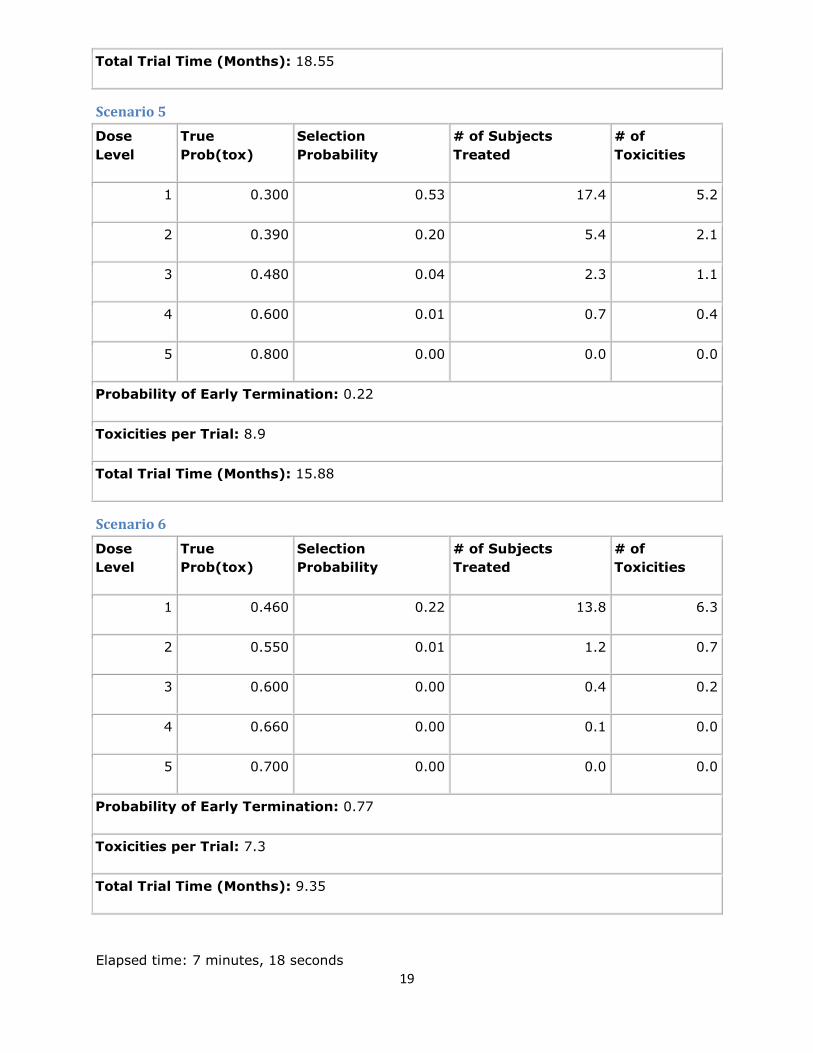
Total Trial Time (Months): 18.55
Scenario 5
Dose
Level
True
Prob(tox)
Selection
Probability
# of Subjects
Treated
# of
Toxicities
1 0.300 0.53 17.4 5.2
2 0.390 0.20 5.4 2.1
3 0.480 0.04 2.3 1.1
4 0.600 0.01 0.7 0.4
5 0.800 0.00 0.0 0.0
Probability of Early Termination: 0.22
Toxicities per Trial: 8.9
Total Trial Time (Months): 15.88
Scenario 6
Dose
Level
True
Prob(tox)
Selection
Probability
# of Subjects
Treated
# of
Toxicities
1 0.460 0.22 13.8 6.3
2 0.550 0.01 1.2 0.7
3 0.600 0.00 0.4 0.2
4 0.660 0.00 0.1 0.0
5 0.700 0.00 0.0 0.0
Probability of Early Termination: 0.77
Toxicities per Trial: 7.3
Total Trial Time (Months): 9.35
Elapsed time: 7 minutes, 18 seconds

20
BMA-CRM BackEnd version 2.2.1 Report time: Friday, January 30, 2015 11:00:37 AM
21
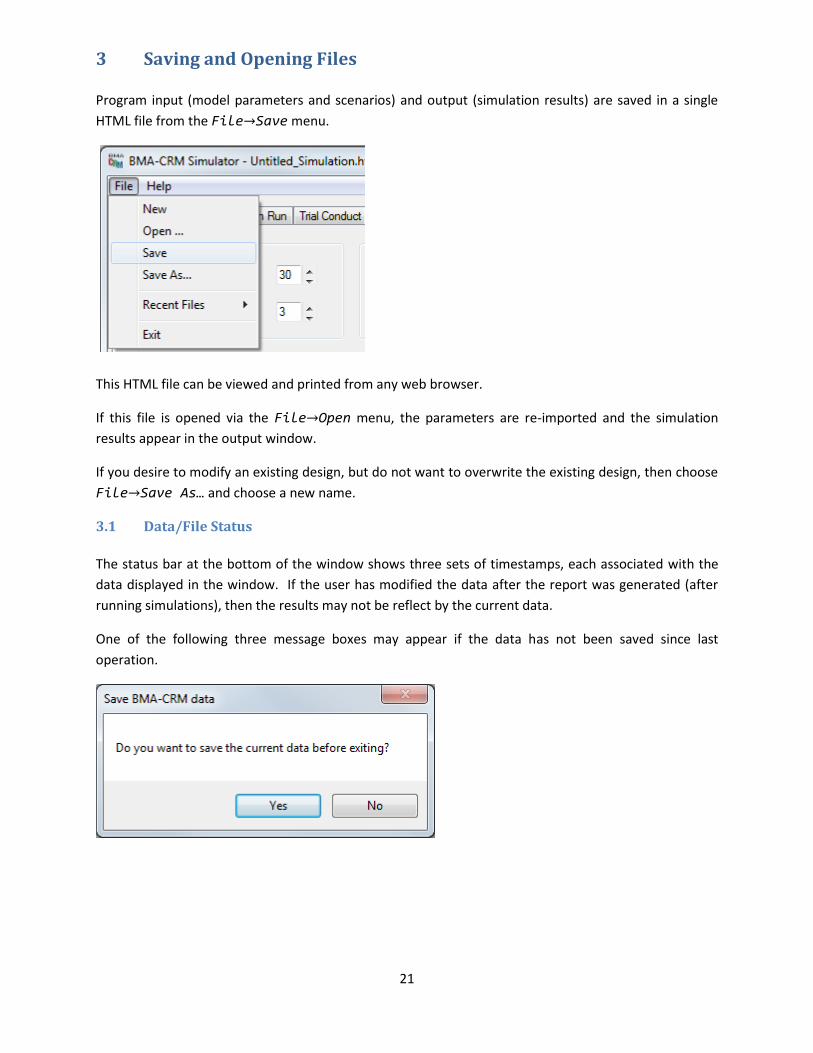
3 Saving and Opening Files Program input (model parameters and scenarios) and output (simulation results) are saved in a single
HTML file from the File→Save menu.
This HTML file can be viewed and printed from any web browser.
If this file is opened via the File→Open menu, the parameters are re-imported and the simulation
results appear in the output window.
If you desire to modify an existing design, but do not want to overwrite the existing design, then choose
File→Save As… and choose a new name.
3.1 Data/File Status
The status bar at the bottom of the window shows three sets of timestamps, each associated with the
data displayed in the window. If the user has modified the data after the report was generated (after
running simulations), then the results may not be reflect by the current data.
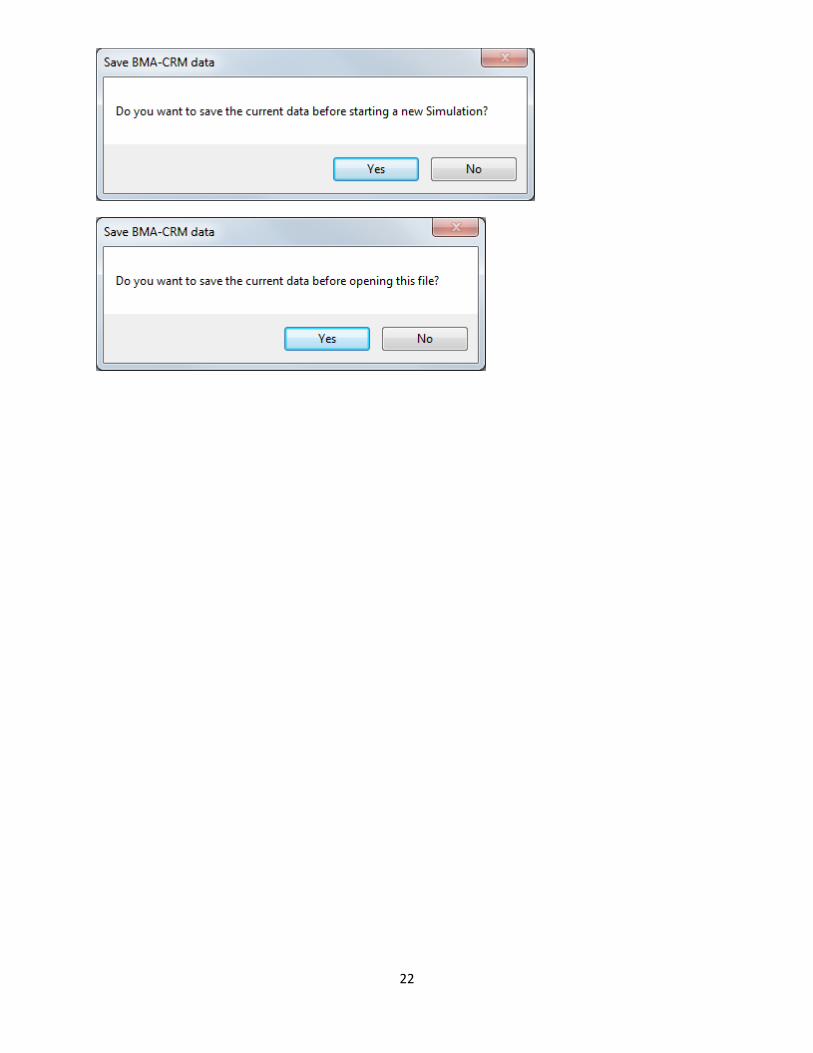
One of the following three message boxes may appear if the data has not been saved since last
operation.
22
23
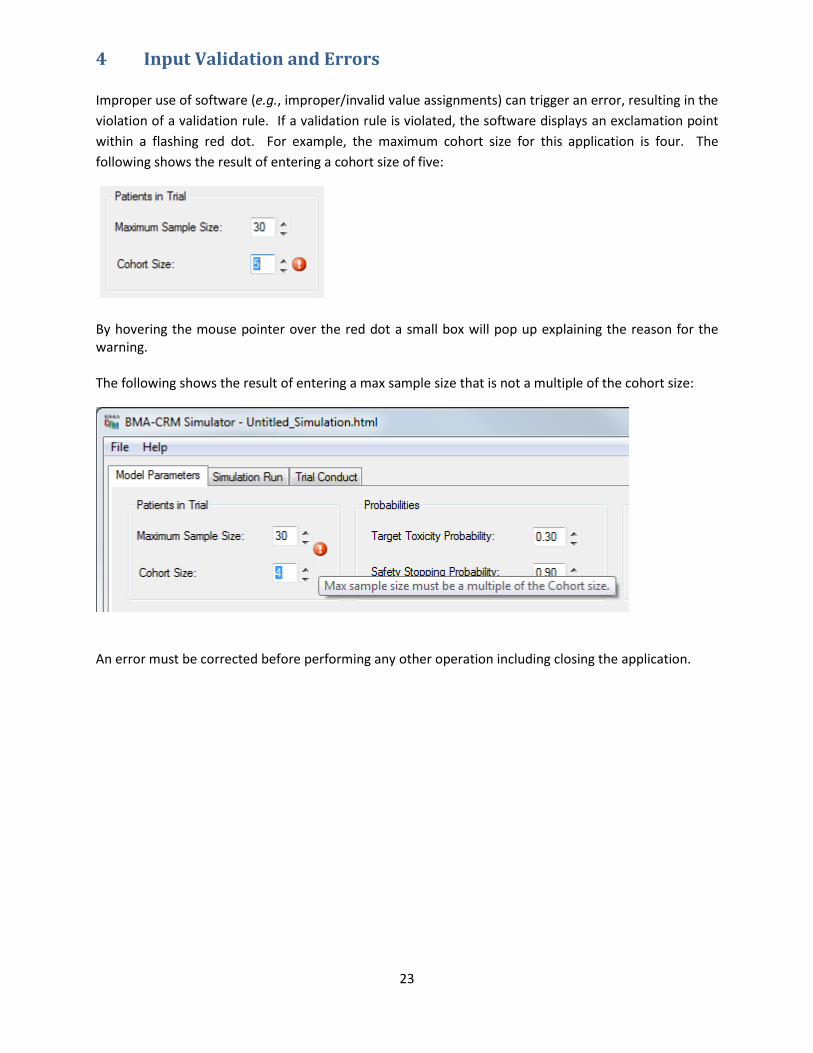
4 Input Validation and Errors Improper use of software (e.g., improper/invalid value assignments) can trigger an error, resulting in the
violation of a validation rule. If a validation rule is violated, the software displays an exclamation point
within a flashing red dot. For example, the maximum cohort size for this application is four. The
following shows the result of entering a cohort size of five:
By hovering the mouse pointer over the red dot a small box will pop up explaining the reason for the warning. The following shows the result of entering a max sample size that is not a multiple of the cohort size:
An error must be corrected before performing any other operation including closing the application.
24
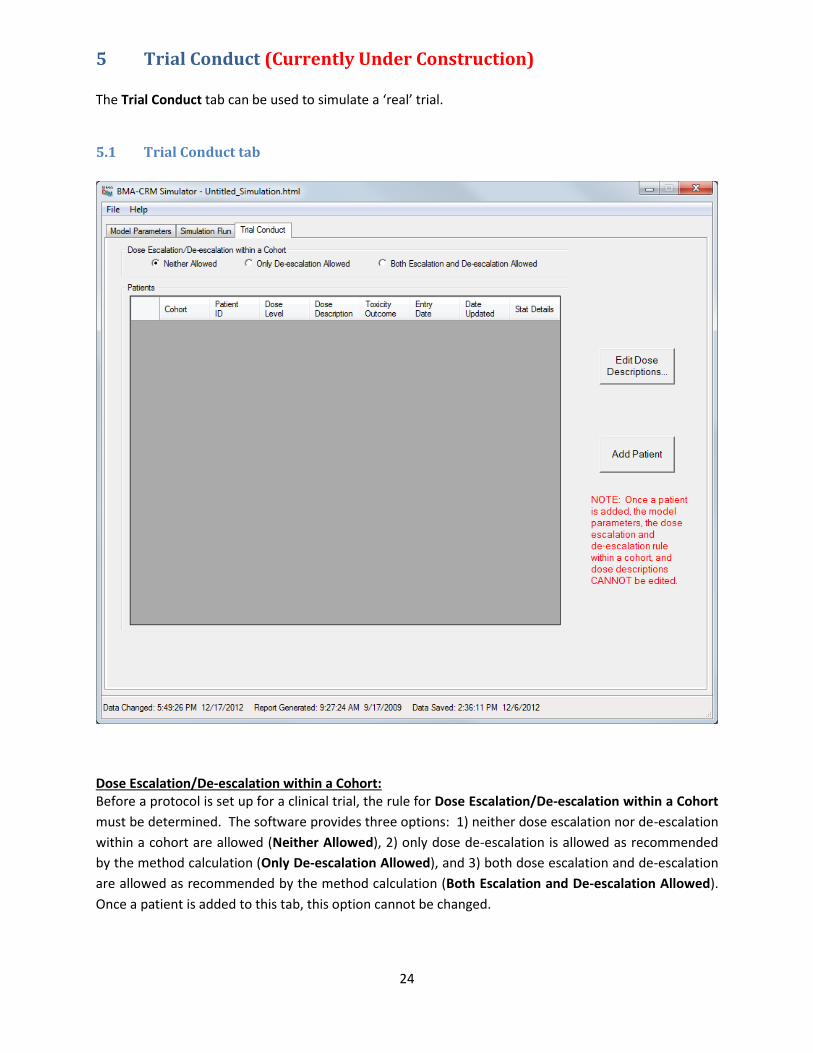
5 Trial Conduct (Currently Under Construction) The Trial Conduct tab can be used to simulate a ‘real’ trial.
5.1 Trial Conduct tab
Dose Escalation/De-escalation within a Cohort: Before a protocol is set up for a clinical trial, the rule for Dose Escalation/De-escalation within a Cohort
must be determined. The software provides three options: 1) neither dose escalation nor de-escalation
within a cohort are allowed (Neither Allowed), 2) only dose de-escalation is allowed as recommended
by the method calculation (Only De-escalation Allowed), and 3) both dose escalation and de-escalation
are allowed as recommended by the method calculation (Both Escalation and De-escalation Allowed).
Once a patient is added to this tab, this option cannot be changed.
25
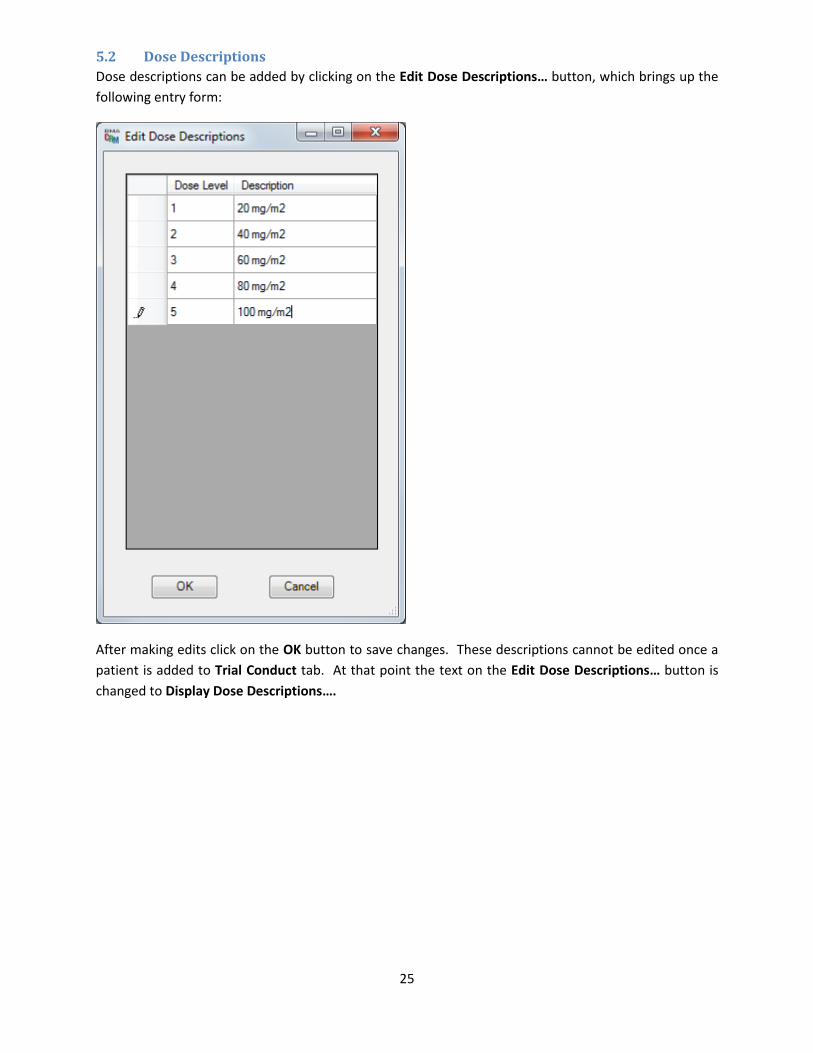
5.2 Dose Descriptions
Dose descriptions can be added by clicking on the Edit Dose Descriptions… button, which brings up the
following entry form:
After making edits click on the OK button to save changes. These descriptions cannot be edited once a
patient is added to Trial Conduct tab. At that point the text on the Edit Dose Descriptions… button is
changed to Display Dose Descriptions….
26
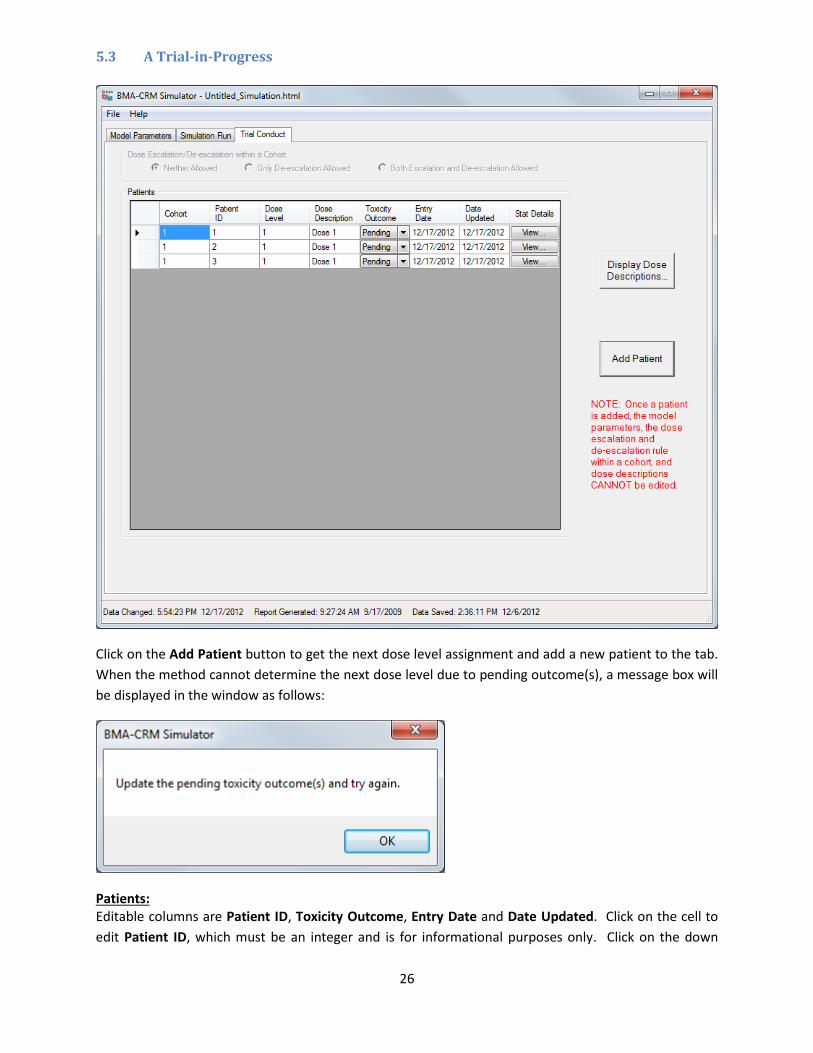
5.3 A Trial-in-Progress
Click on the Add Patient button to get the next dose level assignment and add a new patient to the tab.
When the method cannot determine the next dose level due to pending outcome(s), a message box will
be displayed in the window as follows:
Patients: Editable columns are Patient ID, Toxicity Outcome, Entry Date and Date Updated. Click on the cell to
edit Patient ID, which must be an integer and is for informational purposes only. Click on the down
27
arrow to choose Toxicity Outcome. The columns and rows are resizable in the same way as they are in
Microsoft Excel.
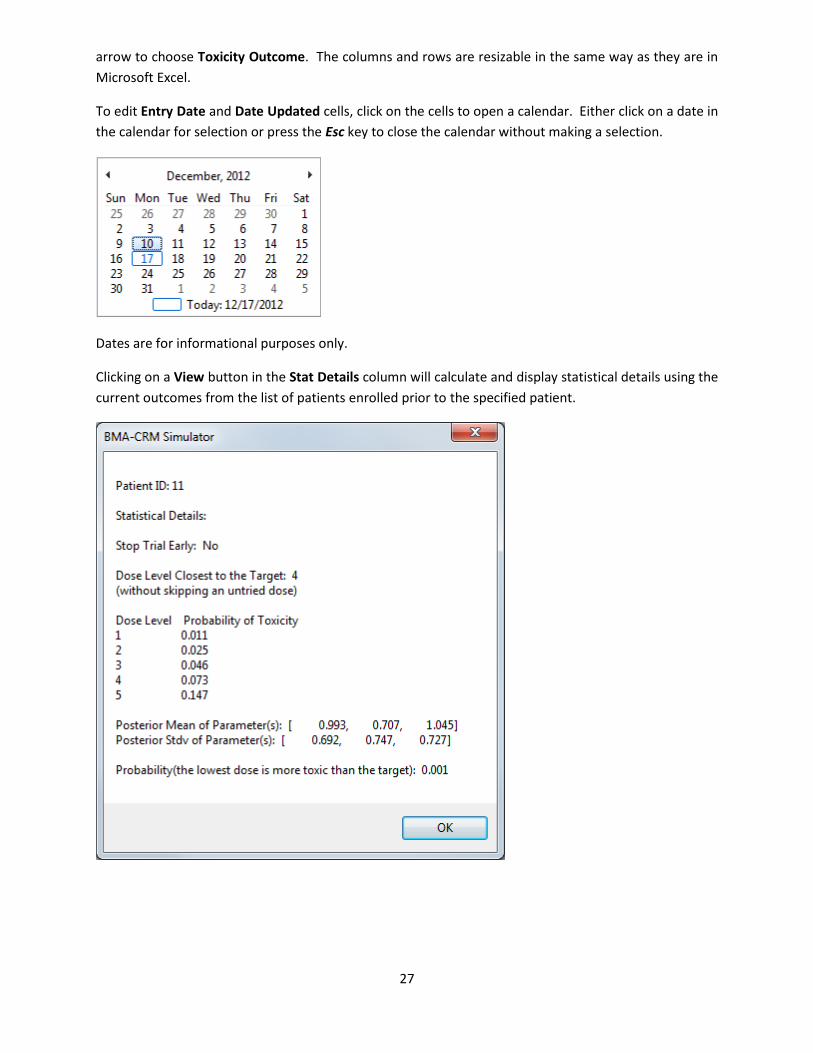
To edit Entry Date and Date Updated cells, click on the cells to open a calendar. Either click on a date in
the calendar for selection or press the Esc key to close the calendar without making a selection.
Dates are for informational purposes only.
Clicking on a View button in the Stat Details column will calculate and display statistical details using the
current outcomes from the list of patients enrolled prior to the specified patient.
28
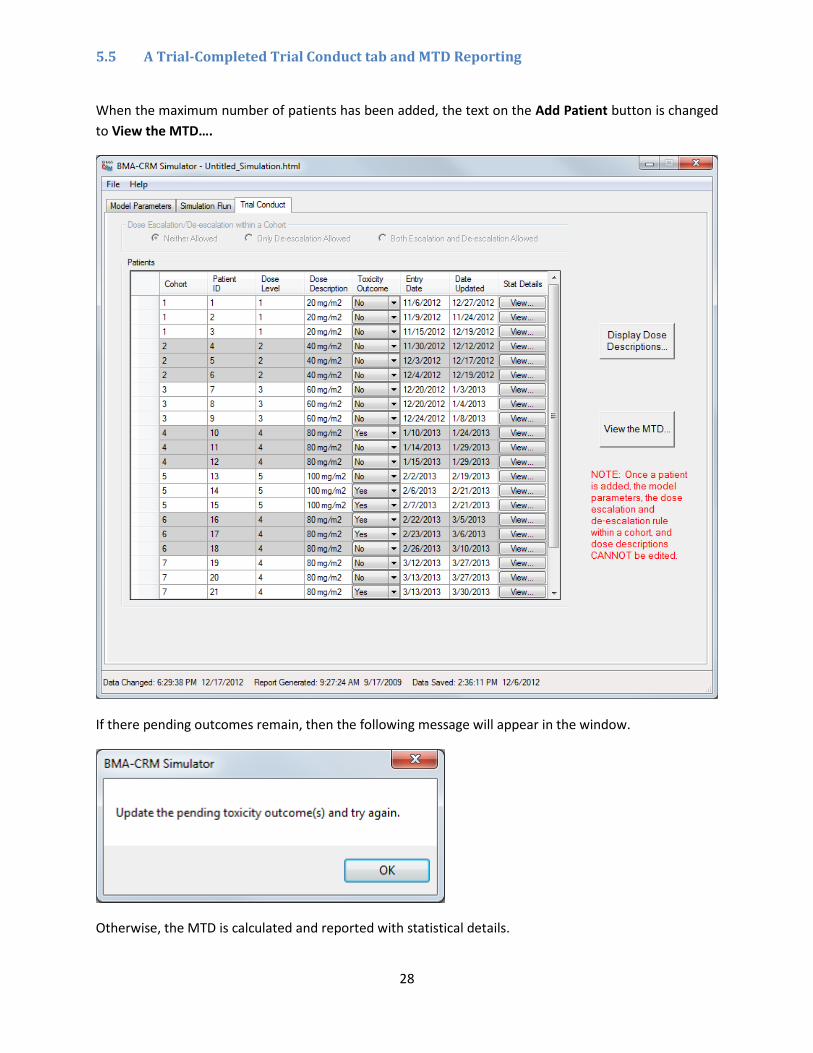
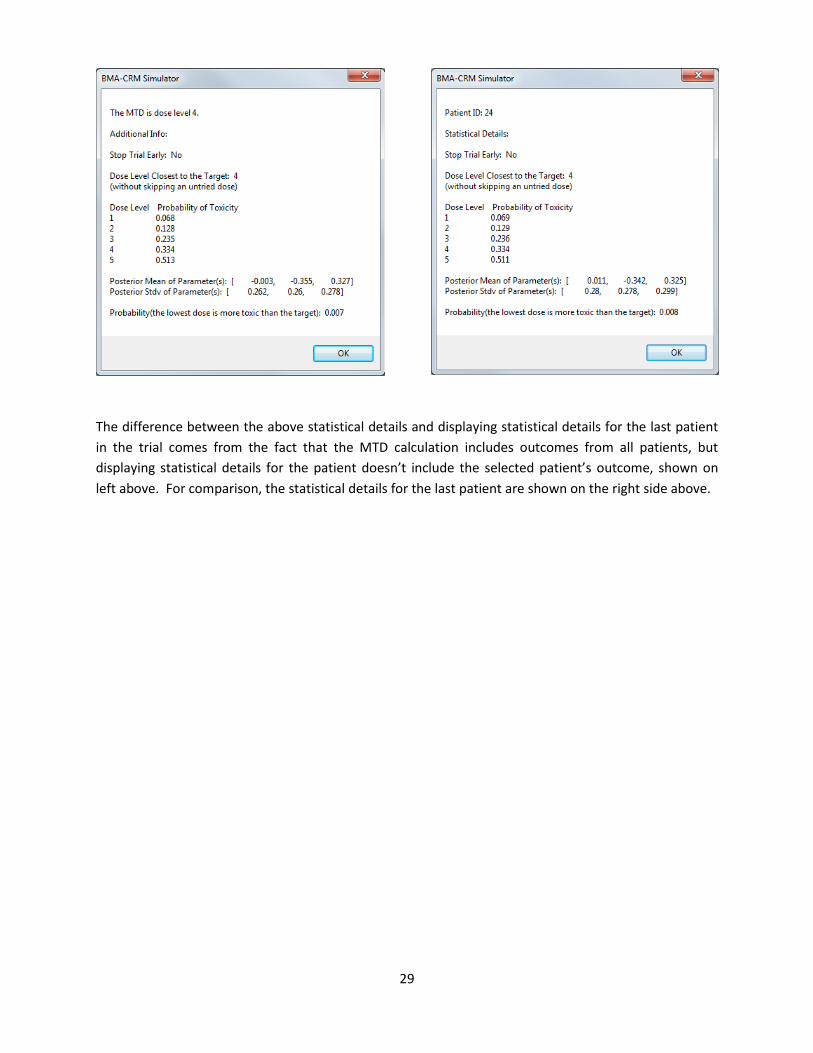
5.5 A Trial-Completed Trial Conduct tab and MTD Reporting
When the maximum number of patients has been added, the text on the Add Patient button is changed
to View the MTD….
If there pending outcomes remain, then the following message will appear in the window.
Otherwise, the MTD is calculated and reported with statistical details.
29
The difference between the above statistical details and displaying statistical details for the last patient
in the trial comes from the fact that the MTD calculation includes outcomes from all patients, but
displaying statistical details for the patient doesn’t include the selected patient’s outcome, shown on
left above. For comparison, the statistical details for the last patient are shown on the right side above.
30
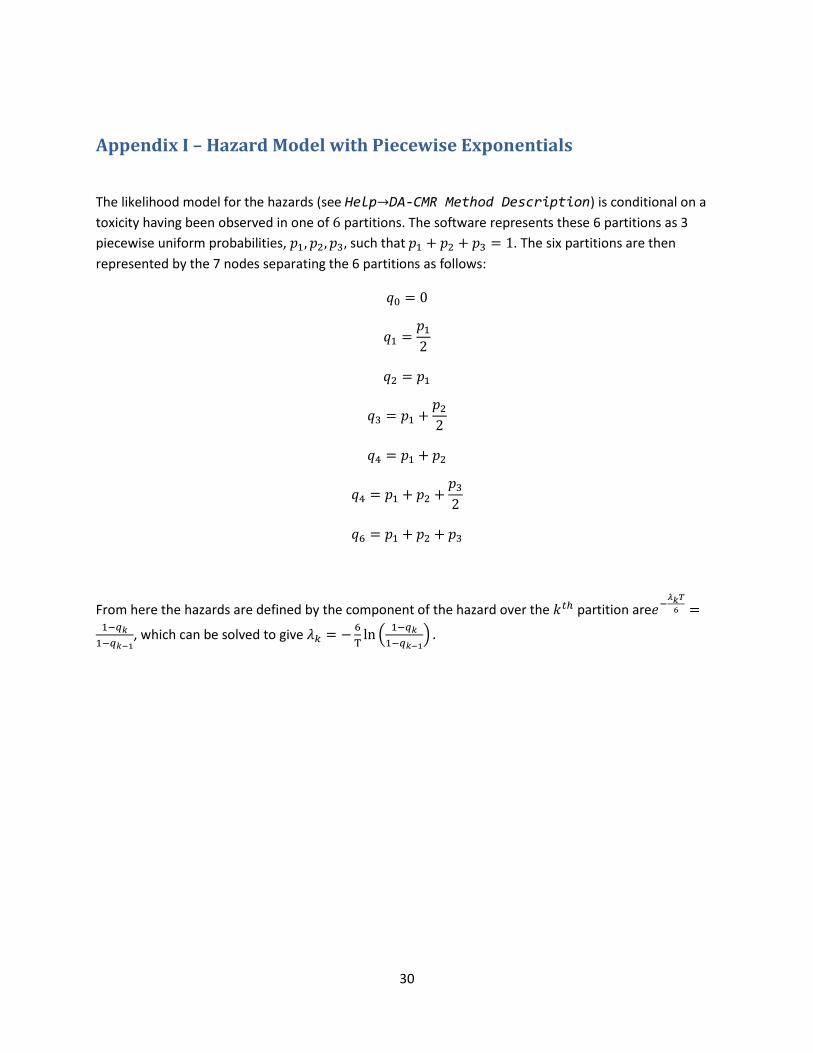
Appendix I – Hazard Model with Piecewise Exponentials
The likelihood model for the hazards (see Help→DA-CMR Method Description) is conditional on a
toxicity having been observed in one of 6 partitions. The software represents these 6 partitions as 3
piecewise uniform probabilities, 𝑝1, 𝑝2, 𝑝3, such that 𝑝1 + 𝑝2 + 𝑝3 = 1. The six partitions are then
represented by the 7 nodes separating the 6 partitions as follows:
𝑞0 = 0
𝑞1 =𝑝12
𝑞2 = 𝑝1
𝑞3 = 𝑝1 +𝑝22
𝑞4 = 𝑝1 + 𝑝2
𝑞4 = 𝑝1 + 𝑝2 +𝑝32
𝑞6 = 𝑝1 + 𝑝2 + 𝑝3
From here the hazards are defined by the component of the hazard over the 𝑘𝑡ℎ partition are𝑒−𝜆𝑘𝑇
6 =1−𝑞𝑘
1−𝑞𝑘−1, which can be solved to give 𝜆𝑘 = −
6
Tln (
1−𝑞𝑘
1−𝑞𝑘−1) .