Embed Size (px)
Citation preview

7 October 2015 The Manager, Listings Australian Securities Exchange ASX Market Announcements Exchange Centre 20 Bridge Street Sydney NSW 2000
Dear Sir We attach copies of slides on Boral's operations which are to be presented to members of the investment community in the UK on 7 October 2015. We note that the presentation material is based upon information previously released to the market, with minor updates only.
Yours faithfully
Dominic Millgate Company Secretary
Boral Limited Level 3, 40 Mount Street North Sydney NSW 2060 PO Box 1228 North Sydney NSW 2059
T: +61 (02) 9220 6300 F: +61 (02) 9233 6605
www.boral.com.au
Boral Limited ABN 13 008 421 761
For
per
sona
l use
onl
y
Boral Limited Presentation for UK Investor Roadshow, October 2015
This is a selection of slides released as part of Boral’s FY2015 results announcement and investor days through 2015
For
per
sona
l use
onl
y

About Boral
For
per
sona
l use
onl
y

61 10
12
17
1. Includes USG Boral joint venture operations. As at 30 June 2015
2. Gypsum revenue represents Boral’s 50% share of underlying revenue from the
USG Boral JV, which is not included in Group reported revenue
3. Roads, highways, subdivisions and bridges
4. Comprised of ~14% from detached housing, ~7% from multi-dwellings and
~9% from alterations and additions
• Boral is an international building
and construction materials group
with operations in Australia, the
USA and Asia
• S&P/ASX 100 company
• Operations across 13 countries1
• ~12,000 employees1
Boral overview
by division, %
by end-market, %
Construction
Materials & Cement
Gypsum
USA
Building Products
FY2015 external revenue2
22
4
30 15
8
12
3 6 Australian RHS&B3
USA non-dwellings
& engineering
USA dwellings
Australian
non-dwellings
Other
Asia
Australian dwellings4
Other Australian
engineering
3
For
per
sona
l use
onl
y

Boral’s Fix, Execute, Transform program
FIX EXECUTE TRANSFORM
2 years 4 years
6 years +
Fixing things that are
holding us back
Improving the way we
operate to be more
efficient, disciplined and
profitable
Transforming Boral for
performance excellence
and sustainable growth
through innovation
Our goal is to transform Boral into a global building and construction
materials company that is known for its world-leading safety
performance, innovative product platform and superior returns
on shareholders’ funds.
4
For
per
sona
l use
onl
y

Construction Materials & Cement
and Boral Building Products
39
24
25
12 NSW /
ACT
QLD
WA / NT
VIC / TAS / SA
SHARE OF REVENUE1, %
1. Based on FY2015 split of revenue across Construction Materials & Cement and Boral Building Products
2. Includes masonry revenues
3. Includes cement manufacturing plant, bagging plant and lime plant in NSW, a clinker grinding plant in Vic
and a clinker grinding JV in Qld
OPERATING FOOTPRINT
(total number of operations)
Quarries
Concrete
Asphalt
Cement3
4
3
14
43
7
92
228
9
Bricks4
Roof tiles
Timber5
Masonry
QLD
NSW/
ACT
VIC/TAS
1
2
20
1
61
17
2
7 30
4
93
13 9
1
3 17
2
50
8
SA
1
11
1
10
2
WA
1
12 1
13
3
NT 2
1
1
5
by state
Concrete
placing
Cement 39
12 20
8
3
10
4 4
Concrete
Quarries Asphalt
Bricks &
Roofing2
Other Timber by business
4. Includes all Boral CSR JV plants on the East Coast
5. Includes 8 Boral Hardwood mills and 1 JV Softwood
operation
For
per
sona
l use
onl
y
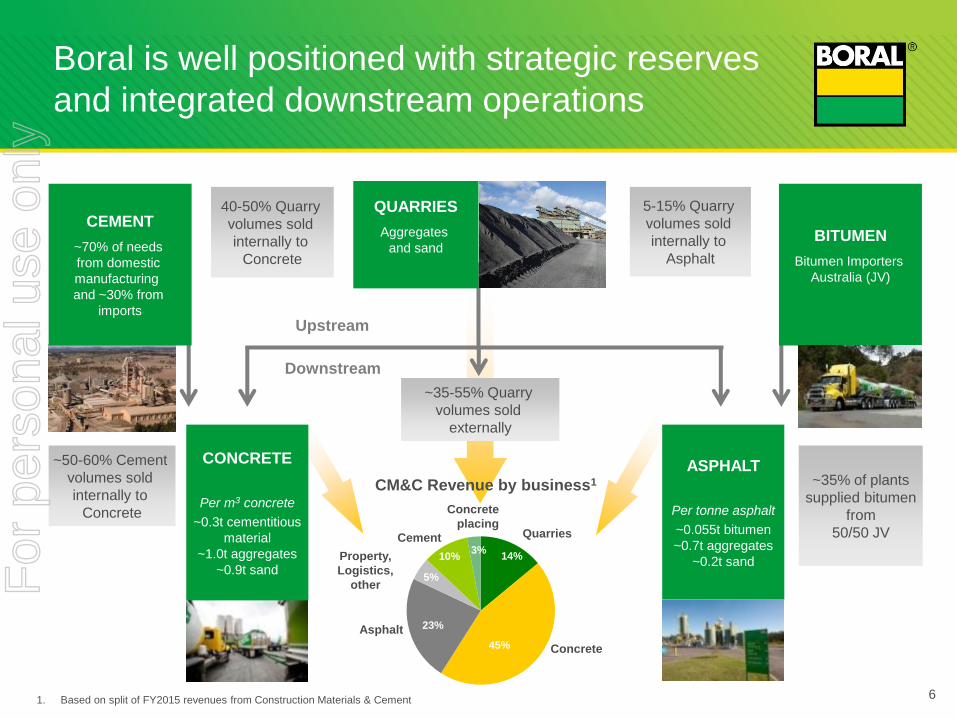
Boral is well positioned with strategic reserves
and integrated downstream operations
6
QUARRIES
Aggregates
and sand
BITUMEN
Bitumen Importers
Australia (JV)
Upstream
Downstream
CEMENT
~70% of needs
from domestic
manufacturing
and ~30% from
imports
5-15% Quarry
volumes sold
internally to
Asphalt
40-50% Quarry
volumes sold
internally to
Concrete
~50-60% Cement
volumes sold
internally to
Concrete
~35% of plants
supplied bitumen
from
50/50 JV
~35-55% Quarry
volumes sold
externally
CONCRETE
Per m3 concrete
~0.3t cementitious
material
~1.0t aggregates
~0.9t sand
ASPHALT
Per tonne asphalt
~0.055t bitumen
~0.7t aggregates
~0.2t sand 14%
45%
23%
5%
10% 3%
Asphalt
Concrete
Cement
Property,
Logistics,
other
Quarries
Concrete
placing
CM&C Revenue by business1
1. Based on split of FY2015 revenues from Construction Materials & Cement
For
per
sona
l use
onl
y

-
2.5
5.0
7.5
10.0
198
9
199
1
199
3
199
5
199
7
199
9
200
1
200
3
200
5
200
7
200
9
201
1
201
3
201
5
201
7
201
9
-
20,000
40,000
60,000
80,000
100,000
198
9
199
1
199
3
199
5
199
7
199
9
200
1
200
3
200
5
200
7
200
9
201
1
201
3
201
5
201
7
201
9
-
20,000
40,000
60,000
80,000
100,000
120,000
140,000
198
9
199
1
199
3
199
5
199
7
199
9
200
1
200
3
200
5
200
7
200
9
201
1
201
3
201
5
201
7
201
9
Boral’s Australian revenues are derived from
a number of segments
Boral’s Australian
Revenue
by end-market1
17%
9%
11%
19%
31%
5%
8%
RHS&B2
Multi-
dwellings
Other
engineering
Non-
residential
Other Detached
dwellings
Alterations
& additions
1. Based on split of FY2015 revenues from Construction Materials & Cement and Building Products
2. Source: BIS Shrapnel
Note all charts are for financial years and have been based on 2012/13 dollars
-
10.0
20.0
30.0
40.0
198
9
199
1
199
3
199
5
199
7
199
9
200
1
200
3
200
5
200
7
200
9
201
1
201
3
201
5
201
7
201
9
Non-residential4, VWD A$ billions
-
5.0
10.0
15.0
20.0
25.0
198
9
199
1
199
3
199
5
199
7
199
9
200
1
200
3
200
5
200
7
200
9
201
1
201
3
201
5
201
7
201
9
RHS&B3,4, VWD A$ billions
-
20.0
40.0
60.0
80.0
100.0
120.0
198
9
199
1
199
3
199
5
199
7
199
9
200
1
200
3
200
5
200
7
200
9
201
1
201
3
201
5
201
7
201
9
Other engineering2, VWD A$ billions
Alterations & additions4, VWD A$ billions
Multi-dwellings5, # starts
Detached dwellings5, # starts
3. Roads, highways, subdivisions and bridges
4. Source: BIS Shrapnel and Macromonitor
5. Source: BIS Shrapnel, Macromonitor and HIA 7
For
per
sona
l use
onl
y

Boral’s largest segment in Australia is Roads,
Highways, Subdivisions & Bridges (RHS&B)
Note that the charts are for financial years and have been based on 2012/13 dollars. VWD = Value of Work Done. RHS&B = Roads, highways, subdivisions & bridges.
Source: Macromonitor
Roads, Highways,
Subdivisions & Bridges
Major Australian Road Projects, VWD A$b ( as at September 2015)
Major road projects
Other RHS&B
A significant lift in Major Road Projects
underpins forecast growth of ~25 - 30%
in RHS&B VWD, over the next 4 - 5 years
-
5.0
10.0
15.0
20.0
25.0
West Gate Distributor
and strategic roads
(Vic)
For
per
sona
l use
onl
y

• ~1% CAGR in concrete volumes forecast
from FY2014 to FY2019
• Growth in RHS&B activity and in non-
residential activity to offset decline in
resources sector engineering work and
softening in dwellings
• NSW to maintain high levels of activity
• Infrastructure investment in Victoria over
time
• Queensland, WA and SA broadly steady
Concrete demand in Australia A proxy for construction materials volumes
Macromonitor Forecast Concrete Demand
across all Australian construction markets, million m3
0
5
10
15
20
25
30
2014 2015 2016 2017 2018 2019
QLD / NT
NSW / ACT
VIC / TAS / SA
WA
Industry concrete demand in Australia is forecast to stay at high levels
of demand for the next five years
Source: Macromonitor, Construction Materials Forecast, February 2015 (Queensland updated April 2015) 9
For
per
sona
l use
onl
y
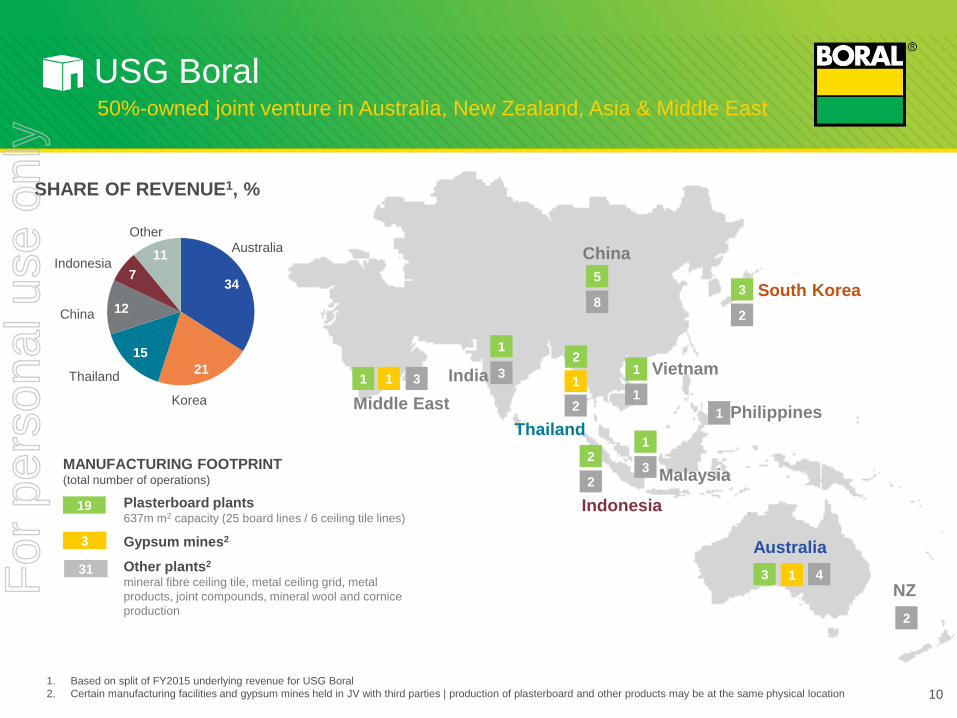
USG Boral
SHARE OF REVENUE1, %
34
21
15
12
7
11 Australia
Thailand
Other
Korea
China
Indonesia
50%-owned joint venture in Australia, New Zealand, Asia & Middle East
Indonesia
South Korea
Malaysia
Australia
Middle East
China
NZ
Philippines
India Vietnam
Thailand
1 1 3
5
8 3
2
1
3
1
3 4 1
2
1
1
3
2
2
1
2
2
1
10
MANUFACTURING FOOTPRINT (total number of operations)
Plasterboard plants 637m m2 capacity (25 board lines / 6 ceiling tile lines)
Gypsum mines2
Other plants2 mineral fibre ceiling tile, metal ceiling grid, metal
products, joint compounds, mineral wool and cornice
production
19
3
31
1. Based on split of FY2015 underlying revenue for USG Boral
2. Certain manufacturing facilities and gypsum mines held in JV with third parties | production of plasterboard and other products may be at the same physical location
For
per
sona
l use
onl
y

Operations in high growth countries as well as
new products will underpin USG Boral’s growth
South Korea
Australia
NZ
Philippines
Vietnam
1. Based on split of FY2015 underlying revenue for USG Boral
2. Certain manufacturing facilities and gypsum mines held in JV with third parties | production of plasterboard and other products may be at the same physical location
3. GDP growth is real GDP growth rate 2014 | Population figures as at December 2014 | Population growth based on 2014 estimates |
Urban population as a percentage of total population for 2014 | Rate of urbanisation based on annual rate of change between 2010 and 2015E
Source: CIA World Factbook
1 1 3
5
8 3
2
1
3
1
3 4 1
2
1
1
3
2
2
1
2
2
1
GDP growth 7.4%
Population 1.4 bn
Population growth 0.4%
Urban population 54.4%
Rate of urbanisation 3.1% GDP growth 5.6%
Population 1.2 bn
Population growth 1.3%
Urban population 32.4%
Rate of urbanisation 2.4%
GDP growth 5.9%
Population 30.1 m
Population growth 1.5%
Urban population 74.0%
Rate of urbanisation 2.7%
GDP growth 5.2%
Population 253.6 m
Population growth 1.0%
Urban population 53.0%
Rate of urbanisation 2.7%
GDP growth 1.0%
Population 67.7 m
Population growth 0.4%
Urban population 49.2%
Rate of urbanisation 3.0%
Middle East
Malaysia
Indonesia
Thailand
China
India
11
SHARE OF REVENUE1, %
34
21
15
12
7
11 Australia
Thailand
Other
Korea
China
Indonesia
MANUFACTURING FOOTPRINT (total number of operations)
Plasterboard plants 637m m2 capacity (25 board lines / 6 ceiling tile lines)
Gypsum mines2
Other plants2 mineral fibre ceiling tile, metal ceiling grid, metal
products, joint compounds, mineral wool and cornice
production
19
3
31 For
per
sona
l use
onl
y

58
6
10
14
7 5
Single-
family
dwellings
Multi-family
dwellings
Repair &
remodel
Non-
residential
RHS&B3 Other
54
23
23
Boral USA
1 5
2
1
3
1
1
3 3
1 1
2
1 7
2 2
5
4 4 5
4
1
1
1 1
4
1
1
10
1
4
6
9
6 1
2
1
5
1
SOUTH
WEST
NORTH-
EAST MIDWEST
SHARE OF REVENUE1 , %
1. Based on split of FY2015 revenue for Boral USA
2. Includes Bricks, Cultured Stone and Trim revenues
3. Roads, highways, subdivisions and bridges 12
Cladding2
Fly Ash &
Construction
Materials
Roofing
by business
OPERATING FOOTPRINT4
(total number of operations)
2
12
12 Bricks
Roof tiles
Cultured Stone
Building Products
Distribution Centres 42
Composites
Concrete and quarries
Fly ash
1
30
10
by end market
4. SOUTH consists of AL, AR, DE, FL, GA, KY, LA, MD, MS, NC, OK, SC, TN, TX, WV, VA | NORTHEAST
consists of CT, MA, ME, NH, NJ, NY, PA, RI, VT | MIDWEST consists of IA, IL, IN, KS, MI, MN, MO, ND, NE,
OH, SD, WI | WEST consists of AK, AZ, CA, CO, HI, ID, MT, NM, NV, OR, UT, WA, WY. States italicised in
green are the states in which Boral operates and are included in Boral’s US Revenue chart.
For
per
sona
l use
onl
y

In the USA, new residential construction is
continuing to recover in all regions
1. Housing starts forecasts based on the average of Dodge, Wells Fargo, NAR, NAHB, Fannie Mae, Freddie Mac and MBA analysts between May & July 2015
2. SOUTH consists of AL, AR, DE, FL, GA, KY, LA, MD, MS, NC, OK, SC, TN, TX, WV, VA | NORTHEAST consists of CT, MA, ME, NH, NJ, NY, PA, RI, VT | MIDWEST consists of
IA, IL, IN, KS, MI, MN, MO, ND, NE, OH, SD, WI | WEST consists of AK, AZ, CA, CO, HI, ID, MT, NM, NV, OR, UT, WA, WY. States italicised in green are the states in which Boral
operates and are included in Boral’s US Revenue chart, which is based on FY2015 split of revenue with ‘Other’ including other states and sales outside of the USA
0
200
400
600
800
1,000
1,200
198
9
199
1
199
3
199
5
199
7
199
9
200
1
200
3
200
5
200
7
200
9
201
1
201
3
201
5
201
7
201
9
0
100
200
300
400
500
600
198
9
199
1
199
3
199
5
199
7
199
9
200
1
200
3
200
5
200
7
200
9
201
1
201
3
201
5
201
7
201
9
0
50
100
150
200
250
198
9
199
1
199
3
199
5
199
7
199
9
200
1
200
3
200
5
200
7
200
9
201
1
201
3
201
5
201
7
201
9
0
100
200
300
400
198
9
199
1
199
3
199
5
199
7
199
9
200
1
200
3
200
5
200
7
200
9
201
1
201
3
201
5
201
7
201
9
WEST2 Region Housing Starts SOUTH2 Region Housing Starts
NORTHEAST2 Region Housing Starts MIDWEST2 Region Housing Starts
Forecasters1 currently expect an average of ~1.2m US housing starts in FY2016 and
~1.8m by FY2019, with all regions forecast to recover strongly
FY
F
Y
FY
FY
TOTAL USA Housing Starts
FY
million
‘000
‘000 ‘000
‘000
0.0
0.5
1.0
1.5
2.0
2.5
198
9
199
1
199
3
199
5
199
7
199
9
200
1
200
3
200
5
200
7
200
9
201
1
201
3
201
5
201
7
201
9
56 30
6 6 2
West
North East
Midwest
South
SHARE OF BORAL’S
US REVENUE2, %
Other
13
For
per
sona
l use
onl
y

18.2
14.2
11.9
10.1
6.5 6.6 7.6
4.1 4.7
7.2 8.2
FY
04
FY
05
FY
06
FY
07
FY
08
FY
09
FY
10
FY
11
FY
12
FY
13
FY
14
FY
15
EBIT to funds employed (ROFE1)
%
Focus on improving ROFE in the long term Driven by improved USA, Building Products and Property earnings,
and portfolio restructuring
1. Excludes significant items, calculated on funds employed as at 30 June
Focused on ongoing disciplined management of COSTS, CASH and CAPITAL
14
15.9
For
per
sona
l use
onl
y
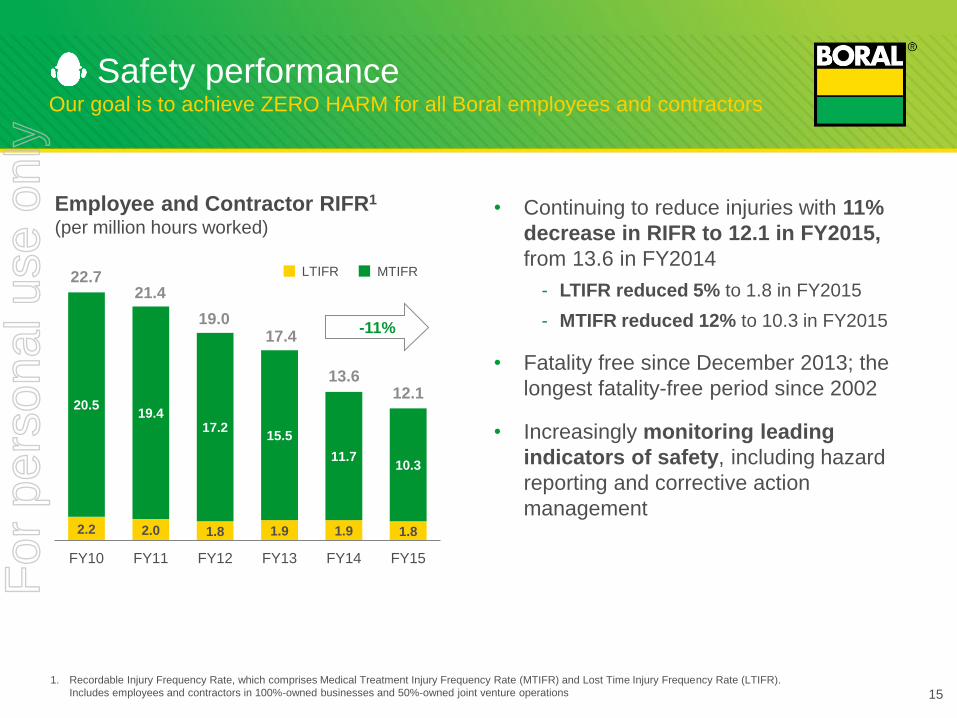
2.2 2.0 1.8 1.9 1.9 1.8
20.5 19.4
17.2 15.5
11.7 10.3
FY10 FY11 FY12 FY13 FY14 FY15
Safety performance Our goal is to achieve ZERO HARM for all Boral employees and contractors
• Continuing to reduce injuries with 11%
decrease in RIFR to 12.1 in FY2015,
from 13.6 in FY2014
- LTIFR reduced 5% to 1.8 in FY2015
- MTIFR reduced 12% to 10.3 in FY2015
• Fatality free since December 2013; the
longest fatality-free period since 2002
• Increasingly monitoring leading
indicators of safety, including hazard
reporting and corrective action
management
1. Recordable Injury Frequency Rate, which comprises Medical Treatment Injury Frequency Rate (MTIFR) and Lost Time Injury Frequency Rate (LTIFR).
Includes employees and contractors in 100%-owned businesses and 50%-owned joint venture operations
Employee and Contractor RIFR1 (per million hours worked)
-11%
15
LTIFR MTIFR 22.7 21.4
19.0 17.4
13.6 12.1
For
per
sona
l use
onl
y

FY2015 Results
For
per
sona
l use
onl
y

Profit after tax1
$249m 45%
Revenue
Reported Continuing operations
$4.4b 15% $4.3b
FY2015 result highlights Boral delivers significant profit improvements
1. Excluding significant items
2. Return on funds employed as at 30 June 2015
EBIT1
$357m 21%
Gearing, Net D/(Net D+E)
19% up from 18%
Earnings per share1
31.9cents 45%
Full year dividend
18.0cents 20%
Net profit after tax
$257m 48%
ROFE1,2
8.2% from 7.2%
17
For
per
sona
l use
onl
y

294
357
38 22
45
(14)
(28)
Construction Materials
& Cement
Boral
USA
Building
Products FY2014
EBIT1
FY2015
EBIT1
Strong earnings performance Boral USA, Building Products and Property sales drive earnings strength
EBIT1 variance
FY2015 vs FY2014
(A$m)
Boral
Gypsum2
Property Operating
1. Excluding significant items
2. Boral Gypsum FY2015 EBIT represents Boral’s 50% post-tax equity accounted income from USG Boral; FY2014 EBIT represents 8 months of 100% consolidated
earnings and 4 months of 50% post-tax equity accounted income from USG Boral. Underlying USG Boral EBIT of $141m in FY2015 is up 38% on FY2014.
(Figures may not add due to rounding) 18
For
per
sona
l use
onl
y

Mixed movements in market activity Housing markets stronger with modest decline in Australian roads
and continued slowdown in engineering construction
1. RHS&B refers to roads, highways, subdivisions and bridges. RHS&B value of work done (VWD) is forecast to decrease by 2% in FY2015f, based on an average of BIS and Macromonitor forecasts. Other engineering VWD is forecast to decline based on BIS forecasts
2. VWD from ABS in 2012/13 constant prices. Average of BIS and Macromonitor forecast used for Jun-15 quarter 3. ABS original data. HIA forecast used for Jun-15 quarter 4. Based on various indicators of building and construction activity in key markets in Boral‘s respective countries of operation. For China this is defined as the high-end market in
regions in which USG Boral operates 5. US Census Bureau seasonally adjusted data 6. Data from McGraw Hill / Dodge. Boral Brick States include: Alabama, Arkansas, Georgia, Kentucky, Louisiana, Mississippi, North Carolina, Oklahoma, South Carolina,
Tennessee, Texas. Boral Tile States include: Arizona, California, Florida, Nevada 7. McGraw Hill / Dodge value of work completed. Forecast used for Jun-15 quarter
FY2015f vs FY2014
USA
Total housing starts5 10%
Single-family housing starts
– Total USA6 8%
– Boral Brick States6 8%
– Boral Tile States6 9%
Non-residential7 11%
Asia4
Korea
Thailand
China
Indonesia
Australia
RHS&B (VWD)1 2%
Other engineering (VWD)1 15%
Non-residential (VWD)2 1%
Total housing starts3 19%
– Detached housing starts3 9%
– Multi-residential starts3 32%
Alterations & additions (VWD)2 1%
19
For
per
sona
l use
onl
y

FY14 FY15
FY14 FY15
2.0
9.0
Construction Materials & Cement
Strong earnings improvement
• Improved housing activity in
NSW, Qld, Vic and WA
• Pricing improvements across all
products and markets
• Improved operational
performance and production
volume leverage
Breaks through to profitability
• Leveraged to continuing housing
market recovery
• Volume and price gains across
most businesses
• Significant cost savings
through restructuring and SG&A
reductions
Volume and price growth
• Strong earnings results from
Australia, Korea, Thailand and
Indonesia
• Successful launch of Sheetrock®
Brand products
• Cost reduction program delivered
significant benefits
ROFE1 % Solid returns with further gains
• Strong NSW market and
increased residential activity
• Focus on improvements and cost
reduction
• Realignment of businesses to
cyclical demand
• Larger contribution from Property
earnings in FY2015
Boral Gypsum2
Building Products
Boral USA
ROFE1,2 %
ROFE1 %
ROFE1 %
1. EBIT return on 30 June divisional funds employed (segment assets less segment liabilities). EBIT excludes significant items
2. Based on USG Boral’s underlying EBIT return on funds employed at 30 June
ROFE improvement across all divisions All divisions reported positive ROFE for FY2015
(5.8)
0.7
FY14 FY15
12.7 14.5
FY14 FY15
6.1 7.4
20
For
per
sona
l use
onl
y

EBIT
$301m 9%
21
Construction Materials & Cement Maintaining profitability despite lower major road, infrastructure
and engineering activity
Revenue
$3.1b 6%
• Higher earnings from Property, Asphalt,
Cement and Concrete Placing, offset by
lower earnings in Concrete and Quarries
• Concrete volumes up 3% on stronger housing
construction activity; like-for-like prices flat
• Quarries volumes down 2%, especially in
SEQ and from reduction in regional
infrastructure projects; aggregates like-for-like
prices down 2%
• Asphalt impacted by continued weakness in
RHS&B activity, but strong margin growth
delivered despite lower volumes
• Cement earnings remained strong despite
revenue decline from changed wholesale
supply agreements
• Property contributed $46m to EBIT, up from
$8m in FY2014
277 301
1. Excluding significant items
2. Other includes Asphalt and DMG contracting margins
FY14
EBIT1
Vo
lum
e
Price
Oth
er2
Pro
pe
rty
FY15
EBIT1
Co
st
escala
tion
Co
st
redu
ction
EBIT variance A$m
A$m FY2015 FY2014 Var, %
Revenue 3,091 3,287 (6)
EBITDA1 485 445 9
EBIT1 301 277 9
EBIT ROS1, % 9.8 8.4
Net Assets 2,086 2,172
ROFE1, % 14.5 12.7
For
per
sona
l use
onl
y

• Revenue broadly steady, reflecting:
- Price gains and stronger housing activity,
offset by
- Absence of 2 months of East Coast Bricks
revenue following formation of Boral CSR
bricks JV on 1 May 2015
• $22m EBIT improvement reflects improved
pricing, production volume leverage, and
improved operational performance and costs
• Bricks volumes up 5% in line with strength in
housing construction activity; average selling
prices up 3%
• Roofing volume and price growth modest,
driven by Victoria and SA
• Timber revenue down 3%; growth in
Softwood partially offsetting decline in
Hardwood
Building Products Increased housing activity and cost savings support improved
profitability across all products
1. Excluding significant items
2. Includes 10 months of 100% consolidated earnings from East Coast Bricks and
2 months of 40% post-tax equity accounted income from Boral CSR Bricks JV
FY14
EBIT1
Vo
lum
e
Price
Oth
er FY15
EBIT1,2
Co
st
escala
tion
Co
st
redu
ction
Revenue
$485m
EBIT
$30m from $8m
EBIT variance A$m
A$m FY20152 FY2014 Var, %
Revenue 485 487 –
EBITDA1 50 29 70
EBIT1 30 8 260
EBIT ROS1, % 6.1 1.7
Net Assets 328 409
ROFE1, % 9.0 2.0
8
30
22
For
per
sona
l use
onl
y

Boral Gypsum (50%-owned USG Boral JV)
Strong price discipline, larger product range and market activity
drive significant growth
Underlying Revenue Underlying EBIT
$1.3b 16% $141m 38%
• Margin expansion in all key regions driven
by increases in board volumes and price, and
increase in non-board product sales
• US$24m in cost savings from restructuring
and improvement initiatives
• Successful launch of Sheetrock® in
Australia, Korea, Thailand, Indonesia and
China attracting price premium above 5%
• Strong revenue growth in Australia and Asia
– Australia: driven by increased housing market
activity, particularly NSW and Victoria
– Asia: reflects strong price gains and
significant growth in non-board sales
• Roll-out of Sheetrock® technology on track
to remain within 2-year capex of US$50m
1. Gypsum consolidated results for period Jul-13 to Feb-14; post tax equity
accounted income for period Mar-14 to Jun-15
2. Excluding significant items
3. Includes foreign exchange impact and share of JV partners’ profits/losses
A$m FY2015 FY2014 Var, %
Reported Gypsum result1
EBIT1,2 – 67
Equity income1,2 49 10
Underlying Gypsum result
Revenue 1,268 1,091 16
EBITDA2 201 148 36
EBIT2 141 102 38
EBIT ROS2, % 11.1 9.3
Net Assets 1,901 1,665
ROFE2, % 7.4 6.1
102
141
FY14
EBIT2
Vo
lum
e
Price
Oth
er3
FY15
EBIT2
Co
st
escala
tion
Co
st
redu
ction
Underlying EBIT variance A$m
23
For
per
sona
l use
onl
y
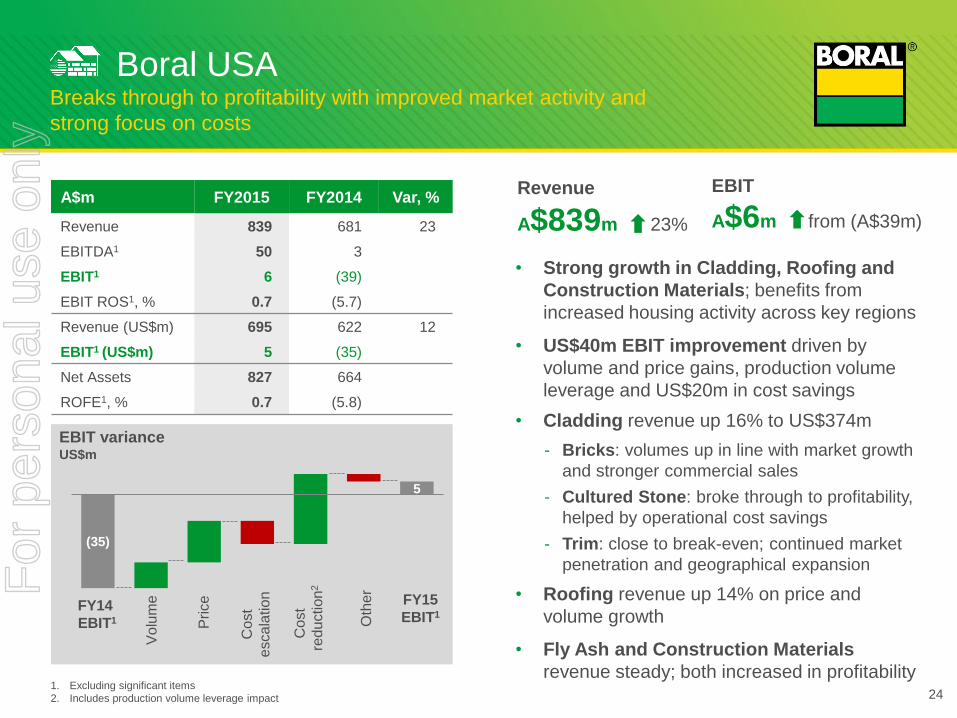
• Strong growth in Cladding, Roofing and
Construction Materials; benefits from
increased housing activity across key regions
• US$40m EBIT improvement driven by
volume and price gains, production volume
leverage and US$20m in cost savings
• Cladding revenue up 16% to US$374m
- Bricks: volumes up in line with market growth
and stronger commercial sales
- Cultured Stone: broke through to profitability,
helped by operational cost savings
- Trim: close to break-even; continued market
penetration and geographical expansion
• Roofing revenue up 14% on price and
volume growth
• Fly Ash and Construction Materials
revenue steady; both increased in profitability
Boral USA Breaks through to profitability with improved market activity and
strong focus on costs
1. Excluding significant items
2. Includes production volume leverage impact
Revenue
A$839m 23%
EBIT
A$6m from (A$39m)
A$m FY2015 FY2014 Var, %
Revenue 839 681 23
EBITDA1 50 3
EBIT1 6 (39)
EBIT ROS1, % 0.7 (5.7)
Revenue (US$m) 695 622 12
EBIT1 (US$m) 5 (35)
Net Assets 827 664
ROFE1, % 0.7 (5.8)
(35)
5
EBIT variance US$m
FY14
EBIT1
Vo
lum
e
Price
Oth
er
FY15
EBIT1
Co
st
escala
tion
Co
st
redu
ction
2
24
For
per
sona
l use
onl
y

Non-IFRS information – Earnings before significant items is a non-IFRS measure that is reported to provide a greater understanding of the financial performance of the
underlying businesses. Further details of non-IFRS information is included on slide 43 while details of significant items are provided in Note 4 of the Financial Statements
within the Boral Annual Report 2015. Non-IFRS information has not been subject to audit or review.
Group financial performance Stronger housing markets, improved operational performance
and Property earnings drive profitability
1. Excluding significant items
(Figures may not add due to rounding)
A$m FY2015 FY2014 Var %
Revenue 4,415 5,204 (15)
EBITDA1 605 556 9
Depreciation and amortisation (249) (261)
EBIT1 357 294 21
Net interest1 (64) (83)
Tax1 (44) (37)
Non-controlling interests - (3)
Profit after tax1 249 171 45
Significant items (net) 8 2
Net profit after tax 257 173 48
Effective tax rate 15% 17%
25
For
per
sona
l use
onl
y

Significant items Gains from sale of Western Landfill offset by impairments
and further business restructuring
Non-IFRS Information – Management has provided an analysis of significant items reported during the period. These items have been considered in relation to their size and
nature and have been adjusted from the reported information to assist users to better understand the performance of the underlying businesses. These items are detailed in Note 4
of the Financial Statements within the Boral Annual Report 2015 and relate to amounts that are associated with significant business restructuring, business disposals, impairment
or individual transactions.
(Figures may not add due to rounding)
Notes:
1. In February 2015 Boral sold its Western Landfill
business for net cash proceeds of $139m and
generated profit before tax of $115m
2. Impairments resulting from ongoing review of
Building Products; namely $31m for West Coast
Bricks business, $30m for Roofing & Masonry, and
for Hardwood, a $9m asset impairment and $3m of
restructuring costs
3. Construction Materials asset portfolio review in
response to changing market conditions, resulting
in $13m of asset impairments and $18m of
restructuring costs
4. Restructuring and stamp duty costs following
formation of joint venture, and net loss on disposal
upon entry of East Coast Bricks business into joint
venture with CSR
5. Includes recovery of capital tax losses
A$m FY2015 Notes
Gain on disposal of Western Landfill 115 1
Impairment of Building Products businesses (73) 2
Construction Materials & Cement restructure (31) 3
Boral CSR Bricks joint venture costs (8) 4
Other (1)
Earnings before tax 2
Income tax benefit 6 5
Significant items (net) 8
26
For
per
sona
l use
onl
y

Cash flow Continuing to generate strong cash flows
1. Excluding significant items
2. Excludes cash disposed in FY2014 of $79m
3. DRP suspended following FY2014 interim dividend
4. On-market share buy-back program announced 18 March 2015 to buy
back up to 5% of issued share capital over 12 months
(Figures may not add due to rounding)
• Operating cash flow of $418m reflects:
− strong EBITDA despite absence of
consolidated Gypsum earnings, partially offset
by USG Boral JV dividends;
− lower interest payments;
− higher tax payments due to timing and a
higher instalment rate in FY2015; and
− FY2014 benefits of inventory reductions, cash
receipt from Forestry Corporation NSW,
receipt of insurance proceeds from Qld floods
not repeated in FY2015
• Total capex down 7% on FY2014
• $194m in proceeds on disposal of
assets and entities, including $139m
from sale of Western Landfill to TPI
• Free cash flow of $363m
• $129m paid out as dividends and $116m
used for share buy-back program
Cash flow, A$m FY2015 FY2014
EBITDA1 605 556
Change in working capital 37 91
Interest (63) (79)
Tax (46) 14
Equity earnings less dividends (34) (28)
Profit on sale of assets (41) (15)
Other non-cash items 4 3
Restructuring costs paid (44) (34)
Operating cash flow 418 507
Capital expenditure (250) (268)
Investments - (48)
Proceeds on disposal of assets 45 37
Proceeds on disposal of entities2 149 555
Free cash flow 363 782
Dividends paid – net DRP3 (129) (57)
Share buy-back4 (116) -
Other items - (4)
Cash flow 118 721 27
For
per
sona
l use
onl
y

235 192
126
203 211
111 222
183 65 39 245
273
307
261
249
FY11 FY12 FY13 FY14 FY15
Capital expenditure remains constrained Increasing proportion of stay in business capital spending
• SIB capex at 85% of depreciation, up from
78% in FY2014
• Growth capex remains constrained to
essential projects
- Preliminary works for quarry upgrades
- New Versetta Stone® line at Napa, CA
- Various projects by Boral Composites in the USA
Total capital expenditure A$m
FY2015 capital expenditure
%
Construction Materials & Cement
Building Products
Corporate
Boral USA
Total = $250m
74
5
18
3
1. Stay in business capital expenditure
2. FY2013 restated to reflect adoption of AASB Interpretation 20 relating to the reclassification of stripping expenditure at quarry sites
SIB1 Growth Depreciation and amortisation
28
For
per
sona
l use
onl
y

0
200
400
600
800
1,000
FY16 FY17 FY18 FY19 FY20 FY21 FY22 FY23 andlater
Balance sheet Strong balance sheet and maintaining debt at lower levels
1. Net debt / (net debt + equity)
2. Gross debt / (gross debt + equity - intangibles)
3. Swiss franc notes issued under EMTN program
Gearing1, % • Net debt up to $817m from $718m due to
foreign exchange impact
• Principal debt gearing covenant2 at 29%; up
from 26% at 30 June 2014 (threshold is less
than 60%)
• Weighted average debt maturity ~4.5 years
• Net interest cover of 5.6 times, up from 3.5
times in FY2014
• Committed undrawn bank debt facility of
A$500m was replaced on 1 July 2015 with
US$400m undrawn facility CHF notes3
Debt maturity profile
A$m USPP notes Undrawn
syndicated facilities
Net debt reconciliation, A$m FY2015
Opening balance (718)
Cash flow 118
Non cash (FX) (217)
Closing balance (817)
29
31
14
31 30
18 19
FY10 FY11 FY12 FY13 FY14 FY15
(Figures may not add due to rounding)
Replaced on 1 July
2015 with US$400m
undrawn facility
For
per
sona
l use
onl
y

Strategic Priorities & Outlook
For
per
sona
l use
onl
y

Product innovation
Gypsum technology roll-out
commenced
Lowering fixed cost exposures
through the cycle
Boral’s Fix, Execute, Transform program
Streamlined organisation
Portfolio realignment
$213m cumulative cost
reduction benefits1 in FY2015
$251m cash from divestments
& land sales in first 2 years
Net debt of $817m at historically
lower levels
Capital expenditure < $300m
2 years 4 years
6 years +
Fixing things that are
holding us back
Improving the way we
operate to be more
efficient, disciplined and
profitable
Transforming Boral for
performance excellence
and sustainable growth
through innovation
Sta
rted
FY
20
13
People engagement and
safety first
Levers of change – LEAN,
Sales & Marketing, Innovation
Responding to external
challenges
Capacity utilisation up
31
FIX EXECUTE TRANSFORM
1. From major corporate and divisional restructuring programs in FY2013-2015, including 50% share of USG Boral programs
For
per
sona
l use
onl
y

Boral Construction
Materials & Cement
Boral Building
Products Boral Gypsum Boral USA
Landfill: Divested
Western Landfill
business in Melbourne
Cement: Closed small
specialty cement kiln at
Maldon in Dec-14 and
transferred production
to Berrima
Quarries: Peppertree
Quarry commissioning
on time and on budget
Quarries: Ongoing
strategic investment in
quarry upgrades
East Coast Bricks:
Boral CSR Bricks JV
commenced in May-15
Timber: Strategic
review undertaken,
including review of
external opportunities
Timber: Structural
improvement program,
particularly for
Hardwood; capital
projects focusing on
safety and operational
improvements
Sheetrock® Brand
plasterboard
introduced into
Australia, Korea,
Indonesia, Thailand,
China and Vietnam
Introduced USG
adjacent products to
portfolio
On track for targeted
US$50m pa synergies
within three years of
technology roll-out
Completed restructure
of regional sales and
operations
Construction Materials:
Divested limestone
quarry in Oklahoma in
Jan-15
Bricks: Continuing to
assess options for the
US Bricks business
Reshaping the portfolio and
positioning to transform the business
32
For
per
sona
l use
onl
y

$150m of benefits from corporate-led programs
A$m
37
105 105
25 45
FY2013 FY2014 FY2015
130
• $20m of incremental cost reduction benefits in
FY2015 from contract management initiatives
• $150m of cumulative cost benefits in FY2015
- annualised benefits of $105m from major
restructuring and rationalisation in FY2013;
- annualised benefits of $45m from contractor
management program, commenced in FY2014
Contractor spend & other
Managing costs down $213m annualised cost benefits delivered in FY2015
Construction
Materials &
Cement
$11m of savings in FY2015 from
resizing of Asphalt organisation
(Vic & Qld) and support services;
further $11m of savings from
primarily support services &
administration redundancies; and
$2.5m of savings from
redundancies with closure of
speciality cement kiln at Maldon
Boral USA
US$20m of cost savings
through a reduction of 70
positions through restructuring
and consolidation of regional
sales and manufacturing teams
in Jun-14 and SG&A savings
~$63m of benefits to Boral from divisional
restructuring and improvement programs
37
130 150
Overhead & rationalisation
20
USG Boral
~US$24m of cost savings1
through a dedicated program in
USG Boral JV to offset higher
costs associated with the roll-out
of new technologies & products 1. Boral’s 50% share from USG Boral is included in the ~$63m of total divisional
benefits in FY2015 (Total calculated using AUD/USD exchange rate of 0.828) 33
For
per
sona
l use
onl
y

• Focused on maintaining FY2016 EBIT broadly in line with FY2015,
excluding Property. Property earnings contribution uncertain
• Restructuring and improvement initiatives and continued strength in
Sydney market needed to offset depressed Queensland market, subdued
RHS&B activity and further tapering off of LNG project volumes
• Pricing is challenging but committed to improving price and margin outcomes
• Expect further underlying performance improvements; Sheetrock® product
volumes should continue to grow
• Synergies to strengthen in FY2016 and expected to exceed cash costs
associated with expanded portfolio and technology roll-out
• Expected to maintain similar EBIT in FY2016 to FY2015 reported EBIT
• Improvement initiatives to offset housing activity coming off peak and
earnings impact of 40% post tax equity accounted share of Boral CSR Bricks
joint venture
Boral
Gypsum
Boral Building
Products
Boral
Construction
Materials &
Cement
Outlook for FY2016 (as announced at FY2015 results, 27 August 2015)
• Expect further increase in earnings in FY2016 on increased housing
activity; in line with projected increase to ~1.2m housing starts in FY20161
Boral
USA
34 1. Average of analysts from Dodge, Wells Fargo, NAR, NAHB, Fannie Mae, Freddie Mac and MBA between May and July 2015
For
per
sona
l use
onl
y

Supplementary slides
For
per
sona
l use
onl
y

FY2015 segment revenue and EBIT
External revenue A$m EBIT1 A$m
FY2015 FY2014 Var, % FY2015 FY2014 Var, %
Construction Materials
& Cement 3,091 3,287 (6) 301 277 9
Building Products 485 487 – 30 8 260
Boral Gypsum2 – 691 (100) 49 77 (37)
Boral USA 839 681 23 6 (39) 115
Unallocated – – – (29) (29) –
Discontinued businesses3 – 58 (100) – (1) (100)
TOTAL 4,415 5,204 (15) 357 294 21
1. Excluding significant items
2. Boral Gypsum FY2015 result represents Boral’s 50% post-tax equity accounted income from USG Boral; FY2014 EBIT represents 8 months of 100% consolidated
earnings and 4 months of 50% post-tax equity accounted income from USG Boral
3. Discontinued businesses in FY2014 included the Windows business, which was sold in November 2013
(Figures may not add due to rounding) 36
For
per
sona
l use
onl
y

Earnings and dividends per share Fully franked final dividend of 9.5 cents per share declared
Earnings and dividends per share1 Fully franked full-year dividend of
18.0 cents, up 20% on FY2014
− fully franked final dividend of 9.5 cents
Full-year dividend payout ratio of 56%,
compared to historical range of 50-80%
A$ cents
1. Earnings per share, excluding significant items
37
13.514.5
11.0 11.0
15.0
18.0
22.1
24.4
13.6 13.6
22.0
31.9
FY10 FY11 FY12 FY13 FY14 FY15
DPS EPS
For
per
sona
l use
onl
y

Debt facilities FY2015
A$m
FY2014 A$m
US PP1 1,105 913
CHF notes2 209 178
Other loans/ finance leases
9 10
Gross debt 1,323 1,101
Net debt 817 718
78%
22% USD
AUD
Gross debt currency exposure As at 30 June 2015
Total = A$1,323m
Debt profile Debt levels maintained at historically lower levels
1. US Private Placement notes
2. Swiss notes issued via EMTN program. Swapped to USD
38
For
per
sona
l use
onl
y

6.3 6.4
1.9 2.1
4.5 3.8
1.1 1.0
2.3 2.2
FY14FY15f FY14FY15f FY14FY15f FY14FY15f FY14FY15f
RHS&B activity forecast to decline Value of work done forecast to decrease in FY2015
RHS&B – by state FY2015f v FY2014 (value of work done, $b)
Roads, Highways, Subdivisions & Bridges1
(value of work done, $b)
-5%
+12%
+1%
-16%
NSW VIC QLD SA WA
-2%
18.5
19.9 19.2
16.7 16.4
15.1
17.7
FY11 FY12 FY13 FY14 FY15f 1H FY15 2H FY15f
-2%
1. RHS&B refers to roads, highways, subdivisions and bridges. Original series data from ABS. FY11 to FY15F figures are an average of BIS and Macromonitor data.
Six monthly data annualised and based on an average of BIS and Macromonitor forecasts 39
For
per
sona
l use
onl
y

Total housing starts1 (‘000)
Australian residential activity continues to grow Housing starts growth driven by Victoria, NSW and Queensland
1. Original series housing starts from ABS to Mar-15 quarter, HIA forecast to Jun-15 quarter. Six monthly data annualised
2. Original series (constant 2012/13 prices) from ABS. Average of BIS and Macromonitor forecast for Jun-15 quarter. Six monthly data annualised
Detached Other
Housing starts – by state1 FY2015f vs FY2014
Detached Other
Alterations & additions (A&A)2 (value of work, $b)
+1%
8.0 7.7
7.1 7.1 7.2 7.5
6.9
FY11 FY12 FY13 FY14 FY15f 1H FY152H FY15f
40
101 90 93 104 114 121 107
62 55 70
77 101 96 106
FY11 FY12 FY13 FY14 FY15f 1H FY15 2H FY15f
145 163 162
181
217
+19%
215 213
21 24 29 32
19 22
8 8
23 24
25
31 22
33
16 21
3 3
6 8
FY14FY15f FY14FY15f FY14FY15f FY14FY15f FY14FY15f
+21%
+9%
0%
56 51
65
36
43
11 11
29 32
46
NSW VIC QLD SA WA
+27%
+20%
For
per
sona
l use
onl
y

Australian non-residential activity forecast to
modestly decline Non-residential activity estimated to be down by 1%
1. Original series (constant 2012/13 prices) from ABS. Average of BIS and Macromonitor forecast for Jun-15 quarter. Six monthly data annualised
Non-residential – by state1 FY2015f v FY2014 (value of work done)
Non-residential1
(value of work done, $b)
37.0
34.7
33.4
35.2 35.0
36.6
33.3
FY11 FY12 FY13 FY14 FY15f 1H FY15 2H FY15f
-1%
9.4 10.0 8.8 9.3
7.1 6.4
2.3 2.1
5.4 5.2
FY14FY15F FY14FY15F FY14FY15F FY14FY15F FY14FY15F
NSW VIC QLD SA WA
-7%
+6% +6%
-9%
-4%
41
For
per
sona
l use
onl
y

63 76 108 116 126 112
140
FY11 FY12 FY13 FY14 FY15f 1H FY15 2H FY15f
175 197 237 255 276 260 292
FY11 FY12 FY13 FY14 FY15f 1H FY15 2H FY15f
570 687
872 954 1,052 1,042 1,061
FY11 FY12 FY13 FY14 FY15f 1H FY15 2H FY15f
US housing activity continues to grow Total housing starts remain below long-term average
US total housing starts1 (‘000)
US single-family housing starts Boral Brick States2 (‘000)
• US housing starts of 1,052k1 in FY2015, up
10% with single-family starts up 8%1
– Total starts remain 30% below long-term
average of 1.5m housing starts
• US single-family starts in Boral Brick States2
and Boral Tiles States2 up 8% and 9%
respectively
• US non-residential activity up 11%3
1. Seasonally adjusted annualised data from US Census. Six monthly data annualised
2. Data from McGraw Hill/ Dodge. Boral‘s Brick States include: Alabama, Arkansas, Georgia, Kentucky, Louisiana, Mississippi, North Carolina, Oklahoma, South Carolina,
Tennessee, Texas. Boral‘s Tile States include: Arizona, California, Florida, Nevada
3. McGraw Hill/ Dodge value of work completed. Forecast used for Jun-15 quarter
US single-family housing starts, Boral Tile States2 (‘000)
+10%
+8% +9%
42
For
per
sona
l use
onl
y

Non-IFRS information
(A$ millions)
Earnings
before
significant
items
Significant
Items Total
Continuing
Operations
Discontinued
Operations Total
Sales revenue 4,414.7 - 4,414.7 4,297.6 117.1 4,414.7
EBIT 356.7 1.9 358.6 352.2 6.4 358.6
Finance costs (63.7) - (63.7) (63.7) - (63.7)
Earnings before tax 293.0 1.9 294.9 288.5 6.4 294.9
Tax (expense) / benefit (43.8) 5.9 (37.9) (45.1) 7.2 (37.9)
Net profit after tax 249.2 7.8 257.0 243.4 13.6 257.0
Boral Limited’s statutory results are reported under International Financial Reporting Standards.
Earnings before significant items is a non-IFRS measure reported to provide a greater understanding of the underlying business
performance of the Group.
Significant items are detailed in Note 4 of the Financial Statements within the Boral Annual Report 2015 and relate to amounts of
income and expense that are associated with significant business restructuring, business disposals, impairment or individual
transactions.
A reconciliation of earnings before significant items to reported statutory profit is detailed below:
Boral Gypsum division commentary also includes a non-IFRS measure of underlying results excluding significant items,
representing the 12 months trading results to assist users to better understand the trading results of this division despite changes
in ownership during the year.
43
For
per
sona
l use
onl
y
Disclaimer
The material contained in this document is a presentation of information about the Group’s activities
current at the date of the presentation, 7 October 2015 unless otherwise stated. It is provided in
summary form and does not purport to be complete. It should be read in conjunction with the Group’s
periodic reporting and other announcements lodged with the Australian Securities Exchange (ASX).
To the extent that this document may contain forward-looking statements, such statements are not
guarantees or predictions of future performance, and involve known and unknown risks, uncertainties
and other factors, many of which are beyond our control, and which may cause actual results to differ
materially from those expressed in the statements contained in this release.
This document is not intended to be relied upon as advice to investors or potential investors and does
not take into account the investment objectives, financial situation or needs of any particular investor.
44
For
per
sona
l use
onl
y