Embed Size (px)
Citation preview
J. exp. Biol. (1981), 93, 101-118 IOI'ith 6 figures
mted in Great Britain
BRANCHIAL AND RENAL ACID ANDION FLUXES IN THE RAINBOW TROUT, SALMO
GAIRDNERI, AT LOW ENVIRONMENTAL pH
BY D. G. MCDONALD AND C. M. WOOD
Department of Biology, McMaster University, Hamilton, OntarioCanada L8S 4KI
(Received 22 September 1980)
SUMMARY
Rainbow trout were exposed for 4 days to an environmental pH averaging4-2, an exposure which resulted in a continuous net branchial influx of acid.The influx provoked a progressive depression in blood pH and [HCO3~],virtually complete by 48 h, and a marked increase in renal acid excretion,also complete by 48 h. The increase in the latter was sufficient to remove, atmaximum, about half of the protons entering at the gills; those remainingwere buffered in body fluids. The low pH exposure also impaired gill ionregulation as indicated by continuous net branchial losses of Na+, Cl~and K+ and by a progressive decline in plasma Na+ and Cl~ levels. Evidenceis presented which indicates that there was a significant contribution by theintracellular compartment both to the total body ion losses and to thebuffering of the body acid load.
INTRODUCTION
There is now an extensive literature on the interaction of low pH environments withthe physiology of freshwater fish (see Fromm, 1980, for a recent review). Effects onnormal blood physiology are particularly well known and disturbances to acid-basestate (Packer & Dunson, 1970; Neville, 1979 a; Packer, 1979; McDonald, H5be &Wood, 1980), ion levels (Mudge & Neff, 1971; Leivestad & Muniz, 1976; Neville,19796; McDonald et al. 1980) and oxygen transport (Vaala & Mitchell, 1970; Packer,1979) have now been reported. Less well understood are effects on the actual mecha-nisms of ionoregulation. Whole-body unidirectional Na+ fluxes have been examinedin acid environments (Packer & Dunson, 1970; McWilliams & Potts, 1978) but noattempt has been made to separate the branchial and renal components of thesefluxes nor has the regulation of other major body ions (e.g. Cl~ and K+) beenassessed. Also largely unknown are the effects of acid environments on the mechanismsof acid-base regulation. Such regulation has been largely thought to occur at the gillsvia Na+/proton and Cl~/basic anion exchange mechanisms (cf. Maetz, 1974) but therecent demonstration (Wood & Caldwell, 1978) of a considerable renal competencein the excretion of an injected acid load suggests that the kidney may also play animportant role. Thus in order to explore more fully these aspects of low pH exposure,
•; have undertaken a study of the effects of such exposure on branchial and renalnction in the rainbow trout.
102 D. G. MCDONALD AND C. M. WOOD
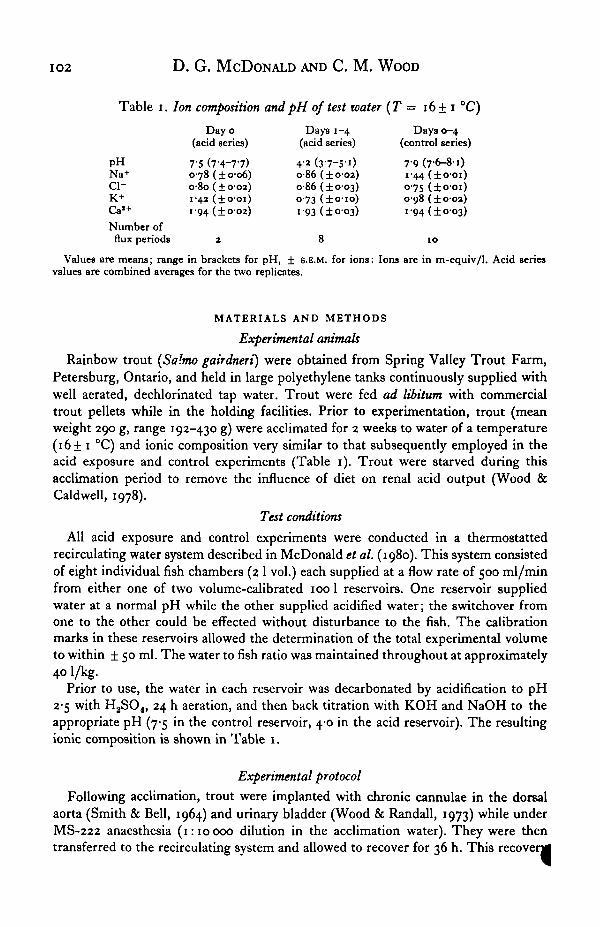
Table i. Ion composition andpH of test water (T = 16 + i °C)
Day o Days 1-4 Days 0-4(acid series) (acid series) (control series)
pH 75 (V4-77) 4* (37-5-I) 79 (7-6-8-1)Na+ 0-78(1006) 0-86(10-02) 1-44(1001)Cl~ 0-80(10-02) 0-86(10-03) 0-75(10-01)K+ 1-42(10-01) 0-73(1010) 0-98(10-02)
Cal+ 1-94(1002) i-93(±o°3) i-94(±o-O3)Number offlux periods 2 8 10
Values are means; range in brackets for pH, 1 S.E.M. for ions: Ions are in m-equiv/1. Acid seriesvalues are combined averages for the two replicates.
MATERIALS AND METHODS
Experimental animals
Rainbow trout (Salmo gairdneri) were obtained from Spring Valley Trout Farm,Petersburg, Ontario, and held in large polyethylene tanks continuously supplied withwell aerated, dechlorinated tap water. Trout were fed ad libitum with commercialtrout pellets while in the holding facilities. Prior to experimentation, trout (meanweight 290 g, range 192-430 g) were acclimated for 2 weeks to water of a temperature(16+ 1 °C) and ionic composition very similar to that subsequently employed in theacid exposure and control experiments (Table 1). Trout were starved during thisacclimation period to remove the influence of diet on renal acid output (Wood &Caldwell, 1978).
Test conditions
All acid exposure and control experiments were conducted in a thermostattedrecirculating water system described in McDonald et al. (1980). This system consistedof eight individual fish chambers (2 1 vol.) each supplied at a flow rate of 500 ml/minfrom either one of two volume-calibrated 100 1 reservoirs. One reservoir suppliedwater at a normal pH while the other supplied acidified water; the switchover fromone to the other could be effected without disturbance to the fish. The calibrationmarks in these reservoirs allowed the determination of the total experimental volumeto within ± 50 ml. The water to fish ratio was maintained throughout at approximately40 I/kg.
Prior to use, the water in each reservoir was decarbonated by acidification to pH2-5 with H2SO4, 24 h aeration, and then back titration with KOH and NaOH to theappropriate pH (7-5 in the control reservoir, 4-0 in the acid reservoir). The resultingionic composition is shown in Table 1.
Experimental protocol
Following acclimation, trout were implanted with chronic cannulae in the dorsalaorta (Smith & Bell, 1964) and urinary bladder (Wood & Randall, 1973) while underMS-222 anaesthesia (1:10000 dilution in the acclimation water). They were thentransferred to the recirculating system and allowed to recover for 36 h. This recovenj
Acid and ion fluxes in the trout at low pH 103
Beriod was followed by a 5 day experimental period. The experimental period for acidexposure (conducted as two experimental replicates, N = 6 and N = 8) consistedof one day at a normal water pH (i.e. Day 0) followed by four days of acid exposure(i.e., Days 1-4, Table 1). The control experiment (Table 1) was conducted to deter-mine the influence of the surgical and blood sampling procedures on branchial fluxesand urine flow. In this experiment, trout (N = 8) were maintained at normal pHthroughout but were otherwise treated identically to the trout undergoing acid ex-posure.
Arterial blood samples (o-6 ml) were drawn from the dorsal aortic cannula withoutdisturbing the fish and were replaced with an equal volume of heparinized (100 i.u./ml) Cortland saline (Wolf, 1963). Blood samples were drawn, in the acid exposureseries, at the midpoint of Day o (control sample) and Day 1, and 2-4 h following theend of Days 1, 2, 3 and 4. Blood samples were analysed for pH, CCOt (whole bloodand plasma ), Na+, Cl~, K+ and Cas+ (see below). The mid-point Day 1 sample wasanalysed for pH only. In order to maintain similar experimental conditions in thecontrol series, a blood sampling procedure identical to the above was employed.Analysis of these collected samples was not required however, as previous studies(McDonald et al. 1980) have established that repetitive sampling has no effect onblood acid-base and ion parameters.
Urinary bladders were drained via the cannulae with a siphon of 7 cm into coveredvials, allowing continuous urine collection. Urine vials were changed at 12 h intervalsthroughout the duration of the experiments. Each 12 h collection for the acid serieswas analysed for volume, pH, NH4
+, TA-HCO3-, Na+, K+, C1-, Ca2+, and phosphate(see below). Collections in the control series were analysed for volume only, asprevious studies (Wood & Caldwell, 1978; Kobayashi & Wood, 1980) have establishedthat repetitive blood sampling has no effect on renal ion and acid excretion.
Water samples (10 ml) for ion analysis (Na+, K+, Cl~ and Ca2+) were collected at12 h intervals. The first water sample on Day 1 of acid exposure was collected 2 hafter the water supply to the fish boxes was switched to the acid reservoir; this delayallowed for complete mixing of water btween the fish boxes and the supply reservoir.Water samples for titration (10 ml) and ammonia analysis (5 ml) were collected fivetimes daily; at time o, + 2 h, + 12 h, + 14 h and + 24 h. During the o—h2 h and the+ 14-+ 16 h intervals on Days 1-4 in the acid exposure series, water pH was returnedto pH ~ 4-0 by addition of 1 N-HJJSC^ and distilled water was added to replacewater lost by evaporation ( ~ 1 I/day). No water pH adjustments were made on Day oin the acid series nor throughout the control series since pH variations were veryminor (Table 1).
At the termination of the acid-exposure and control experiments, animals were killedby a blow on the head and duplicate 1 g samples of epaxial muscle were removed frombelow and slightly caudal to the dorsal fin. These samples were then frozen forsubsequent ion analysis.
Analytical techniques1. Blood acid-base parameters
Arterial blood pH (pHa) and total CO2 (CaCOl) were determined immediately onfleeted samples by methods described in McDonald et al. (1980). Measurements
104 D. G. MCDONALD AND C. M. WOOD
of C a C O l and pHa were used to calculate Pa>COl (in mmHg) and HCO3~ (m-equiv/Jin whole blood and plasma) from the Henderson-Hasselbalch equation. The quantityof H+ ions (in m-equiv/1 of blood) added to blood buffers by non-respiratory (i.e.non-volatile) acids (AHb+) was calculated from whole blood HCO3~, pHa andhaematocrit according to equations 2 and 3 of McDonald et al. (1980).
2. IonsNa+, K+ and Ca2+ levels in plasma, urine and water were determined (cf.
McDonald et al. 1980; Kobayashi & Wood, 1980) by flame photometry (EEL Mark IIfor Na+ and K+, Coleman 20 for Ca2+). Chloride levels in these fluids were deter-mined by coulometric titration (Radiometer CMT-10). Ammonia levels in urineand water were determined by colorimetric assay using a micro-modification of thephenolhypochlorite method of Solorzano (1969). Phosphate levels in urine weredetermined colorimetrically by phosphomolybdate reduction using Sigma reagents(Sigma, 1974).
For ion analysis, muscle samples were dried (95 °C, 48 h), homogenized andextracted with i-o N-nitric acid (10:1, 37 °C, 24 h). Aliquots were analysed for Na+,K+ and Cl~ levels in a fashion similar to plasma. Intracellular concentrations (m-equiv/kg cell water) were calculated according to the equation:
rT _ total tissue ion — extracellular ion contentL J = total tissue water-ECFV ' ( I '
where extracellular ion content was taken as the product of the plasma [ion] andECFV (extracellular fluid volume) (a Donnan equilibrium factor of 1 was assumed;Houston & Mearow, 1979). ECFV (I/kg body weight) was estimated as the chloride-potassium space, calculated according to the equation given in Conway (1957).Houston & Mearow (1979) have shown that this readily determined parameter givesvalues for muscle ECFV that are closely comparable to those measured more rigorouslywith a radiolabelled ECF marker ([14C]polyethylene gylcol).
3. Urine acidity
Urine pH and titratable acidity (TA-HCO3~) were determined immediately aftercollection as described in Wood & Caldwell (1978) and Kobayashi & Wood (1980).TA-HC03~ was determined as a single value in the double titration procedurerecommended by Hills (1973) using a Radiometer micro pH electrode (Type E5021)coupled to a Radiometer PHM-71 acid-base analyser. Titrants used were 0-02 N-HC1and 002 N-NaOH. In contrast to previous studies (e.g. Kobayashi & Wood, 1980)the final end point of the titration for all samples was the blood pH on Day o ratherthan the mean blood pH for the collection period. The latter represents the titratableacid content of the urine relative to the blood at the time of collection whereas theformer more closely reflects the titratable acid content of the urine relative to aconstant value. It is thus more appropriate for assessing changes in absolute acidoutput over time and for comparisons of branchial and renal acid fluxes. Total renalacid output was calculated as the sum of this titratable acid efflux ([TA-HC08~] xurine flow rate) and the ammonium efflux ([NH4
+] x urine flow rate).
Acid and ton fluxes in the trout at low pH 105
4. Branchial ion and acid fluxes
Net fluxes of Na+, K+, Cl~ and Ca2+ (in/^equiv/kg. h) were calculated from changesin their concentrations in the water.
Net branchial acid fluxes (in /^equiv H+/kg.h) were determined according toprocedures similar to those of DeRenzis & Maetz (1973) and Cameron (1980). 10 mlwater samples, collected at the beginning and end of each flux period and thermo-statted to the experimental temperature, were titrated to an end point pH of 4-0 with0-02 N-HC1. For these titrations pH was measured with a Radiometer G202C pHelectrode coupled to a PHM28 pH meter. Samples were aerated 1 h prior to titrationto remove respiratory CO2 and aeration was maintained through the titration both toprovide mixing and to remove additional COE liberated by the titration of HCO3~.The end-point titrant concentrations determined by this procedure were used tocalculate the titratable component of the net acid flux. This component reflectsbut does not equal the net acid flux since protons may have been excreted by the gillsin the form of NH4+ and/or may have been trapped from the medium as the result ofbranchial NHS excretion, i.e. branchial ammonia excretion, regardless of its form,results in protons in the medium which will escape titration. Thus the net branchialacid flux is the sum of the titratable net flux and the ammonia excretion (signs con-sidered). It should be pointed out that this procedure does not distinguish betweena net excretion of acid and a net uptake of base or vice-versa. Fortunately, this does notmatter in terms of the acid-base status of the animal.
Statistical analyses
For the two acid-exposure replicates the experimental conditions, including thefluctuations in the acid pH regime (see Fig. 1) were nearly identical and preliminarydata analysis indicated no significant differences between their mean values. Con-sequently, the results from the replicates have been pooled. Means + 1 S.E.M. arereported for blood and urine parameters and means only for branchial flux data. Thelatter were weighted according to the number of fish in each replicate. The N valuesfor branchial fluxes and urine parameters declined from 14 on Day o to 10 by the endof Day 4 because of death caused by exposure to acid (two during Day 3 and two duringDay 4). N values for blood acid-base and ionic parameters were lower due to inopera-tive dorsal aortic catheters, declining from 10 (on Day o) to 7 (on Day 4). Significantdifferences for blood and urine parameters were tested with the Student's two-tailedt test (paired design) using each fish for its own 'control' values (the Day 0 values).
RESULTS
Control measurements
In all trout the Day o measurements of blood acid-base status (Fig. 2), plasma ionlevels (Fig. 6), urine flow rate (Fig. 5) and renal ion and acid excretion (Table 2) wereclosely comparable to values we have previously defined as normal for this speciesacclimated to similar experimental conditions (Wood & Caldwell, 1978; Kobayashi &Wood, 1980; McDonald et al. 1980).
106 D. G. MCDONALD AND C. M. WOOD
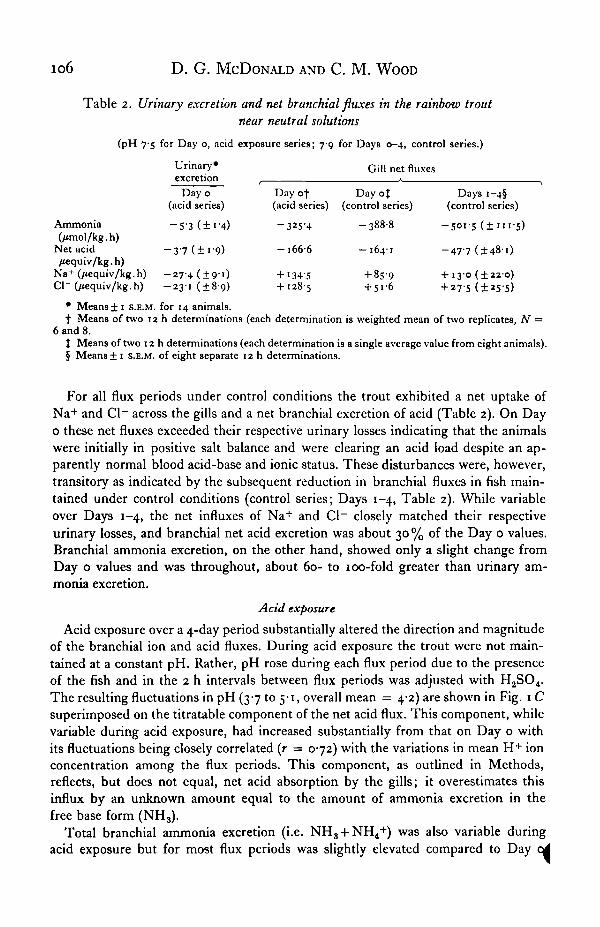
Table 2. Urinary excretion and net branchial fluxes in the rainbow troutnear neutral solutions
(pH 7-5 for Day o, ncid exposure series; 79 for Days 0-4, control series.)
Ammonia(/imol/kg.h)
Net acid/tequiv/kg. h)
Na+ (/tequiv/kgCl~ (/iequiv/kg.
•h)h)
Urinary*excretion
Day 0(acid series)
-5-3 (±i-4)
- 3 7 (±i-9)
- 2 7 4 (±91)-23-1 (±89)
Day of(acid series)
-325-4
-1666
+ I34-5+ 128-5
Gill net fluxes
Day 0%(control series)
-3888
—164-1
+ 859+ 51-6
Days i—4§(control series)
- 5 0 1 - 5 ( ± 1 1 1 - 5 )
-47-7(1481)
+ 130 (±220)+ 27-5 (±25-5)
• Mean8± 1 s.E.M. for 14 animals.t Means of two 12 h determinations (each determination is weighted mean of two replicates, N =
6 and 8.t Means of two 12 h determinations (each determination is a single average value from eight animals).§ Means ± 1 s.E.M. of eight separate 12 h determinations.
For all flux periods under control conditions the trout exhibited a net uptake ofNa+ and Cl~ across the gills and a net branchial excretion of acid (Table 2). On Dayo these net fluxes exceeded their respective urinary losses indicating that the animalswere initially in positive salt balance and were clearing an acid load despite an ap-parently normal blood acid-base and ionic status. These disturbances were, however,transitory as indicated by the subsequent reduction in branchial fluxes in fish main-tained under control conditions (control series; Days 1-4, Table 2). While variableover Days 1-4, the net influxes of Na+ and Cl~ closely matched their respectiveurinary losses, and branchial net acid excretion was about 30 % of the Day o values.Branchial ammonia excretion, on the other hand, showed only a slight change fromDay o values and was throughout, about 60- to 100-fold greater than urinary am-monia excretion.
Acid exposure
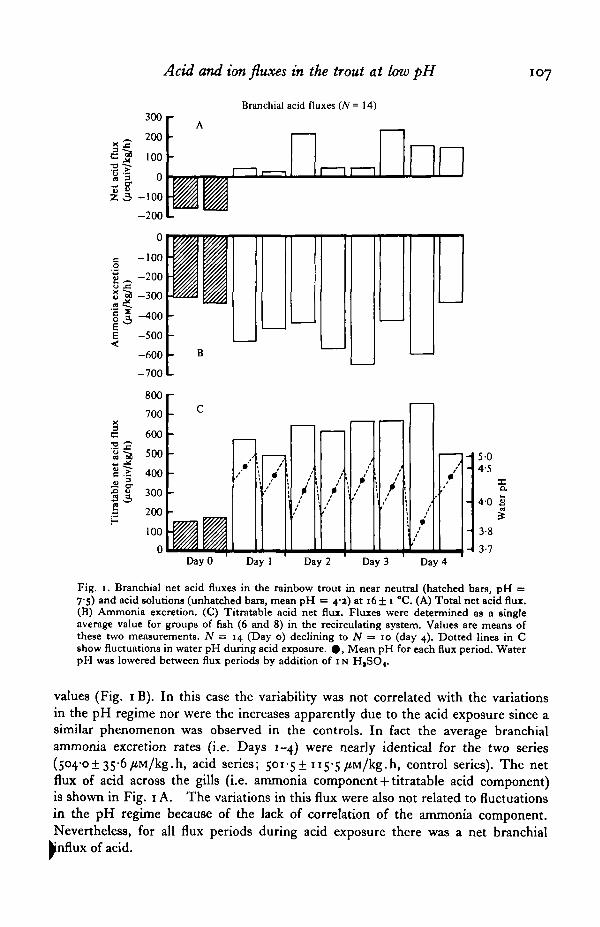
Acid exposure over a 4-day period substantially altered the direction and magnitudeof the branchial ion and acid fluxes. During acid exposure the trout were not main-tained at a constant pH. Rather, pH rose during each flux period due to the presenceof the fish and in the 2 h intervals between flux periods was adjusted with H2SO4.The resulting fluctuations in pH (37 to 5-1, overall mean = 4-2) are shown in Fig. 1Csuperimposed on the titratable component of the net acid flux. This component, whilevariable during acid exposure, had increased substantially from that on Day o withits fluctuations being closely correlated (r = 072) with the variations in mean H+ ionconcentration among the flux periods. This component, as outlined in Methods,reflects, but does not equal, net acid absorption by the gills; it overestimates thisinflux by an unknown amount equal to the amount of ammonia excretion in thefree base form (NH3).
Total branchial ammonia excretion (i.e. NH3 + NH4+) was also variable duringacid exposure but for most flux periods was slightly elevated compared to Day q |
Acid and ion fluxes in the trout at low pH 107
z 3
iV<
133 12a
300
200
100
0
-100
-200
0
-100
-200
-300
-400
-500
-600
-700
800
700
600
500
400
300
200
100
0
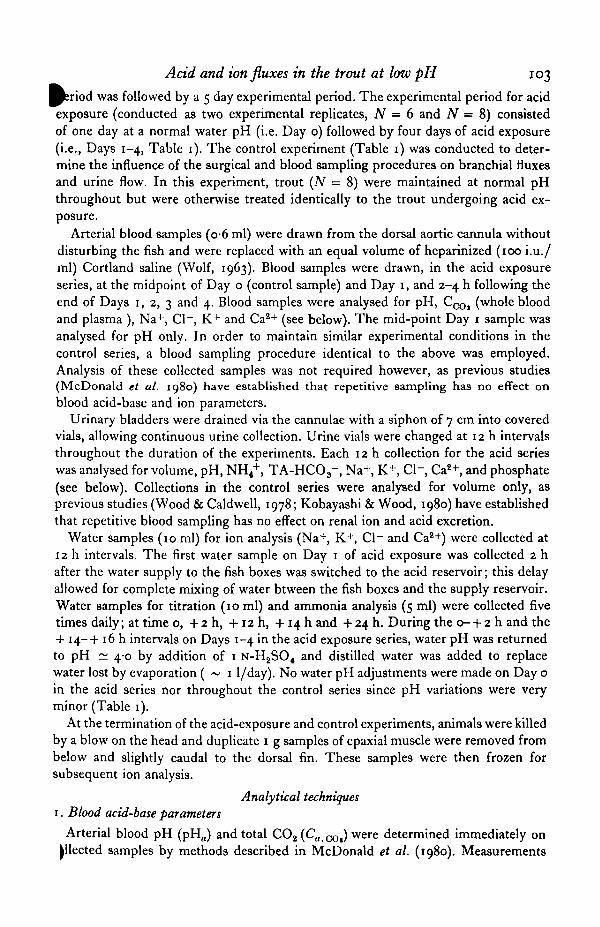
Branchial acid fluxes (JV= 14)
Day 0 Day 1 Day 2 Day 3 Day 4
5 04-5
40 a
3-8
3-7
Fig. 1. Branchial net acid fluxes in the rainbow trout in near neutral (hatched bars, pH =7'S) and acid solutions (unhatched barB, mean pH = 4-*) at 16 ± 1 °C. (A) Total net acid flux.(B) Ammonia excretion. (C) Titratable acid net flux. Fluxes were determined as a singleaverage value for groups of fish (6 and 8) in the recirculating system. Values are means ofthese two measurements. N = 14 (Day o) declining to N = 10 (day 4). Dotted lines in Cshow fluctuations in water pH during acid exposure. • , Mean pH for each flux period. WaterpH was lowered between flux periods by addition of 1N H,SO«.
values (Fig. 1B). In this case the variability was not correlated with the variationsin the pH regime nor were the increases apparently due to the acid exposure since asimilar phenomenon was observed in the controls. In fact the average branchialammonia excretion rates (i.e. Days 1-4) were nearly identical for the two series(504-01 35-6 fi\i/kg.h, acid series; 501-5+115-5/iM/kg.h, control series). The netflux of acid across the gills (i.e. ammonia component + titratable acid component)is shown in Fig. 1 A. The variations in this flux were also not related to fluctuationsin the pH regime because of the lack of correlation of the ammonia component.Nevertheless, for all flux periods during acid exposure there was a net branchialinflux of acid.
i o 8 D. G. MCDONALD AND C. M. WOOD
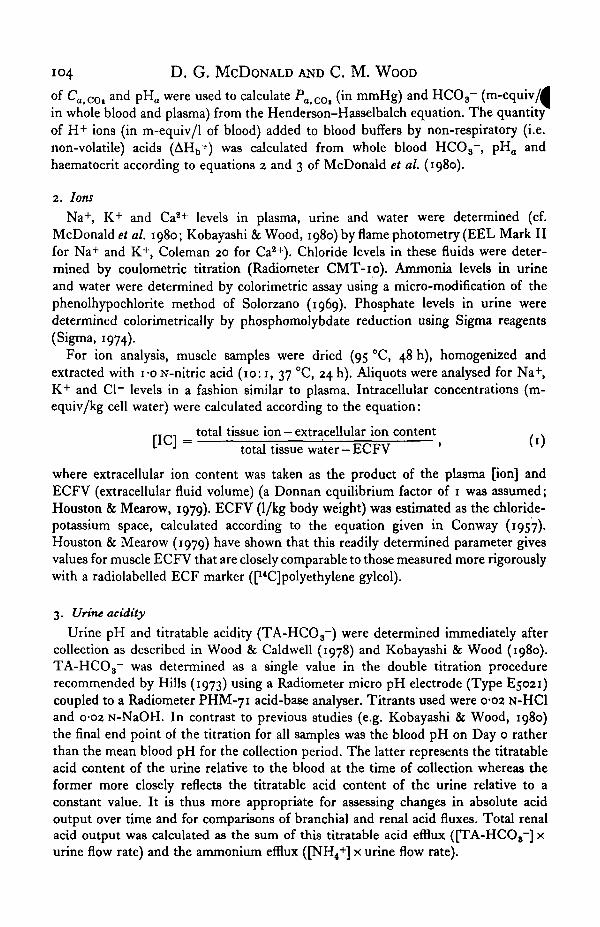
Blood acid-base status (N= 10)
1 2 3 4Days of acid exposure
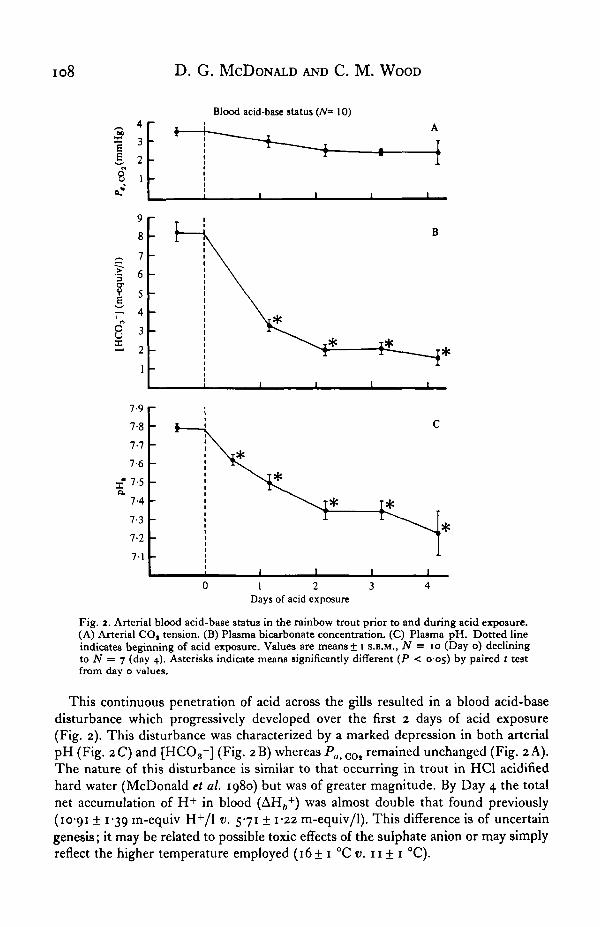
Fig. 2. Arterial blood acid-base status in the rainbow trout prior to and during acid exposure.(A) Arterial COt tension. (B) Plasma bicarbonate concentration. (C) Plasma pH. Dotted lineindicates beginning of acid exposure. Values are means± i S.E.M., N = io (Day o) decliningto N = 7 (day 4). Asterisks indicate means significantly different (P < 005) by paired t testfrom day o values.
This continuous penetration of acid across the gills resulted in a blood acid-basedisturbance which progressively developed over the first 2 days of acid exposure(Fig. 2). This disturbance was characterized by a marked depression in both arterialpH (Fig. 2C) and [HCO3~] (Fig. 2B) whereas Pa< COl remained unchanged (Fig. 2 A).The nature of this disturbance is similar to that occurring in trout in HCl acidifiedhard water (McDonald et al. 1980) but was of greater magnitude. By Day 4 the totalnet accumulation of H+ in blood (AH6
+) was almost double that found previously(10-91 ± 1-39 m-equiv H+/1 v. 571 ± 1-22 m-equiv/1). This difference is of uncertaingenesis; it may be related to possible toxic effects of the sulphate anion or may simplyreflect the higher temperature employed (16+ 1 °C v. 11 ± 1 °C).
Acid and ion fluxes in the trout at low pH 109
80
70
60
« §• 30
o 20
10
60
I!4 0
g | 30
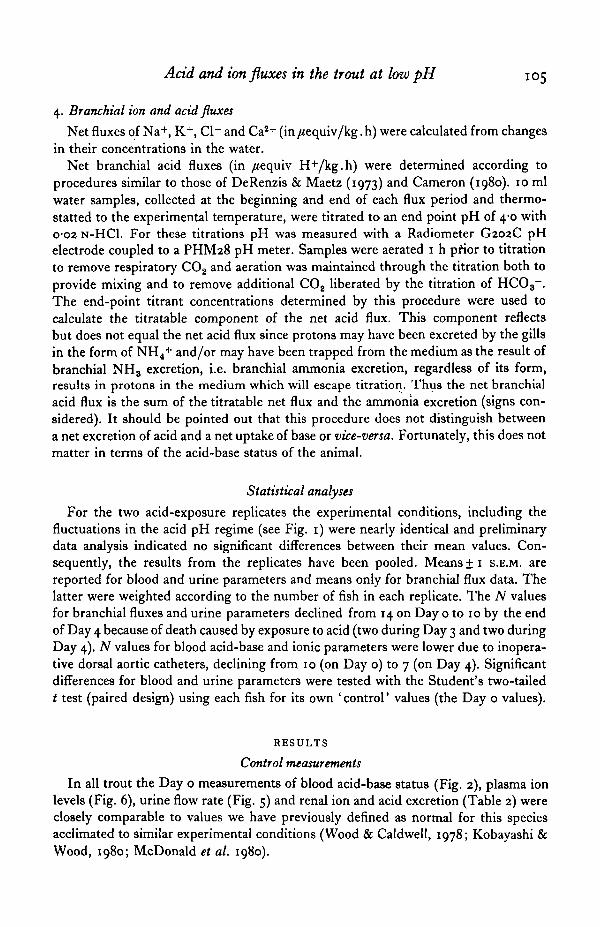
Urine acid excretion (N= 14)
B
T
T i - ! • -
*
. I .y1
Day 0 Day 1 Day 2 Day 3 Day 4
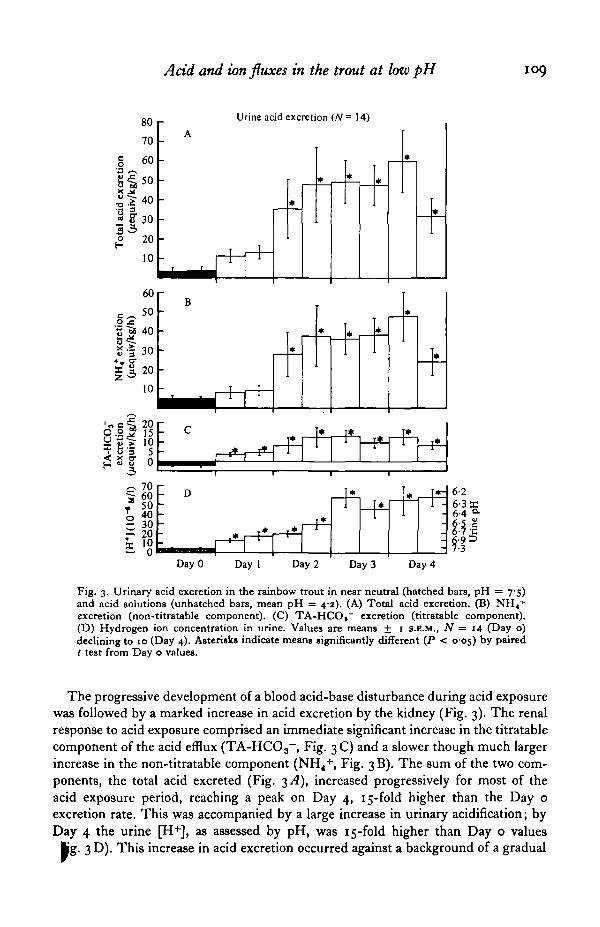
Fig. 3. Urinary acid excretion in the rainbow trout in near neutral (hatched bars, pH = 7-5)and acid solutions (unhatched bars, mean pH = 42). (A) Total acid excretion. (B) NH4
+
excretion (non-titratable component). (C) TA-HCO," excretion (titratable component).(D) Hydrogen ion concentration in urine. Values are means ± 1 S.E.M., N = 14 (Day o)declining to 10 (Day 4). Asterisks indicate means significantly different (P < 005) by paired/ test from Day o values.
The progressive development of a blood acid-base disturbance during acid exposurewas followed by a marked increase in acid excretion by the kidney (Fig. 3). The renalresponse to acid exposure comprised an immediate significant increase in the titratablecomponent of the acid efflux (TA-HCO 3~, Fig. 3 C) and a slower though much largerincrease in the non-titratable component (NH4+, Fig. 3 B). The sum of the two com-ponents, the total acid excreted (Fig. 3^4), increased progressively for most of theacid exposure period, reaching a peak on Day 4, 15-fold higher than the Day oexcretion rate. This was accompanied by a large increase in urinary acidification; byDay 4 the urine [H+], as assessed by pH, was 15-fold higher than Day o values
kg. 3 D). This increase in acid excretion occurred against a background of a gradual
n o D. G. MCDONALD AND C. M. WOOD
•43
200
100
-100
-200
-300
200
100
0
-100
-200
100
0
-100
-200
Branchial net ion fhixet (N ° 14)
• ' B
Day 0
1
Day 1
1
Day 2
1
Day 3
C
Day 4
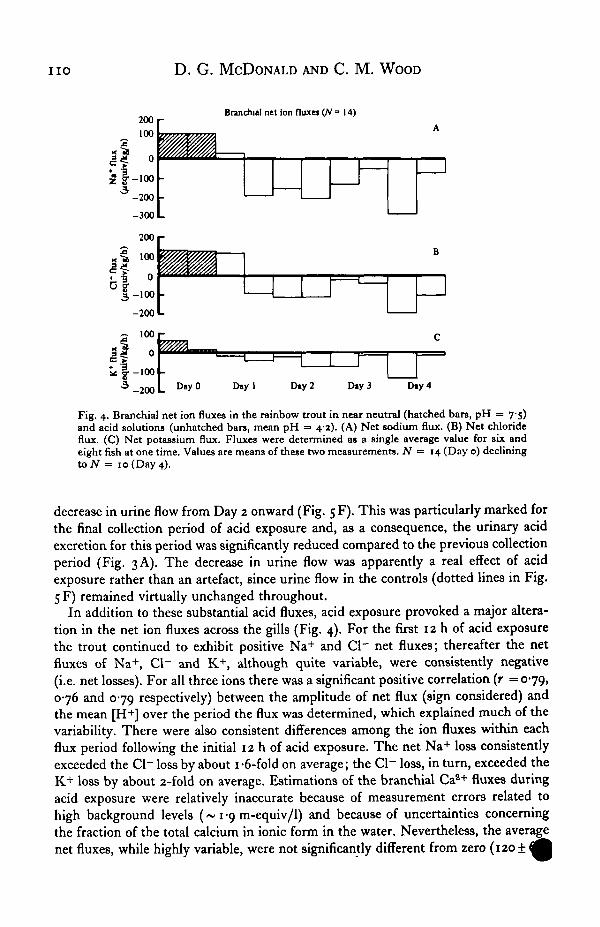
Fig. 4. Branchial net ion fluxes in the rainbow trout in near neutral (hatched bars, pH = 7-5)and acid solutions (unhatched bars, mean pH = 4-2). (A) Net sodium flux. (B) Net chlorideflux. (C) Net potassium flux. Fluxes were determined as a single average value for six andeight fish at one time. Values are means of these two measurements. N = 14 (Day o) decliningto N = 10 (Day 4).
decrease in urine flow from Day 2 onward (Fig. 5 F). This was particularly marked forthe final collection period of acid exposure and, as a consequence, the urinary acidexcretion for this period was significantly reduced compared to the previous collectionperiod (Fig. 3 A). The decrease in urine flow was apparently a real effect of acidexposure rather than an artefact, since urine flow in the controls (dotted lines in Fig.5 F) remained virtually unchanged throughout.
In addition to these substantial acid fluxes, acid exposure provoked a major altera-tion in the net ion fluxes across the gills (Fig. 4). For the first 12 h of acid exposurethe trout continued to exhibit positive Na+ and Cl" net fluxes; thereafter the netfluxes of Na+, Cl~ and K+, although quite variable, were consistently negative(i.e. net losses). For all three ions there was a significant positive correlation (r = 079,076 and 079 respectively) between the amplitude of net flux (sign considered) andthe mean [H+] over the period the flux was determined, which explained much of thevariability. There were also consistent differences among the ion fluxes within eachflux period following the initial 12 h of acid exposure. The net Na+ loss consistentlyexceeded the Cl~ loss by about 1 -6-fold on average; the Cl~ loss, in turn, exceeded theK+ loss by about 2-fold on average. Estimations of the branchial Cas+ fluxes duringacid exposure were relatively inaccurate because of measurement errors related tohigh background levels (~ 1 -9 m-equiv/1) and because of uncertainties concerningthe fraction of the total calcium in ionic form in the water. Nevertheless, the averagenet fluxes, while highly variable, were not significantly different from zero (120 ± I
Acid and ion fluxes in the trout ai low pH i n
Urine ion excretion and flow rate (ND 14)
•20 -' D
T* T * i t—P1
hi
Day 0 Day 1 Day 2 Day 3 Day 4
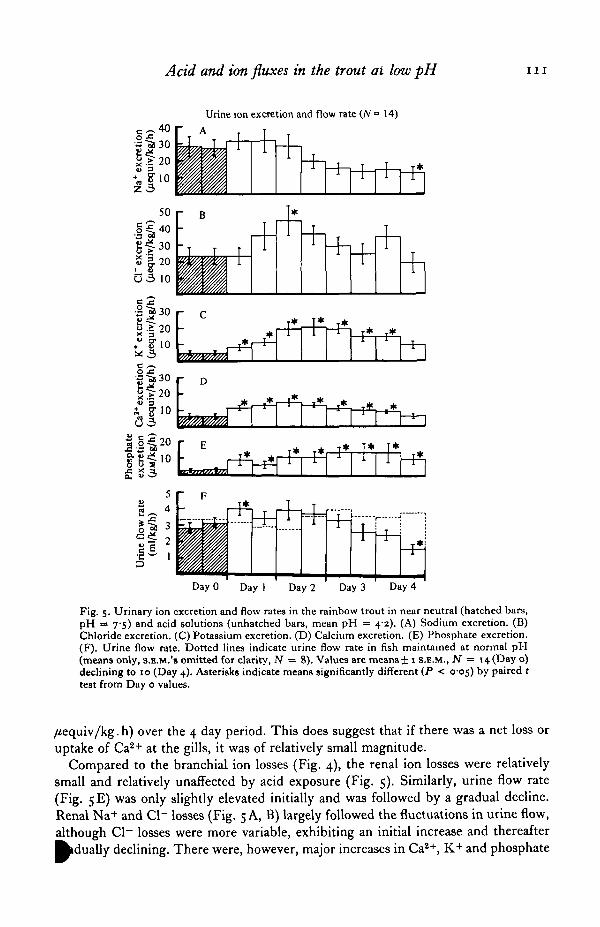
Fig. 5. Urinary ion excretion and flow rates in the rainbow trout in near neutral (hatched bars,pH = 75) and acid solutions (unhatched bars, mean pH = 42). (A) Sodium excretion. (B)Chloride excretion. (C) Potassium excretion. (D) Calcium excretion. (E) Phosphate excretion.(F). Urine flow rate. Dotted lines indicate urine flow rate in fish maintained at normal pH(means only, S.E.M.'S omitted for clarity, JV = 8). Values are means ± 1 S.E.M., N = 14 (Day o)declining to 10 (Day 4). Asterisks indicate means significantly different (P < 005) by paired ttest from Day o values.
/iequiv/kg.h) over the 4 day period. This does suggest that if there was a net loss oruptake of Ca2+ at the gills, it was of relatively small magnitude.
Compared to the branchial ion losses (Fig. 4), the renal ion losses were relativelysmall and relatively unaffected by acid exposure (Fig. 5). Similarly, urine flow rate(Fig. 5E) was only slightly elevated initially and was followed by a gradual decline.Renal Na+ and Cl~ losses (Fig. 5 A, B) largely followed the fluctuations in urine flow,although Cl~ losses were more variable, exhibiting an initial increase and thereafter^dua l ly declining. There were, however, major increases in Ca2+, K+ and phosphate
1 1 2 D. G. MCDONALD AND C. M. WOOD
0 1 2 3 4Days of acid exposure
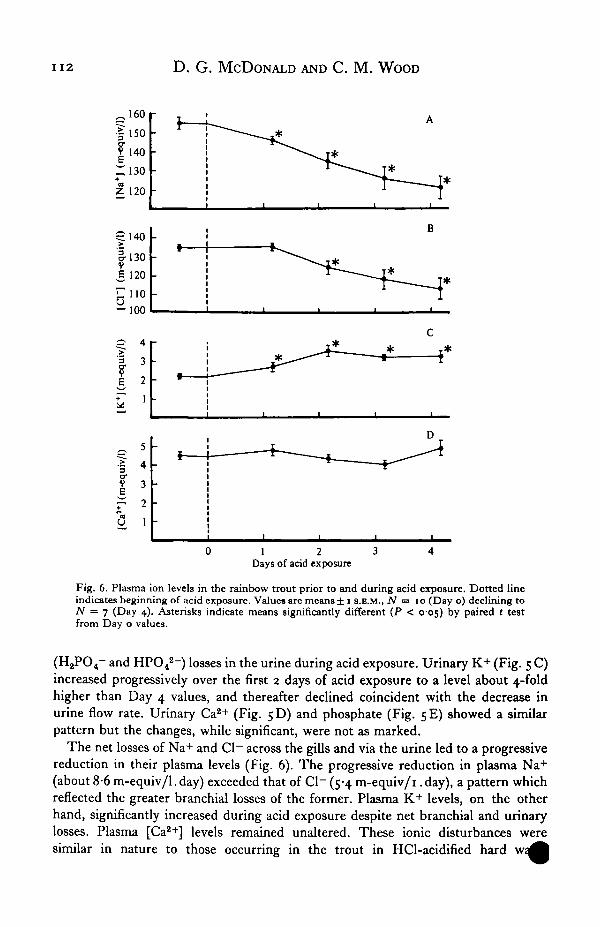
Fig. 6. Plasma ion levels in the rainbow trout prior to and during acid exposure. Dotted lineindicates beginning of acid exposure. Values are means ± i 8.E.M., N •=* 10 (Day o) declining toN = 7 (Day 4). Asterisks indicate means significantly different (P < 005) by paired t testfrom Day o values.
and HPO42~) losses in the urine during acid exposure. Urinary K+ (Fig. 5 C)
increased progressively over the first 2 days of acid exposure to a level about 4-foldhigher than Day 4 values, and thereafter declined coincident with the decrease inurine flow rate. Urinary Ca2+ (Fig. 5D) and phosphate (Fig. 5E) showed a similarpattern but the changes, while significant, were not as marked.
The net losses of Na+ and Cl~ across the gills and via the urine led to a progressivereduction in their plasma levels (Fig. 6). The progressive reduction in plasma Na+
(about 8-6 m-equiv/1. day) exceeded that of Cl~ (5-4 m-equiv/i. day), a pattern whichreflected the greater branchial losses of the former. Plasma K+ levels, on the otherhand, significantly increased during acid exposure despite net branchial and urinarylosses. Plasma [Ca2+] levels remained unaltered. These ionic disturbances weresimilar in nature to those occurring in the trout in HCl-acidified hard
Acid and ion fluxes in the trout at low pH 113
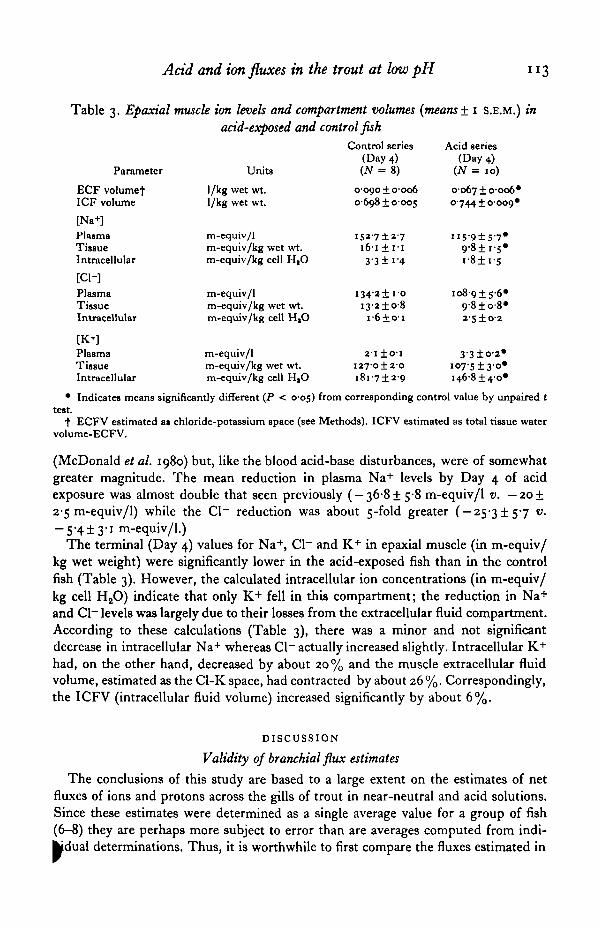
Table 3. Epaxial muscle ion levels and compartment volumes {means ± 1 S.E.M.) inacid-exposed and control fish
Control series Acid series(Day 4) (Day 4)
Parameter Unite (N = 8) (N = xo)ECF volumefICF volume
[Na+]PlasmaTissueIntracellular
[C1-]PlasmaTissueIntracellular
[K+]PlasmaTissueIntracellular
I/kg wet wt.I/kg wet wt.
m-equiv/1m-equiv/kg wet wt.m-equiv/kg cell HtO
m-equiv/1m-equiv/kg wet wt.m-equiv/kg cell HtO
m-equiv/1m-equiv/kg wet wt.m-equiv/kg cell HtO
0090 ±0-0060-698 + 0-005
16-1 ± I-I33 ±i'4
i3-2±o-8I - 6 ± O I
2-1 ±o-iI27O±2OI 8 I - 7 ± 2 - 9
oo67±o-oo6#
0744 ±0-009*
9'8±i-5*I - 8 ± I - 5
io8-9±5-6*9-8±o-8#
2-5 ±0-2
33±o-2*i°7'5±3'°*1468 ±4-0*
• Indicates means significantly different (P < 0-05) from corresponding control value by unpaired ttest.
t ECFV estimated a* chloride-potassium space (see Methods). ICFV estimated as total tissue watervolume-ECFV.
(McDonald et al. 1980) but, like the blood acid-base disturbances, were of somewhatgreater magnitude. The mean reduction in plasma Na+ levels by Day 4 of acidexposure was almost double that seen previously ( — 36-81 5-8 m-equiv/1 v. — 20 ±2-5 m-equiv/1) while the Cl~ reduction was about 5-fold greater ( — 25-3 ±5-7 v.— 5'4± 3"1 m-equiv/1.)
The terminal (Day 4) values for Na+, Cl~ and K+ in epaxial muscle (in m-equiv/kg wet weight) were significantly lower in the acid-exposed fish than in the controlfish (Table 3). However, the calculated intracellular ion concentrations (in m-equiv/kg cell H20) indicate that only K+ fell in this compartment; the reduction in Na+and Cl~ levels was largely due to their losses from the extracellular fluid compartment.According to these calculations (Table 3), there was a minor and not significantdecrease in intracellular Na+ whereas Cl~ actually increased slightly. Intracellular K+
had, on the other hand, decreased by about 20% and the muscle extracellular fluidvolume, estimated as the Cl-K space, had contracted by about 26%. Correspondingly,the ICFV (intracellular fluid volume) increased significantly by about 6%.
DISCUSSION
Validity of branchial flux estimates
The conclusions of this study are based to a large extent on the estimates of netfluxes of ions and protons across the gills of trout in near-neutral and acid solutions.Since these estimates were determined as a single average value for a group of fish(6-8) they are perhaps more subject to error than are averages computed from indi-
determinations. Thus, it is worthwhile to first compare the fluxes estimated in
i i4 D. G. MCDONALD AND C. M. WOOD
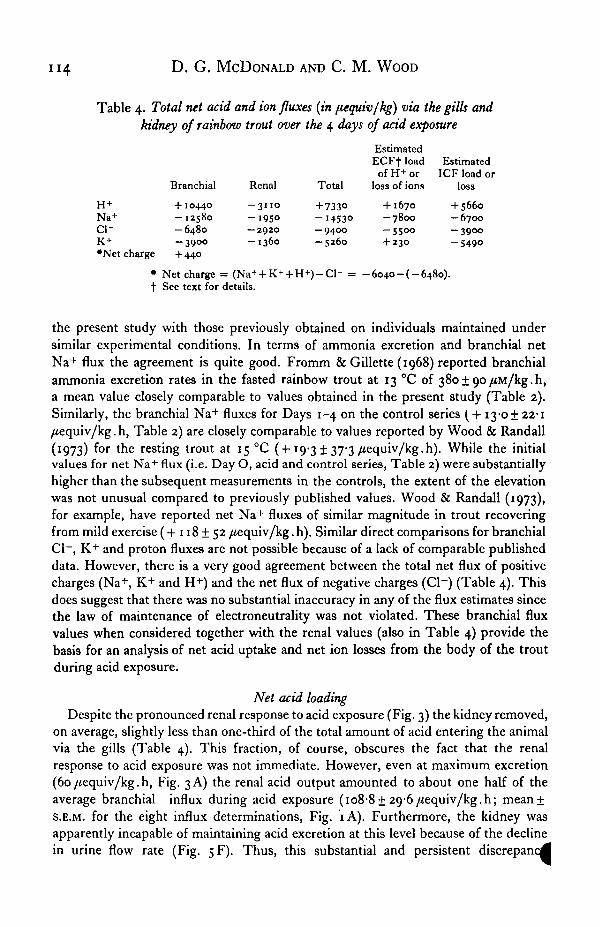
Table 4. Total net acid and ion fluxes (in fiequiv/kg) via the gills andkidney of rainbow trout over the 4 days of acid exposure
H+Na+
ci-K +
•Net charge
Branchial
+10440- 12580-6480-3900+ 440
Renal
- 3 1 1 0
-195°— 2920- 1 3 6 0
Total
+ 7330-14530- 9 4 0 0— 5260
EstimatedECFf loadof H+ or
loss of ions
+ 1670- 7 8 0 0-55OO+ 230
EstimatedICF load or
loss
+5660— 6700- 3 9 0 0-S49O
• Net charge = (Na++K+ + H+)-Cl - = -6040-( -6480) .t See text for details.
the present study with those previously obtained on individuals maintained undersimilar experimental conditions. In terms of ammonia excretion and branchial netNa+ flux the agreement is quite good. Fromm & Gillette (1968) reported branchialammonia excretion rates in the fasted rainbow trout at 13 °C of 380+ 90/tin/kg.h,a mean value closely comparable to values obtained in the present study (Table 2).Similarly, the branchial Na+ fluxes for Days 1-4 on the control series ( + 13-0±22-1/iequiv/kg. h, Table 2) are closely comparable to values reported by Wood & Randall(1973) for the resting trout at 15 °C (+19-3 ± 37-3 /iequiv/kg.h). While the initialvalues for net Na+ flux (i.e. Day O, acid and control series, Table 2) were substantiallyhigher than the subsequent measurements in the controls, the extent of the elevationwas not unusual compared to previously published values. Wood & Randall (1973),for example, have reported net Na+ fluxes of similar magnitude in trout recoveringfrom mild exercise (4-118 + 52 /tequiv/kg.h). Similar direct comparisons for branchialCl~, K+ and proton fluxes are not possible because of a lack of comparable publisheddata. However, there is a very good agreement between the total net flux of positivecharges (Na+, K+ and H+) and the net flux of negative charges (Cl~) (Table 4). Thisdoes suggest that there was no substantial inaccuracy in any of the flux estimates sincethe law of maintenance of electroneutrality was not violated. These branchial fluxvalues when considered together with the renal values (also in Table 4) provide thebasis for an analysis of net acid uptake and net ion losses from the body of the troutduring acid exposure.
Net acid loadingDespite the pronounced renal response to acid exposure (Fig. 3) the kidney removed,
on average, slightly less than one-third of the total amount of acid entering the animalvia the gills (Table 4). This fraction, of course, obscures the fact that the renalresponse to acid exposure was not immediate. However, even at maximum excretion(6o/(equiv/kg.h, Fig. 3 A) the renal acid output amounted to about one half of theaverage branchial influx during acid exposure (io8-8±29-6/iequiv/kg.h; mean +S.E.M. for the eight influx determinations, Fig. iA). Furthermore, the kidney wasapparently incapable of maintaining acid excretion at this level because of the declinein urine flow rate (Fig. 5F). Thus, this substantial and persistent discrepancy
Acid and ion fluxes in the trout at low pH 115
uptake and removal of acid led, by Day 4 of acid exposure, to a net bodyload amounting to 7330 /iequiv H+/kg (Table 4).
By making some reasonable assumptions, it is possible to calculate, from the de-pression in plasma pH and [HCO3~] (Fig. 2), the portion of this load buffered inextracellular fluids and thus, by difference, the amount buffered by the intracellularcompartment. These ECF estimates (Table 4) are based on the assumptions that theextracellular fluid volume (ECFV) for the whole animal was 190 ml/kg (cf. Eddy &Bath, 1979; Cameron, 1980) partitioned as 50 ml/kg blood volume (BV; Stevens,1968) and 140 ml/kg interstitial fluid (IFV), that interstitial fluids were in equilibriumwith plasma with respect to pH and HCO3~, and that the non-bicarbonate (i.e.protein) buffering capacity of interstitial fluids was similar to that of plasma (Hargens,Millard & Johansen, 1974). The equation used for this calculation was thus:
AHJCFV = BV.AH+ + IFV.AH&,
where AH6+ and AHfF, the quantities of buffered H+, were calculated from equation 2
of McDonald et al. (1980). For the calculation of AH "̂, the required /? value (thewhole blood buffer value) was calculated from equation 3 of McDonald et al. 1980;for AHfF, a ft of — 2-70 mequiv/1. pH unit (the buffer capacity of separated plasma;D. G. McDonald and C. M. Wood, unpublished results) was assumed.
On this basis we estimate that by 4 days of acid exposure 1670 /iequiv/kg ofprotons were buffered in the ECF. Thus a large fraction of the total body load (77 %or 5660 /iequiv/kg) was, by this time, buffered by the intracellular compartment.Similar estimates for the first 2 days of acid exposure indicate that the participationof ICF to total buffering was progressive; by 2 days the net body load was 2427 fi-equiv/kg of which 1540 /tequiv/kg was buffered in the ECF, i.e. ICF buffering, at thispoint, amounted to only 37% of the total. Further evidence for this progressive pene-tration of the intracellular compartment by H+ is provided by the significant elevationin plasma K+ levels (Fig. 6C) and in urinary K+ excretion (Fig. 5C). In mammals,similar changes accompany a chronic metabolic acidosis and are attributed to H +
penetration of the ICF in exchange for K+ loss (Woodbury, 1974). The elevation ofCa*+ and phosphate excretion in the urine (Fig. 5 D, E) further suggests that bone_minerals may also make a significant contribution to intracellular buffering. Suchchanges occur in man during and following sustained acid loading (Lemann, Litzow &Lennon, 1966) and are attributed to the dissolution of the major mineral componentsof bone; Cag(PO4)2 and CaCo3 (Lemann et al. 1966; Burnell & Teubner, 1971).Titration of the latter can, in fact, account for the major fraction (40-60%) of thetotal body buffering of an acid load (Burnell & Teubner, 1971). While the extent ofthe participation of bone in buffering in the present study is unknown, spinal de-formities attributable to skeletal demineralization have been reported for chronicallyacid-stressed fish in the wild (Beamish, 1974).
Net ion losses
From Table 4 it can also be seen that the gills constitute the major route for Na+,Cl~, and K+ losses during acid exposure. Furthermore, despite the substantialdifferences in the magnitude of the losses, the percentages of the total loss occurring via
n 6 D. G. MCDONALD AND C. M. WOOD
the gills were similarly large for all three ions; 87, 69 and 74%, respectively. Thus, t t fionic disturbances are due mainly to the effects of low pH on gill iono-regulatorymechanisms rather than on the renal reabsorption of filtered ions. Such disturbancesmay arise both via a stimulation of the passive branchial efflux of the ion in questionand/or by an inhibition of its active inward transport. For branchial Na+ fluxes,previous studies have shown that both phenomena are important. At pH 4-0, Na+influx was virtually completely inhibited in the trout (Packer & Dunson, 1970;McWilliams & Potts, 1978), while passive Na+ efflux had increased substantially.These studies have also shown that the magnitudes of the unidirectional fluxes arecorrelated with pH, a result confirmed by the correlation in the present study betweenthe net flux and the mean [H+] over the flux period (Figs. 1 C, 4A). Less is known ofthe effects of low pH on gill Cl~ fluxes. Maetz (1973) reported that Cl~ net fluxin the goldfish was unaffected by acid pH but the reduction in pH employed in this -study was small (7-2 to 6-i). McWilliams & Potts (1978), while not directly measuringCl~ fluxes at low pH, recorded a marked change in transepithelial potential in thetrout transferred from pH 7-0 to 4-0. This, they estimated, would have resulted inan actual reduction in passive Cl~ efflux by about 50%. This phenomenon may be thebasis for the lower net Cl~ losses reported in the present study. No information ispresently available on the effect of low pH on branchial K+ fluxes.
By assuming that plasma levels of Na+, Cl~ and K+ (Fig. 6) reflect those of thewhole body extracellular fluid space (190 ml/kg) than it can be estimated that 7800/^equiv/kg of Na+ and 5500 fiequiv of Cl~ were lost from the ECF, and 230 /*equiv/kgof K+ were gained by the ECF by Day 4 of acid exposure (Table 4). Thus, all of thebody K+ losses and slightly less than one-half of the body Na+ and Cl~ losses camefrom intracellular compartments. Since muscle intracellular Na+ and Cl~ levels werelow and not appreciably affected by acid exposure (Table 3), the losses of theseions must have arisen largely from the remaining body tissues, particularly those withrelatively high intracellular concentrations (e.g. cardiac muscle, gut and brain;Houston & Mearow, 1979). Muscle did, however, make a major contribution to thetotal K+ loss. Indeed, if it is assumed that the muscle K+ values (Table 3) are repre-sentative of the total white muscle mass (~ 55% of the body weight; Cameron, 1974)then it can be estimated that the muscle K+ loss is 11847 /^equiv/kg, a value approxi-mately double the total body loss (Table 4). For this to have occurred, a substantialportion of the muscle K+ loss must have been taken up by other body tissues,possibly those which sustained relatively high Na+ and Cl~ losses.
These considerations suggest that, at the cellular level, the ionic disturbance has acomplex and heterogeneous nature, the physiological consequences of which cannotbe predicted with certainty. There are, however, some obvious possibilities. Sinceintracellular K+ loss is linked to H+ gain (Woodbury, 1974), the intracellular acidosis(Table 4) may be particularly severe in muscle tissue, leading to weakness and eventualparalysis. In turn, this K+ efflux from muscle may provoke a hyperkalemia in blood(Fig. 6 C, Table 4) and other tissues. Increases in intracellular K+ would lead, intissues so affected, to membrane hyperpolarization and intracellular alkalosis (Wood-bury, 1974). Major fluid shifts may also accompany the ion losses. A decrease inECF osmotic pressure resulting from the reduction in plasma Na+ and Cl~ l
Acid and ion fluxes in the trout at low pH 117
• F i g . 6) would tend to reduce branchial water entry and increase ICFV at the expenseof ECFV (Table 3). A general contraction of the ECFV would result and wouldaffect circulatory efficiency. Recent studies in this laboratory have found evidencefor such cardiovascular disturbances (C. L. Milligan and C. M. Wood, unpublishedresults). Further work will be needed to confirm these phenomena and to ascertaintheir relative importance in the overall toxic syndrome.
We thank C. L. Milligan, M. A. Rogano and D. Spry for excellent technicalassistance and Dr G. P. Harris for the loan of equipment. Financial support wasprovided by a strategic grant in environmental toxicology from the Natural Sciencesand Engineering Research Council of Canada and by grants from the CanadianNational Sportsmen's Fund and from Fisheries and Oceans Canada.
REFERENCES
BEAMISH, R. J. (1974). Growth and survival of white suckers Catattomus commertoni in an acidifiedlake. J. Fish. Res. Bd. Can. 31, 49-54.
BURNELL, J. M. & TEUBNEH, E. (1971). Changes in bone sodium and carbonate in metabolic acidosisand alkalosis in the dog. J. dm. Invest. 50, 327-331.
CAMERON, J. N. (1974). Blood flow distribution as indicated by tracer microspheres in resting andhypoxic artic grayling, Thymallus arcticus. Comp. Biochem. Physiol. 5aA, 441-444.
CAMERON, J. N. (1980). Body fluid pools, kidney function, and acid-base regulation in the freshwatercatfish, Ictalurus punctatus. J. exp. Biol. 86, 171-185.
CONWAY, E. J. (1975). Nature and significance of concentration relations of potassium and sodium ionsin skeletal muscle. Physiol. Rev. 37, 84-132.
DE RENZIS, G. & MAETZ, J. (1973). Studies on the mechanism of chloride absorption by the goldfish gill.Relation with acid-base regulation. J. exp. Biol. 59, 339—358.
EDDY, F. B. & BATH, R. N. (1979). Ionic regulation in rainbow trout, Salmo gairdneri, adapted to freshwater and dilute sea water. J. exp. Biol. 83, 181-192.
FROMM, P. O. (1980). A review of some physiological and toxicologica] responses of freshwater fish toacid stress. Env. Biol, Fish 5, 79-93.
FROMM, P. O. & GILLETTE, J. R. (1968). Effect of ambient ammonia on blood ammonia and nitrogenexcretion of rainbow trout, Salmo gairdneri. Comp. Biochem. Physiol. 26, 887-896.
HARDENS, A. E., MILXARD, R. W. & JOHANBEN, K. (1974). High capillary permeability in fishes. Comp.Biochem. Physiol. 48A, 675—680.
HILLS, A. G. (1973). Acid-Base Balance-Chemistry, Physiology, Pathophysiology. Baltimore: Williamsand Wilkins.
HOUSTON, A. H. & MEADOW, K. M. (1979). [14C]PEG-4Ooo, chloride, chloride/potassium and sodiumspaces as indicators of extracellular phase volume in the tissues of rainbow trout Salmo gairdneri,Richardson. Comp. Biochem. Physiol. 6a A, 747-751.
KOBAYASHI, K. A. & WOOD, C. M. (1980). The response of the kidney of the fresh-water rainbow troutto true metabolic acidosis. J. exp. Biol. 84, 227-244.
LEIVESTAD, H. & MUNIZ, I. P. (1976). Fish kill at low pH in a Norwegian river. Nature, Lond. 359,391-392.
LEMANN, J. JR., LITZOW, J. R. & LENNON, E. J. ( I 966). The effects of chronic acid loads in normal man:further evidence for the participation of bone mineral in the defense against chronic metabolicacidosis. J. din. Invest. 45, 1608-1614.
MAETZ, J. (1973). Na+/NH,+, Na+/H+ exchanges and NH, movement across the gill of Carassiusauratus. J. exp. Biol. 58, 255-275.
MAETZ. J. (1974). Aspects of adaptation to hypo-osmotic and hyper-osmotic environments. In: Bio-chemical and Biophysical perspectives in Marine Biology, vol. 1. (ed. D. C. Malins and J. R. Sargent),pp. 1—167. London: Academic Press.
MCDONALD, D. G., H6BE, H. & WOOD, C. M. (1980). The influence of calcium on the physiologicalresponses of the rainbow trout, Salmo gairdneri, to low environmental pH. J. exp. Biol. 88, 109-131.
MCWILLIAMS, P. G. & POTTS, W. T. N. (1978). The effects of pH and calcium concentrations on gillpotentials in the brown trout, Salmo trutta. J. comp. Physiol. 126, 277-286.
n 8 D. G. MCDONALD AND C. M. WOOD
MUDGE, J. E. & NEFF, W. H. (1971). Sodium and potassium levels in serum of acid-exposed brookitrout, Salvelinus fontmalii. Proc. Pa Acad. Set. 45, 101-103. '
NEVILLE, C. M. (1979 a). Sublethal effects of environmental acidification on rainbow trout, Salmogairdneri. J. Fish. Res. Bd. Can. 36, 84-87.
NEVILLE, C. M. (19796). Influence of mild hypercapnia on the effects of environmental acidificationon rainbow trout, Salmo gairdneri. J. exp. Bid. 83, 343-349.
PACKER, R. K. (1979). Acid-base balance and gas exchange in brook trout, Salvelinus fontmalis exposedto acidic environments. J. exp. Biol. 79, 127-134.
PACKER, R. K. & DUNSON, W. A. (1970). Effects of low environmental pH on blood pH and sodiumbalance of brook trout. J. exp. Zool. 174, 65-72.
SIGMA, (1974). The Colorimetric Determination of Inorganic Phosphorous in Serum and Urine. SigmaTechnical Bulletin No. 670. Sigma Chemical Company, St Louis, Missouri.
SMITH, L. S. & BELL, G. R. (1964). A technique for prolonged blood sampling in free swimmingsalmon. J. Fish. Res. Bd. Can. ai, 711-717.
SOLORZANO, L. (1969). Determination of ammonia in natural waters by the phenolhypochlorite method.hirnnol. Oceanogr. 14, 799—801.
STEVENS, E. D. (1968). The effect of exercise on the distribution of blood to various organs in rainbowtrout. Comp. Biochem. Physiol. as, 615-625.
VAALA, S. S. & MITCHELL, R. R. (1970). Blood oxygen tension changes in acid exposed brook trout.Proc. Pa. Acad. Sci. 44, 41-44.
WOLF, K. (1963). Physiological salines for freshwater teleosts. Prog. Fish. Cult, as, 135-140.WOOD, C. M. & CALDWELL, F. H. (1978). Renal regulation of acid-base balance in a freshwater fish.
J. exp. Zool. 305, 301-307.WOOD, C. M. & RANDALL, D. J. (1973). The influence of swimming activity on sodium balance in the
rainbow trout, Salmo gairdneri. J. comp. Physiol. 82, 207-233.WOODBURY, J. W. (1974). Body acid-base state and its regulation. In: Physiology and Biophysics, vol. II,
20th ed. (ed. T. C. Ruch and H. D. Patton), Philadelphia: W. B. Saunders.