Embed Size (px)
Citation preview

Bridging the gapIncreasing coal production and sector augmentationJune 2016
www.pwc.in
ContentsForeword p2/ Message from PwC p3/ The coal sector in India: Target FY 2020 p4/ Scenario estimation vis-à-vis targets p10/ Outlook of coal demand and imports till FY 2020 p16/ Essentials for coal sector augmentation p21/ The way forward for the coal sector p29
PwC2
In India’s energy sector, coal accounts for the majority of primary commercial energy supply. With the economy poised to grow at the rate of 8–10% per annum, energy requirements will also rise at a reasonable level. Coal will continue to be a dominant commercial fuel two decades from now and beyond, despite our nuclear energy programme, development of natural gas supplies, increased hydropower generation, and emphasis on renewables.
The Indian coal industry aspires to reach the 1.5 billion tonne (BT) mark by FY 2020. In 2016, the industry will naturally need to focus on building on the success of 2015, and be on track for reaching the FY 2020 goal.
One of the primary goals of the Government of India is to ensure that it is able to meet the country’s power generation needs. Another aim is to lower the country’s reliance on coal imports by boosting the coal production quickly. India imports about 25% of its coal demand, much of which comes from Indonesia. The government expects that by 2017, it will not have to import coal, except to feed power plants located along the coast. Coal imports have shrunk by around 9% this year, according to the government, which is a positive trend.
The success of coal block auctions carried out by the new government has proved that its decision to conduct a ‘fair and transparent’ bidding for coal
However, there are many issues with regard to domestic coal production,
consumers, environmental impacts (both from mining and burning of
In this context, the Indian Chamber of Commerce (ICC) presents the 8th India Coal Summit to further strengthen its support amongst industry representatives and policymakers. PwC is the knowledge partner for this initiative. I trust the conference will be able to generate new ideas and new thoughts among the various stakeholders to discuss, share and evolve suitable strategies and development models.
Dr Rajeev Singh Director General Indian Chamber of Commerce (ICC)
Foreword
Bridging the gap I Increasing coal production and sector augmentation 3
The last two years have been a transition phase for the Indian mineral sector, with major policy changes happening to overhaul the entire sector. The slew of changes started with the restoration of coal allocation policies followed by changes in the allocation policies of other major minerals. The focus
timely development and production. These changes, especially in the coal sector, have redrafted the mineral sector landscape in the country. The movements in the global commodity markets have further added to the intensity of these changes and dynamism of the demand-supply equilibrium. The deallocation of 204 coal blocks by the Supreme Court of India, followed by the auction of coal blocks under the new regulatory regime, increase in the Clean Environment Cess (CEC) by eight times (since its introduction in July 2010), announcement of the auction of coal linkages for both power and non-regulated sector, announcement of blocks for commercial mining, etc., have changed the set proportions of the industry and developed intuitive waves among sector players and investors on what’s next.
As per estimates by the Government of India, coal demand in the country is expected to be in the range of 1.2 to 1.5 billion tonnes (BT) by FY 2020. The government had launched the ‘Power for All’ campaign in April 2015, under which it plans to provide affordable power to all houses by 2019. Despite being the third largest coal producing country in the world, India is dependent on imports to meet around 20–25% of its coal demand. India has more than 300 BT of coal reserves, out of which around 90% are non-coking coal reserves. But despite this, non-coking coal accounts for nearly 75–80% of the Indian coal imports. In order to meet this massive demand and minimise the imports of coal (especially non-coking coal), the government has put coal production in the country on fast track and has set a target of 1.5 BT of domestic coal production by FY 2020. To meet this target, the government has set a goal of 1 BT coal production for Coal India Limited (CIL) by FY 2020. The remaining 500 million tonnes (MT) is expected to be achieved by Singareni Collieries Company Limited (SCCL) and other public and private sector producers.
For the country to reach this ambitious target of 1.5 BT, all players—be it CIL, SCCL or block owners—would have to
their share. To achieve the coal production target of 1.5 BT, huge investment adding up to more than 10 lakh crore INR is required in coal mining and its allied sectors like power,
Message from PwCsteel, cement, infrastructure for logistics, and coal washeries. The government would also need to take steps to promote smooth land acquisition, easy availability of water, augment infrastructure for logistics, develop coal washeries, capacity building and skill development, etc., to provide the support system for developing a cohesive environment for achieving the coal production target.
Given the various policy developments in domestic coal sources and global turmoil in the coal market, the demand-supply dynamics in the country is expected to undergo a great degree of change and variation as compared to its historical establishment, as coal consumers see more options now and may be in a catch-22 situation on the available options. The auction of coal blocks have made a substantial quantum of coal resources available with consumers, but the challenges remain in maintaining sustainable economics of projects at the quoted prices. The industry players may prioritise asset utilisation over aggressive asset generation (by procuring additional coal resources) to mitigate the risks of developing non-performing assets. A cautious approach from the government and coal consumers is required to ensure that there is clarity on the market dynamics. The government should therefore focus more on sustainable augmentation of the sector and try to achieve maximum exploitation of the resources available in the market before adding more resources to meet the near-term demand. The government and private coal producing companies may also need to focus on technological advancements, addressing issues pertaining to land acquisition, manpower availability, water supply, etc., in order to run this production growth apace.
This publication discusses the various scenarios of domestic coal production vis-à-vis the target set by the ministry for FY 2020, considering a demand linked to the gross development product (GDP) growth rate of the country. This also discusses the steps to be taken by the ministry in order to support the growth of the sector and meet the coal demand in a sustainable manner.
Kameswara Rao Leader, Energy, Utilities and Mining
Pukhraj Sethiya Associate Director, Mining and Metals
PwC4
1 The coal sector in India: Target FY 2020
Dissection of coal supplies in IndiaIndia is the third largest coal producer in the world after China and the US. The total coal production in India was around 612 million tonnes (MT) in FY 2015, which has increased to 626 MT in FY 2016. Ninety per cent of the domestic production
Percentage fulfilment by imports
12% 11%
16%
21%
23%
26%
24%
0%
5%
10%
15%
20%
25%
30%
FY 2010 FY 2011 FY 2012 FY 2013 FY 2014 FY 2015 FY 2016
Source: Ministry of Coal, PwC analysis
comes from public sector coal producers while only 10% is produced by the private sector. India imported a total of 212 MT of coal in FY 2015 and 193 MT in FY 2016, which is equivalent to one-fourth of the domestic coal consumption in the country based on tonnage.
Bridging the gap I Increasing coal production and sector augmentation 5
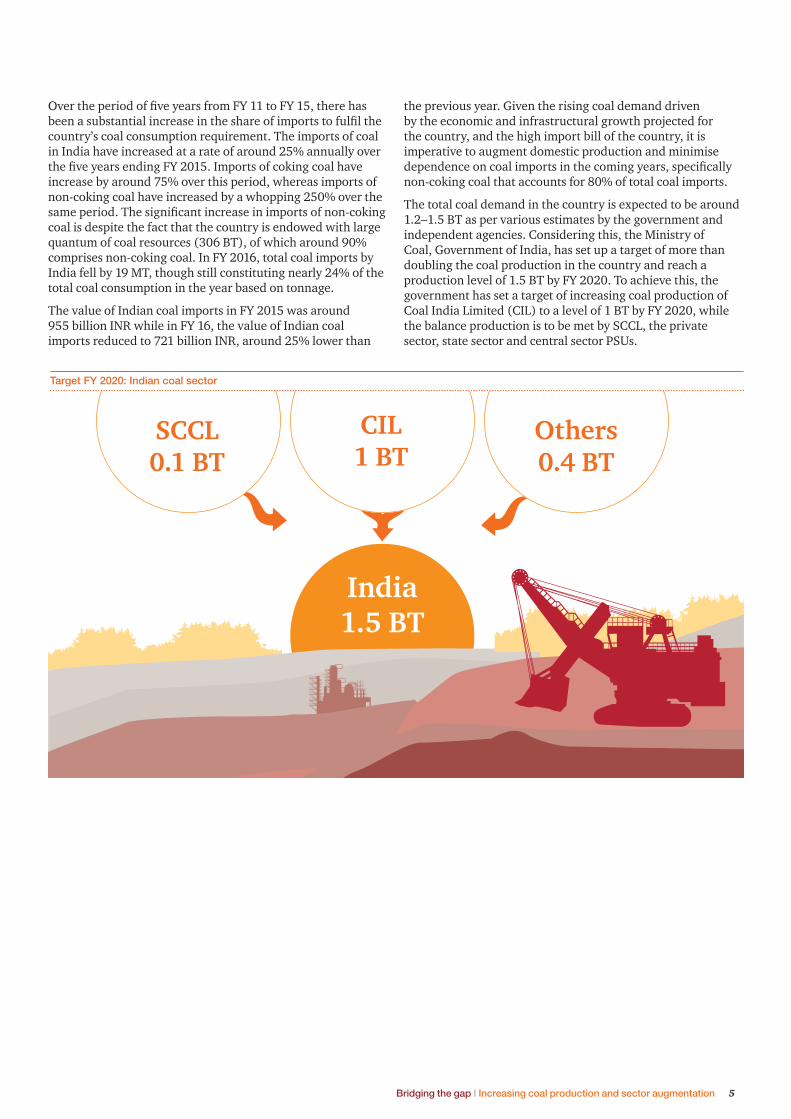
Target FY 2020: Indian coal sector
country’s coal consumption requirement. The imports of coal in India have increased at a rate of around 25% annually over
increase by around 75% over this period, whereas imports of non-coking coal have increased by a whopping 250% over the
coal is despite the fact that the country is endowed with large quantum of coal resources (306 BT), of which around 90% comprises non-coking coal. In FY 2016, total coal imports by India fell by 19 MT, though still constituting nearly 24% of the total coal consumption in the year based on tonnage.
The value of Indian coal imports in FY 2015 was around 955 billion INR while in FY 16, the value of Indian coal imports reduced to 721 billion INR, around 25% lower than
the previous year. Given the rising coal demand driven by the economic and infrastructural growth projected for the country, and the high import bill of the country, it is imperative to augment domestic production and minimise
non-coking coal that accounts for 80% of total coal imports.
The total coal demand in the country is expected to be around 1.2–1.5 BT as per various estimates by the government and independent agencies. Considering this, the Ministry of Coal, Government of India, has set up a target of more than doubling the coal production in the country and reach a production level of 1.5 BT by FY 2020. To achieve this, the government has set a target of increasing coal production of Coal India Limited (CIL) to a level of 1 BT by FY 2020, while the balance production is to be met by SCCL, the private sector, state sector and central sector PSUs.
SCCL0.1 BT
CIL1 BT
India1.5 BT
Others0.4 BT
PwC6
Background of coal block allocation and production targetsThe Indian coal sector has a history that dates back nearly 220 years. After independence, the coal production in the country stood at around 33 MT. In the early 70s, given the rising demand for investment in the sector and the challenges being faced by the sector, the government took a
coking coal mines, except those of the Indian Iron & Steel Company (IISCO), Tata Iron and Steel Company (TISCO)
and nationalised on 1 May 1972. In the second stage, all 771 non-coking mines were taken over and nationalised on 1 May 1973. CIL was formed in November 1975 as a holding company of all these mines.
On 14 July 1992, an inter-ministerial and intergovernmental body and screening committee was constituted through an administrative order of the Ministry of Coal for allocating coal blocks for captive mining. Accordingly, 218 coal blocks were allocated to a number of companies for captive use in various sectors. Of the 218 coal blocks, 132 blocks were allotted through the screening committee, 72 blocks were allotted under government dispensation, 12 blocks were allotted for ultra mega power projects (UMPP), and two blocks were allotted for coal to liquid (CTL).
Competitive bidding was introduced for allocation of coal/lignite blocks in September 2010 by amendment of the Mines and Minerals (Development and Regulation) Act, 1957, (MMDR Act). On 2 February 2012, in exercise of the powers conferred by clause (d) of subsection (2) of the MMDR Act, 1957, the central government introduced rules for auctioning coal blocks via competitive bidding—‘the Auction by Competitive Bidding of Coal Mines Rules, 2012’. The government allotted 14 coal blocks to public sector companies under these rules in FY 2013.
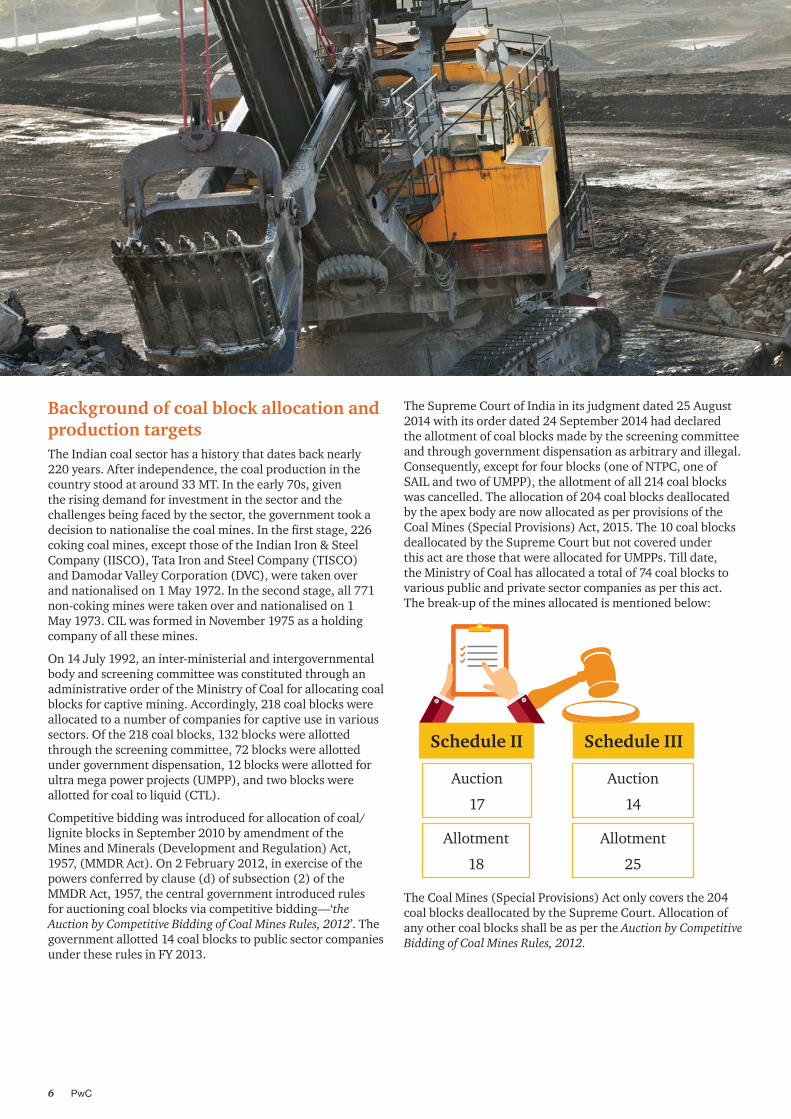
The Supreme Court of India in its judgment dated 25 August 2014 with its order dated 24 September 2014 had declared the allotment of coal blocks made by the screening committee and through government dispensation as arbitrary and illegal. Consequently, except for four blocks (one of NTPC, one of SAIL and two of UMPP), the allotment of all 214 coal blocks was cancelled. The allocation of 204 coal blocks deallocated by the apex body are now allocated as per provisions of the Coal Mines (Special Provisions) Act, 2015. The 10 coal blocks deallocated by the Supreme Court but not covered under this act are those that were allocated for UMPPs. Till date, the Ministry of Coal has allocated a total of 74 coal blocks to various public and private sector companies as per this act. The break-up of the mines allocated is mentioned below:
Schedule II Schedule III
Auction
17
Allotment
18
Auction
14
Allotment
25
The Coal Mines (Special Provisions) Act only covers the 204 coal blocks deallocated by the Supreme Court. Allocation of any other coal blocks shall be as per the Auction by Competitive Bidding of Coal Mines Rules, 2012.
Bridging the gap I Increasing coal production and sector augmentation 7
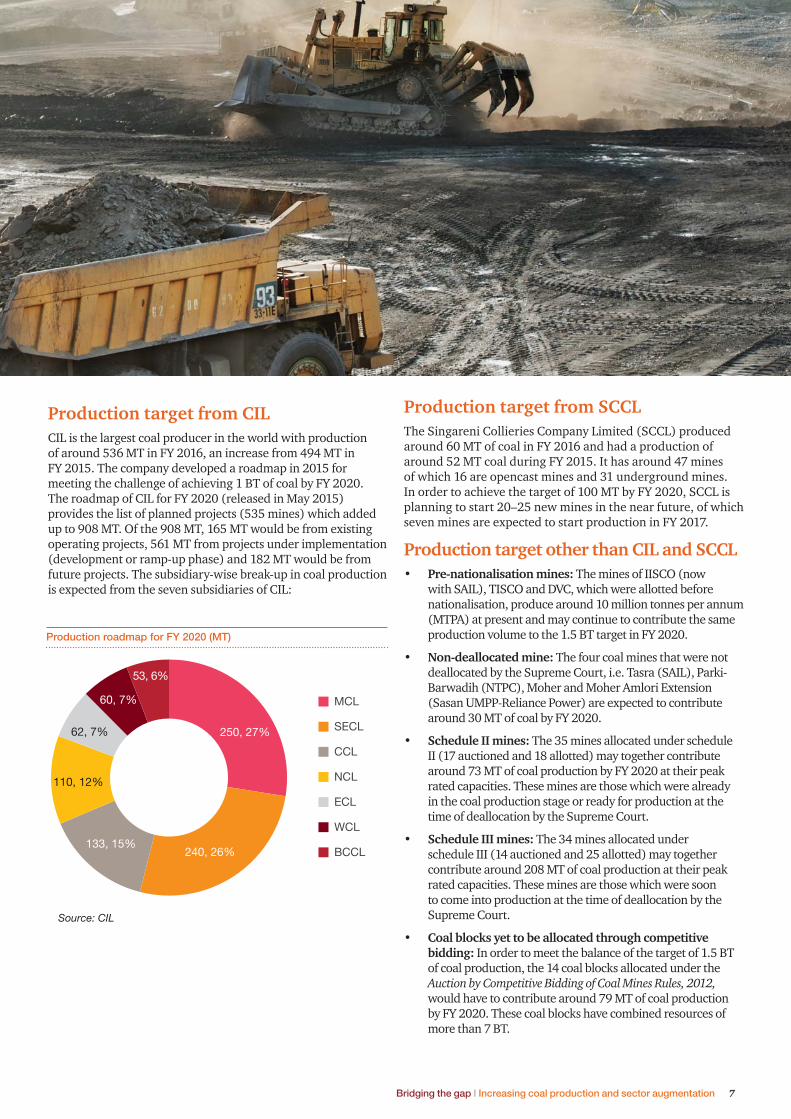
Production target from CILCIL is the largest coal producer in the world with production of around 536 MT in FY 2016, an increase from 494 MT in FY 2015. The company developed a roadmap in 2015 for meeting the challenge of achieving 1 BT of coal by FY 2020. The roadmap of CIL for FY 2020 (released in May 2015) provides the list of planned projects (535 mines) which added up to 908 MT. Of the 908 MT, 165 MT would be from existing operating projects, 561 MT from projects under implementation (development or ramp-up phase) and 182 MT would be from future projects. The subsidiary-wise break-up in coal production is expected from the seven subsidiaries of CIL:
250, 27%
240, 26%133, 15%
110, 12%
62, 7%
60, 7%
53, 6%
MCL
SECL
CCL
NCL
ECL
WCL
BCCL
Production roadmap for FY 2020 (MT)
Source: CIL
Production target from SCCLThe Singareni Collieries Company Limited (SCCL) produced around 60 MT of coal in FY 2016 and had a production of around 52 MT coal during FY 2015. It has around 47 mines of which 16 are opencast mines and 31 underground mines. In order to achieve the target of 100 MT by FY 2020, SCCL is planning to start 20–25 new mines in the near future, of which seven mines are expected to start production in FY 2017.
Production target other than CIL and SCCL• Pre-nationalisation mines: The mines of IISCO (now
nationalisation, produce around 10 million tonnes per annum (MTPA) at present and may continue to contribute the same production volume to the 1.5 BT target in FY 2020.
• Non-deallocated mine: The four coal mines that were not deallocated by the Supreme Court, i.e. Tasra (SAIL), Parki-Barwadih (NTPC), Moher and Moher Amlori Extension (Sasan UMPP-Reliance Power) are expected to contribute around 30 MT of coal by FY 2020.
• Schedule II mines: The 35 mines allocated under schedule II (17 auctioned and 18 allotted) may together contribute around 73 MT of coal production by FY 2020 at their peak rated capacities. These mines are those which were already in the coal production stage or ready for production at the time of deallocation by the Supreme Court.
• Schedule III mines: The 34 mines allocated under schedule III (14 auctioned and 25 allotted) may together contribute around 208 MT of coal production at their peak rated capacities. These mines are those which were soon to come into production at the time of deallocation by the Supreme Court.
• Coal blocks yet to be allocated through competitive bidding: In order to meet the balance of the target of 1.5 BT of coal production, the 14 coal blocks allocated under the Auction by Competitive Bidding of Coal Mines Rules, 2012, would have to contribute around 79 MT of coal production by FY 2020. These coal blocks have combined resources of more than 7 BT.
PwC8
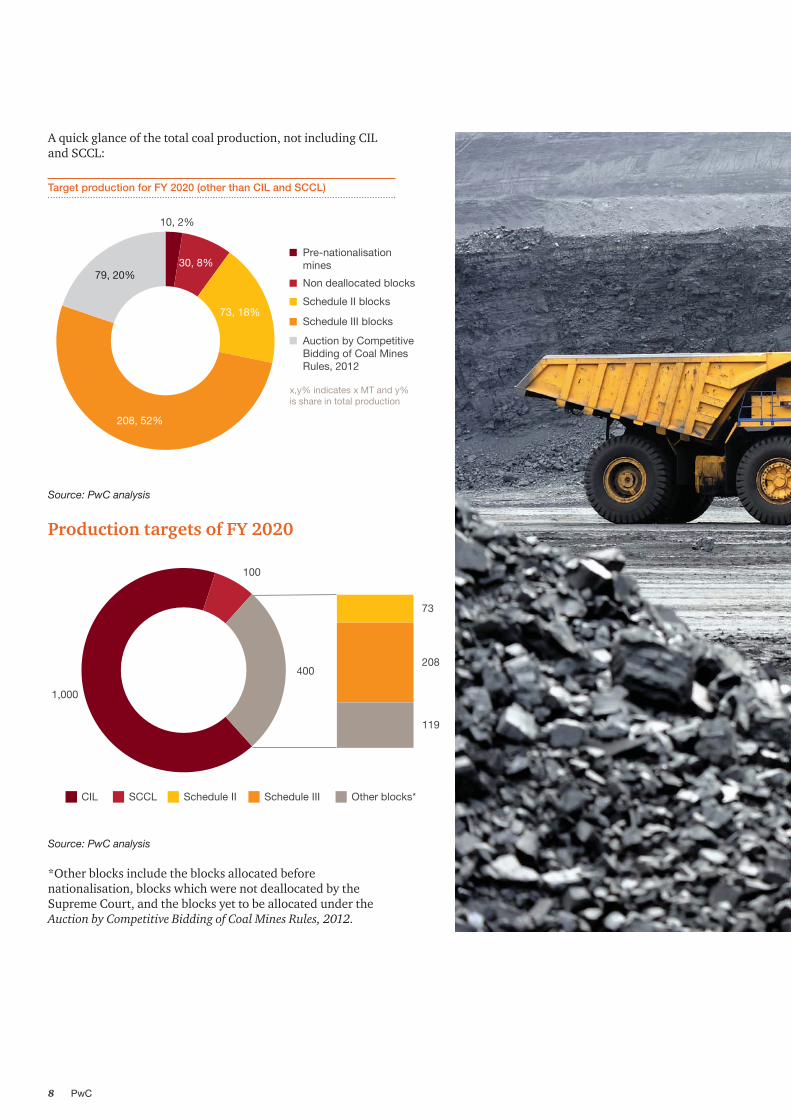
A quick glance of the total coal production, not including CIL and SCCL:
10, 2%
30, 8%
73, 18%
208, 52%
79, 20%
Pre-nationalisation mines
Non deallocated blocks
Schedule II blocks
Schedule III blocks
Auction by Competitive Bidding of Coal Mines Rules, 2012
x,y% indicates x MT and y% is share in total production
Target production for FY 2020 (other than CIL and SCCL)
Source: PwC analysis
Production targets of FY 2020
1,000
100
73
208
119
400
CIL SCCL Schedule II Schedule III Other blocks*
Source: PwC analysis
*Other blocks include the blocks allocated before nationalisation, blocks which were not deallocated by the Supreme Court, and the blocks yet to be allocated under the Auction by Competitive Bidding of Coal Mines Rules, 2012.
Bridging the gap I Increasing coal production and sector augmentation 9
PwC10
2 Scenario estimation vis-à-vis targets
The target of 1.5 BT of domestic coal production in FY 2020 is ambitious and challenging. This section analyses the various production scenarios for CIL, SCCL and others coal blocks based on production plans, historic performance and progress of upcoming and future projects.
Production from CIL minesIn FY 16, CIL was operating 430 mines. In its roadmap, CIL has planned to achieve 908 MT from 535 coal mines in FY 2020. Thus, CIL’s total number of operating mines will increase at an average of 26 per year till FY 2020. As per a presentation by the Central Mine Planning and Design Institute (CMPDI ), dated 20 January 2015, additional nine projects with a capacity of 17 MTPA have already received in-principal approval while another 15 mines with combined capacity of 29 MTPA are awaiting approval from CIL and/or its subsidiaries. Typically, it has been observed that it
production after the commencement of the development
rated capacity production till FY 2020.
CIL increased its production by 9% last year, which is
10 years, when its production grew at a compound annual
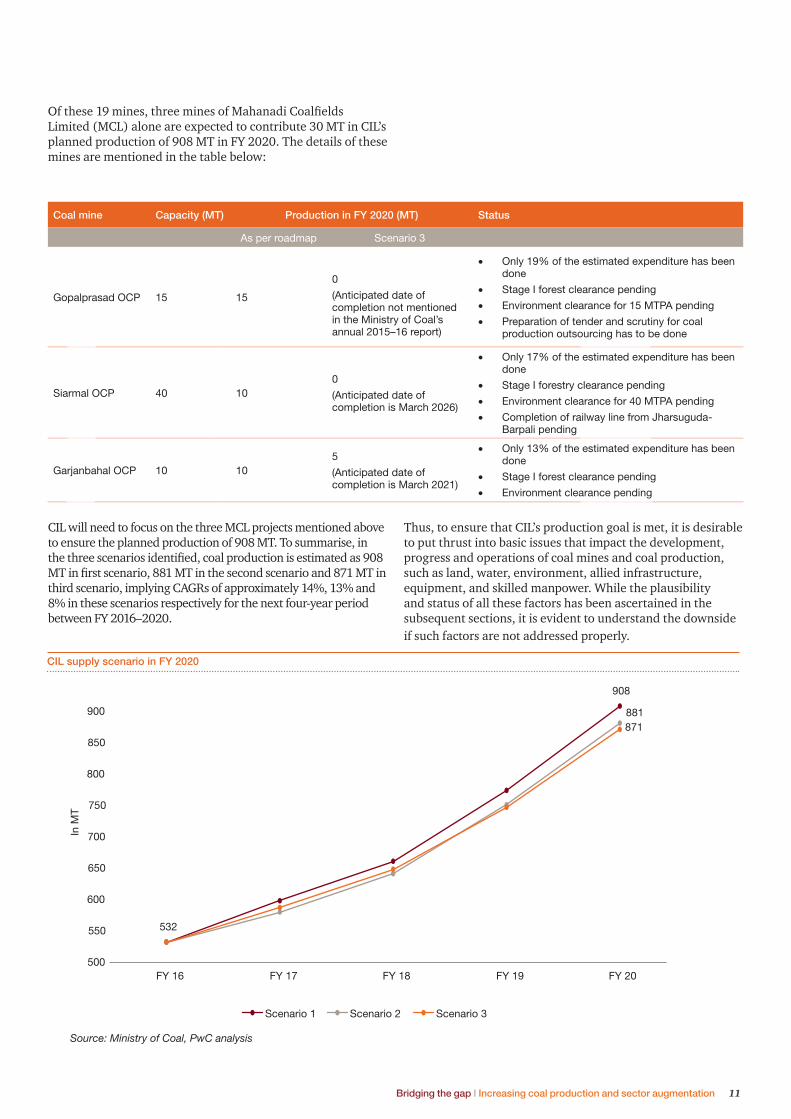
growth rate (CAGR) of only 6%. Hence, in this base case (Scenario 1), CIL is expected to reach up to 908 MT by FY 2020. In order to achieve this target, CIL is required to increase its production at a CAGR of 14% between FY 16 and
achieved by CIL is around 97% and thus the same is considered as the most likely scenario. In case such a trend continues and CIL ensures to meet at least 97% of the annual target, CIL would be able to achieve up to 881 MT by FY 2020 (Scenario 2) which would require a CAGR of 13%.
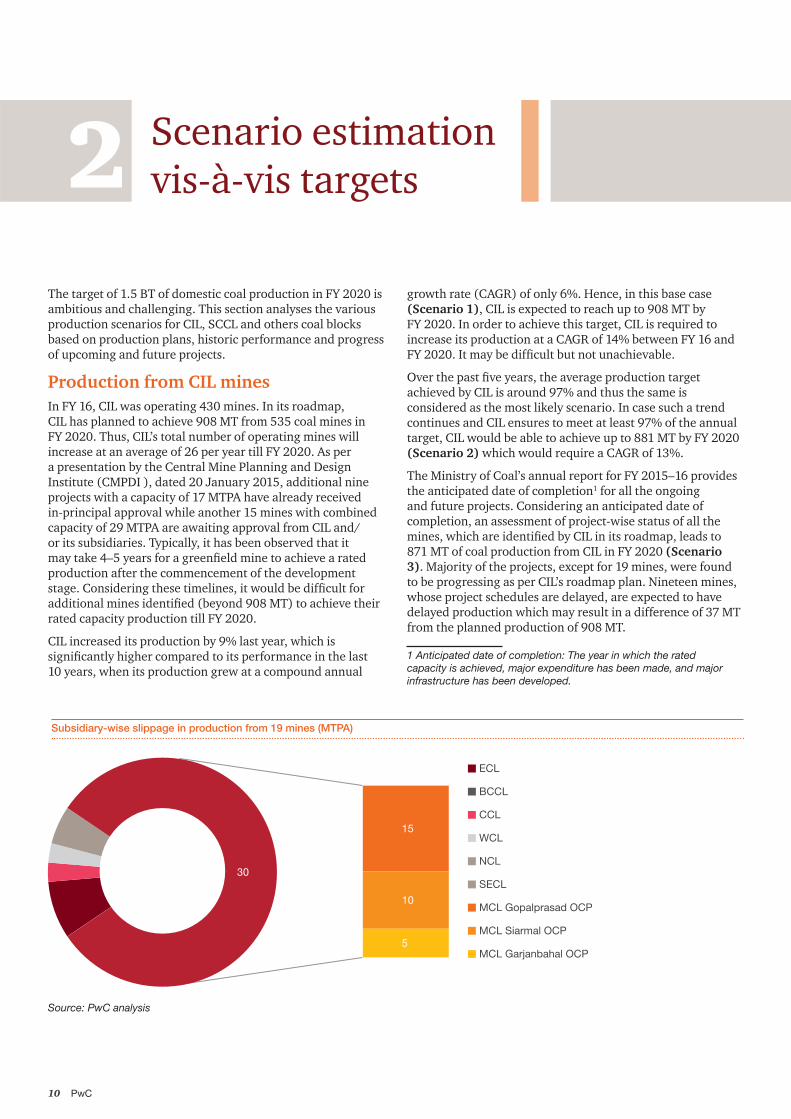
The Ministry of Coal’s annual report for FY 2015–16 provides the anticipated date of completion1 for all the ongoing and future projects. Considering an anticipated date of completion, an assessment of project-wise status of all the
871 MT of coal production from CIL in FY 2020 (Scenario 3). Majority of the projects, except for 19 mines, were found to be progressing as per CIL’s roadmap plan. Nineteen mines, whose project schedules are delayed, are expected to have delayed production which may result in a difference of 37 MT from the planned production of 908 MT.
1 Anticipated date of completion: The year in which the rated
capacity is achieved, major expenditure has been made, and major
infrastructure has been developed.
Subsidiary-wise slippage in production from 19 mines (MTPA)
15
10
5
30
ECL
BCCL
CCL
WCL
NCL
SECL
MCL Gopalprasad OCP
MCL Siarmal OCP
MCL Garjanbahal OCP
Source: PwC analysis
Bridging the gap I Increasing coal production and sector augmentation 11
CIL supply scenario in FY 2020
Limited (MCL) alone are expected to contribute 30 MT in CIL’s planned production of 908 MT in FY 2020. The details of these mines are mentioned in the table below:
Coal mine Capacity (MT) Production in FY 2020 (MT) Status
As per roadmap Scenario 3
Gopalprasad OCP 15 15
0
(Anticipated date of completion not mentioned in the Ministry of Coal’s annual 2015–16 report)
Only 19% of the estimated expenditure has been done
Stage I forest clearance pending
Environment clearance for 15 MTPA pending
Preparation of tender and scrutiny for coal production outsourcing has to be done
Siarmal OCP 40 100
(Anticipated date of completion is March 2026)
Only 17% of the estimated expenditure has been done
Stage I forestry clearance pending
Environment clearance for 40 MTPA pending
Completion of railway line from Jharsuguda-Barpali pending
Garjanbahal OCP 10 105
(Anticipated date of completion is March 2021)
Only 13% of the estimated expenditure has been done
Stage I forest clearance pending
Environment clearance pending
CIL will need to focus on the three MCL projects mentioned above to ensure the planned production of 908 MT. To summarise, in
third scenario, implying CAGRs of approximately 14%, 13% and 8% in these scenarios respectively for the next four-year period between FY 2016–2020.
Thus, to ensure that CIL’s production goal is met, it is desirable to put thrust into basic issues that impact the development, progress and operations of coal mines and coal production, such as land, water, environment, allied infrastructure, equipment, and skilled manpower. While the plausibility and status of all these factors has been ascertained in the subsequent sections, it is evident to understand the downside if such factors are not addressed properly.
908
881
532
871
500
550
600
650
700
750
800
850
900
FY 16 FY 17 FY 18 FY 19 FY 20
In M
T
Scenario 1 Scenario 2 Scenario 3
Source: Ministry of Coal, PwC analysis
PwC12
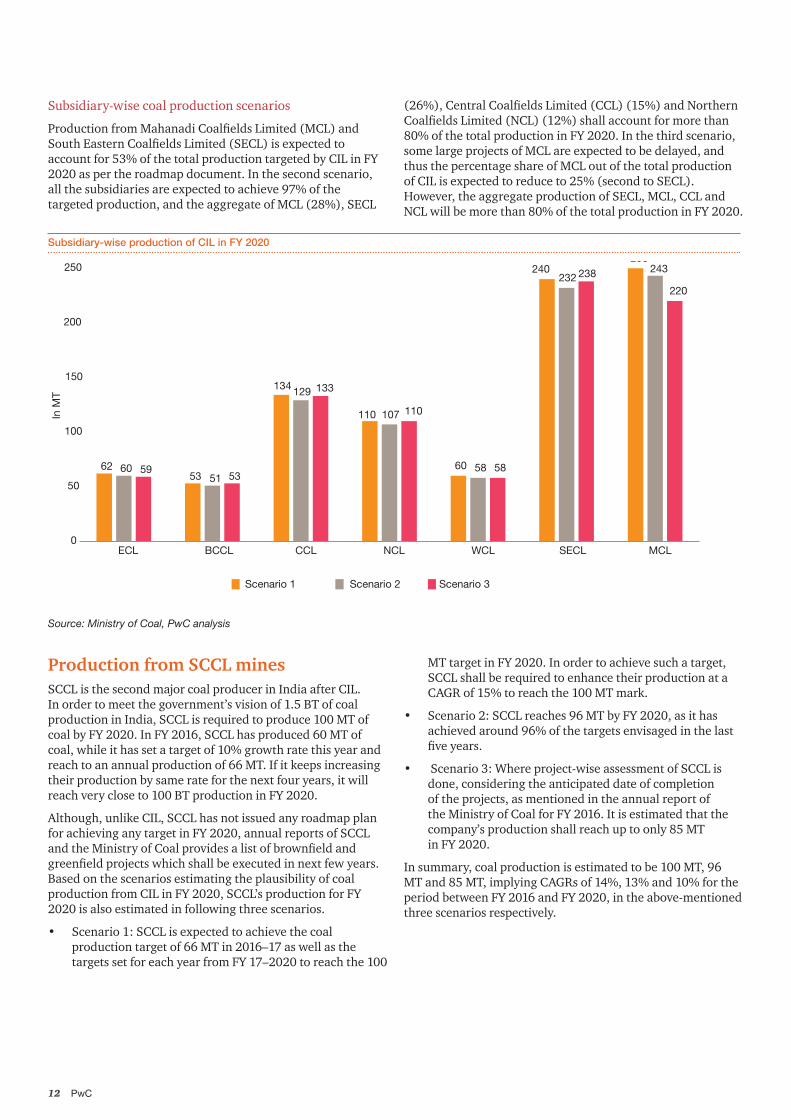
Subsidiary-wise coal production scenarios
account for 53% of the total production targeted by CIL in FY 2020 as per the roadmap document. In the second scenario, all the subsidiaries are expected to achieve 97% of the targeted production, and the aggregate of MCL (28%), SECL
80% of the total production in FY 2020. In the third scenario, some large projects of MCL are expected to be delayed, and thus the percentage share of MCL out of the total production of CIL is expected to reduce to 25% (second to SECL). However, the aggregate production of SECL, MCL, CCL and NCL will be more than 80% of the total production in FY 2020.
Source: Ministry of Coal, PwC analysis
6253
134
110
60
240250
6051
129
107
58
232243
5953
133
110
58
238
220
0
50
100
150
200
250
ECL BCCL CCL NCL WCL SECL MCL
In M
T
Scenario 1 Scenario 2 Scenario 3
Subsidiary-wise production of CIL in FY 2020
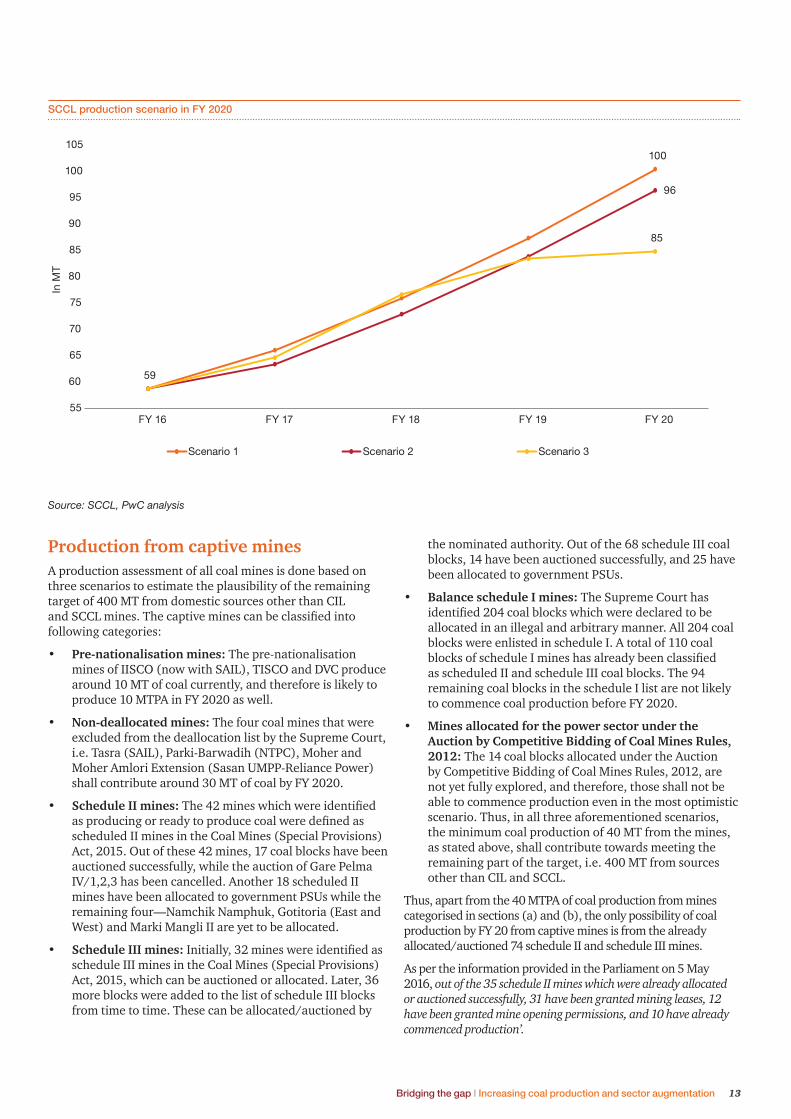
Production from SCCL minesSCCL is the second major coal producer in India after CIL. In order to meet the government’s vision of 1.5 BT of coal production in India, SCCL is required to produce 100 MT of coal by FY 2020. In FY 2016, SCCL has produced 60 MT of coal, while it has set a target of 10% growth rate this year and reach to an annual production of 66 MT. If it keeps increasing their production by same rate for the next four years, it will reach very close to 100 BT production in FY 2020.
Although, unlike CIL, SCCL has not issued any roadmap plan for achieving any target in FY 2020, annual reports of SCCL
Based on the scenarios estimating the plausibility of coal production from CIL in FY 2020, SCCL’s production for FY 2020 is also estimated in following three scenarios.
• Scenario 1: SCCL is expected to achieve the coal production target of 66 MT in 2016–17 as well as the targets set for each year from FY 17–2020 to reach the 100
MT target in FY 2020. In order to achieve such a target, SCCL shall be required to enhance their production at a CAGR of 15% to reach the 100 MT mark.
• Scenario 2: SCCL reaches 96 MT by FY 2020, as it has achieved around 96% of the targets envisaged in the last
• Scenario 3: Where project-wise assessment of SCCL is done, considering the anticipated date of completion of the projects, as mentioned in the annual report of the Ministry of Coal for FY 2016. It is estimated that the company’s production shall reach up to only 85 MT in FY 2020.
In summary, coal production is estimated to be 100 MT, 96 MT and 85 MT, implying CAGRs of 14%, 13% and 10% for the period between FY 2016 and FY 2020, in the above-mentioned three scenarios respectively.
Bridging the gap I Increasing coal production and sector augmentation 13
SCCL production scenario in FY 2020
Production from captive minesA production assessment of all coal mines is done based on three scenarios to estimate the plausibility of the remaining target of 400 MT from domestic sources other than CIL
• Pre-nationalisation mines: The pre-nationalisation
around 10 MT of coal currently, and therefore is likely to produce 10 MTPA in FY 2020 as well.
• Non-deallocated mines: The four coal mines that were excluded from the deallocation list by the Supreme Court, i.e. Tasra (SAIL), Parki-Barwadih (NTPC), Moher and Moher Amlori Extension (Sasan UMPP-Reliance Power) shall contribute around 30 MT of coal by FY 2020.
• Schedule II mines:
scheduled II mines in the Coal Mines (Special Provisions) Act, 2015. Out of these 42 mines, 17 coal blocks have been auctioned successfully, while the auction of Gare Pelma
mines have been allocated to government PSUs while the remaining four—Namchik Namphuk, Gotitoria (East and West) and Marki Mangli II are yet to be allocated.
• Schedule III mines:schedule III mines in the Coal Mines (Special Provisions) Act, 2015, which can be auctioned or allocated. Later, 36 more blocks were added to the list of schedule III blocks from time to time. These can be allocated/auctioned by
100
96
59
85
55
60
65
70
75
80
85
90
95
100
105
FY 16 FY 17 FY 18 FY 19 FY 20
In M
T
Scenario 1 Scenario 2 Scenario 3
the nominated authority. Out of the 68 schedule III coal blocks, 14 have been auctioned successfully, and 25 have been allocated to government PSUs.
• Balance schedule I mines: The Supreme Court has
allocated in an illegal and arbitrary manner. All 204 coal blocks were enlisted in schedule I. A total of 110 coal
as scheduled II and schedule III coal blocks. The 94 remaining coal blocks in the schedule I list are not likely to commence coal production before FY 2020.
• Mines allocated for the power sector under the Auction by Competitive Bidding of Coal Mines Rules, 2012: The 14 coal blocks allocated under the Auction by Competitive Bidding of Coal Mines Rules, 2012, are not yet fully explored, and therefore, those shall not be able to commence production even in the most optimistic scenario. Thus, in all three aforementioned scenarios, the minimum coal production of 40 MT from the mines, as stated above, shall contribute towards meeting the remaining part of the target, i.e. 400 MT from sources other than CIL and SCCL.
Thus, apart from the 40 MTPA of coal production from mines categorised in sections (a) and (b), the only possibility of coal production by FY 20 from captive mines is from the already allocated/auctioned 74 schedule II and schedule III mines.
As per the information provided in the Parliament on 5 May 2016, out of the 35 schedule II mines which were already allocated or auctioned successfully, 31 have been granted mining leases, 12 have been granted mine opening permissions, and 10 have already commenced production’.
Source: SCCL, PwC analysis
PwC14
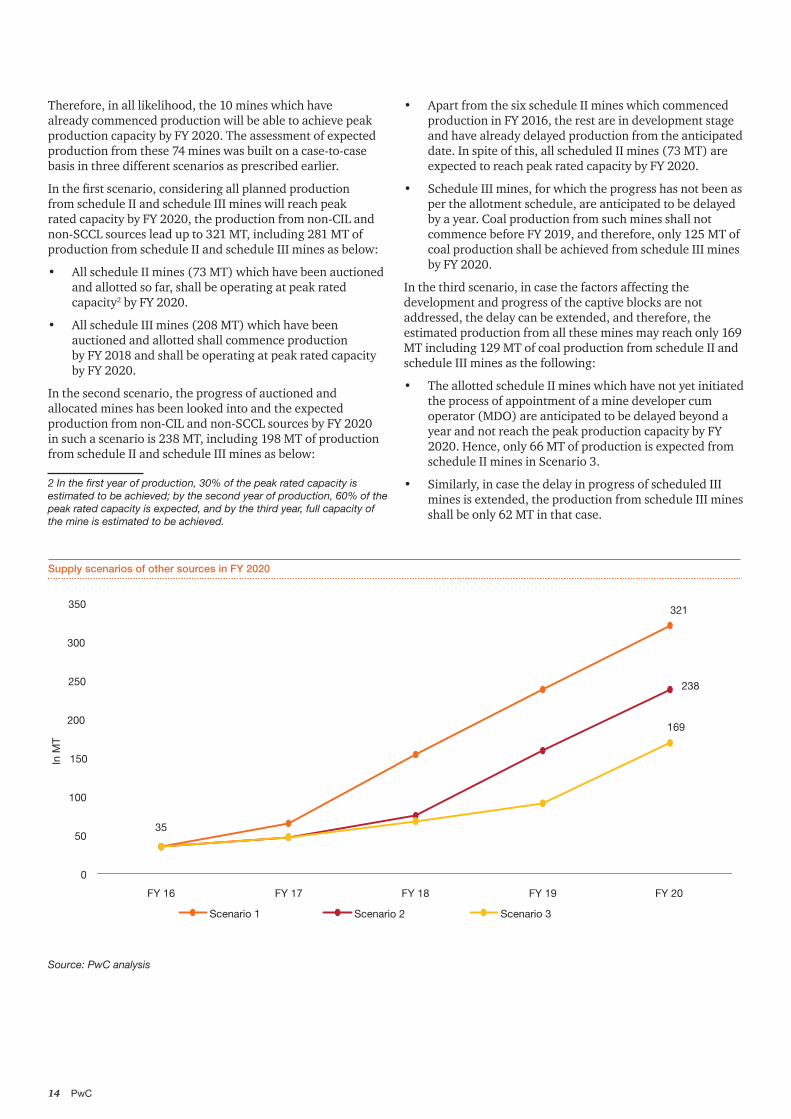
Therefore, in all likelihood, the 10 mines which have already commenced production will be able to achieve peak production capacity by FY 2020. The assessment of expected production from these 74 mines was built on a case-to-case basis in three different scenarios as prescribed earlier.
from schedule II and schedule III mines will reach peak rated capacity by FY 2020, the production from non-CIL and non-SCCL sources lead up to 321 MT, including 281 MT of production from schedule II and schedule III mines as below:
• All schedule II mines (73 MT) which have been auctioned and allotted so far, shall be operating at peak rated capacity2 by FY 2020.
• All schedule III mines (208 MT) which have been auctioned and allotted shall commence production by FY 2018 and shall be operating at peak rated capacity by FY 2020.
In the second scenario, the progress of auctioned and allocated mines has been looked into and the expected production from non-CIL and non-SCCL sources by FY 2020 in such a scenario is 238 MT, including 198 MT of production from schedule II and schedule III mines as below:
the mine is estimated to be achieved.
• Apart from the six schedule II mines which commenced production in FY 2016, the rest are in development stage and have already delayed production from the anticipated date. In spite of this, all scheduled II mines (73 MT) are expected to reach peak rated capacity by FY 2020.
• Schedule III mines, for which the progress has not been as per the allotment schedule, are anticipated to be delayed by a year. Coal production from such mines shall not commence before FY 2019, and therefore, only 125 MT of coal production shall be achieved from schedule III mines by FY 2020.
In the third scenario, in case the factors affecting the development and progress of the captive blocks are not addressed, the delay can be extended, and therefore, the estimated production from all these mines may reach only 169 MT including 129 MT of coal production from schedule II and schedule III mines as the following:
• The allotted schedule II mines which have not yet initiated the process of appointment of a mine developer cum operator (MDO) are anticipated to be delayed beyond a year and not reach the peak production capacity by FY 2020. Hence, only 66 MT of production is expected from schedule II mines in Scenario 3.
• Similarly, in case the delay in progress of scheduled III mines is extended, the production from schedule III mines shall be only 62 MT in that case.
321
238
35
169
0
50
100
150
200
250
300
350
FY 16 FY 17 FY 18 FY 19 FY 20
In M
T
Scenario 1 Scenario 2 Scenario 3
Source: PwC analysis
Supply scenarios of other sources in FY 2020
Bridging the gap I Increasing coal production and sector augmentation 15
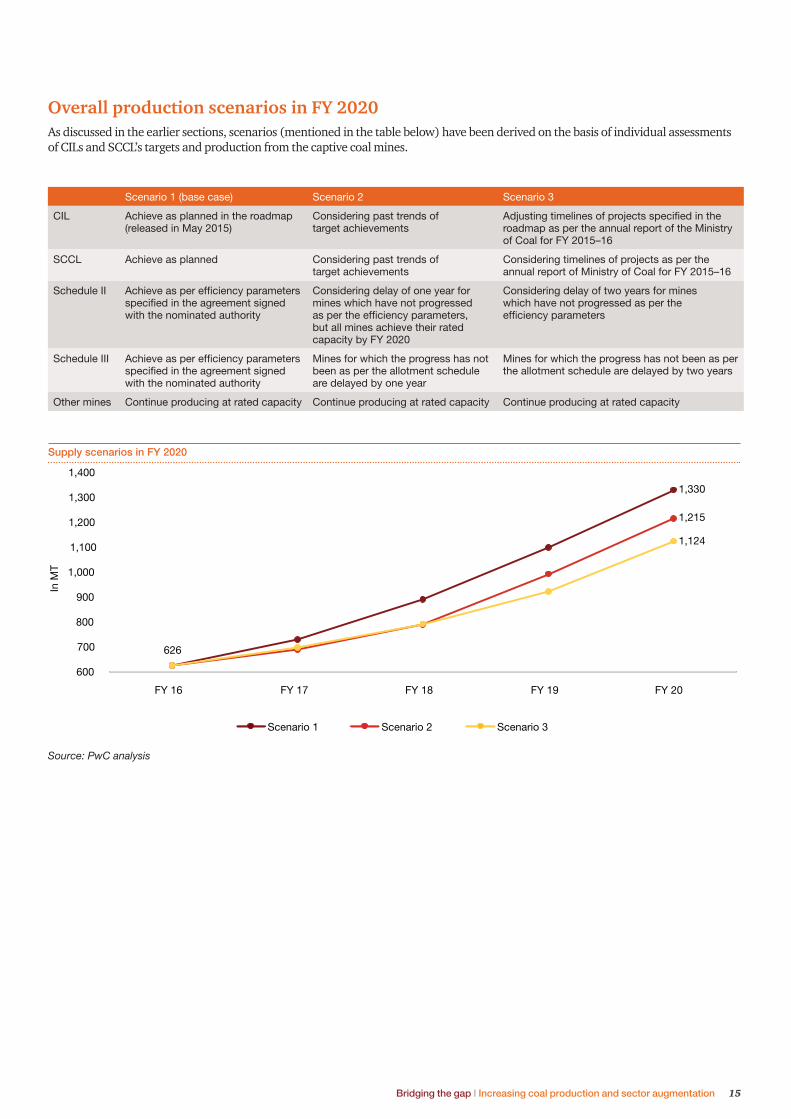
Overall production scenarios in FY 2020As discussed in the earlier sections, scenarios (mentioned in the table below) have been derived on the basis of individual assessments of CILs and SCCL’s targets and production from the captive coal mines.
Scenario 1 (base case) Scenario 2 Scenario 3
CIL Achieve as planned in the roadmap (released in May 2015)
Considering past trends of target achievements
Adjusting timelines of projects specified in the roadmap as per the annual report of the Ministry of Coal for FY 2015–16
SCCL Achieve as planned Considering past trends of target achievements
Considering timelines of projects as per the annual report of Ministry of Coal for FY 2015–16
Schedule II Achieve as per efficiency parameters specified in the agreement signed with the nominated authority
Considering delay of one year for mines which have not progressed as per the efficiency parameters, but all mines achieve their rated capacity by FY 2020
Considering delay of two years for mines which have not progressed as per the efficiency parameters
Schedule III Achieve as per efficiency parameters specified in the agreement signed with the nominated authority
Mines for which the progress has not been as per the allotment schedule are delayed by one year
Mines for which the progress has not been as per the allotment schedule are delayed by two years
Other mines Continue producing at rated capacity Continue producing at rated capacity Continue producing at rated capacity
1,330
1,215
626
1,124
600
700
800
900
1,000
1,100
1,200
1,300
1,400
FY 16 FY 17 FY 18 FY 19 FY 20
In M
T
Scenario 1 Scenario 2 Scenario 3
Source: PwC analysis
Supply scenarios in FY 2020
PwC16
3 Outlook of coal demand and imports till FY 2020
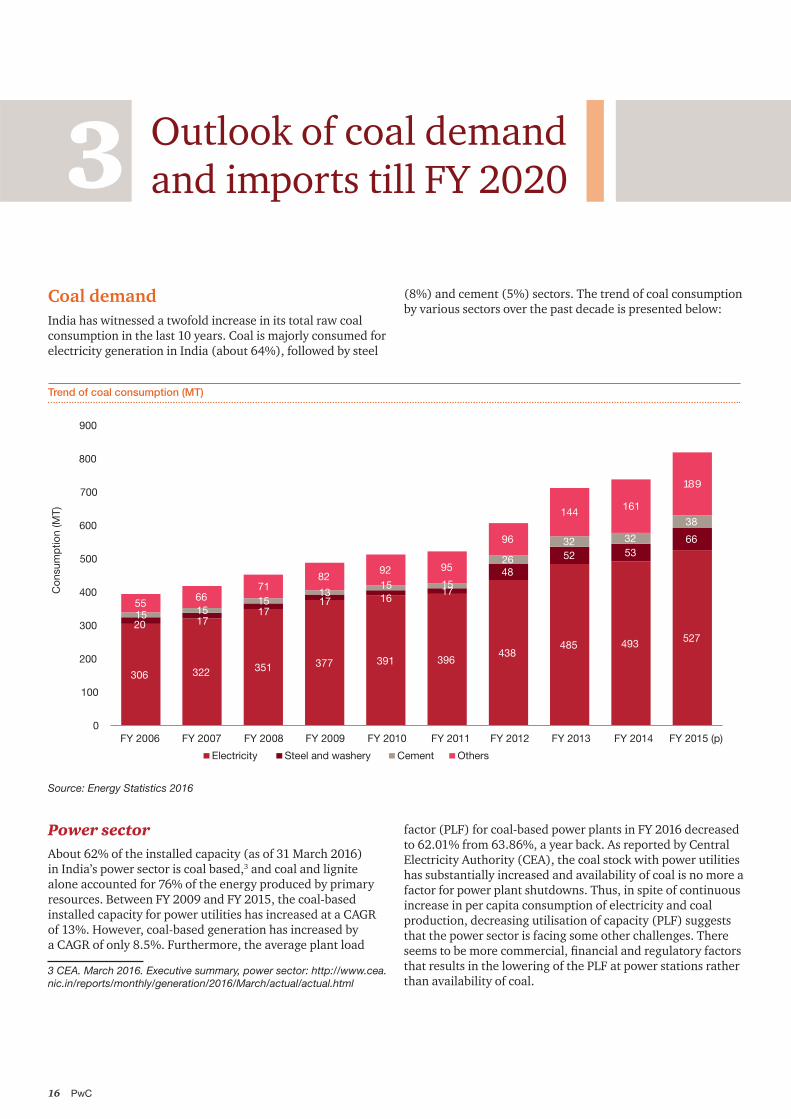
Coal demandIndia has witnessed a twofold increase in its total raw coal consumption in the last 10 years. Coal is majorly consumed for electricity generation in India (about 64%), followed by steel
(8%) and cement (5%) sectors. The trend of coal consumption by various sectors over the past decade is presented below:
Trend of coal consumption (MT)
306 322 351 377 391 396438
485 493 52720 17
1717 16
17
48
52 5366
15 1515
1315 15
26
32 32
38
5566
7182
92 95
96
144 161
189
0
100
200
300
400
500
600
700
800
900
FY 2006 FY 2007 FY 2008 FY 2009 FY 2010 FY 2011 FY 2012 FY 2013 FY 2014 FY 2015 (p)
Con
sum
ptio
n (M
T)
Electricity Steel and washery Cement Others
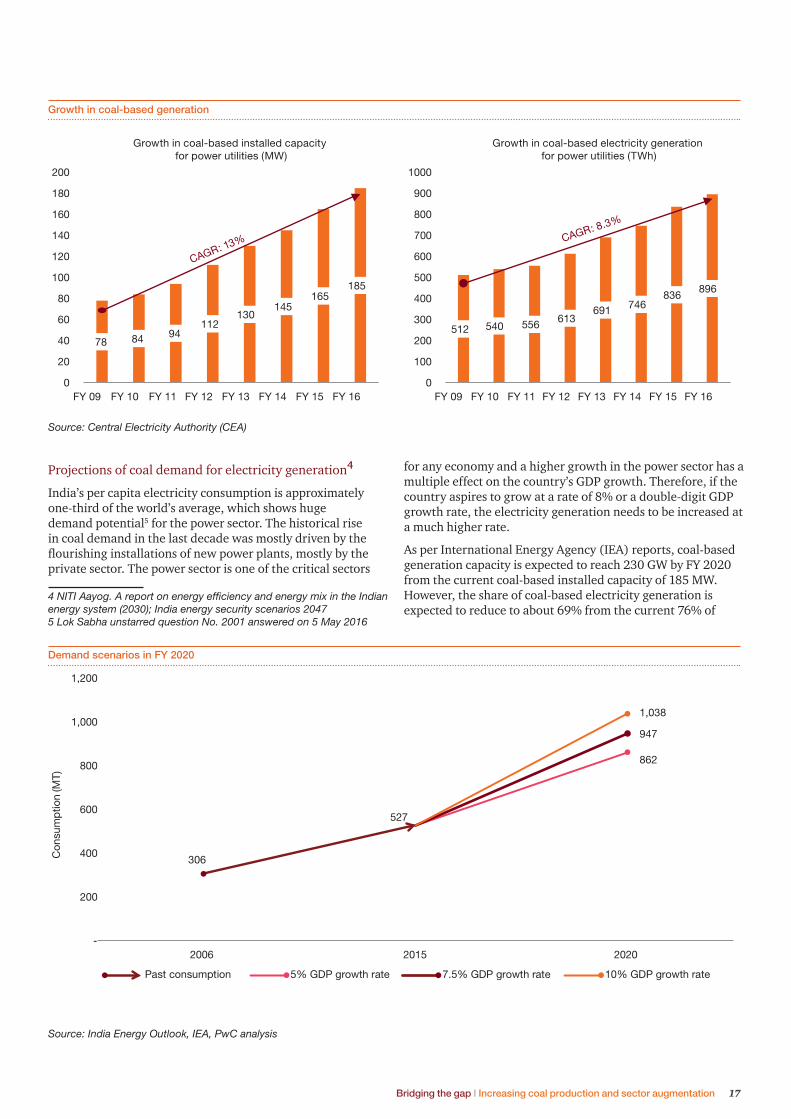
Power sectorAbout 62% of the installed capacity (as of 31 March 2016) in India’s power sector is coal based,3 and coal and lignite alone accounted for 76% of the energy produced by primary resources. Between FY 2009 and FY 2015, the coal-based installed capacity for power utilities has increased at a CAGR of 13%. However, coal-based generation has increased by a CAGR of only 8.5%. Furthermore, the average plant load
factor (PLF) for coal-based power plants in FY 2016 decreased to 62.01% from 63.86%, a year back. As reported by Central Electricity Authority (CEA), the coal stock with power utilities has substantially increased and availability of coal is no more a factor for power plant shutdowns. Thus, in spite of continuous increase in per capita consumption of electricity and coal production, decreasing utilisation of capacity (PLF) suggests that the power sector is facing some other challenges. There
that results in the lowering of the PLF at power stations rather than availability of coal.
Bridging the gap I Increasing coal production and sector augmentation 17
4
India’s per capita electricity consumption is approximately one-third of the world’s average, which shows huge demand potential5 for the power sector. The historical rise in coal demand in the last decade was mostly driven by the
private sector. The power sector is one of the critical sectors
Growth in coal-based generation
78 84 94112
130145
165185
0
20
40
60
80
100
120
140
160
180
200
FY 09 FY 10 FY 11 FY 12 FY 13 FY 14 FY 15 FY 16
512 540 556 613691 746
836896
0
100
200
300
400
500
600
700
800
900
1000
FY 09 FY 10 FY 11 FY 12 FY 13 FY 14 FY 15 FY 16
Growth in coal-based installed capacity for power utilities (MW)
Growth in coal-based electricity generation for power utilities (TWh)
CAGR: 13% CAGR: 8.3%
Demand scenarios in FY 2020
306
527
862
947
1,038
-
200
400
600
800
1,000
1,200
2006 2015 2020
Con
sum
ptio
n (M
T)
Past consumption 5% GDP growth rate 7.5% GDP growth rate 10% GDP growth rate
for any economy and a higher growth in the power sector has a multiple effect on the country’s GDP growth. Therefore, if the country aspires to grow at a rate of 8% or a double-digit GDP growth rate, the electricity generation needs to be increased at a much higher rate.
As per International Energy Agency (IEA) reports, coal-based generation capacity is expected to reach 230 GW by FY 2020 from the current coal-based installed capacity of 185 MW. However, the share of coal-based electricity generation is expected to reduce to about 69% from the current 76% of
PwC18
India’s total electricity generation by FY 2020. In FY 2016, coal-based electricity generation was 896 TWh at a PLF of
Considering the historical trends of the share of coal-based electricity generation in total generation and keeping the energy intensity constant, the impact on PLF is assessed with respect to the GDP growth rate. Considering an installed capacity of 230 GW in FY 2020, with variation in the average annual GDP growth rate from 5–10%, the average annual PLF in FY 2020 is assessed to be 71–81%. Taking this into account and the coal consumption norms6 of the Ministry of Coal (for G11 grade), the coal demand in FY 2020 from the power sector shall range from 862 MT to 1,038 MT, depending on the PLF. In a much realistic scenario, 7–8% GDP growth, the coal demand from the power sector is estimated to be 947 MT.
Steel sectorIn 2015, India became the world’s third largest producer of crude steel, with a production of 89 MT, and the third largest
producer of sponge iron. The steel sector’s contribution to India’s GDP is approximately 2% and the steel industry is one of the eight core industries of India’s economy. In 2014, India’s
world’s average was 216.6 kg. This shows that India has huge growth potential in this sector.
unit capacity of the power plant.
In FY 15, coal consumed by the steel industry in India was 66 MT, and its consumption has increased nearly threefold between FY 06 and FY 15. Imported coal accounted for approximately two-third of the total coal consumption by the steel sector in India. India has set a target of 300 MT of crude steel capacity and 275 MT crude steel production by 2025–26, increasing the capacity level to approximately 110 MT and production level to approximately 89 MT in 2015. This is an approximately threefold increase in both capacity and production levels. Considering this, the expected growth rate of crude steel capacity will reach 173 MT by FY 2020, resulting in coking coal requirement of around 96 MT.
Cement sectorCement sector (third largest coal consuming sector) accounts for 5% of India’s total coal consumption. India is the second largest producer and consumer of cement with the cement producing capacity of 360 MT in 2015.7 In the past 10 years, coal consumption by this sector has increased 2.5 times. Nearly two-third of the coal consumed in FY 15 was imported.
It accounts for 6.7% of the total world production. India’s per capita consumption of cement as of March 2015 was 190 kg, which was much less than the developed and developing economies. Rapid urbanisation, increase in infrastructure investment by the Government of India, infrastructure projects like smart cities and dedicated freight corridors, development of metro rail projects, modernisation and expansion of airports will be the main factors driving the cement demand. The demand is expected to reach 550–600 MTPA by 20258 from the production level of 256 MT in FY 2014 (CAGR of 7–8%). Considering this growth rate, cement production in FY 2020 will be around 389–407 MT. Such a quantum would result in the coal requirement of 78–82 MT (assuming consumption norm for G11 coal grade: 201 kg/T of cement production).9
consumptionnormscb.html
Bridging the gap I Increasing coal production and sector augmentation 19
Other sectorsApart from the core sectors of power, cement and steel, coal is also consumed by various other industries such as paper, textile, fertilisers, railways, defence and other small and medium enterprises (SMEs). Although the consumption of each of these sectors individually is comparatively smaller than the core sectors, its share of coal consumption increased to about 23% in FY 15 from a mere 14% in FY 06. It has been assumed that other sectors’ coal requirement will grow at a CAGR of 7.5%, in line with the economic growth. Thus, coal requirement for other sectors will be 271 MT.
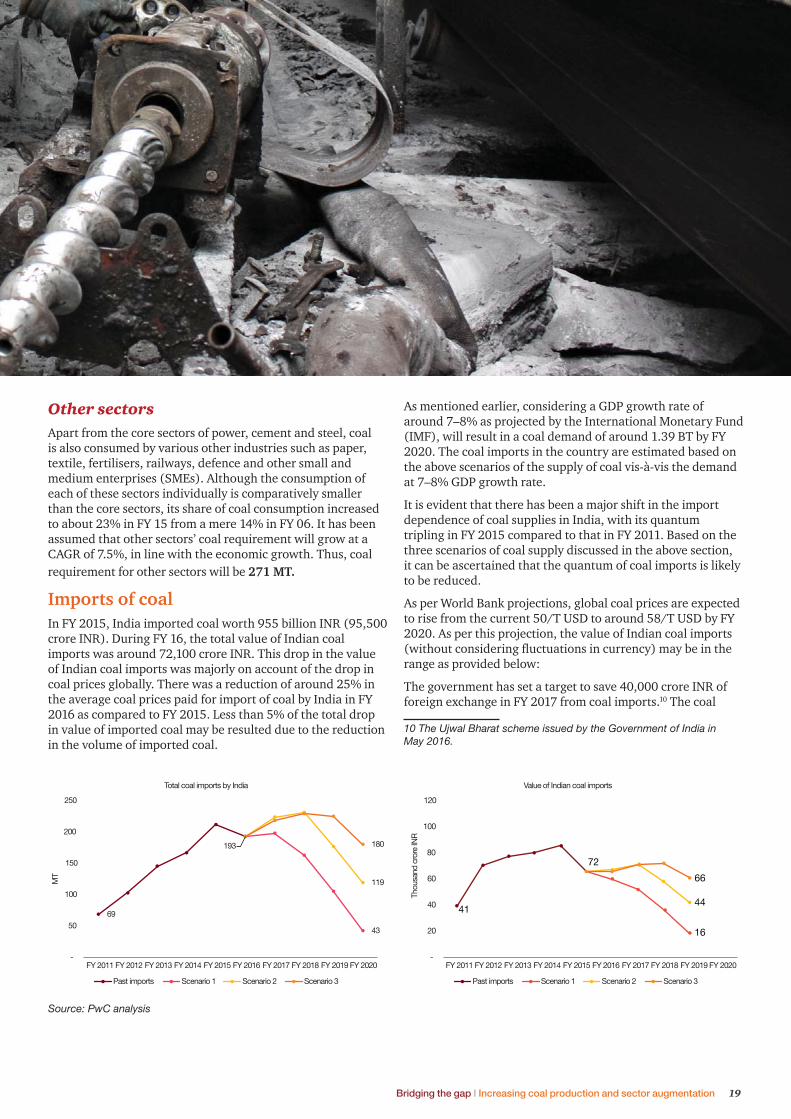
Imports of coalIn FY 2015, India imported coal worth 955 billion INR (95,500 crore INR). During FY 16, the total value of Indian coal imports was around 72,100 crore INR. This drop in the value of Indian coal imports was majorly on account of the drop in coal prices globally. There was a reduction of around 25% in the average coal prices paid for import of coal by India in FY 2016 as compared to FY 2015. Less than 5% of the total drop in value of imported coal may be resulted due to the reduction in the volume of imported coal.
As mentioned earlier, considering a GDP growth rate of around 7–8% as projected by the International Monetary Fund (IMF), will result in a coal demand of around 1.39 BT by FY 2020. The coal imports in the country are estimated based on the above scenarios of the supply of coal vis-à-vis the demand at 7–8% GDP growth rate.
It is evident that there has been a major shift in the import dependence of coal supplies in India, with its quantum
three scenarios of coal supply discussed in the above section, it can be ascertained that the quantum of coal imports is likely
As per World Bank projections, global coal prices are expected to rise from the current 50/T USD to around 58/T USD by FY 2020. As per this projection, the value of Indian coal imports
range as provided below:
The government has set a target to save 40,000 crore INR of foreign exchange in FY 2017 from coal imports.10 The coal
Source: PwC analysis
69
43
119
193 180
-
50
100
150
200
250
FY 2011 FY 2012 FY 2013 FY 2014 FY 2015 FY 2016 FY 2017 FY 2018 FY 2019 FY 2020
MT
Total coal imports by India
Past imports Scenario 1 Scenario 2 Scenario 3
FY 2011 FY 2012 FY 2013 FY 2014 FY 2015 FY 2016 FY 2017 FY 2018 FY 2019 FY 2020
Thou
sand
cro
re IN
R
Value of Indian coal imports
Past imports Scenario 1 Scenario 2 Scenario 3
41
16
44
72
66
-
20
40
60
80
100
120
PwC20
bill of the country as already reduced by 24,000 crore INR in FY 2016. If the government is able to reach the production levels assessed in Scenario 1, there can be additional saving of around 7,000 crore INR in FY 2017 on the coal bill of the country, based on reduction in the quantum of coal imports. In case there is reduction in global coal prices rather than the increase forecasted by the World Bank, the savings on coal import bill would further increase.
Coal import reduction threshold In the present scenario, the total coking coal demand in the country is around 100 MT. India domestically produces around 50–55 MT of coking coal and imports around 40–45% of its coking coal requirement. The demand of coking coal in FY 2020 may reach 140–150 MT. Considering the coking coal reserve tonnage to not be high, India may have to remain
proportion of this demand. Regarding the non-coking coal story, there are number of imported coal-based power plants in India, located mostly in the coastal region, which have been designed to operate on coal imported from other countries.
The coal import requirement of these power plants stand in the range of 40–50 MT at present. Since these plants have been designed on imported coal, it may not be technically viable to operate these on domestic coal due to vast variation in the quality of coal available domestically.
Moreover, the landed cost of imported coal per kcal/kg for some of the coastal power plants may also be lower than the landed cost of domestic coal. Moreover, other commercial factors such as reducing price differentials between imported
lower ash percentage of imported coal, and lower dependency on the already stressed inland transportation of road and railways may also play their part, while estimating the import substitution of thermal coal by the coastal power plants.
This requirement of coal from imported coal-based power plants may not allow the coal imports in the country to fall below a certain threshold number unless other economical
viable to feed these plants.
Bridging the gap I Increasing coal production and sector augmentation 21
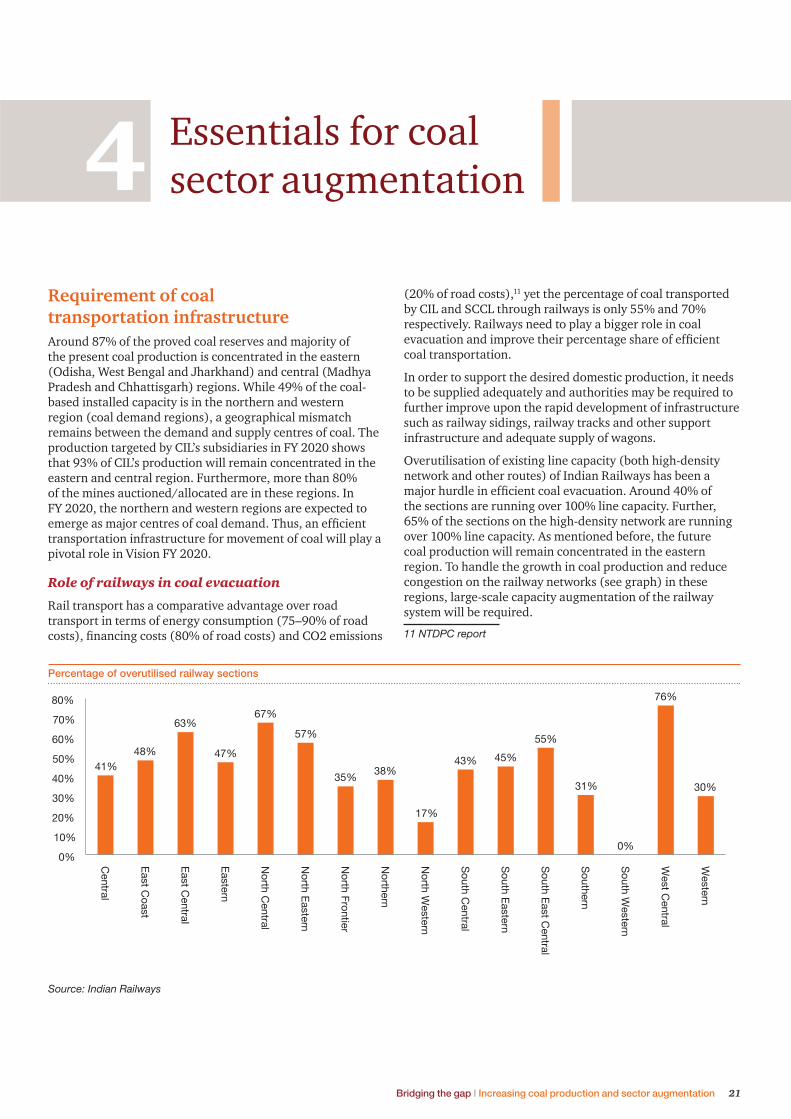
4 Essentials for coal sector augmentation
Requirement of coal
Around 87% of the proved coal reserves and majority of the present coal production is concentrated in the eastern (Odisha, West Bengal and Jharkhand) and central (Madhya Pradesh and Chhattisgarh) regions. While 49% of the coal-based installed capacity is in the northern and western region (coal demand regions), a geographical mismatch remains between the demand and supply centres of coal. The production targeted by CIL’s subsidiaries in FY 2020 shows that 93% of CIL’s production will remain concentrated in the eastern and central region. Furthermore, more than 80% of the mines auctioned/allocated are in these regions. In FY 2020, the northern and western regions are expected to
transportation infrastructure for movement of coal will play a
Role of railways in coal evacuation
Rail transport has a comparative advantage over road transport in terms of energy consumption (75–90% of road
(20% of road costs),11 yet the percentage of coal transported by CIL and SCCL through railways is only 55% and 70% respectively. Railways need to play a bigger role in coal
coal transportation.
In order to support the desired domestic production, it needs to be supplied adequately and authorities may be required to further improve upon the rapid development of infrastructure such as railway sidings, railway tracks and other support infrastructure and adequate supply of wagons.
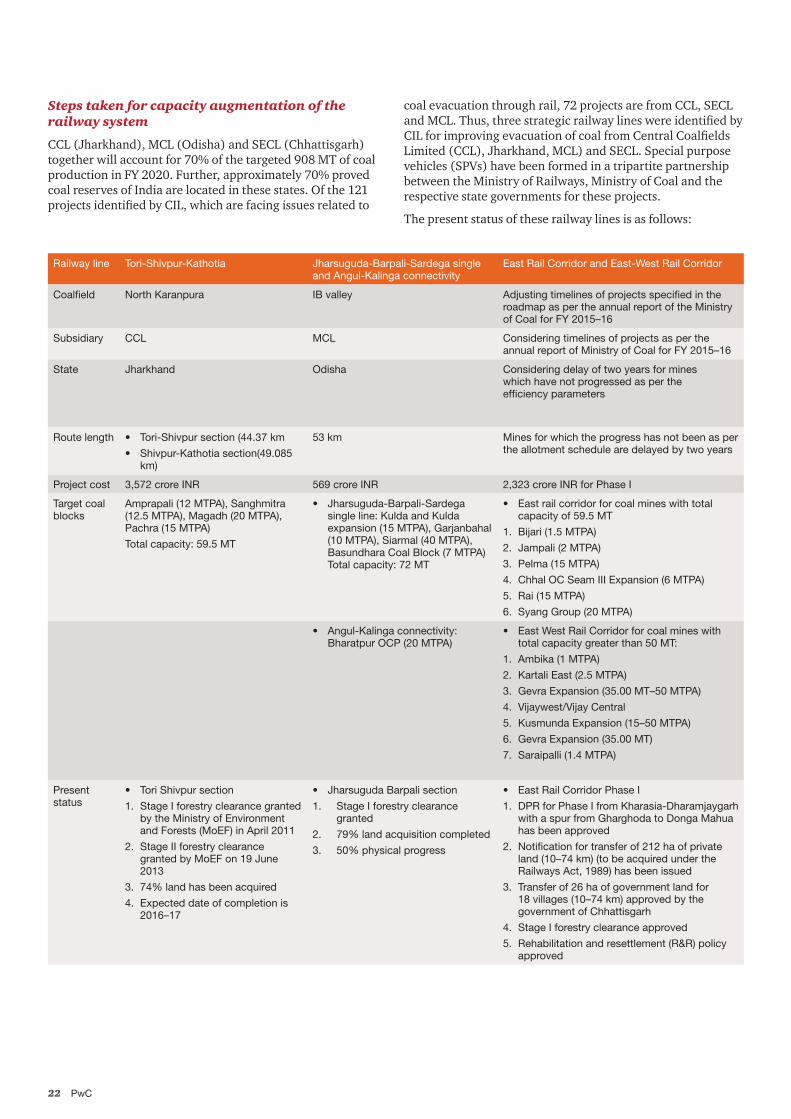
Overutilisation of existing line capacity (both high-density network and other routes) of Indian Railways has been a
the sections are running over 100% line capacity. Further, 65% of the sections on the high-density network are running over 100% line capacity. As mentioned before, the future coal production will remain concentrated in the eastern
congestion on the railway networks (see graph) in these regions, large-scale capacity augmentation of the railway system will be required.
11 NTDPC report
Source: Indian Railways
Percentage of overutilised railway sections
41%48%
63%
47%
67%
57%
35%38%
17%
43% 45%
55%
31%
0%
76%
30%
0%
10%
20%
30%
40%
50%
60%
70%
80%C
entral
East C
oast
East C
entral
Eastern
North C
entral
North E
astern
North Frontier
Northern
North W
estern
South C
entral
South E
astern
South E
ast Central
Southern
South W
estern
West C
entral
Western
PwC22
railway system
CCL (Jharkhand), MCL (Odisha) and SECL (Chhattisgarh) together will account for 70% of the targeted 908 MT of coal production in FY 2020. Further, approximately 70% proved coal reserves of India are located in these states. Of the 121
coal evacuation through rail, 72 projects are from CCL, SECL
Limited (CCL), Jharkhand, MCL) and SECL. Special purpose
between the Ministry of Railways, Ministry of Coal and the respective state governments for these projects.
The present status of these railway lines is as follows:
Railway line Tori-Shivpur-Kathotia Jharsuguda-Barpali-Sardega single and Angul-Kalinga connectivity
East Rail Corridor and East-West Rail Corridor
Coalfield North Karanpura IB valley Adjusting timelines of projects specified in the roadmap as per the annual report of the Ministry of Coal for FY 2015–16
Subsidiary CCL MCL Considering timelines of projects as per the annual report of Ministry of Coal for FY 2015–16
State Jharkhand Odisha Considering delay of two years for mines which have not progressed as per the efficiency parameters
Route length • Tori-Shivpur section (44.37 km
• Shivpur-Kathotia section(49.085 km)
53 km Mines for which the progress has not been as per the allotment schedule are delayed by two years
Project cost 3,572 crore INR 569 crore INR 2,323 crore INR for Phase I
Target coal blocks
Amprapali (12 MTPA), Sanghmitra (12.5 MTPA), Magadh (20 MTPA), Pachra (15 MTPA)
Total capacity: 59.5 MT
• Jharsuguda-Barpali-Sardega single line: Kulda and Kulda expansion (15 MTPA), Garjanbahal (10 MTPA), Siarmal (40 MTPA), Basundhara Coal Block (7 MTPA) Total capacity: 72 MT
• East rail corridor for coal mines with total capacity of 59.5 MT
1. Bijari (1.5 MTPA)
2. Jampali (2 MTPA)
3. Pelma (15 MTPA)
4. Chhal OC Seam III Expansion (6 MTPA)
5. Rai (15 MTPA)
6. Syang Group (20 MTPA)
• Angul-Kalinga connectivity: Bharatpur OCP (20 MTPA)
• East West Rail Corridor for coal mines with total capacity greater than 50 MT:
1. Ambika (1 MTPA)
2. Kartali East (2.5 MTPA)
3. Gevra Expansion (35.00 MT–50 MTPA)
4. Vijaywest/Vijay Central
5. Kusmunda Expansion (15–50 MTPA)
6. Gevra Expansion (35.00 MT)
7. Saraipalli (1.4 MTPA)
Present status
• Tori Shivpur section
1. Stage I forestry clearance granted by the Ministry of Environment and Forests (MoEF) in April 2011
2. Stage II forestry clearance granted by MoEF on 19 June 2013
3. 74% land has been acquired
4. Expected date of completion is 2016–17
• Jharsuguda Barpali section
1. Stage I forestry clearance granted
2. 79% land acquisition completed
3. 50% physical progress
• East Rail Corridor Phase I
1. DPR for Phase I from Kharasia-Dharamjaygarh with a spur from Gharghoda to Donga Mahua has been approved
2. Notification for transfer of 212 ha of private land (10–74 km) (to be acquired under the Railways Act, 1989) has been issued
3. Transfer of 26 ha of government land for 18 villages (10–74 km) approved by the government of Chhattisgarh
4. Stage I forestry clearance approved
5. Rehabilitation and resettlement (R&R) policy approved
Bridging the gap I Increasing coal production and sector augmentation 23
• Shivpur-Kathautia section
1. Land plans submitted to the state government for land acquisition
2. E-application for Stage I forestry clearance has been submitted
3. Timeline not decided due to uncertainty in land acquisition and forest clearances
• East West Rail Corridor
1. Detailed project report (DPR) under revision
2. Notification has been issued to acquire private land in Bilaspur district
3. Application for the transfer of government land has been submitted
Expected date of completion
Tori Shivpur Section: 2016–17
Shivpur-Kathautia section: Not decided
Jharsuguda-Barpali : June 2016 (Phase I)
East Rail Corridor: FY 2018
East West Rail Corridor: Mid FY 2020
Dependent coal supply on upcoming railway
projects • As per the roadmap scenario, approximately 45% of
the targeted production for CCL in FY 2020, i.e. around 60 MT, is dependent for coal evacuation on the Tori-Shivpur-Kathotia railway line. The Tori-Shivpur section is expected to be completed by 2016–17. The undecided timeline for completion of the Shivpur-Kathautia section (49 km) due to uncertainty in land acquisition and forest clearances, can prove to be the major hurdle for CCL.
• Mines with total capacity of 72 MT are dependent on the Jharsuguda-Barpali-Sardega single line, but as per the roadmap scenario only 42 MT will be produced from these mines in FY 2020. The Jharsuguda-Barpali line will handle 34 MTPA coal dispatch; however, after construction of the double line, this capacity will increase to 60 MTPA. The single line is expected to be complete by June 2016, and the double line by March 2019. Thus, timely completion of these critical projects will ensure the required coal movement.
• The Angul Kalinga connectivity will serve the 20 MTPA Bharatpur opencast project (OCP). The scheduled date of completion for this project was March 2016. Commencement of this line will increase 15 rakes per day (60,000 tonnes per day).
• East Rail Corridor, a ‘special railway project’ declared by the Ministry of Railways will be used for coal movement
is expected to be completed by FY 2018. By FY 2020, the mines dependent on this corridor will produce 29 MT as per the roadmap document.
• Another critical coal evacuation project for SECL is the East West Rail Corridor. The expected date of completion of this corridor is FY 2020. Any further delay in this corridor may hinder SECL’s target plan, as mines dependent on this corridor will produce approximately 50% of SECL’s target production in FY 2020.
• for coal evacuation. A memorandum of understanding (MoU) has been signed between the Ministry of Railways, Ministry of Coal and the Government of Odisha for the execution of these projects. The major projects are
down line (6.6 km), Sambalpur-Talcher doubling (174 km), Sambalpur-Titlagarh doubling (182 km), Raipur-Titlagarh doubling (203 km) and Champa-Jharsuguda-3rd line (165 km) with total cost of 2,889 crore INR.
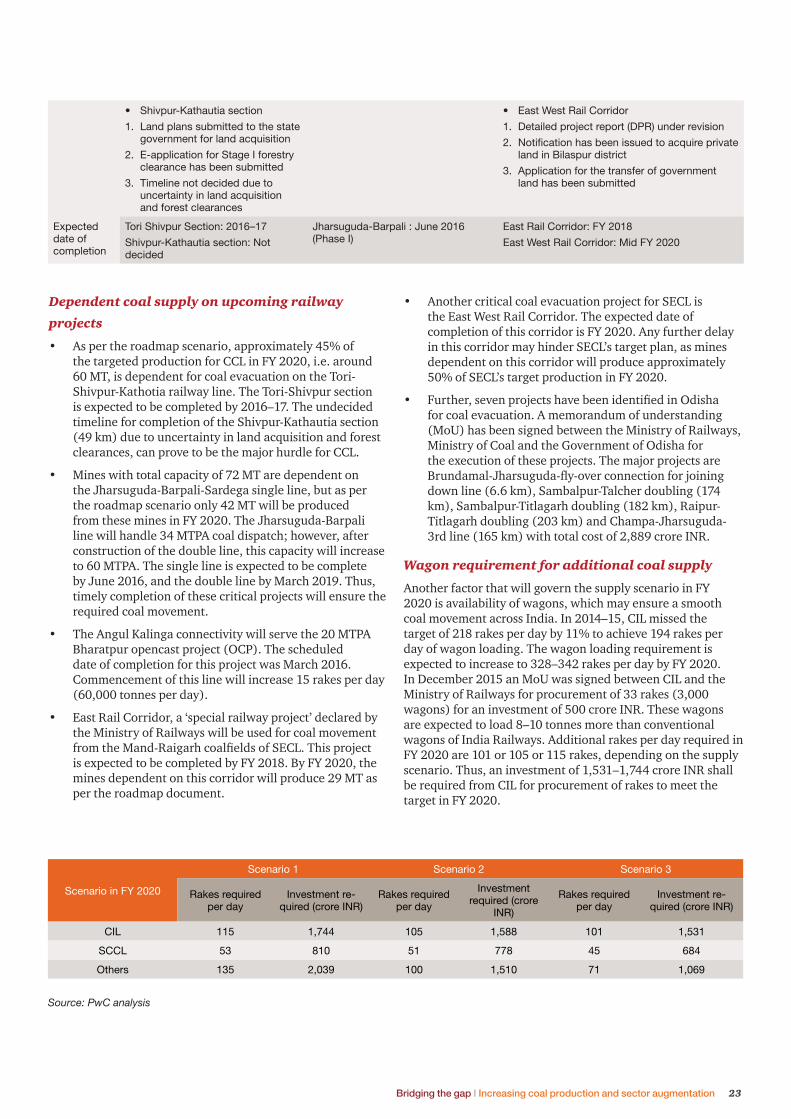
Wagon requirement for additional coal supply
Another factor that will govern the supply scenario in FY 2020 is availability of wagons, which may ensure a smooth coal movement across India. In 2014–15, CIL missed the target of 218 rakes per day by 11% to achieve 194 rakes per day of wagon loading. The wagon loading requirement is expected to increase to 328–342 rakes per day by FY 2020. In December 2015 an MoU was signed between CIL and the Ministry of Railways for procurement of 33 rakes (3,000 wagons) for an investment of 500 crore INR. These wagons are expected to load 8–10 tonnes more than conventional wagons of India Railways. Additional rakes per day required in FY 2020 are 101 or 105 or 115 rakes, depending on the supply scenario. Thus, an investment of 1,531–1,744 crore INR shall be required from CIL for procurement of rakes to meet the
Scenario in FY 2020
Scenario 1 Scenario 2 Scenario 3
Rakes required per day
Investment re-quired (crore INR)
Rakes required per day
Investment required (crore
INR)
Rakes required per day
Investment re-quired (crore INR)
CIL 115 1,744 105 1,588 101 1,531
SCCL 53 810 51 778 45 684
Others 135 2,039 100 1,510 71 1,069
Source: PwC analysis
PwC24
Investment requirement for wagon loading requirement for SCCL will be 810 crore INR for a 100 MT production target.
(schedule II, schedule III, non-deallocated coal mines and pre-nationalisation coal mines), investment of 2,039 or 1,510 or 1,069 crore INR will be required in the different supply scenarios.
Private participation in railway infrastructure developmentModernisation, strengthening and expansion of Indian
Availability of funds has been the major bottleneck in this process. The Ministry of Railways has already introduced a policy on participative models for rail connectivity and capacity augmentation in December 2012. This policy aims at attracting private investments for providing last-mile connectivity to ports, large mines and cluster of industries. The models under this policy have tried to ensure appropriate risk allocation between the private and public sector through the following:
1. Payment of user fees by Indian Railways to the developer
2.
3. Stating the key performance indicators (KPIs) and the pen-alties on the basis of shortfall in achieving the KPIs
4. Transfer of time/cost overruns and construction risk to en-gineering, procurement and construction (EPC) contractors
Success of policy on participative models for rail connectivity and capacity augmentation in India
Completion of the Gandhidham-Tuna Tekra rail line in May 2015 shows the success of the non-governmental railway private line model under the above-mentioned policy. This rail line is 17-km long. Coal and fertiliser with average
total project cost was 185 crore INR and was funded by the Kandla Port Trust (KPT). Indian Railways will earn a revenue of 5 crore INR by
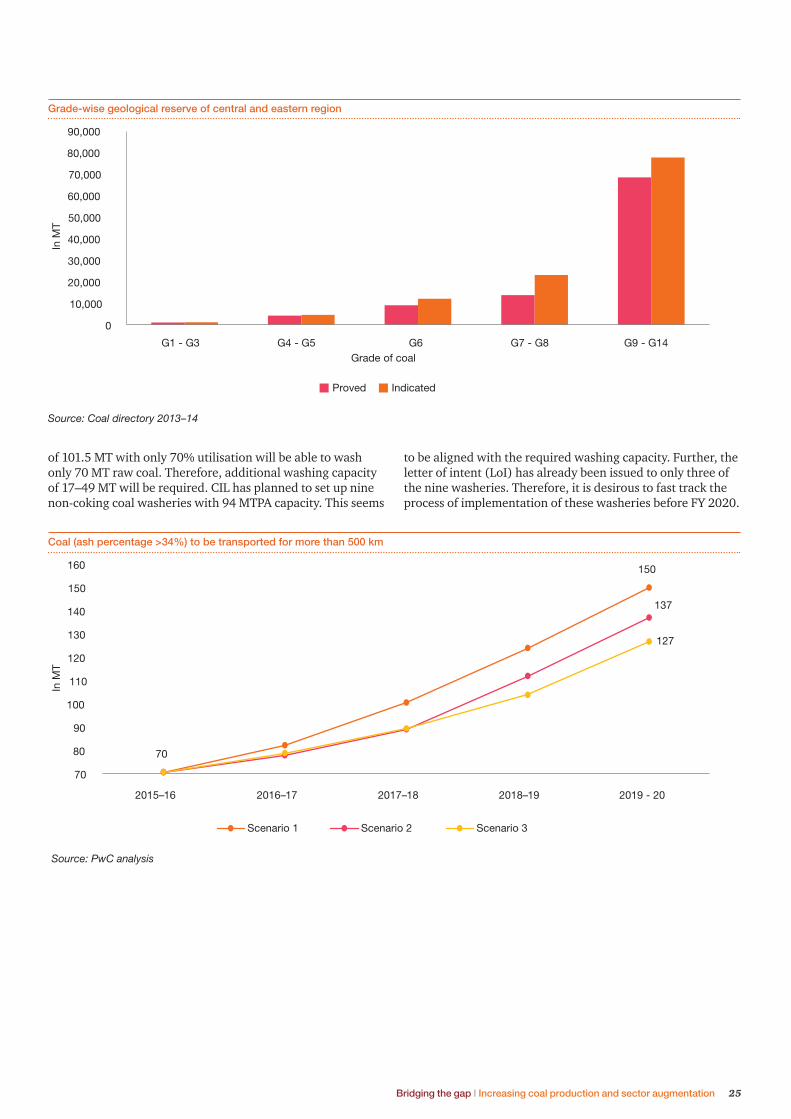
Constraints on quality of coal for
Around 87% of the proved coal reserves are concentrated in the eastern and central region. Approximately 70% of these proved coal reserves have grades ranging from G9–G14, i.e., ash percentage ranging from 34–55%. Furthermore, these regions will be the major coal producers in FY 2020 (93% of CIL’s FY 2020 target and more than 85% of auctioned/allotted mines production for power generation will be from these regions). While approximately 29% of the coal demand from the power sector will be from the northern and western region, approximately 29% of the coal produced for supplying to the power sector will be transported by a distance greater than 500 km in FY 2020.
As per the Environment (Protection) Amendment Rules, 2014, coal transported for thermal power plants with distance greater than 500 km from the pithead must use raw or
34%. Coal (ash percentage greater than 34%) that will need to be transported for more than 500 km will range from 127–150 MT. The present non-coking coal washing capacity
Privatisation of railway infrastructure: Aurizon’s success
Globally, Aurizon is an example of successful privatisation of railway infrastructure. Aurizon (Australia’s largest rail freight operator) manages the central Queensland coal network. The government decided to privatise the rail freight operator in 2010 to attract private investments in the coal movement systems. This in turn was expected to promote
haulage from mine to port. Post privatisation, the operating ratio (ratio of operating expenses to total revenue) decreased from 90% in 2010 to 74% in 2015, and the return on invested capital increased from 3.4% in 2010 to 9.7% in 2015. These two factors show
Bridging the gap I Increasing coal production and sector augmentation 25
of 101.5 MT with only 70% utilisation will be able to wash only 70 MT raw coal. Therefore, additional washing capacity of 17–49 MT will be required. CIL has planned to set up nine non-coking coal washeries with 94 MTPA capacity. This seems
Grade-wise geological reserve of central and eastern region
0
10,000
20,000
30,000
40,000
50,000
60,000
70,000
80,000
90,000
G1 - G3 G4 - G5 G6 G7 - G8 G9 - G14
In M
T
Grade of coal
Proved Indicated
to be aligned with the required washing capacity. Further, the letter of intent (LoI) has already been issued to only three of the nine washeries. Therefore, it is desirous to fast track the process of implementation of these washeries before FY 2020.
Coal (ash percentage >34%) to be transported for more than 500 km
Source: PwC analysis
150
137
70
127
70
80
90
100
110
120
130
140
150
160
2015–16 2016–17 2017–18 2018–19 2019 - 20
In M
T
Scenario 1 Scenario 2 Scenario 3
PwC26
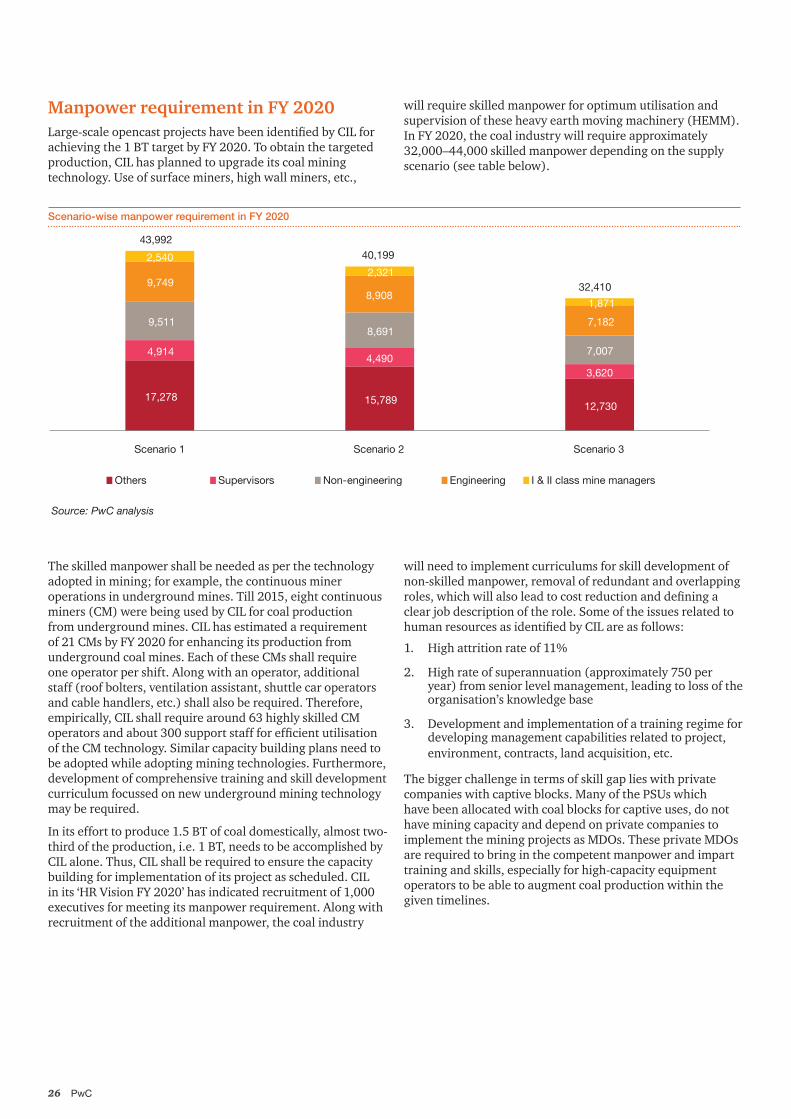
Manpower requirement in FY 2020
achieving the 1 BT target by FY 2020. To obtain the targeted production, CIL has planned to upgrade its coal mining technology. Use of surface miners, high wall miners, etc.,
will require skilled manpower for optimum utilisation and supervision of these heavy earth moving machinery (HEMM). In FY 2020, the coal industry will require approximately 32,000–44,000 skilled manpower depending on the supply scenario (see table below).
Scenario-wise manpower requirement in FY 2020
Source: PwC analysis
17,278 15,789 12,730
4,914 4,490
3,620
9,511 8,691
7,007
9,749 8,908
7,182
2,540 2,321
1,871
43,992 40,199
32,410
Scenario 1 Scenario 2 Scenario 3
Others Supervisors Non-engineering Engineering I & II class mine managers
The skilled manpower shall be needed as per the technology adopted in mining; for example, the continuous miner operations in underground mines. Till 2015, eight continuous miners (CM) were being used by CIL for coal production from underground mines. CIL has estimated a requirement of 21 CMs by FY 2020 for enhancing its production from underground coal mines. Each of these CMs shall require one operator per shift. Along with an operator, additional staff (roof bolters, ventilation assistant, shuttle car operators and cable handlers, etc.) shall also be required. Therefore, empirically, CIL shall require around 63 highly skilled CM
of the CM technology. Similar capacity building plans need to be adopted while adopting mining technologies. Furthermore, development of comprehensive training and skill development curriculum focussed on new underground mining technology may be required.
In its effort to produce 1.5 BT of coal domestically, almost two-third of the production, i.e. 1 BT, needs to be accomplished by CIL alone. Thus, CIL shall be required to ensure the capacity building for implementation of its project as scheduled. CIL
executives for meeting its manpower requirement. Along with recruitment of the additional manpower, the coal industry
will need to implement curriculums for skill development of non-skilled manpower, removal of redundant and overlapping
clear job description of the role. Some of the issues related to
1. High attrition rate of 11%
2. High rate of superannuation (approximately 750 per year) from senior level management, leading to loss of the organisation’s knowledge base
3. Development and implementation of a training regime for developing management capabilities related to project, environment, contracts, land acquisition, etc.
The bigger challenge in terms of skill gap lies with private companies with captive blocks. Many of the PSUs which have been allocated with coal blocks for captive uses, do not have mining capacity and depend on private companies to implement the mining projects as MDOs. These private MDOs are required to bring in the competent manpower and impart training and skills, especially for high-capacity equipment operators to be able to augment coal production within the given timelines.
Bridging the gap I Increasing coal production and sector augmentation 27
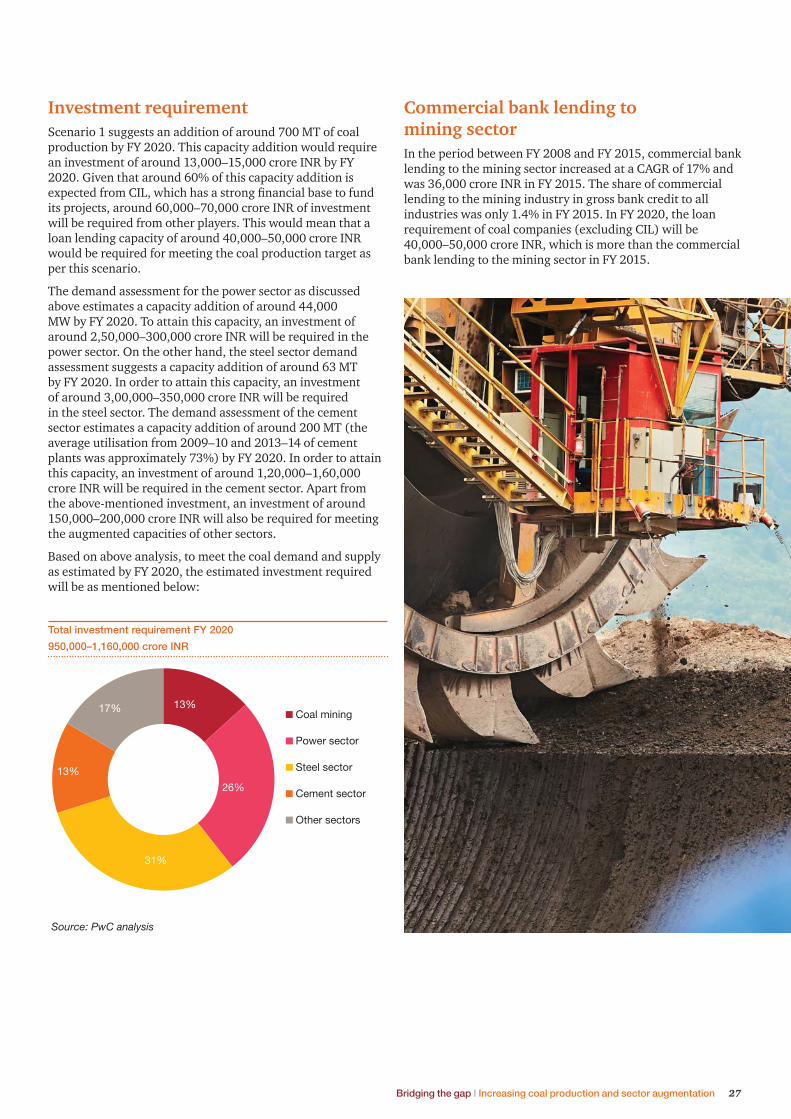
Investment requirementScenario 1 suggests an addition of around 700 MT of coal production by FY 2020. This capacity addition would require an investment of around 13,000–15,000 crore INR by FY 2020. Given that around 60% of this capacity addition is
its projects, around 60,000–70,000 crore INR of investment will be required from other players. This would mean that a loan lending capacity of around 40,000–50,000 crore INR would be required for meeting the coal production target as per this scenario.
The demand assessment for the power sector as discussed above estimates a capacity addition of around 44,000 MW by FY 2020. To attain this capacity, an investment of around 2,50,000–300,000 crore INR will be required in the power sector. On the other hand, the steel sector demand assessment suggests a capacity addition of around 63 MT by FY 2020. In order to attain this capacity, an investment of around 3,00,000–350,000 crore INR will be required in the steel sector. The demand assessment of the cement sector estimates a capacity addition of around 200 MT (the average utilisation from 2009–10 and 2013–14 of cement plants was approximately 73%) by FY 2020. In order to attain this capacity, an investment of around 1,20,000–1,60,000 crore INR will be required in the cement sector. Apart from the above-mentioned investment, an investment of around 150,000–200,000 crore INR will also be required for meeting the augmented capacities of other sectors.
Based on above analysis, to meet the coal demand and supply as estimated by FY 2020, the estimated investment required will be as mentioned below:
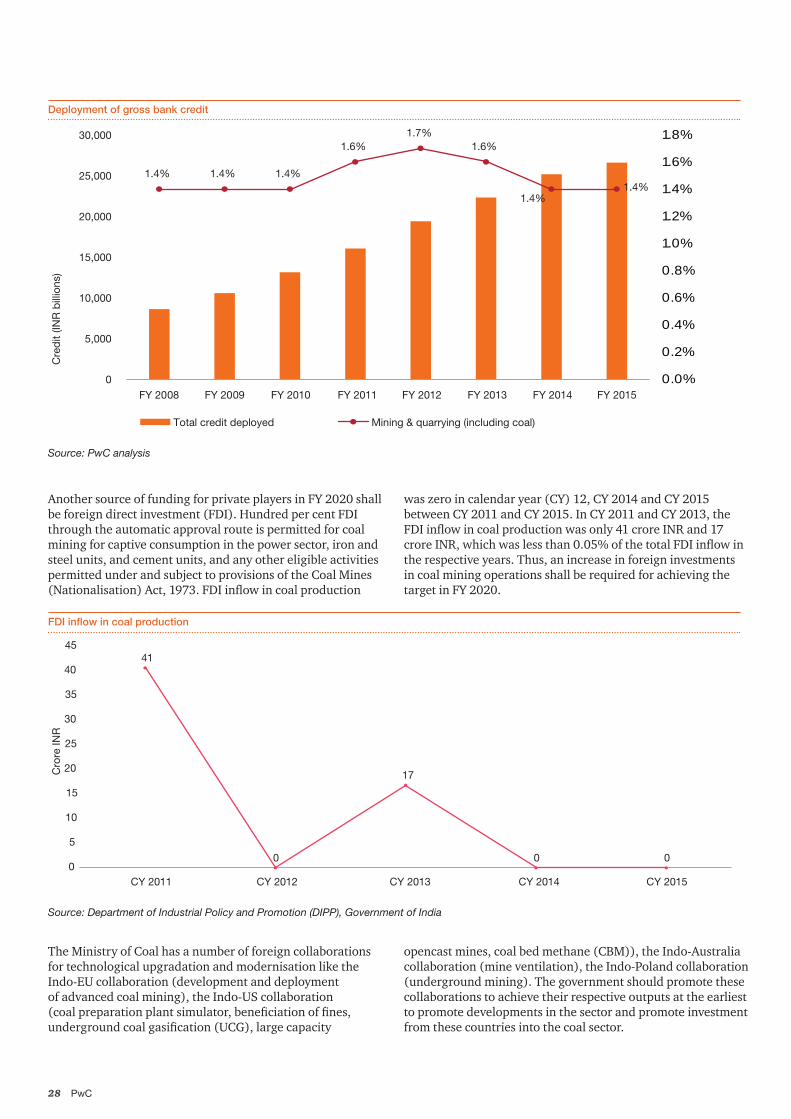
Commercial bank lending to mining sectorIn the period between FY 2008 and FY 2015, commercial bank lending to the mining sector increased at a CAGR of 17% and was 36,000 crore INR in FY 2015. The share of commercial lending to the mining industry in gross bank credit to all industries was only 1.4% in FY 2015. In FY 2020, the loan requirement of coal companies (excluding CIL) will be 40,000–50,000 crore INR, which is more than the commercial bank lending to the mining sector in FY 2015.
Source: PwC analysis
13%
26%
31%
13%
17% Coal mining
Power sector
Steel sector
Cement sector
Other sectors
Total investment requirement FY 2020
950,000–1,160,000 crore INR
PwC28
Another source of funding for private players in FY 2020 shall be foreign direct investment (FDI). Hundred per cent FDI through the automatic approval route is permitted for coal mining for captive consumption in the power sector, iron and steel units, and cement units, and any other eligible activities permitted under and subject to provisions of the Coal Mines
Deployment of gross bank credit
FDI inflow in coal production
Source: PwC analysis
1.4% 1.4% 1.4%
1.6%1.7%
1.6%
1.4%1.4%
0.0%
0.2%
0.4%
0.6%
0.8%
1.0%
1.2%
1.4%
1.6%
1.8%
0
5,000
10,000
15,000
20,000
25,000
30,000
FY 2008 FY 2009 FY 2010 FY 2011 FY 2012 FY 2013 FY 2014 FY 2015
Cre
dit
(INR
bill
ions
)
Total credit deployed Mining & quarrying (including coal)
41
0
17
0 00
5
10
15
20
25
30
35
40
45
CY 2011 CY 2012 CY 2013 CY 2014 CY 2015
Cro
re IN
R
was zero in calendar year (CY) 12, CY 2014 and CY 2015 between CY 2011 and CY 2015. In CY 2011 and CY 2013, the
the respective years. Thus, an increase in foreign investments in coal mining operations shall be required for achieving the target in FY 2020.
The Ministry of Coal has a number of foreign collaborations for technological upgradation and modernisation like the Indo-EU collaboration (development and deployment of advanced coal mining), the Indo-US collaboration
opencast mines, coal bed methane (CBM)), the Indo-Australia collaboration (mine ventilation), the Indo-Poland collaboration (underground mining). The government should promote these collaborations to achieve their respective outputs at the earliest to promote developments in the sector and promote investment from these countries into the coal sector.
Bridging the gap I Increasing coal production and sector augmentation 29
5 The way forward for the coal sector
To achieve the ambitious coal production targets set by the government of India, strong and focused efforts are required from all stakeholders, especially governments, industry players, investors, funding agencies, and infrastructure
efforts to achieve these targets are discussed below.
Incentivising private sector participation and
international collaborations
One of the critical success factors for achieving sector
for exploration, mine development, logistics infrastructure and coal washing. Globally, there have been examples wherein increasing private sector participation has helped the cause. The key to this is to develop a framework that ensures appropriate risk allocation and recovery of investments. The government’s National Mineral Exploration Policy (NMEP) for non-fuel and non-coal minerals is a welcome step in this direction and such steps may be considered for the coal sector as well. Several coal block owners and even CIL (for some coal blocks) will be dependent on contract miners/MDOs for development and operations of coal blocks. The processes for selecting the contractor/MDO in such cases should be dealt in a way that ensures good participation of domestic as well as international companies by ensuring proper risk allocation and business models which are focussed towards sustainable
investor-friendly framework would help in implementing
project management toolkit, integration of information technology and sustainable development.
The government would also need to promote international collaborations for bringing in technological upgradations in the sector, which in turn would ensure investment in the sector from various countries. There are a number of possible foreign collaboration opportunities in clean coal technology,
mines and manufacturing of mining equipment which would help in getting investments in the sector and achieving the targets of production augmentation to meet the growing demand.
Increase exploration spend as well as
capacity augmentation
If India’s GDP grows at a rate of 7–8% per annum after FY 2020, the country would need to add production of 130–150 MT per annum to meet the coal demand. This would need availability of additional 4.5 BT (considering 30 years mine life) of proved reserves every year. Presently, the country’s spend on exploration is low compared to major mining countries, and in order to achieve the exploration demands of the future, focus on increasing the depth of drilling to greater depths (600 m and beyond) would be required. Further, to achieve these drilling targets, investment would be required in machinery, manpower, skill upgradation and resource management.
Increasing funding options
industry players may face challenges in securing the required funding for the projects. Efforts are required to attract
government should consider exploring new options, such as structuring of equipment leases, attracting private equity investors, providing tax incentives, making arrangements
traditional sources.
market for the mining sector by promoting detailed
play out, etc. In the last few years, more funds have been raised through non-traditional instruments such as bonds. Similar trends of capital investments have been observed across the global mining sector.
Phased addition of capacity
It may be interesting to note that the fourth tranche of coal block auctions announced by the Ministry of Coal in November 2015 had to be annulled due to low participation from industry players. Such low participation may be due to various technical factors like size, reserve, and geological
market factors; however, it also indicates that the demand for
PwC30
coal blocks may be reduced if there is an oversupply of coal blocks up for allocation. Further, the auction model may need to be more open in the
accommodate for its demand as well as market movements.
Therefore, the government should create a periodic plan for the allocation of coal blocks in line with the growth in demand. Accordingly, allocation of a certain quantum of coal resources each year would create a systematic augmentation to the captive coal sector and promote stability in the sector. This would help in channelising a proper supply to meet the increasing demand and at the same time ensure that there is no oversupply of coal. Also, the auction model may need to be more accommodative to the needs of the industry, as the demand of coal and market conditions are not always uniform across the life of a project.
Local area development and improving
social indicators
One of the major challenges faced by the coal industry is timely
The Pradhan Mantri Khaniz Kshetra Kalyan Yozana (PMKKY) provides guidelines to be implemented by district mineral funds (DMFs) for using the DMF funds. It provides utilisation of 60% of the funds for high priority areas (such as drinking water, environment preservation and pollution control measures, health care, education, and skill development). A proper assessment of the local economic and demographic scenario, and focus on customising the spending on DMFs for effective development of the local area can help in improving the social indicators and developing a positive perspective of the coal industry. This is in turn can help in smoothening the process for acquisition of land and taking locals onboard.
Capacity building and skill development
The output per man shift (OMS) for opencast mines for CIL has improved
2015) but that for underground mines, it has remained almost stagnant in the range of 0.71–0.78, during the same period. Although most of the upcoming capacity is adding through the opencast method of mining in the next four years, the focus needs to be on productivity improvement of underground mines to sustain the growth post FY 2020.
Apart from mechanisation of underground mines, optimum utilisation of human resources will also be important. As per estimates by the Skill Council for Mining Sector (SCMC), the employment in the mining industry is expected to rise to 11 lakh by 2017 and 12 lakh by 2025. The gap between the demand and supply of skilled resources is expected to increase in the future. Further, with the changing landscape in terms of technology upgradation, and productivity improvement, there is a requirement for upskilling or reskilling 50–55% of the skilled and semi-skilled manpower and unskilled workers for which
operating procedures (SOPs), incorporation of IT-based solutions, and implementation of best HR practices, including performance management system, training and development, recruitment and retention helps coal mining companies in capacity building. In order to match the skills requirements for continuous implementation and operation, skill
to be developed, and skill enhancement trainings need to be imparted in addition to mandatory vocational trainings. The industry players should consider setting up training centres in partnership with original equipment manufacturers (OEMs)/equipment suppliers for upgrading
rated equipment. Also, the companies should coordinate with academic
curriculums and additional national occupational standards, if required.
Bridging the gap I Increasing coal production and sector augmentation 31
PwC32
Founded in 1925, Indian Chamber of Commerce (ICC) is the leading and only National Chamber of Commerce operating from Kolkata, and one of the most pro-active and forward-looking Chambers in the country today. Its membership spans some of the most prominent and major industrial groups in India. ICC is the founder member of FICCI, the apex body of business and industry in India. ICC’s forte is its ability to anticipate the needs of the future, respond to challenges, and prepare the stakeholders in the
Set up by a group of pioneering industrialists led by Mr G D Birla, the Indian Chamber of Commerce was closely
organised voice of indigenous Indian Industry. Several of the distinguished industry leaders in India, such as Mr B M Birla, Sir Ardeshir Dalal, Sir Badridas Goenka, Mr S P Jain, Lala Karam Chand Thapar, Mr Russi Mody, Mr Ashok Jain, Mr Sanjiv Goenka, have led the ICC as its President. Currently, Mr Shiv Siddhant Kaul is leading the Chamber as its President.
World Chambers Competition in Quebec, Canada.
ICC’s North-East Initiative has gained a new momentum and dynamism over the last few years, and the Chamber has been hugely successful in spreading awareness about
the great economic potential of the North-East at national and international levels. Trade & Investment shows on North-East in countries like Singapore, Thailand and
between the North-East of India and South-East Asia. ICC has a special focus upon India’s trade & commerce relations with South & South-East Asian nations, in sync with India’s ‘Look East’ Policy, and has played a key role in building synergies between India and her Asian neighbours like Singapore, Indonesia, Bangladesh, and Bhutan through Trade & Business Delegation Exchanges, and large Investment Summits.
ICC also has a very strong focus upon Economic Research & Policy issues - it regularly undertakes Macro-economic Surveys/Studies, prepares State Investment Climate Reports and Sector Reports, provides necessary Policy Inputs & Budget Recommendations to Governments at State & Central levels.
The Indian Chamber of Commerce headquartered in Kolkata, over the last few years has truly emerged as a
New Delhi, Guwahati, Patna, Ranchi and Bhubaneshwar
among Industry and Government by addressing strategic
Bridging the gap I Increasing coal production and sector augmentation 33
Contacts
ICC Towers4, India Exchange PlaceKolkata - 700 001West BengalTel: 91-33 2230 3242 - 44,Fax : 91-33 2231 3377/ 3380E mail: [email protected]
D – 118, 1st Floor,Aashirwad Complex,Green Park Main,New Delhi - 110 016.Tel: +91-11-4610 1431 to 1439Fax: +91-11-4610 1440 & 1441E mail: [email protected]
House No. - 209, R. G. Baruah Road;(Near – AIDC) Opp. Overnite Courier;Overnite Courier;Guwahati – 781024, Assam.Tel: +91-361-2460216/2464767Fax: +91-361-2461763E Mail: [email protected]
11/B DUMRI HOUSE;Kavi Raman PathEast Boring Road;Patna – 800001, Bihar.Tel: +91-612-3212418Fax: +91-612- 2533636E mail: [email protected]
181 – C;ROAD NO. – 4; ASHOK NAGAR;RANCHI – 834002, Jhankhand.Tel: +91-651-6063236Fax: +91-651-2243236E mail: [email protected]
11, Kharavela Nagar,1st Floor, Unit-IIIBhubaneswar-751001, Odisha.Tel: +91-674-2532744/2534744 Fax: +91-674-2533744E mail: [email protected]
Andheri (W), Mumbai-400053, MaharashtraTel: +91-22-6127 7443Fax: 91-22-6888 8656E mail: [email protected]
www.indianchamber.org

PwC34
About PwCNotes
Bridging the gap I Increasing coal production and sector augmentation 35
About PwC
Contacts
with more than 2,08,000 people who are committed to delivering quality in assurance, advisory and tax services. Find out more and tell us what matters to you by visiting us at www.pwc.com
Pune. For more information about PwC India’s service offerings, visit www.pwc.com/in
independent and distinct legal entity in separate lines of service. Please see www.pwc.com/structure for further details.
©2016 PwC. All rights reserved
Kameswara RaoLeader, Energy, Utilities and MiningPwC India+91 40 4424 6688 [email protected]
Sambitosh MohapatraPartner, Power and UtilitiesPwC India+91 (124) 330 6008 [email protected]
Yogesh DarukaPartner, Power and UtilitiesPwC India+91 (33) 4404 [email protected]
Pukhraj SethiyaAssociate Director, Mining and MetalsPwC India+91 40 4424 [email protected]
Key contributorsPukhraj Sethiya (Associate Director, PwC India)
Piyush Kumar Bharti (Manager, PwC India)
Bhavesh Singhavi (Manager, PwC India)
Swapnil Gupta (Manager, PwC India)
Pallav Bagla (Senior Consultant, PwC India)
Shubham Upadhyay (Consultant, PwC India)

pwc.inData Classification: DC0
This document does not constitute professional advice. The information in this document has been obtained or derived from sources believed by PricewaterhouseCoopers Private Limited (PwCPL) to be reliable but PwCPL does not represent that this information is accurate or complete. Any opinions or estimates contained in this document represent the judgment of PwCPL at this time and are subject to change without notice. Readers of this publication are advised to seek their own professional advice before taking any course of action or decision, for which they are entirely responsible, based on the contents of this publication. PwCPL neither accepts or assumes any responsibility or liability to any reader of this publication in respect of the information contained within it or for any decisions readers may take or decide not to or fail to take.
© 2016 PricewaterhouseCoopers Private Limited. All rights reserved. In this document, “PwC” refers to PricewaterhouseCoopers Private Limited (a limited liability company in India having Corporate Identity Number or CIN : U74140WB1983PTC036093), which is a member firm of PricewaterhouseCoopers International Limited (PwCIL), each member firm of which is a separate legal entity.
PD6317