Embed Size (px)
Citation preview

California Department of Education
School Accountability Report Card Reported Using Data from the 2015–16 School Year
Bright Futures Academy—Riverside School Address: 9994 County Farm Rd. Riverside, CA 92503 Phone: 951-785-0504 Principal: Betti Colucci Grade Span: K-12 By February 1 of each year, every school in California is required by state law to publish a School Accountabil-ity Report Card (SARC). The SARC contains information about the condition and performance of each Califor-nia public school. Under the Local Control Funding Formula (LCFF) all local educational agencies (LEAs) are required to prepare a Local Control and Accountability Plan (LCAP), which describes how they intend to meet annual school-specific goals for all pupils, with specific activities to address state and local priorities. Addition-ally, data reported in an LCAP is to be consistent with data reported in the SARC. ➢ For more information about SARC requirements, see the California Department of Education (CDE)
SARC Web page at http://www.cde.ca.gov/ta/ac/sa/. ➢ For more information about the LCFF or LCAP, see the CDE LCFF Web page at
http://www.cde.ca.gov/fg/aa/lc/. ➢ For additional information about the school, parents/guardians and community members should contact
the school principal or the district office. DataQuest DataQuest is an online data tool located on the CDE DataQuest Web page at http://dq.cde.ca.gov/dataquest/ that contains additional information about this school and comparisons of the school to the district and the county. Specifically, DataQuest is a dynamic system that provides reports for accountability (e.g., test data, enrollment, high school graduates, dropouts, course enrollments, staffing, and data regarding English learn-ers). Internet Access Internet access is available at public libraries and other locations that are publicly accessible (e.g., the Califor-nia State Library). Access to the Internet at libraries and public locations is generally provided on a first-come, first-served basis. Other use restrictions may include the hours of operation, the length of time that a work-station may be used (depending on availability), the types of software programs available on a workstation, and the ability to print documents. Throughout this document, the letters DPL mean data provided by the LEA, and the letters DPC mean data provided by the CDE.
About This School District Contact Information (School Year 2015–16)
District Name Alvord Unified School District
Phone Number 951-509-5000
Superintendent Dr. Sid Salazar
E-mail Address [email protected]
Web Site http://www.alvord.k12.ca.us School Contact Information (School Year 2015–16)
School Name Bright Futures Academy
Street 9994 County Farm Rd.
City, State, Zip Riverside, CA 92503
Phone Number 951-785-0504
Principal Betti Colucci
E-mail Address [email protected]
Web Site brightfuturesnps.com
County-District-School (CDS) Code 33 66977 0126821
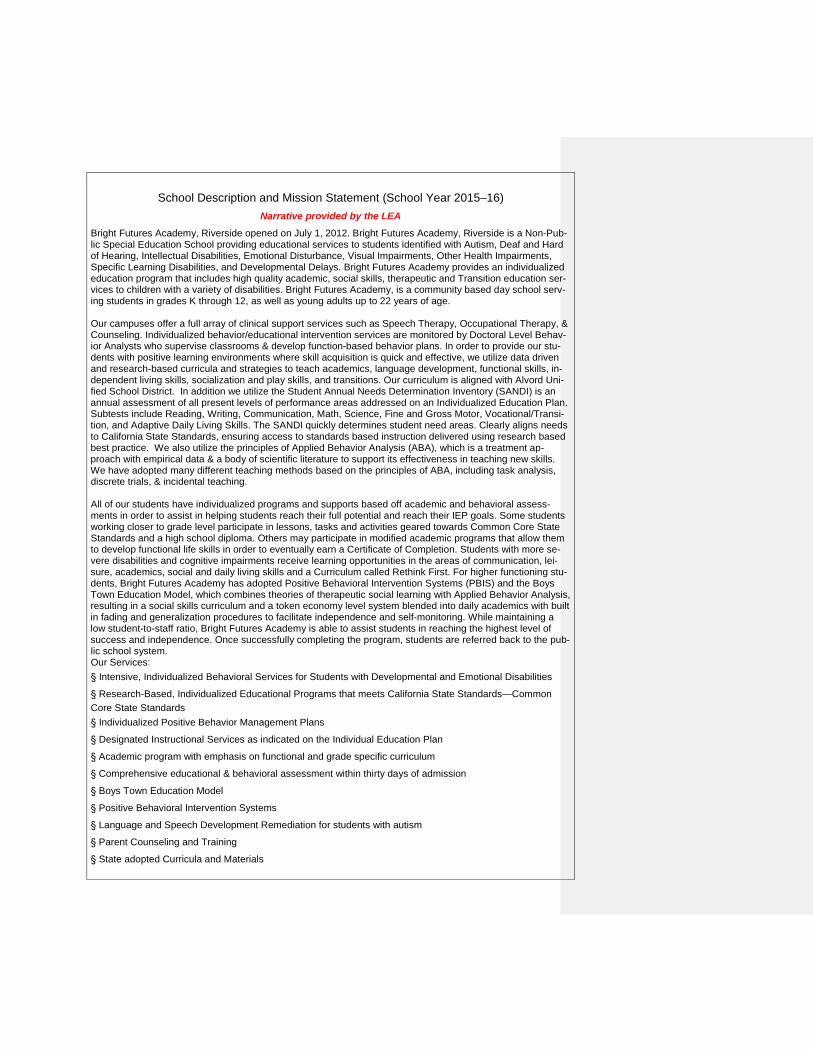
School Description and Mission Statement (School Year 2015–16) Narrative provided by the LEA
Bright Futures Academy, Riverside opened on July 1, 2012. Bright Futures Academy, Riverside is a Non-Pub-lic Special Education School providing educational services to students identified with Autism, Deaf and Hard of Hearing, Intellectual Disabilities, Emotional Disturbance, Visual Impairments, Other Health Impairments, Specific Learning Disabilities, and Developmental Delays. Bright Futures Academy provides an individualized education program that includes high quality academic, social skills, therapeutic and Transition education ser-vices to children with a variety of disabilities. Bright Futures Academy, is a community based day school serv-ing students in grades K through 12, as well as young adults up to 22 years of age. Our campuses offer a full array of clinical support services such as Speech Therapy, Occupational Therapy, & Counseling. Individualized behavior/educational intervention services are monitored by Doctoral Level Behav-ior Analysts who supervise classrooms & develop function-based behavior plans. In order to provide our stu-dents with positive learning environments where skill acquisition is quick and effective, we utilize data driven and research-based curricula and strategies to teach academics, language development, functional skills, in-dependent living skills, socialization and play skills, and transitions. Our curriculum is aligned with Alvord Uni-fied School District. In addition we utilize the Student Annual Needs Determination Inventory (SANDI) is an annual assessment of all present levels of performance areas addressed on an Individualized Education Plan. Subtests include Reading, Writing, Communication, Math, Science, Fine and Gross Motor, Vocational/Transi-tion, and Adaptive Daily Living Skills. The SANDI quickly determines student need areas. Clearly aligns needs to California State Standards, ensuring access to standards based instruction delivered using research based best practice. We also utilize the principles of Applied Behavior Analysis (ABA), which is a treatment ap-proach with empirical data & a body of scientific literature to support its effectiveness in teaching new skills. We have adopted many different teaching methods based on the principles of ABA, including task analysis, discrete trials, & incidental teaching. All of our students have individualized programs and supports based off academic and behavioral assess-ments in order to assist in helping students reach their full potential and reach their IEP goals. Some students working closer to grade level participate in lessons, tasks and activities geared towards Common Core State Standards and a high school diploma. Others may participate in modified academic programs that allow them to develop functional life skills in order to eventually earn a Certificate of Completion. Students with more se-vere disabilities and cognitive impairments receive learning opportunities in the areas of communication, lei-sure, academics, social and daily living skills and a Curriculum called Rethink First. For higher functioning stu-dents, Bright Futures Academy has adopted Positive Behavioral Intervention Systems (PBIS) and the Boys Town Education Model, which combines theories of therapeutic social learning with Applied Behavior Analysis, resulting in a social skills curriculum and a token economy level system blended into daily academics with built in fading and generalization procedures to facilitate independence and self-monitoring. While maintaining a low student-to-staff ratio, Bright Futures Academy is able to assist students in reaching the highest level of success and independence. Once successfully completing the program, students are referred back to the pub-lic school system. Our Services: § Intensive, Individualized Behavioral Services for Students with Developmental and Emotional Disabilities
§ Research-Based, Individualized Educational Programs that meets California State Standards—Common Core State Standards § Individualized Positive Behavior Management Plans
§ Designated Instructional Services as indicated on the Individual Education Plan
§ Academic program with emphasis on functional and grade specific curriculum
§ Comprehensive educational & behavioral assessment within thirty days of admission
§ Boys Town Education Model
§ Positive Behavioral Intervention Systems
§ Language and Speech Development Remediation for students with autism
§ Parent Counseling and Training
§ State adopted Curricula and Materials
§ Transition Education and Career Development
§ Community Based Instruction
§ Full Range of Research-Based Psychological Skills Training Programs
§ Transportation Services
§ Non-Public Agency (NPA) services include behavior consultation and staff training Mission: Bright Futures Academy’s mission is to provide a safe, personalized, and data-driven learning envi-ronment for special needs students, empowering them to develop positive social skills and independent living skills necessary to transition into a less restrictive educational setting or into adulthood after completing high school. Certified by the California Department of Education as a non-public school, Bright Futures Academy employs a variety of personnel to oversee and implement educational and behavioral programs in conjunction with local school districts, students, their families, as well as other social service agencies. Bright Futures Academy places emphasis on a multidisciplinary approach and on-going collaborative case management, based on analysis of academic and behavioral data, and outcome measures.
Certified by the California Department of Education as a non-public school, Bright Futures Academy employs a variety of personnel to oversee and implement educational and behav-ioral programs in conjunction with local school districts, students, their families, as well as
other social service agencies. Bright Futures Academy places emphasis on a multidiscipli-nary approach and on-going collaborative case management, based on analysis of aca-
demic and behavioral data, and outcome measures.
Mission: Bright Futures Academy’s mission is to provide a safe, personalized, and data-driven learning environment for special needs students. Empowering them to develop posi-
tive social skills and independent living skills necessary to transition into a less restrictive educational setting or into adulthood after completing high school.
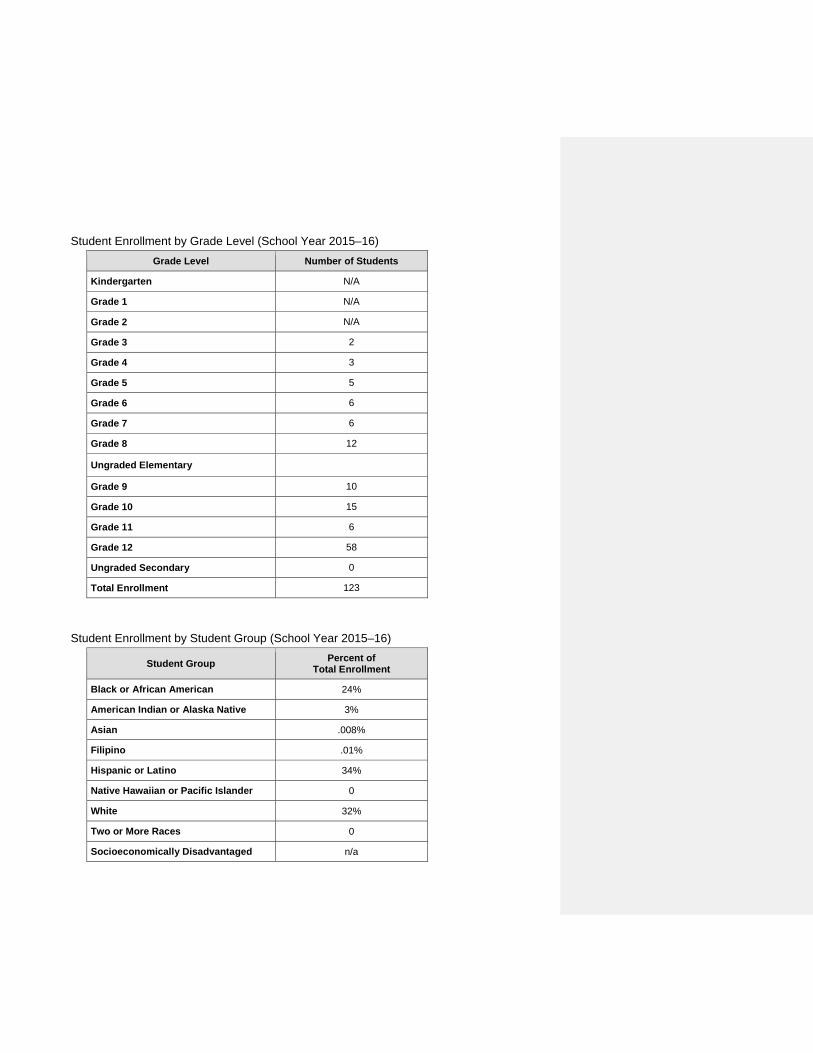
Student Enrollment by Grade Level (School Year 2015–16)
Grade Level Number of Students
Kindergarten N/A
Grade 1 N/A
Grade 2 N/A
Grade 3 2
Grade 4 3
Grade 5 5
Grade 6 6
Grade 7 6
Grade 8 12
Ungraded Elementary
Grade 9 10
Grade 10 15
Grade 11 6
Grade 12 58
Ungraded Secondary 0
Total Enrollment 123 Student Enrollment by Student Group (School Year 2015–16)
Student Group Percent of Total Enrollment
Black or African American 24%
American Indian or Alaska Native 3%
Asian .008%
Filipino .01%
Hispanic or Latino 34%
Native Hawaiian or Pacific Islander 0
White 32%
Two or More Races 0
Socioeconomically Disadvantaged n/a
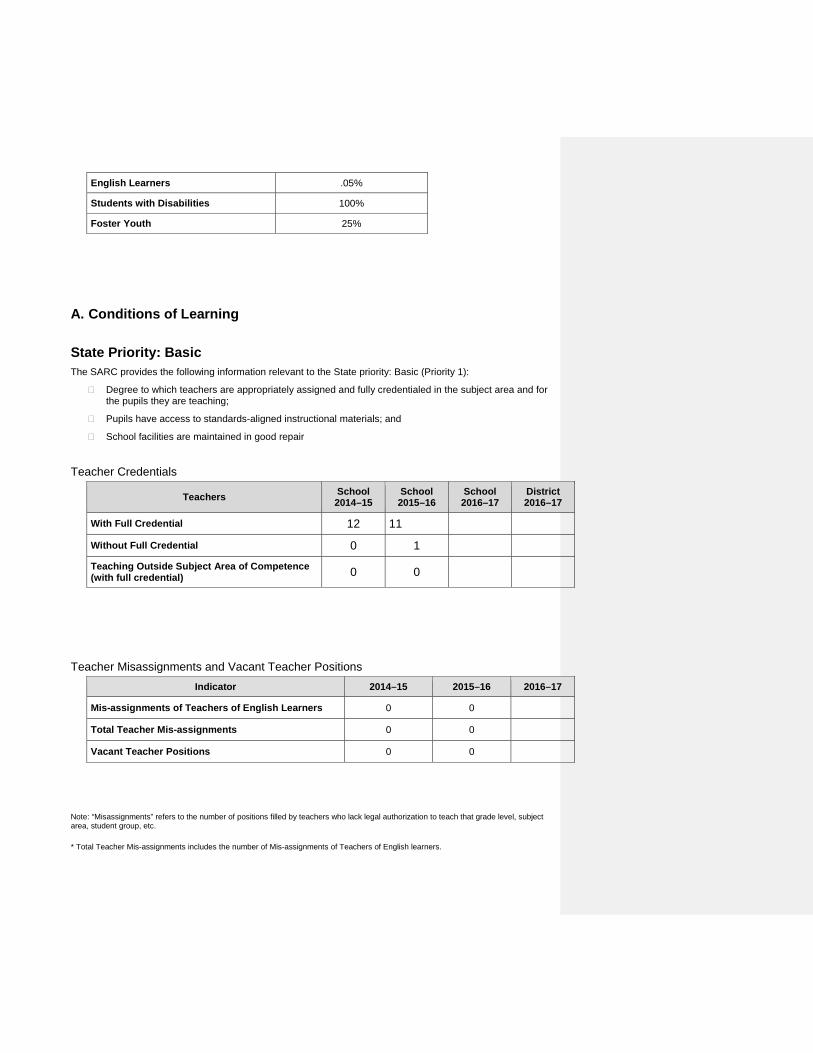
English Learners .05%
Students with Disabilities 100%
Foster Youth 25% A. Conditions of Learning State Priority: Basic The SARC provides the following information relevant to the State priority: Basic (Priority 1):
� Degree to which teachers are appropriately assigned and fully credentialed in the subject area and for the pupils they are teaching;
� Pupils have access to standards-aligned instructional materials; and
� School facilities are maintained in good repair Teacher Credentials
Teachers School 2014–15
School 2015–16
School 2016–17
District 2016–17
With Full Credential 12 11
Without Full Credential 0 1 Teaching Outside Subject Area of Competence (with full credential) 0 0
Teacher Misassignments and Vacant Teacher Positions
Indicator 2014–15 2015–16 2016–17
Mis-assignments of Teachers of English Learners 0 0
Total Teacher Mis-assignments 0 0
Vacant Teacher Positions 0 0 Note: “Misassignments” refers to the number of positions filled by teachers who lack legal authorization to teach that grade level, subject area, student group, etc. * Total Teacher Mis-assignments includes the number of Mis-assignments of Teachers of English learners.
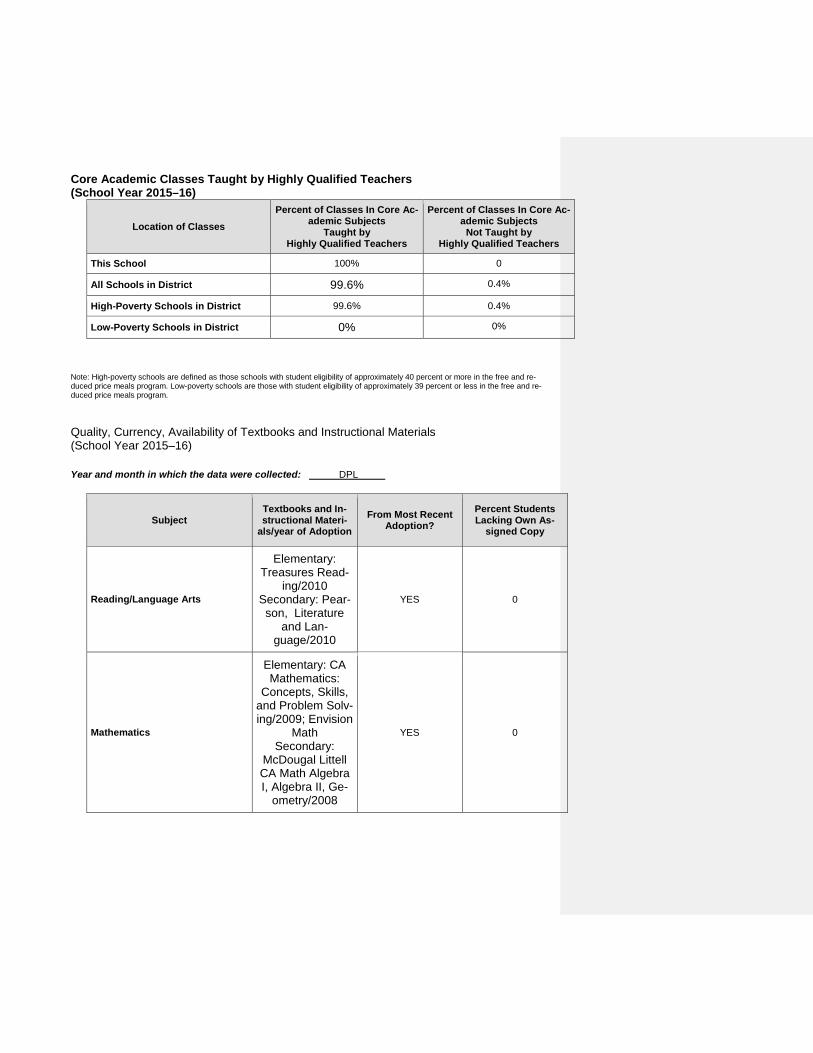
Core Academic Classes Taught by Highly Qualified Teachers (School Year 2015–16)
Location of Classes Percent of Classes In Core Ac-
ademic Subjects Taught by
Highly Qualified Teachers
Percent of Classes In Core Ac-ademic Subjects
Not Taught by Highly Qualified Teachers
This School 100% 0
All Schools in District 99.6% 0.4%
High-Poverty Schools in District 99.6% 0.4%
Low-Poverty Schools in District 0% 0% Note: High-poverty schools are defined as those schools with student eligibility of approximately 40 percent or more in the free and re-duced price meals program. Low-poverty schools are those with student eligibility of approximately 39 percent or less in the free and re-duced price meals program.
Quality, Currency, Availability of Textbooks and Instructional Materials (School Year 2015–16) Year and month in which the data were collected: DPL .
Subject Textbooks and In-structional Materi-
als/year of Adoption From Most Recent
Adoption? Percent Students Lacking Own As-
signed Copy
Reading/Language Arts
Elementary: Treasures Read-
ing/2010 Secondary: Pear-son, Literature
and Lan-guage/2010
YES 0
Mathematics
Elementary: CA Mathematics:
Concepts, Skills, and Problem Solv-ing/2009; Envision
Math Secondary:
McDougal Littell CA Math Algebra I, Algebra II, Ge-
ometry/2008
YES 0
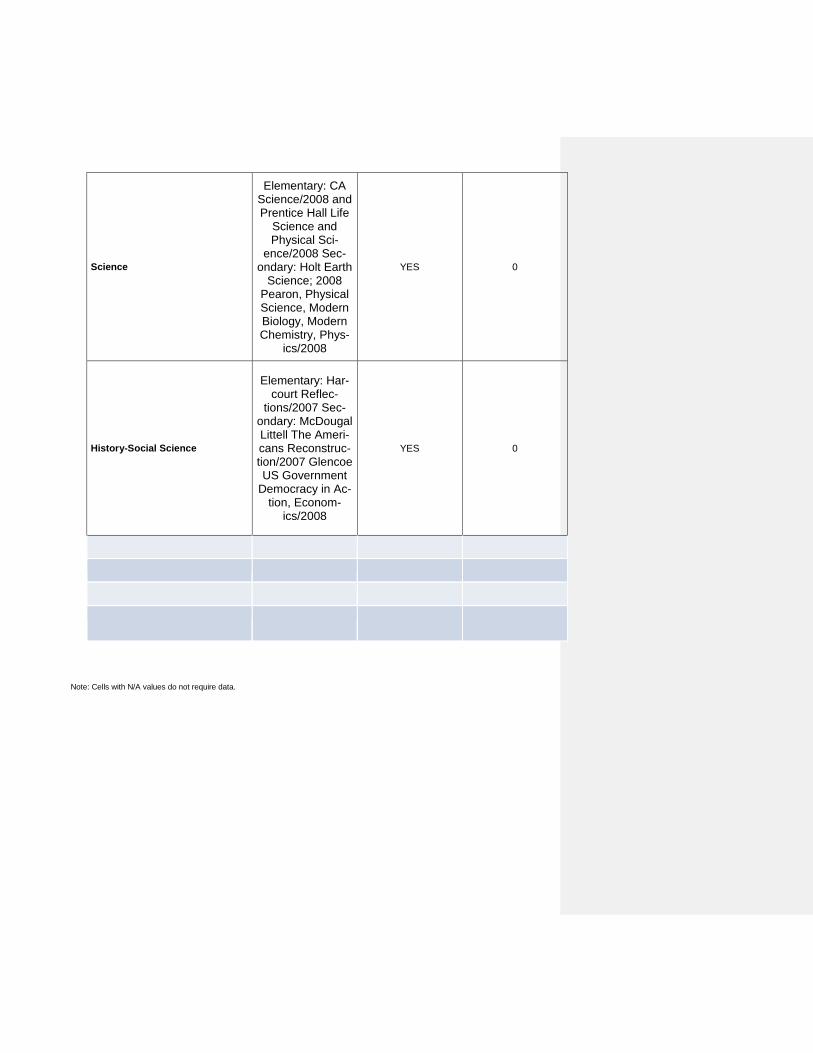
Science
Elementary: CA Science/2008 and Prentice Hall Life
Science and Physical Sci-
ence/2008 Sec-ondary: Holt Earth
Science; 2008 Pearon, Physical Science, Modern Biology, Modern Chemistry, Phys-
ics/2008
YES 0
History-Social Science
Elementary: Har-court Reflec-
tions/2007 Sec-ondary: McDougal Littell The Ameri-cans Reconstruc-tion/2007 Glencoe US Government
Democracy in Ac-tion, Econom-
ics/2008
YES 0
Note: Cells with N/A values do not require data.
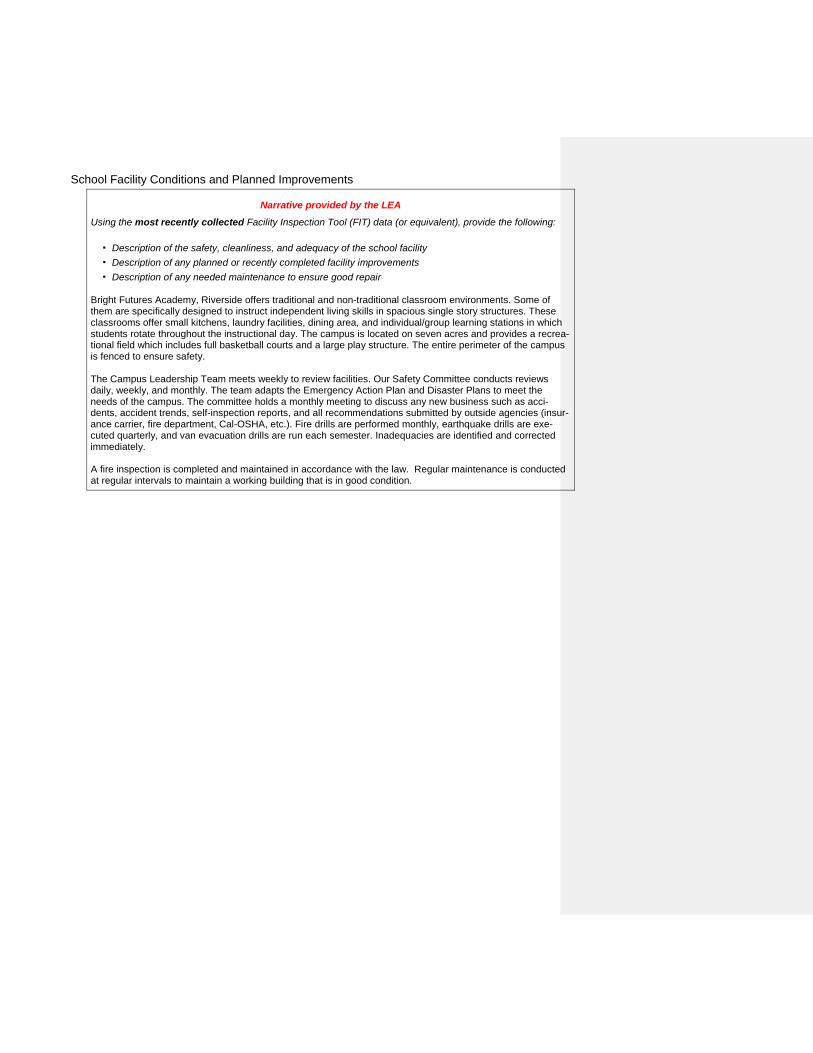
School Facility Conditions and Planned Improvements
Narrative provided by the LEA
Using the most recently collected Facility Inspection Tool (FIT) data (or equivalent), provide the following: ▪ Description of the safety, cleanliness, and adequacy of the school facility ▪ Description of any planned or recently completed facility improvements ▪ Description of any needed maintenance to ensure good repair
Bright Futures Academy, Riverside offers traditional and non-traditional classroom environments. Some of them are specifically designed to instruct independent living skills in spacious single story structures. These classrooms offer small kitchens, laundry facilities, dining area, and individual/group learning stations in which students rotate throughout the instructional day. The campus is located on seven acres and provides a recrea-tional field which includes full basketball courts and a large play structure. The entire perimeter of the campus is fenced to ensure safety. The Campus Leadership Team meets weekly to review facilities. Our Safety Committee conducts reviews daily, weekly, and monthly. The team adapts the Emergency Action Plan and Disaster Plans to meet the needs of the campus. The committee holds a monthly meeting to discuss any new business such as acci-dents, accident trends, self-inspection reports, and all recommendations submitted by outside agencies (insur-ance carrier, fire department, Cal-OSHA, etc.). Fire drills are performed monthly, earthquake drills are exe-cuted quarterly, and van evacuation drills are run each semester. Inadequacies are identified and corrected immediately. A fire inspection is completed and maintained in accordance with the law. Regular maintenance is conducted at regular intervals to maintain a working building that is in good condition.
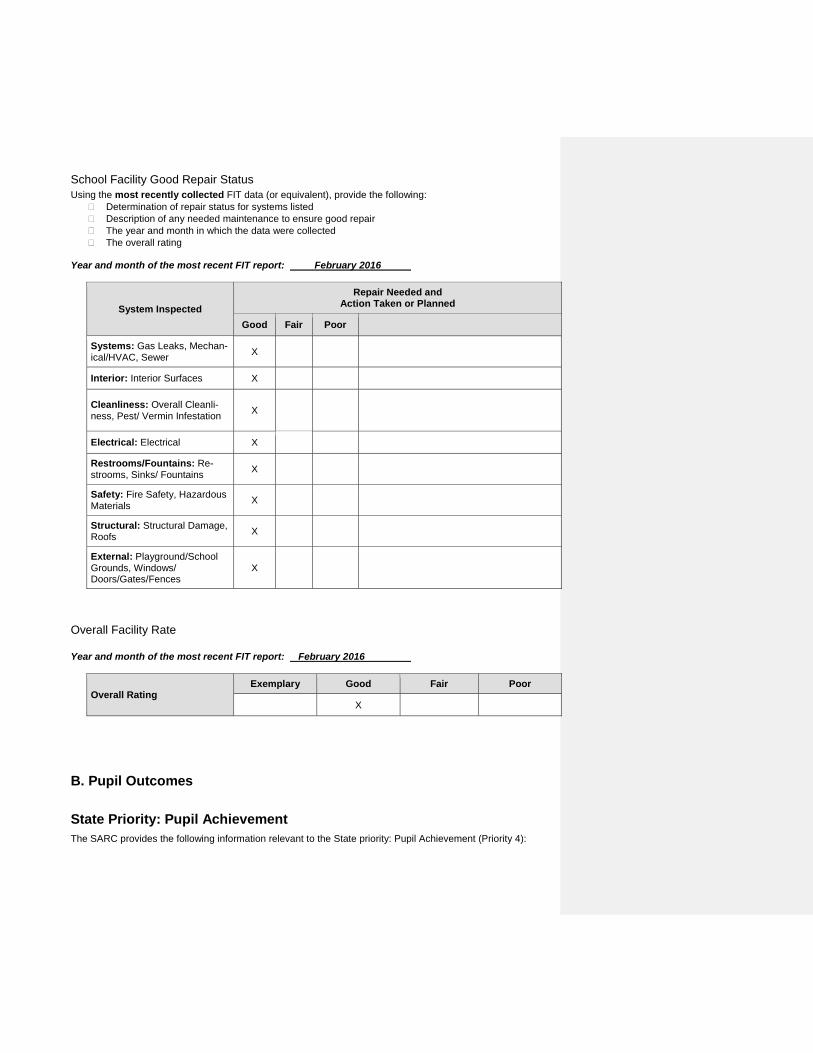
School Facility Good Repair Status Using the most recently collected FIT data (or equivalent), provide the following:
� Determination of repair status for systems listed � Description of any needed maintenance to ensure good repair � The year and month in which the data were collected � The overall rating
Year and month of the most recent FIT report: February 2016
System Inspected Repair Needed and
Action Taken or Planned
Good Fair Poor
Systems: Gas Leaks, Mechan-ical/HVAC, Sewer X
Interior: Interior Surfaces X
Cleanliness: Overall Cleanli-ness, Pest/ Vermin Infestation X
Electrical: Electrical X
Restrooms/Fountains: Re-strooms, Sinks/ Fountains X
Safety: Fire Safety, Hazardous Materials X
Structural: Structural Damage, Roofs X
External: Playground/School Grounds, Windows/ Doors/Gates/Fences
X
Overall Facility Rate Year and month of the most recent FIT report: February 2016
Overall Rating Exemplary Good Fair Poor
X B. Pupil Outcomes State Priority: Pupil Achievement The SARC provides the following information relevant to the State priority: Pupil Achievement (Priority 4):
×Statewide assessments (i.e., California Assessment of Student Performance and Progress [CAASPP] System, which includes the Smarter Balanced Summative Assessments for students in the general educa-tion population and the California Alternate Assessments [CAAs] for English language arts/literacy [ELA] and mathematics given in grades three through eight and grade eleven. The CAAs have replaced the Cali-fornia Alternate Performance Assessment [CAPA] for ELA and mathematics, which were eliminated in 2015. Only eligible students may participate in the administration of the CAAs. CAA items are aligned with alternate achievement standards, which are linked with the Common Core State Standards [CCSS] for students with significant cognitive disabilities); and
� The percentage of students who have successfully completed courses that satisfy the requirements for entrance to the University of California and the California State University, or career technical educa-tion sequences or programs of study
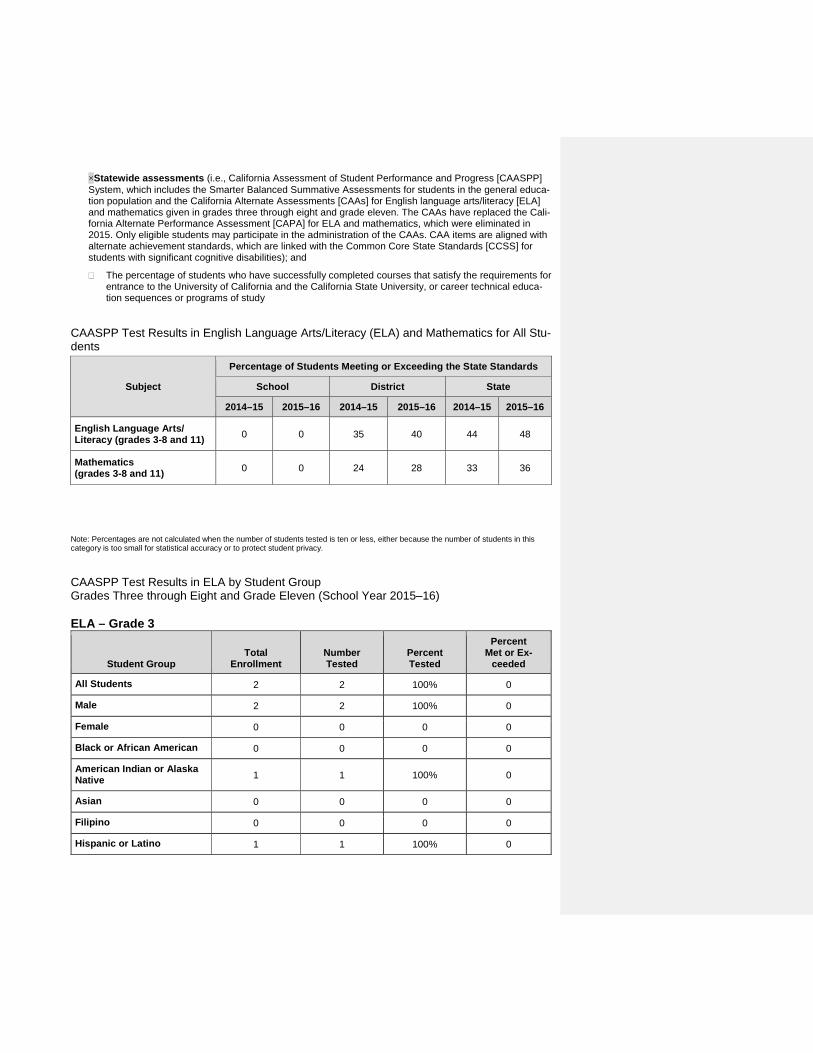
CAASPP Test Results in English Language Arts/Literacy (ELA) and Mathematics for All Stu-dents
Subject
Percentage of Students Meeting or Exceeding the State Standards
School District State
2014–15 2015–16 2014–15 2015–16 2014–15 2015–16
English Language Arts/ Literacy (grades 3-8 and 11) 0 0 35 40 44 48
Mathematics (grades 3-8 and 11) 0 0 24 28 33 36
Note: Percentages are not calculated when the number of students tested is ten or less, either because the number of students in this category is too small for statistical accuracy or to protect student privacy. CAASPP Test Results in ELA by Student Group Grades Three through Eight and Grade Eleven (School Year 2015–16) ELA – Grade 3
Student Group
Total
Enrollment Number Tested
Percent Tested
Percent Met or Ex-
ceeded All Students 2 2 100% 0
Male 2 2 100% 0
Female 0 0 0 0
Black or African American 0 0 0 0
American Indian or Alaska Native 1 1 100% 0
Asian 0 0 0 0
Filipino 0 0 0 0
Hispanic or Latino 1 1 100% 0
Native Hawaiian or Pacific Islander 0 0 0 0
White 0 0 0 0
Two or More Races 0 0 0 0
Socioeconomically Disad-vantaged 0 0 0 0
English Learners 0 0 0 0
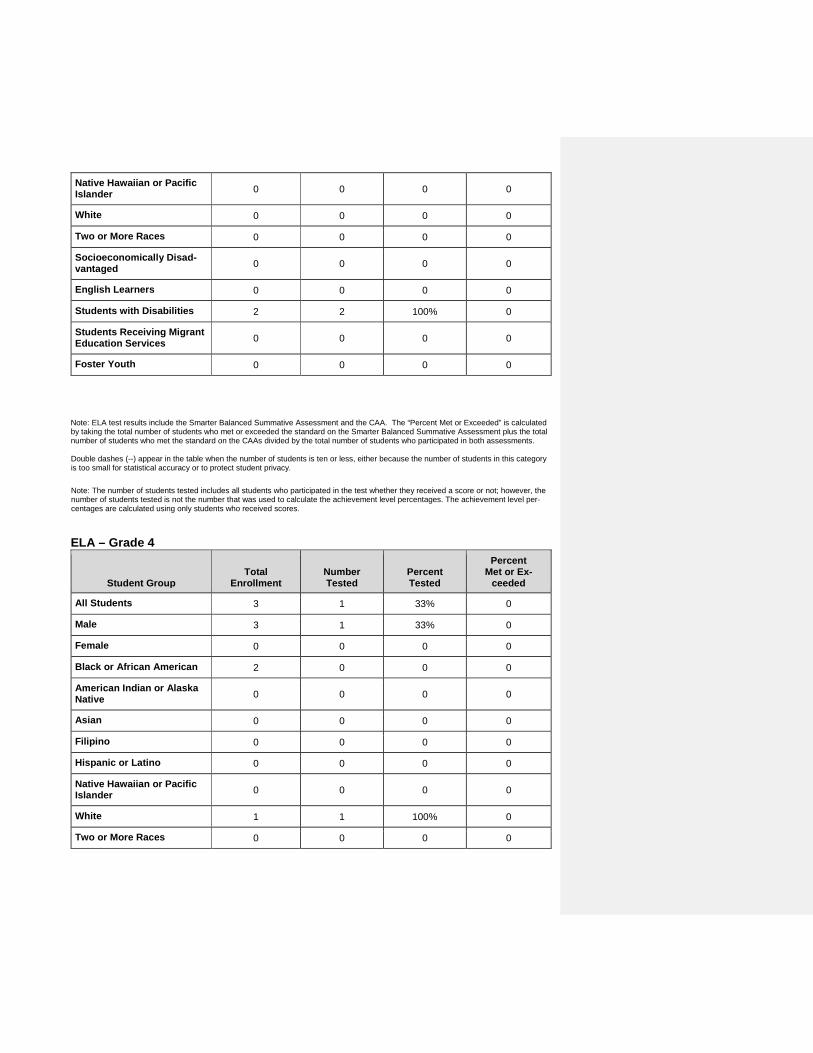
Students with Disabilities 2 2 100% 0
Students Receiving Migrant Education Services 0 0 0 0
Foster Youth 0 0 0 0
Note: ELA test results include the Smarter Balanced Summative Assessment and the CAA. The “Percent Met or Exceeded” is calculated by taking the total number of students who met or exceeded the standard on the Smarter Balanced Summative Assessment plus the total number of students who met the standard on the CAAs divided by the total number of students who participated in both assessments. Double dashes (--) appear in the table when the number of students is ten or less, either because the number of students in this category is too small for statistical accuracy or to protect student privacy. Note: The number of students tested includes all students who participated in the test whether they received a score or not; however, the number of students tested is not the number that was used to calculate the achievement level percentages. The achievement level per-centages are calculated using only students who received scores. ELA – Grade 4
Student Group
Total
Enrollment Number Tested
Percent Tested
Percent Met or Ex-
ceeded All Students 3 1 33% 0
Male 3 1 33% 0
Female 0 0 0 0
Black or African American 2 0 0 0
American Indian or Alaska Native 0 0 0 0
Asian 0 0 0 0
Filipino 0 0 0 0
Hispanic or Latino 0 0 0 0
Native Hawaiian or Pacific Islander 0 0 0 0
White 1 1 100% 0
Two or More Races 0 0 0 0
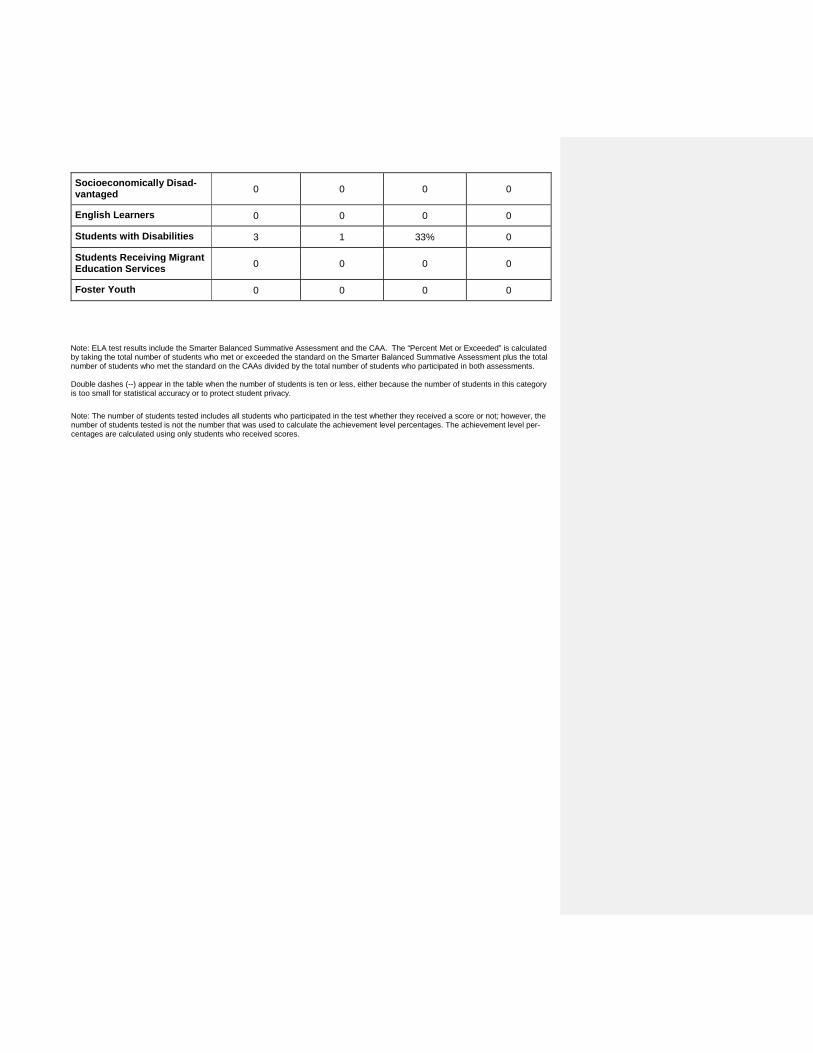
Socioeconomically Disad-vantaged 0 0 0 0
English Learners 0 0 0 0
Students with Disabilities 3 1 33% 0
Students Receiving Migrant Education Services 0 0 0 0
Foster Youth 0 0 0 0
Note: ELA test results include the Smarter Balanced Summative Assessment and the CAA. The “Percent Met or Exceeded” is calculated by taking the total number of students who met or exceeded the standard on the Smarter Balanced Summative Assessment plus the total number of students who met the standard on the CAAs divided by the total number of students who participated in both assessments. Double dashes (--) appear in the table when the number of students is ten or less, either because the number of students in this category is too small for statistical accuracy or to protect student privacy. Note: The number of students tested includes all students who participated in the test whether they received a score or not; however, the number of students tested is not the number that was used to calculate the achievement level percentages. The achievement level per-centages are calculated using only students who received scores.

ELA – Grade 5
Student Group
Total
Enrollment Number Tested
Percent Tested
Percent Met or Ex-
ceeded All Students 5 5 100% 0
Male 5 5 100% 0
Female 0 0 0 0
Black or African American 2 2 100% 0
American Indian or Alaska Native 0 0 0 0
Asian 0 0 0 0
Filipino 0 0 0 0
Hispanic or Latino 2 2 100% 0
Native Hawaiian or Pacific Islander 0 0 0 0
White 1 1 100% 0
Two or More Races 0 0 0 0
Socioeconomically Disad-vantaged 0 0 0 0
English Learners 0 0 0 0
Students with Disabilities 5 5 100% 0
Students Receiving Migrant Education Services 0 0 0 0
Foster Youth 1 1 100% 0
Note: ELA test results include the Smarter Balanced Summative Assessment and the CAA. The “Percent Met or Exceeded” is calculated by taking the total number of students who met or exceeded the standard on the Smarter Balanced Summative Assessment plus the total number of students who met the standard on the CAAs divided by the total number of students who participated in both assessments. Double dashes (--) appear in the table when the number of students is ten or less, either because the number of students in this category is too small for statistical accuracy or to protect student privacy. Note: The number of students tested includes all students who participated in the test whether they received a score or not; however, the number of students tested is not the number that was used to calculate the achievement level percentages. The achievement level per-centages are calculated using only students who received scores.
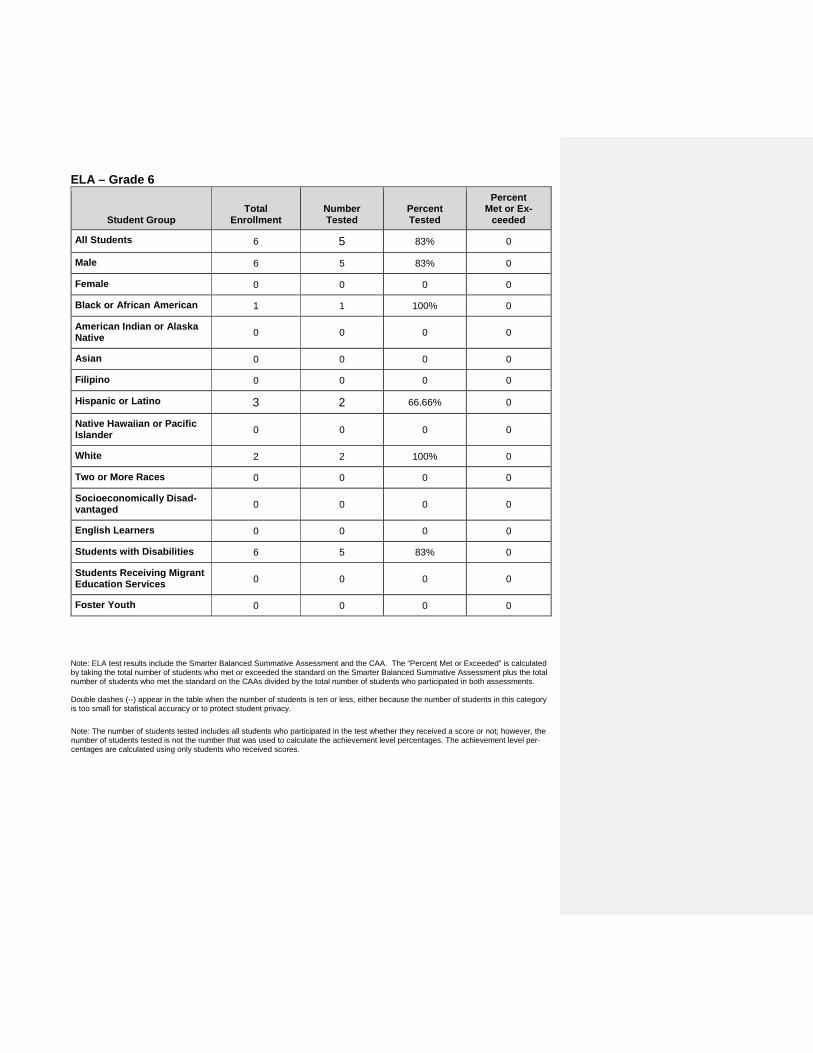
ELA – Grade 6
Student Group
Total
Enrollment Number Tested
Percent Tested
Percent Met or Ex-
ceeded All Students 6 5 83% 0
Male 6 5 83% 0
Female 0 0 0 0
Black or African American 1 1 100% 0
American Indian or Alaska Native 0 0 0 0
Asian 0 0 0 0
Filipino 0 0 0 0
Hispanic or Latino 3 2 66.66% 0
Native Hawaiian or Pacific Islander 0 0 0 0
White 2 2 100% 0
Two or More Races 0 0 0 0
Socioeconomically Disad-vantaged 0 0 0 0
English Learners 0 0 0 0
Students with Disabilities 6 5 83% 0
Students Receiving Migrant Education Services 0 0 0 0
Foster Youth 0 0 0 0
Note: ELA test results include the Smarter Balanced Summative Assessment and the CAA. The “Percent Met or Exceeded” is calculated by taking the total number of students who met or exceeded the standard on the Smarter Balanced Summative Assessment plus the total number of students who met the standard on the CAAs divided by the total number of students who participated in both assessments. Double dashes (--) appear in the table when the number of students is ten or less, either because the number of students in this category is too small for statistical accuracy or to protect student privacy. Note: The number of students tested includes all students who participated in the test whether they received a score or not; however, the number of students tested is not the number that was used to calculate the achievement level percentages. The achievement level per-centages are calculated using only students who received scores.
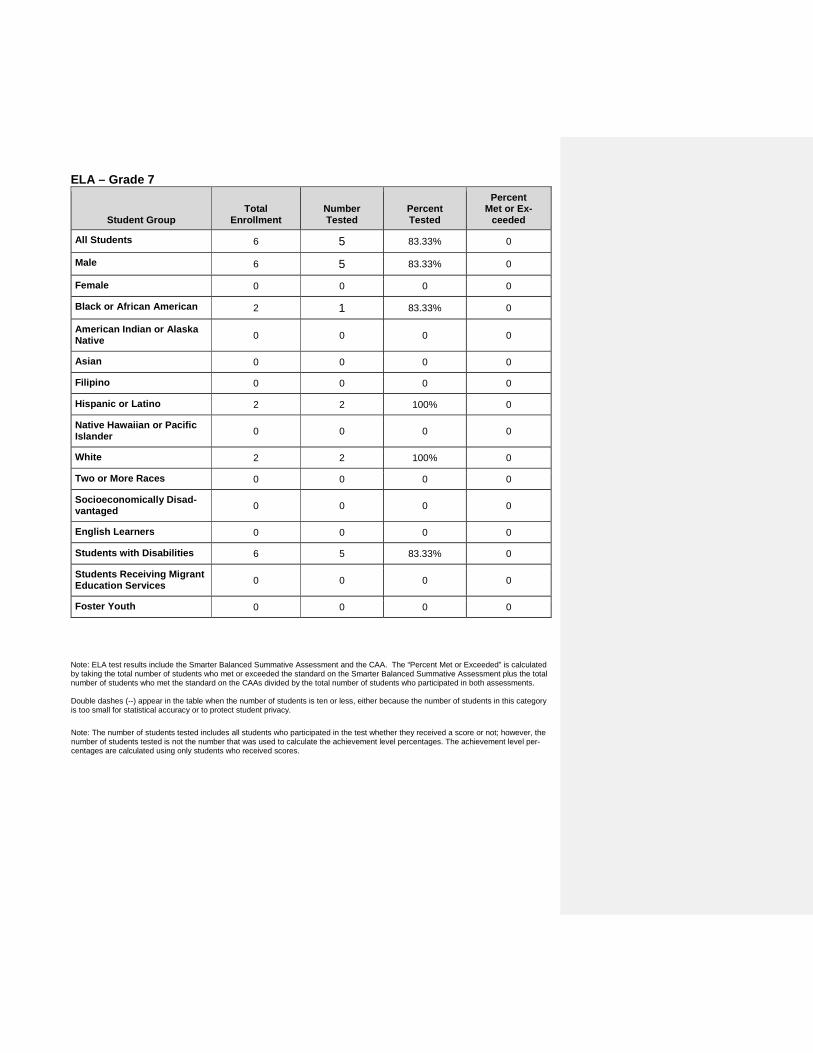
ELA – Grade 7
Student Group
Total
Enrollment Number Tested
Percent Tested
Percent Met or Ex-
ceeded All Students 6 5 83.33% 0
Male 6 5 83.33% 0
Female 0 0 0 0
Black or African American 2 1 83.33% 0
American Indian or Alaska Native 0 0 0 0
Asian 0 0 0 0
Filipino 0 0 0 0
Hispanic or Latino 2 2 100% 0
Native Hawaiian or Pacific Islander 0 0 0 0
White 2 2 100% 0
Two or More Races 0 0 0 0
Socioeconomically Disad-vantaged 0 0 0 0
English Learners 0 0 0 0
Students with Disabilities 6 5 83.33% 0
Students Receiving Migrant Education Services 0 0 0 0
Foster Youth 0 0 0 0
Note: ELA test results include the Smarter Balanced Summative Assessment and the CAA. The “Percent Met or Exceeded” is calculated by taking the total number of students who met or exceeded the standard on the Smarter Balanced Summative Assessment plus the total number of students who met the standard on the CAAs divided by the total number of students who participated in both assessments. Double dashes (--) appear in the table when the number of students is ten or less, either because the number of students in this category is too small for statistical accuracy or to protect student privacy. Note: The number of students tested includes all students who participated in the test whether they received a score or not; however, the number of students tested is not the number that was used to calculate the achievement level percentages. The achievement level per-centages are calculated using only students who received scores.

ELA – Grade 8
Student Group
Total
Enrollment Number Tested
Percent Tested
Percent Met or Ex-
ceeded All Students 13 13 85% 0
Male 11 11 98% 0
Female 2 2 100% 0
Black or African American 1 1 100% 0
American Indian or Alaska Native 1 1 100% 0
Asian 0 0 0 0
Filipino 0 0 0 0
Hispanic or Latino 7 7 85% 0
Native Hawaiian or Pacific Islander 0 0 0 0
White 3 3 100% 0
Two or More Races 0 0 0 0
Socioeconomically Disad-vantaged 0 0 0 0
English Learners 1 1 100% 0
Students with Disabilities 13 13 13 0
Students Receiving Migrant Education Services 0 0 0 0
Foster Youth 1 1 1 0
Note: ELA test results include the Smarter Balanced Summative Assessment and the CAA. The “Percent Met or Exceeded” is calculated by taking the total number of students who met or exceeded the standard on the Smarter Balanced Summative Assessment plus the total number of students who met the standard on the CAAs divided by the total number of students who participated in both assessments. Double dashes (--) appear in the table when the number of students is ten or less, either because the number of students in this category is too small for statistical accuracy or to protect student privacy. Note: The number of students tested includes all students who participated in the test whether they received a score or not; however, the number of students tested is not the number that was used to calculate the achievement level percentages. The achievement level per-centages are calculated using only students who received scores.
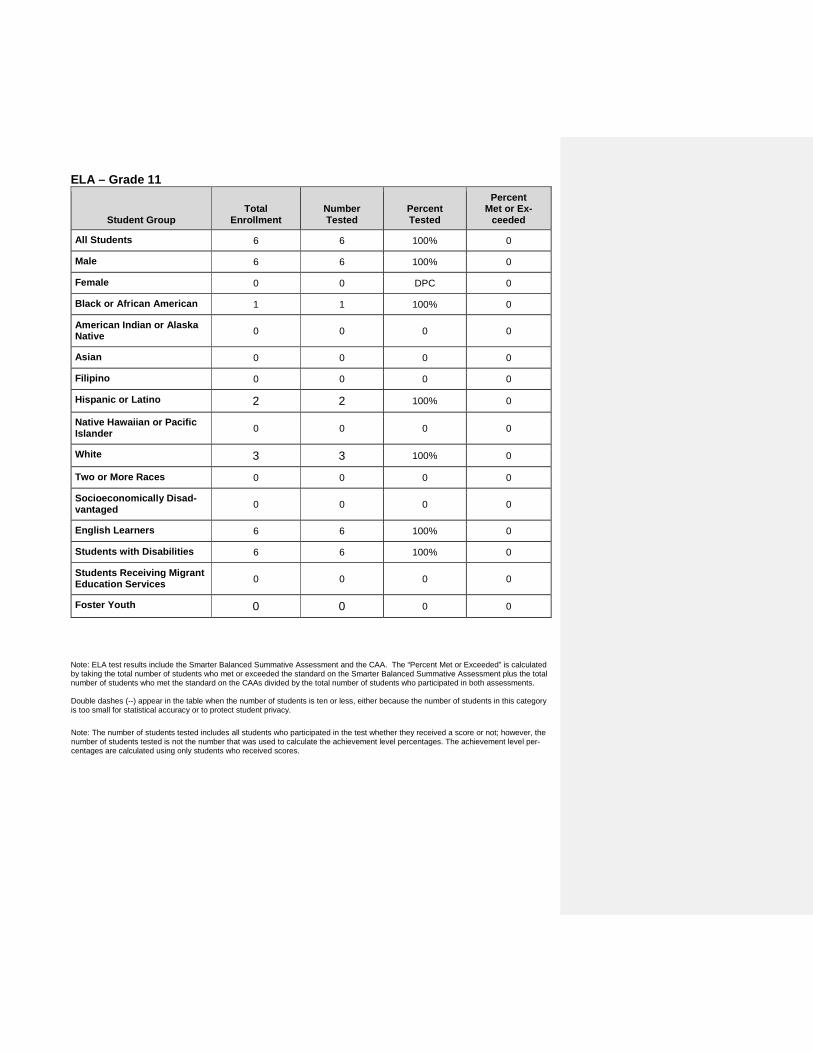
ELA – Grade 11
Student Group
Total
Enrollment Number Tested
Percent Tested
Percent Met or Ex-
ceeded All Students 6 6 100% 0
Male 6 6 100% 0
Female 0 0 DPC 0
Black or African American 1 1 100% 0
American Indian or Alaska Native 0 0 0 0
Asian 0 0 0 0
Filipino 0 0 0 0
Hispanic or Latino 2 2 100% 0
Native Hawaiian or Pacific Islander 0 0 0 0
White 3 3 100% 0
Two or More Races 0 0 0 0
Socioeconomically Disad-vantaged 0 0 0 0
English Learners 6 6 100% 0
Students with Disabilities 6 6 100% 0
Students Receiving Migrant Education Services 0 0 0 0
Foster Youth 0 0 0 0
Note: ELA test results include the Smarter Balanced Summative Assessment and the CAA. The “Percent Met or Exceeded” is calculated by taking the total number of students who met or exceeded the standard on the Smarter Balanced Summative Assessment plus the total number of students who met the standard on the CAAs divided by the total number of students who participated in both assessments. Double dashes (--) appear in the table when the number of students is ten or less, either because the number of students in this category is too small for statistical accuracy or to protect student privacy. Note: The number of students tested includes all students who participated in the test whether they received a score or not; however, the number of students tested is not the number that was used to calculate the achievement level percentages. The achievement level per-centages are calculated using only students who received scores.
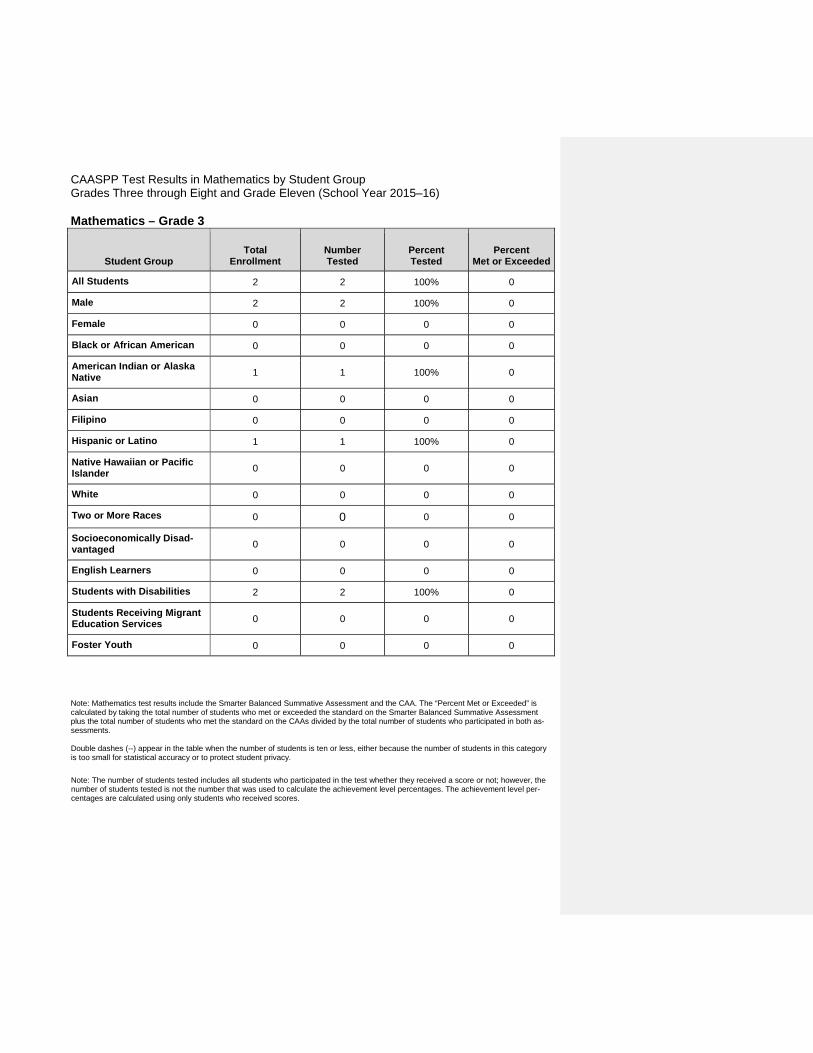
CAASPP Test Results in Mathematics by Student Group Grades Three through Eight and Grade Eleven (School Year 2015–16) Mathematics – Grade 3
Student Group
Total
Enrollment Number Tested
Percent Tested
Percent Met or Exceeded
All Students 2 2 100% 0
Male 2 2 100% 0
Female 0 0 0 0
Black or African American 0 0 0 0
American Indian or Alaska Native 1 1 100% 0
Asian 0 0 0 0
Filipino 0 0 0 0
Hispanic or Latino 1 1 100% 0
Native Hawaiian or Pacific Islander 0 0 0 0
White 0 0 0 0
Two or More Races 0 0 0 0
Socioeconomically Disad-vantaged 0 0 0 0
English Learners 0 0 0 0
Students with Disabilities 2 2 100% 0
Students Receiving Migrant Education Services 0 0 0 0
Foster Youth 0 0 0 0
Note: Mathematics test results include the Smarter Balanced Summative Assessment and the CAA. The “Percent Met or Exceeded” is calculated by taking the total number of students who met or exceeded the standard on the Smarter Balanced Summative Assessment plus the total number of students who met the standard on the CAAs divided by the total number of students who participated in both as-sessments. Double dashes (--) appear in the table when the number of students is ten or less, either because the number of students in this category is too small for statistical accuracy or to protect student privacy. Note: The number of students tested includes all students who participated in the test whether they received a score or not; however, the number of students tested is not the number that was used to calculate the achievement level percentages. The achievement level per-centages are calculated using only students who received scores.
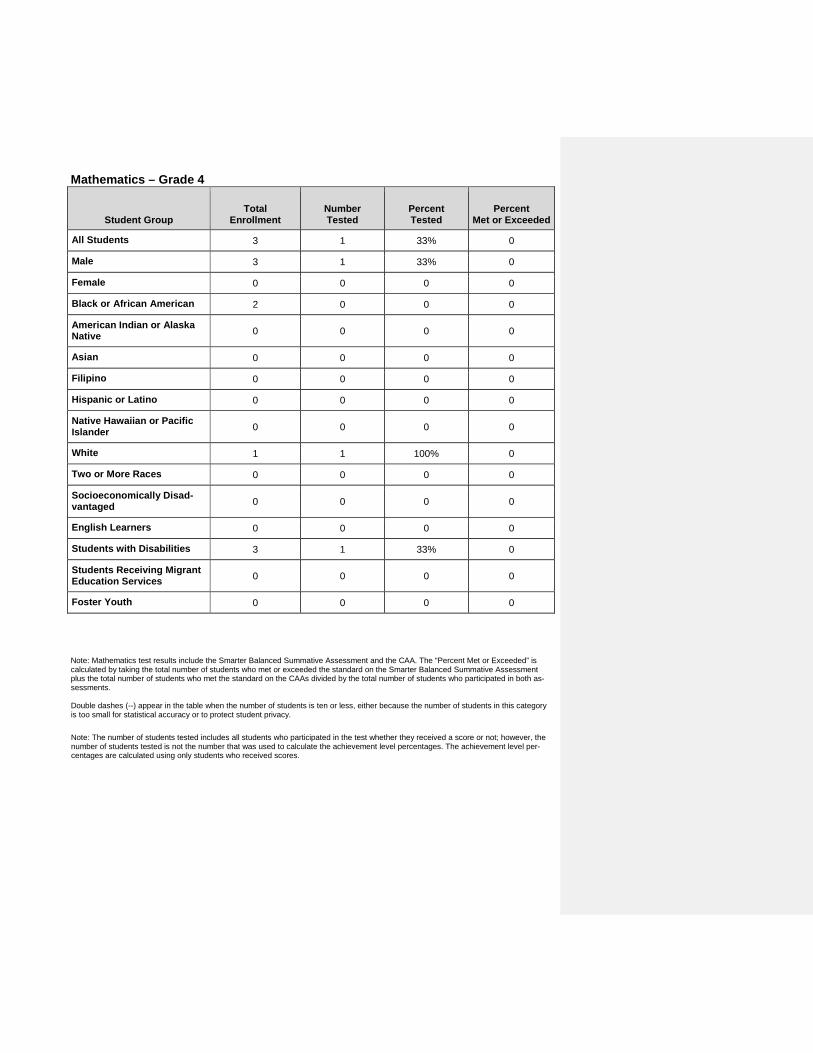
Mathematics – Grade 4
Student Group
Total
Enrollment Number Tested
Percent Tested
Percent Met or Exceeded
All Students 3 1 33% 0
Male 3 1 33% 0
Female 0 0 0 0
Black or African American 2 0 0 0
American Indian or Alaska Native 0 0 0 0
Asian 0 0 0 0
Filipino 0 0 0 0
Hispanic or Latino 0 0 0 0
Native Hawaiian or Pacific Islander 0 0 0 0
White 1 1 100% 0
Two or More Races 0 0 0 0
Socioeconomically Disad-vantaged 0 0 0 0
English Learners 0 0 0 0
Students with Disabilities 3 1 33% 0
Students Receiving Migrant Education Services 0 0 0 0
Foster Youth 0 0 0 0
Note: Mathematics test results include the Smarter Balanced Summative Assessment and the CAA. The “Percent Met or Exceeded” is calculated by taking the total number of students who met or exceeded the standard on the Smarter Balanced Summative Assessment plus the total number of students who met the standard on the CAAs divided by the total number of students who participated in both as-sessments. Double dashes (--) appear in the table when the number of students is ten or less, either because the number of students in this category is too small for statistical accuracy or to protect student privacy. Note: The number of students tested includes all students who participated in the test whether they received a score or not; however, the number of students tested is not the number that was used to calculate the achievement level percentages. The achievement level per-centages are calculated using only students who received scores.

Mathematics – Grade 5
Student Group
Total
Enrollment Number Tested
Percent Tested
Percent Met or Ex-
ceeded All Students 5 5 100% 0
Male 5 5 100% 0
Female 0 0 0 0
Black or African American 2 2 100% 0
American Indian or Alaska Native 0 0 0 0
Asian 0 0 0 0
Filipino 0 0 0 0
Hispanic or Latino 2 2 100% 0
Native Hawaiian or Pacific Islander 0 0 0 0
White 1 1 100% 0
Two or More Races 0 0 0 0
Socioeconomically Disad-vantaged 0 0 0 0
English Learners 0 0 0 0
Students with Disabilities 5 5 100% 0
Students Receiving Migrant Education Services 0 0 0 0
Foster Youth 1 1 100% 0
Note: Mathematics test results include the Smarter Balanced Summative Assessment and the CAA. The “Percent Met or Exceeded” is calculated by taking the total number of students who met or exceeded the standard on the Smarter Balanced Summative Assessment plus the total number of students who met the standard on the CAAs divided by the total number of students who participated in both as-sessments. Double dashes (--) appear in the table when the number of students is ten or less, either because the number of students in this category is too small for statistical accuracy or to protect student privacy. Note: The number of students tested includes all students who participated in the test whether they received a score or not; however, the number of students tested is not the number that was used to calculate the achievement level percentages. The achievement level per-centages are calculated using only students who received scores.

Mathematics – Grade 6
Student Group
Total
Enrollment Number Tested
Percent Tested
Percent Met or Ex-
ceeded All Students 6 6 100% 0
Male 6 6 100% 0
Female 0 0 0 0
Black or African American 1 1 100% 0
American Indian or Alaska Native 0 0 0 0
Asian 0 0 0 0
Filipino 0 0 0 0
Hispanic or Latino 3 3 100% 0
Native Hawaiian or Pacific Islander 0 0 0 0
White 2 2 100% 0
Two or More Races 0 0 0 0
Socioeconomically Disad-vantaged 0 0 0 0
English Learners 0 0 0 0
Students with Disabilities 6 6 0 0
Students Receiving Migrant Education Services 0 0 0 0
Foster Youth 0 0 0 0
Note: Mathematics test results include the Smarter Balanced Summative Assessment and the CAA. The “Percent Met or Exceeded” is calculated by taking the total number of students who met or exceeded the standard on the Smarter Balanced Summative Assessment plus the total number of students who met the standard on the CAAs divided by the total number of students who participated in both as-sessments. Double dashes (--) appear in the table when the number of students is ten or less, either because the number of students in this category is too small for statistical accuracy or to protect student privacy. Note: The number of students tested includes all students who participated in the test whether they received a score or not; however, the number of students tested is not the number that was used to calculate the achievement level percentages. The achievement level per-centages are calculated using only students who received scores.

Mathematics – Grade 7
Student Group
Total
Enrollment Number Tested
Percent Tested
Percent Met or Ex-
ceeded All Students 6 5 83.33% 0
Male 6 5 83.33% 0
Female 0 0 0 0
Black or African American 2 1 83.33% 0
American Indian or Alaska Native 0 0 0 0
Asian 0 0 0 0
Filipino 0 0 0 0
Hispanic or Latino 2 2 100% 0
Native Hawaiian or Pacific Islander 0 0 0 0
White 2 2 100% 0
Two or More Races 0 0 0 0
Socioeconomically Disad-vantaged 0 0 0 0
English Learners 0 0 0 0
Students with Disabilities 6 5 83.33% 0
Students Receiving Migrant Education Services 0 0 0 0
Foster Youth 0 0 0 0
Note: Mathematics test results include the Smarter Balanced Summative Assessment and the CAA. The “Percent Met or Exceeded” is calculated by taking the total number of students who met or exceeded the standard on the Smarter Balanced Summative Assessment plus the total number of students who met the standard on the CAAs divided by the total number of students who participated in both as-sessments. Double dashes (--) appear in the table when the number of students is ten or less, either because the number of students in this category is too small for statistical accuracy or to protect student privacy. Note: The number of students tested includes all students who participated in the test whether they received a score or not; however, the number of students tested is not the number that was used to calculate the achievement level percentages. The achievement level per-centages are calculated using only students who received scores.

Mathematics – Grade 8
Student Group
Total
Enrollment Number Tested
Percent Tested
Percent Met or Ex-
ceeded All Students 13 13 85% 0
Male 11 11 98% 0
Female 2 2 100% 0
Black or African American 1 1 100% 0
American Indian or Alaska Native 1 1 100% 0
Asian 0 0 0 0
Filipino 0 0 0 0
Hispanic or Latino 7 7 85% 0
Native Hawaiian or Pacific Islander 0 0 0 0
White 3 3 100% 0
Two or More Races 0 0 0 0
Socioeconomically Disad-vantaged 0 0 0 0
English Learners 1 1 100% 0
Students with Disabilities 13 13 13 0
Students Receiving Migrant Education Services 0 0 0 0
Foster Youth 1 1 1 0
Note: Mathematics test results include the Smarter Balanced Summative Assessment and the CAA. The “Percent Met or Exceeded” is calculated by taking the total number of students who met or exceeded the standard on the Smarter Balanced Summative Assessment plus the total number of students who met the standard on the CAAs divided by the total number of students who participated in both as-sessments. Double dashes (--) appear in the table when the number of students is ten or less, either because the number of students in this category is too small for statistical accuracy or to protect student privacy. Note: The number of students tested includes all students who participated in the test whether they received a score or not; however, the number of students tested is not the number that was used to calculate the achievement level percentages. The achievement level per-centages are calculated using only students who received scores.

Mathematics – Grade 11
Student Group
Total
Enrollment Number Tested
Percent Tested
Percent Met or Ex-
ceeded All Students 6 6 100% 0
Male 6 6 100% 0
Female 0 0 0 0
Black or African American 1 1 100% 0
American Indian or Alaska Native 0 0 0 0
Asian 0 0 0 0
Filipino 0 0 0 0
Hispanic or Latino 2 2 100% 0
Native Hawaiian or Pacific Islander 0 0 0 0
White 3 3 100% 0
Two or More Races 0 0 0 0
Socioeconomically Disad-vantaged 0 0 0 0
English Learners 6 0 0 0
Students with Disabilities 6 6 100% 0
Students Receiving Migrant Education Services 0 0 0 0
Foster Youth 0 0 0 0
Note: Mathematics test results include the Smarter Balanced Summative Assessment and the CAA. The “Percent Met or Exceeded” is calculated by taking the total number of students who met or exceeded the standard on the Smarter Balanced Summative Assessment plus the total number of students who met the standard on the CAAs divided by the total number of students who participated in both as-sessments. Double dashes (--) appear in the table when the number of students is ten or less, either because the number of students in this category is too small for statistical accuracy or to protect student privacy. Note: The number of students tested includes all students who participated in the test whether they received a score or not; however, the number of students tested is not the number that was used to calculate the achievement level percentages. The achievement level per-centages are calculated using only students who received scores.
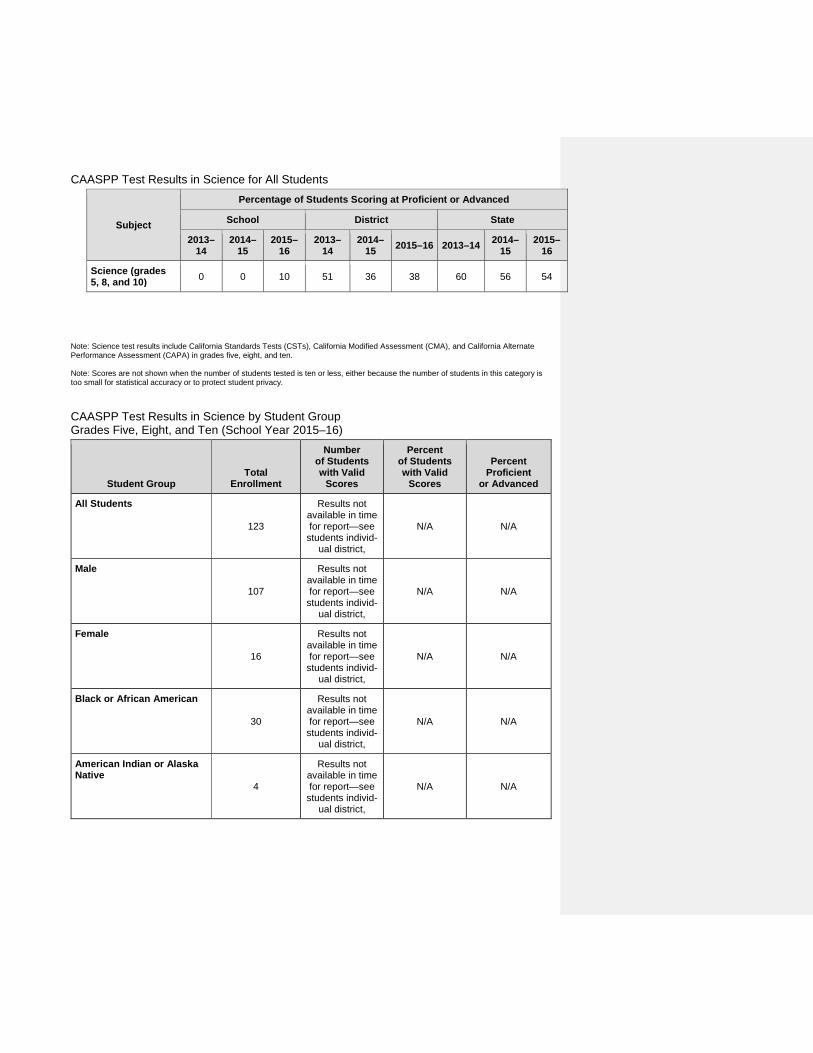
CAASPP Test Results in Science for All Students
Subject
Percentage of Students Scoring at Proficient or Advanced
School District State 2013–
14 2014–
15 2015–
16 2013–
14 2014–
15 2015–16 2013–14 2014–15
2015–16
Science (grades 5, 8, and 10) 0 0 10 51 36 38 60 56 54
Note: Science test results include California Standards Tests (CSTs), California Modified Assessment (CMA), and California Alternate Performance Assessment (CAPA) in grades five, eight, and ten. Note: Scores are not shown when the number of students tested is ten or less, either because the number of students in this category is too small for statistical accuracy or to protect student privacy. CAASPP Test Results in Science by Student Group Grades Five, Eight, and Ten (School Year 2015–16)
Student Group
Total
Enrollment
Number of Students with Valid
Scores
Percent of Students with Valid
Scores
Percent Proficient
or Advanced All Students
123
Results not available in time for report—see
students individ-ual district,
N/A N/A
Male
107
Results not available in time for report—see
students individ-ual district,
N/A N/A
Female
16
Results not available in time for report—see
students individ-ual district,
N/A N/A
Black or African American
30
Results not available in time for report—see
students individ-ual district,
N/A N/A
American Indian or Alaska Native
4
Results not available in time for report—see
students individ-ual district,
N/A N/A
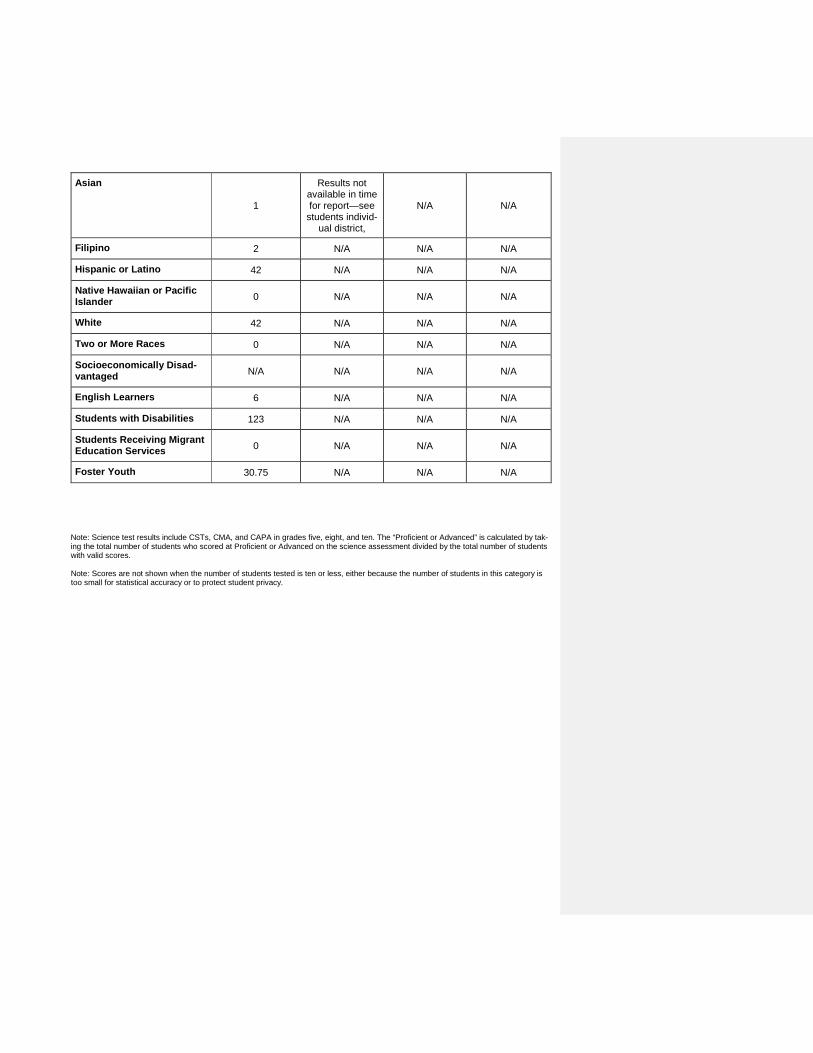
Asian
1
Results not available in time for report—see
students individ-ual district,
N/A N/A
Filipino 2 N/A N/A N/A
Hispanic or Latino 42 N/A N/A N/A
Native Hawaiian or Pacific Islander 0 N/A N/A N/A
White 42 N/A N/A N/A
Two or More Races 0 N/A N/A N/A
Socioeconomically Disad-vantaged N/A N/A N/A N/A
English Learners 6 N/A N/A N/A
Students with Disabilities 123 N/A N/A N/A
Students Receiving Migrant Education Services 0 N/A N/A N/A
Foster Youth 30.75 N/A N/A N/A
Note: Science test results include CSTs, CMA, and CAPA in grades five, eight, and ten. The “Proficient or Advanced” is calculated by tak-ing the total number of students who scored at Proficient or Advanced on the science assessment divided by the total number of students with valid scores. Note: Scores are not shown when the number of students tested is ten or less, either because the number of students in this category is too small for statistical accuracy or to protect student privacy.
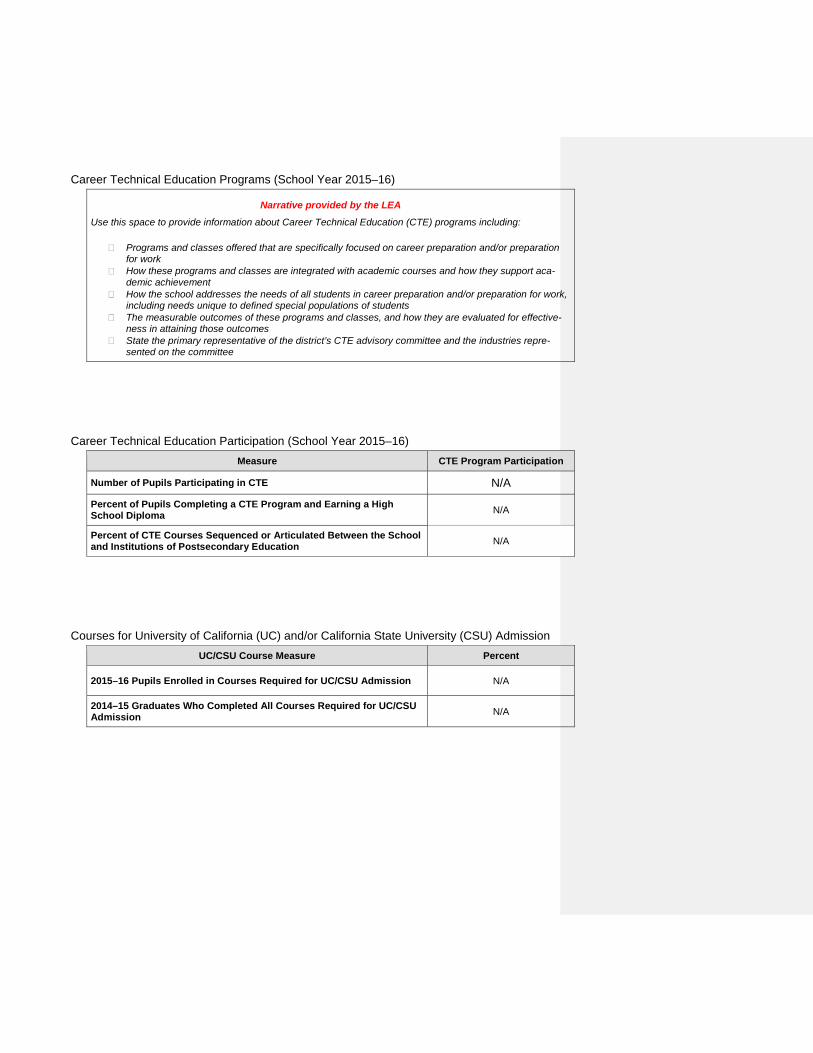
Career Technical Education Programs (School Year 2015–16)
Narrative provided by the LEA Use this space to provide information about Career Technical Education (CTE) programs including:
� Programs and classes offered that are specifically focused on career preparation and/or preparation for work
� How these programs and classes are integrated with academic courses and how they support aca-demic achievement
� How the school addresses the needs of all students in career preparation and/or preparation for work, including needs unique to defined special populations of students
� The measurable outcomes of these programs and classes, and how they are evaluated for effective-ness in attaining those outcomes
� State the primary representative of the district’s CTE advisory committee and the industries repre-sented on the committee
Career Technical Education Participation (School Year 2015–16)
Measure CTE Program Participation
Number of Pupils Participating in CTE N/A
Percent of Pupils Completing a CTE Program and Earning a High School Diploma N/A
Percent of CTE Courses Sequenced or Articulated Between the School and Institutions of Postsecondary Education N/A
Courses for University of California (UC) and/or California State University (CSU) Admission
UC/CSU Course Measure Percent
2015–16 Pupils Enrolled in Courses Required for UC/CSU Admission N/A
2014–15 Graduates Who Completed All Courses Required for UC/CSU Admission N/A
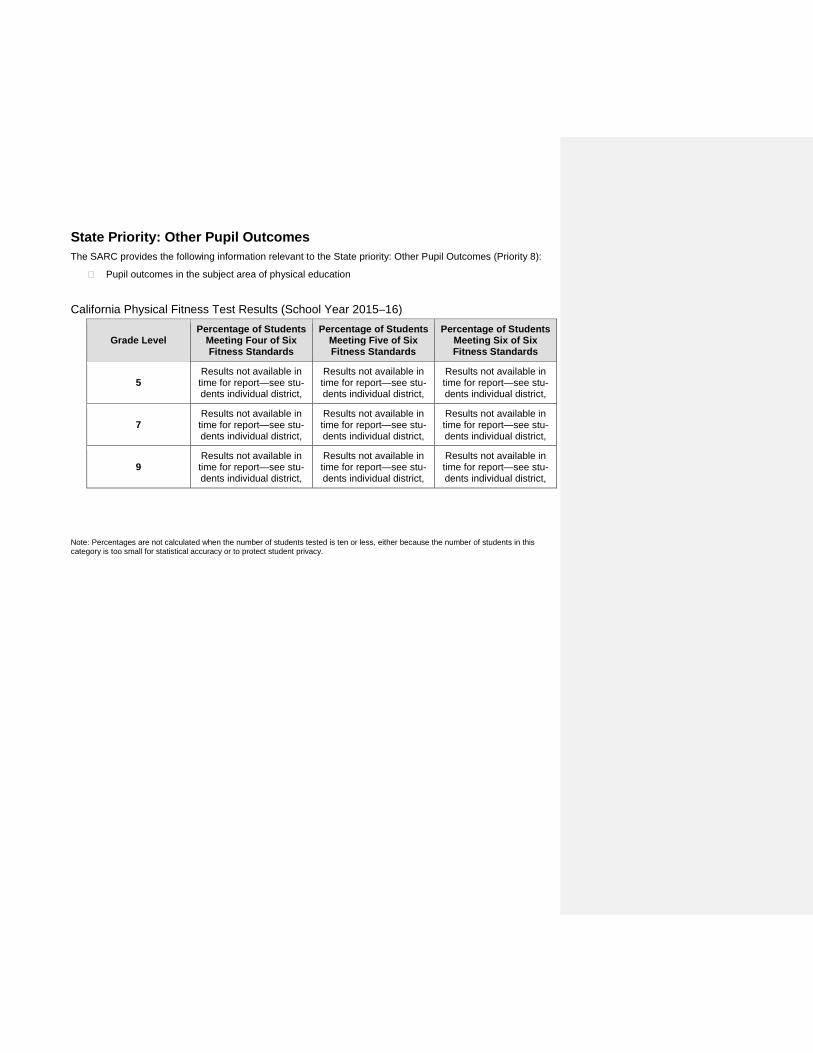
State Priority: Other Pupil Outcomes The SARC provides the following information relevant to the State priority: Other Pupil Outcomes (Priority 8):
� Pupil outcomes in the subject area of physical education
California Physical Fitness Test Results (School Year 2015–16)
Grade Level Percentage of Students
Meeting Four of Six Fitness Standards
Percentage of Students Meeting Five of Six Fitness Standards
Percentage of Students Meeting Six of Six Fitness Standards
5 Results not available in time for report—see stu-dents individual district,
Results not available in time for report—see stu-dents individual district,
Results not available in time for report—see stu-dents individual district,
7 Results not available in time for report—see stu-dents individual district,
Results not available in time for report—see stu-dents individual district,
Results not available in time for report—see stu-dents individual district,
9 Results not available in time for report—see stu-dents individual district,
Results not available in time for report—see stu-dents individual district,
Results not available in time for report—see stu-dents individual district,
Note: Percentages are not calculated when the number of students tested is ten or less, either because the number of students in this category is too small for statistical accuracy or to protect student privacy.
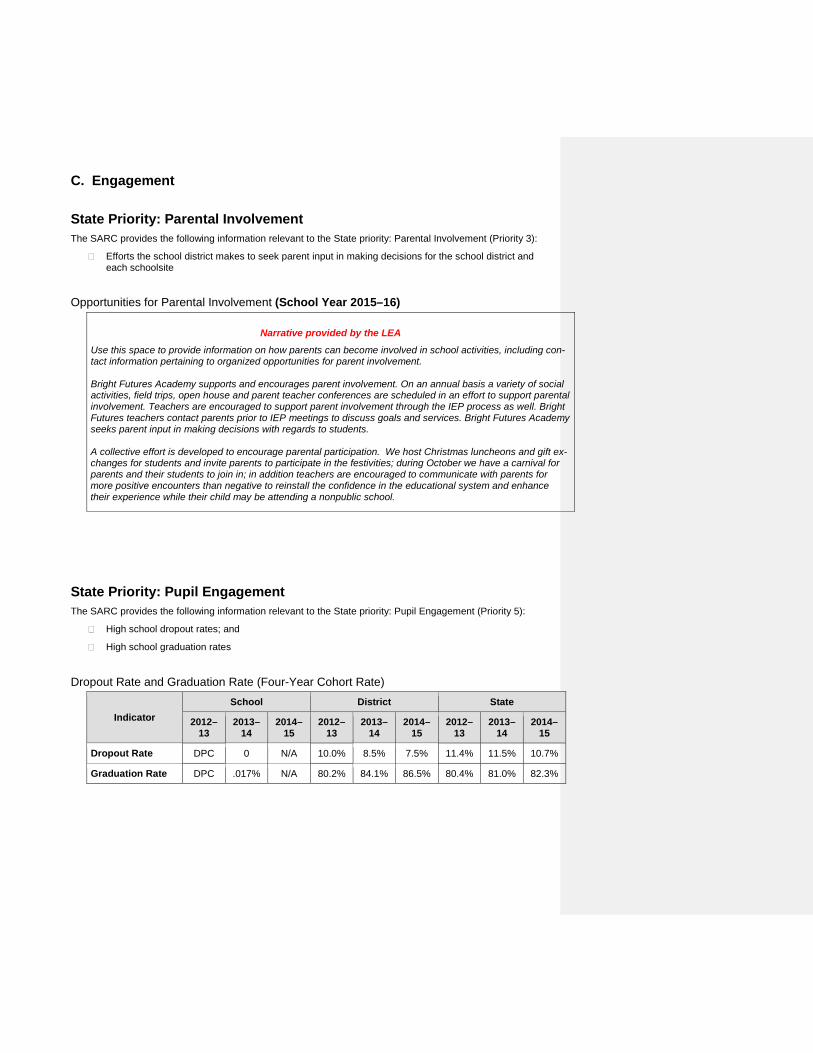
C. Engagement State Priority: Parental Involvement The SARC provides the following information relevant to the State priority: Parental Involvement (Priority 3):
� Efforts the school district makes to seek parent input in making decisions for the school district and each schoolsite
Opportunities for Parental Involvement (School Year 2015–16)
Narrative provided by the LEA
Use this space to provide information on how parents can become involved in school activities, including con-tact information pertaining to organized opportunities for parent involvement. Bright Futures Academy supports and encourages parent involvement. On an annual basis a variety of social activities, field trips, open house and parent teacher conferences are scheduled in an effort to support parental involvement. Teachers are encouraged to support parent involvement through the IEP process as well. Bright Futures teachers contact parents prior to IEP meetings to discuss goals and services. Bright Futures Academy seeks parent input in making decisions with regards to students. A collective effort is developed to encourage parental participation. We host Christmas luncheons and gift ex-changes for students and invite parents to participate in the festivities; during October we have a carnival for parents and their students to join in; in addition teachers are encouraged to communicate with parents for more positive encounters than negative to reinstall the confidence in the educational system and enhance their experience while their child may be attending a nonpublic school.
State Priority: Pupil Engagement The SARC provides the following information relevant to the State priority: Pupil Engagement (Priority 5):
� High school dropout rates; and
� High school graduation rates Dropout Rate and Graduation Rate (Four-Year Cohort Rate)
Indicator School District State
2012–13
2013–14
2014–15
2012–13
2013–14
2014–15
2012–13
2013–14
2014–15
Dropout Rate DPC 0 N/A 10.0% 8.5% 7.5% 11.4% 11.5% 10.7%
Graduation Rate DPC .017% N/A 80.2% 84.1% 86.5% 80.4% 81.0% 82.3%
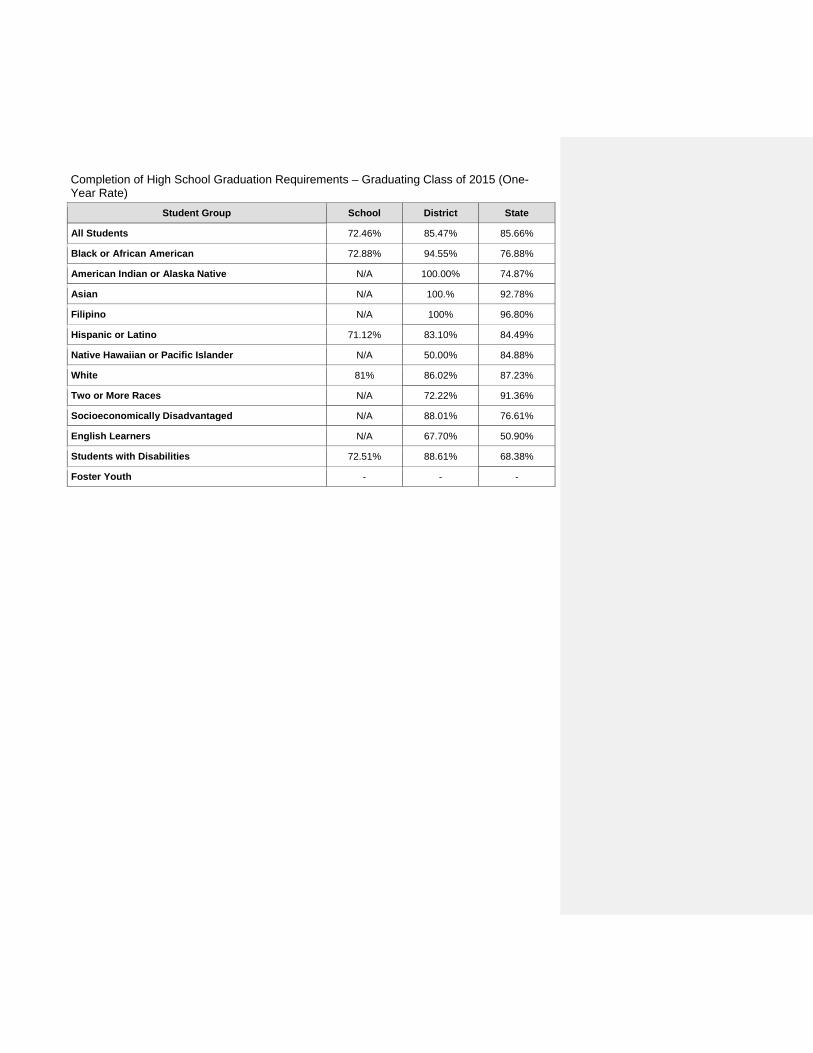
Completion of High School Graduation Requirements – Graduating Class of 2015 (One-Year Rate)
Student Group School District State
All Students 72.46% 85.47% 85.66%
Black or African American 72.88% 94.55% 76.88%
American Indian or Alaska Native N/A 100.00% 74.87%
Asian N/A 100.% 92.78%
Filipino N/A 100% 96.80%
Hispanic or Latino 71.12% 83.10% 84.49%
Native Hawaiian or Pacific Islander N/A 50.00% 84.88%
White 81% 86.02% 87.23%
Two or More Races N/A 72.22% 91.36%
Socioeconomically Disadvantaged N/A 88.01% 76.61%
English Learners N/A 67.70% 50.90%
Students with Disabilities 72.51% 88.61% 68.38%
Foster Youth - - -
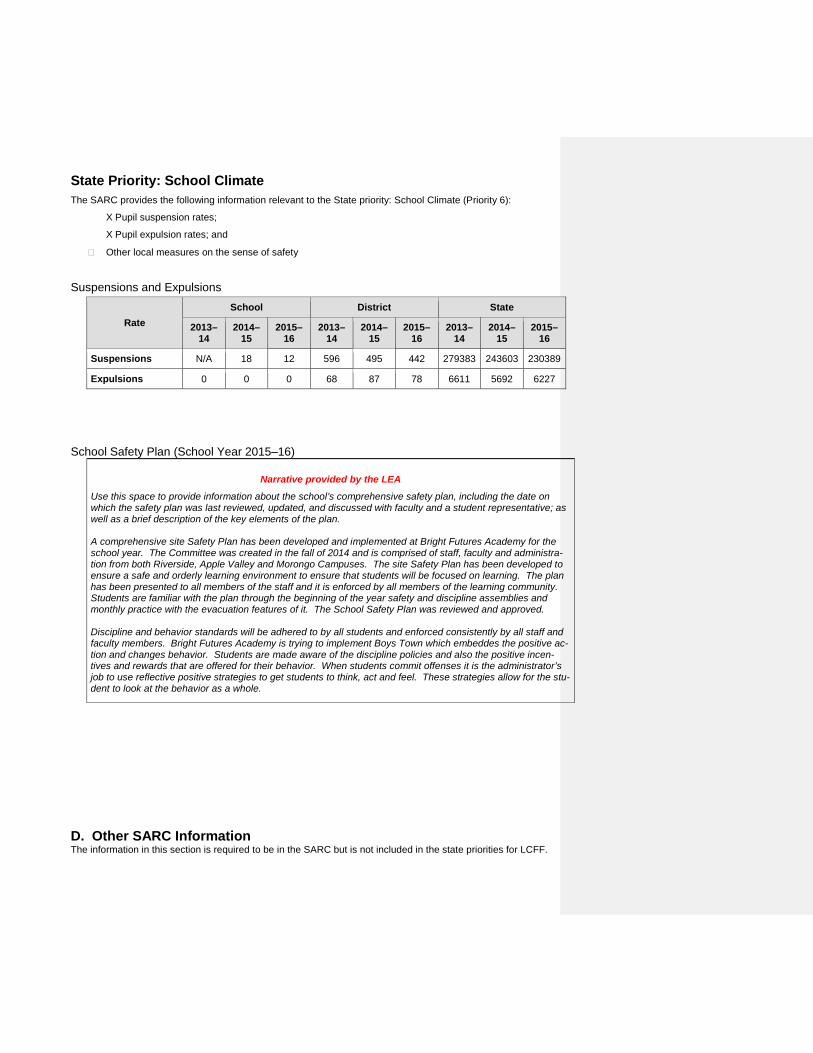
State Priority: School Climate The SARC provides the following information relevant to the State priority: School Climate (Priority 6):
X Pupil suspension rates;
X Pupil expulsion rates; and
� Other local measures on the sense of safety Suspensions and Expulsions
Rate School District State
2013–14
2014–15
2015–16
2013–14
2014–15
2015–16
2013–14
2014–15
2015–16
Suspensions N/A 18 12 596 495 442 279383 243603 230389
Expulsions 0 0 0 68 87 78 6611 5692 6227 School Safety Plan (School Year 2015–16)
Narrative provided by the LEA
Use this space to provide information about the school’s comprehensive safety plan, including the date on which the safety plan was last reviewed, updated, and discussed with faculty and a student representative; as well as a brief description of the key elements of the plan. A comprehensive site Safety Plan has been developed and implemented at Bright Futures Academy for the school year. The Committee was created in the fall of 2014 and is comprised of staff, faculty and administra-tion from both Riverside, Apple Valley and Morongo Campuses. The site Safety Plan has been developed to ensure a safe and orderly learning environment to ensure that students will be focused on learning. The plan has been presented to all members of the staff and it is enforced by all members of the learning community. Students are familiar with the plan through the beginning of the year safety and discipline assemblies and monthly practice with the evacuation features of it. The School Safety Plan was reviewed and approved. Discipline and behavior standards will be adhered to by all students and enforced consistently by all staff and faculty members. Bright Futures Academy is trying to implement Boys Town which embeddes the positive ac-tion and changes behavior. Students are made aware of the discipline policies and also the positive incen-tives and rewards that are offered for their behavior. When students commit offenses it is the administrator’s job to use reflective positive strategies to get students to think, act and feel. These strategies allow for the stu-dent to look at the behavior as a whole.
D. Other SARC Information The information in this section is required to be in the SARC but is not included in the state priorities for LCFF.
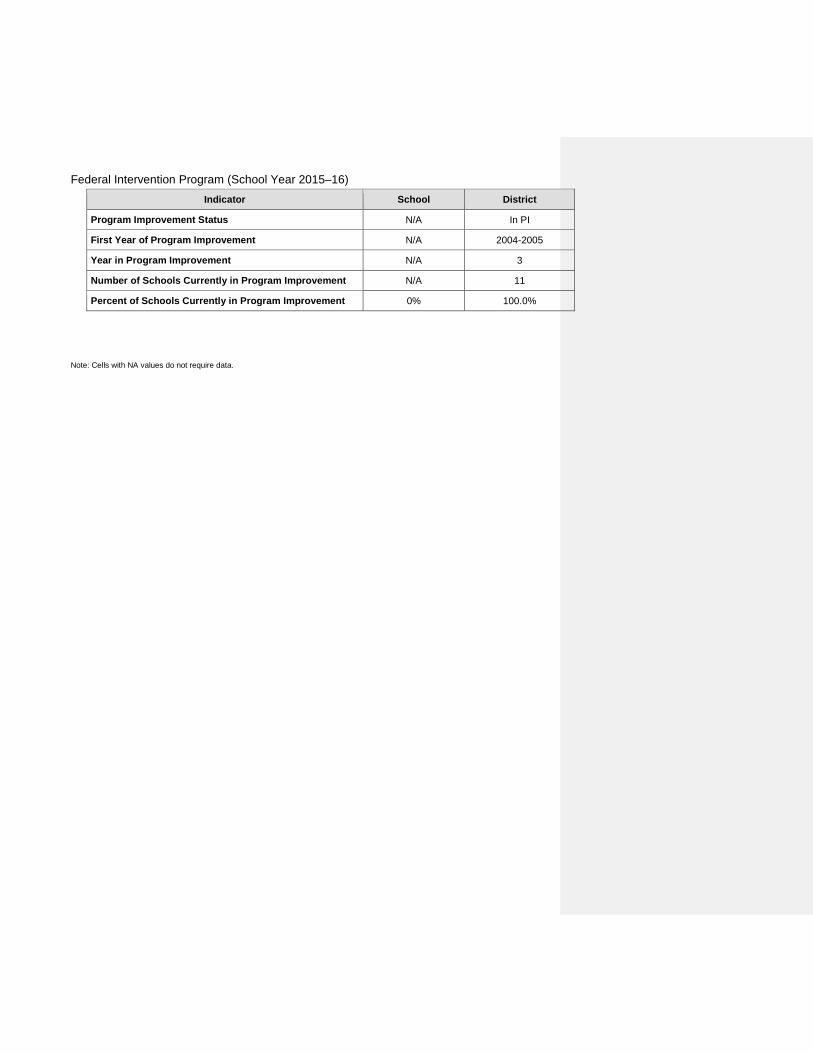
Federal Intervention Program (School Year 2015–16) Indicator School District
Program Improvement Status N/A In PI
First Year of Program Improvement N/A 2004-2005
Year in Program Improvement N/A 3
Number of Schools Currently in Program Improvement N/A 11
Percent of Schools Currently in Program Improvement 0% 100.0% Note: Cells with NA values do not require data.
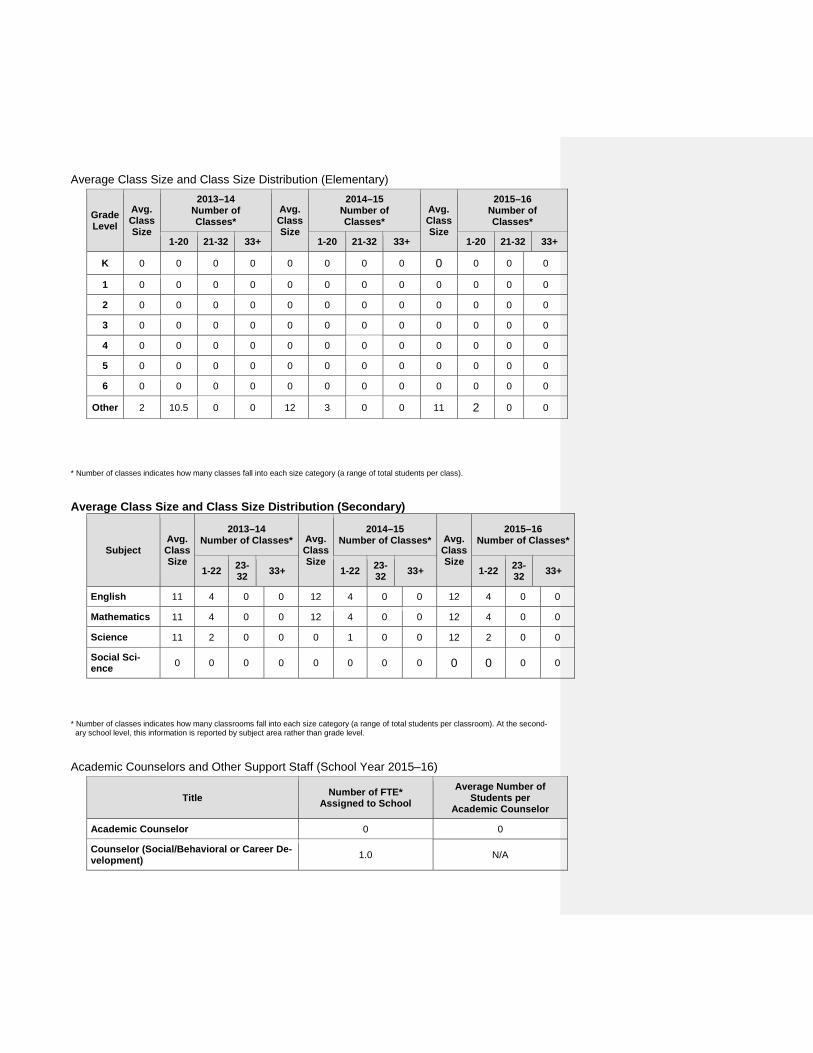
Average Class Size and Class Size Distribution (Elementary)
Grade Level
Avg. Class Size
2013–14 Number of Classes*
Avg. Class Size
2014–15 Number of Classes*
Avg. Class Size
2015–16 Number of Classes*
1-20 21-32 33+ 1-20 21-32 33+ 1-20 21-32 33+
K 0 0 0 0 0 0 0 0 0 0 0 0
1 0 0 0 0 0 0 0 0 0 0 0 0
2 0 0 0 0 0 0 0 0 0 0 0 0
3 0 0 0 0 0 0 0 0 0 0 0 0
4 0 0 0 0 0 0 0 0 0 0 0 0
5 0 0 0 0 0 0 0 0 0 0 0 0
6 0 0 0 0 0 0 0 0 0 0 0 0
Other 2 10.5 0 0 12 3 0 0 11 2 0 0 * Number of classes indicates how many classes fall into each size category (a range of total students per class). Average Class Size and Class Size Distribution (Secondary)
Subject Avg. Class Size
2013–14 Number of Classes* Avg.
Class Size
2014–15 Number of Classes* Avg.
Class Size
2015–16 Number of Classes*
1-22 23-32 33+ 1-22 23-
32 33+ 1-22 23-32 33+
English 11 4 0 0 12 4 0 0 12 4 0 0
Mathematics 11 4 0 0 12 4 0 0 12 4 0 0
Science 11 2 0 0 0 1 0 0 12 2 0 0 Social Sci-ence 0 0 0 0 0 0 0 0 0 0 0 0
* Number of classes indicates how many classrooms fall into each size category (a range of total students per classroom). At the second-
ary school level, this information is reported by subject area rather than grade level. Academic Counselors and Other Support Staff (School Year 2015–16)
Title Number of FTE* Assigned to School
Average Number of Students per
Academic Counselor Academic Counselor 0 0 Counselor (Social/Behavioral or Career De-velopment) 1.0 N/A
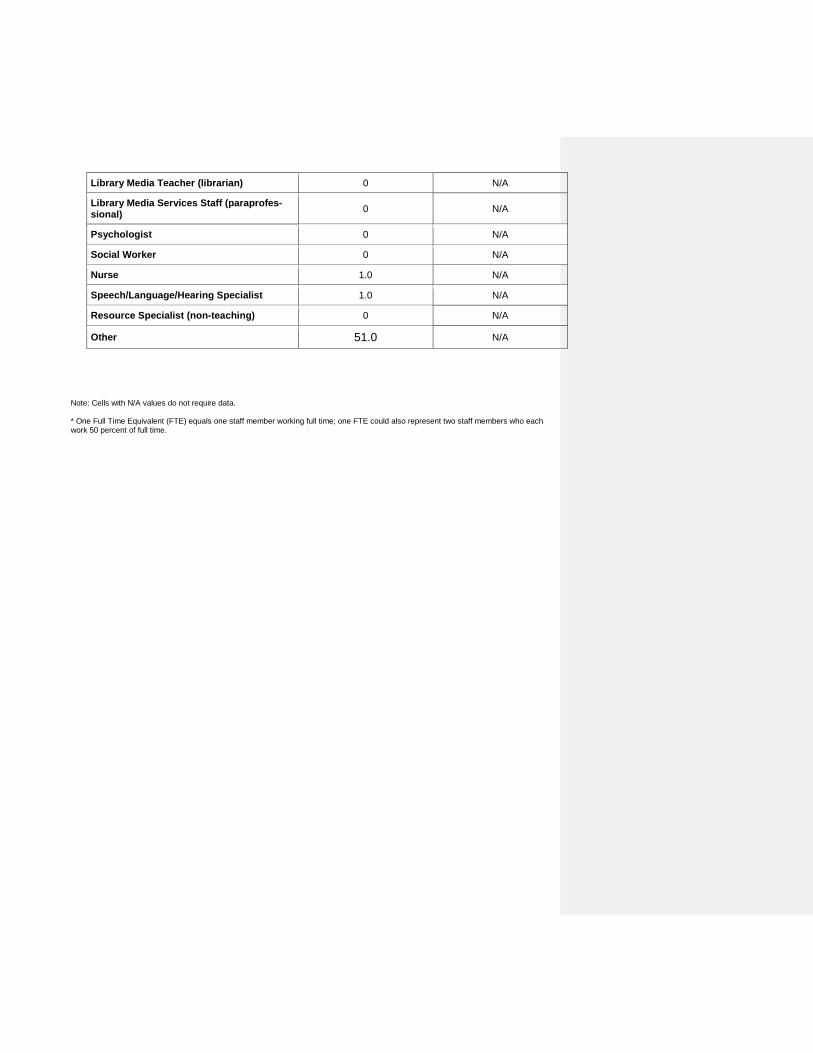
Library Media Teacher (librarian) 0 N/A Library Media Services Staff (paraprofes-sional) 0 N/A
Psychologist 0 N/A
Social Worker 0 N/A
Nurse 1.0 N/A
Speech/Language/Hearing Specialist 1.0 N/A
Resource Specialist (non-teaching) 0 N/A
Other 51.0 N/A Note: Cells with N/A values do not require data. * One Full Time Equivalent (FTE) equals one staff member working full time; one FTE could also represent two staff members who each work 50 percent of full time.
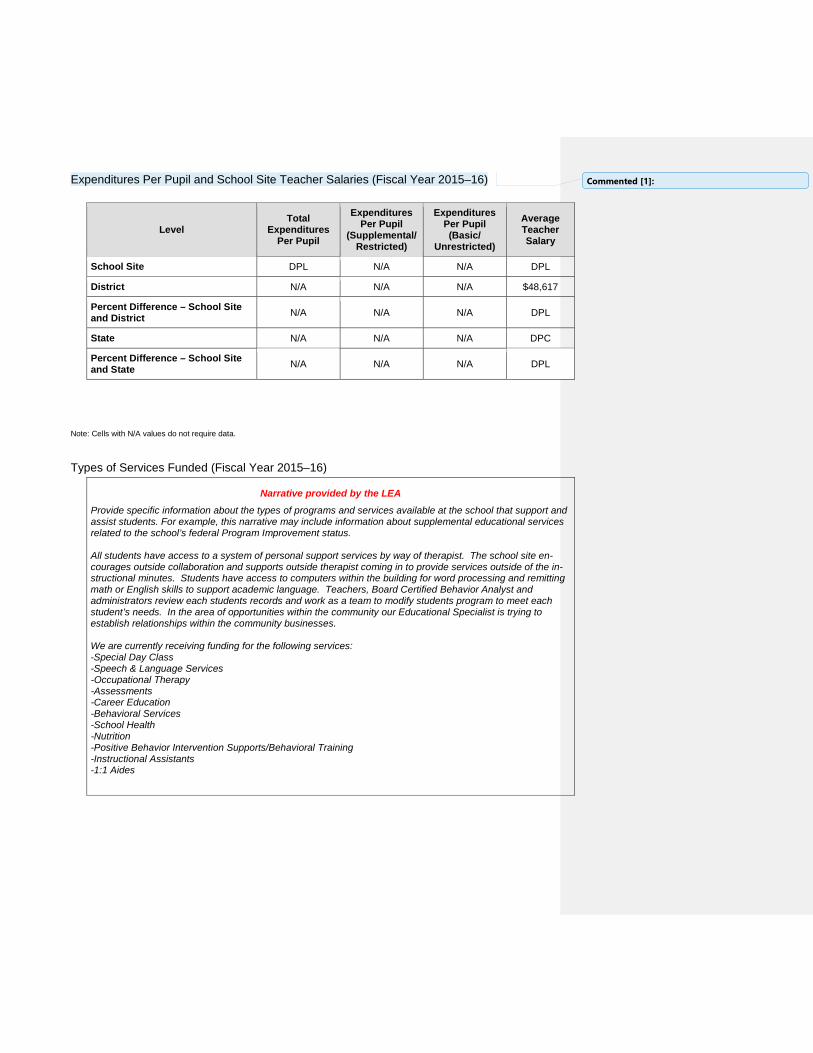
Expenditures Per Pupil and School Site Teacher Salaries (Fiscal Year 2015–16)
Level Total
Expenditures Per Pupil
Expenditures Per Pupil
(Supplemental/ Restricted)
Expenditures Per Pupil (Basic/
Unrestricted)
Average Teacher Salary
School Site DPL N/A N/A DPL
District N/A N/A N/A $48,617 Percent Difference – School Site and District N/A N/A N/A DPL
State N/A N/A N/A DPC Percent Difference – School Site and State N/A N/A N/A DPL
Note: Cells with N/A values do not require data. Types of Services Funded (Fiscal Year 2015–16)
Narrative provided by the LEA Provide specific information about the types of programs and services available at the school that support and assist students. For example, this narrative may include information about supplemental educational services related to the school’s federal Program Improvement status. All students have access to a system of personal support services by way of therapist. The school site en-courages outside collaboration and supports outside therapist coming in to provide services outside of the in-structional minutes. Students have access to computers within the building for word processing and remitting math or English skills to support academic language. Teachers, Board Certified Behavior Analyst and administrators review each students records and work as a team to modify students program to meet each student’s needs. In the area of opportunities within the community our Educational Specialist is trying to establish relationships within the community businesses. We are currently receiving funding for the following services: -Special Day Class -Speech & Language Services -Occupational Therapy -Assessments -Career Education -Behavioral Services -School Health -Nutrition -Positive Behavior Intervention Supports/Behavioral Training -Instructional Assistants -1:1 Aides
Commented [1]:
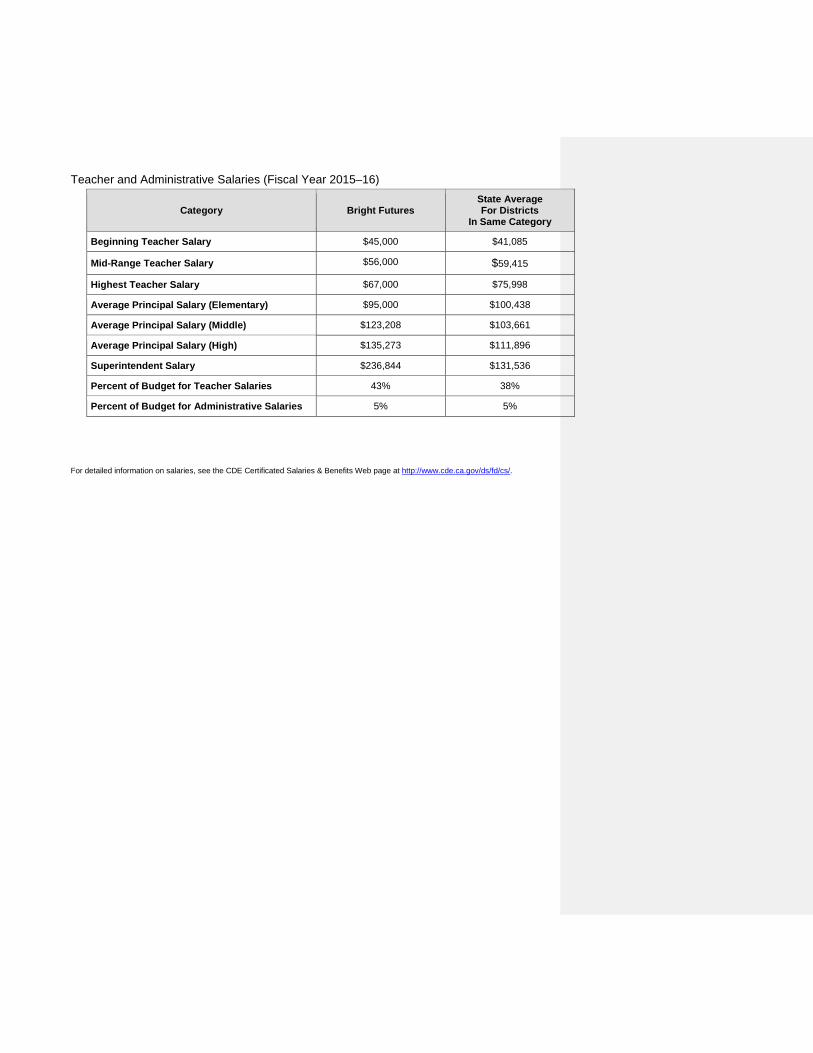
Teacher and Administrative Salaries (Fiscal Year 2015–16)
Category Bright Futures State Average For Districts
In Same Category Beginning Teacher Salary $45,000 $41,085
Mid-Range Teacher Salary $56,000 $59,415
Highest Teacher Salary $67,000 $75,998
Average Principal Salary (Elementary) $95,000 $100,438
Average Principal Salary (Middle) $123,208 $103,661
Average Principal Salary (High) $135,273 $111,896
Superintendent Salary $236,844 $131,536
Percent of Budget for Teacher Salaries 43% 38%
Percent of Budget for Administrative Salaries 5% 5% For detailed information on salaries, see the CDE Certificated Salaries & Benefits Web page at http://www.cde.ca.gov/ds/fd/cs/.
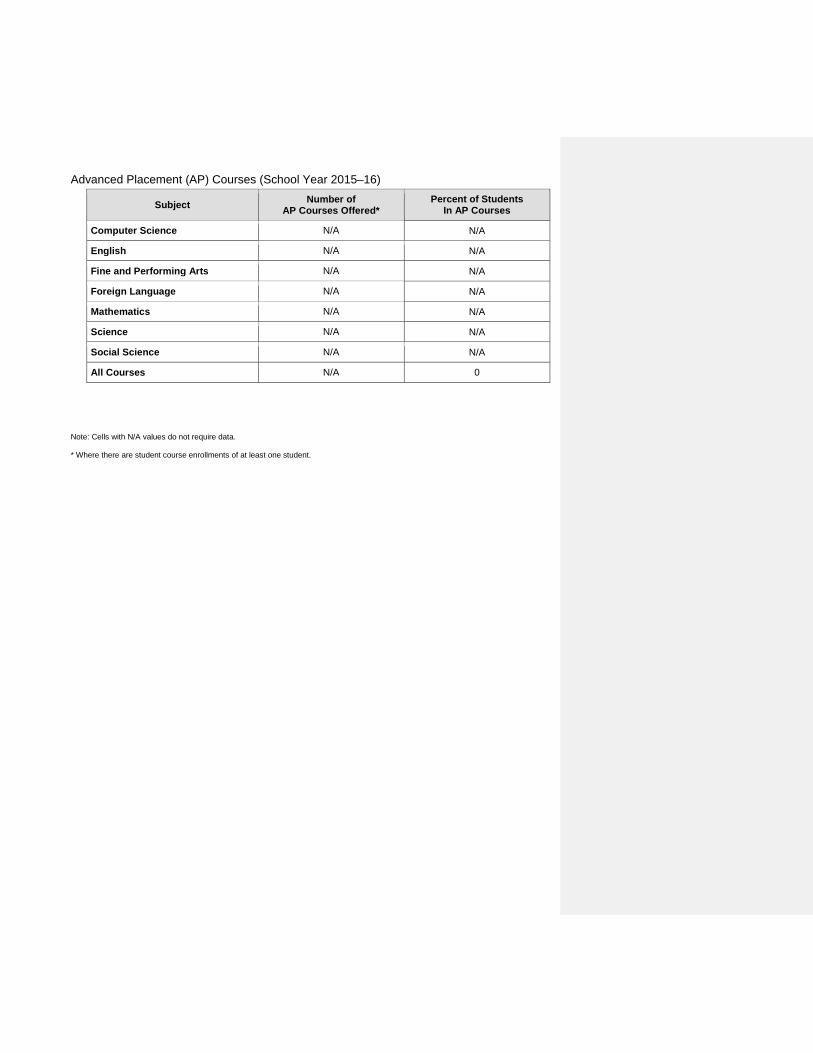
Advanced Placement (AP) Courses (School Year 2015–16)
Subject Number of AP Courses Offered*
Percent of Students In AP Courses
Computer Science N/A N/A
English N/A N/A
Fine and Performing Arts N/A N/A
Foreign Language N/A N/A
Mathematics N/A N/A
Science N/A N/A
Social Science N/A N/A
All Courses N/A 0 Note: Cells with N/A values do not require data. * Where there are student course enrollments of at least one student.
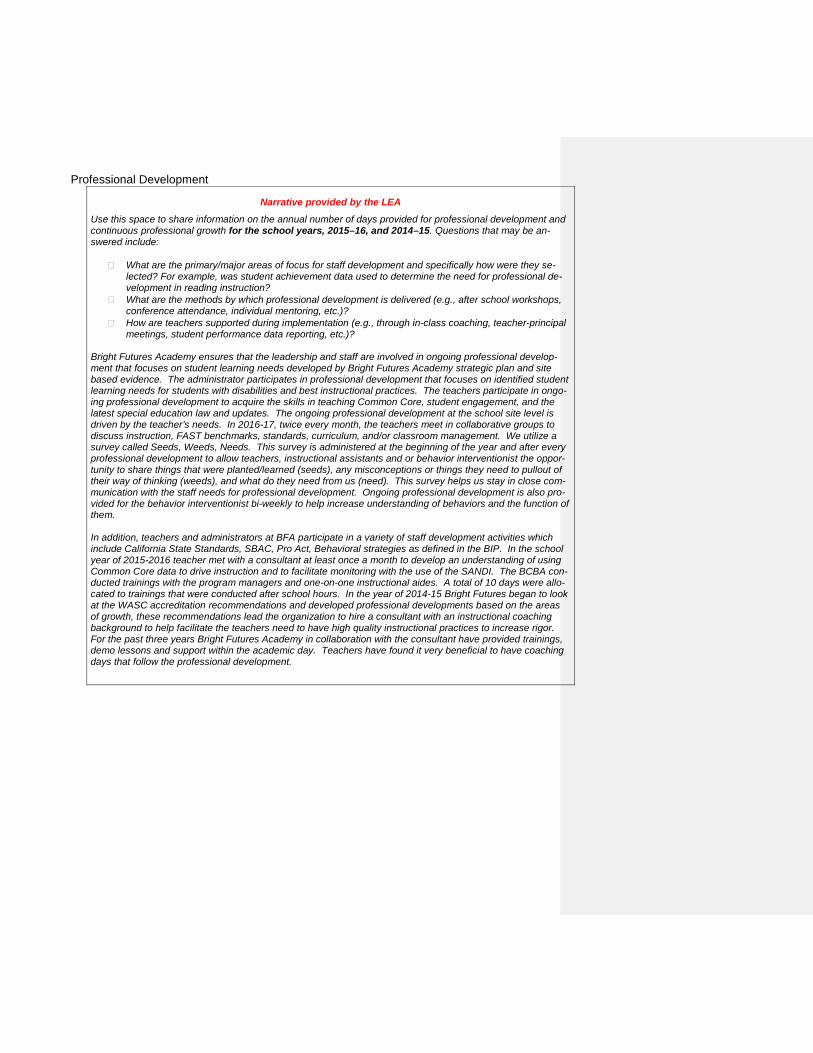
Professional Development
Narrative provided by the LEA
Use this space to share information on the annual number of days provided for professional development and continuous professional growth for the school years, 2015–16, and 2014–15. Questions that may be an-swered include:
� What are the primary/major areas of focus for staff development and specifically how were they se-lected? For example, was student achievement data used to determine the need for professional de-velopment in reading instruction?
� What are the methods by which professional development is delivered (e.g., after school workshops, conference attendance, individual mentoring, etc.)?
� How are teachers supported during implementation (e.g., through in-class coaching, teacher-principal meetings, student performance data reporting, etc.)?
Bright Futures Academy ensures that the leadership and staff are involved in ongoing professional develop-ment that focuses on student learning needs developed by Bright Futures Academy strategic plan and site based evidence. The administrator participates in professional development that focuses on identified student learning needs for students with disabilities and best instructional practices. The teachers participate in ongo-ing professional development to acquire the skills in teaching Common Core, student engagement, and the latest special education law and updates. The ongoing professional development at the school site level is driven by the teacher’s needs. In 2016-17, twice every month, the teachers meet in collaborative groups to discuss instruction, FAST benchmarks, standards, curriculum, and/or classroom management. We utilize a survey called Seeds, Weeds, Needs. This survey is administered at the beginning of the year and after every professional development to allow teachers, instructional assistants and or behavior interventionist the oppor-tunity to share things that were planted/learned (seeds), any misconceptions or things they need to pullout of their way of thinking (weeds), and what do they need from us (need). This survey helps us stay in close com-munication with the staff needs for professional development. Ongoing professional development is also pro-vided for the behavior interventionist bi-weekly to help increase understanding of behaviors and the function of them. In addition, teachers and administrators at BFA participate in a variety of staff development activities which include California State Standards, SBAC, Pro Act, Behavioral strategies as defined in the BIP. In the school year of 2015-2016 teacher met with a consultant at least once a month to develop an understanding of using Common Core data to drive instruction and to facilitate monitoring with the use of the SANDI. The BCBA con-ducted trainings with the program managers and one-on-one instructional aides. A total of 10 days were allo-cated to trainings that were conducted after school hours. In the year of 2014-15 Bright Futures began to look at the WASC accreditation recommendations and developed professional developments based on the areas of growth, these recommendations lead the organization to hire a consultant with an instructional coaching background to help facilitate the teachers need to have high quality instructional practices to increase rigor. For the past three years Bright Futures Academy in collaboration with the consultant have provided trainings, demo lessons and support within the academic day. Teachers have found it very beneficial to have coaching days that follow the professional development.


![BURNPUR RIVERSIDE SCHOOL ASSIGNMENT II:[2021-2022] …](https://img.pdfslide.net/doc/110x75/61688df0d394e9041f70897d/burnpur-riverside-school-assignment-ii2021-2022-.jpg)