Embed Size (px)
Citation preview
TDWI BEST PRACTICES REPORT
TDWI RESEARCh third Quarter 2014
tdwi.org
Business-Driven Business Intelligence and AnalyticsAchieving Value through Collaborative Business/IT Leadership
By David Stodder
Co-sponsored by
tdwi.org 1
© 2014 by TDWI (The Data Warehousing Institute™), a division of 1105 Media, Inc. All rights reserved. Reproductions in whole or in part are prohibited except by written permission. E-mail requests or feedback to [email protected]. Product and company names mentioned herein may be trademarks and/or registered trademarks of their respective companies.
By David Stodder
Table of ContentsResearch Methodology and Demographics 3
Executive Summary 4
Driving toward Business-Driven BI and Analytics 5
Shadow it highlights Need for Business/it Collaboration . . . . . . 6
Current Status of BI/Analytics Democratization 7
it’s role in Bi, analytics, and data Warehousing . . . . . . . . . . 9
Business/IT Budget Responsibility for BI and Analytics 12
Bi and analytics technology Selection Process roles . . . . . . . 15
accountability for Project Success or Failure . . . . . . . . . . . . 17
Winning Sponsorship for Bi and analytics Projects . . . . . . . . 18
Improving Business/IT Leadership and Collaboration 21
Project Leadership for analytics and data discovery . . . . . . . 21
Establishing a Center of Excellence and Competency 24
Who Participates in Coes and Competency Centers . . . . . . . . 25
Self-Reliance with BI and Analytics Technologies 26
technologies Most important to Business-driven Bi and analytics Projects . . . . . . . . . . . . . . . . . . . . . . . . . 28
Vendor Products 29
Recommendations 31
Business-Driven Business Intelligence and AnalyticsAchieving Value through Collaborative Business/IT Leadership
third Quarter 2014BEST PRACTICES REPORT
TDWI RESEARCh
2 TDWI RESEARCh
Business-Driven Business Intelligence and Analytics
About the AuthorDAVID STODDER is director of TDWI Research for business intelligence. He focuses on providing research-based insight and best practices for organizations implementing BI, analytics, performance management, data discovery, data visualization, and related technologies and methods. He is the author of TDWI Best Practices Reports and Checklist Reports on data discovery, data visualization, customer analytics in the age of social media, BI/DW agility, mobile BI, and information management. He has chaired TDWI conferences on BI agility and big data analytics. Stodder has provided thought leadership on BI, information management, and IT management for over two decades. He has served as vice president and research director with Ventana Research, and he was the founding chief editor of Intelligent Enterprise, where he served as editorial director for nine years.
About TDWITDWI, a division of 1105 Media, Inc., is the premier provider of in-depth, high-quality education and research in the business intelligence, data warehousing, and analytics industry. TDWI is dedicated to educating business and information technology professionals about the best practices, strategies, techniques, and tools required to successfully design, build, maintain, and enhance business intelligence and data warehousing solutions. TDWI also fosters the advancement of business intelligence, data warehousing, and analytics research and contributes to knowledge transfer and the professional development of its members. TDWI offers a worldwide membership program, five major educational conferences, topical educational seminars, role-based training, onsite courses, certification, solution provider partnerships, an awards program for best practices, live Webinars, resourceful publications, an in-depth research program, and a comprehensive Web site, tdwi.org.
About the TDWI Best Practices Reports SeriesThis series is designed to educate technical and business professionals about new business intelligence and analytics technologies, concepts, or approaches that address a significant problem or issue. Research for the reports is conducted via interviews with industry experts and leading-edge user companies and is supplemented by surveys of business intelligence, analytics, and data management professionals.
To support the program, TDWI seeks vendors that collectively wish to evangelize a new approach to solving business intelligence and analytics problems or an emerging technology discipline. By banding together, sponsors can validate a new market niche and educate organizations about alternative solutions to critical business intelligence issues. Please contact TDWI Research Director David Stodder ([email protected]) to suggest a topic that meets these requirements.
AcknowledgmentsTDWI would like to thank many people who contributed to this report. First, we appreciate the many users who responded to our survey, especially those who responded to our requests for phone interviews. Second, our report sponsors, who diligently reviewed outlines, survey questions, and report drafts. Finally, we would like to recognize TDWI’s production team: Jennifer Agee, Roxanne Cooke, Marie Gipson, Denelle Hanlon, Deirdre Hoffman, and Liz Martini.
SponsorsActian, Datawatch, Looker, SAS, Tableau Software, and Treasure Data sponsored the research for this report.
tdwi.org 3
research Methodology and demographics
Research Methodology and Demographics Report Scope Across organizations, users seek to increase the role of visual data reporting, exploration, and analysis in their determination of best strategies or actions. Business intelligence (BI), data discovery, and analytics tools and platforms have been evolving rapidly in response to demand for technologies that are easier to deploy for use by “nontechnical” users who are subject matter experts but not data management experts. IT, while playing a critical role in provisioning and managing data, is adjusting as users’ budgets and desire for control increase. This report will examine organizations’ experiences with business-driven BI and analytics and recommend best practices.
Survey Methodology In February 2014, TDWI sent an invitation via e-mail to business and IT executives; VPs and directors of BI, analytics, and data warehousing; business and data analysts; line-of-business (LOB) and departmental directors and managers; and other professionals, asking them to complete an Internet-based survey. The invitation was also delivered via websites, newsletters, and publications from TDWI. The survey analysis drew from a total of 668 responses. A total of 313 completed every question. Answers from respondents who answered enough questions for their input to be valuable are included in the results. Thus, some questions have different numbers of responses. Marketing and sales personnel from technology vendors as well as academics were excluded.
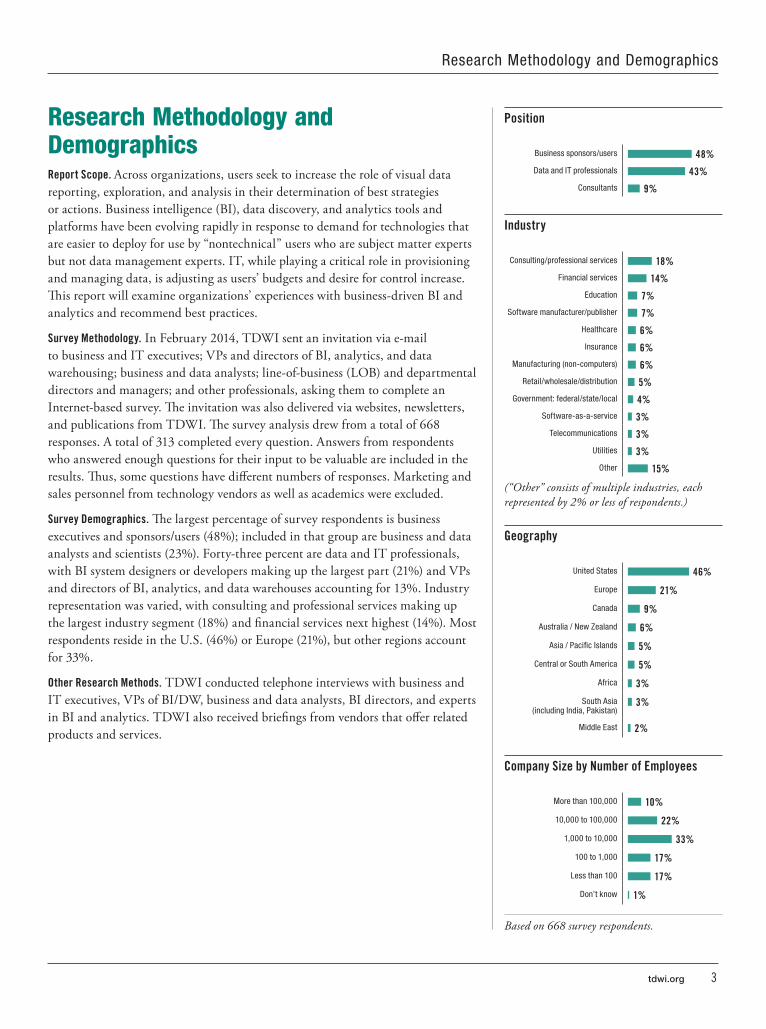
Survey Demographics The largest percentage of survey respondents is business executives and sponsors/users (48%); included in that group are business and data analysts and scientists (23%). Forty-three percent are data and IT professionals, with BI system designers or developers making up the largest part (21%) and VPs and directors of BI, analytics, and data warehouses accounting for 13%. Industry representation was varied, with consulting and professional services making up the largest industry segment (18%) and financial services next highest (14%). Most respondents reside in the U.S. (46%) or Europe (21%), but other regions account for 33%.
Other Research Methods TDWI conducted telephone interviews with business and IT executives, VPs of BI/DW, business and data analysts, BI directors, and experts in BI and analytics. TDWI also received briefings from vendors that offer related products and services.
Position
Business sponsors/users 48%data and it professionals 43%
Consultants 9%
Industry
Consulting/professional services 18%Financial services 14%
education 7%Software manufacturer/publisher 7%
healthcare 6%insurance 6%
Manufacturing (non-computers) 6%retail/wholesale/distribution 5%
Government: federal/state/local 4%Software-as-a-service 3%
telecommunications 3%utilities 3%
Other 15%
(“Other” consists of multiple industries, each represented by 2% or less of respondents.)
Geography
united States 46%
europe 21%
Canada 9%
australia / New Zealand 6%
asia / Pacific islands 5%
Central or South america 5%
africa 3%
South asia (including india, Pakistan)
3%
Middle east 2%
Company Size by Number of Employees
More than 100,000 10%
10,000 to 100,000 22%
1,000 to 10,000 33%
100 to 1,000 17%
Less than 100 17%
don’t know 1%
Based on 668 survey respondents.
4 TDWI RESEARCh
Business-Driven Business Intelligence and Analytics
Executive Summary One of the chief goals of nearly all organizations today is to enable data-driven decisions and actions. Firms want to achieve the “right data, for the right user, at the right time” objective that has characterized business intelligence (BI) and data warehousing since their beginnings. They also want to enable users to push beyond canned reports and limited spreadsheet views to take advantage of more advanced data visualization and analytics; then, users can accelerate exploration and discovery of valuable insights and apply them for business advantage.
Only in recent years have BI tools, as well as those in the newer categories of data discovery and software as a service (SaaS), become easy enough for business users to deploy and implement without considerable handholding by IT developers and data analysts. Analytic database platforms that are specifically designed to support data discovery and advanced analytics are also now easier to deploy, load with data, and use. Offering flexible data visualization, dashboard-based information views, analytics, and more, the latest BI tools, analytic platforms, and SaaS offerings are spurring users in business functions and lines of business (LOB) to venture beyond the boundaries of IT management and obtain technologies themselves.
This trend toward “business-driven,” rather than IT-driven BI and analytics, is riding the momentum created by technology change and strong interest, if not CEO-driven mandates, to infuse data into all decisions and actions. This TDWI Best Practices Report explores key drivers behind this trend and examines how organizations are both taking advantage of it and realigning business-IT collaboration to avoid pitfalls. Organizations need this collaboration to allocate resources effectively and adhere to data governance policies.
Our research finds that, overall, IT still plays a major, if not dominant, role in BI and analytics implementations. As they have historically, IT and corporate-level leadership still head up sponsorship of most BI and analytics projects. However, it is becoming more important to avoid
“technology for technology’s sake” and to define the benefits of technology deployment in terms of business advantages, such as smarter financial management, more effective marketing, or more efficient operational processes. Business-side leadership and IT leadership need to align business and technology objectives so that projects can succeed in satisfying users.
One way that some organizations have effectively brought together business and IT leadership is by establishing a BI and analytics center of excellence (CoE) or competency center. Such an institution can bring the sides together to share best practices, identify training needs, tighten alignment between BI and analytics and business processes, manage data governance, and more. Currently, however, our research finds that business-side participation in CoEs and competency centers is low.
If business-driven BI and analytics are to be sustained with less direct IT involvement, business-side leadership must step up to ensure that chaos does not reign and to provide direction for the adoption of new technologies and practices for the betterment of the enterprise as a whole. Otherwise, organizations could invite data confusion and unnecessarily waste precious budget and resources.
Business-side participation in CoEs
and competency centers remains low
The latest BI tools, analytic platforms,
and SaaS offerings are spurring users to obtain
technologies themselves
tdwi.org 5
driving toward Business-driven Bi and analytics
Driving toward Business-Driven BI and AnalyticsFelix Ungar: I put order in this house. For the first time in months, you’re saving money. You’re sleeping on clean sheets. You’re eating hot meals for a change and I did it.
Oscar Madison: Yes. That’s right. And then at night after we’ve had your halibut steak and your tartar sauce, I have to spend the rest of the evening watching you Saran Wrap the leftovers.
—From The Odd Couple by Neil Simon
Yin and yang, order and chaos, Felix and Oscar: These and similar comparisons have been used to describe the necessary but sometimes fractious relationship between business (Oscar) and IT (Felix). The notion is that the business side lives amid the creative chaos of trying to survive in a dynamic economic environment while IT fastidiously works behind the scenes to put the data house in order. More than a few observers have even borrowed the title of John Gray’s 1992 bestseller about gender differences, Men Are from Mars, Women Are from Venus, to describe the relationship between business and IT. In Gray’s view, men and women communicate effectively during periods of stress only when each understands the distinctive customs and characteristics of the other’s “planet.” The same could be said about business users and IT.
IT’s role in business intelligence (BI) and analytics remains vital, primarily for developing and managing the BI and data infrastructure and increasingly for data governance. However, the spotlight today is on “business-driven” BI and analytics. Data assets play an ever greater role in business decision making; business users want more data and more control over how they access, analyze, present, and share it. “Business-driven projects will focus on answering questions that are presented as challenges within your company,” writes Lyndsay Wise, president and founder of WiseAnalytics.1
Business decision makers are closest to the issues involved in these challenges and the type of information they need to address them. As executives and managers at corporate, departmental, and LOB levels, they want to be more self-reliant and less dependent on IT. They are the subject matter experts (SMEs) and often know the most about the data and its context. “Information access and design need to be driven by the business units most affected by the [BI and analytics] implementation,” Wise writes. “IT’s involvement is essential, but in support of business-driven sponsorship not in lieu of it.”
The traditional business/IT relationship is changing Most business users have lacked the tools, the know-how, and the budgets to access and interact with data effectively on their own, beyond the functionality of personal spreadsheets or simple reports tied to applications. Traditionally, small and midsize firms have started out with no IT function—or at least, not one with responsibility over data assets. As these firms grow and employees seek larger volumes of data for reporting and analysis, executives may establish a dedicated IT function with responsibility for data provisioning, management, and performance, typically reporting to the CEO or chief operating officer (COO). Separated from the business side, IT over time becomes an enterprise function, serving users in multiple departments, LOBs, and corporate offices.
This traditional evolutionary path is changing in the digital age, however. Businesses now launch with ingrained data savvy; led by social networks and ecommerce firms, these modern organizations view data science and analytics as core to their business models and pursuit of market success. With the service economy growing, organizations that rely on online channels need to crunch through customer data that goes beyond transactions to behavior. They need data insights
IT’s role in BI remains vital, primarily for developing and managing infrastructure
Separated from the business side, IT becomes an enterprise function
1 Lyndsay Wise [2014]. Ten Mistakes to Avoid When Bridging the Business/IT Divide, TDWI, Q1.
6 TDWI RESEARCh
Business-Driven Business Intelligence and Analytics
to develop strategies for new services and to fine-tune operational efficiency to ensure strong customer relationships and profitable customer engagement. Additionally, many industries today are undergoing dramatic changes due to the Internet, data digitization, and policy changes. Both new and established companies in industries such as healthcare and media see data as the raw material from which they can draw insights about how to refocus business models and meet shifting regulatory requirements.
Often, business units in such organizations seek to exercise greater ownership over data resources separately from IT, which is then given responsibility primarily for systems and network infrastructure. Along with data analysts and scientists, chief data officers, data architects, and other data professionals find themselves reporting to business functions rather than IT management. Most likely, as business-side leadership seeks to become more data-driven in its decision making and management of operations, the appetite for business-side data ownership, along with the expertise and technology to realize value from the data, will continue to grow.
“The trend towards business-driven BI and analytics is a permanent one,” said Shawn Rogers, VP at Enterprise Management Associates. “Business users have matured over the past 5-10 years, creating a community of data-driven professionals who expect and demand access to the information that drives their business. They don’t want to rely too heavily on IT to enable their success and innovation. IT will evolve toward a caretaker role, focusing on enabling access and controlling governance and quality issues.”
The business-driven BI and analytics trend is propelling strong interest in tools and platforms that enable business users to work with data continuously, flexibly, and rapidly. Commercial software and cloud service providers as well as open-source developers are competing intensely to address the market for highly visual, easy-to-use BI, analytics, and data discovery tools that enable self-directed data exploration. Analytics platforms and appliances today are evolving into more pre-configured and fully integrated systems, making it easier for users to load different types of data and get started. Cloud and software-as-a-service (SaaS) options are making it simpler to spin up data resources for analytics and reporting to meet dynamic business demands.
Data-driven marketing budgets are growing. In 2012, Gartner analyst Laura McLellan projected that by 2017, chief marketing officers (CMOs) will outspend chief information officers (CIOs) on technology. Gartner’s research indicated that the marketing function’s budgets for information technology were growing at more than twice the rate of IT budgets, no doubt due to the competitive need to access and analyze big data sources such as clickstreams and online customer behavior logs.
“Marketing in a digital world is deeply entwined with technology,” writes Scott Brinker at www.chiefmartec.com. Indeed, demand for the newest generations of big data and analytics technologies is often strongest in marketing, where leadership sees itself in a race to apply these technologies and is unable to wait for IT. In this report, we examine trends in budgets for BI, analytics, and data warehousing spending headed up by business units such as marketing.
Shadow IT Highlights Need for Business/IT Collaboration Marketing, of course, is not the only department so entwined; groups such as finance, product development, and customer service also want to be data-driven and are exhibiting less patience with IT backlogs. To track, analyze, and measure data about business performance, process efficiency, product effectiveness, and more, they are increasingly willing to strike out on their own, first with single-user applications and then with larger “shadow” IT systems intended to supply data to entire groups of users.
“Data-driven professionals don’t
want to rely too heavily on IT to enable their
success and innovation ”
tdwi.org 7
Current Status of Bi/analytics democratization
Despite shadow IT growth, TDWI Research finds that today, IT is still the lead sponsor of most BI and analytics projects. However, the trend toward more business-driven BI and analytics will require adjustment by IT. To smooth the relationship between business and IT, manage enterprise-wide policies, and foster best practices across business units, many organizations are establishing CoEs and competency centers. This report will discuss survey results to help us understand how commonly organizations are establishing such committees, who participates, and whether they are succeeding.
This TDWI Best Practices Report will look at these and other trends, directions, and practices related to business-driven BI and analytics. The report will examine budget control, leadership, technology deployment, and the establishment of organizations for joint leadership of projects. TDWI’s goal with this report is to give professionals a research-based understanding of trends in peer organizations so they can gain insight into where they stand in their organizations. The report will offer recommendations for rebalancing the business/IT relationship to meet strategic and operational objectives with BI and analytics.
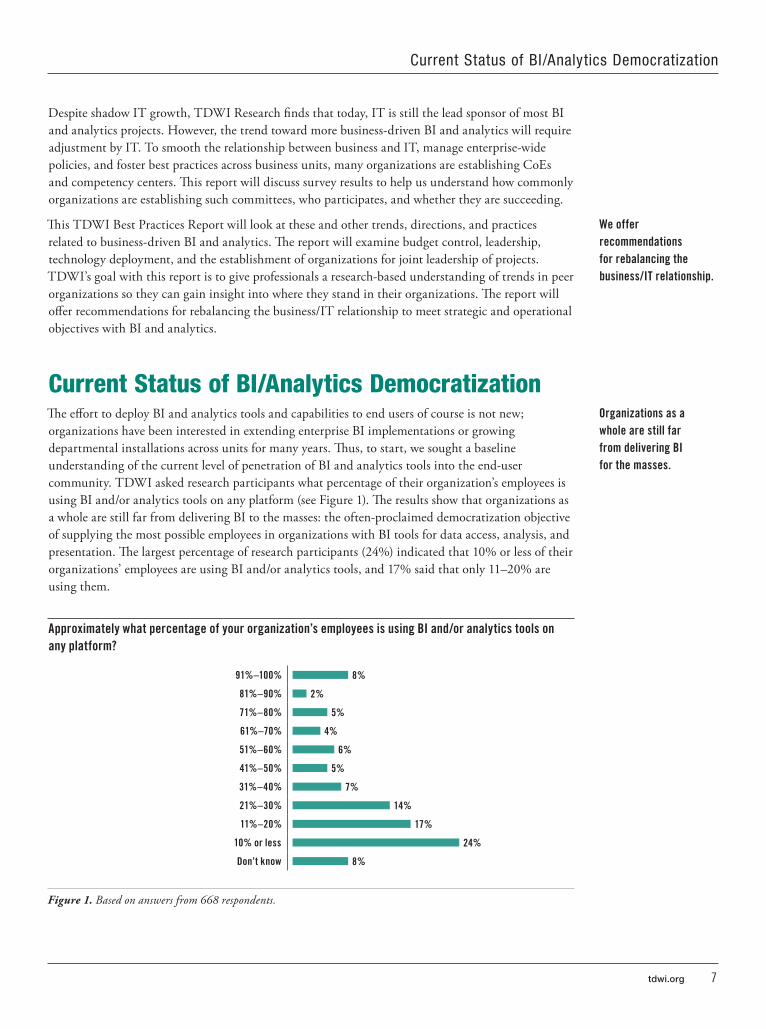
Current Status of BI/Analytics DemocratizationThe effort to deploy BI and analytics tools and capabilities to end users of course is not new; organizations have been interested in extending enterprise BI implementations or growing departmental installations across units for many years. Thus, to start, we sought a baseline understanding of the current level of penetration of BI and analytics tools into the end-user community. TDWI asked research participants what percentage of their organization’s employees is using BI and/or analytics tools on any platform (see Figure 1). The results show that organizations as a whole are still far from delivering BI to the masses: the often-proclaimed democratization objective of supplying the most possible employees in organizations with BI tools for data access, analysis, and presentation. The largest percentage of research participants (24%) indicated that 10% or less of their organizations’ employees are using BI and/or analytics tools, and 17% said that only 11–20% are using them.
Approximately what percentage of your organization’s employees is using BI and/or analytics tools on any platform?
91%–100% 8%
81%–90% 2%
71%–80% 5%
61%–70% 4%
51%–60% 6%
41%–50% 5%
31%–40% 7%
21%–30% 14%
11%–20% 17%
10% or less 24%
Don’t know 8%
Figure 1. Based on answers from 668 respondents.
We offer recommendations for rebalancing the business/IT relationship
Organizations as a whole are still far from delivering BI for the masses
8 TDWI RESEARCh
Business-Driven Business Intelligence and Analytics
We also asked this question of research participants three years ago, in the context of our Mobile Business Intelligence and Analytics Best Practices Report.2 That report found that for the largest percentage (43%) of respondents, less than one-quarter of their employees were implementing BI and analytics tools. For the present report, we sought a finer-grained view of the percentages, as Figure 1 shows. However, comparing the responses in the two reports reveals that the results are about the same, including the percentages at the other end of the spectrum. About one-quarter of participants in both surveys indicated that more than half of their users are employing BI and/or analytics tools.
Thus, in the time between the two research reports, it has remained the case, for the largest percentage of organizations surveyed, that less than a quarter of their employees are implementing BI and analytics tools. Filtering the results for different sizes of organization does not change the percentages much; for example, 22% of participants from organizations with more than 10,000 employees indicated that 10% or less of their users are working with the tools.
Spreadsheets are not going away Spreadsheet use is often cited as one of the main obstacles to greater growth in deploying specialized BI and analytics tools. Spreadsheet applications such as Google Spreadsheets or Microsoft Excel are ubiquitous, giving users ready tools for doing calculations, creating graphs, and performing other types of data analysis. In recent releases, Microsoft has integrated BI, data access, and transformation functionality into Excel as well as expanded size limits to enable analysis of more data. Organizations must therefore evaluate whether to adopt specialized BI and analytics tools in the context of what users are already doing with spreadsheets and the investment organizations have in their use for data management and analysis.
In our research, we asked participants what percentage of their organizations’ employees is using spreadsheets or spreadsheet-related programs as their primary tool for data access, analysis, and presentation. Just over half (51%) of participants said more than half of users in their organizations are using spreadsheets rather than a specialized BI or analytics tool; 21% indicated that more than 80% of their users are doing so. The percentages in our research stay about the same no matter how large the participants’ companies are.
Rather than force users to decide between BI and analytics tools and spreadsheets, most leading vendors have developed routines to connect their tools to spreadsheet data. Users can then integrate spreadsheet analysis into their BI dashboards; they can transform and integrate the data for analysis along with other data sources, enabling them to implement their BI, data discovery, and analytics tools’ expanded functionality for data visualization, pattern discovery, and other advanced analytics on spreadsheet data. Many data warehousing and analytics platform solutions can also load data from other sources into users’ spreadsheets and then refresh it periodically if users prefer to manipulate the data in spreadsheets.
The user story below illustrates how Mindjet has moved beyond siloed spreadsheets and primitive analysis to support rapid growth and business change.
USER STORY MINDjET ShIFTS DATA STRATEGY INTO hIGh GEAR TO ADAPT TO BUSINESS ChANGE Business innovation today often depends on innovation in data analysis. However, when a company is growing fast, it can be difficult for its data management and analysis capabilities to keep pace. Acquisitions, product and service introductions, and expansion into new sales channels can all create new and different types of data. These new data sources often remain siloed in spreadsheets or application data stores, making it hard for users to access and analyze them in their quest to discover data insights to support business innovation.
More than half of users are using spreadsheets
rather than a BI or analytics tool
2 David Stodder [2012]. Mobile Business Intelligence and Analytics, TDWI Best Practices Report, Q1, p. 8.
tdwi.org 9
Current Status of Bi/analytics democratization
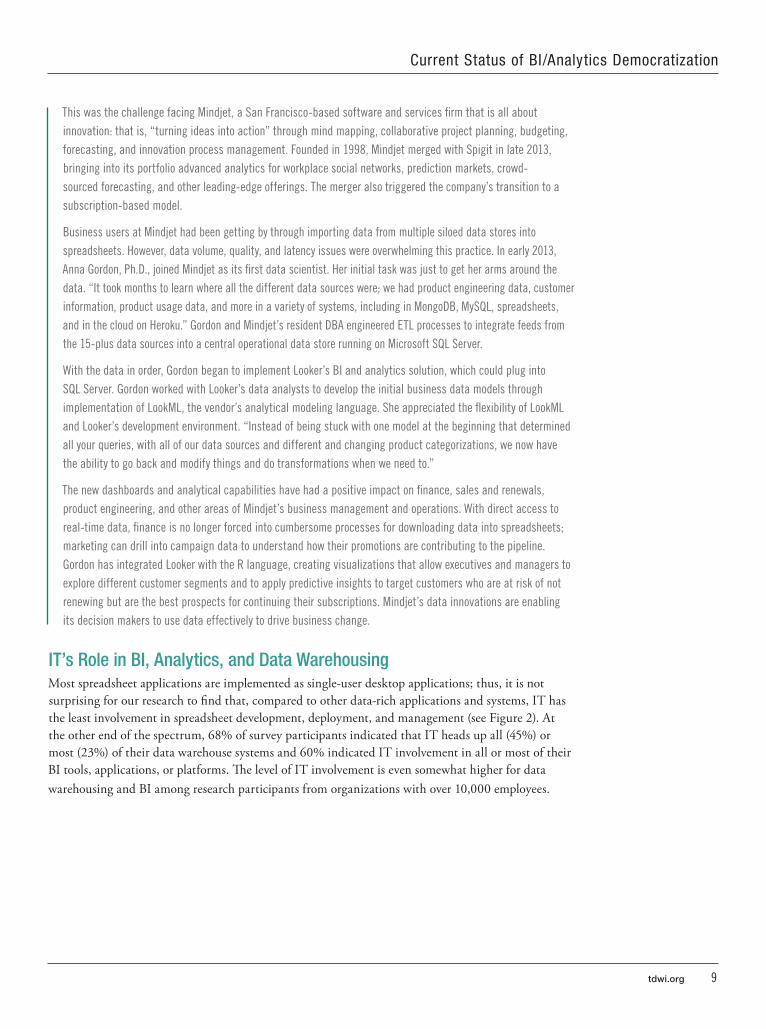
This was the challenge facing Mindjet, a San Francisco-based software and services firm that is all about innovation: that is, “turning ideas into action” through mind mapping, collaborative project planning, budgeting, forecasting, and innovation process management. Founded in 1998, Mindjet merged with Spigit in late 2013, bringing into its portfolio advanced analytics for workplace social networks, prediction markets, crowd-sourced forecasting, and other leading-edge offerings. The merger also triggered the company’s transition to a subscription-based model.
Business users at Mindjet had been getting by through importing data from multiple siloed data stores into spreadsheets. However, data volume, quality, and latency issues were overwhelming this practice. In early 2013, Anna Gordon, Ph.D., joined Mindjet as its first data scientist. Her initial task was just to get her arms around the data. “It took months to learn where all the different data sources were; we had product engineering data, customer information, product usage data, and more in a variety of systems, including in MongoDB, MySQL, spreadsheets, and in the cloud on Heroku.” Gordon and Mindjet’s resident DBA engineered ETL processes to integrate feeds from the 15-plus data sources into a central operational data store running on Microsoft SQL Server.
With the data in order, Gordon began to implement Looker’s BI and analytics solution, which could plug into SQL Server. Gordon worked with Looker’s data analysts to develop the initial business data models through implementation of LookML, the vendor’s analytical modeling language. She appreciated the flexibility of LookML and Looker’s development environment. “Instead of being stuck with one model at the beginning that determined all your queries, with all of our data sources and different and changing product categorizations, we now have the ability to go back and modify things and do transformations when we need to.”
The new dashboards and analytical capabilities have had a positive impact on finance, sales and renewals, product engineering, and other areas of Mindjet’s business management and operations. With direct access to real-time data, finance is no longer forced into cumbersome processes for downloading data into spreadsheets; marketing can drill into campaign data to understand how their promotions are contributing to the pipeline. Gordon has integrated Looker with the R language, creating visualizations that allow executives and managers to explore different customer segments and to apply predictive insights to target customers who are at risk of not renewing but are the best prospects for continuing their subscriptions. Mindjet’s data innovations are enabling its decision makers to use data effectively to drive business change.
IT’s Role in BI, Analytics, and Data WarehousingMost spreadsheet applications are implemented as single-user desktop applications; thus, it is not surprising for our research to find that, compared to other data-rich applications and systems, IT has the least involvement in spreadsheet development, deployment, and management (see Figure 2). At the other end of the spectrum, 68% of survey participants indicated that IT heads up all (45%) or most (23%) of their data warehouse systems and 60% indicated IT involvement in all or most of their BI tools, applications, or platforms. The level of IT involvement is even somewhat higher for data warehousing and BI among research participants from organizations with over 10,000 employees.
10 TDWI RESEARCh
Business-Driven Business Intelligence and Analytics
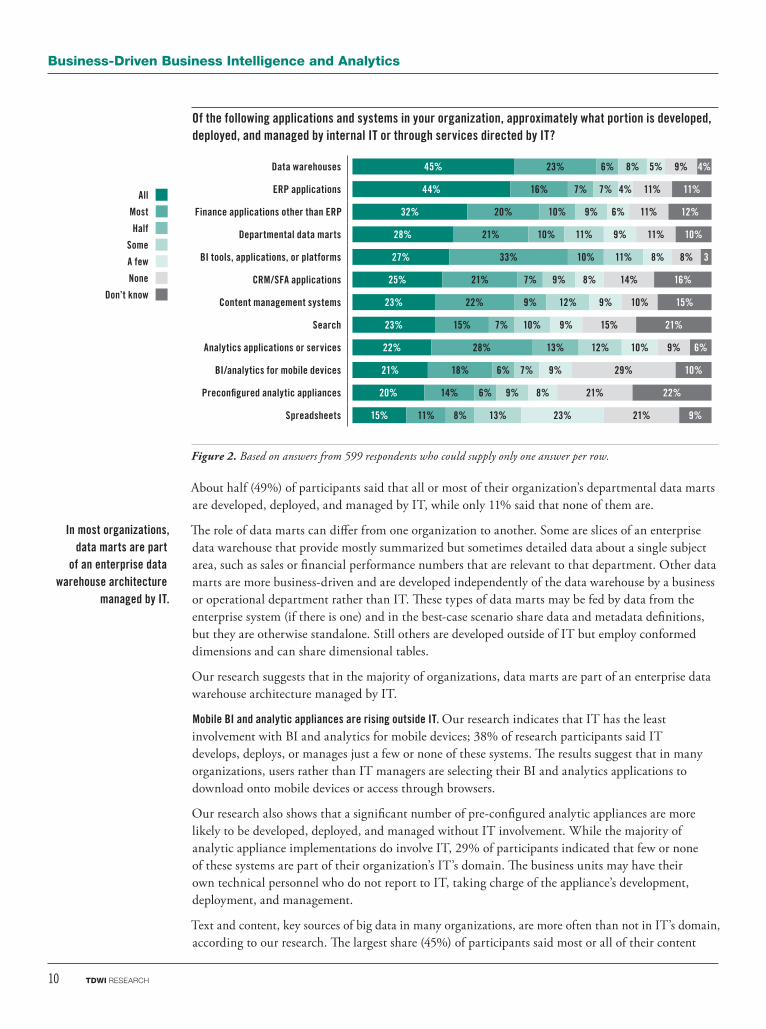
Of the following applications and systems in your organization, approximately what portion is developed, deployed, and managed by internal IT or through services directed by IT?
Data warehouses 45% 23% 6% 8% 5% 9% 4%
ERP applications 44% 16% 7% 7% 4% 11% 11%
Finance applications other than ERP 32% 20% 10% 9% 6% 11% 12%
Departmental data marts 28% 21% 10% 11% 9% 11% 10%
BI tools, applications, or platforms 27% 33% 10% 11% 8% 8% 3
CRM/SFA applications 25% 21% 7% 9% 8% 14% 16%
Content management systems 23% 22% 9% 12% 9% 10% 15%
Search 23% 15% 7% 10% 9% 15% 21%
Analytics applications or services 22% 28% 13% 12% 10% 9% 6%
BI/analytics for mobile devices 21% 18% 6% 7% 9% 29% 10%
Preconfigured analytic appliances 20% 14% 6% 9% 8% 21% 22%
Spreadsheets 15% 11% 8% 13% 23% 21% 9%
Figure 2. Based on answers from 599 respondents who could supply only one answer per row.
About half (49%) of participants said that all or most of their organization’s departmental data marts are developed, deployed, and managed by IT, while only 11% said that none of them are.
The role of data marts can differ from one organization to another. Some are slices of an enterprise data warehouse that provide mostly summarized but sometimes detailed data about a single subject area, such as sales or financial performance numbers that are relevant to that department. Other data marts are more business-driven and are developed independently of the data warehouse by a business or operational department rather than IT. These types of data marts may be fed by data from the enterprise system (if there is one) and in the best-case scenario share data and metadata definitions, but they are otherwise standalone. Still others are developed outside of IT but employ conformed dimensions and can share dimensional tables.
Our research suggests that in the majority of organizations, data marts are part of an enterprise data warehouse architecture managed by IT.
Mobile BI and analytic appliances are rising outside IT Our research indicates that IT has the least involvement with BI and analytics for mobile devices; 38% of research participants said IT develops, deploys, or manages just a few or none of these systems. The results suggest that in many organizations, users rather than IT managers are selecting their BI and analytics applications to download onto mobile devices or access through browsers.
Our research also shows that a significant number of pre-configured analytic appliances are more likely to be developed, deployed, and managed without IT involvement. While the majority of analytic appliance implementations do involve IT, 29% of participants indicated that few or none of these systems are part of their organization’s IT’s domain. The business units may have their own technical personnel who do not report to IT, taking charge of the appliance’s development, deployment, and management.
Text and content, key sources of big data in many organizations, are more often than not in IT’s domain, according to our research. The largest share (45%) of participants said most or all of their content
In most organizations, data marts are part
of an enterprise data warehouse architecture
managed by IT
All
Most
half
Some
A few
None
Don’t know
tdwi.org 11
Current Status of Bi/analytics democratization
management systems are headed by IT, compared to 19% who indicated that only a few or none are. The results for search also lean toward comparatively higher IT involvement, with the majority of participants (38%) indicating that IT develops, deploys, and manages all or most search systems.
Technology implementations that are begun on the business side benefit from IT involvement when the organization wants to scale up and out: that is, give more users across the organization access to the tools for analysis of more data. The user story below describes how Cisco Systems fostered a good business-IT relationship to accelerate adoption of data visualization tools into other units for business decisions across the enterprise.
USER STORY CISCO’S BUSINESS/IT PARTNERShIP ENABLES USERS TO BENEFIT FROM DATA VISUALIzATION Data analysis is so critical to business-user decision making today that BI, analytics, and data visualization projects commonly become flashpoints. Passions can run high as users seek more control. The IT function, aware of its responsibilities to meet service-level agreements and ensure overall performance and governance, digs in its heels.
Having had enough of an all-too-common situation, business and IT management at Cisco Systems have struck out on a different path. “It started when I was looking to enhance the speed and performance of work I was doing on my own,” said Gregory Lewandowski, a 15-year veteran on the business side of Cisco who has worked in sales, operations, and finance. Trying out a number of different tools, Lewandowski’s team built many successful data visualization and analytics applications, including some used by senior Cisco leadership.
However, as Lewandowski’s projects began to involve other groups, it became necessary to secure funding and focus investment on a larger, enterprise vision to support the scale up of applications. Lewandowski partnered with Greg Blair, an IT veteran of 26 years, 14 of them in the BI and data warehousing space. Together, they have been leading a hybrid business and IT competency center aimed at implementing data visualization to “transform the way Cisco’s employees, from board room to boiler room, present and analyze data.” Now, Blair’s IT team is supporting over 100 different business functions producing their own workbooks, dashboards, and content for their respective leaderships.
To make the partnership work, Blair said it was critical to move away from the traditional IT stance. “When IT gets involved, its feet are held to the fire around performance, which leads to an ‘I need to keep bad things from happening’ mindset,” Blair observed. “We call the approach we take ‘unobtrusive governance’: we allow the business users to do things and we’re kind of monitoring in the background. We can find out what data sources people are connecting to and provide optimization.”
Blair and Lewandowski point to another necessary mindset change: IT’s project orientation. “Not everything is a project or can be treated that way,” said Lewandowski. “When you’re in a business function, you know your customers, the organization, and the data. However, you might not be able to articulate the end point, which is very uncomfortable for a traditional project delivery organization like IT. This is why users need to engage in data exploration; they need the freedom to stumble on things that could end up being incredibly important.”
Blair added that while some things need to be projects, and you need controls for regulatory compliance, “you have to find a common ground to provide a self-reliance environment so that both business and IT groups can jump on things.” Yet, at the same time, he said, “we need to be clear with business users that the self-reliance environment means more responsibility for them.”
The shared sense of ownership is essential to realizing Lewandowski’s goal of applying data visualization to achieve “the highest level of accurate communication,” he said. “We want visualization to be so intuitive that no instructions are needed. We want people to just understand what’s there and what’s occurring very quickly.”
Technology implementations that are begun on the business side benefit from IT involvement when the organization wants to scale up and out
12 TDWI RESEARCh
Business-Driven Business Intelligence and Analytics
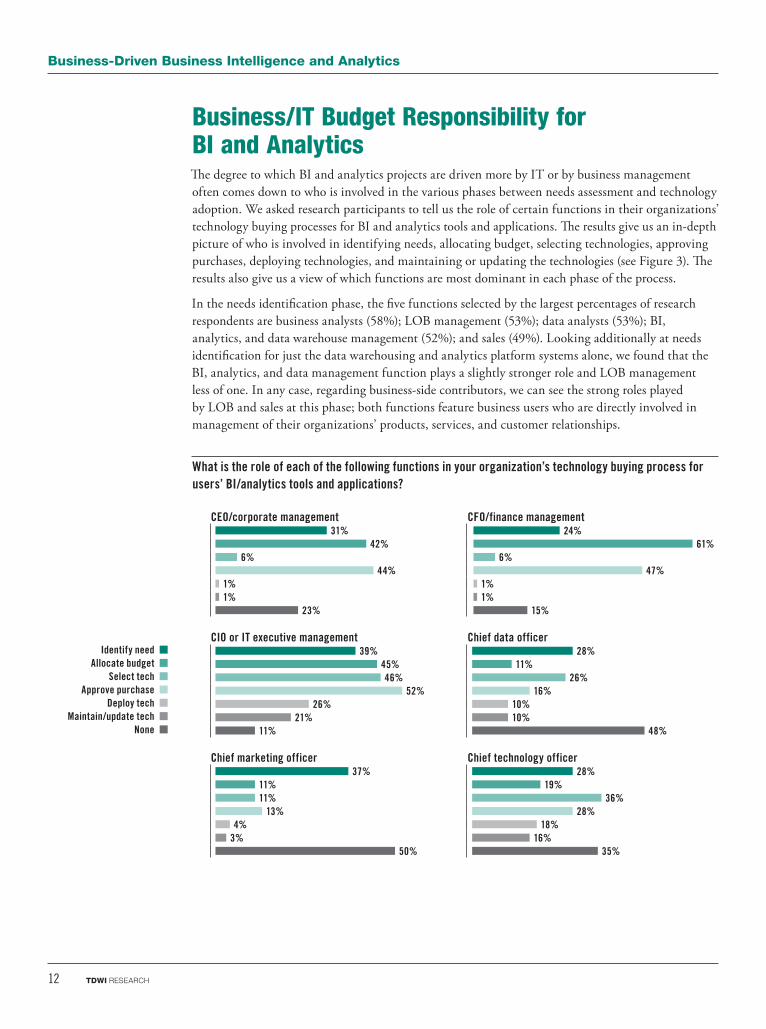
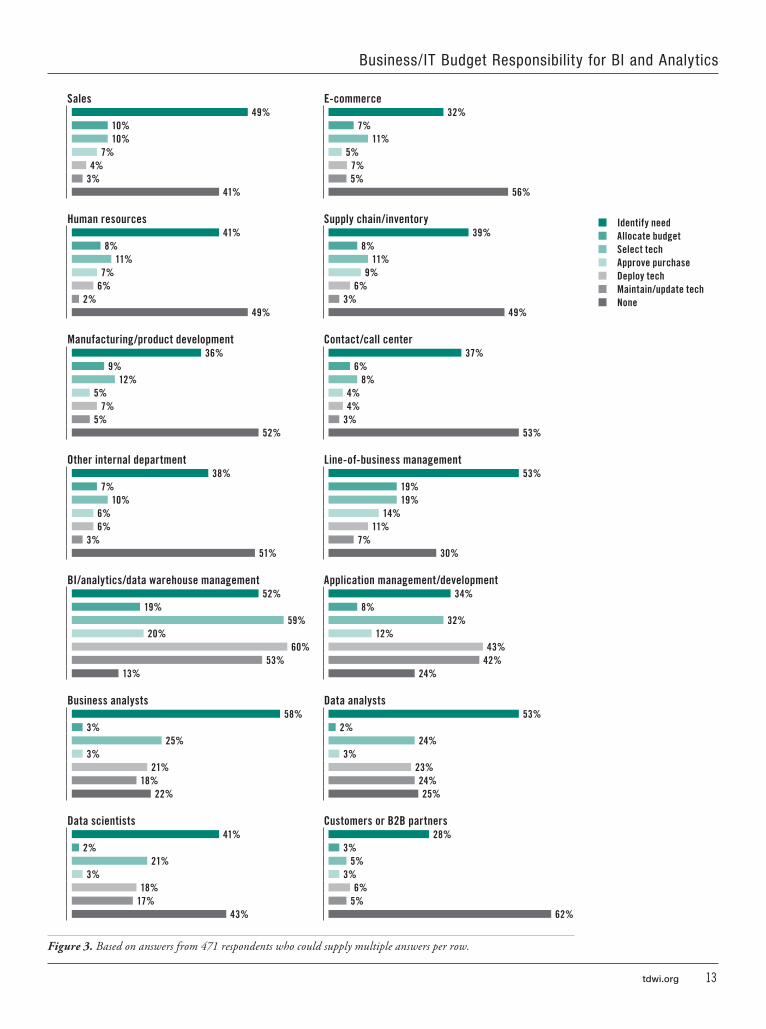
Business/IT Budget Responsibility for BI and AnalyticsThe degree to which BI and analytics projects are driven more by IT or by business management often comes down to who is involved in the various phases between needs assessment and technology adoption. We asked research participants to tell us the role of certain functions in their organizations’ technology buying processes for BI and analytics tools and applications. The results give us an in-depth picture of who is involved in identifying needs, allocating budget, selecting technologies, approving purchases, deploying technologies, and maintaining or updating the technologies (see Figure 3). The results also give us a view of which functions are most dominant in each phase of the process.
In the needs identification phase, the five functions selected by the largest percentages of research respondents are business analysts (58%); LOB management (53%); data analysts (53%); BI, analytics, and data warehouse management (52%); and sales (49%). Looking additionally at needs identification for just the data warehousing and analytics platform systems alone, we found that the BI, analytics, and data management function plays a slightly stronger role and LOB management less of one. In any case, regarding business-side contributors, we can see the strong roles played by LOB and sales at this phase; both functions feature business users who are directly involved in management of their organizations’ products, services, and customer relationships.
What is the role of each of the following functions in your organization’s technology buying process for users’ BI/analytics tools and applications?
CEO/corporate management CFO/finance management31% 24%
42% 61%6% 6%
44% 47%1% 1%1% 1%
23% 15%
CIO or IT executive management Chief data officer39% 28%
45% 11%46% 26%
52% 16%26% 10%
21% 10%11% 48%
Chief marketing officer Chief technology officer37% 28%
11% 19%11% 36%
13% 28%4% 18%
3% 16%50% 35%
Identify needAllocate budget
Select techApprove purchase
Deploy techMaintain/update tech
None
tdwi.org 13
Business/it Budget responsibility for Bi and analytics
Sales E-commerce49% 32%
10% 7%10% 11%
7% 5%4% 7%
3% 5%41% 56%
human resources Supply chain/inventory41% 39%
8% 8%11% 11%
7% 9%6% 6%
2% 3%49% 49%
Manufacturing/product development Contact/call center36% 37%
9% 6%12% 8%
5% 4%7% 4%
5% 3%52% 53%
Other internal department Line-of-business management38% 53%
7% 19%10% 19%
6% 14%6% 11%
3% 7%51% 30%
BI/analytics/data warehouse management Application management/development52% 34%
19% 8%59% 32%
20% 12%60% 43%
53% 42%13% 24%
Business analysts Data analysts58% 53%
3% 2%25% 24%
3% 3%21% 23%
18% 24%22% 25%
Data scientists Customers or B2B partners41% 28%
2% 3%21% 5%
3% 3%18% 6%
17% 5%43% 62%
Figure 3. Based on answers from 471 respondents who could supply multiple answers per row.
Identify needAllocate budgetSelect techApprove purchaseDeploy techMaintain/update techNone
14 TDWI RESEARCh
Business-Driven Business Intelligence and Analytics
Research highlights the importance of business analysts It is not surprising that the business analyst would be high on the list of functions responsible for identifying needs. The International Institute of Business Analysts defines the role as “a liaison among stakeholders in order to understand the structure, policies, and operations of an organization, and to recommend solutions that enable the organization to achieve its goals.” Business analysts play an essential role in translating business needs into data-driven technology projects.
Business analysts often enter into the profession from the business side and become the business team’s tech-savvy requirements experts. In this role, they develop a deep understanding of the business’s challenges and requirements. To enable them to gain this depth, organizations will dedicate business analysts to one area, such as a single LOB or function, if not a single product or service line within the function. The trade-off is that these business analysts do not have an enterprise view or the opportunity to engage frequently in cross-functional projects to develop a broad understanding.
Other business analysts instead report into IT. One such analyst interviewed as part of our research explained that as part of IT, he has a cross-functional, enterprise view, which is important for projects that involve (and are potentially funded by) more than one business function. In his company, IT management periodically rotates groups of data analysts and developers into and out of the business analyst role before assigning the duties to another group. He said this approach gives his organization’s IT data analysts and developers firsthand experience in identifying business needs, developing requirements, and communicating proposed solutions to business users. The approach addresses the potential downside of having business analysts report into IT, which is that they are disconnected from the business side and lack depth of knowledge about particular business functions or LOBs.
The CFO has the biggest role in allocating budgets Our research shows that business analysts are not very involved in allocating budgets (3%). The top participants in this phase, ordered according to our research, are CFO and finance management (61%); CIO or IT executive management (45%), and CEO and corporate management (42%). Roughly the same percentages hold when we look at budget allocation for just data warehouse and analytics platform systems. Clearly, these C-level functions, representing both business and IT, control most of the purse strings for BI and analytics projects in most organizations.
Our interview research finds that CFOs in general are playing a more significant role in BI and analytics projects as organizations seek to monitor and measure more aspects of business performance and analyze the quality of alignment between financial objectives and operational decisions. Some IT functions are now reporting to the CFO, making the entire IT function by definition “business-driven,” or at least finance-driven. In this arrangement, the office of finance oversees IT costs and alignment more directly and can also guide development of BI and analytics projects to support the CFO’s growing business performance leadership responsibilities.
Our research finds that the functions currently exhibiting the greatest increase in budget control over BI, analytics, and data warehousing projects are LOB management; non-IT heads of BI, analytics, and data warehousing; and the office of finance. Most research participants said the level of budget control for other functions identified in Figure 3 will be staying about the same.
Business analysts play an essential role in
translating business needs into data-driven
technology projects
CFOs are playing a more significant role
in BI and analytics projects as organizations
seek to monitor and measure more aspects
of performance
tdwi.org 15
Business/it Budget responsibility for Bi and analytics
BI and Analytics Technology Selection Process RolesIn Figure 3, we can see that the dominant player in technology selection is the BI, analytics, and data warehouse management function (59%). CIOs and IT executive managers (46%) have considerable say as well, particularly for choosing data warehousing and analytics platform systems. Within BI, analytics, and data warehouse management are typically personnel who specialize in assessing the technology’s qualities and can test features. They will examine how the new technology would fit into the organization’s existing data architecture. They will pay close attention to factors such as data and metadata integration, security, scalability, and how great an effort it will take to deploy and maintain the new solution over time. Working with business users, IT’s BI, analytics, and data warehouse management personnel are tasked with evaluating the user experience to see if the proposed technology solution offers the requisite flexibility and intuitiveness to enable users to address the full range of their needs.
Interestingly, while the business side has a relatively strong role in needs identification and in allocating budgets for technology solution acquisition, research participants indicated that few of their business functions have a direct role in technology selection. Only 19% said LOBs have a role, and just 11% said either e-commerce or human resources have roles. Other key players in selecting technology, according to our research, are the chief technology officer (36%, with the caveat that many organizations in our study do not have a CTO) and application management and development (32%).
Leaders in purchase approval are the same as those for budget allocation The research shows that the same C-level triumvirate identified earlier as leading the budget allocation process is also most commonly involved in approving purchases: that is, the CIO or IT executive management (52%), CFO and finance management (47%), and CEO and corporate management (44%). We find that the CIO has a somewhat bigger role in allocating budget for data warehouse and analytics platform systems specifically. It is interesting to note that the highest of these percentages is just over half, which suggests that there are frequently multiple functions with some responsibility for approving purchases. Other significant players include CTOs (cited by 28%) and BI, analytics, and data warehouse management (20%). Less involved in approving purchases are LOB (14%) and the other business functions among the selections; for example, only 13% of research participants cited the CMO.
Responsibility for deploying technology falls most prevalently to BI, analytics, and data warehouse management (60%), followed by application management and development (43%). These two functions also dominate technology maintenance.
Research participants say IT still plays a large role in cloud and SaaS selection In our research hypothesis, we theorized that the growing presence of alternatives to on-premises technology deployment could shift more technology selection to the business side. However, we discovered that while some business departments are selecting and funding cloud-based or SaaS BI, analytics, and data warehousing solutions, IT still plays a large role in the decisions.
In our research, about one-quarter (24%) of our participants said that business functions are selecting more than half of their cloud and SaaS solutions for BI, analytics, and data warehousing, with only 6% saying all of it is being done by business functions or departments. By comparison, just over a quarter (28%) of research participants said none of their cloud or SaaS solution selection and funding is being done by business functions or departments rather than IT. It appears that for most organizations, both sides are involved; the largest group (38%) said at least “a few” or “some” of their cloud or SaaS solutions are selected and funded by business departments or functions.
The following user story illustrates how Splurgy met needs for data access and analysis flexibility with cloud-based technology and services.
A small number of business functions have a direct role in technology selection
16 TDWI RESEARCh
Business-Driven Business Intelligence and Analytics
USER STORY SPLURGY FINDS DATA FLExIBILITY AND INSIGhT IN ThE CLOUD “We’re very concerned about data,” said Michi Kono, VP of engineering and a co-founder of Splurgy, an innovative social media marketing services provider. Founded in 2011, Splurgy offers a platform for creating and embedding promotions such as coupons and personalized sweepstakes that can run not only on a company’s own website but also on other sites such as Facebook. Splurgy’s tools enable firms to monitor what is hot in social content and then create marketing campaigns and messages based on the Splurgy tool’s recommendations. Splurgy’s approach demands recording lots of data to measure user actions and having significant flexibility in how data is analyzed.
Splurgy’s recognition of the importance of data was part of its own DNA. “As a startup, you’re trying to fill a hole in the business world,” said Kono. “You’re making a lot of assumptions and need data to make sure those assumptions are correct. We figured out early on that we could serve clients by measuring as much data as possible.”
Like many young companies, Splurgy was interested in alternatives to heavy on-premises IT investment. However, Kono was initially frustrated in his search for a SaaS provider to support Splurgy’s data analysis requirements. He found providers’ data loading and integration capabilities were limited and their reports, while visually “fancy,” were too canned. “We wanted to look at the raw data,” he said. “In providing insights to our customers, we often don’t know what we will be reporting on until much later; we also might want to build complex reports ourselves or just crunch numbers in a spreadsheet.”
Splurgy chose to go with Treasure Data’s cloud services, which could provide the required flexibility in big data collection, access, analysis, and reporting as well as handle the maintenance and monitoring of the platform with its managed service model. Splurgy implements a layered architecture, applying its own data transformation layer for its reporting. Access to large quantities of raw data served Splurgy well during a system redesign to refresh its tools and promotion services. “We were changing the flow and had rewritten code to load faster, but we were concerned about how this would impact conversion rates,” Kono related. “We were able to look at the data to compare the old and new versions of the code before launching it publicly. We ended up keeping the parts of the new flow that improved conversions but had to do some work on the landing page process. In the end, conversion rates almost doubled with the full redesign.”
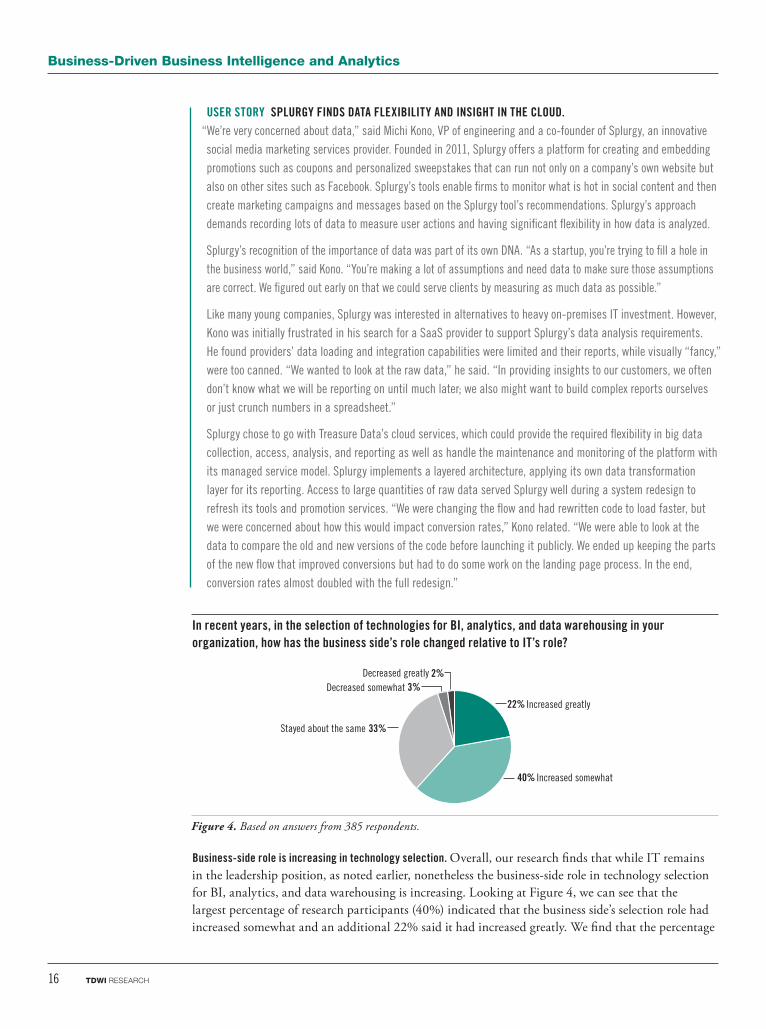
In recent years, in the selection of technologies for BI, analytics, and data warehousing in your organization, how has the business side’s role changed relative to IT’s role?
Increased greatly22%
Decreased greatly 2%Decreased somewhat 3%
Stayed about the same 33%
Increased somewhat40%
Figure 4. Based on answers from 385 respondents.
Business-side role is increasing in technology selection Overall, our research finds that while IT remains in the leadership position, as noted earlier, nonetheless the business-side role in technology selection for BI, analytics, and data warehousing is increasing. Looking at Figure 4, we can see that the largest percentage of research participants (40%) indicated that the business side’s selection role had increased somewhat and an additional 22% said it had increased greatly. We find that the percentage
tdwi.org 17
Business/it Budget responsibility for Bi and analytics
of research participants indicating larger business-side roles in technology selection is higher among those from organizations where most users are implementing BI and analytics tools. Among research participants who indicated that more than half of their organizations’ users are working with the tools, 41% said the business side’s role had increased at least somewhat and 32% said it had increased greatly. Democratization of BI and analytics appears to increase the business side’s role in technology selection.
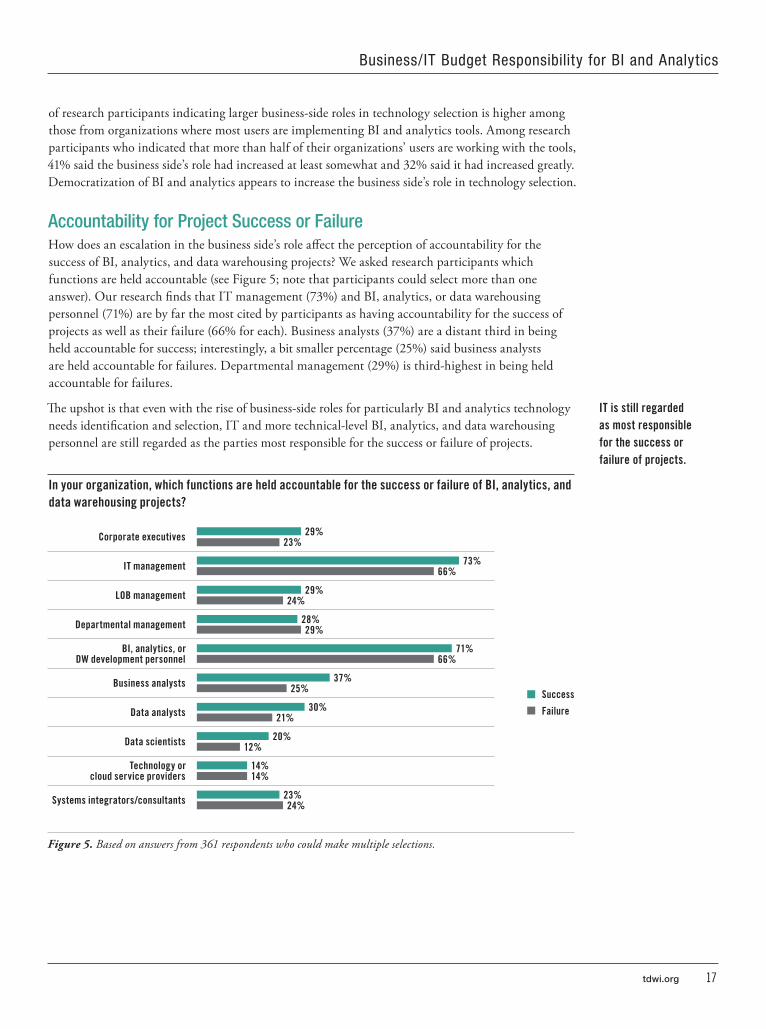
Accountability for Project Success or FailureHow does an escalation in the business side’s role affect the perception of accountability for the success of BI, analytics, and data warehousing projects? We asked research participants which functions are held accountable (see Figure 5; note that participants could select more than one answer). Our research finds that IT management (73%) and BI, analytics, or data warehousing personnel (71%) are by far the most cited by participants as having accountability for the success of projects as well as their failure (66% for each). Business analysts (37%) are a distant third in being held accountable for success; interestingly, a bit smaller percentage (25%) said business analysts are held accountable for failures. Departmental management (29%) is third-highest in being held accountable for failures.
The upshot is that even with the rise of business-side roles for particularly BI and analytics technology needs identification and selection, IT and more technical-level BI, analytics, and data warehousing personnel are still regarded as the parties most responsible for the success or failure of projects.
In your organization, which functions are held accountable for the success or failure of BI, analytics, and data warehousing projects?
Corporate executives 29% 23%
IT management 73%66%
LOB management 29% 24%
Departmental management 28% 29%
BI, analytics, or DW development personnel
71% 66%
Business analysts 37% 25%
Data analysts 30% 21%
Data scientists 20% 12%
Technology or cloud service providers
14% 14%
Systems integrators/consultants 23% 24%
Figure 5. Based on answers from 361 respondents who could make multiple selections.
IT is still regarded as most responsible for the success or failure of projects
Success
Failure
18 TDWI RESEARCh
Business-Driven Business Intelligence and Analytics
Winning Sponsorship for BI and Analytics ProjectsTDWI Research finds that the functions currently taking the lead in sponsoring the biggest share of BI and analytics projects are familiar ones: BI, analytics, and data warehouse management; CIOs and IT executive management; CEOs and corporate management; and CFOs and finance management. These findings line up with those discussed above, where we noted that these functions are often the most prominent in allocating budget and approving technology purchases. These functions also have the most definite plans to continue sponsoring projects in the future.
At least in terms of quantity, LOBs and business functions such as marketing, sales, ecommerce, supply chain, and inventory are sponsoring a comparatively smaller number of projects and have only modest plans to sponsor more in the future. Budget limitations that constrain sponsorship opportunities for LOB and business functions are often cited as key drivers behind the explosion of interest in adopting at least initially less expensive technologies such as Hadoop and related open-source big data technologies. Although these options can generate other costs (for example, the need to hire specialized technology and data science experts), they do not carry the substantial licensing fees of commercial, off-the-shelf products that IT leadership and C-level executives tend to favor for IT-sponsored projects.
BI and analytics project success depends on good alignment with priorities Thus, for business-driven BI and analytics projects to gain sponsorship from LOB and business functions, project proposals must be carefully crafted. Because they have more limited budgets, LOB and business functions are highly selective about which projects they sponsor. At the same time, however, the project proposals must align with the priorities of those in the organizations who do sponsor the most BI and analytics projects, namely IT leadership and C-level executives such as CFOs and CEOs.
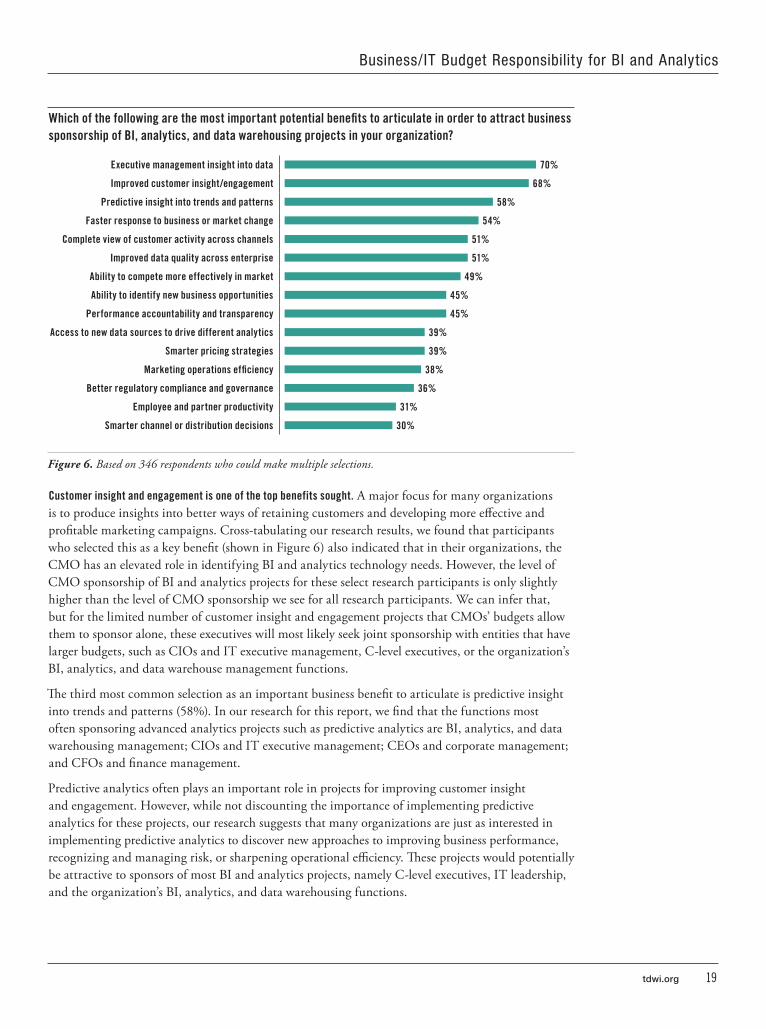
Our research finds that the top two most important potential benefits to articulate in order to attract business sponsorship are executive management insight into data (70%) and improved customer insight and engagement (68%; see Figure 6). Reducing time to insight for all users is a good thing, but perhaps most appreciated by executive management. CEOs and other executives are under pressure to make strategic and operational decisions more quickly. Executives need dashboards that offer easily understood data visualizations, in some cases for metrics that need to be refreshed in near real time. They need continuous and complete visibility into different aspects of the business, including LOB performance, sales, finance, risk, and more.
Because of limited budgets, business
functions are highly selective about which projects they sponsor
tdwi.org 19
Business/it Budget responsibility for Bi and analytics
Which of the following are the most important potential benefits to articulate in order to attract business sponsorship of BI, analytics, and data warehousing projects in your organization?
Executive management insight into data 70%
Improved customer insight/engagement 68%
Predictive insight into trends and patterns 58%
Faster response to business or market change 54%
Complete view of customer activity across channels 51%
Improved data quality across enterprise 51%
Ability to compete more effectively in market 49%
Ability to identify new business opportunities 45%
Performance accountability and transparency 45%
Access to new data sources to drive different analytics 39%
Smarter pricing strategies 39%
Marketing operations efficiency 38%
Better regulatory compliance and governance 36%
Employee and partner productivity 31%
Smarter channel or distribution decisions 30%
Figure 6. Based on 346 respondents who could make multiple selections.
Customer insight and engagement is one of the top benefits sought A major focus for many organizations is to produce insights into better ways of retaining customers and developing more effective and profitable marketing campaigns. Cross-tabulating our research results, we found that participants who selected this as a key benefit (shown in Figure 6) also indicated that in their organizations, the CMO has an elevated role in identifying BI and analytics technology needs. However, the level of CMO sponsorship of BI and analytics projects for these select research participants is only slightly higher than the level of CMO sponsorship we see for all research participants. We can infer that, but for the limited number of customer insight and engagement projects that CMOs’ budgets allow them to sponsor alone, these executives will most likely seek joint sponsorship with entities that have larger budgets, such as CIOs and IT executive management, C-level executives, or the organization’s BI, analytics, and data warehouse management functions.
The third most common selection as an important business benefit to articulate is predictive insight into trends and patterns (58%). In our research for this report, we find that the functions most often sponsoring advanced analytics projects such as predictive analytics are BI, analytics, and data warehousing management; CIOs and IT executive management; CEOs and corporate management; and CFOs and finance management.
Predictive analytics often plays an important role in projects for improving customer insight and engagement. However, while not discounting the importance of implementing predictive analytics for these projects, our research suggests that many organizations are just as interested in implementing predictive analytics to discover new approaches to improving business performance, recognizing and managing risk, or sharpening operational efficiency. These projects would potentially be attractive to sponsors of most BI and analytics projects, namely C-level executives, IT leadership, and the organization’s BI, analytics, and data warehousing functions.
20 TDWI RESEARCh
Business-Driven Business Intelligence and Analytics
The following user story describes how the University of Louisiana System is driving to achieve ambitious goals for integrating stakeholders to improve education for students and employers.
USER STORY UNIVERSITY OF LOUISIANA SYSTEM ALIGNS EDUCATION AND EMPLOYMENT OPPORTUNITIES “Education is not a problem,” President Lyndon B. Johnson once said. “Education is an opportunity.” Realizing opportunities through education is an inspiring goal, but not one without challenges. Despite best intentions, it can be difficult to foster the necessary collaboration between educational institutions, funding sources, employers, and students to align college education with career opportunities. Forward-thinking professionals believe that data and analytics could improve alignment and lead to better outcomes.
Dr. Sandra Woodley, president of the University of Louisiana System, has been a proponent of data-driven approaches to improving the connection between students’ education and career opportunities. Her goal is to create “a massive data trove that should help students become more marketable to prospective employers and help those companies find their desired types of students,” she said. The System is leading the development of a partnership with employers to provide all parties—students, employers, educators, trustees, and others—with visibility into data so that together they can “improve workforce creation by matching skills with employer needs.”
Analytics will play a key role in enabling the partnership. Before coming to the System, Woodley led a major dashboard development initiative at the University of Texas System in partnership with SAS and Austin-based social media platform developer MyEdu. The Texas system involved extensive development of a data warehouse that integrated data from many sources to feed users’ BI dashboards. “We had huge demand for data that we didn’t really have available for users to access,” Woodley said. For the University of Louisiana System, Woodley’s group and MyEdu have been able to focus more on the analytics, having chosen a less complicated development path through hosted implementation of SAS Visual Analytics.
The analytics will serve a wide range of users and will focus on delivering data insights about graduation rates, degrees, retention rates, costs per degree, and the system’s ability to provide graduates who can meet employers’ needs. Through an easy-to-use, visual workspace and social media platform, students will supply the system with their projects, grades, and other information. Employers, particularly in the booming Louisiana oil and gas industry, will load the system with information about their internships and available jobs, so that users can do correlations, look at trends, and find gaps.
The first two steps of the project have been completed. Step one was forging a partnership between MyEdu and the UL System to encourage its 90,000 students to create profiles. Step two was creating an online analytics dashboard powered by SAS. The third critical step of bringing the two together is currently under development.
According to Woodley, the key challenges ahead are funding and leadership. “Analytics can help us connect the dots and build models to plan for the long term; we can then begin to nudge students by making them aware of options that they otherwise might not have considered. The end game is to align student demand with market demand, so that students benefit by having a career that stimulates them intellectually and supports them financially, while at the same time meet the demands of Louisiana’s growing economy,” she said.
tdwi.org 21
improving Business/it Leadership and Collaboration
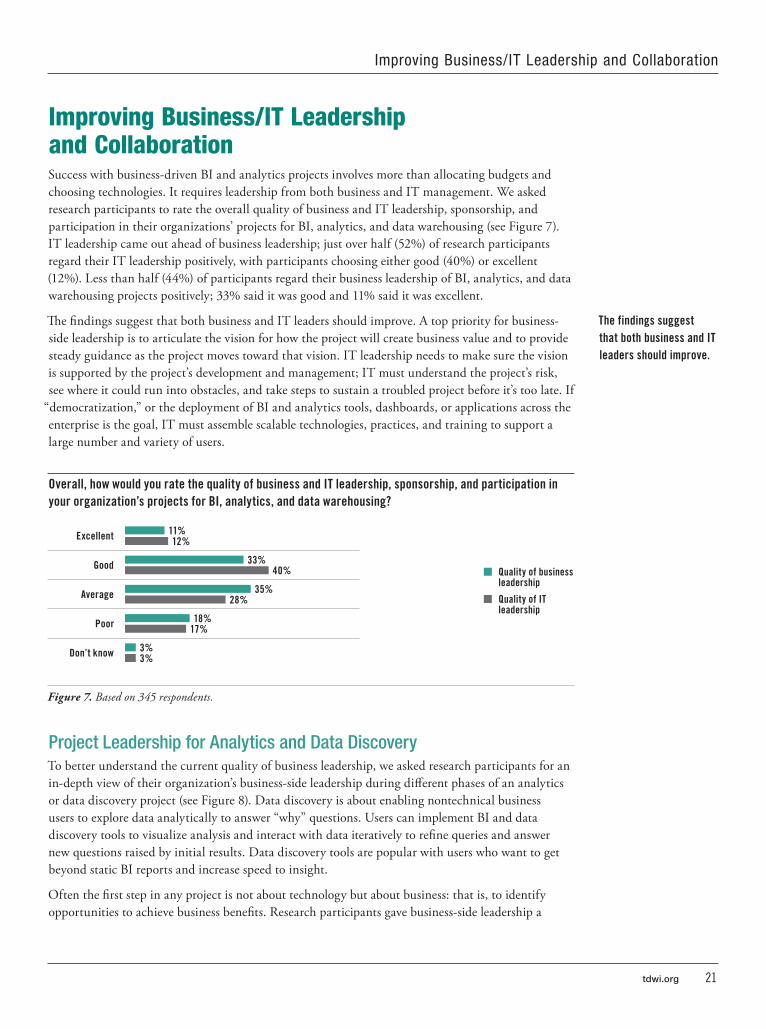
Improving Business/IT Leadership and CollaborationSuccess with business-driven BI and analytics projects involves more than allocating budgets and choosing technologies. It requires leadership from both business and IT management. We asked research participants to rate the overall quality of business and IT leadership, sponsorship, and participation in their organizations’ projects for BI, analytics, and data warehousing (see Figure 7). IT leadership came out ahead of business leadership; just over half (52%) of research participants regard their IT leadership positively, with participants choosing either good (40%) or excellent (12%). Less than half (44%) of participants regard their business leadership of BI, analytics, and data warehousing projects positively; 33% said it was good and 11% said it was excellent.
The findings suggest that both business and IT leaders should improve. A top priority for business-side leadership is to articulate the vision for how the project will create business value and to provide steady guidance as the project moves toward that vision. IT leadership needs to make sure the vision is supported by the project’s development and management; IT must understand the project’s risk, see where it could run into obstacles, and take steps to sustain a troubled project before it’s too late. If
“democratization,” or the deployment of BI and analytics tools, dashboards, or applications across the enterprise is the goal, IT must assemble scalable technologies, practices, and training to support a large number and variety of users.
Overall, how would you rate the quality of business and IT leadership, sponsorship, and participation in your organization’s projects for BI, analytics, and data warehousing?
Excellent 11% 12%
Good 33%40%
Average 35% 28%
Poor 18% 17%
Don’t know 3% 3%
Figure 7. Based on 345 respondents.
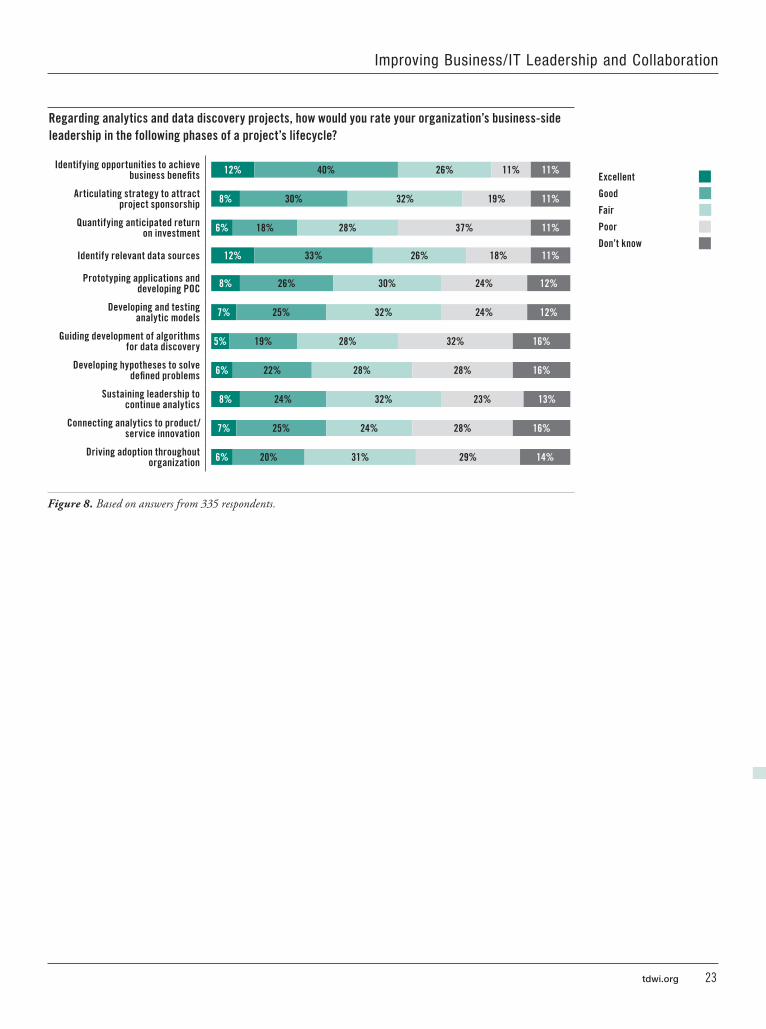
Project Leadership for Analytics and Data DiscoveryTo better understand the current quality of business leadership, we asked research participants for an in-depth view of their organization’s business-side leadership during different phases of an analytics or data discovery project (see Figure 8). Data discovery is about enabling nontechnical business users to explore data analytically to answer “why” questions. Users can implement BI and data discovery tools to visualize analysis and interact with data iteratively to refine queries and answer new questions raised by initial results. Data discovery tools are popular with users who want to get beyond static BI reports and increase speed to insight.
Often the first step in any project is not about technology but about business: that is, to identify opportunities to achieve business benefits. Research participants gave business-side leadership a
The findings suggest that both business and IT leaders should improve
Quality of business leadership
Quality of IT leadership
22 TDWI RESEARCh
Business-Driven Business Intelligence and Analytics
moderately positive review for this phase; 40% said their business leadership was good and 12% said it was excellent. These positive percentages rise slightly among participants who indicated that more than half of their organization’s users are implementing BI and analytics tools.
Research participants are somewhat less sanguine about business-side leadership for articulating strategy to attract project sponsorship; 32% said it was fair and 19% called it poor. Participants indicated that their business leaders struggle even more in providing leadership for quantifying the anticipated return on investment (ROI). Just 6% indicated that such leadership was excellent while 37% said it was poor and 28% called it merely fair.
Our research finds that in fact most organizations struggle with quantifying the ROI of BI and analytics projects, in part because the benefits are generally felt downstream, in financial management processes, customer relationships and experience management, supply chain planning, and so on. Business and IT leaders often are more successful in pointing out the cost of not having BI and analytics: that is, the length of time it takes users to access the right data, analyze it effectively, and share it in a comprehensible fashion with their colleagues. They can point to lost business opportunities due to poor information flow, which BI and analytics projects could remedy.
In contrast to their less-than-stellar impression about business leadership’s ability to quantify ROI, in Figure 8 we can see that research participants view their business-side leadership as somewhat better at identifying relevant data sources for analytics and data discovery. As noted earlier in this report, business SMEs often know the data they wish to access but do not have the skill or tools to effectively do so.
However, business leadership evidently struggles during the application prototyping and proof of concept development phase; only 8% of participants said leadership in this step was excellent, while 54% said it was either fair or poor. Participants’ assessments of business leadership are also relatively negative for crucial phases in analytics projects such as developing and testing models, guiding development of algorithms for data discovery, and developing hypotheses to solve defined problems.
The business side also needs to improve how well it sustains leadership to continue analytics projects. Our research finds that too often, business management loses focus on analytics projects after a change of leadership, a shift in priorities, or other disruption. Figure 8 shows that 55% of participants indicated that business leadership for project sustenance is either fair or poor. Participants’ impressions are no better regarding business leadership for connecting analytics to product and service innovation.
Leadership for driving adoption throughout the organization is also weak; only 26% of participants had a positive view of this aspect of business-side leadership. To expand projects across organizations often requires leaders with an enterprise perspective, such as a C-level business or IT executive. In our interview research, we find that organizations often struggle to maintain business-side sponsorship of BI and analytics projects when the vision broadens beyond the initial focus on a single LOB or business function—and beyond the direct interest of the LOB or business function leadership that originally sponsored the project.
Most organizations struggle with quantifying
the ROI of BI and analytics projects
The business side also needs to improve
how well it sustains leadership to continue
analytics projects
tdwi.org 23
Regarding analytics and data discovery projects, how would you rate your organization’s business-side leadership in the following phases of a project’s lifecycle?
Identifying opportunities to achieve business benefits 12% 40% 26% 11% 11%
Articulating strategy to attract project sponsorship 8% 30% 32% 19% 11%
Quantifying anticipated return on investment 6% 18% 28% 37% 11%
Identify relevant data sources 12% 33% 26% 18% 11%
Prototyping applications and developing POC 8% 26% 30% 24% 12%
Developing and testing analytic models 7% 25% 32% 24% 12%
Guiding development of algorithms for data discovery 5% 19% 28% 32% 16%
Developing hypotheses to solve defined problems 6% 22% 28% 28% 16%
Sustaining leadership to continue analytics 8% 24% 32% 23% 13%
Connecting analytics to product/service innovation 7% 25% 24% 28% 16%
Driving adoption throughout organization 6% 20% 31% 29% 14%
Figure 8. Based on answers from 335 respondents.
Excellent
Good
Fair
Poor
Don’t know
improving Business/it Leadership and Collaboration
24 TDWI RESEARCh
Business-Driven Business Intelligence and Analytics
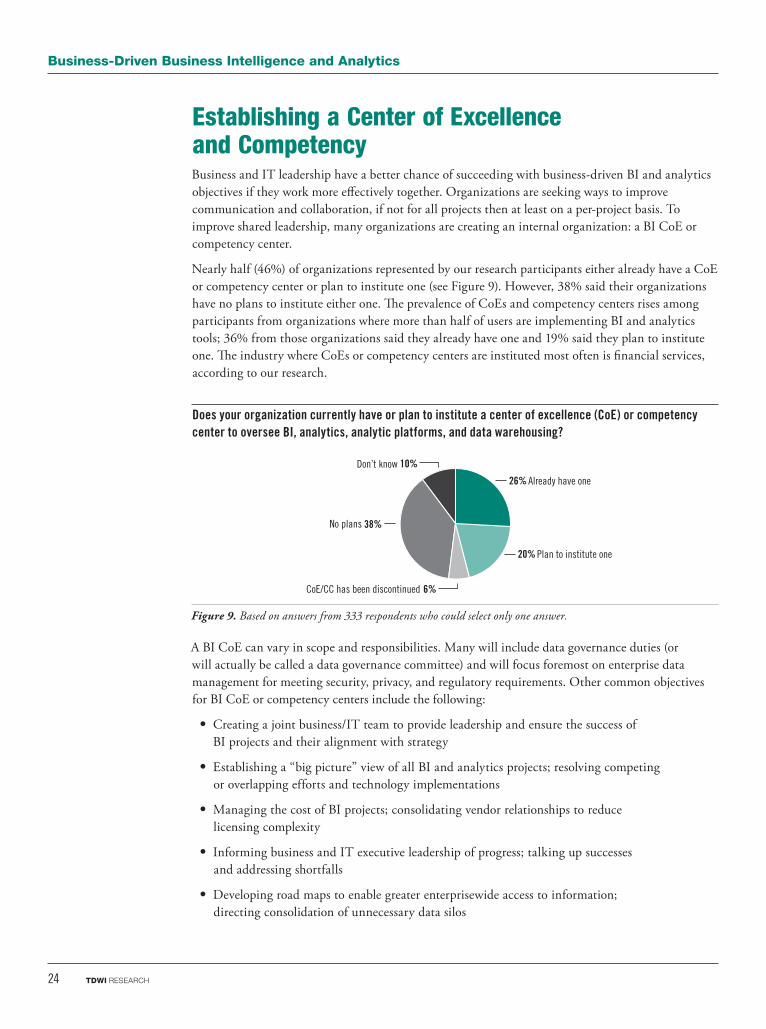
Establishing a Center of Excellence and CompetencyBusiness and IT leadership have a better chance of succeeding with business-driven BI and analytics objectives if they work more effectively together. Organizations are seeking ways to improve communication and collaboration, if not for all projects then at least on a per-project basis. To improve shared leadership, many organizations are creating an internal organization: a BI CoE or competency center.
Nearly half (46%) of organizations represented by our research participants either already have a CoE or competency center or plan to institute one (see Figure 9). However, 38% said their organizations have no plans to institute either one. The prevalence of CoEs and competency centers rises among participants from organizations where more than half of users are implementing BI and analytics tools; 36% from those organizations said they already have one and 19% said they plan to institute one. The industry where CoEs or competency centers are instituted most often is financial services, according to our research.
Does your organization currently have or plan to institute a center of excellence (CoE) or competency center to oversee BI, analytics, analytic platforms, and data warehousing?
Already have one26%
No plans 38%
Don’t know 10%
CoE/CC has been discontinued 6%
Plan to institute one20%
Figure 9. Based on answers from 333 respondents who could select only one answer.
A BI CoE can vary in scope and responsibilities. Many will include data governance duties (or will actually be called a data governance committee) and will focus foremost on enterprise data management for meeting security, privacy, and regulatory requirements. Other common objectives for BI CoE or competency centers include the following:
• Creating a joint business/IT team to provide leadership and ensure the success of BI projects and their alignment with strategy
• Establishing a “big picture” view of all BI and analytics projects; resolving competing or overlapping efforts and technology implementations
• Managing the cost of BI projects; consolidating vendor relationships to reduce licensing complexity
• Informing business and IT executive leadership of progress; talking up successes and addressing shortfalls
• Developing road maps to enable greater enterprisewide access to information; directing consolidation of unnecessary data silos
tdwi.org 25
• Increasing BI’s role in financial and operational processes; realizing the value of data for continuous process improvement
• Defining best practices; keeping the focus on improving the quality, effectiveness, and value of BI and analytics projects for business users
• Providing high-level leadership and support for implementation of agile methods for BI, analytics, and data warehousing projects; encouraging iterative development to explore and identify ongoing user needs
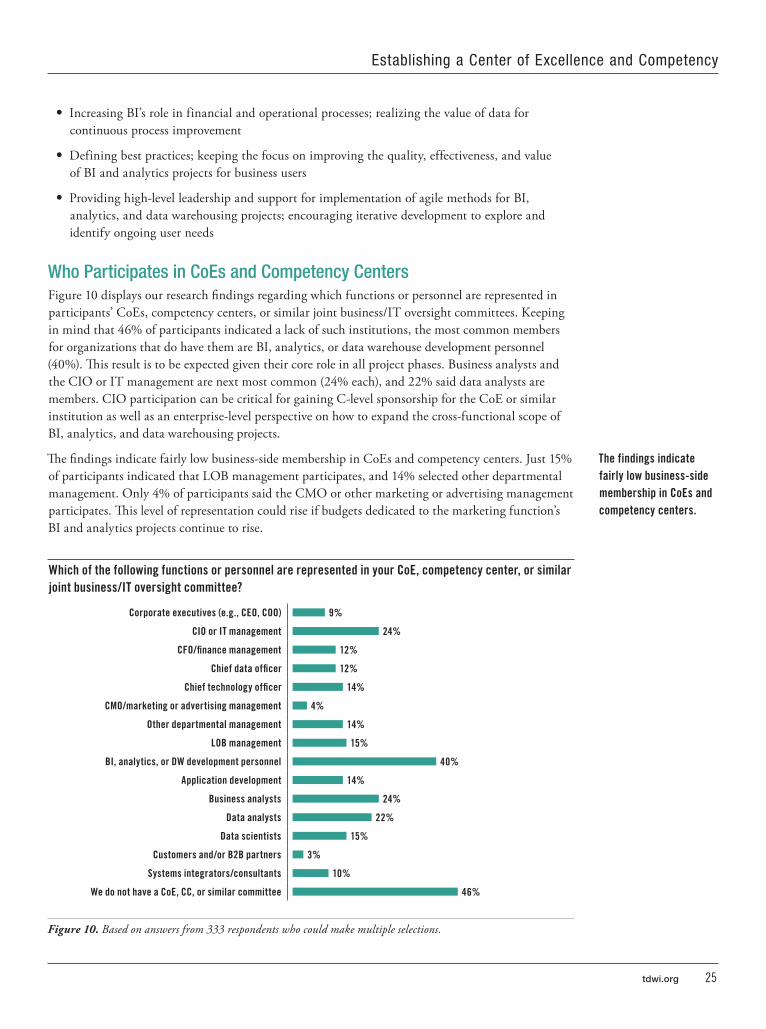
Who Participates in CoEs and Competency CentersFigure 10 displays our research findings regarding which functions or personnel are represented in participants’ CoEs, competency centers, or similar joint business/IT oversight committees. Keeping in mind that 46% of participants indicated a lack of such institutions, the most common members for organizations that do have them are BI, analytics, or data warehouse development personnel (40%). This result is to be expected given their core role in all project phases. Business analysts and the CIO or IT management are next most common (24% each), and 22% said data analysts are members. CIO participation can be critical for gaining C-level sponsorship for the CoE or similar institution as well as an enterprise-level perspective on how to expand the cross-functional scope of BI, analytics, and data warehousing projects.
The findings indicate fairly low business-side membership in CoEs and competency centers. Just 15% of participants indicated that LOB management participates, and 14% selected other departmental management. Only 4% of participants said the CMO or other marketing or advertising management participates. This level of representation could rise if budgets dedicated to the marketing function’s BI and analytics projects continue to rise.
Which of the following functions or personnel are represented in your CoE, competency center, or similar joint business/IT oversight committee?
Corporate executives (e g , CEO, COO) 9%
CIO or IT management 24%
CFO/finance management 12%
Chief data officer 12%
Chief technology officer 14%
CMO/marketing or advertising management 4%
Other departmental management 14%
LOB management 15%
BI, analytics, or DW development personnel 40%
Application development 14%
Business analysts 24%
Data analysts 22%
Data scientists 15%
Customers and/or B2B partners 3%
Systems integrators/consultants 10%
We do not have a CoE, CC, or similar committee 46%
Figure 10. Based on answers from 333 respondents who could make multiple selections.
The findings indicate fairly low business-side membership in CoEs and competency centers
establishing a Center of excellence and Competency
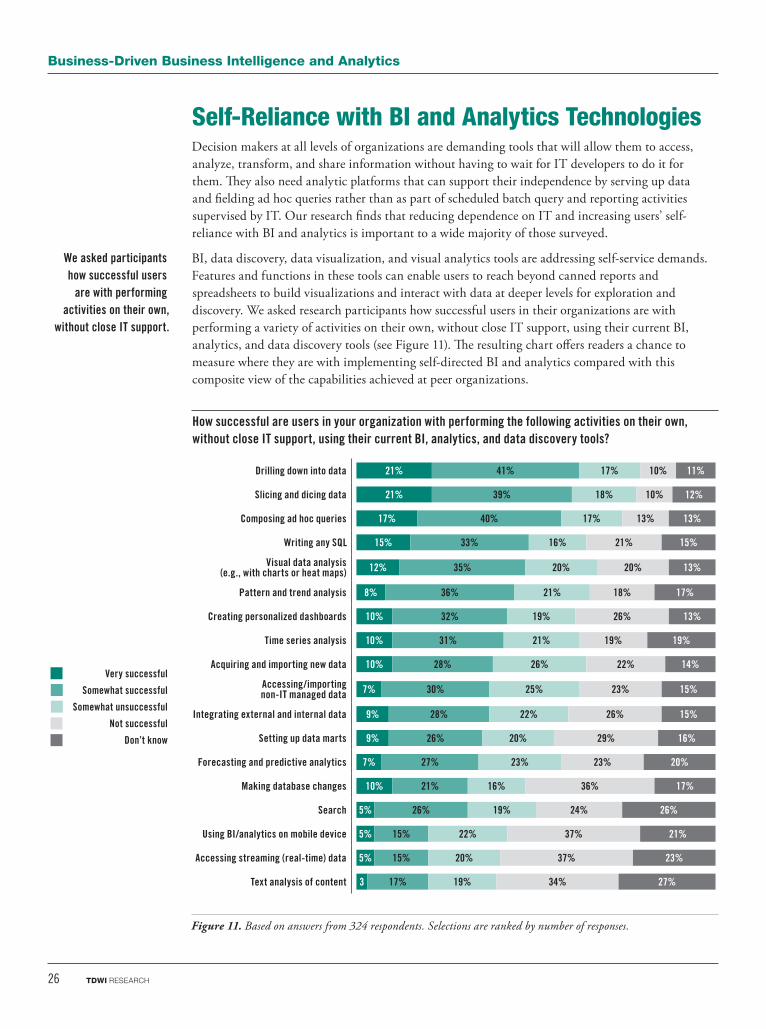
26 TDWI RESEARCh
Business-Driven Business Intelligence and Analytics
Self-Reliance with BI and Analytics TechnologiesDecision makers at all levels of organizations are demanding tools that will allow them to access, analyze, transform, and share information without having to wait for IT developers to do it for them. They also need analytic platforms that can support their independence by serving up data and fielding ad hoc queries rather than as part of scheduled batch query and reporting activities supervised by IT. Our research finds that reducing dependence on IT and increasing users’ self-reliance with BI and analytics is important to a wide majority of those surveyed.
BI, data discovery, data visualization, and visual analytics tools are addressing self-service demands. Features and functions in these tools can enable users to reach beyond canned reports and spreadsheets to build visualizations and interact with data at deeper levels for exploration and discovery. We asked research participants how successful users in their organizations are with performing a variety of activities on their own, without close IT support, using their current BI, analytics, and data discovery tools (see Figure 11). The resulting chart offers readers a chance to measure where they are with implementing self-directed BI and analytics compared with this composite view of the capabilities achieved at peer organizations.
how successful are users in your organization with performing the following activities on their own, without close IT support, using their current BI, analytics, and data discovery tools?
Drilling down into data 21% 41% 17% 10% 11%
Slicing and dicing data 21% 39% 18% 10% 12%
Composing ad hoc queries 17% 40% 17% 13% 13%
Writing any SQL 15% 33% 16% 21% 15%
Visual data analysis (e g , with charts or heat maps) 12% 35% 20% 20% 13%
Pattern and trend analysis 8% 36% 21% 18% 17%
Creating personalized dashboards 10% 32% 19% 26% 13%
Time series analysis 10% 31% 21% 19% 19%
Acquiring and importing new data 10% 28% 26% 22% 14%
Accessing/importing non-IT managed data 7% 30% 25% 23% 15%
Integrating external and internal data 9% 28% 22% 26% 15%
Setting up data marts 9% 26% 20% 29% 16%
Forecasting and predictive analytics 7% 27% 23% 23% 20%
Making database changes 10% 21% 16% 36% 17%
Search 5% 26% 19% 24% 26%
Using BI/analytics on mobile device 5% 15% 22% 37% 21%
Accessing streaming (real-time) data 5% 15% 20% 37% 23%
Text analysis of content 3 17% 19% 34% 27%
Figure 11. Based on answers from 324 respondents. Selections are ranked by number of responses.
We asked participants how successful users
are with performing activities on their own,
without close IT support
Very successful
Somewhat successful
Somewhat unsuccessful
Not successful
Don’t know
tdwi.org 27
Self-reliance with Bi and analytics technologies
OLAP and visual data analysis features are being implemented successfully Respondents indicated that users are having the most success with drilling down and slicing and dicing data: activities that are familiar to users experienced with online analytical processing (OLAP) but that are being brought forward into more visual, easy-to-use systems with the latest self-service data discovery tools. Users are also having positive experiences composing ad hoc queries, enabling them to address immediate and dynamic data needs; 40% of participants said their users are somewhat successful and 17% said very successful. Participants indicated that users are employing visual data analysis; 47% said users are either somewhat or very successful with these activities. At the same time, 45% of participants said users are not successful with creating personalized dashboards, an important capability for self-service BI.
Where users are finding less success is mostly with activities that are new to the portfolios of most self-service BI and analytics tools. For example, more than half (57%) of research participants said users are either somewhat unsuccessful or not successful with accessing streaming (real-time) data, which is not currently a common capability of most tools. Just over half (53%) of research participants report that their users are unsuccessful with text analysis of content and 43% are unsuccessful with search. This suggests that many users are not satisfied with their ability to work with semi- and unstructured data from within their BI and analytics tools or systems. Unless they are unable to satisfy such requirements with any technology, it is likely that users in these participants’ organizations are turning to specialized text analytics and enterprise search tools that are not currently integrated with their BI and analytics systems.
The following story describes how Thomson Reuters’ Financial & Risk division has created a platform to support visual analysis of real-time data streams for users in banking and financial services.
USER STORY ThOMSON REUTERS’ REAL-TIME DATA VISIBILITY kEEPS CLIENTS ON TOP OF RISk Visibility and transparency are perhaps the two biggest watchwords for banking and financial services firms today. Regulatory pressure has ratcheted up in recent years, with more laws in the pipeline. Organizations are obligated to retain far more data than ever before and be able to scan and analyze it to understand their vulnerability to unacceptable levels of volatility and loss. They also need to monitor real-time data streams for risk exposure and integrate these views with those of their stored data sources. All the while, of course, they must also analyze the data for business objectives, such as how they can drive down the cost of transactions to improve profitability and competitive standing.
The Financial & Risk division of the giant media and financial information provider Thomson Reuters Corp. plays a critical role in delivering data and tools for visibility and transparency to organizations in banking and financial services. Thomson Reuters provides a variety of data that affects trading risk: weather feeds, news feeds, and real-time feeds from equity, foreign exchange, global derivative, and other markets. The Thomson Reuters Enterprise Platform (TREP) can integrate data from across these historical and real-time sources; and with data visualization and analytics, it can enable users to analyze positions, the execution of trades, algorithm performance, and more. Thomson Reuters resells Datawatch data visualization and analytics technology in its platform.
Data visualization is essential because there’s only so much that humans can process in tables derived from sources such as real-time feeds. Heat maps, tree maps, time-series analysis graphs, and more allow professionals to quickly see the significance of trends and take action, sometimes before the next series of updates. Bringing integrated, real-time data and visualization together, Thomson Reuters is enabling its clients to increase transparency and realize both business-driven and regulatory-driven objectives.
Users are finding less success with activities that are new to the portfolios of most self-service BI and analytics tools
28 TDWI RESEARCh
Business-Driven Business Intelligence and Analytics
Technologies Most Important to Business-Driven BI and Analytics ProjectsFigure 12 displays another extensive chart, this time focusing on which technologies our research participants find most important to implementing business-driven BI and analytics. The largest percentages of participants said dashboards (60%) are important, with data visualization (51%) second, just ahead of BI/OLAP tools and analytic databases and platforms (each 50%). Data visualizations, which can range from bar charts to heat maps, tree maps, scatter plots, and more, are crucial to users’ understanding of data, especially as data volume, variety, and velocity increase. Well-crafted visualizations can depict data insights that would be deeply hidden in massive reporting tables.
Visualizations are often presented to users via BI dashboards; these user workspaces and portals make it easier for users to interact with data through the visualizations and are therefore a key type of technology for realizing value from data. Visualizations and dashboards are essential to data discovery, which 38% of participants deemed important. Data discovery tools employ visualizations to make data analysis, exploration, and presentation more intuitive for business users compared to employing standard tabular BI reports or writing out ad hoc queries in SQL—activities more suited to data professionals.
It is significant that half of research participants identified analytic databases and platforms as important. These technologies, which include columnar and massively parallel processing databases, are specifically designed for analytic workloads. Many older data warehouses had to be built on database systems that either also performed online transaction processing (OLTP) or were originally designed for OLTP and required significant database design and modeling by IT personnel to support BI and analytic workloads. The trend in analytic databases and platforms is to reduce design requirements and improve performance even further by deploying them in memory, especially to support the often compute-intensive demands of complex visual analytics.
Fewer research participants signaled that pre-configured data appliances, cloud options, and big data technologies were important. These are all newer, which could mean that organizations are either less familiar with them or have not yet tested them for production BI and analytics workloads. The percentages could rise as these options mature in meeting business-driven BI and analytics requirements.
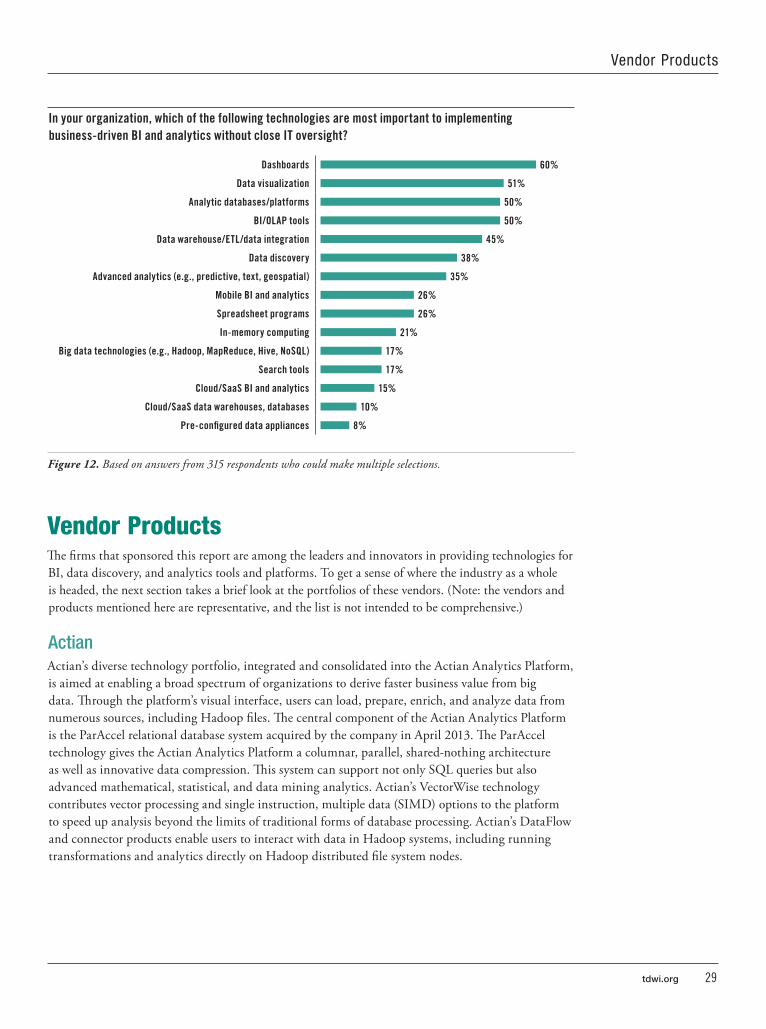
tdwi.org 29
In your organization, which of the following technologies are most important to implementing business-driven BI and analytics without close IT oversight?
Dashboards 60%
Data visualization 51%
Analytic databases/platforms 50%
BI/OLAP tools 50%
Data warehouse/ETL/data integration 45%
Data discovery 38%
Advanced analytics (e g , predictive, text, geospatial) 35%
Mobile BI and analytics 26%
Spreadsheet programs 26%
In-memory computing 21%
Big data technologies (e g , hadoop, MapReduce, hive, NoSQL) 17%
Search tools 17%
Cloud/SaaS BI and analytics 15%
Cloud/SaaS data warehouses, databases 10%
Pre-configured data appliances 8%
Figure 12. Based on answers from 315 respondents who could make multiple selections.
Vendor ProductsThe firms that sponsored this report are among the leaders and innovators in providing technologies for BI, data discovery, and analytics tools and platforms. To get a sense of where the industry as a whole is headed, the next section takes a brief look at the portfolios of these vendors. (Note: the vendors and products mentioned here are representative, and the list is not intended to be comprehensive.)
ActianActian’s diverse technology portfolio, integrated and consolidated into the Actian Analytics Platform, is aimed at enabling a broad spectrum of organizations to derive faster business value from big data. Through the platform’s visual interface, users can load, prepare, enrich, and analyze data from numerous sources, including Hadoop files. The central component of the Actian Analytics Platform is the ParAccel relational database system acquired by the company in April 2013. The ParAccel technology gives the Actian Analytics Platform a columnar, parallel, shared-nothing architecture as well as innovative data compression. This system can support not only SQL queries but also advanced mathematical, statistical, and data mining analytics. Actian’s VectorWise technology contributes vector processing and single instruction, multiple data (SIMD) options to the platform to speed up analysis beyond the limits of traditional forms of database processing. Actian’s DataFlow and connector products enable users to interact with data in Hadoop systems, including running transformations and analytics directly on Hadoop distributed file system nodes.
Vendor Products
30 TDWI RESEARCh
Business-Driven Business Intelligence and Analytics
DatawatchFounded in 1986 and a longtime leader in report mining and enterprise information management, Datawatch became a visual data discovery software provider when it acquired Panopticon Software in August 2013. The company’s Datawatch Desktop and Datawatch Server enable users to interactively explore data through a range of visualizations. A major distinction with Datawatch visual discovery is the product’s ability to consume real time data sources directly, including streaming data from complex event processing engines or message brokers monitoring securities trades and risk positions, news, social media, energy grids, healthcare data, and more. Users can run continuous queries and set up alerts to enable notification of anomalous or unexpected trends and events. Through dashboards, users can visually filter real-time feeds and use algorithms to identify anomalies and outliers from a variety of “data in motion” sources. The analysis of real-time data can be enriched by combining it with analysis of “at rest” historical data in a data warehouse.
LookerLooker is a new face in the BI and data discovery software market. Founded in 2011 and based in Santa Cruz, California, the company offers a lightweight, Web-based platform aimed at solving business questions with data exploration rather than standard reporting (it can be deployed in a complementary fashion with enterprise BI reporting). A core component of Looker is LookML, an
“agile language” for user-friendly development of models and for producing enhanced SQL queries that have greater expression, perform better, and can be easily reused in parts or in their entirety. Instead of requiring a separate, intermediate data store, Looker supports in-database processing, which enables transformations at query time and improves exploration agility. Looker provides a visual, browser-based application interface and customizable dashboards for desktop or mobile devices. Users can employ data interaction tools for contextual filtering, pivoting, and more. With these capabilities, Looker users can create data views on the fly and share results with colleagues over email, through bookmarks, and in applications such as spreadsheets, Google Docs, and more.
SASSAS, founded in 1976, is a longtime leader in business analytics and data management software and services. SAS offers a broad range of both technology products and solutions for specific requirements such as customer intelligence, fraud detection, risk management, and more. In 2012, SAS introduced SAS Visual Analytics. Available both on premises and in the cloud, SAS Visual Analytics integrates easy-to-use data visualization with the company’s in-memory SAS LASR Analytic Server. The Analytic Server can run advanced analytics operations against any volume of data, up to multiple terabytes, and support rapid generation of and interaction with data visualizations. Organizations can consolidate analytic processes owned by different business users. SAS views as crucial to reducing cost of ownership the option of moving the data just once and running analytic model development and processing logic where the data resides, whether in the in-memory data store or other database appliance. The Analytic Server can also run on Hadoop clusters, enabling organizations to reduce the cost of executing high-performance analytics.
Tableau SoftwareFounded in 2003, Tableau has grown with the trend toward greater democratization of data analysis and visualization. Business-side subject matter experts can use Tableau Desktop, Server, and Online (cloud) products to realize value from data without encountering the traditional complexity of BI
tdwi.org 31
recomendations
technology or needing extensive IT handholding. Tableau focuses on making it easier for both users and enterprise BI and data architects to reduce technical barriers to user productivity with data. The 8.x releases feature functionality for more easily creating and editing new chart types. Tableau’s data connection interface enables users to join, clean, and otherwise manipulate data on the same screen as they are viewing results. Users can build base dashboards and reuse and refine them for other analysis projects as well as copy and paste dashboards between workbooks. Tableau Server supports scalability and various shared service requirements, including metadata management, data integrity, security, and data governance, enabling organizations to support increased users, data volume, and data variety. Already able to store data in memory, Tableau products are now available in 64-bit versions to tap larger memory space and additional processing power.
Treasure DataThe Treasure Data Service is a fully-managed, cloud-based subscription service for big data management and analytics. With this “-as-a-service” cloud model, users can collect, store and analyze big data without adding new infrastructure or specialized Hadoop skills. The service supports most data types, including structured data from applications and multi-structured Web logs, and mobile and sensor data. To load data, there is a bulk loader tool or “Treasure Agent” acquisition technology to stream data from servers into the Treasure Data Service with compression and buffering for reliability. Data is stored in Plazma, the company’s homegrown database, a schema-on-read (though not schema-less) system that can handle dynamic data and changing schema. Users can employ popular BI or visualization tools or write SQL queries via a browser-based management console. Treasure Data staff manages the entire platform, and says it gets customers into production in about two weeks. Treasure Data launched its service in 2012, and now has more than 100 customers.
RecommendationsDefine technology benefits in business language Organizations want more of their strategic and operational decisions to be driven by data insights. Yet, in many organizations and especially in small and midsize firms, the majority of users are not implementing BI and analytics tools; they are limited to primitive spreadsheets and canned reports. To convince business executives to invest in the next level of data intelligence, project leaders need to express potential benefits in business terms.
Align objectives of business units with those of C-level executives and enterprise IT While business-driven BI and analytics technologies and practices can be empowering to business functions that have suffered from inadequate means of accessing and analyzing data, they could bump up against a variety of limitations without sponsorship from C-level executives, including the CEO, CFO, and CIO. TDWI finds that these entities still control the largest budgets and can call upon deeper resources in terms of skills and technology.
Clarify the IT role in business-driven BI and analytics As technologies and practices for business-driven BI and analytics take hold, the IT function is in a period of adjustment. IT remains vital for supporting centralized data platforms as well as systems and networking infrastructure, but the function’s roles in BI and analytics are in flux. Organizations need to bring business and IT leadership together to clarify IT’s role for data governance, data provisioning, assembling enterprise resources for projects, and extending each project’s value to other parts of the enterprise.
To convince executives to invest in the next level of data intelligence, project leaders need to express potential benefits in business terms
32 TDWI RESEARCh
Business-Driven Business Intelligence and Analytics
Establish a center of excellence or competency center for BI and analytics To improve business/IT collaboration, address data governance, and guide BI and analytics projects so they realize objectives, TDWI recommends that organizations establish an internal CoE or competency center. These institutions can help organizations manage project costs and ensure that resources are appropriately channeled to the most important projects. Our research finds that in most CoEs and competency centers, IT executives and business analysts participate, as do BI, analytics, and data warehousing professionals, but business-side leadership is less supportive. Organizations should strongly encourage business-side involvement.
Improve business-side leadership for self-service BI and analytics With both on-premises and cloud technology options becoming easier to deploy and use, solutions could proliferate throughout business functions without the benefit of an overall strategic vision and sharing of best practices. TDWI research finds weakness in current business-side leadership for articulating strategy to attract BI and analytics project sponsorship and identifying and quantifying ROI. Organizations should initiate a CoE or other institution to encourage communication and sharing of best practices among business functions.
Ensure a growth path for business users’ BI and analytics tools implementation Our research finds that users are successfully implementing standard BI and OLAP functions, but fewer are performing more advanced types of data exploration and interaction. As they gain experience with BI and data discovery tools, they will push ahead toward more advanced activities, including more complex visual analysis. Evaluate users’ skills, tools, and analytic database platforms to ensure they will support more advanced business-driven BI and analytics. Ensure good integration with new data sources they wish to access.
Provide guidance for business-driven advanced analytics TDWI research finds that business leadership is reasonably strong in identifying opportunities to achieve business benefits with advanced analytics and data discovery, but not as strong in other key project phases. With interest rising in LOBs, finance, and other business functions to develop and deploy predictive and other types of advanced analytics, organizations need to improve business-side skills and practices. Organizations should invest in resources that can offer expert guidance in all phases of projects and encourage sharing of best practices.
Determine the right level of oversight for emerging technologies to improve project success Our research finds that mobile BI and analytics applications and specialized analytic database platforms are the technologies growing fastest outside of IT’s direct management. Improve collaboration between business and IT leadership to set the right level of data governance and oversight to increase business ROI for these technologies and ensure that data security and other policy requirements are met.
Increase customer intelligence benefits of BI and analytics though CMO/CIO collaboration Many organizations today seek data insights that will help them improve customer loyalty and run more efficient and effective marketing campaigns. Yet without strong communication and collaboration between CMOs and marketing managers and CIOs and the IT function, which TDWI research finds is lacking, marketing’s customer intelligence could end up siloed and miss the advantages of integration with enterprise IT platform resources and funding. Ensure success by establishing strong executive-level communication and collaboration between marketing and IT.
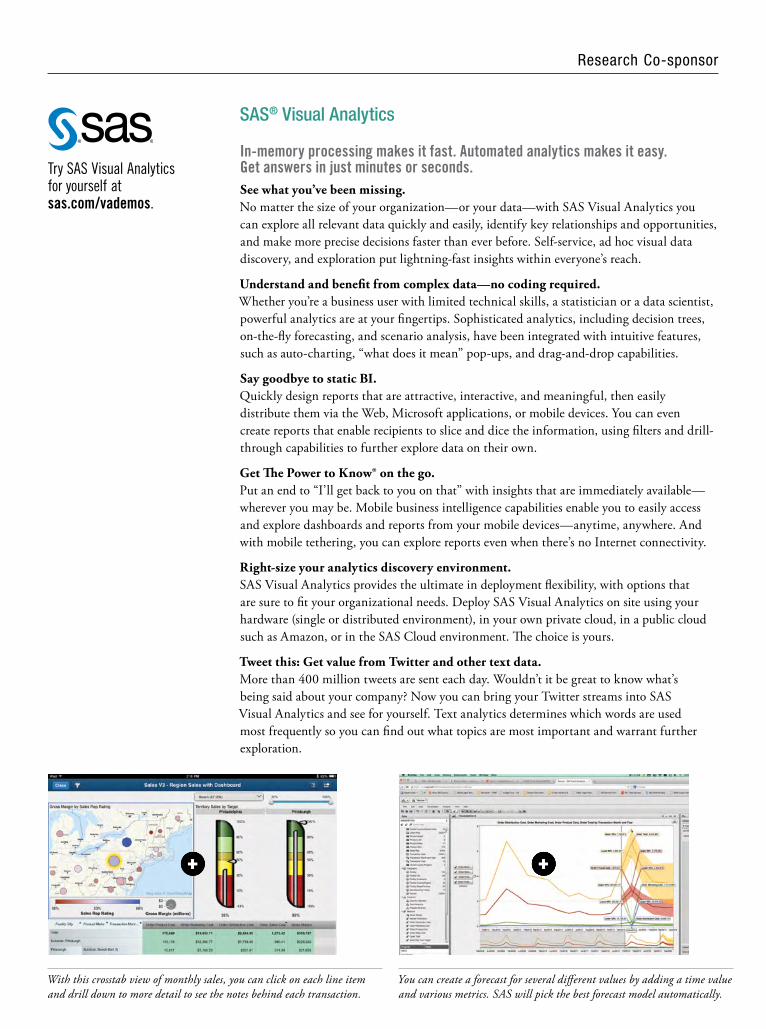
research Co-sponsor
SAS® Visual Analytics
In-memory processing makes it fast. Automated analytics makes it easy. Get answers in just minutes or seconds.See what you’ve been missing. No matter the size of your organization—or your data—with SAS Visual Analytics you can explore all relevant data quickly and easily, identify key relationships and opportunities, and make more precise decisions faster than ever before. Self-service, ad hoc visual data discovery, and exploration put lightning-fast insights within everyone’s reach.
Understand and benefit from complex data—no coding required. Whether you’re a business user with limited technical skills, a statistician or a data scientist, powerful analytics are at your fingertips. Sophisticated analytics, including decision trees, on-the-fly forecasting, and scenario analysis, have been integrated with intuitive features, such as auto-charting, “what does it mean” pop-ups, and drag-and-drop capabilities.
Say goodbye to static BI. Quickly design reports that are attractive, interactive, and meaningful, then easily distribute them via the Web, Microsoft applications, or mobile devices. You can even create reports that enable recipients to slice and dice the information, using filters and drill-through capabilities to further explore data on their own.
Get The Power to Know® on the go. Put an end to “I’ll get back to you on that” with insights that are immediately available—wherever you may be. Mobile business intelligence capabilities enable you to easily access and explore dashboards and reports from your mobile devices—anytime, anywhere. And with mobile tethering, you can explore reports even when there’s no Internet connectivity.
Right-size your analytics discovery environment. SAS Visual Analytics provides the ultimate in deployment flexibility, with options that are sure to fit your organizational needs. Deploy SAS Visual Analytics on site using your hardware (single or distributed environment), in your own private cloud, in a public cloud such as Amazon, or in the SAS Cloud environment. The choice is yours.
Tweet this: Get value from Twitter and other text data. More than 400 million tweets are sent each day. Wouldn’t it be great to know what’s being said about your company? Now you can bring your Twitter streams into SAS Visual Analytics and see for yourself. Text analytics determines which words are used most frequently so you can find out what topics are most important and warrant further exploration.
With this crosstab view of monthly sales, you can click on each line item and drill down to more detail to see the notes behind each transaction.
You can create a forecast for several different values by adding a time value and various metrics. SAS will pick the best forecast model automatically.
Try SAS Visual Analytics for yourself at sas.com/vademos.
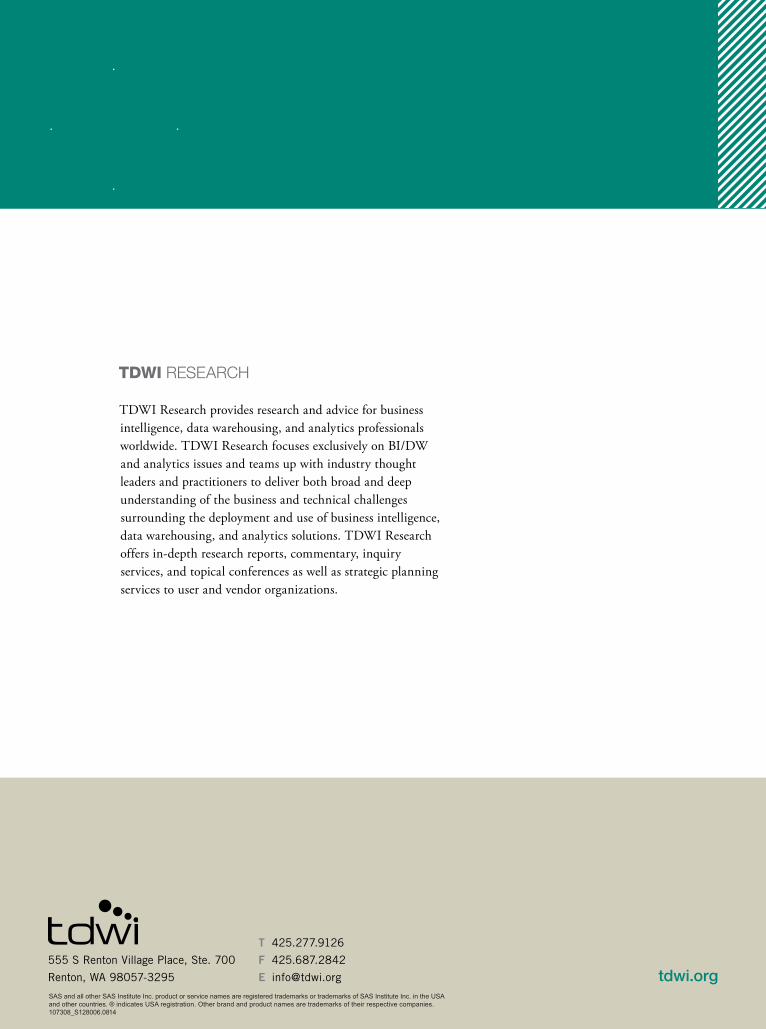
TDWI RESEARCh
TDWI Research provides research and advice for business intelligence, data warehousing, and analytics professionals worldwide. TDWI Research focuses exclusively on BI/DW and analytics issues and teams up with industry thought leaders and practitioners to deliver both broad and deep understanding of the business and technical challenges surrounding the deployment and use of business intelligence, data warehousing, and analytics solutions. TDWI Research offers in-depth research reports, commentary, inquiry services, and topical conferences as well as strategic planning services to user and vendor organizations.
555 S Renton Village Place, Ste. 700
Renton, WA 98057-3295
T 425.277.9126
F 425.687.2842
E [email protected] tdwi.orgSAS and all other SAS Institute Inc. product or service names are registered trademarks or trademarks of SAS Institute Inc. in the USA and other countries. ® indicates USA registration. Other brand and product names are trademarks of their respective companies. 107308_S128006.0814