Embed Size (px)
Citation preview
Consulting Firm
-0.45%
0.69%0.11%
-7.56% -8.00%
-7.00%
-6.00%
-5.00%
-4.00%
-3.00%
-2.00%
-1.00%
0.00%
1.00%
2.00%
1.66
1.68
1.70
1.72
1.74
1.76
1.78
1.80
1.82
1.84
2006 2007 2008 2009 2010
#3 PRICING POLICYGP MARK-UP CHANGE GROSS PROFIT MARK-UP INDEX
0.00%
5.00%
10.00%
15.00%
20.00%
25.00%
30.00%
35.00%
40.00%
45.00%
2007 2008 2009 2010
#1 REAL REVENUE GROWTHNOMINAL REVENUE GROWTH PRICE ADJUSTED REVENUE GROWTH
($250,000)
($200,000)
($150,000)
($100,000)
($50,000)
$0
$50,000
$100,000
$150,000
$200,000
2007 2008 2009 2010
#6 DEBT FREE CASH FLOW CFBF ACTUAL CFBF DEBT FREE ADJUSTED CFBF DEBT FREE
($100,000)
($50,000)
$0
$50,000
$100,000
$150,000
$200,000
$250,000
$300,000
$350,000
$400,000
$450,000
2007 2008 2009 2010
#7 USE of EXCESS CASHCASH GENERATION CASH BALANCE EXCESS NET CASH
($100,000)
$0
$100,000
$200,000
$300,000
$400,000
$500,000
$600,000
$700,000
$800,000
2006 2007 2008 2009 2010
#9 WORKING CAPITAL NEEDSCASH ARs INVENTORY ACCTS PAYABLE WC Need
4% 5% 6%3%
0.00%
5.00%
10.00%
15.00%
20.00%
25.00%
30.00%
35.00%
40.00%
45.00%
2007 2008 2009 2010
#2 SUSTAINABLE REVENUE GROWTHPRICE ADJ REV SUSTAINABLE REV NOMINAL REV
(300,000)
(200,000)
(100,000)
0
100,000
200,000
300,000
400,000
2007 2008 2009 2010
#5 EBITDA to ACTUAL CASH FLOWEBITDA CFBF ACTUAL
64
66
68
70
72
74
76
78
80
82
84
86
($40,000)
($30,000)
($20,000)
($10,000)
$0
$10,000
$20,000
$30,000
2007 2008 2009 2010
#11 NET TRADE CYCLEAR Cash INV CASH AP Cash Cash Conversion NTC Days
($1,000,000)
($900,000)
($800,000)
($700,000)
($600,000)
($500,000)
($400,000)
($300,000)
($200,000)
($100,000)
$0
0.00%
2.00%
4.00%
6.00%
8.00%
10.00%
12.00%
14.00%
16.00%
18.00%
20.00%
2007 2008 2009 2010
#12 ECONOMIC VALUE ADDED (EVA)ADJ COST of CAPITAL % ROA % ROI % EVA$
0.00%
5.00%
10.00%
15.00%
20.00%
25.00%
30.00%
35.00%
40.00%
45.00%
2007 2008 2009 2010
#8 RETURN on ASSETS (ROA)RETURN on ASSETS ADJUSTED ROA EFFICIENT ROA
0.00%
5.00%
10.00%
15.00%
20.00%
25.00%
30.00%
35.00%
40.00%
45.00%
50.00%
2006 2007 2008 2009 2010
$0
$100,000
$200,000
$300,000
$400,000
$500,000
$600,000
$700,000
#4 OPERATING EXPENSE CONTROLNOI$ GP$ NOI% GP% CORE OPER EXP%
$0
$500,000
$1,000,000
$1,500,000
$2,000,000
$2,500,000
$3,000,000
2006 2007 2008 2009 2010
#10 USE of DEBT FINANCINGTOTAL ASSETS EQUITY LONG TERM DEBT CURRENT LIAB
1
REAL REVENUE GROWTH #1
SUSTAINABLE REVENUE GROWTH #2
PRICING POLICY #3
OPERATING EXPENSE CONTROL #4
EBITDA to ACTUAL CASH FLOW #5
DEBT FREE CASH FLOW #6
USE of EXCESS CASH #7
RETURN on ASSETS (ROA) #8
WORKING CAPITAL NEEDS #9
USE of DEBT FINANCING #10
NET TRADE CYCLE #11
ECONOMIC VALUE ADDED (EVA) #12
$0
$0
$0
$0
$0
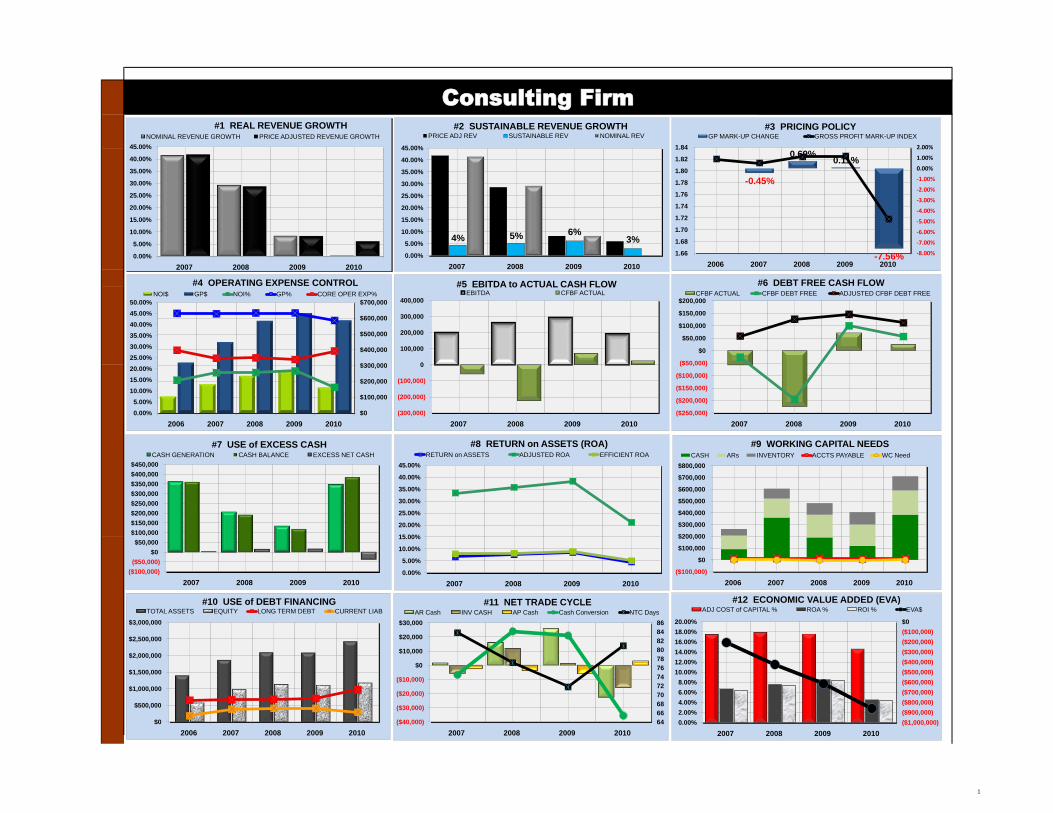
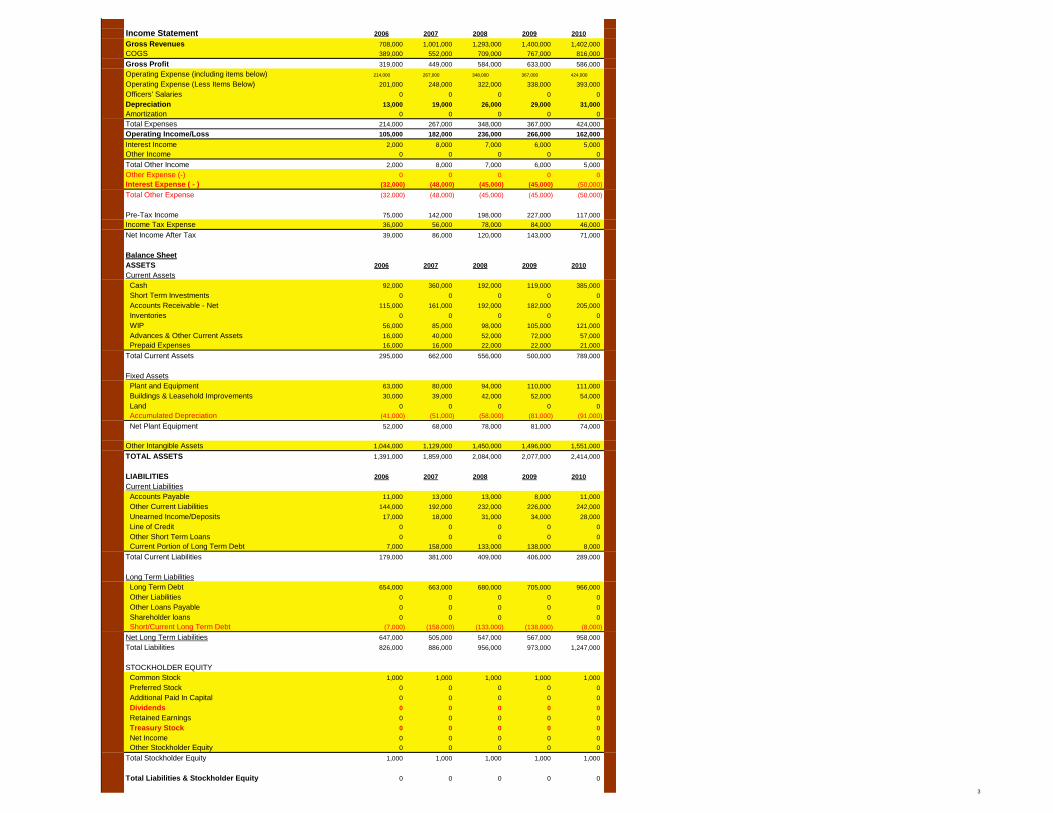
Real revenue growth reflects the actual real increase or decrease year by year in your business sales. Price increases or decreases
are measured by the year to year change in the gross profit mark-up index. Real revenue growth shows us the annual growth in
revenues adjusted for the effect of annual over-all increases or decreases in the gross profit mark-up or mark-down. This can be
due to increase or decrease in the end pricing to the buyers or due to decreases or increases in the costs of goods sold. Real
revenue growth is similar to an additional adjustment to prices for annual inflation or deflation.
$0
$0
$0
$0
$0
$0
$0
The annual change in retained earnings in relation to equity if you use debt financing or total assets (if no debt financing) tells one
how fast or slow the revenues can change in the following year. Have you ever heard the term growing broke? That term means
growing annual revenues so fast that they consume the resources of the balance sheet faster than they can be replenished. Where
do additional resources primarily come from – from retained earnings or the portion of annual net income you leave in or reinvest in
your business.
We use the gross profit mark-up index to develop pricing policy. This index measures revenue divided by cost of goods sold,
resulting in an index. The annual change in this index plus or minus shows the increase or decrease in over-all pricing. Real
revenue growth as defined above is derived by subtracting the over-all pricing index from the nominal annual revenue change. For
many companies it would be impossible to add up a bunch of widgets, compare to the prior year, and know how much more volume
was produced. This can be daunting for even the well-organized firm. So this is how one can ferret out price increases or decreases
over-all year by year.Operating expenses are expressed as a percentage of revenues. This percentage is typically compared to net income margin or net
income to revenues. Statistics are used to determine if the operating expenses are moving in or out of control and the magnitude of
any change. These statistics will tell one how sustainable operating expense improvements really are. Core operating expenses are
tracked in order to find different levels of economies of scale.
EBITDA means earnings before interest expense, taxes, annual depreciation expense and amortization. EBITDA is typically used by
banks to assess the ability of a firm to pay back debt financing. EBITDA ignores several issues critical to any business. It ignores
interest expenses, income taxes, annual changes in working capital, and annual capital expenditures to maintain the on-going viable
business operation. Without making working capital investments and capital expenditures, the business would begin to decline and
ultimately to fail. EBITDA is compared to annual cash flow before financing - IT SHOULD NOT BE USED for cash flow.
Cash flow before financing with after tax interest expense added back shows a company’s debt-free cash flow after tax. This is the
most meaningful cash flow for any business and should be followed consistently and frequently. This number is what is followed to
determine sustainable annual cash flow. This is the real driver of increasing business value without reservation. It is very difficult to
game this figure which is another valuable characteristic of this metric.
How a company manages its’ cash is a critical job that most companies do not really understand. Poor cash management can harm
the company’s performance in subtle but serious ways. It lowers the return on assets and it increases the cost of capital. Holding
excess cash dulls the company’s operating edge which increases overall risk and produces overly confident management. When
the cash balance exceeds the actual working capital cash balance need then that excess cash balance is unnecessary to the firm’s
financial operations. Increasing or decreasing excess cash balances is a leading indicator of future good or bad times for the
company. Assets means the firm’s total assets. The return on assets is calculated as net income after tax plus after- tax interest expense
added back in as net income. The result is divided by total assets to arrive at the Return on Assets (ROA). ROA can then be
compared to other returns on investments with similar risk profiles. For instance, if your business is only returning 4% ROA
compared to say the yield on a junk municipal bond at 6%, one would conclude that the business is probably underperforming for
the risk taken to have all the assets tied up in an illiquid business operation.
Working capital is the interaction of the current assets and current liabilities. Accounts receivable and inventory (if applicable) are
the main drivers of current assets and accounts payable and other payables are the main drivers of the current liabilities. The
current liabilities fund to some extent the current assets. Mismatching the working capital will cause consistent and costly problems
for the company. Knowing the potential need for capital in the working capital is an important metric for determining the future
financing of the business whether short, medium, or long term.
The total debt or total liabilities will be different in each industry and with each business depending on the company's risk tolerance.
Long term debt financing should be used for long term asset financing and short term debt for working capital. Total annual interest
expense percentage to revenues should not exceed the net operating income margin as a percentage to revenues. This is what is
termed negative leverage. Negative leverage should be avoided at all costs. The use of debt financing is a critical component to
management of a company’s cost of capital and cash flow, and proper use of debt lowers the over-all cost of capital.
The measurement of average days to annual revenues tied up in accounts receivable, inventory and accounts payable is used to
determine the net trade cycle or cash conversion cycle. It tells a company how fast cash goes through its sale or trade cycle before
coming back out as cash again. The shorter the days in the NTC or CCC the better in most cases. The days in accounts receivable
plus the days in inventory less the days in accounts payable will produce the NTC days. This is a critical metric in managing the
business operations.
Economic value added is a long term goal that every firm should follow without exception. This calculation determines the actual
cost of your capital (COC) both debt and equity combined as compared to the return on assets or ROA. The ROA needs to exceed
the COC in order to add premium value to the business over and above the book net equity. When the ROA falls under COC the
firm is destroying capital employed in the business. This would be the same as selling your products or services below the cost to
produce them. You can only do that for so long before bad things begin to happen to the business.
2
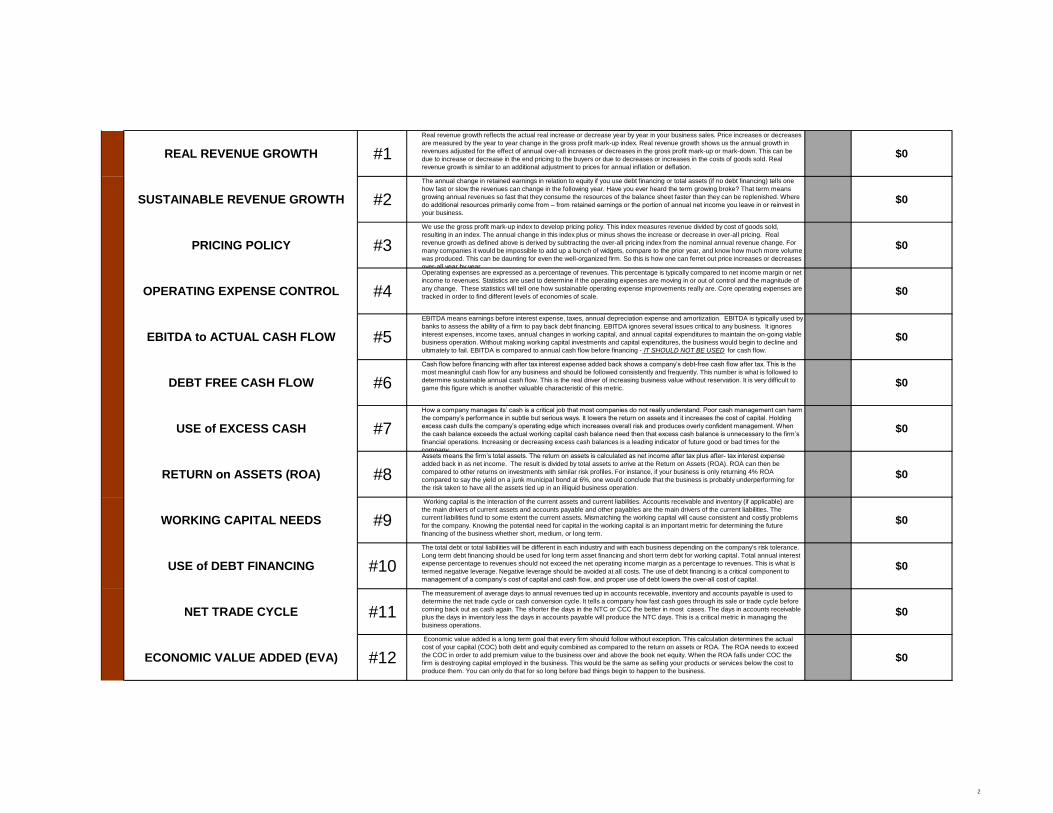
Income Statement 2006 2007 2008 2009 2010
Gross Revenues 708,000 1,001,000 1,293,000 1,400,000 1,402,000
COGS 389,000 552,000 709,000 767,000 816,000
Gross Profit 319,000 449,000 584,000 633,000 586,000
Operating Expense (including items below) 214,000 267,000 348,000 367,000 424,000
Operating Expense (Less Items Below) 201,000 248,000 322,000 338,000 393,000
Officers' Salaries 0 0 0 0 0
Depreciation 13,000 19,000 26,000 29,000 31,000
Amortization 0 0 0 0 0
Total Expenses 214,000 267,000 348,000 367,000 424,000
Operating Income/Loss 105,000 182,000 236,000 266,000 162,000
Interest Income 2,000 8,000 7,000 6,000 5,000
Other Income 0 0 0 0 0
Total Other Income 2,000 8,000 7,000 6,000 5,000
Other Expense (-) 0 0 0 0 0
Interest Expense ( - ) (32,000) (48,000) (45,000) (45,000) (50,000)
Total Other Expense (32,000) (48,000) (45,000) (45,000) (50,000)
Pre-Tax Income 75,000 142,000 198,000 227,000 117,000
Income Tax Expense 36,000 56,000 78,000 84,000 46,000
Net Income After Tax 39,000 86,000 120,000 143,000 71,000
Balance Sheet
ASSETS 2006 2007 2008 2009 2010
Current Assets
Cash 92,000 360,000 192,000 119,000 385,000
Short Term Investments 0 0 0 0 0
Accounts Receivable - Net 115,000 161,000 192,000 182,000 205,000
Inventories 0 0 0 0 0
WIP 56,000 85,000 98,000 105,000 121,000
Advances & Other Current Assets 16,000 40,000 52,000 72,000 57,000
Prepaid Expenses 16,000 16,000 22,000 22,000 21,000 Total Current Assets 295,000 662,000 556,000 500,000 789,000
Fixed Assets
Plant and Equipment 63,000 80,000 94,000 110,000 111,000
Buildings & Leasehold Improvements 30,000 39,000 42,000 52,000 54,000
Land 0 0 0 0 0
Accumulated Depreciation (41,000) (51,000) (58,000) (81,000) (91,000)
Net Plant Equipment 52,000 68,000 78,000 81,000 74,000
Other Intangible Assets 1,044,000 1,129,000 1,450,000 1,496,000 1,551,000
TOTAL ASSETS 1,391,000 1,859,000 2,084,000 2,077,000 2,414,000
LIABILITIES 2006 2007 2008 2009 2010
Current Liabilities
Accounts Payable 11,000 13,000 13,000 8,000 11,000
Other Current Liabilities 144,000 192,000 232,000 226,000 242,000
Unearned Income/Deposits 17,000 18,000 31,000 34,000 28,000
Line of Credit 0 0 0 0 0
Other Short Term Loans 0 0 0 0 0
Current Portion of Long Term Debt 7,000 158,000 133,000 138,000 8,000
Total Current Liabilities 179,000 381,000 409,000 406,000 289,000
Long Term Liabilities
Long Term Debt 654,000 663,000 680,000 705,000 966,000
Other Liabilities 0 0 0 0 0
Other Loans Payable 0 0 0 0 0
Shareholder loans 0 0 0 0 0
Short/Current Long Term Debt (7,000) (158,000) (133,000) (138,000) (8,000)
Net Long Term Liabilities 647,000 505,000 547,000 567,000 958,000
Total Liabilities 826,000 886,000 956,000 973,000 1,247,000
STOCKHOLDER EQUITY
Common Stock 1,000 1,000 1,000 1,000 1,000
Preferred Stock 0 0 0 0 0
Additional Paid In Capital 0 0 0 0 0
Dividends 0 0 0 0 0
Retained Earnings 0 0 0 0 0
Treasury Stock 0 0 0 0 0
Net Income 0 0 0 0 0
Other Stockholder Equity 0 0 0 0 0
Total Stockholder Equity 1,000 1,000 1,000 1,000 1,000
Total Liabilities & Stockholder Equity 0 0 0 0 0
3
1 1 2 3 4 5 6 7 8 9 10 11 12
2 INCOME STATEMENT
3 REVENUES
4 (all numbers in 1,000s)
5 Annualizing Factor
6
7 GROSS REVENUES: $708,000 $1,001,000 $1,293,000 $1,400,000 $1,402,000 $1,160,800 100.00% 100.00% 18.63% 301,428 25.97% 100.00%
8 Other Revenues 0 0 0 0 0 0 0.00% 0.00% 0
9 Other Revenues 0 0 0 0 0 0 0.00% 0.00% 0
10 Returns, Refunds, and Discounts 0 0 0 0 0 0 0.00% 0.00% 0
11 Write-downs 0 0 0 0 0 0 0.00% 0.00% 0
12 TOTAL NET REVENUES $708,000 $1,001,000 $1,293,000 $1,400,000 $1,402,000 $1,160,800 100.00% 100.00% 18.63% 301,428 25.97% 100.00%
13 Annual Percentage Increase or Decrease in Net Revenues 41.38% 29.17% 8.28% 0.14% EQUITY BASED 4.71% ASSET BASED 3.14%
14 ANNUAL PRICING CHANGES -0.37% 0.57% 0.09% -5.87% -1.40%
15 NET ANNUAL PRICE ADJUSTED REVENUE GROWTH 41.75% 28.60% 8.19% 6.01% 14.76%
16 PRICE ELASTICITY (sensitivity to price changes) 114.34 50.41 93.44 1.02 49.96
17 293,000 292,000 107,000 2,000
18 COSTS OF REVENUES (net of depreciation) same as COGS 389,000 552,000 709,000 767,000 816,000 646,600 58.20% 55.70% 20.35% 174,924 27.05% 99.41%
19 Costs of Revenues Margin 54.94% 55.14% 54.83% 54.79% 58.20% 55.58%
20 Annual Percentage Increase or Decrease Costs of Revenues 41.90% 28.44% 8.18% 6.39% 21.23%
21 163,000 157,000 58,000 49,000
22 GROSS PROFIT $319,000 $449,000 $584,000 $633,000 $586,000 $514,200 41.80% 44.30% 16.42% 128,933 25.07% 98.91%
23 Gross Profit Margin 45.06% 44.86% 45.17% 45.21% 41.80% 44.42% 24 Annual Percentage Increase or Decrease in Gross Profit Dollars 40.75% 30.07% 8.39% -7.42% 17.95%
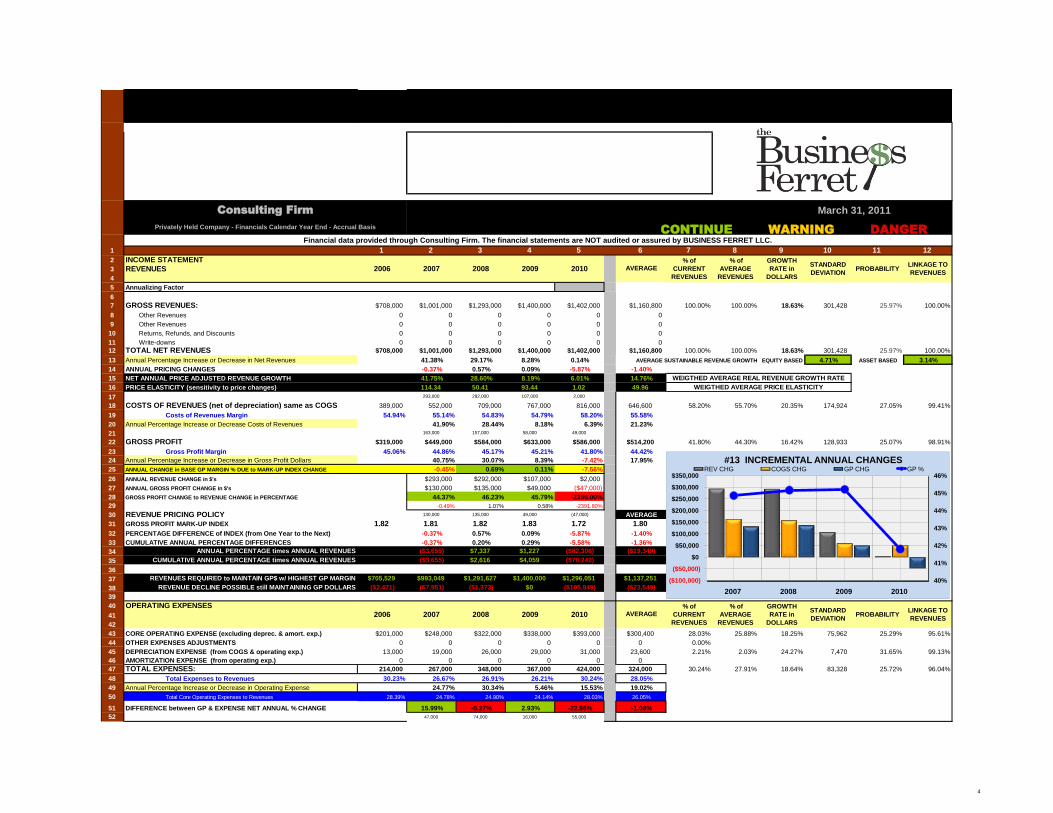
25 ANNUAL CHANGE in BASE GP MARGIN % DUE to MARK-UP INDEX CHANGE -0.45% 0.69% 0.11% -7.56%
26 ANNUAL REVENUE CHANGE in $'s $293,000 $292,000 $107,000 $2,000
27 ANNUAL GROSS PROFIT CHANGE in $'s $130,000 $135,000 $49,000 ($47,000)
28 GROSS PROFIT CHANGE to REVENUE CHANGE in PERCENTAGE 44.37% 46.23% 45.79% -2350.00%
29 -0.49% 1.07% 0.58% -2391.80%
30 REVENUE PRICING POLICY 130,000 135,000 49,000 (47,000) AVERAGE
31 GROSS PROFIT MARK-UP INDEX 1.82 1.81 1.82 1.83 1.72 1.80
32 PERCENTAGE DIFFERENCE of INDEX (from One Year to the Next) -0.37% 0.57% 0.09% -5.87% -1.40%
33 CUMULATIVE ANNUAL PERCENTAGE DIFFERENCES -0.37% 0.20% 0.29% -5.58% -1.36%
34 ANNUAL PERCENTAGE times ANNUAL REVENUES ($3,655) $7,337 $1,227 ($82,306) ($19,349)
35 CUMULATIVE ANNUAL PERCENTAGE times ANNUAL REVENUES ($3,655) $2,616 $4,059 ($78,242)
36
37 REVENUES REQUIRED to MAINTAIN GP$ w/ HIGHEST GP MARGIN $705,529 $993,049 $1,291,627 $1,400,000 $1,296,051 $1,137,251
38 REVENUE DECLINE POSSIBLE still MAINTAINING GP DOLLARS ($2,471) ($7,951) ($1,373) $0 ($105,949) ($23,549)
39
40 OPERATING EXPENSES
41 (all numbers in 1,000s)
42
43 CORE OPERATING EXPENSE (excluding deprec. & amort. exp.) $201,000 $248,000 $322,000 $338,000 $393,000 $300,400 28.03% 25.88% 18.25% 75,962 25.29% 95.61%
44 OTHER EXPENSES ADJUSTMENTS 0 0 0 0 0 0 0.00%
45 DEPRECIATION EXPENSE (from COGS & operating exp.) 13,000 19,000 26,000 29,000 31,000 23,600 2.21% 2.03% 24.27% 7,470 31.65% 99.13%
46 AMORTIZATION EXPENSE (from operating exp.) 0 0 0 0 0 0
47 TOTAL EXPENSES: 214,000 267,000 348,000 367,000 424,000 324,000 30.24% 27.91% 18.64% 83,328 25.72% 96.04%
48 Total Expenses to Revenues 30.23% 26.67% 26.91% 26.21% 30.24% 28.05%
49 Annual Percentage Increase or Decrease in Operating Expense 24.77% 30.34% 5.46% 15.53% 19.02%
50 Total Core Operating Expenses to Revenues 28.39% 24.78% 24.90% 24.14% 28.03% 26.05%
51 DIFFERENCE between GP & EXPENSE NET ANNUAL % CHANGE 15.99% -0.27% 2.93% -22.96% -1.08%
52 47,000 74,000 16,000 55,000
LINKAGE TO
REVENUES2010
GROWTH
RATE in
DOLLARS
Consulting Firm March 31, 2011
% of
CURRENT
REVENUES
CONTINUE WARNING DANGER
LINKAGE TO
REVENUESAVERAGE
STANDARD
DEVIATION
2010
2009
2009 2008
2007
WEIGTHED AVERAGE PRICE ELASTICITY
2008
PROBABILITY
Financial data provided through Consulting Firm. The financial statements are NOT audited or assured by BUSINESS FERRET LLC.
Privately Held Company - Financials Calendar Year End - Accrual Basis
% of
AVERAGE
REVENUES
AVERAGE
GROWTH
RATE in
DOLLARS
PROBABILITY2006
STANDARD
DEVIATION
WEIGTHED AVERAGE REAL REVENUE GROWTH RATE
2006 2007 % of
CURRENT
REVENUES
% of
AVERAGE
REVENUES
AVERAGE SUSTAINABLE REVENUE GROWTH
40%
41%
42%
43%
44%
45%
46%
($100,000)
($50,000)
$0
$50,000
$100,000
$150,000
$200,000
$250,000
$300,000
$350,000
2007 2008 2009 2010
#13 INCREMENTAL ANNUAL CHANGESREV CHG COGS CHG GP CHG GP %
4
1 1 2 3 4 5 6 7 8 9 10 11 12
LINKAGE TO
REVENUESAVERAGE2010 2009 2008 PROBABILITY
Financial data provided through Consulting Firm. The financial statements are NOT audited or assured by BUSINESS FERRET LLC.
GROWTH
RATE in
DOLLARS
STANDARD
DEVIATION2006 2007
% of
CURRENT
REVENUES
% of
AVERAGE
REVENUES
53 NET OPERATING INCOME or (LOSSES)
54 (all numbers in 1,000s)
55
56 NET OPERATING INCOME or (LOSS) or NOI $105,000 $182,000 $236,000 $266,000 $162,000 $190,200 11.55% 16.39% 11.45% 63,176 33.22% 75.19%
57 Net Operating Income to Revenues 14.83% 18.18% 18.25% 19.00% 11.55% 16.36%
58 Annual Percentage Increase or Decrease in NOI 73.33% 29.67% 12.71% -39.10% 19.15% 41.80% $244,052
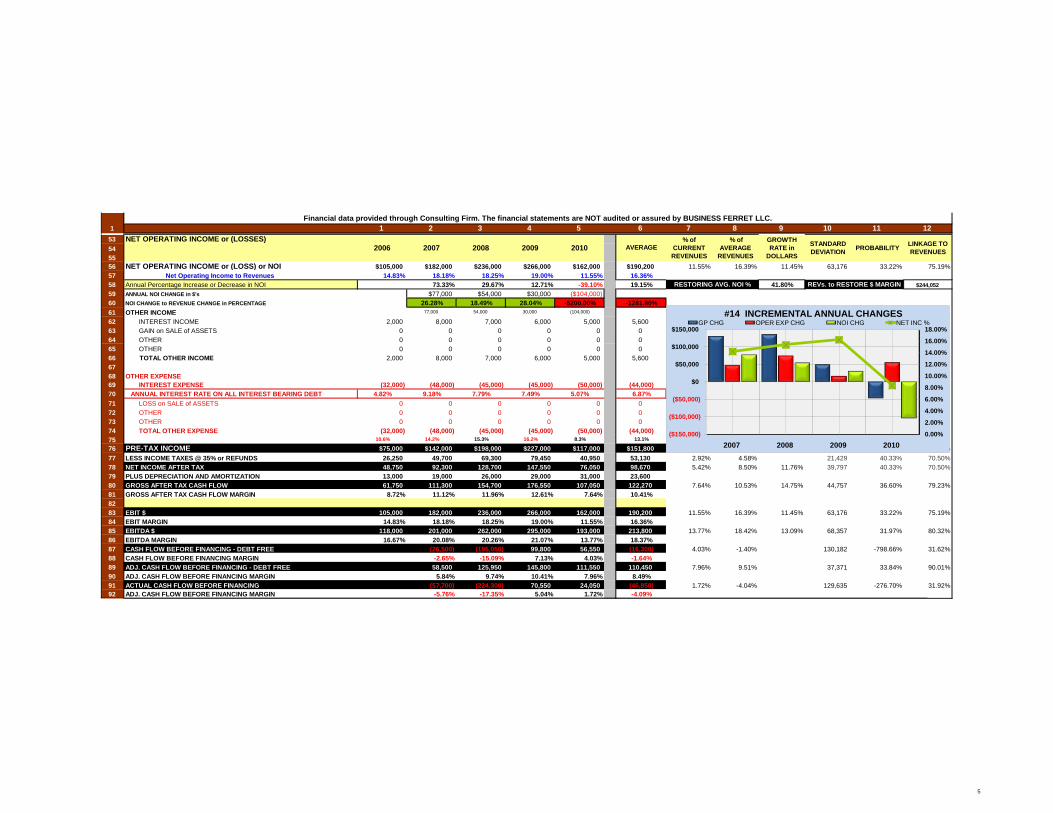
59 ANNUAL NOI CHANGE in $'s $77,000 $54,000 $30,000 ($104,000)
60 NOI CHANGE to REVENUE CHANGE in PERCENTAGE 26.28% 18.49% 28.04% -5200.00% -1281.80%
61 OTHER INCOME 77,000 54,000 30,000 (104,000)
62 INTEREST INCOME 2,000 8,000 7,000 6,000 5,000 5,600
63 GAIN on SALE of ASSETS 0 0 0 0 0 0
64 OTHER 0 0 0 0 0 0
65 OTHER 0 0 0 0 0 0
66 TOTAL OTHER INCOME 2,000 8,000 7,000 6,000 5,000 5,600
67
68 OTHER EXPENSE
69 INTEREST EXPENSE (32,000) (48,000) (45,000) (45,000) (50,000) (44,000)
70 ANNUAL INTEREST RATE ON ALL INTEREST BEARING DEBT 4.82% 9.18% 7.79% 7.49% 5.07% 6.87%
71 LOSS on SALE of ASSETS 0 0 0 0 0 0
72 OTHER 0 0 0 0 0 0
73 OTHER 0 0 0 0 0 0
74 TOTAL OTHER EXPENSE (32,000) (48,000) (45,000) (45,000) (50,000) (44,000)
75 10.6% 14.2% 15.3% 16.2% 8.3% 13.1% -5.79%
76 PRE-TAX INCOME $75,000 $142,000 $198,000 $227,000 $117,000 $151,800 8.35% 13.08% 11.76% 61,227 40.33% 70.50%
77 LESS INCOME TAXES @ 35% or REFUNDS 26,250 49,700 69,300 79,450 40,950 53,130 2.92% 4.58% 21,429 40.33% 70.50%
78 NET INCOME AFTER TAX 48,750 92,300 128,700 147,550 76,050 98,670 5.42% 8.50% 11.76% 39,797 40.33% 70.50%
79 PLUS DEPRECIATION AND AMORTIZATION 13,000 19,000 26,000 29,000 31,000 23,600
80 GROSS AFTER TAX CASH FLOW 61,750 111,300 154,700 176,550 107,050 122,270 7.64% 10.53% 14.75% 44,757 36.60% 79.23%
81 GROSS AFTER TAX CASH FLOW MARGIN 8.72% 11.12% 11.96% 12.61% 7.64% 10.41%
82
83 EBIT $ 105,000 182,000 236,000 266,000 162,000 190,200 11.55% 16.39% 11.45% 63,176 33.22% 75.19%
84 EBIT MARGIN 14.83% 18.18% 18.25% 19.00% 11.55% 16.36%
85 EBITDA $ 118,000 201,000 262,000 295,000 193,000 213,800 13.77% 18.42% 13.09% 68,357 31.97% 80.32%
86 EBITDA MARGIN 16.67% 20.08% 20.26% 21.07% 13.77% 18.37%
87 CASH FLOW BEFORE FINANCING - DEBT FREE (26,500) (195,050) 99,800 56,550 (16,300) 4.03% -1.40% 130,182 -798.66% 31.62%
88 CASH FLOW BEFORE FINANCING MARGIN -2.65% -15.09% 7.13% 4.03% -1.64%
89 ADJ. CASH FLOW BEFORE FINANCING - DEBT FREE 58,500 125,950 145,800 111,550 110,450 7.96% 9.51% 37,371 33.84% 90.01%
90 ADJ. CASH FLOW BEFORE FINANCING MARGIN 5.84% 9.74% 10.41% 7.96% 8.49%
91 ACTUAL CASH FLOW BEFORE FINANCING (57,700) (224,300) 70,550 24,050 (46,850) 1.72% -4.04% 129,635 -276.70% 31.92%
92 ADJ. CASH FLOW BEFORE FINANCING MARGIN -5.76% -17.35% 5.04% 1.72% -4.09%
STANDARD
DEVIATION
% of
AVERAGE
REVENUES
LINKAGE TO
REVENUESPROBABILITY2007 2010 2009
GROWTH
RATE in
DOLLARS
RESTORING AVG. NOI %
AVERAGE2006 2008
REVs. to RESTORE $ MARGIN
% of
CURRENT
REVENUES
0.00%
2.00%
4.00%
6.00%
8.00%
10.00%
12.00%
14.00%
16.00%
18.00%
($150,000)
($100,000)
($50,000)
$0
$50,000
$100,000
$150,000
2007 2008 2009 2010
#14 INCREMENTAL ANNUAL CHANGESGP CHG OPER EXP CHG NOI CHG NET INC %
5
1 1 2 3 4 5 6 7 8 9 10 11 12
LINKAGE TO
REVENUESAVERAGE2010 2009 2008 PROBABILITY
Financial data provided through Consulting Firm. The financial statements are NOT audited or assured by BUSINESS FERRET LLC.
GROWTH
RATE in
DOLLARS
STANDARD
DEVIATION2006 2007
% of
CURRENT
REVENUES
% of
AVERAGE
REVENUES
93 BALANCE SHEET
94 ASSETS
95 (all numbers in 1,000s)
96
97 CURRENT ASSETS
98 Cash Balance Excess or (Shortfall) 102,250 361,600 206,400 134,100 347,100 230,290 14.38% 11.72% 119,483 51.88% 27.07%
99 CASH 92,000 360,000 192,000 119,000 385,000 229,600 15.95% 11.68% 43.03% 135,769 59.13% 29.03%
100 ACCOUNTS RECEIVABLE (net of Bad Debt Allowance) 115,000 161,000 192,000 182,000 205,000 171,000 8.49% 8.70% 15.55% 35,192 20.58% 95.60%
101 INVENTORIES plus WORK in PROCESS 56,000 85,000 98,000 105,000 121,000 93,000 5.01% 4.73% 21.24% 24,423 26.26% 96.16%
102 ADVANCES & OTHER CURRENT ASSETS 16,000 40,000 52,000 72,000 57,000 55,250 2.36% 2.81% 37.38% 20,971 37.96% 95.74%
103 PREPAID EXPENSES 16,000 16,000 22,000 22,000 21,000 19,400 0.87% 0.99% 3,130 16.14% 90.99%
104
105 TOTAL CURRENT ASSETS $295,000 $662,000 $556,000 $500,000 $789,000 $560,400 32.68% 28.52% 27.88% 184,855 32.99% 64.63%
106
107 FIXED ASSETS
108 LAND 0 0 0 0 0 0.00%
109 BUILDINGS/LEASE IMPROVEMENTS 30,000 39,000 42,000 52,000 54,000 2.24% 0.00% 15.83% 9,839 94.41%
110 PLANT& EQUIPMENT 63,000 80,000 94,000 110,000 111,000 91,600 4.60% 4.66% 15.21% 20,452 22.33% 98.14%
111 OFFICE EQUIPMENT 0 0 0 0 0 0
112 TRANSPORTATION EQUIPMENT 0 0 0 0 0 0
113 (LESS: ACCUMULATED DEPRECIATION EXPENSE) (41,000) (51,000) (58,000) (81,000) (91,000) (64,400) -3.77% -3.28% 20,924 -32.49% -88.30%
114 0
115 TOTAL NET FIXED ASSETS $52,000 $68,000 $78,000 $81,000 $74,000 $70,600 3.07% 3.59% 9.22% 11,480 16.26% 94.81%
116
117 OTHER ASSETS
118 GOODWILL 1,044,000 1,129,000 1,450,000 1,496,000 1,551,000 1,334,000 64.25% 67.89% 10.40% 230,713 17.29% 97.24%
119 OTHER INTANGIBLE ASSETS 0 0 0 0 0 0 0.00%
120 TOTAL OTHER ASSETS 1,044,000 1,129,000 1,450,000 1,496,000 1,551,000 1,334,000 64.25% 67.89% 10.40% 230,713 17.29% 97.24%
121
122 TOTAL ASSETS $1,391,000 $1,859,000 $2,084,000 $2,077,000 $2,414,000 $1,965,000 100.00% 100.00% 14.78% 377,166 19.19% 94.04%
123 CASH ADJUSTMENT FACTOR $92,000 $360,000 $192,000 $119,000 $347,100 $222,020
2007 2010 2008 GROWTH
RATE in
DOLLARS
% of AVERAGE
TOTAL ASSETSAVERAGE
% of CURRENT
TOTAL ASSETS2009 2006
STANDARD
DEVIATIONPROBABILITY
LINKAGE TO
REVENUES
6
1 1 2 3 4 5 6 7 8 9 10 11 12
LINKAGE TO
REVENUESAVERAGE2010 2009 2008 PROBABILITY
Financial data provided through Consulting Firm. The financial statements are NOT audited or assured by BUSINESS FERRET LLC.
GROWTH
RATE in
DOLLARS
STANDARD
DEVIATION2006 2007
% of
CURRENT
REVENUES
% of
AVERAGE
REVENUES
124 LIABILITIES: 2006 2007 2008 2009 2010
125 CURRENT LIABILITIES
126 ACCOUNTS PAYABLE $11,000 $13,000 $13,000 $8,000 $11,000 $11,200 0.46% 0.57% 0.00% 2,049 18.30% -31.28%
127 OTHER PAYABLES 144,000 192,000 232,000 226,000 242,000 207,200 10.02% 10.54% 13.86% 40,015 19.31% 97.86%
128 UNEARNED INCOME 17,000 18,000 31,000 34,000 28,000 25,600 1.16% 1.30% 13.29% 7,701 30.08% 90.59%
129 LINE OF CREDIT 0 0 0 0 0 0 0.00%
130 CURRENT PORTION OF LONG TERM DEBT & LEASES 7,000 158,000 133,000 138,000 8,000 88,800 0.33% 4.52% 3.39% 74,804 84.24% 26.72%
131 LINE of CREDIT LIMIT $ $ $ $
132 TOTAL CURRENT LIABILITIES: $179,000 $381,000 $409,000 $406,000 $289,000 $332,800 11.97% 16.94% 12.72% 98,819 29.69% 66.27%
133
134 20.71% 11.58%
135 4.76% -0.10%
136 LONG TERM LIABILITIES
137 LONG TERM DEBT $654,000 $663,000 $680,000 $705,000 $966,000 $733,600 40.02% 37.33% 10.24% 131,359 17.91% 56.48%
138 CAPITAL LEASE 0 0 0 0 0 0
139 MORTGAGE LOANS 0 0 0 0 0 0
140 OTHER LOANS PAYABLE 0 0 0 0 0 0 0.00%
141 SHAREHOLDERS' LOANS 0 0 0 0 0 0
142 LESS CURRENT PORTION OF LONG TERM DEBT (7,000) (158,000) (133,000) (138,000) (8,000) (88,800)
143
144 TOTAL LONG TERM DEBT $647,000 $505,000 $547,000 $567,000 $958,000 $644,800 39.69% 32.81% 10.31% 182,525 28.31% 29.69%
145
146 OTHER LONG TERM LIABILITIES
147 DEFERRED TAX LIABILITY 0 0 0 0 0 0
148
149 TOTAL LIABILITIES: $826,000 $886,000 $956,000 $973,000 $1,247,000 $977,600 51.66% 49.75% 10.85% 161,584 16.53% 74.07%
150
151 STOCKHOLDERS' EQUITY
152 COMMON STOCK - CUMULATIVE $1,000 $1,000 $1,000 $1,000 $1,000 $1,000
153 OTHER PAID-IN CAPITAL or DISTRIBUTIONS -Cumulative 0 365,400 461,000 368,900 396,800 318,420
154 RETAINED EARNINGS-BEGINNING 541,500 564,000 606,600 666,000 734,100 622,440 30.41% 31.68% 7.90% 78,395 12.59% 85.96%
155 NET INCOME 48,750 92,300 128,700 147,550 76,050 98,670 3.15% 5.02% 11.76% 39,797 40.33% 70.50%
156 Tax Effect Distributions (26,250) (49,700) (69,300) (79,450) (40,950) (53,130)
157 Dividend Distributions 0 0 0 0 0 0
158 Other Distributions 0 0 0 0 0 0
159 RETAINED EARNINGS-ENDING 564,000 606,600 666,000 734,100 769,200 667,980 31.86% 33.99% 8.07% 85,441 12.79% 94.02%
160 LESS TREASURY STOCK 0 0 0 0 0 0
161 EQUITY $565,000 $973,000 $1,128,000 $1,104,000 $1,167,000 $987,400 48.34% 50.25% 19.88% 247,108 25.03% 95.11%
162 Annual Equity Percentage Changes 72.21% 15.93% -2.13% 5.71% 22.93%
163 Share Price $11.67
164 Shares Outstanding 100,000
165 Market Capitalization of Equity $1,167,000
166 MV Equity to Book Equity 100.00%
167 After-Tax Current Yield on MV Equity (plus dividends) 6.52%
168 After-Tax Dividend Yield Based on MV Equity 0.00%
169 TOTAL LIABILITIES & NET WORTH $1,391,000 $1,859,000 $2,084,000 $2,077,000 $2,414,000 $1,965,000 100.00% 100.00% 14.78% 377,166 19.19% 94.04%
170 Check 0 0 0 0 0
Book Equity Pricing
WORKING CAPITAL GAP with CASH BALANCE
WORKING CAPITAL GAP without CASH BALANCE
7
1 1 2 3 4 5 6 7 8 9 10 11 12
LINKAGE TO
REVENUESAVERAGE2010 2009 2008 PROBABILITY
Financial data provided through Consulting Firm. The financial statements are NOT audited or assured by BUSINESS FERRET LLC.
GROWTH
RATE in
DOLLARS
STANDARD
DEVIATION2006 2007
% of
CURRENT
REVENUES
% of
AVERAGE
REVENUES
171
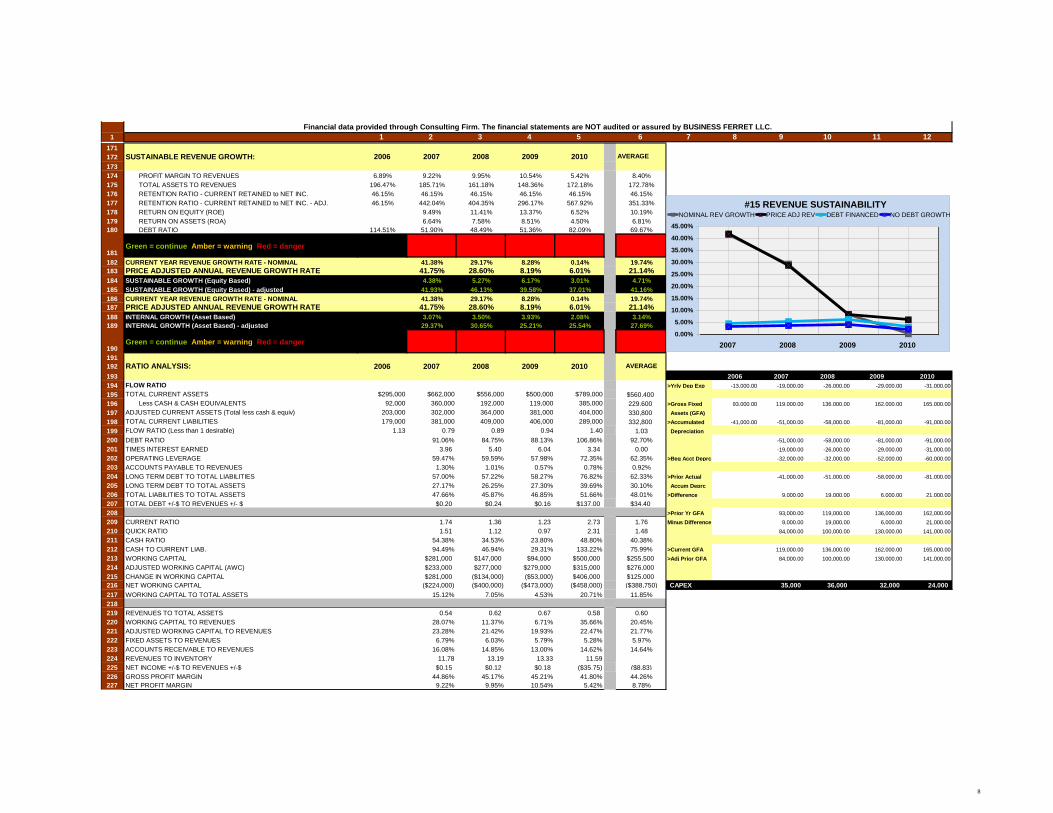
172 SUSTAINABLE REVENUE GROWTH:
173
174 PROFIT MARGIN TO REVENUES 6.89% 9.22% 9.95% 10.54% 5.42% 8.40%
175 TOTAL ASSETS TO REVENUES 196.47% 185.71% 161.18% 148.36% 172.18% 172.78%
176 RETENTION RATIO - CURRENT RETAINED to NET INC. 46.15% 46.15% 46.15% 46.15% 46.15% 46.15%
177 RETENTION RATIO - CURRENT RETAINED to NET INC. - ADJ. 46.15% 442.04% 404.35% 296.17% 567.92% 351.33%
178 RETURN ON EQUITY (ROE) 9.49% 11.41% 13.37% 6.52% 10.19%
179 RETURN ON ASSETS (ROA) 6.64% 7.58% 8.51% 4.50% 6.81%
180 DEBT RATIO 114.51% 51.90% 48.49% 51.36% 82.09% 69.67%
181Green = continue Amber = warning Red = danger
182 CURRENT YEAR REVENUE GROWTH RATE - NOMINAL 41.38% 29.17% 8.28% 0.14% 19.74%
183 PRICE ADJUSTED ANNUAL REVENUE GROWTH RATE 41.75% 28.60% 8.19% 6.01% 21.14%
184 SUSTAINABLE GROWTH (Equity Based) 4.38% 5.27% 6.17% 3.01% 4.71%
185 SUSTAINABLE GROWTH (Equity Based) - adjusted 41.93% 46.13% 39.58% 37.01% 41.16%
186 CURRENT YEAR REVENUE GROWTH RATE - NOMINAL 41.38% 29.17% 8.28% 0.14% 19.74%
187 PRICE ADJUSTED ANNUAL REVENUE GROWTH RATE 41.75% 28.60% 8.19% 6.01% 21.14%
188 INTERNAL GROWTH (Asset Based) 3.07% 3.50% 3.93% 2.08% 3.14%
189 INTERNAL GROWTH (Asset Based) - adjusted 29.37% 30.65% 25.21% 25.54% 27.69%
190Green = continue Amber = warning Red = danger
191
192 RATIO ANALYSIS:
193 2006 2007 2008 2009 2010
194 FLOW RATIO >Yrly Dep Exp -13,000.00 -19,000.00 -26,000.00 -29,000.00 -31,000.00
195 TOTAL CURRENT ASSETS $295,000 $662,000 $556,000 $500,000 $789,000 $560,400
196 Less CASH & CASH EQUIVALENTS 92,000 360,000 192,000 119,000 385,000 229,600 >Gross Fixed 93,000.00 119,000.00 136,000.00 162,000.00 165,000.00
197 ADJUSTED CURRENT ASSETS (Total less cash & equiv) 203,000 302,000 364,000 381,000 404,000 330,800 Assets (GFA)
198 TOTAL CURRENT LIABILITIES 179,000 381,000 409,000 406,000 289,000 332,800 >Accumulated -41,000.00 -51,000.00 -58,000.00 -81,000.00 -91,000.00
199 FLOW RATIO (Less than 1 desirable) 1.13 0.79 0.89 0.94 1.40 1.03 Depreciation
200 DEBT RATIO 91.06% 84.75% 88.13% 106.86% 92.70% -51,000.00 -58,000.00 -81,000.00 -91,000.00
201 TIMES INTEREST EARNED 3.96 5.40 6.04 3.34 0.00 -19,000.00 -26,000.00 -29,000.00 -31,000.00
202 OPERATING LEVERAGE 59.47% 59.59% 57.98% 72.35% 62.35% >Beg Acct Deprc -32,000.00 -32,000.00 -52,000.00 -60,000.00
203 ACCOUNTS PAYABLE TO REVENUES 1.30% 1.01% 0.57% 0.78% 0.92%
204 LONG TERM DEBT TO TOTAL LIABILITIES 57.00% 57.22% 58.27% 76.82% 62.33% >Prior Actual -41,000.00 -51,000.00 -58,000.00 -81,000.00
205 LONG TERM DEBT TO TOTAL ASSETS 27.17% 26.25% 27.30% 39.69% 30.10% Accum Deprc
206 TOTAL LIABILITIES TO TOTAL ASSETS 47.66% 45.87% 46.85% 51.66% 48.01% >Difference 9,000.00 19,000.00 6,000.00 21,000.00
207 TOTAL DEBT +/-$ TO REVENUES +/- $ $0.20 $0.24 $0.16 $137.00 $34.40
208 >Prior Yr GFA 93,000.00 119,000.00 136,000.00 162,000.00
209 CURRENT RATIO 1.74 1.36 1.23 2.73 1.76 Minus Difference 9,000.00 19,000.00 6,000.00 21,000.00
210 QUICK RATIO 1.51 1.12 0.97 2.31 1.48 84,000.00 100,000.00 130,000.00 141,000.00
211 CASH RATIO 54.38% 34.53% 23.80% 48.80% 40.38%
212 CASH TO CURRENT LIAB. 94.49% 46.94% 29.31% 133.22% 75.99% >Current GFA 119,000.00 136,000.00 162,000.00 165,000.00
213 WORKING CAPITAL $281,000 $147,000 $94,000 $500,000 $255,500 >Adj Prior GFA 84,000.00 100,000.00 130,000.00 141,000.00
214 ADJUSTED WORKING CAPITAL (AWC) $233,000 $277,000 $279,000 $315,000 $276,000
215 CHANGE IN WORKING CAPITAL $281,000 ($134,000) ($53,000) $406,000 $125,000
216 NET WORKING CAPITAL ($224,000) ($400,000) ($473,000) ($458,000) ($388,750) CAPEX 35,000 36,000 32,000 24,000
217 WORKING CAPITAL TO TOTAL ASSETS 15.12% 7.05% 4.53% 20.71% 11.85%
218
219 REVENUES TO TOTAL ASSETS 0.54 0.62 0.67 0.58 0.60
220 WORKING CAPITAL TO REVENUES 28.07% 11.37% 6.71% 35.66% 20.45%
221 ADJUSTED WORKING CAPITAL TO REVENUES 23.28% 21.42% 19.93% 22.47% 21.77%
222 FIXED ASSETS TO REVENUES 6.79% 6.03% 5.79% 5.28% 5.97%
223 ACCOUNTS RECEIVABLE TO REVENUES 16.08% 14.85% 13.00% 14.62% 14.64%
224 REVENUES TO INVENTORY 11.78 13.19 13.33 11.59 12.47
225 NET INCOME +/-$ TO REVENUES +/-$ $0.15 $0.12 $0.18 ($35.75) ($8.83)
226 GROSS PROFIT MARGIN 44.86% 45.17% 45.21% 41.80% 44.26%
227 NET PROFIT MARGIN 9.22% 9.95% 10.54% 5.42% 8.78%
2006 2010 AVERAGE2007 2009
2010
2008
AVERAGE2009 2008 2007 2006
0.00%
5.00%
10.00%
15.00%
20.00%
25.00%
30.00%
35.00%
40.00%
45.00%
2007 2008 2009 2010
#15 REVENUE SUSTAINABILITYNOMINAL REV GROWTH PRICE ADJ REV DEBT FINANCED NO DEBT GROWTH
8
1 1 2 3 4 5 6 7 8 9 10 11 12
LINKAGE TO
REVENUESAVERAGE2010 2009 2008 PROBABILITY
Financial data provided through Consulting Firm. The financial statements are NOT audited or assured by BUSINESS FERRET LLC.
GROWTH
RATE in
DOLLARS
STANDARD
DEVIATION2006 2007
% of
CURRENT
REVENUES
% of
AVERAGE
REVENUES
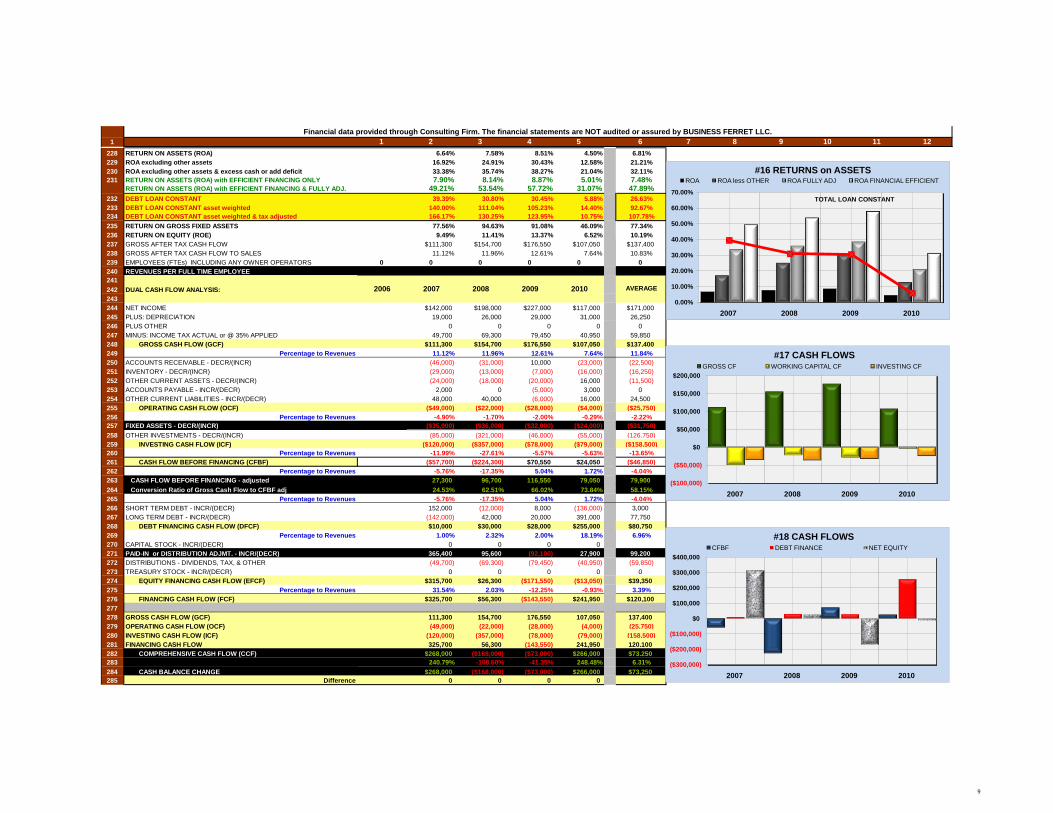
228 RETURN ON ASSETS (ROA) 6.64% 7.58% 8.51% 4.50% 6.81%
229 ROA excluding other assets 16.92% 24.91% 30.43% 12.58% 21.21%
230 ROA excluding other assets & excess cash or add deficit 33.38% 35.74% 38.27% 21.04% 32.11%
231 RETURN ON ASSETS (ROA) with EFFICIENT FINANCING ONLY 7.90% 8.14% 8.87% 5.01% 7.48%RETURN ON ASSETS (ROA) with EFFICIENT FINANCING & FULLY ADJ. 49.21% 53.54% 57.72% 31.07% 47.89%
232 DEBT LOAN CONSTANT 39.39% 30.80% 30.45% 5.88% 26.63%
233 DEBT LOAN CONSTANT asset weighted 140.00% 111.04% 105.23% 14.40% 92.67%
234 DEBT LOAN CONSTANT asset weighted & tax adjusted 166.17% 130.25% 123.95% 10.75% 107.78%
235 RETURN ON GROSS FIXED ASSETS 77.56% 94.63% 91.08% 46.09% 77.34%
236 RETURN ON EQUITY (ROE) 9.49% 11.41% 13.37% 6.52% 10.19%
237 GROSS AFTER TAX CASH FLOW $111,300 $154,700 $176,550 $107,050 $137,400
238 GROSS AFTER TAX CASH FLOW TO SALES 11.12% 11.96% 12.61% 7.64% 10.83%
239 EMPLOYEES (FTEs) INCLUDING ANY OWNER OPERATORS 0 0 0 0 0 0
240 REVENUES PER FULL TIME EMPLOYEE #DIV/0! #DIV/0! #DIV/0! #DIV/0! #DIV/0! #DIV/0!
241
242 DUAL CASH FLOW ANALYSIS:
243
244 NET INCOME $142,000 $198,000 $227,000 $117,000 $171,000
245 PLUS: DEPRECIATION 19,000 26,000 29,000 31,000 26,250
246 PLUS OTHER 0 0 0 0 0
247 MINUS: INCOME TAX ACTUAL or @ 35% APPLIED 49,700 69,300 79,450 40,950 59,850
248 GROSS CASH FLOW (GCF) $111,300 $154,700 $176,550 $107,050 $137,400
249 Percentage to Revenues 11.12% 11.96% 12.61% 7.64% 11.84%
250 ACCOUNTS RECEIVABLE - DECR/(INCR) (46,000) (31,000) 10,000 (23,000) (22,500)
251 INVENTORY - DECR/(INCR) (29,000) (13,000) (7,000) (16,000) (16,250)
252 OTHER CURRENT ASSETS - DECR/(INCR) (24,000) (18,000) (20,000) 16,000 (11,500)
253 ACCOUNTS PAYABLE - INCR/(DECR) 2,000 0 (5,000) 3,000 0
254 OTHER CURRENT LIABILITIES - INCR/(DECR) 48,000 40,000 (6,000) 16,000 24,500
255 OPERATING CASH FLOW (OCF) ($49,000) ($22,000) ($28,000) ($4,000) ($25,750)
256 Percentage to Revenues -4.90% -1.70% -2.00% -0.29% -2.22%
257 FIXED ASSETS - DECR/(INCR) ($35,000) ($36,000) ($32,000) ($24,000) ($31,750)
258 OTHER INVESTMENTS - DECR/(INCR) (85,000) (321,000) (46,000) (55,000) (126,750)
259 INVESTING CASH FLOW (ICF) ($120,000) ($357,000) ($78,000) ($79,000) ($158,500)
260 Percentage to Revenues -11.99% -27.61% -5.57% -5.63% -13.65%
261 CASH FLOW BEFORE FINANCING (CFBF) ($57,700) ($224,300) $70,550 $24,050 ($46,850)
262 Percentage to Revenues -5.76% -17.35% 5.04% 1.72% -4.04%
263 CASH FLOW BEFORE FINANCING - adjusted 27,300 96,700 116,550 79,050 79,900
264 Conversion Ratio of Gross Cash Flow to CFBF adj 24.53% 62.51% 66.02% 73.84% 58.15%
265 Percentage to Revenues -5.76% -17.35% 5.04% 1.72% -4.04%
266 SHORT TERM DEBT - INCR/(DECR) 152,000 (12,000) 8,000 (136,000) 3,000
267 LONG TERM DEBT - INCR/(DECR) (142,000) 42,000 20,000 391,000 77,750
268 DEBT FINANCING CASH FLOW (DFCF) $10,000 $30,000 $28,000 $255,000 $80,750
269 Percentage to Revenues 1.00% 2.32% 2.00% 18.19% 6.96%
270 CAPITAL STOCK - INCR/(DECR) 0 0 0 0 0
271 PAID-IN or DISTRIBUTION ADJMT. - INCR/(DECR) 365,400 95,600 (92,100) 27,900 99,200
272 DISTRIBUTIONS - DIVIDENDS, TAX, & OTHER (49,700) (69,300) (79,450) (40,950) (59,850)
273 TREASURY STOCK - INCR/(DECR) 0 0 0 0 0
274 EQUITY FINANCING CASH FLOW (EFCF) $315,700 $26,300 ($171,550) ($13,050) $39,350
275 Percentage to Revenues 31.54% 2.03% -12.25% -0.93% 3.39%
276 FINANCING CASH FLOW (FCF) $325,700 $56,300 ($143,550) $241,950 $120,100
277
278 GROSS CASH FLOW (GCF) 111,300 154,700 176,550 107,050 137,400
279 OPERATING CASH FLOW (OCF) (49,000) (22,000) (28,000) (4,000) (25,750)
280 INVESTING CASH FLOW (ICF) (120,000) (357,000) (78,000) (79,000) (158,500)
281 FINANCING CASH FLOW 325,700 56,300 (143,550) 241,950 120,100
282 COMPREHENSIVE CASH FLOW (CCF) $268,000 ($168,000) ($73,000) $266,000 $73,250
283 Conversion Ratio of Gross Cash Flow to CCF 240.79% -108.60% -41.35% 248.48% 6.31%
284 CASH BALANCE CHANGE $268,000 ($168,000) ($73,000) $266,000 $73,250
285 Difference 0 0 0 0
AVERAGE2008 2006 2007 2010 2009
0.00%
10.00%
20.00%
30.00%
40.00%
50.00%
60.00%
70.00%
2007 2008 2009 2010
#16 RETURNS on ASSETSROA ROA less OTHER ROA FULLY ADJ ROA FINANCIAL EFFICIENT
TOTAL LOAN CONSTANT
($100,000)
($50,000)
$0
$50,000
$100,000
$150,000
$200,000
2007 2008 2009 2010
#17 CASH FLOWSGROSS CF WORKING CAPITAL CF INVESTING CF
($300,000)
($200,000)
($100,000)
$0
$100,000
$200,000
$300,000
$400,000
2007 2008 2009 2010
#18 CASH FLOWSCFBF DEBT FINANCE NET EQUITY
9
1 1 2 3 4 5 6 7 8 9 10 11 12
LINKAGE TO
REVENUESAVERAGE2010 2009 2008 PROBABILITY
Financial data provided through Consulting Firm. The financial statements are NOT audited or assured by BUSINESS FERRET LLC.
GROWTH
RATE in
DOLLARS
STANDARD
DEVIATION2006 2007
% of
CURRENT
REVENUES
% of
AVERAGE
REVENUES
286
287 HISTORICAL CAPITALIZED CASH FLOW VALUE:
288
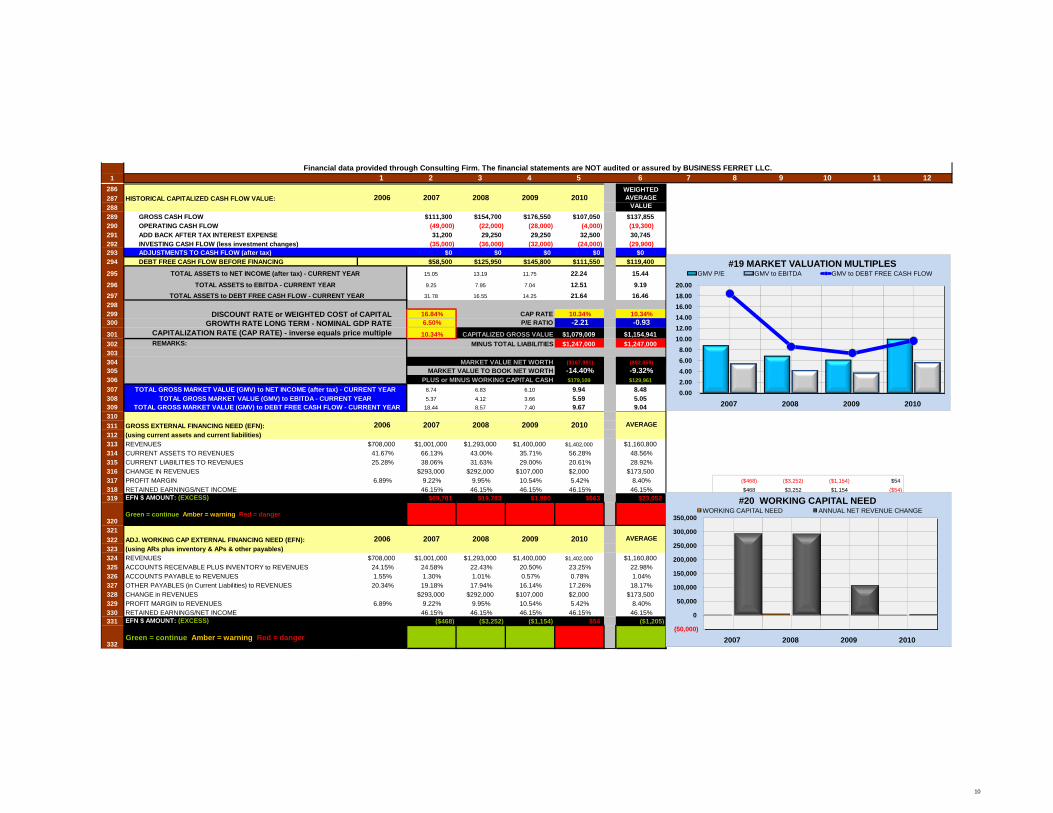
289 GROSS CASH FLOW $111,300 $154,700 $176,550 $107,050 $137,855
290 OPERATING CASH FLOW (49,000) (22,000) (28,000) (4,000) (19,300)
291 ADD BACK AFTER TAX INTEREST EXPENSE 31,200 29,250 29,250 32,500 30,745
292 INVESTING CASH FLOW (less investment changes) (35,000) (36,000) (32,000) (24,000) (29,900)
293 ADJUSTMENTS TO CASH FLOW (after tax) $0 $0 $0 $0 $0
294 DEBT FREE CASH FLOW BEFORE FINANCING $58,500 $125,950 $145,800 $111,550 $119,400
295 15.05 13.19 11.75 22.24 15.44
296 9.25 7.95 7.04 12.51 9.19
297 31.78 16.55 14.25 21.64 16.46
298
299 16.84% CAP RATE 10.34% 10.34%
300 6.50% P/E RATIO -2.21 -0.93
301 10.34% $1,079,009 $1,154,941
302 $1,247,000 $1,247,000
303
304 ($167,991) ($92,059)
305 -14.40% -9.32%
306 $179,109 $129,961
307 8.74 6.83 6.10 9.94 8.48
308 5.37 4.12 3.66 5.59 5.05
309 18.44 8.57 7.40 9.67 9.04
310
311 GROSS EXTERNAL FINANCING NEED (EFN):
312 (using current assets and current liabilities)
313 REVENUES $708,000 $1,001,000 $1,293,000 $1,400,000 $1,402,000 $1,160,800
314 CURRENT ASSETS TO REVENUES 41.67% 66.13% 43.00% 35.71% 56.28% 48.56%
315 CURRENT LIABILITIES TO REVENUES 25.28% 38.06% 31.63% 29.00% 20.61% 28.92%
316 CHANGE IN REVENUES $293,000 $292,000 $107,000 $2,000 $173,500
317 PROFIT MARGIN 6.89% 9.22% 9.95% 10.54% 5.42% 8.40% ($468) ($3,252) ($1,154) $54
318 RETAINED EARNINGS/NET INCOME 46.15% 46.15% 46.15% 46.15% 46.15% $468 $3,252 $1,154 ($54)
319 EFN $ AMOUNT: (EXCESS) $69,781 $19,783 $1,980 $663 $23,052
320Green = continue Amber = warning Red = danger
321
322 ADJ. WORKING CAP EXTERNAL FINANCING NEED (EFN):
323 (using ARs plus inventory & APs & other payables)
324 REVENUES $708,000 $1,001,000 $1,293,000 $1,400,000 $1,402,000 $1,160,800
325 ACCOUNTS RECEIVABLE PLUS INVENTORY to REVENUES 24.15% 24.58% 22.43% 20.50% 23.25% 22.98%
326 ACCOUNTS PAYABLE to REVENUES 1.55% 1.30% 1.01% 0.57% 0.78% 1.04%
327 OTHER PAYABLES (in Current Liabilities) to REVENUES 20.34% 19.18% 17.94% 16.14% 17.26% 18.17%
328 CHANGE in REVENUES $293,000 $292,000 $107,000 $2,000 $173,500
329 PROFIT MARGIN to REVENUES 6.89% 9.22% 9.95% 10.54% 5.42% 8.40%
330 RETAINED EARNINGS/NET INCOME 46.15% 46.15% 46.15% 46.15% 46.15%
331 EFN $ AMOUNT: (EXCESS) ($468) ($3,252) ($1,154) $54 ($1,205)
332Green = continue Amber = warning Red = danger
TOTAL GROSS MARKET VALUE (GMV) to DEBT FREE CASH FLOW - CURRENT YEAR
MINUS TOTAL LIABILITIES
2009 2010
CAPITALIZED GROSS VALUE
MARKET VALUE TO BOOK NET WORTH
2008
TOTAL GROSS MARKET VALUE (GMV) to NET INCOME (after tax) - CURRENT YEAR
TOTAL GROSS MARKET VALUE (GMV) to EBITDA - CURRENT YEAR
2009
2009 AVERAGE
WEIGHTED
AVERAGE
VALUE
AVERAGE
2008
2008
2007 2010
PLUS or MINUS WORKING CAPITAL CASH
MARKET VALUE NET WORTH
2007
DISCOUNT RATE or WEIGHTED COST of CAPITAL
2006
2007
2010
GROWTH RATE LONG TERM - NOMINAL GDP RATE
2006
TOTAL ASSETS to NET INCOME (after tax) - CURRENT YEAR
CAPITALIZATION RATE (CAP RATE) - inverse equals price multiple
REMARKS:
2006
TOTAL ASSETS to EBITDA - CURRENT YEAR
TOTAL ASSETS to DEBT FREE CASH FLOW - CURRENT YEAR
0.00
2.00
4.00
6.00
8.00
10.00
12.00
14.00
16.00
18.00
20.00
2007 2008 2009 2010
#19 MARKET VALUATION MULTIPLESGMV P/E GMV to EBITDA GMV to DEBT FREE CASH FLOW
(50,000)
0
50,000
100,000
150,000
200,000
250,000
300,000
350,000
2007 2008 2009 2010
#20 WORKING CAPITAL NEEDWORKING CAPITAL NEED ANNUAL NET REVENUE CHANGE
10
1 1 2 3 4 5 6 7 8 9 10 11 12
LINKAGE TO
REVENUESAVERAGE2010 2009 2008 PROBABILITY
Financial data provided through Consulting Firm. The financial statements are NOT audited or assured by BUSINESS FERRET LLC.
GROWTH
RATE in
DOLLARS
STANDARD
DEVIATION2006 2007
% of
CURRENT
REVENUES
% of
AVERAGE
REVENUES
333
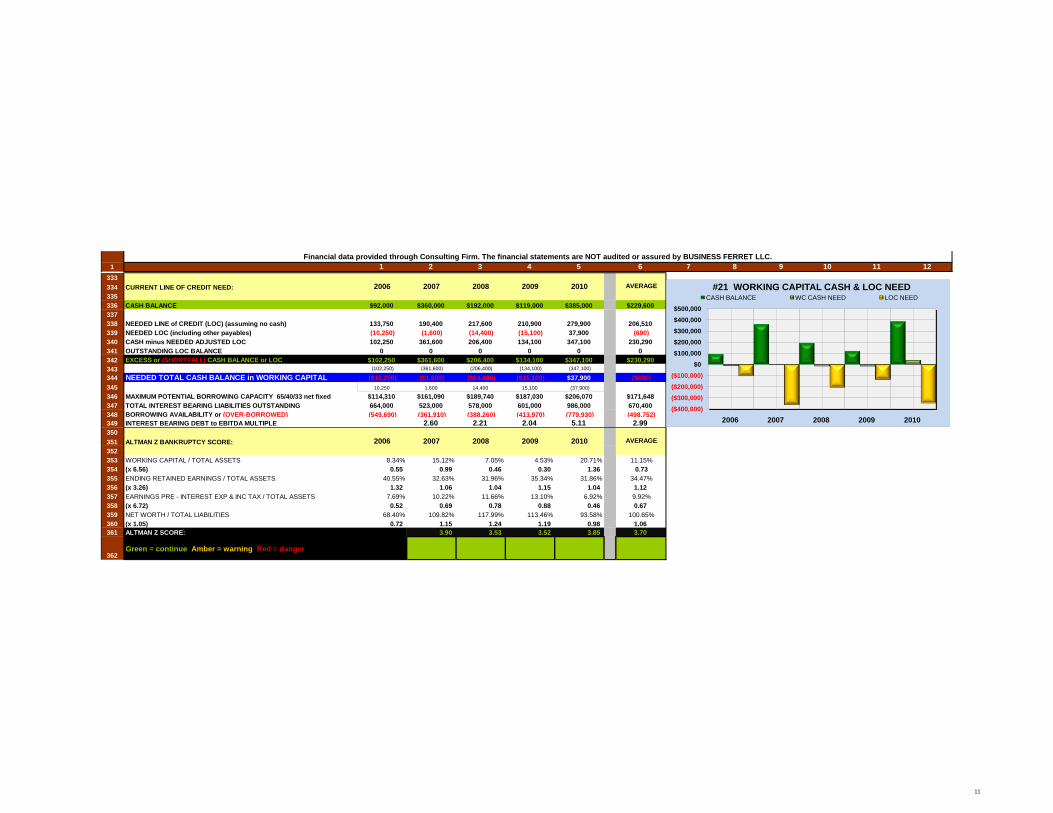
334 CURRENT LINE OF CREDIT NEED:
335
336 CASH BALANCE $92,000 $360,000 $192,000 $119,000 $385,000 $229,600
337
338 NEEDED LINE of CREDIT (LOC) (assuming no cash) 133,750 190,400 217,600 210,900 279,900 206,510
339 NEEDED LOC (including other payables) (10,250) (1,600) (14,400) (15,100) 37,900 (690)
340 CASH minus NEEDED ADJUSTED LOC 102,250 361,600 206,400 134,100 347,100 230,290
341 OUTSTANDING LOC BALANCE 0 0 0 0 0 0
342 EXCESS or (SHORTFALL) CASH BALANCE or LOC $102,250 $361,600 $206,400 $134,100 $347,100 $230,290
343 (102,250) (361,600) (206,400) (134,100) (347,100)
344 NEEDED TOTAL CASH BALANCE in WORKING CAPITAL ($10,250) ($1,600) ($14,400) ($15,100) $37,900 ($690)
345 10,250 1,600 14,400 15,100 (37,900)
346 MAXIMUM POTENTIAL BORROWING CAPACITY 65/40/33 net fixed $114,310 $161,090 $189,740 $187,030 $206,070 $171,648
347 TOTAL INTEREST BEARING LIABILITIES OUTSTANDING 664,000 523,000 578,000 601,000 986,000 670,400
348 BORROWING AVAILABILITY or (OVER-BORROWED) (549,690) (361,910) (388,260) (413,970) (779,930) (498,752)
349 INTEREST BEARING DEBT to EBITDA MULTIPLE 2.60 2.21 2.04 5.11 2.99
350
351 ALTMAN Z BANKRUPTCY SCORE:
352
353 WORKING CAPITAL / TOTAL ASSETS 8.34% 15.12% 7.05% 4.53% 20.71% 11.15%
354 (x 6.56) 0.55 0.99 0.46 0.30 1.36 0.73
355 ENDING RETAINED EARNINGS / TOTAL ASSETS 40.55% 32.63% 31.96% 35.34% 31.86% 34.47%
356 (x 3.26) 1.32 1.06 1.04 1.15 1.04 1.12
357 EARNINGS PRE - INTEREST EXP & INC TAX / TOTAL ASSETS 7.69% 10.22% 11.66% 13.10% 6.92% 9.92%
358 (x 6.72) 0.52 0.69 0.78 0.88 0.46 0.67
359 NET WORTH / TOTAL LIABILITIES 68.40% 109.82% 117.99% 113.46% 93.58% 100.65%
360 (x 1.05) 0.72 1.15 1.24 1.19 0.98 1.06
361 ALTMAN Z SCORE: 3.90 3.53 3.52 3.85 3.70
362Green = continue Amber = warning Red = danger
AVERAGE
AVERAGE
2010
2010
2009
2009 2007
2007 2008 2006
2006 2008
($400,000)
($300,000)
($200,000)
($100,000)
$0
$100,000
$200,000
$300,000
$400,000
$500,000
2006 2007 2008 2009 2010
#21 WORKING CAPITAL CASH & LOC NEEDCASH BALANCE WC CASH NEED LOC NEED
11
1 1 2 3 4 5 6 7 8 9 10 11 12
LINKAGE TO
REVENUESAVERAGE2010 2009 2008 PROBABILITY
Financial data provided through Consulting Firm. The financial statements are NOT audited or assured by BUSINESS FERRET LLC.
GROWTH
RATE in
DOLLARS
STANDARD
DEVIATION2006 2007
% of
CURRENT
REVENUES
% of
AVERAGE
REVENUES
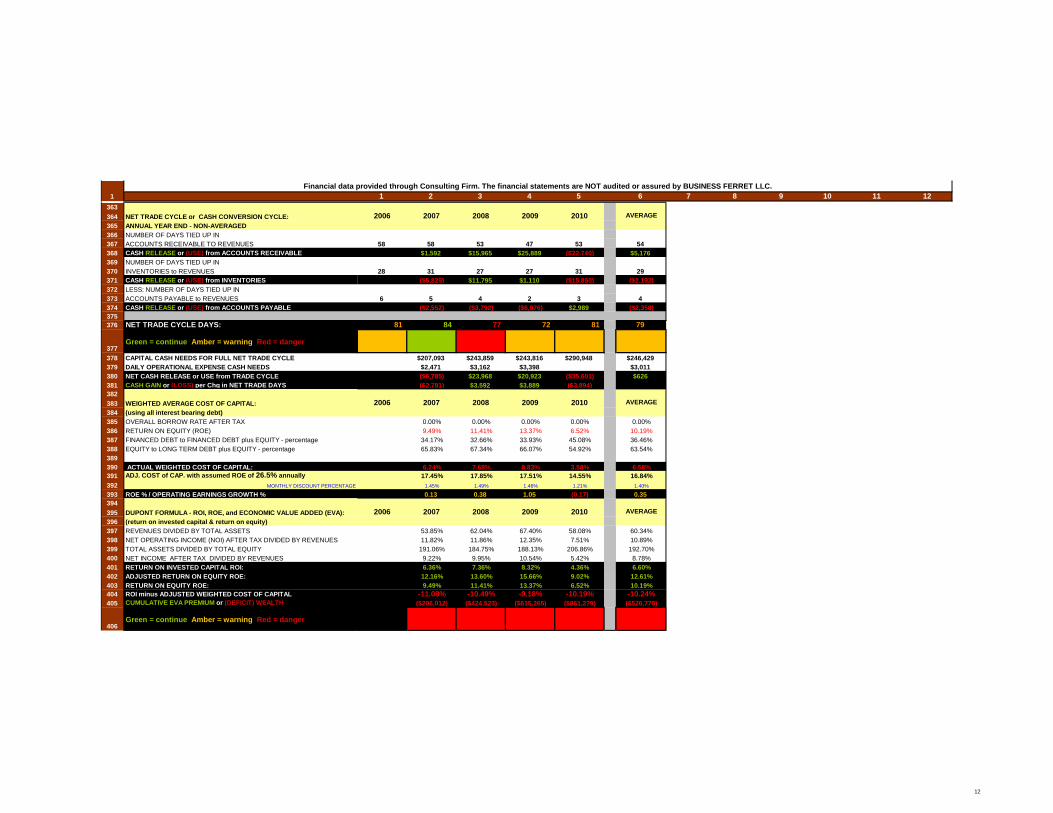
363
364 NET TRADE CYCLE or CASH CONVERSION CYCLE:
365 ANNUAL YEAR END - NON-AVERAGED
366 NUMBER OF DAYS TIED UP IN
367 ACCOUNTS RECEIVABLE TO REVENUES 58 58 53 47 53 54
368 CASH RELEASE or (USE) from ACCOUNTS RECEIVABLE $1,592 $15,965 $25,889 ($22,740) $5,176
369 NUMBER OF DAYS TIED UP IN
370 INVENTORIES to REVENUES 28 31 27 27 31 29
371 CASH RELEASE or (USE) from INVENTORIES #DIV/0! ($5,825) $11,795 $1,110 ($15,850) ($2,192)
372 LESS: NUMBER OF DAYS TIED UP IN
373 ACCOUNTS PAYABLE to REVENUES 6 5 4 2 3 4
374 CASH RELEASE or (USE) from ACCOUNTS PAYABLE ($2,552) ($3,792) ($6,076) $2,989 ($2,358)
375
376 NET TRADE CYCLE DAYS: 81 84 77 72 81 79
377Green = continue Amber = warning Red = danger
378 CAPITAL CASH NEEDS FOR FULL NET TRADE CYCLE $207,093 $243,859 $243,816 $290,948 $246,429
379 DAILY OPERATIONAL EXPENSE CASH NEEDS $2,471 $3,162 $3,398 $3,011
380 NET CASH RELEASE or USE from TRADE CYCLE ($6,785) $23,968 $20,923 ($35,601) $626
381 CASH GAIN or (LOSS) per Chg in NET TRADE DAYS ($2,781) $3,592 $3,889 ($3,894)
382
383 WEIGHTED AVERAGE COST OF CAPITAL:
384 (using all interest bearing debt)
385 OVERALL BORROW RATE AFTER TAX 0.00% 0.00% 0.00% 0.00% 0.00%
386 RETURN ON EQUITY (ROE) 9.49% 11.41% 13.37% 6.52% 10.19%
387 FINANCED DEBT to FINANCED DEBT plus EQUITY - percentage 34.17% 32.66% 33.93% 45.08% 36.46%
388 EQUITY to LONG TERM DEBT plus EQUITY - percentage 65.83% 67.34% 66.07% 54.92% 63.54%
389
390 ACTUAL WEIGHTED COST OF CAPITAL: 6.24% 7.68% 8.83% 3.58% 6.58%
391 ADJ. COST of CAP. with assumed ROE of 26.5% annually 17.45% 17.85% 17.51% 14.55% 16.84%
392 MONTHLY DISCOUNT PERCENTAGE 1.45% 1.49% 1.46% 1.21% 1.40%
393 ROE % / OPERATING EARNINGS GROWTH % 0.13 0.38 1.05 (0.17) 0.35
394
395 DUPONT FORMULA - ROI, ROE, and ECONOMIC VALUE ADDED (EVA):
396 (return on invested capital & return on equity)
397 REVENUES DIVIDED BY TOTAL ASSETS 53.85% 62.04% 67.40% 58.08% 60.34%
398 NET OPERATING INCOME (NOI) AFTER TAX DIVIDED BY REVENUES 11.82% 11.86% 12.35% 7.51% 10.89%
399 TOTAL ASSETS DIVIDED BY TOTAL EQUITY 191.06% 184.75% 188.13% 206.86% 192.70%
400 NET INCOME AFTER TAX DIVIDED BY REVENUES 9.22% 9.95% 10.54% 5.42% 8.78%
401 RETURN ON INVESTED CAPITAL ROI: 6.36% 7.36% 8.32% 4.36% 6.60%
402 ADJUSTED RETURN ON EQUITY ROE: 12.16% 13.60% 15.66% 9.02% 12.61%
403 RETURN ON EQUITY ROE: 9.49% 11.41% 13.37% 6.52% 10.19%
404 ROI minus ADJUSTED WEIGHTED COST OF CAPITAL -11.08% -10.49% -9.18% -10.19% -10.24%
405 CUMULATIVE EVA PREMIUM or (DEFICIT) WEALTH ($206,012) ($424,523) ($615,265) ($861,279) ($526,770)
406Green = continue Amber = warning Red = danger
2006
2006 2007
2008
2008
2008
2007 2010 AVERAGE
AVERAGE
AVERAGE
2009
2009
2009
2010
2010 2007 2006
12