Embed Size (px)
Citation preview

BUSINESS OVERVIEW
2016

ContentsKEMIRA TODAY
CEO STATEMENT
PERFORMANCE 2016
BUSINESS MODEL
OUR STRATEGY FOR PROFITABLE GROWTH
Three core segments with strong market positions
Profitable growth through clear defined actions
People
Innovating together with customers
Our global network
SEGMENTS
Pulp & Paper
Oil & Mining
Municipal & Industrial
RISKS AND OPPORTUNITIES
2489
1012171819
20242832
TABLE OF
All forward-looking statements in this report are based on the management’s current expectations and beliefs about
future events, and actual results may differ materially from the expectations and beliefs such statements contain.
BUSINESS OVERVIEW
GRI DISCLOSURESCORPORATE GOVERNANCE STATEMENTFINANCIAL STATEMENTS
The Kemira Annual Report 2016 consists of four
modules. By clicking the titles below, you can go
directly into each module with its own table of
contents.

→ Revenue: EUR 2.4 billion (2.4 billion in 2015)
→ Operative EBITDA: EUR 302.5 million (287.3 million)
→ Operative EBITDA margin: 12.8% (12.1%)
→ Earnings per share: EUR 0.60 (0.47)
→ Employees 4,818 (4,685)
→ Manufacturing network of 63 (64) sites,
products sold in more than 100 countries
→ Financial targets on mid- to long-term: above-the-market
revenue growth, operative EBITDA margin 14–16%,
gearing below 60%
→ Headquartered in Helsinki, Finland and
listed on the Nasdaq Helsinki Ltd.
Kemira – KEY FIGURES 2016
2
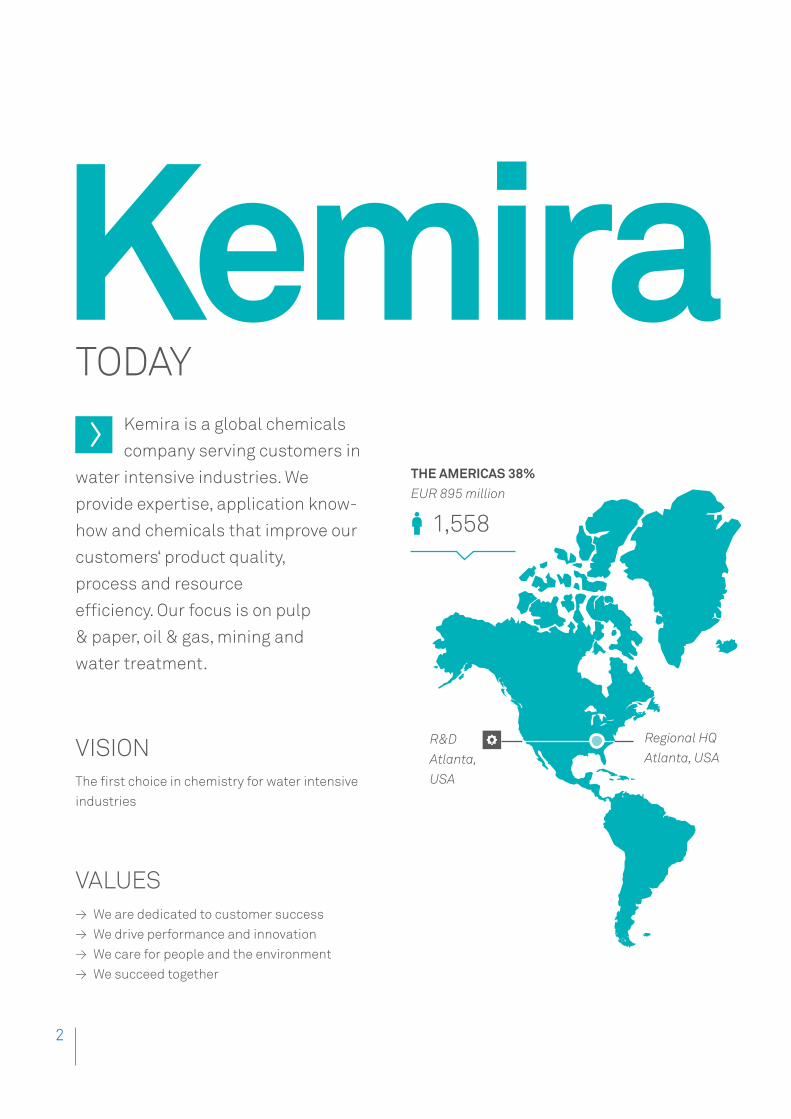
KemiraKemira is a global chemicals
company serving customers in
water intensive industries. We
provide expertise, application know-
how and chemicals that improve our
customers‘ product quality,
process and resource
efficiency. Our focus is on pulp
& paper, oil & gas, mining and
water treatment.
TODAY
THE AMERICAS 38%EUR 895 million
1,558
Regional HQ
Atlanta, USAR&D
Atlanta,
USA
VALUES
VISION
→ We are dedicated to customer success
→ We drive performance and innovation
→ We care for people and the environment
→ We succeed together
The first choice in chemistry for water intensive
industries

20163
PULP & PAPERA leading global bleaching, process and func-
tional chemical supplier, #1–2 in all regions.
OIL & MININGA growing chemical supplier to the oil & gas and
mining industries, #2 in global polyacrylamide
polymers.
MUNICIPAL & INDUSTRIALMarket leader in raw and waste water treatment
chemicals, #1 in Europe and North America.
EUROPE, MIDDLE EAST AND AFRICA 52%EUR 1.239 million
ASIA PACIFIC 10%EUR 228 million
Kemira headquartersHelsinki, Finland
2,609
651
Regional HQ Shanghai, China
R&D Shanghai, China
Employees
R&D and technology centersR&D Espoo, Finland
BUSINESS SEGMENTS:

4
CONTINUED IMPROVEMENT IN
profitability In 2016, we continued to improve our
profitability. We have systematically
followed our strategic plan, and we are on
our way towards our mid-to-long-term financial
targets. Our goal is to deliver revenue growth
above-the-market with improving profitability.
THE YEAR 2016 IN BRIEFThe year 2016 showed that our action plan is
delivering continued improvement in profitability
despite adverse developments in oil and gas
markets. We progressed a step forward towards
our profitability target and achieved operative
EBITDA margin of 12.8% (12.1%). Organic revenue
growth remained challenging, mainly due to the
deflationary pricing environment, declines in oil
and gas markets, and tightening competition in
the pulp and paper chemicals market. Our full-
year revenue amounted to EUR 2.4 billion with
organic growth of -2%, mainly due to drop in oil
and gas markets.
In September 2016, we updated our mid- to
long-term financial targets. Kemira aims for
above-the-market revenue growth with operative Jari Rosendal I President and CEO
CEO STATEMENT

20165
EBITDA margin of 14–16%. The gearing target is
maintained at below 60%.
OUR STRATEGY FOR PROFITABLE GROWTHKemira’s vision is to be the first choice in chemis-
try for water intensive industries. This means we
must provide first class expertise, application
know-how and chemicals that improve our cus-
tomers’ product quality as well as their process
and resource efficiency. It also means that we
must operate sustainably, efficiently and safely,
while employing the best people with the right
service attitude and a passion for our business.
Over the past three years we have been focus-
ing on the following four areas: driving growth,
acquisitions, cost discipline, and efficiency. In
March 2016, we announced an investment of
approximately EUR 50-60 million in the expansion
of our production capacity in Joutseno, Finland,
aiming to capture growth opportunities in the
pulp and paper industry. We have also expanded
our production in San Giorgio, Italy, and in Brad-
ford, UK. Our capital expenditure in 2016 was EUR
OVER THE PAST THREE YEARS WE HAVE BEEN FOCUSING ON THE FOLLOWING FOUR AREAS: DRIVING GROWTH, ACQUISITIONS, COST DISCIPLINE, AND EFFICIENCY.
211 million (2015: EUR 305 million), and these
investments have all been executed on schedule
and on budget. In spring 2016, we successfully
started up our new sodium chlorate plant in
Ortigueira, Brazil, strengthening our capability to
meet growing demand for pulping chemicals in
the South American market.
6
The integration of the AkzoNobel paper chemi-
cals business, acquired in May 2015, has pro-
gressed better than expected, so we raised the
related cost synergy target from EUR 15 million to
EUR 20 million in September. The synergy capture
will be at full run-rate by the end of 2017.
During 2016 we launched a new operational
excellence program known as BOOST, to improve
efficiency and customer experience. We expect
this program to bring annual savings run-rate of
EUR 20-30 million within 2-3 years. A new part-
nership with Odyssey, who will start to operate
Kemira’s external road transportation activities in
the EMEA region and North America in 2017, will
make a major contribution to the BOOST pro-
gram’s benefits.
Our strategy execution is on track, and we will
continue to move forward with regard to deliver-
ing our mid-to-long-term financial targets. We
remain determined to drive profitable growth
through initiatives including Total Chemistry
Management (TCM) contracts and additional
bleaching chemical capacity in the Pulp & Paper
segment; Chemical Enhanced Oil Recovery (CEOR)
and oil sands in Oil & Mining; and measures to
increase revenue in Municipal & Industrial includ-
ing Advanced Water Treatment (AWT) applications
and geographical expansion in selected regions.
CEO STATEMENT
RESPONSIBILITY THROUGHOUT THE VALUE CHAINOur corporate responsibility work is guided by the
increasing expectations of our customers and
other stakeholders, as well as by our own strategy
and Code of Conduct, and internationally defined
principles. Our work particularly focuses on
responsible business practices, sustainable
products and solutions, responsible manufactur-
ing, responsibility in our supply chain, and
responsibility towards our employees, and local
communities wherever we operate.
Thanks to our long-term efforts to enhance
health and safety culture throughout Kemira, we
have been able to significantly improve our safety
performance. The frequency of reported injuries
per million hours worked by our employees and
contractors decreased to 3.4, compared to 7.2 in
2015. We will continue to invest a lot of time and
effort to achieve further improvements in work-
place safety.
We create sustainable value by innovating and
improving product performance, by reducing the
environmental footprint of our value chain, and by
improving safety throughout product life cycles.
We launched 14 new products in 2016 (2015: 3)
and the share of innovation products in total
sales increased to 9% by revenue (2015: 8%). Our

20167
innovation sales target is 10% and we will con-
tinue our efforts to reach it.
Our main environmental impact is the carbon
dioxide emissions from our manufacturing, which
we are striving to reduce through energy effi-
ciency improvements and the sourcing of more
low-carbon energy. In 2016, we were able to
source a higher share of low-carbon energy and
we continued to invest in more energy efficient
equipment and production lines through our
E3plus energy efficiency program. The Kemira
Carbon Index improved to 86, and we are on
progress to reach our target of reducing the
Kemira Carbon Index by 20 percentage points by
the end of 2020, compared to the baseline year
2012 (index value = 100).
THE RIGHT MIXToday, we are number one globally in bleaching,
process and functional chemicals for the pulp
and paper industry – and also the market leader
in waste water treatment chemicals in Europe
and North America. Our products are distributed
to over 100 countries globally, and we have 4,818
employees in approximately 40 countries. During
WE PROGRESSED WELL TOWARDS OUR PROFITABILITY TARGET AND REACHED OPERATIVE EBITDA MARGIN OF 12.8% IN 2016.
the three years I have worked as Kemira’s CEO, I
have clearly seen that we are a global technology
house with excellent in-house chemistry exper-
tise and a profound understanding of different
industrial processes. Creating the right mix of
these elements will make us the first choice for
our customers.
Jari Rosendal
President & CEO

8
PERFORMANCE
Sustainable products and solutions
Innovation sales target:
10% of total
revenue by the end
of 2017
15 16 Target 2017
141312
5%7%
8% 8%9%
10%
Responsibility in our supply chain
Target: 5 suppliers audited every
year during 2016-2020, average.
Responsibility towards employees
Occupational health and safety target: Achieve zero injuries
(TRIF 2.0 by 2020)
Total Recordable Injury Frequency (TRIF), per million hours, Kemira + contractor, 1 year rolling average.
Leadership development target : Two (2) leadership development activities per people manager position during 2016–2020
Engagement target:Employee engagement index at or above the external industry norm, participation rate 75% or above.
■ Employee engagement index, % (external norm 2015: 68%)
■ Participation rate, % of total employees
Responsible manufacturing
2015 16141312
Climate change target: Kemira Carbon
Index ≤ 80 by
the end of
2020
88100
91 92 8680
2016
4
2020
25
2015
494
2020
1500
2012 2013 2014 2015 2016
8.57.1
5.87.2
3.4
2011 2013 2015
70%84%
58%67%75%
85%
Operative EBITDA (%)Revenue (EUR billion)
2014 2015 2016
Financial performance
Target: above market growth Target: 14-16%
2.12.4 2.4
2014 2015 2016
12.1% 12.8%11.8%
2016

20169
INPUTS
BUSINESS ACTIVITIES
OUTPUTS
OUTCOMES
Equity: EUR 1,183 million
Interest-bearing liabilities: EUR 807 million
Cash: EUR 173 million 250 R&D experts in 3 centers, over 1,200 patents
Total materials purchased: → 3.5 million tons, 27% recycled
→ Total energy purchased (GWh) 4,426
4,818 professionals worldwide
Business units in 40 countries, 63 manufacturing sites
Sustainable products and solutions, market position
→ Polyacrylamide polymers #2 → Coagulants #1 → Sizing #1 → Chlorate & peroxides #2
Services → Application support → Process control & monitoring → Total Chemistry Management
Emissions and waste → Scope1 + Scope2 (CO2 eq. tonnes) = 931,000 → Total waste disposal 82,300 tonnes
Income received from customers → EUR 2.4 billion
Business model
Differentiation: → Unique strategy based
on expertise, application knowhow and chemicals for customers in water-intensive industries.
Responsibility for employees
→ Workplace safety → Employee engagement → Leadership development
Product stewardship → Ensuring safety of our products
Responsible business practices → Compliance to Kemira Code of Conduct
Responsible supply chain → Sustainability in sourcing and supply
chain management
Responsible manufacturing → Lowering costs & environmental
impacts of our operations
Customers → Product quality or product yield
optimization → Process and energy
efficiency → Water quality and regulatory
compliance → Customer Net Promoter Score: 28
(industry average 26)
Society → Purified water, suitable for reuse → Sustainable use of biobased materials:
recycled fibers → Less water and energy used in
industrial processes → More efficient extraction and use of
non-renewable resources: oil, minerals and water
→ Income taxes paid: EUR 23 million*
Shareholders & lenders → EUR 114 million paid in dividends*
*on cash basis including interest expenses*
Key relationships: customers, suppliers, distributors & agents, industrial partners for secondary raw materials

10
Our focus will continue to be on promoting and supporting profitable
growth in three business segments. We gain synergies through similar
production technologies and shared manufacturing sites. Polymers are the
largest product group used throughout these segments.
OUR STRATEGY FOR
profitable growthTHREE CORE SEGMENTS WITH STRONG MARKET POSITIONS

201611
In Pulp & Paper, we have unique expertise in
applying chemicals and in helping pulp and paper
producers to innovate and constantly improve
their operational efficiency and environmental
impacts. Kemira is the only company in the
industry with a major global presence in pulp,
packaging and paper chemicals. Thanks to an
increased focus on this business combined with
strategic investments and selective acquisitions,
we have been able to grow and become the global
market leader.
In Oil & Mining, we provide a unique combina-
tion of innovative knowhow on chemicals and
applications that can improve process efficiency
and yields in oil, gas and metals recovery. Kemira
is the second largest producer of polyacrylamide
(PAM) polymers globally. Within the extensive
global oil and gas industry we have selected a few
attractive niches such as the shale fracking
industry. We have a leading market position in
friction reducers used in fracking of shale oil and
gas. In addition, oil sands and Chemical Enhanced
Oil Recovery (CEOR), are attractive growth pros-
pects for the long-term.
In Municipal & Industrial, we enable our
customers to improve their water treatment
efficiency by providing expertise and chemicals
for the management of raw and waste water. In
this segment we have a market share of around
30% in Europe and North America, but we have
also gained ground in selected growth markets
such as Singapore and Shanghai. In our focus
regions, we are the leading supplier for raw and
waste water treatment chemicals.
62% 13% 25%
13.4 %
5.9 %
14.9 %
#1 #2* #1
Leading global pulp and paper
chemical supplier
Market leader in water treatment
chemicals in Europe and North
America
Growing chemical supplier to oil, gas and mining
industries
PULP & PAPER OIL & MINING MUNICIPAL & INDUSTRIAL
of group revenue of group revenue of group revenue
Operative EBITDA
Operative EBITDA
Operative EBITDA
MarketPosition
MarketPosition
MarketPosition
*in polyacrylamide polymers

12
PROFITABLE GROWTH THROUGH
clear, defined actionsACHIEVEMENTS & ONGOING PROJECTS
% %
Opening of Nanjing (CN) multi-purpose site
Start-up of EMEA service center
Expansion of dry and emulsion polyacrylamide (US)
Acquisition of BASF AKD emulsions
Opening of Tarragona (ES)coagulant site
Chevron CEOR R&D agreement
Pulp chemicals to Montes del Plata (UY)
Q1/14
Q3/15
Q2/14
Q4/15
Q3/14
Q1/16
Q4/14
Q2/16
Q1/15
Q3/16
Q2/15
Q4/16
Transportation agreement with Odyssey
2013 operative EBITDA
11.3 12.82016 operative EBITDA
AkzoNobel´s paper chemicals acquisition
Acquisition of Polymer Services (US)
Expansion of Bradford (UK)
Expansion of San Giorgio (IT)
Closure of Ottawa (CA)
Botlek (NL) modernization
BOOST operational excellence program launch
Closure of Soave (IT)
Decision to close Zaramillo (ES)
Opening / expansion of siteAcquisitionNew major contractOperational efficienciesClosure of site
Acquisition of Soto Industries (US)
Start-up of Ortigueira (BR) sodium chlorate
site and announcement of Joutseno (FI)
expansion
Expansion of pulp chemicals, Oulu (FI)
Closure of Longview (US)
Cairn CEOR agreement

201613
Over the last three years Kemira has initiated and
executed multiple actions to deliver profitable
growth. These actions are a key factor behind
revenue growth from around EUR 2.2 billion in
2013 to around EUR 2.4 billion in 2016, as well as
profitability improvements from 11.3% in 2013 to
12.8% in 2016, despite the adverse developments
in the oil and gas markets. The single largest
action has been the acquisition of AkzoNobel
paper chemicals business, which has brought us
additional annual revenue of around EUR 200
million and some 350 experts around the world.
This acquisition strengthened our market position
in all regions, especially in the APAC region where
we are now the #1 chemicals provider to paper,
board and tissue mills. The acquisition is also
expected to bring around EUR 20 million in syner-
gies on top of the EUR 19 million EBITDA (pro
forma 2015) contribution from the existing busi-
ness. We are very satisfied with the way integra-
tion has proceeded, and proud to have new
AkzoNobel employees and products as a part of
Kemira’s business today, giving us an even
stronger market leadership position.
SELECTIVE INVESTMENTS TO SUPPORT FUTURE GROWTH Kemira is currently in an investment phase, and
our capital expenditure in 2016 amounted to EUR
211 million (Capital expenditure including acqui-
sitions, 2015: EUR 305 million, 2014: EUR 145
million). Several site expansions and openings
have taken place during the last three years, of
which the most recent is a new sodium chlorate
site in Ortigueira, Brazil. The site opened in March
2016, exclusively serving Klabin, Brazil’s largest
pulp producer. Other examples of the investment
phase include expansions in Bradford, UK, and
San Giorgio, Italy, as well as the upcoming new
bleaching chemical production line in Joutseno,
Finland.
MID- TO LONG-TERM TARGETS
2014 2015 2016 FINANCIAL TARGETS
Revenue
Operative
EBITDA
margin
Gearing
(mid- to long-term)
2.1 2.4 2.4
11.8 12.1 12.8% % %
% % %42 54 54
EURbillion
EURbillion
EURbillion
Above-the-market growth
14-16%
Below 60%

14
DRIVERS FOR PROFITABLE GROWTH In Pulp and Paper, the cornerstone of revenue and
profitability improvement is continuous excel-
lence in all daily operations. Growth in pulp
chemicals is driven by our investments in bleach-
ing chemical capacity to meet growing demand in
South America and Northern Europe. The newly
built capacity in Brazil is now running at full
speed, and we are in the process of building a
new sodium chlorate line in Joutseno, Finland, to
serve primarily the Nordic market. The new line is
expected to come into operation in the fourth
quarter of 2017. In paper chemicals, our newly
launched Total Chemistry Management (TCM)
concept has brought us multiple deals, especially
in the APAC region, thanks to our one-stop-shop
In addition, we have optimized our Group-wide
production footprint through prudent cost con-
trol. This is essential, since we have to constantly
take care of our efficiency to remain competitive.
At the end of 2016, we had 63 production sites
(compared to 64 in 2015) in 24 different countries.
Kemira is well on its way towards its mid- to long-
term financial targets. However, the world is unpre-
dictable. Economic cycles affect the supply and
cost of certain important raw materials. Currency
rates have also been fluctuating substantially, and
geopolitical issues such as Brexit have recently
arisen. The issues may not impact Kemira directly,
but they certainly may have consequences for some
of our customers and for entire economies, and
therefore they may have indirect impacts on Kemira.
ALL SEGMENTS AIMING FOR PROFITABLE GROWTH
MID- TO LONG-TERM TARGETS
Pulp & Paper
Growth
Oil & Mining
Growth
Municipal& Industrial
Growth2 X market growth
62% of Group revenue 13% of Group revenue 25% of Group revenue
Double-digit growth-% over-the-cycle
Steady growth of 2-4%
ProfitabilityIn line with the Group target
ProfitabilityOver-the-cycle profitability in line or above the Group target
ProfitabilitySlightly below the Group target

201615
approach. On the profitability side, synergies from
the AkzoNobel´s paper chemicals acquisition will
continue to ramp up and contribute towards our
profitability target.
In Oil and Mining, the shale oil and gas market
seems to have bottomed in summer 2016. The rig
count in the US is an indirect indicator of activity
in shale fields, and the number of rigs has risen
by 63% from the bottom in spring 2016 to 658
rigs, though the figure is still far below the 1,800
level where it was on average during 2014. We are
continuing our efforts for entering Chemical
Enhanced Oil Recovery (CEOR). CEOR is an area
where it typically takes 12-24 months to develop
and tailor the right product to fulfill all customer’s
needs, relating to factors including specific
PROFITABLE GROWTH DRIVERS
Pulp & Paper
Oil & Mining
Municipal& Industrial
→ Winning Formula – Excel in
basic game
→ Bleaching chemical capacity
additions
→ New Total Chemistry
Management (TCM) contracts
→ Capture acquisition synergies
→ CEOR - tailored polymers for
harsh conditions in Chemical
Enhanced Oil Recovery
→ Oil sands – tailings treatment
→ Recovery of shale market
→ Geographic expansion
→ Expansion in product
offering
→ Advanced Water
Treatment (AWT)
conditions in a certain oilfield. This kind of know-
how-based and tailored application requirement
is very suitable for Kemira, as we have decades of
experience in polymer applications. We have also
entered oil sands, which is a growth prospect in
Canada, as oil producers are required by law to
conduct appropriate tailings treatment. We are
also focusing on our mining business as well as
our process industry portfolio in selected indus-
tries.
In Municipal and Industrial, we aim to con-
tinue with our successful business in existing
markets, with wider offerings to the market. We
are additionally looking for geographic expansion,
selectively going into new areas. Some of our
products, such as anti-scalants, are not yet
Group wide drivers → BOOST program – operational excellence
→ Selective acquisitions

16
offered to all of our customers. There is an
increasing demand for Advanced Water
Treatment (AWT) among municipalities for
such solutions. We are currently expanding
our capabilities and knowhow to serve this
market.
In 2016, we launched the new BOOST
program to enhance our operational excel-
lence. We operate in 63 manufacturing sites,
serving 16,000 ship-to-customers in over 100
countries with a wide product portfolio of
more than 2,000 products and we feel con-
vinced that we can extract more out of the
company in the future.
Kemira targets above-the-market growth.
Annual market growth in the respective
chemicals is estimated to be around 2% until
2020. For profitability, the target is operative
EBITDA margin of 14–16%. The range takes into
account economic cyclicalities. We have set clear
targets and launched purposeful initiatives how
we will improve our financial performance.
OUR KEY ACTIONS FOR HIGHER MARGINS
2014 2015 2016
AkzoNobel´s paper chemicals
business
New investments (Brazil and Finland), New TCM contracts
Optimization of operations: e.g.
logistics, sourcing, manufacturing
Recovery of shale market,
CEOR & oil sands
Advanced Water Treatment
Operative EBITDA margin
14-16%
Synergies from
acquisitions
End of 2016 run-rate Above 50% Below 50% Low Low Low
End of 2017 2018 2-3 yrs 3-5 yrs 3-5 yrsFull run-rate by
Pulp & Paper
BOOST- operational
exellence
Oil & Mining
Municipal & Industrial
Mid- to long-term target
11.8% 12.1%12.8%
14-16%

201617
EMPLOYER OF CHOICE – OUR JOURNEY SO FARWe aim to be an employer of choice by ensuring
that our diverse workforce enjoy a safe and
engaging working environment. We also strive to
attract, develop and retain the right mix of tal-
ented people for the continued success and
growth of Kemira.
BUILDING OUR SAFETY CULTURESafety is our first priority in all our locations
globally, and our long-term goal is zero harm to
people. We are continuously investing a lot of
training time and resources to further enhance
our safety culture. As an example, in 2016 we
started a group-wide Behavior Based Safety
program which will be rolled out to all locations.
During 2016, the frequency of reported injuries
per million hours worked (TRIF) decreased signifi-
cantly to 3.4, compared to 7.2 in 2015 (covers
both Kemira employees and contractors working
at our sites and facilities).
EMPLOYER BRANDINGDuring 2016, we renewed our employer brand
concept. We aim to offer employees the right mix
of opportunities and challenges in a global and
People – MAKING AN IMPACT TOGETHER
diverse working environment. Our result-oriented
and collaborative culture empowers employees to
solve the challenges of tomorrow in an inspiring
company, so that together we can have a major
impact on the future. We have started implement-
ing the new Employer Brand concept by renewing
our Kemira.com/careers site and the implemen-
tation will be completed during 2017.
LEADERSHIP DEVELOPMENTSkilled leaders are key to the successful execu-
tion of Kemira's strategy. We continue to help our
leaders to develop by running on-the-job learning,
stretch projects, coaching and mentoring
schemes, and development programs. In 2016,
494 leadership development activities were
completed, exceeding our target of 300 for the
year.
EMPLOYEE ENGAGEMENTAn engaged workforce is the cornerstone for
becoming the employer of choice. We currently
measure employee engagement with our biennial
Voices@Kemira survey and intervening pulse
surveys. In 2016, we ran a brief pulse survey,
whose results suggest that our employee engage-
ment levels are stable and in line with industry
norms. The latest Voices@Kemira survey was
done in 2015.
DIVERSITYWe are an equal opportunity employer. A total of
60 nationalities are represented in our workforce,
and our gender split is 74% male and 26% female.
The diversity of our workforce supports our
organizational performance. In 2016, we defined
the diversity principles for the composition of our
Board of Directors.
Making an
impact together
Delivering
innovation
We have
defined three
differentiating
themes for
our employer
brand:
Empowering your
full potential

18
Kemira’s main goal in terms of innovation is to
help our customers improve their process effi-
ciency and product quality to make us their first
choice. We innovate for the future through cus-
tomer collaboration, partnerships and open
innovation. We utilize the opportunities of digi-
talization to improve our own efficiency as well as
the services offered to customers.
Customers benefit by using our products and
solutions to:
• Improve product properties and quality
• Enhance process and energy efficiency
• Ensure that water quality meets end-use
specifications and regulatory requirements.
We focus on customer-driven, sustainable inno-
vation. Sustainability reviews are required at
every stage of Kemira’s New Product Develop-
ment (NPD) process to ensure that sustainability
criteria are met. These evaluations consider
impacts on Kemira’s own operations as well as on
customers’ processes. We also aim to identify
more sustainable alternatives for raw materials
with the help of our NPD process. We always push
for solutions that improve sustainability com-
pared to those already available on the market.
Our technical customer support in the field
provides a feedback loop to let us know how our
products are working in our customers’ industrial
facilities, how they are serving our customers,
and what needs our customers might have in the
Innovating togetherWITH CUSTOMERS
future, so we can develop our products further.
We are a technology house for chemistry, able to
tailor solutions and solve customers’ problems –
and this is an important differentiator in competi-
tion with our peers.
INNOVATING TOGETHER TO IMPROVE OUR CUSTOMERS WATER, ENERGY AND RAW MATERIAL EFFIENCY
→ 250 EXPERTS IN 3 R&D CENTERS IN FINLAND, CHINA AND US → 348 PATENT FAMILIES → 1,236 GRANTED PATENTS → 860 PENDING PATENTS

Polyacrylamide polymers and other process chemicals (24)
Coagulants (29)
Bleaching and pulping (10)
Ship-to countries
201619
63
Our globalnetwork
manufacturing sites

20
Profitability
Profitable growth drivers
GrowthIn line with Group target
Winning Formula – excel in basic game
Bleaching chemical capacity additions
New Total Chemistry Management (TCM)
contracts
Acquisition synergies
2 x market growth
62%
1
13.4
#
% LEADING global pulp and
paper chemical supplierof group revenue
Operative EBITDA
Market Position
Pulp & Paper

201621
Pulp & Paper
THE LEADING GLOBAL PROVIDER OF CHEMICALS FOR THE PULP AND PAPER INDUSTRY
Growth in the use of pulp & paper chemicals is driven by higher
production volumes for board and tissue grades. Kemira has
unique expertise in chemical applications, and we are well
placed to help our pulp & paper producing customers to
innovate and constantly improve their operational efficiency
and end-product quality. We are working to support our
customers through the transition to a bio-based economy, by
enabling production with fewer inputs, lower environmental
impacts and a reduced water footprint.

22
Pulp Packaging & Board,
Tissue & Specialties
Printing & Writing
RESULT 2016
EUR million, growth 3%
Revenue
Operative EBITDA
PRODUCTSShare of segment revenue:35% Bleaching and pulping 25% Strength and sizing20% Defoamers, dispersants, biocides
and other process chemicals10% Polymers10% Other (e.g. paper colorants)
MAJOR RAW MATERIALSAcrylonitrile, olefins, cationic monomer, tall oil soaps and crude tall oil, electricity, fatty acids, heavy fuel oil/natural gas, maleic anhydride, sodium chloride, sulfur
MARKET POSITIONS#1 IN EUROPE
#2 IN AMERICAS
#1 IN APAC
20%
40%40%
1,457
195EUR million, margin 13.4%
KEMIRA PULP & PAPER CUSTOMERS

201623
BUSINESS SPECIFICS
→ Strategic commitment to the pulp &
paper industry
→ Customer and application-driven
approach
→ Offerings adapted to regional
requirements
→ Innovative partner for customers in the
pulp & paper industry
KEMIRA'S COMPETITIVE ADVANTAGES
→ Application know-how
→ Product performance
→ Backward integration into key raw
materials
→ Comprehensive offering
→ Global reach
CUSTOMER VALUE
Improved
→ Process efficiency
→ End-product features and quality
→ Raw material, energy and water
efficiency: sustainable innovations
STRATEGIC OBJECTIVE2 x market growth with improved profitabilityHow?
→ Improve customer experience
→ Maximize capacity utilization
→ Manage fixed costs
→ Reduce complexity
→ Enhance performance culture
→ Invest in growth and R&D
2016 IN BRIEF → Volume growth continued, supported by Total
Chemistry Management deals in the APAC region,
and paper-to-board conversion start-up contracts
in the EMEA region.
→ Revenue growth impacted by lower sales prices
and unfavorable currency fluctuations.
→ Strong improvement in profitability, driven by
acquisition synergies, new production capacity,
higher utilization, and improved gross margin
→ Inauguration of a new bleaching chemical plant in
Ortigueira, Brazil for Klabin.
→ Synergy realization from the AkzoNobel´s paper
chemicals acquisition proceeded ahead of plan,
with the target increased from EUR 15 million
to EUR 20 million. Current run-rate at the end of
2016 was EUR 14 million. Contract manufacturing
insourcing successfully completed in the Americas.
Insourcing progressing according to plan in the
EMEA and APAC regions, with completion expected
during 2017.
→ Announcement of new line for bleaching chemical
capacity in Joutseno, Finland. The new capacity is
expected to come into operation during the fourth
quarter of 2017.
MARKET OUTLOOKOur Pulp & Paper segment is expected to grow at double the market growth rate. The market’s compounded annual growth rate (CAGR) is estimated to be 1.0%. The majority of the growth is expected to occur in emerging markets in South America and the APAC region. Though market growth in the APAC region is expected to slow down slightly, it is still expected to be some 2–3% per annum. There is also an increased demand for pulp chemicals in the Nordic region, where several expansion projects are ongoing or have been announced. Thanks to our comprehensive offering, our global reach and our strong application knowhow, Kemira remains well positioned to serve the pulp and paper industry.

* in polyacrylamide polymers
24
Oil & Mining
Profitability
Profitable growth drivers
Growth
Operative EBITDA
Market Position
Over-the-cycle profitability in line or above the Group target
Recovery of shale market CEOR - tailored polymers for harsh conditions in Chemical Enhanced
Oil Recovery
Oil sands – tailings treatment
Double-digit growth-% over-the-cycle
13%GROWING chemical supplier to
oil, gas and mining
industries of group revenue
2*
5.9
#
%

201625
Oil & Mining
INNOVATIVE KNOWHOW ON CHEMICALS AND APPLICATIONS FOR THE OIL, GAS AND MINING INDUSTRIES
Kemira provides a unique combination of knowhow on innovative
applications and chemicals that can improve process efficiency
and yields in oil, gas and metals recovery. We tailor chemistries
for specific process needs, ensuring each customer has the most
cost-effective and best-performing product for their particular
application and field. We help our customers to extract oil, gas
and certain ores with higher resource efficiency, getting more out
of existing resources, while also utilizing less water and energy.

26
Other industries
through distributors
Oil & Gas
Mining
RESULT 2016
EUR million, growth -12%
Revenue
Operative EBITDA
PRODUCTSShare of segment revenue:60% Polyacrylamide polymers40% Other products such as
dispersants, antiscalants, biocides, emulsifiers, defoamers
MAJOR RAW MATERIALSAcrylonitrile, acrylic acid, various monomers
MARKET POSITION#2 IN GLOBAL POLYACRYLAMIDE POLYMERS
PRODUCTION
25%
40%35%
310
18EUR million, margin 5.9%
KEMIRA OIL & MINING CUSTOMERS

201627
BUSINESS SPECIFICS
→ Application-driven approach
→ Focus on rapid innovation to solve our
customers’ critical challenges
KEMIRA'S COMPETITIVE ADVANTAGES
→ Innovative knowhow on chemicals and
applications
→ 2nd largest manufacturer of
polyacrylamides worldwide
CUSTOMER VALUE
Improved
→ Process efficiency
→ Yield
→ Cost efficiency
→ Water efficiency
→ Energy efficiency
→ Compliance with environmental
regulation
STRATEGIC OBJECTIVERecovery in shale business, and growth in new applications like Chemical Enhanced Oil Recovery and oil sands.
How?
→ Improve customer experience
→ Maximize capacity utilization
→ Manage fixed costs
→ Reduce complexity
→ Enhance performance culture
→ Invest in growth and R&D
2016 IN BRIEF → Revenue decreased due to weak oil and gas
markets.
→ Signs of recovery in the US shale oil and gas market
towards the year end, albeit fragile and at early
phase.
→ Further business gained in the Canadian oil sands
market.
→ Progress in the development of tailored products
for Chemical Enhanced Oil Recovery (CEOR).
→ Restructuring of a manufacturing plant in Botlek,
Netherlands.
→ Continue to selectively grow our process industry
portfolio.
MARKET OUTLOOKVolatile market conditions are likely to continue going into 2017. Being a technology and value provider, Kemira is well positioned to weather the fluctuations in the market. Recovery of shale market, oil sands and Chemical Enhanced Oil Recovery (CEOR) present long-term growth opportunities in Oil & Mining segment.

28
Municipal &Industrial
Profitability
Profitable growth drivers
Growth
Operative EBITDA
Market Position,EU & North America
Slightly below Group target
Geographic expansion Expansion in product offering Advanced Water Treatment (AWT)
Steady growth of 2-4%
25%MARKET LEADERin water treatment
chemicals in Europe
and North America of group revenue
1
14.9
#
%

201629
Municipal &Industrial
MARKET LEADER IN RAW AND WASTE WATER TREATMENT CHEMICALS
The market for Kemira’s Municipal & Industrial segment is driven by
regulation. Kemira is helping municipalities, private operators and
water intensive industries to advance through the transition
towards a circular economy by enabling water to be reused, and by
improving the efficiency of water treatment at every stage of water
management. We are the leading chemicals supplier for raw water,
waste water and sludge treatment applications in Europe and North
America, and the only manufacturer offering a full product portfolio
of coagulants, polyacrylamide polymers and other water treatment
chemicals. This makes our position in the market unique.

30
Industrial customers Municipal customers
RESULT 2016
EUR million, growth -2%
Revenue
Operative EBITDA
PRODUCTSShare of segment revenue:65% Coagulants20% Polyacrylamide polymers 15% Other products such as antiscalants,
defoamers and biocides
MAJOR RAW MATERIALS → 60–70% secondary input materials:
participating in local and flexible by-product
streams
→ Acrylonitrile, sulfuric acid, hydrochloric acid,
aluminum hydrate, iron ore, pickling liquor,
copperas (ferrous sulfate)
MARKET POSITIONS#1 IN EUROPE
#1 IN NORTH AMERICA
60%40%
596
89EUR million, margin 14.9%
KEMIRAMUNICIPAL
& INDUSTRIAL CUSTOMERS

201631
BUSINESS SPECIFICS
→ Regulation-driven business
→ Local business
→ Municipal tenders
→ Raw material backward integration
→ Large customer base
KEMIRA'S COMPETITIVE ADVANTAGES
→ Security of supply, speed, and logistics
flexibility
→ Expertise and decades of knowledge in
water treatment applications
→ Comprehensive portfolio
→ Backward integration into other
industries’ by-products through long-term
partnerships
→ Extensive manufacturing network in mature
markets
CUSTOMER VALUE
Improved
→ Water treatment process reliability and
efficiency: total water cycle management
→ Regulatory compliance and beyond
STRATEGIC OBJECTIVESteady growth and cash flow generationHow?
→ Further strengthen the base business in raw
and waste water treatment
→ Build on top of our strong existing customer
base with innovation-driven Advanced
Water Treatment applications
→ Selective geographic expansion in Middle
East, Africa and APAC
→ Expand product offering by introducing
existing products into new markets
MARKET OUTLOOKOur Municipal & Industrial segment’s strategic intent is to grow by 2–4% annually, and to further improve profitability and maximize cash flow. For us to achieve greater growth figures, water treatment will need to be more strongly regulated and enforced – especially in emerging markets.
2016 IN BRIEF → Volume growth in line with market growth. Lower
sales prices have impacted revenue development.
→ Market position remains strong in our key markets.
→ Advanced Water Treatment initiatives progressing
well, e.g. on-line monitoring and control based
applications for sludge dewatering and odor
control.
→ Strong operative EBITDA margin improvement
from 13.7% to 14.9%, driven by better operational
performance, customer focus and lower raw
material prices.
→ North American business impacted by raw material
supply disruption, which was solved operationally
during the year.
→ Closures of manufacturing plants in Zaramillo,
Spain, and Ottawa, Canada.

32
KEMIRA
RISKS & OPPORTUNITIES
→ Systematic monitoring of market development
→ Focus on improved sustainability of products and solutions
→ Customer intimacy and innovation
→ Geographic and customer-industry diversity
→ Comprehensive & diversified portfolio
→ Flexible manufacturing network with competitive scale
→ Active communications spotlighting the benefits of Kemira’s technologies
→ Regular strategy reviews to reflect changes in the competitive situation
→ Close follow-up of competitive activity
→ Investments in competencies and capabilities
→ Differentiation and customer intimacy
→ Participation in market consolidation and active M&A monitoring
→ Continuous systematic and joint development of new product and service concepts
→ Proactive follow-up and participation in regulatory discussions relating to chemical substances, water treatment and the circular economy
→ Active evaluation of alternatives to debated substances
→ Focus on R&D: innovations enabling more efficient use and recycling of resources
→ Increased focus and resource allocation for company compliance matters (incl. trade compliance)
→ Comprehensive strategic approach to sourcing
→ Strategic purchase contracts, backward integration, tracking of prices of key raw materials
→ Captive manufacturing of critical raw materials
→ Strategic investment in energy-generating companies, and the hedging of a portion of the Group’s energy and electricity spend
OPPORTUNITIES OPPORTUNITIES OPPORTUNITIESOPPORTUNITIES
RISKS
RISKS
RISKS RISKS
→ Large customers looking for a strategic supplier with a global footprint and commitment to their line of industry
→ New product and service concepts such as all-encompassing chemistry management and increased use of digitalization
→ Sustainability and compliance aspects emphasized in partner selection
→ Efficiencies brought by active price and inventory management and forecasting
→ Bio-based materials increasingly favored as an alternative to fossil-based materials
→ Increased demand for chemical treatment of water, due to stricter regulation and enforcement
→ Regulatory developments expected to favor recycling and reuse of resources
→ Further decline in demand for printing and graphical paper grades, leading to mergers and mill closures
→ Prolonged/further slowdown in oil, gas and mining activity, due to soft market conditions
→ Shift in demand towards water treatment technologies with lower chemical consumption
→ Unforeseen customer production slowdowns
→ Major competitor or customer consolidations that could reshape market positions
→ New standard commodity chemical producers entering the market
→ Regulatory developments creating pressure to replace chemicals with other substances or technologies
→ Bans/restrictions on substances used in Kemira’s production
→ Changing regulations on import/export and customs, increasing the need to effectively monitor and master global trade compliance
→ Increased costs impact profitability
→ Dependency on a single source for raw material supply
→ Breaks or disturbances in the availability of key raw materials
CHANGES IN COMPETITION
CHANGES IN RAW MATERIAL COSTS & AVAILABILITY
CHANGES IN LAWS AND REGULATIONS
→ Rising demand for sustainable solutions for: packaging, board and tissue grades; chemistries enabling water recycling and reuse; and technologies enabling unconventional oil and gas recovery and enhanced conventional oil recovery
CHANGES IN CUSTOMER DEMAND
MANAGEMENT APPROACH MANAGEMENT APPROACH MANAGEMENT APPROACH MANAGEMENT APPROACH

201633
→ Continuous identification of high potentials and key competencies for meeting future needs
→ Development and improvement of compensation schemes, learning programs, and career development programs
→ Systematic approach and commitment to employee engagement
→ Collaboration with educational institutes, employer branding
→ Systematic focus on achieving set targets and implementing certified management systems, efficient hazard prevention programs and related reporting, crisis management procedures, and personnel competency development
→ Insurance programs protecting the company against the financial impacts of eventual hazards
→ Systematic risk analyses and continuous improvements in procedural, technical and physical protection mechanisms
→ Customer intimacy and co-creation
→ Innovation metrics and sustainability checks
→ Differentiated products and technologies, application knowhow
→ Monitoring and scouting for new technologies
→ Ensuring adequate marketing and technical sales expertise and training
OPPORTUNITIES OPPORTUNITIES OPPORTUNITIES
RISKS
RISKS
RISKS
→ Attractive employer status in many areas, thanks to market-leading knowhow and people processes
→ Ability to demonstrate high performance and compliance with standards and expectations, giving us an advantage over smaller players
→ Kemira’s ability to innovate for resource efficiency, circular economy and bioeconomy together with customers
→ Key talent attracted by value chain players
→ Possible harmful incidents such as process safety deficiencies, machinery breakdowns, environmental damage, or employee health and safety incidents, together with the consequent financial losses and brand damage
→ Unauthorized IT system access or damage caused by computer malware/viruses, resulting in physical damage or financial losses
→ New disruptive technologies by competitors
→ Slow product portfolio renewal, lack of differentiation
→ Failure in raising awareness regarding new products and service concepts and related competitive advantages
COMPETITION FOR KEY TALENT
POTENTIAL FOR HAZARD & REPUTATIONAL DAMAGE
ADVERSE DEVELOPMENTS IN INNOVATION CAPABILITY GEOPOLITICAL
CHANGES
OPPORTUNITIES
→ New geographical markets become accessible
RISKS
→ Business interference or other adverse consequences caused by political actions, trade-related political decisions or economic uncertainties, either globally or in countries strategically important to Kemira
→ Continuous monitoring and consideration of geopolitical movements and changes, followed by appropriate business adjustments
MANAGEMENT APPROACH MANAGEMENT APPROACH MANAGEMENT APPROACH MANAGEMENT APPROACH