Embed Size (px)
Citation preview

T h e M o n t h l y
BUSINESS REVIEWCovering business and industrial conditions in the Rurth Extend ReserveDistrict
FEDERAL RESERVE BANK o f CLEVELANDD .C .W il ls , C h a irm a n o f -die B oard
(COMPILED SEPTEMBER 20. >921)
VOL 3 CLEVELAND. OHIO. NOVEMBER I. 1921 N*. 11
THE time is near when business can safely throw away its crutches. Nearly all our reports agree that the improvement shown last month is hold
ing up well. In some lines the production throttle has been opened another notch to meet increasing demands.
There are still too many smokeless stacks in the steel sections. The blowing in of new furnaces is encouragingly reducing this number.
As the building industry finds its stride, it is a reassuring sight to see the steel frame work springing up over the District, rather than to watch structural steel rusting in the yard.
These facts, together with others, tend to dim the ugly specter of unemployment. A brief comparison with last year’s activities is a good tonic for pessimism.
Last year when the crop moving season was at its height there was an especially heavy agricultural demand for funds from other Federal Reserve banks. In comparison with last October this demand during the past thirty days has been practically negligible.
About this time last year the weakness of the iron and steel industry was casting gloom over all lines of business, as this industry is looked upon as the barometer of business. The cancellation of orders was a common occurrence. Today this barometer indicates a steady improvement.
During October last year the railroads reported a pick-up in business, due largely to a plentiful supply of labor and a surplus of goods. It could only be temporary. Now any improvement in this direction has substantial business to back it.
A year ago, automobile and tire manufacturers were overstocked and sales were falling off. Recent reports indicate sales are holding up well. Production is now being determined by demand.
Last fall building was hesitating in anticipation of lower costs. Labor troubles gave out a jarring note. The recovery this fall has been even more rapid than was expected.
These developments are only a part of the transition—a transition not as yet completed, but gradually working toward dependable business.
When business will return to so-called normal is a question we are all asking; but who can give us the day or hour? In looking for the answer we should bear in mind that the survival of the fittest is not always the survival of the best, nor is business at its flush always business at its best.
Criticisms and suggestions are often too freely offered, but, as usually happens, we return to the “ time-will-tell’ ’ starting point. Credit, as well as business, is based on faith. The accusation that the other fellow is the main sprag in the wheels of business weakens this faith; and in so far as faith is weakened, business is weakened.
Little Change in Banking Situation; Acceptance Market Shows Less Activity
There has been considerable fluctuation in the demand for accommodations from member banks during the past thirty days. One week may bring a reduction in the amount of loans while the next may Bhow a marked upward trend. At this season of the year there is usually a call from other Federal Reserve banks for crop moving funds, but as compared with last year the demand this year has been practically negligible.
While the marketing of crops has been going on rapidly, country banks so far have experienced few good effects. Liquidation of loans has been very slow, as many farmers are in need of money for the
purchase of goods to carry them through the winter. Country banks report an increasing demand from farmers for funds to buy stock to fatten during the winter.
Combined reports of 18 large savings banks and trust companies in the Fourth District show a decline in total time deposits of 1.7 per cent for September 30, 1921, compared with the same period last year, and a decline on September 30, 1921, as compared with the previous month of 0.4 per cent.
Of twenty reporting accepting banks, seven indicate acceptances executed for customers during September, $2,865,122, and eleven banks report accept
ON PAGES 8 TO 10 WILL BE POUND A SPECIAL REPORT ON THE OLAY PRODUCTS INDUSTRYDigitized for FRASER http://fraser.stlouisfed.org/ Federal Reserve Bank of St. Louis
2 T H E M O N T H L Y B U S I N E S S R E V I E W
ances paid during the same period, $3,561,964. Predominating classifications are coal, oil, and tractors for domestic shipment. Bankers’ acceptances bought by the Federal Reserve Bank of Cleveland during September, 1921, amount to $3,168,127, and the amount paid, $2,808,507.
The acceptance market was dull throughout the month. Bills are scarce, and the rates steadily declined to their present level of 4^ per cent. This was partly due to the scarcity of bills and to the lower level of call money rates in New York. This credit instrument indicates a general liquidation of frozen credits with domestic shipments being sold in “ spot” and otherwise being taken care of through the channels of straight loans.
Few bills were originated against domestic shipments and on warehouse receipts. The majority of
bills, accepted by the banks in the District, were participations of old syndicates and a few bills against foreign transactions.
The demand throughout the month has remained practically the same as in the previous month. In the first week or so, when the rates first began falling, there was a lull, but as the month progressed some idle funds accumulated, and the demand for bills was better. Prime bills were still scarce, which, together with the low rate, had a tendency for idle funds to seek other investments.
The rates for prime eligible bills are as follows:Under 30 days............................41 to 4 # per cent30 to 60 days............................. 4^ to 4 # per cent60 to 90 days..............................4^ to 4 # per cent
Interest in Iron and Steel Industry Centers on Freight Rates; Production Increasing; Pig Iron Prices Firmer
Speculation over the probability of a general readjustment of iron and steel freight rates in the near future has injected a new and commanding factor into the trade position of that industry. The conviction is strong in the industry that the present freight costs, both of raw materials for manufacture and on finished products which have been increased 125 per cent or more since pre-war times, are seriously retarding the return of normal business activity. A reduction of 28 per cent in iron ore freight rates in central classification territory put into effect by the railroads Oct. 18, has ben accepted by the iron and steel industry as the entering wedge to a complete readjustment of freight tariffs in iron and steel. Events of recent days leading up to the threat of a general railroad strike by the unions, it is believed, have so crystallized the issue of freight rate revision from the viewpoint of national welfare, that some important developments of a constructive character will shortly appear.
With a disposition to regard lower freight rates as the most imperative need of the moment, producers and consumers of iron and steel have manifested comparatively little anxiety over the prospects of a strike and a tie-up of transportation. Some consumers hav6 been pressing producers to hurry forward shipments of material in larger quantity in order to accumulate some stocks in their yards for any eventuality. Some disposition to hold back new buying in consideration of the possibility that lower rates may bring about lower prices, also is apparent.
New business generally in iron and steel during the latter part of October was in lighter volume than during the several weeks preceding. However, the mills and furnaces previously had been enabled to accumulate considerable backlog and production has been on the increase. Consumers have been specifying freely against old orders as it is apparent that stocks generally in their hands have been reduced to a low point, and this fact, in conjunction with the fair volume of new business, has produced a mild
improvement of the position of the whole industry and a more cheerful sentiment.
For the first time in some months, the industry is operating close to 50 per cent of ingot capacity. The lighter lines, such as sheets, tin plate, wire, etc., are making the best showing, but the heavier materials have been sluggish and further improvement of production apparently will hinge upon the expansions of the latter. Sheets have led all other products and have exhibited a widely diversified demand under which mill operations have been raised to an average of 80 to 90 per cent. On October 1 the independent sheet mills had orders on their books to take up their capacity for seven weeks ahead. As a result of this situation, one general advance of $5 a ton has been recently established and another of equal amount has been announced by a number, although not by all of the mills. Sheet bars have moved up $3 to $4 a ton from their recent low point. Some strip steel producers also have advanced their prices. Softness has continued in most of the other finished steel lines despite the efforts of some leading producers to hold for a higher schedule.
The pig iion situation continues to show a slow but progressive improvement. September proved to be the best month of the year in new bookings and shipments by the furnaces and October has been maintaining this record with the probabilities of a slight increase Prices in pig iron, while firmer as a whole, still show soft spots, notably at Chicago and in the valleys. The steel making irons especially have been irregular. The composite market average
by Z S n f i f S to t r w a t k V o e ffi Srt„°dV 8.U to5°M yraP,rCd With W5'34 Sep,em‘
Stimulating effects on the lake iron ore movement for the remainder of the season from the 28 per“ e£t reduction ,n rail rates promises to be small WUh the shipping season rapidly nearing the close it is estimated that probably not more thin 2,000,0<M> tons
Digitized for FRASER http://fraser.stlouisfed.org/ Federal Reserve Bank of St. Louis

T H E M O N T H L Y B U S I N E S S R E V I E W 3
will be affected. However, 9,000,000 to 10,000,000 tons of ore on lower lake docks will take the reduction when it is moved forward to the furnaces.
One Mahoning Valley steel works will bring down100,000 tons more than originally planned as a result of the reduction.
Definite production statistics for September in pig iron and steel reflect the gradual expansion of the industry. The output of pig iron in September according to the compilation of The Iron Trade Review was 975,912 tons compared with 954,901 tons in August and on a daily basis 32,530 tons compared with 30,802 tons in the preceding month. The Sep
tember gain followed the first increase in August after nine months of decline. October, it is indicated, will show a further increase in production as the number of furnaces in blast September 30 was 84 compared with 69 on the corresponding date a month previously. Steel ingot production in September, according to the American Iron and Steel Institute, was at the rate of 17,350,000 tons annually. This compares with an annual rate of 15,570,000 tons in August. The September rate of output represents approximately 40 per cent of the record ingot year of 1917.
Ore and Coal Shipments Fall Off as End of Shipping Season Approaches; Lake Boats Laying Up For Winter
The ore movement is slowing up fast and the indications are that the total for the season will not reach 23,000,000 tons. The shippers say that the reduction of 28 per cent in the rail rate from Lake Erie ports to the furnaces, which became effective October 18, will not bring out any orders worth while as the plants have good stocks on hand. The cut in the rail rate delayed the movement some and a number of cargoes that would have been sent forward in October were carried over until November. Some of the shippers are through for the season and according to the present line up shipments for November will be very light and practically all the ore will be carried by vessels that are operated by shippers. The fleet only loaded 3,913,122 tons of ore in September compared with 4,329,158 tons in August and 4,047,687 tons in July. The mines in the Lake Superior district up to October 1 sent forward 18,611,194 tons or 25,612,162 tons less than for the same time last season when the movement was 44,273,356 tons.
Stocks at the furnace yards are heavy and there is more ore in store at the Lake Erie ports than there was a year ago. On October 1 the docks at this end of the route were holding 9,661,365 tons and on the same date in 1920 stocks were 9,203,206 tons. The docks at Cleveland and Conneaut handled more than half the ore that was delivered at Lake Erie ports
up to October 1. The movement will be the smallest for many years and the total will not be much greater than the soft coal movement.
Coal shipments for September were 2,200,473 tons making the movement for the season up to October 1, 18,148,236 tons. Shipments for the same time in 1920 were 14,604,393 tons, 1919, 17,681,223 tons and 1918, 20,778,250 tons. Coal is not going forward from the upper lake docks any faster. The clean-up will be much earlier than last season when a large number of cargoes were shipped in December. Shipments for November will be very light although some of the railroads have decided to continue to carry October coal at a cut of 28 cents a ton after November 1.
Tonnage is offered freely in the grain trade owing to the scarcity of ore cargoes and rates are low as a large number of big carriers are on the market. Boats that were placed ahead are taking a large amount of the grain and the demand for tonnage has been light the past two weeks. A large number of steamers were placed for storage cargoes at rates ranging from 2% to 4 cents and a number of boats are holding cargoes at the receiving ports. Practically all the outside boats will be up on their ore contracts by November 1 and some of them will have to go to the dock for the winter as the grain trade will not take care of all the tonnage.
Manufacturers Report Slight Improvements; Automobile Industry Shows Little Change
A marked improvement was shown last month in many lines of manufacturing, and reports from Fourth District manufacturers this month quite generally indicate that business continues to hold up well. Some important plants are now running at full capacity and the number of unemployed throughout the country is showing a slight decrease as employers take on additional help.
There has been little change this month in the automobile industry. The price cuts have now lost much of their selling punch and competition is becoming keener. Buyers want a better car, priced fairly, and with no reduction in the quality of the goods that are used in its construction.
A large truck manufacturer reports September sales 8 per cent over those for August, and August sales 10 per cent over those for July. Orders are coming in at a good rate. The sales are not restricted to any certain line, but are widely scattered. Large companies are beginning to order in small quantities. The truck business is less satisfactory in other parts of the District and in marked contrast to this favorable outlook is the report of another prominent truck manufacturer that orders during the past thirty days have been slower than at any previous time this year.
Business in the hardware manufacturing line is still very dull but the first part of August as com
Digitized for FRASER http://fraser.stlouisfed.org/ Federal Reserve Bank of St. Louis

4 T H E M O N T H L Y B U S I N E S S B E V I E W
pared with July brought a slight increase. Indications point to a slow return to normal.
The tool manufacturing business is about holding its own. While there has been a little gain as compared with July, general business has not yet reached the place where the small tool trade can materially increase its production.
Paint manufacturers report business as very satisfactory. There has been a decided increase in orders and a greater confidence is indicated in the dealers trade. Many factories are working overtime to fill orders. While manufacturers anticipate an easing off in the demand during the winter months, they also see an increased activity in the dealers lines for spring. A white lead manufacturer reports September business as close to normal and that orders are coming in fast enough to keep the mills busy.
There has been no special change in the tin can industry during the past month, but a gradual improvement has been in evidence since the middle of the summer. This increase in business is attributed to the fact that the jobber has reduced his stock to
take care of loans and is now in the market for goods to a greater extent than he was last spring.
The cork business is reported to be running about the same as last month. Sales have shown a slight decline.
The month of May marked the low point in the heavy hoisting machine industry, and with the exception of a little improvement after this time there has been no noticeable change. The majority of orders placed are for labor saving equipment.
August and September were the best months so far this year in the storage battery business. At present there is a slight decline that is customary at this time of year.
Improvement in the printing and lithographic ink business has been especially noticeable during the past thirty days and is thought to be the result of depletion of inventories throughout the country.
In the laundry machine line, business is reported to be running almost uniform for the past three or four months, and as showing no increase up to the present time.
Pulp and Paper Industry Shows Evidence of Increased Activity; Box Board Business Erratic
Developments during the past thirty days indicate a definite improvement in the paper manufacturing industry more noticeable than at any time since the first of the year. While the principal grades of paper are not all experiencing an equal pick-up, nevertheless all show improvement. A number of mills have again resumed a full time operating schedule after many months of part time operation. Orders have increased materially in volume and inquiries are more numerous. In a greater number of cases, these are leading to the actual placing of orders instead of being merely feelers as they were during the early part of the year to a great extent.
Buyers are now willing to place a larger volume of tonnage and anticipate their requirements for a longer period of time than has been the case during the current year. Some of the raw materials, notably waste papers, have strengthened in price quite materially, with the natural result of convincing buyers that the bottom has been reached. Stocks
in distributors’ and consumers’ hands are undoubtedly lower than they have been for some time past. A certain amount of the present improvement is attributed to seasonal activity as there is always a favorable reaction in the paper business about the first of October after a dull period during the summer time.
Mills in the Fourth District report that orders have increased to about 70 per cent of normal and that business has shown a continuous improvement since January. Paper manufacturers have taken advantage of the dull period and have installed new machinery and the result is that they are now in a good position to meet increasing production demands.
Business in the box board industry continues erratic. Orders today are better than they were three months ago, but they are still quite a distance from normal. This is normally the busy season of the year, in this particular line, but there is some uncertainty as to how long the present improvement will last.
Rubber Industry Slowing up as Winter Season Approaches; Inventories Materially Reduced
Fundamentally the rubber industry is in very good condition at the present time. Sales naturally show a decrease at this season of the year and this is particularly true of the tire division. This is partially offset, however, by the increasing tendency to run cars all winter, which helps to equalize production and demand.
Rubber footwear, rubber clothing and druggists’ sundries are always in greater demand during the winter months.
Efficiency has increased greatly. A year ago approximately 70,000 workers were employed in the Akron rubber district. Figures recently compiled show that 30,000 workers wore producing 85 per cent
of last year’s output. Big cuts have been made in overhead expenses. One large plant employing 1,500 office people 14 months ago, at present is reported to be producing more goods with an office force of 300. Many departments and services inaugurated during previous years of prosperity are now being abolished.
Business in mechanical rubber goods continues good. This end of the industry is continually branching out as new uses for rubber are discovered and new products are placed on the market.
The tire business in Akron is estimated to be running about 70 per cent of the peak which was reached about August first of this year. This is a very eood showing in view of the fact that strong efforts have
Digitized for FRASER http://fraser.stlouisfed.org/ Federal Reserve Bank of St. Louis

T H E M O N T H L Y B U S I N E S S R E V I E W 5
been made this year to reduce inventories. At present, stocks of manufactured rubber goods are low, and it is the opinion of manufacturers and dealers that the sale of tires through the winter months will show an improvement over last year.
In some localities, plants continue to operate at full capacity and orders are still coming in. Dealers are reported to be ordering from hand to mouth and availing themselves of the discounts allowed for cash payments. The surplus of crude rubber is large and amounts to approximately 300,000 tons.
The fall of 1920 brought rubber men face to face with the annual paring of production schedules, and in addition, a dark outlook for general business. Without adequate or complete statistics, the industry suddenly discovered that there was a surplus of tires in the country due to lack of usual purchases by car owners.
Statistics are now being gathered and the following interesting statement was recently given out by the Rubber Association of America:
TEN MONTHS’ PRODUCTION FIGURESReport of Inventory, Production and Shipments (domestic) of Pneumatic Casings, Tubes and Solid Tires.
“ Production” and “ Shipments” figures cover the entire month for which each report is made. “ Inventory” is reported as of the last day of each month.
“ Inventory” includes tires and tubes constituting domestic stock in factory and in transit to, or at, warehouses, branches (if any), or in possession of dealers on consignment basis, and as a total represents all tires and tubes still owned by manufacturers as a domestic stock.
“ Shipments” includes only stock forwarded to a purchaser and does not include stock forwarded to a warehouse, branch, or on a consignment basis, or abroad.
PNEUMATIC CASINGS No. Mfgrs.
Month Reporting Inventory Production ShipmentsNovember, 1920 36 5,880,016 649,742 806,023December, 1920. 43 5,508,380 506,111 1,327,153January, 1921.. 45 5,319,605 703,430 965,417February, 1921. 45 5,193,018 819,892 1,073,756March, 1921 April, 1921.. . May, 1921...
46 4,597,103 1,163,314 1,614,65149 4,527,445 1,651,418 1,785,95159 4,451,668 2,100,917 2.085,882
June,1921...... 63 4,154,456 2,313,265 2,643,850July, 1921 . 63 3,892,037 2,570,524 2,757,581August, 1921.. 66 3,931,583 3,043,187 2,894,442
INNER TL'BES
MonthNo. Mfgrs. Reporting Inventory Production Shipments
November, 1920. 40 6,131,935 742,815 920,938December, 1920. 43 5,786,929 508,446 1,481,285January, 1921... 47 5,586,163 740,824 1,042,617February, 1921.. 46 5,415,464 916,627 1,129,881March, 1921 48 5,044,861 1,346,483 1,643,690April, 1921....... 51 4,916,772 1,762,122 1,983,571May, 1921........ 57 4,751,880 2,210,040 2,342,567June, 1921........ 60 3,835.098 2,359,928 3,232,673July, 1921 61 3,122,815 3,020,981 3,603,248August, 1921... 64 3,649,319 4,430,152 3,804,060
Month
SOLID TIRES No. Mfgrs.Reporting Inventory Production Shipments
November, 1920. 11 298,875 21,355 34,217December, 1920. 12 303,473 16,297 40,828January, 1921... 12 303,753 21,220 29,116February, 1921.. 12 304,374 23,365 29,599March, 1921 12 283,800 28,710 43,926April, 1921 12 269,985 28,859 42,080May, 1921........ 12 264,633 35,156 40,122June, 1921 11 240,336 28,395 49,867Julv. 1921......... 11 220,003 35,123 55,678August, 1921... 11 216,367 55,694 66,866
Marked Increase in September B u ild in g ]O p era tio n s ; Investors Still Uncertain
For some time past, various lines of building have been showing increased activity. Last month a noticeable improvement was in evidence and the recovery up to the present time has been even more rapid than was expected. September operations went forward rapidly with residential construction in the lead.
As a profitable investment in the building industry depends to a great extent on the initial cost of construction and the future trend of prices, and as the latter factor is so uncertain at this time, investors are still hesitating to enter the construction field. This is one of the chief retarding factors in construction work. Building and loan associations are showing considerable interest in the problem of how to properly finance home construction.
The American Building Exposition scheduled for January 4-14 in Cleveland is being planned with a view to stimulating both the home and commercial building program, by showing that the prices of building materials have reached a reasonably low level.
The valuation of permits issued in thirteen of the leading cities in the Fourth District for September shows a marked gain over August. While the total August valuation for these cities shows an increase of only $116,472 or 1 per cent as compared with last year, September brought a gain of $2,107,223 or 21.4 per cent. Elsewhere in this issue may be found a table showing building operations in the Fourth Fed* eral Reserve District for the month of September.
Digitized for FRASER http://fraser.stlouisfed.org/ Federal Reserve Bank of St. Louis

6 T H E M O N T H L Y B U S I N E S S R E V I E W
Fall Work on Farms Nearing Completion; Marketing of Crops Progressing Rapidly;
Burley Tobacco Prospects Good
The growing season has practically ended and late fall work is rapidly nearing completion. With the exception of some late corn and tobacco in the southern part of the District that is now maturing rapidly, very little harvesting remains unfinished. Weather conditions have been unusually favorable for late crops, and the absence of frost has given practically the entire corn crop a chance to mature.
According to government estimates the forecast of the Ohio corn crop is 150,000,000 bushels. This amount is 9,000,000 bushels above the five year average but 12,000,000 less than last year’s crop. Farmers are taking advantage of the good weather and husking is progressing rapidly. Damage from cinch bugs is reported to be severe in some sections. The West Virginia corn crop promises to reach approximately 21,683,000 bushels, a slight decline from last year, when a total of 22,100,000 bushels was reached. In Pennsylvania the condition of the corn crop on October 1 was estimated at 94 per cent of normal, indicating a production of 69,011,000 bushels as compared with 67,050,000 last year.
More than half the wheat crop in Ohio has left the farmers hands, an indication that the marketing of crops is going on rapidly this season. Winter wheat seeding has made good progress. It is reported that the acreage will show a slight decline and this is attributed to the high cost of production and the low prices received this year.
Prospects for white potatoes have improved slightly since last month, however, disappointing yields are reported in many sections. The quality of the crop is quite generally good. Sweet potato prospects are fair.
No development of outstanding importance is reported m the Burley Tobacco district. The majority of the crop was saved by rain which came at a very opportune time. There has been no recurrence of
wild fire on any extensive scale, but some loss from house burning’ ’ during the curing period is
reported.The reduced acreage and the favorable reports
from the Carolina market, which serves as a sort of barometer for Kentucky, has led farmers to anticipate a good market.
Soft Coal Production Climbing; Retail Business Improves; European Exports Decline
Production of soft coal is again on the up grade. The first week in October showed a continued improvement and for the first time since January the nine million-ton mark was passed. The total output is estimated at 9,105,000 net tons, an increase over the preceding week of 222,000 tons or 2.5 per cent. However, production is still considerably below normal, for with industry active and a fair export business, the October output usually runs at least 11,000,000 tons a week.
In round numbers bituminous coal production for the year 1921 is 55,000,000 tons behind 1919 and 106,- 000,000 tons behind 1920. The United States Geological Survey reports estimated production as follows:Week ending September 17 -----8,187,000 net tons.Week ending September 24 . . . . 8,527,000 net tons.Week ending October 1 .............8,883,000 net tons.Week ending October 8 .............9,105,000 net tons.
Coal dealers in this District report that business continues to show a good healthy improvement, and that operators have received more inquiries during the past few weeks than they have had all summer. The retail business has been greatly stimulated by the recent cool weather and with winter near at
hand, coal bins are being stocked. While industrial consumers quite generally are still ordering in small quantities, they are beginning to realize that April first, at which time the miners’ present wage scale expires, is not very far in the future, and also that the railroads may not be able to meet all requirements if every one continues the hand-to-mouth policy too long.
The settlement of the English miners’ strike has caused European coal exports to fall off rapidly. The bunker coal trade continues to grow in volume and increased from 5.8 million tons in 1918 to 9.4 million tons in 1921. There has been a considerable increase in exports of bituminous coal to Mexico during the first eight months of 1921, shipments amounting to133,000 tons as against 99,000 tons in the same months of last year.
Conditions in West Virginia and Kentucky fields are not very favorable and production is still low Some good effects are noticeable as a result of the improvement in the iron and steel industry, but industrial demand does not show any great amount of activity. A few extra men have been employed but mines as a rule are not uniformly active.
Digitized for FRASER http://fraser.stlouisfed.org/ Federal Reserve Bank of St. Louis

T H E M O N T H L Y B U S I N E S S R E V I E W 7
Transportation Situation Shows Gradual Improvement; Rolling Stock in Need of Repairs
While the month of September brought no great change in the local transportation situation, there has been a slow but gradual improvement and this has been especially evident during the past few weeks. Car loadings have been increasing and the number of idle cars show a noticeable decline.
From the figures covering transportation throughout the United States there appears to be an un
doubted increase in the amount of freight moving and a corresponding reduction in the number of idle cars.
Increased efficiency, reduced wages and postponement of repairs and improvements have been largely rsponsible for the increase in earnings. Many freight cars and locomotives are in poor repair and there is also an urgent need for rails.
Cool Weather Stimulates Textile Industry; Woolen Mills Operating Near Normal; Retailers Order Cautiously
The textile industry has been affected by unusually warm weather which tends to delay the opening of fall retail business, but the few cool days near the middle of the month gave a definite stimulus to the trade. Generally speaking fall retail business in industrial centers is not expected to show as noticeable improvement as was in evidence last spring, for unemployment and reduced saving reserves have lowered the buying power of the public. However, dealers are relying on the large number of people who continue to work, and on those employed in clerical and professional lines, whose buying power has been increased by the reduction in commodity prices, for a fair amount of business.
Wool textile mills continue to operate at close to 100 per cent of normal. A large worsted mill manu
facturer reports more machinery in operation at the present time than for several years past, and enough orders on hand to last until February and possibly March. Weather conditions this fall continue to have more than the usual effect on the demand for goods. Low stock in the hands of the wholesaler and retailer and in the hands of the wholesale manufacturer of clothing, and the fact that many people are making their clothes last longer, are reported to be chiefly responsible for the fluxional demands.
Stocks on the shelves of retailers are not heavy, and retailers are still ordering cautiously, on the ground that the public may hesitate to pay the prices that retailers say are necessary under present costs of labor and material.
Production of Leading Canned Vegetables Reduced; Satisfactory Business in Preserving Lines; Corn Canning Industry on Road to Recovery
Production of the leading canned vegetables during the present season has been on the average of 50 per cent less than last year. Of the three staples, the approximate national production has been as follows:Peas ......................................... 8,000,000 cases 1921P eas..........................................12,000,000 cases 1920Com ......................................... 7,000,000 cases 1921Corn .........................................15,000,000 cases 1920Tomatoes................................. 6,000,000 cases 1921Tomatoes................................. 12,000,000 cases 1920
The wholesale grocers are continuing their policy of buying canned goods in small quantities, and making frequent purchases. Since the total distribution has approached that of last year, canners have been compelled to carry quite heavy stocks. The market prices are now on a much improved basis, although there is some weakness in certain sections, owing to forced sales by canners who have had diffi
culty in financing their operations during the past year.
The output in various lines of preserved goods, since the first of May, has been larger in tonnage than for the same period last year. Sales for current requirements are reported to be quite satisfactory this fall. Goods are moving from the shelves of the stores, and especially in the agricultural districts there is a noticeable improvement.
The corn canning industry is gradually recovering and the losses that appeared inevitable to the corn canner the first of the year have been reduced more than half. The corn pack of 1920 was the largest in the history of the industry, and at this time there are less than 1,500,000 cases of this pack in first hands. The total acreage for the 1920 pack was around 280,000, while this year the total acreage amounted to approximately 110,000. The market in this line has been somewhat weaker than for some time past.
Digitized for FRASER http://fraser.stlouisfed.org/ Federal Reserve Bank of St. Louis

8 T H E M O N T H L Y B U S I N E S S R E V I E W
Special Report on the Clay Products Industry
Construction work with its myriad lines of endeavor is as old as the human race. Of the importance of the clay products industry in past and present development there can be no question and this industry can rightfully claim a fair share of responsibility for the familiar boast *4 America is the workshop of the world.7f
In the October number of the Review there was published a brief historical sketch of the clay products industry showing the remarkable progress it has made and the important place it holds in the long list of Fourth District industries.
Construction work is largely dependent on the various lines of clay products. The walls of many of our great fireproof skyscrapers are built of brick. Our rural and city homes show a wide variety of brick construction meeting the demands of the American people who are showing an awakening appreciation of better architecture. Some of the oldest and most serviceable street and highway pavement is built of paving brick—brick that has stood the test of time and has given entire satisfaction.
In the production of face brick the Fourth District holds first place in the United States. This District is also the heaviest single producing center of paving brick in the country.
People like smooth, rapid and dependable transportation, These three essentials are not only wished for, but they are demanded. In this “ age 011 wheels’ * a few minutes count for a lot, and sometimes mean the difference between success and failure. It does not pay to be late, and transportation is the determining factor that lies at the bottom of it.
Good streets are not only a convenience but they are a source of pride for the city man. He pays taxes to keep them in good condition and he likes to see his money put to the proper use. Outsiders often judge a city by its streets. If they happen to pass through on a tour and find smooth, well kept streets, they leave with a feeling that the town is alive and up to date, but a stretch of poor pavement is all that is necessary to give the town a black mark.
Just as the city man is proud of his smooth streets, the rural districts like to have dependable highways, and the frown against the old-fashioned dirt road is becoming darker. Good roads are the connecting link not only between towns but between the farmer and his city market, and they have gone far toward keeping him out of the mud about seven months in the year.
With the ever increasing use of the auto truck for transportation testing the lasting qualities of the materials used in road construction, and with the constant demand for good roads for pleasure and commercial travel twelve months in the year, the problem of building roads that last is a big one.
It is interesting to note the qualities of paving brick, the care with which they are made, and the methods employed in construction work. Because of the heavy traffic-wear they must be very hard and tough. In comparison with other varieties of clay products paving brick are subjected to a longer burning process and a more intense heat is required. The care with which the brick are made does not begin or end with the burning, but is in evidence from the time the shale is ground beneath great revolving wheels until the brick finally pass the careful inspectors. If the unfinished brick do not measure up to standard they are sent back to be reground and start the journey all over again. If the finished brick show any defects, they are not sent out as first class paving material. This is a part of the elaborate system known as the return operations” employed to in* sure a product of standard size and quality. It is indeed interesting to watch the various processes through which the bricks must pass before they are ready for shipment and after seeing the care with which they are inspected and the high standard of requirements, one leaves the factory with an increased respect for brick as a good paving material.
Production of paving brick requires about 1.87 tons of coal for power and burning for every 1,000 ten- pound pavers produced, or roughly .4 of a ton of coal for 1 ton of output. The clay products industry is estimated to rank among the first half-dozen users of coal in the country.
A brick pavement may vary from a simple structure formed by laying the brick on natural soil, up- ward through an increasing scale of elaborateness in design, and naturally the cost varies accordingly. Under proper construction brick pavement will give good service for many years and show practically no wear. In instances where edges of the brick become worn, which is the case sometimes where they have given long service and the filler has worn out of the joints, they frequently are turned bottom side up, thus providing a new smooth surfaced street.
Despite the durable qualities of paving brick no claim is made that every brick pavement is 100 per cent success. Like all other pavements, thorough construction is essential. And a substantial support in respect to natural as well as artificial base is an important element in bringing out maximum service qualities.
There are a lot of towns with unpaved streets and they can be found in any part of the country. But the famous town pump is fast disappearing from the middle of the square and the mudhole in front of the post office is being looked upon with increasing disfavor. The inhabitants like to see good streets Small towns are one of the chief markets for the paving brick manufacturer. Before the war approximately 45 per cent of the entire output of the pavih* brick industry in any year was taken by cities and
Digitized for FRASER http://fraser.stlouisfed.org/ Federal Reserve Bank of St. Louis

T H E M O N T H L Y B U S I N E S S R E V I E W
towns of less than 25,000 population. City streets must be built with exceptional care to insure their holding up under the traffic, but this problem is not so pressing in the small towns. The traffic may be heavy but it cannot compare with the continual grind on the city streets. In some sections where the soil is naturally dry, brick laid on a natural surface has given satisfaction for a considerable length of time.
At the close of the war, the paving brick industry was operating around 40 per cent of normal. The restriction in large part was due to the “ non-essential” classification in which paving brick construction was placed; dull business also played its part. Up to 1921 the recovery was practically complete in short-haul markets or those within a radius of 200 miles. The remaining recovery must come largely from the long-haul markets which depend on freight rates. As reductions come, long-haul business will be regained.
While the clay products industry is not among the leading industries in knowing the cost of production, the manufacturers realizing its importance have definitely taken the matter into their own hands and are studying improved methods of finding production costs. An industry drifting is at the mercy of economic conditions, and the brick men refuse to drift any longer. They are facing facts—facts determined by a thorough research of conditions controlling the industry.
While there is much similarity in the methods used in the manufacture of different kinds of clay products, each product requires some special preparation. Burning plays an important part. Just as the paving brick are made practically immune to wear by a special process of burning, so the face brick receive their distinguishing and beautiful colorings through various applications of heat.
Great skill in burning is required to bring out these colors. In this process, the impurities of the clay are burned out or transformed into the beautiful color effects seen in the finished ware. In order to add to these effects, the manufacturer of face brick sometimes mixes different clays, or adds certain ores, or even sets the brick in the kiln in such a way as to get the effects of the superheated kiln gasses. But in any case, it is the magic of the flame that gives to face brick the great variety of shadings and color tones.
The American manufacturer offers a wide variety of color tones and textures and in this he has far outstripped the rest of the world. The prospective builder has his choice of a color scheme ranging from the severe tones of pearl greys or creams, through buff, golden and bronze tints to a descending scale of reds, down to purple, maroons and even gun metal blacks.
Although the popularity of face brick has steadily increased during the last twenty years, business conditions during the last five years have worked against maximum production. The following production and valuation figures of the United States Geological Survey show the effects of the World War.
Quantity Average PriceYear Bricks Value per 1000
1909 ....... 816,164,000 S 9,712.219 $11.90191 0 ....... 697,857,000 8,590,057 12.31191 1 ....... 724,911,000 8,648,877 11.931912 ....... 814,007,000 9,455,297 11.62191 3 ....... 827,665,000 9,614,138 11.62191 4 ....... 810,395,000 9,289,623 11.461915 ....... 855,668,000 9,535,536 11.14191 6 ....... 1,002,762,000 11,464,614 11.431917 757,618,000 10,391,368 13.721918 356,394,000 6,095,120 17.10
Figures for the year 1919 are approximately 780,- 000,000. Figures are not yet available for 1920 production, but indications are that the total amount will not be representative of a normal year on account of the manufacturing difficulties that were experienced.
In this industry, 1916 was the year of largest production. In the spring of 1917, when this country declared war, the drafts of June and September hit the brick business especially hard, as brick plant labor must be close to 100 per cent physically fit. Shortage of labor and lack of demand for the product were responsible for the decreased production during 1917.
In April, 1918, the Fuel Administration limited coal consumption in the brick industry to 50 per cent of the average consumption during the preceding three years. Then during the summer and fall of 1918 the War Industrial Board limited the amount of construction, other than for war purposes, to the absolute minimum. Naturally the brick industry suffered severely.
During the first part of 1919 there was an almost total lack of demand for face brick and most of the factories were closed down awaiting developments. Business picked up in the late spring of 1919 and grew until there was an enormous demand which continued through the spring of 1920. At that time the industry was affected by the shortage and high prices of coal, labor scarcity and indifference and the lack of shipping facilities.
With other lines of business, the face brick industry has been passing through a readjustment period. Wage readjustments and freight rates have made the problem a difficult one, but manufacturers have whole-heartedly attacked it. While the year 1921 may prove to be considerably subnormal in production, it is believed the energetic sales methods which have been shown by aggressive manufacturers will probably result in a fair amount of business.
Digitized for FRASER http://fraser.stlouisfed.org/ Federal Reserve Bank of St. Louis
10 T H E M O N T H L Y B U S I N E S S R E V I E W
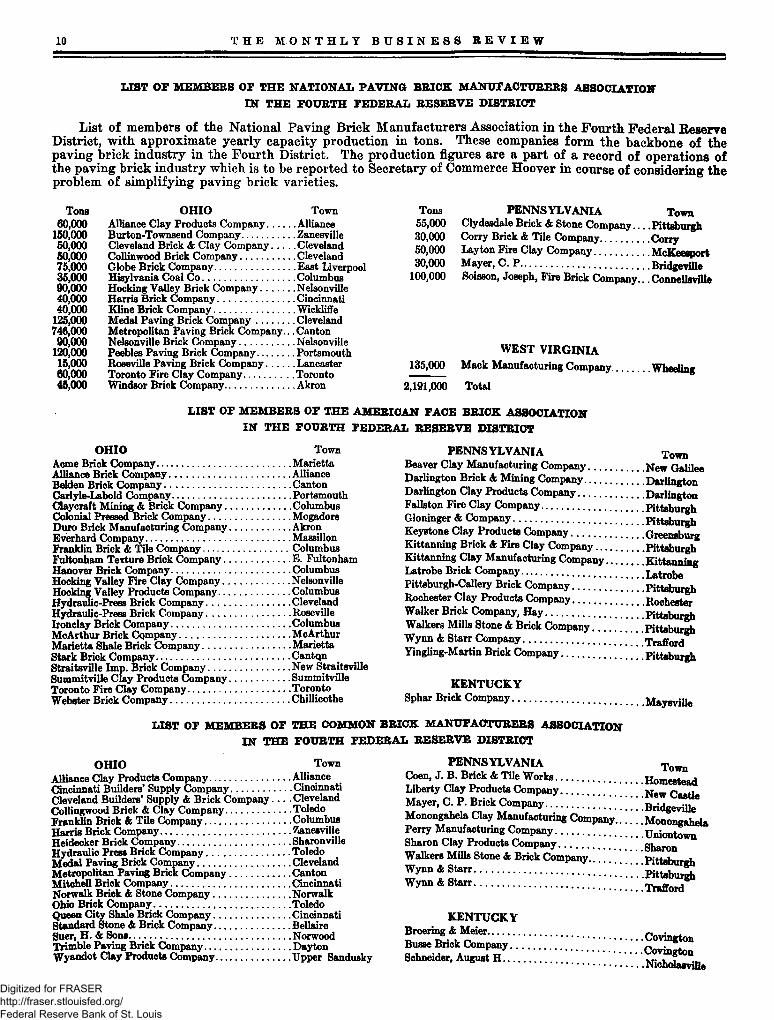
LIST OP MEMBERS OP THE NATIONAL PAVING BRICK MANUFACTURERS ASSOCIATION IN THE POURTH FEDERAL RESERVE DISTRICT
List of members of the National Paving Brick Manufacturers Association in the Fourth Federal Reserve District, with approximate yearly capacity production in tons. These companies form the backbone of the paving brick industry in the Fourth District. The production figures are a part of a record of operations of the paving brick industry which is to be reported to Secretary of Commerce Hoover in course of considering the problem of simplifying paving brick varieties.
Tons60,000
150.00050.00050.00075.00035.00090.00040.00040.000
125.000746.00090.000
120.00015.00060.000 45,000
OHIO TownAlliance Clay Products Company.........AllianceBurton-Townsend Company................ ZanesvilleCleveland Brick & Clay Company....... ClevelandCollinwood Brick Company................. ClevelandGlobe Brick Company......................... East LiverpoolHisylvania Coal Co............................. ColumbusHocking Valley Brick Company...........NelsonviileHarris Brick Company........................ CincinnatiKline Brick Company..........................WickliffeMedal Paving Brick Company............ClevelandMetropolitan Paving Brick Company... CantonNelsonviile Brick Company................. NelsonviilePeebles Paving Brick Company........... PortsmouthRoseville Paving Brick Company.........LancasterToronto Fire Clay Company................TorontoWindsor Brick Company......................Akron
Tons PENNSYLVANIA Town55.000 Clydesdale Brick & Stone Company... .Pittsburgh30.000 Corry Brick & Tile Company............... Corry50.000 Layton Fire Clay Company................. McKeesport30.000 Mayer, C. P.........................................Bridgeville
100,000 Soisson, Joseph, Fire Brick Company... Connellsville
WEST VIRGINIA135,000 Mack Manufacturing Company............Wheeling
2,191,000 Total
LIST OF MEMBERS OF THE AMERICAN FACE BRICK ASSOCIATION IN THE FOURTH FEDERAL RESERVE DISTRICT
OHIO TownAcme Brick Company.......................................... MariettaAlliance Brick Company...................................... AllianceBelden Brick Company........................................ CantonCarlyle-Labold Company......................................PortsmouthClaycraft Mining & Brick Company.....................ColumbusColonial Pressed Brick Company..........................MogadoreDuro Brick Manufacturing Company................... AkronEverhard Company..............................................MassillonFranklin Brick & Tile Company...........................ColumbusFultonham Texture Brick Company.....................E. FultonhamHanover Brick Company......................................ColumbusHocking Valley Fire Clay Company..................... NelsonviileHocking Valley Products Company...................... ColumbusHydraulic-Press Brick Company...........................ClevelandHydraulic-Press Brick Company...........................RosevilleIronclay Brick Company......................................ColumbusMcArthur Brick Cpmpany...................................McArthurMarietta Shale Brick Company............................MariettaStark Brick Company, i ....................................... CantqnStraitsville Imp. Brick Company..........................New StraitsvilleSummitville Clay Products Company...................SummitvilleToronto Fire Clay Company................................ TorontoWebster Brick Company......................................Chillicothe
PENNSYLVANIA TownBeaver Clay Manufacturing Company................. New GalileeDarlington Brick & Mining Company...................DarlingtonDarlington Clay Products Company.....................DarlingtonFallston Fire Clay Company................................ PittsburghGloninger & Company......................................... PittsburghKeystone Clay Products Company.......................GreensburgKittanning Brick & Fire Clay Company............. * PittsburghKittanning Clay Manufacturing Company...... ’ . KittanningLatrobe Brick Company................................ LatrobePittsburgh-Callery Brick Company................’ ’ .PittsburghRochester Clay Products Company...................... RochesterWalker Brick Company, Hay...................... . PittsburghWalkers Mills Stone & Brick Company................PittsburghWynn A Starr Company...................................... TraffordYingling-Martin Brick Company.....................’ ’ .Pittsburgh
KENTUCKY Sphar Brick Company. . . .Maysville
LIST OF MEMBERS OF THE COMMON BRICK MANUFACTURERS ASSOCIATION IN THE FOURTH FEDERAL RESERVE DISTRICT
OHIO TownAlliance Clay Products Company......................... AllianceCincinnati Builders’ Supply Company................... CincinnatiCleveland Builders* Supply & Brick Company. . . . ClevelandCollingwood Brick & Clay Company.................... ToledoFranklin Brick & Tile Company........................... ColumbusHarris Brick Company......................................... ZanesvilleHeidecker Brick Company....................................SharonvilleHydraulic Press Brick Company.......................... ToledoMedal Paving Brick Company............................. ClevelandMetropolitan Paving Brick Company...................CantonMitchell Brick Company......................................CincinnatiNorwalk Brick A Stone Company........................ NorwalkOhio Brick Company........................................... ToledoQueen City Shale Brick Company........................ CincinnatiStandard Stone & Brick Company........................BellaireSuer, H. & Sons.. .............................................. NorwoodTrimble Paving Brick Company........................... DaytonWyandot Clay Products Company....................... Upper Sandusky
PENNSYLVANIA TownCoen, J. B. Brick & Tile Works............................HomesteadLiberty Clay Products Company............ NflwMayer, C. P. Brick Company...................! [; |;; ^ r id g e XMonongahela Clay Manufacturing Company........ -------------Perry Manufacturing Company................ .........UnionismSharon Clay Products Company.................... SharonWalkers Mills Stone & Brick Company....... * ’ .PittsburghWynn & Starr.............................. .......Wynn & Starr.......................... . i . . ; ; ; ................Trafford
KENTUCKYBroering & Meier..........Busse Brick Company.., Schneider, August H__
.Covington
.CovingtonNicholasville
Digitized for FRASER http://fraser.stlouisfed.org/ Federal Reserve Bank of St. Louis

T HE M O N T H L Y B U S I N E S S E E V I E W U
ClearingsSeptember 16th to October 15th Increase or1921 1980 Decrease
Akron.................................................... $26,782,000 $43,779,000 —$16,997,000Canton.................................................. 14,126,504 22,096,244 —7,969,740Cincinnati.............................................. 228,420,592 307,473,466 —79,052,874Cleveland.............................................. 381,763,439 617,522,483 —235,759,044Columbus.............................................. 56,241,800 64,896,800 —8,655,000Dayton.................................................. 17,657,217 19,217,748 —1,560,531Erie....................................................... 9,717,862 12,751,377 —3,033,515Greensburg............................................ 5,241,792 7,582,686 —2,340,894Lexington.............................................. 4,150,776 6,322,341 —2,171,565Pittsburgh............................................. 538,083,585 788,672,454 —250,588,869Springfield............................................. 5,567,375 7,118,579 —1,551,204Toledo................................................... 48,182,505 65,757,348 —17,574,843Wheeling............................................... 17,467,630 24,641,952 —7,174,322Youngstown.......................................... 14,399,243 21,270,897 —6,871,654
Total................................... $1,367,802,320 $2,009,103,375 —$641,301,055
Debits to Individual Accounts
Akron.................Cincinnati...........Cleveland...........Columbus...........Dayton...............Erie....................Greensburg.........Lexington...........Oil City..............Pittsburgh...........Springfield..........Toledo................Wheeling.............Youngstown.......
Total.
Week Ending Oct 12.1021
Week Ending Oct 13.1020 Increase or
(270 Banks) (233 Banks) Decrease$9,536,000 $19,008,000 —$9,472,00050,025,000 59,136,000 —9,111,00084,375,000 167,912,000 —83,537,00023,710,000 27,309,000 —3,599,00012,812,000 11,743,000 1,069,0005,675,000 7,612,000 —1,937,0003,882,000 6,400,000 —2,518,0003,054,000 4,448,000 —1,394,0001,500,000 2,534,000 —1,034,000
147,134,000 179,874,000 —32,740,0003,190,000 3,668,000 —478,000
24,877,000 26,661,000 —1,784,0005,598,000 8,524,000 — 926,0009,191,000 17,436,000 —8,245,000
$384,559,000 $542,265,000 —$157,706,000
Comparative Statement of Selected Member Banks in Fourth District(In Thousands of Dollars)
Loans and Discounts secured by U. S. Governmentobligations...................................................................
Loans and Discounts secured by other stocks and bonds .Loans and Discounts, all other..........................................U. S. Bonds........................................................................U. S. Victory Notes...........................................................U. S. Treasury Notes.........................................................U. S. Certificates of Indebtedness.....................................Other Bonds, Stocks and Securities...................................Total Loans, Discounts and Investments..........................Reserve with Federal Reserve Bank..................................Cash in Vault.....................................................................Net Demand Deposits.......................................................Time Deposits....................................................................Government Deposits.........................................................Total Resources at date of this report...............................
Oct. 12, Sept. 14.1021 102185 Banks 88 Bulks Inc.51,499 49,472 2,027
335,803 336,394590,242 593,876110,147 101,599 8,54814,407 16,6856,034 5,028 1,006
10,699 10,000 699277,805 273,801 4,004
1,396,636 1,386,855 9,78193,995 94,75329,320 29,305 15
802,720 817,811423,950 424,29039,782 10,995 28,787
1,820,461 1,804,807 15,654
Per cent Inc. or Dec.
—38.8 —36.1 —25.7 —38.2 —13.3 —8.1
—23.8 —30.9 —34.3 —31.8 — 21.8 —26.7 —29.1 —32.8
—81.9
Per cent Inc. or Dec.
—49.8 —15.4 —49.8 —18.2
9.1 —25.4 —39.3 —31.3 —40.8 —18.2 —18.0 —6.7
—34.3 —47.3
—29.1
Dec.
59i3,634
2,278
758
15,091340
Digitized for FRASER http://fraser.stlouisfed.org/ Federal Reserve Bank of St. Louis

1* T H E M O N T H L Y B U S I N E S S B E V I E W
Wholesale Trade Percentage Increase (or Decrease) in Sales During 1920 and 1921
Over the Corresponding Month in Previous Year
September, 1920.October.............November.........December.........January.............February...........March...............April.................May..................June..................July..................August..............September, 1921.
Dry Goods Groceries Hardware Drugs. . . . 23.8 12.4 31.1—27.5 —10.8 2.0
—4.2 —3.8 16.7 45!8—20.0 —18.8 —16.9 —17.0—51.6 —36.7 —20.6 —19.0—22.3 —27.1 —19.0 —31.2—14.9 —33.1 —16.3 —29.2—4.2 —37.7 —21.9 —23.4—13.6 —35.1 —22.0 —23.4—24.4 —49.8 —32.9 —22.2—35.5 —43.6 —38.5 —15.0—13.2 —20.4 —41.1 —21.2—19.5 —32.6 —39.5 —18.4
Department Store SalesPercentage of net sales (selling price) duringSeptem-
ber, 1921, over net sales (selling price) during samemonth last year.....................................................
Percentage of net sales (selling price) from July 1, 1921, to September 30,1921, over net sales (sellingprice) during same period last year......................
Percentage of stocks at close of September, 1921, overstocks at close of same month last year...............
Percentage of stocks at close of September, 1921, overstocks at close of August, 1921.............................
Percentage of average stocks at close of each month this season (commencing with July 1, 1921) to average monthly net sales during the same period
Percentage of all outstanding orders (cost) at close of September, 1921, to total purchases (cost) during the calendar year, 1920.........................................
Pgb. —24.6
Cleve. Toledo —26.9 —14.7
OtherCities
—16.4District
—23.6
—23.5 —26.7 —17.3 —12.7 —22.7—15.4 —26.8 —29.6 —13.0 —19.6
6.6 15.2 6.7 10.7 9.7
487.2
5.8
462.5
6.1
294.2
7.0
536.5
9.2
470.94
6.4
Movement of Livestock at Principal Centers in Fourth Federal Reserve District For Month of September, 1921-1920
Car*Cattle Hogs Sheep Calves Unloaded1921 1920 1921 1920 1921 1920 1921 1920 1921 1920
Cincinnati.................... 30,238 31,021 113,295 80,523 30,399 36,088 15,214 12,735 2 260 4 067Cleveland.................... 10,175 11,188 82,968 64,757 31,907 16,447 8,831 9,868 1 567 I4«mColumbus.................... 9 ......... 5,529 ......... 70 ......... 99 ......... ’ q 1,*3UDayton........................ 2,084 2,621 9,705 8,072 1,317 1,256 707 722Fostoria....................... 242 803 8,158 6,492 3,867 2,108 407 398 is " " uPittsburgh................... 41,701 48,515 182,169 177,479 98,981 89,059 33,119 32,747 8 925Springfield.................... 372 300 5,601 4,000 2,047 600 189 200 ’ i«Toledo......................... 1,345 1,432 9,787 9,188 1,719 4,418 473 822 " i s s iaaWheeling...................... 492 968 1,045 1,463 837 1,054 869 1,406 io g
Purchases for Local SlaughterCincinnati.................... 20,123 20,854 66,302 43,380 15,557 10,590 8,207 7,184Cleveland.................... 9,189 9,579 56,965 45,926 18,990 7,280 8,457 9,089Columbus.................... 8 ......... 1,010 ......... 70 ......... 87 .........Fostoria....................... 40 10 950 350 10 10 82 202Pittsburgh.................... 11,648 6,764 39,345 26,234 12,253 13,875 6,995 7,480Toledo........................................ 497 ......... 712 ......... 4,188 ......... S72Wheeling...................... 492 ......... 1,045 ......... 837 ......... 869 .........
Digitized for FRASER http://fraser.stlouisfed.org/ Federal Reserve Bank of St. Louis

T H E M O N T H L Y B U S I N E S S R E V I E W IS
Building Operations For Month of September
Permits Issued New Construction Alterations 1921 1920 1921 1920
ValuationsNew Construction Alterations 1921 192d 1921 1920 1
Inc. or Dec. of Per cent Total Valuation Inc. or Dec.
Akron............. .. 132 221 36 85 332,350 1,680,581 11,122 136,775 —1,473,884 —81.1Canton........... 152 79 60 67 240,259 163,900 27,850 120,540 —16,331 —5.7Cincinnati... 327 215 209 535 756,090 368,215 178,700 653,050 —86,475 —8.3Cleveland*. . 382 216 859 909 4,036,232 2,873,500 512,920 491,475 1,184,177 35.2Columbus. . . . 335 148 112 76 659,350 758,605 73,590 64,755 —90,420 —11.0Dayton......... 184 100 92 55 902,900 388,219 30,427 28,421 516,687 124.0Erie............... 82 57 74 51 228,592 117,404 99,635 29,810 181,013 123.0Lexington. . . 12 6 44 53 50,179 20,700 20,620 9,000 41,099 138.4Pittsburgh. 341 242 92 65 1,490,479 734,286 211,150 129,445 837,898 97.0Springfield.. .. 68 19 23 15 110,710 38,135 10,235 11,180 71,630 145.2Toledo........... 205 173 153 113 735,393 619,685 128,098 143,917 99,889 13.1Wheeling....... 54 30 31 22 78,172 25,360 11,543 4,985 59,370 195.7Youngstown.. .. 115 101 25 21 933,845 196,900 75,525 29,900 782,570 345.0
Total 2,389 1,607 1,810 2,067 10,554,551 7,985,490 1,391,415 1,853,253 2,107,223 21.4*1921 figures include Lakewood and East Cleveland.
Statement of Bituminous Coal Loaded Into Vessels (As Dumped by Docks) In Net Tons for Season to End of September, 1921, as Compared with the Same
Period for the Seasons of 1920-1919
1921 1920 1919Ports Railroads Cargo Fuel Total Cargo Fuel Total Cargo Fuel Total
Toledo Hocking Valley........... 3,392,526 90,626 3,483,152 2,533,666 51,508 2,585,174 3,476,476 97,686 3,574,162Toledo & Ohio Central 912,039 25,463 937,502 1,155,803 44,646 1,200,449 1,030,810 31,539 1,062,349Baltimore & Ohio....... 2,019,800 59,071 2,078,871 933,093 28,423 961,516 1,886,659 44,918 1,931,577
Sandusky Pennsylvania............. 1,221,981 35,303 1,257,284 1,066,276 15,015 1,081,291 1,102,597 30,193 1,132,790Huron Wheeling & Lake Erie 1,418,826 40,134 1,458,460 1,376,311 73,418 1,449,729 1,183,769 41,148 1,224,917Lorain Baltimore & Ohio....... 2,176,645 87,837 c© a 00 2,163,365 152,418 2,315,783 2,240,013 121,721 2,361,734Cleveland Pennsylvania.............. 1,768,313 73,258 1,841,571 752,653 115,458 868,111 1,773,256 198,259 1,971,515
Erie............................ 355,964 12,071 368,035 243,997 14,116 258,113 189,235 5,598 194,833Ashtabula New York Central... . 959,835 52,381 1,012,216 988,367 196,637 1,185,004 1,384,993 118,556 1,503,549
Pennsylvania............. 1,922,167 63,910 1,986,077 1,210,112 70,349 1,280,461 1,525,198 77,201 1,602,399Conneaut Bessemer & Lake Erie 1,090,156 14,732 1,104,888 1,797,497 30,624 1,828,121 1,105,605 7,108 1,112,713Erie Pennsylvania—West. . 770,091 27,030 797,121 149,137 12,926 162,063 613,242 34,255 647,497
Pennsylvania—East .. 140,393 24,799 165,192 234,116 59,245 293,361 152,678 11,771 164,449
Total..................18,148,236 606,615 18,754,851 14,604,393 864,783 15,469,176 17,681,223 832,90718,514,130
Digitized for FRASER http://fraser.stlouisfed.org/ Federal Reserve Bank of St. Louis

14 T H E M O N T H L Y B U S I N E S S R E V I E W
STATEMENT OF CONDITION FEDERAL RESERVE BANK OF CLEVELAND
NOVEMBER 2, J92 \
In Thousands of DollarsRESOURCES
Gold and gold certificates....................................................... $ 12,452Gold settlement fund—F. R. Board........................................ 49,370Total gold held by bank.......................................................... 61,822Gold with Federal Reserve Agent........................................... 167,572Gold redemption fund ............................................................. 5,565
Total gold reserves.......................................................... 234,959Legal tender notes, silver, etc.................................................. 5,880
TOTAL RESERVES ..................................................... $240,839Bills discounted—Secured by U. S. Government obligations 41,701Bills discounted—All other..................................................... 87,119Bills bought in open market................................................ .... 3,423
Total bills on hand.......................................................... 132,243U« S. bonds and notes................................... :....................... 844U. S. Certificates of indebtedness—One year......................... 13,299U. S. Certificates of indebtedness—All other....................... 187
TOTAL EARNING ASSETS........................................ 146,573Bank premises ......................................................................... 3,3115% Redemption fund against F. R. Bank notes..................... 539Uncollected items ................................................................... 47,637All other resources ...................... ........................................... 1,063
TOTAL RESOURCES.................................................... 439,962
LIABILITIESCapital paid in ......................................................................... 11,104Surplus ...................................................................................... 22,264Reserved for Government Franchise Tax............................... 2,847Deposits—Government............................................................ 4,071
Member Bank-Reserve account........................................ 130,809All other............................................................................. 772
TOTAL DEPOSITS ...................................................... 135,652F. R. notes in actual circulation............................................. 215,448F. R. Bank notes in circulation—net liability......................... 8,007Deferred availability items...................................................... 43 $84All other liabilities................................................................... 1,356
TOTAL LIABILITIES 439,962
Ratio of total reserves to deposit and F. R. note liabilities combined = 68.6% Compared with 68.7% last week.
Ratio of gold reserves to F. R. notes in circulation after setting aside 35 per cent against deposit liabilities = 89.7% compared with 89.7% last week.
Digitized for FRASER http://fraser.stlouisfed.org/ Federal Reserve Bank of St. Louis

T H E M O N T H L Y B U S I N E S S R E V I E W 15
PICKUPS ON BUSINESS TOPICS
STANDARDIZATION of the different kinds, qualities, and sizes of window and plate glass was discussed at a con
ference between glass distributors, architects, and engineers of the Bureau of Standards recently. Confusion is declared to exist in the glass and glazing fields so far as qualities and sizes of glass are concerned, and this conference outlined a program which, it is believed, will result in the elimination of unnecessary sizes, standardize quality, and enable a more efficient use of this building material.
IIMHimtllDHlUHlllHU'tHillltll
A service consolidating L. C. L. shipments at Cincinnati and routing a through car to be operated from Cincinnati to Havana without transfer is now in operation; the car is for* warded weekly. Quotations for through rates can be secured from Mr. M. C. Browning, General Agent, L. & N. R. R., 706 Hippodrome Building, Cleveland, freight charges to be prepaid. Through bills of lading will be issued to Havana and points beyond. Custom house entry must be made at Havana.
HmiiiimtiitiiiifiiiiiiiHiimiiJiJ
Before the war, France possessed approximately 185,000,000 acres of productive forests. During the war, large areas were totally destroyed through fire, and other areas were heavily drawn upon for firewood, trench timber and other necessities. It is calculated that it will require from 60 to 100 years of intensive cultivation to bring these forests back to normal.
jimjiiiiiJiriHHiiiMioiiiiJUJiiiJapan imported 77,000,000 feet of American lumber in 1920,
according to a report appearing in the Japanese-American Commercial Weekly. A material reduction in prices, a decrease in freight rates, and the recent great fire in Japan are considered grounds for the belief that this demand will increase to about 100,000,000 feet in 1921.
No rubber goods of any kind are manufactured in Santiago, Cuba, or the Oriente Province, the trade being supplied almost entirely by the United States. The market for mbber tires in Santiago and the Province may be called fairly good, since it is estimated that 7,000 automobile and motor-truck tires are sold annually.
IMfJllllMIIHIinjIIMIIJntJIMlJlIH
American galvanized wire netting has proven very satisfactory to the trade of British Malaya, and when exchange becomes normal there is no apparent reason why orders should not be placed with American mills, as the line is a big one with steady sales.
A report at Puerto Plata, states that the Dominican Central Railroad had received during the month a cargo of fuel oil. and will hereafter use oil as fuel instead of coal. This road has oil tanks and is converting its engines into oil burners.
iimiiimimiitiuuHimmitimii
Estimates for Army and Navy air service for fiscal year beginning July 1, 192*2, total $30,000,000. Last year $70,000,- 000 was asked and Congress appropriated $33,613,431.
A German shipping company has resumed monthly freight service from Hamburg to the West Coast of South America, suspended since the beginning of the war.
THE Shipping, Engineering and Machinery Exhibition at Olympia, London, from September 7 to 28, which appeared
to be the most complete thing of its kind ever held in England, was limited to British goods. New specialties which aroused particular interest were: portable gasoline electric welding plants; automatic electrical direction indicators and other ship control devices; reversible rudder; clear view windows for ships, etc., consisting of revolving circles of glass which will throw off rain, snow, or spray; audible water meter, which automatically reports the height of the water in reservoirs by telephone to the engineer's office.
The possibility of importing into this country manufactured woolen goods from Germany and other European countries where costs are lower than in domestic mills is seriously being considered, according to recent reports. The plan is to introduce certain products of foreign countries made at low prices which are not manufactured here, to be sold in South America or the Far East in competition with low-cost goods of other European centers.
A new method for the production of a cement, which is claimed to have substantial advantages over the forms of cement in general use now, is reported to the Department of Commerce by Consul H. C. Claibourne, at Havre. The product is obtained through the melting down (in water jacket) of a specific mixture of silex, alumina, iron and lime.
The announcement by Mr. Marconi recently of the perfection of a means of eliminating the bete-noire of wireless, namely the interference of ‘ * atmosphericsJ * in the reception of wireless messages, is of far reaching importance, and its extended use will remove, it is said, the last advantage the cable has over wireless telegraphy.
Thirty licenses for water-powrer development and twenty- four preliminary permits, involving 2,549,000 horsepower, have been authorized by the Federal Power Commission since March 1. This is as much as all applications approved during the fifteen years to June, 1920.
iiMiiimmiHiimiiiiiiiiiDiiiiiiii
A very big decline in the exportation of cigars, partially manufactured and leaf tobacco from the Philippines to the United States, was registered during the first half of this year, according to figures issued by the Collector of Internal Revenue at Manila.
tnmiuiimiuimiiiiiiimiuiiii'i
The use of alcohol instead of gasoline for motor vehicles is gaining ground in Cuba. The alcohol is produced from the waste of sugar, and varies in price from 30 to 3*5 cents a gallon, whereas gasoline at present in Havana is 50 cents a gallon.
iiiiiMiiiiiimiiiMifiiiniiihiiiiiir
Cultivation of rubber in the Brazilian States of Amazone and Matto Grosso is reported to be completely supplanted by the cultivation of cotton, due to high costs of production and transportation of rubber.
The Republic of Cuba is again actively seeking a loan of $60,000,000 to assist in stabilizing her economic situation.
Digitized for FRASER http://fraser.stlouisfed.org/ Federal Reserve Bank of St. Louis