Embed Size (px)
Citation preview

Annual Plan andBudget2017-18
Including Forward Estimates
2018-19 to 2020-21
Presented and submitted to the Council on
Wednesday, 14 June 2017 by the Right
Honourable the Lord Mayor of Brisbane
(Councillor Graham Quirk)

Businesses and Council Providers
Businesses and council providers
Council providers and businesses deliver products and services.
A Budgeted Income Statement showing the anticipated 2016-17 and proposed budgets for 2017-18 and the next two financial years, and a brief description of the role of the Businesses and Council Providers delivering the following business activities is provided.
National Competition Policy (NCP) business activities
This disclosure in relation to NCP is made to satisfy the City of Brisbane Act 2010 and City of Brisbane Regulation 2012.
• Transport for Brisbane1
• City Projects Office3
• Civil Construction and Maintenance Operations2
• Urban Amenity2
• Waste and Resource Recovery Services2
• Brisbane City Cemeteries3,5
• City Parking1,6
• Golf Courses3,4
• Riverstage3,4
• Asset Portfolio Management3,7
Notes:
1. Council has resolved to apply commercialisation to these business activities
2. Council has resolved to apply full cost pricing to these business activities
3. Council has resolved to apply the Code of Competitive Conduct to these business activities
4. Golf Courses and Riverstage are managed by City Venues
5. Narrative for Brisbane City Cemeteries can be found on Service 5.8.1.1 City Cemeteries
6. Narrative for City Parking can be found on Service 2.2.1.1 Enhancing Parking Management
7. Asset Portfolio Management’s external revenue includes non-contestable work. It now includes activities for Sports and Aquatic Centres and City Hall Precincts.
2

Businesses and Council Providers
Business Activities - Summary 2016-17 2017-18 2018-19 2019-20Budgeted Income Statement Anticipated Proposed Proposed Proposedfor the year ending 30 June 2018 $000 $000 $000 $000
Revenue
Field Services 206,203 208,953 219,394 232,809Transport for Brisbane 471,939 479,014 491,678 505,522City Projects Office 330 1,236 1,238 1,258Total revenue 678,472 689,203 712,310 739,589
Expenses
Field Services 578,406 523,878 544,307 567,359Transport for Brisbane 463,462 466,414 479,699 494,008City Projects Office 112,230 118,368 116,077 92,396Total expenses 1,154,098 1,108,660 1,140,083 1,153,763
Less costs allocated to internal services 519,935 472,686 479,512 468,852
Total expenses relating to external services 634,163 635,974 660,571 684,911
Increase/(decrease) in operating capability after tax
Field Services 35,771 40,526 39,668 43,077Transport for Brisbane 8,477 12,600 11,979 11,514City Projects Office 61 103 92 87Increase in operating capability 44,309 53,229 51,739 54,678
Imputed income tax 8,515 10,001 10,573 11,320
Increase/(decrease) in operating capability after tax
35,794 42,228 41,166 43,358
3

Businesses and Council Providers
Total project expenditure combined with rolling projects
Projects 2017-18 2018-19 2019-20 2020-21$000 $000 $000 $000
Bracalba Quarry Development 807 539 547 -Field Services Depot Enhancement Project 4,937 764 - -Field Services Tools of Trade 4,184 4,307 4,477 4,582Field Services Total 9,928 5,610 5,024 4,582
Transport for Brisbane Tools of Trade 7,281 7,483 7,753 7,929Work Order Activity Based Costing - 837 37 -Transport for Brisbane Total 7,281 8,320 7,790 7,929
City Projects Office Tools of Trade 162 167 175 119City Projects Office Total 162 167 175 119
4

Businesses and Council Providers
Field Services
As a quality endorsed business, Field Services objective is to enhance Brisbane’s liveability by providing waste management, civil construction, cleansing and urban maintenance services to Council, that meet customer expectations in productivity, availability and value for money.
Field Services fosters an innovative, motivated and dedicated team-based workforce by focusing on continuous improvement across five critical success factors of Zero Harm, quality, cost and efficiency, people and delivery.
Key Branches include:
• Asphalt and Aggregates • Construction • Urban Amenity • Commercial Services and Business Improvement • Asset Services • Waste and Resource Recovery Services and• Fleet Solutions
Note the NCP activities carried out under these operations are described in the Businesses and Council Providers overview.
Field Services is primarily funded from Council's Annual Plan and Budget, supplemented by revenue from services supplied to the Queensland and local government bodies. Surpluses after the application of the requirements of the Tax Equivalents Regime (TER) are returned back to Council's consolidated revenue. Field Services has nil outstanding or proposed borrowings.
The position of Executive Manager, Field Services has delegations under the Council's Administrative Arrangements for the general working and business operations of Field Services, with responsibility to the Chief Executive Officer of Council.
Field Services will report on financial and non-financial outcomes, indicators and targets as contained in the Annual Plan and Budget document.
5

Businesses and Council Providers
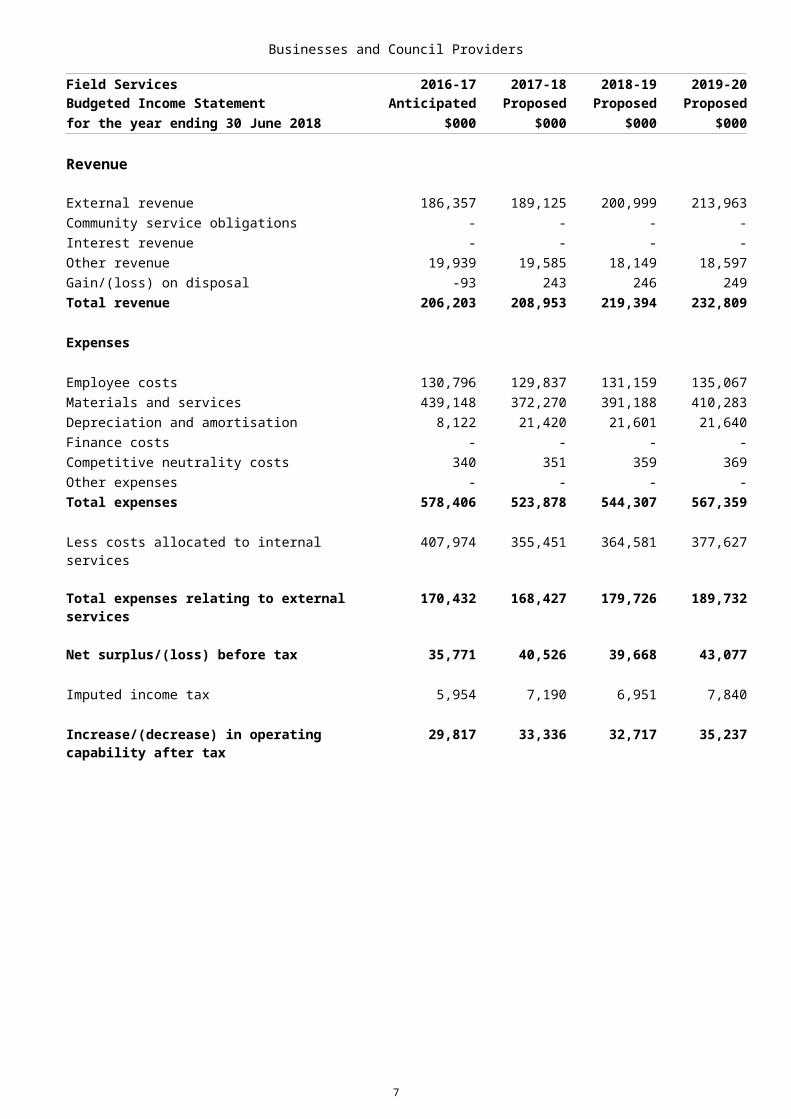
Field Services 2016-17 2017-18 2018-19 2019-20Budgeted Income Statement Anticipated Proposed Proposed Proposedfor the year ending 30 June 2018 $000 $000 $000 $000
Revenue
External revenue 186,357 189,125 200,999 213,963Community service obligations - - - -Interest revenue - - - -Other revenue 19,939 19,585 18,149 18,597Gain/(loss) on disposal -93 243 246 249Total revenue 206,203 208,953 219,394 232,809
Expenses
Employee costs 130,796 129,837 131,159 135,067Materials and services 439,148 372,270 391,188 410,283Depreciation and amortisation 8,122 21,420 21,601 21,640Finance costs - - - -Competitive neutrality costs 340 351 359 369Other expenses - - - -Total expenses 578,406 523,878 544,307 567,359
Less costs allocated to internal services 407,974 355,451 364,581 377,627
Total expenses relating to external services 170,432 168,427 179,726 189,732
Net surplus/(loss) before tax 35,771 40,526 39,668 43,077
Imputed income tax 5,954 7,190 6,951 7,840
Increase/(decrease) in operating capability after tax
29,817 33,336 32,717 35,237
6
Businesses and Council Providers
Transport for Brisbane
Objectives
Transport for Brisbane is one of the largest bus operators in Australia and Brisbane's major provider of public transport with the objective to provide frequent, reliable and safe services, more often, and at the most comfortable standard possible for our passengers. The business includes the provision of CityCat and ferry services, active travel options through CityCycle, and Personalised Public Transport. Together, the business aims to deliver high quality public transport services with a focus on customer service and sustainable transport options for residents and visitors to Brisbane.
Role
Transport for Brisbane has the second largest bus fleet in Australia which will travel approximately 70 million kilometres delivering high-quality services focusing on accessibility, safety, and customer service to contribute to reducing traffic congestion and associated adverse social, economic and environmental impacts.
Cont investment in modern environmentally friendly, air-conditioned and accessible buses, as well as the continued success of the popular Bus Upgrade Zones (BUZ), the Blue CityGlider and the Maroon CityGlider have helped to ensure Transport for Brisbane carries significantly more passengers than the entire SEQ City Train network.
Transport for Brisbane provides scheduled network passenger bus services including high frequency BUZ and CityGlider services, school services, charter services and special event services. The services include non-commercial and community bus services and concessional travel for senior citizens, full time university students, school students and for disadvantaged members of the community. A modern, wheelchair-accessible, well-maintained, clean and carbon neutral bus fleet and strategically positioned depots ensure these services are delivered effectively.
Transport for Brisbane delivers public transport bus, CityCat and ferry services under contracts with TransLink, a division of Queensland Government’s Department of Transport and Main Roads. Under the TransLink contracts, fares are set by Queensland Government and all fare revenue belongs to TransLink.
CityCat and ferry services are an important part of the public transport network, stretching 22 kilometres along the Brisbane River. The ferry network provides access at 25 terminals for commuters along and across the river. Brisbane's free inner-city ferry service, the CityHopper is included in this service. The Queensland Government provides a funding contribution for ferry operations.
The CityCycle public bike hire scheme operates within the inner-city to encourage short trips by bicycle. The scheme is delivered in partnership with the private sector. With up to 2000 bikes and 150 station locations conveniently positioned near key bus, train and ferry stations, the scheme provides another travel option for commuters and visitors around the inner-city as part of our integrated public transport system.
Transport for Brisbane also delivers Personalised Public Transport (PPT). This service provides Council-funded access to public transport for residents in areas of Brisbane which do not meet the requirements for full TransLink services. PPT currently utilises maxi taxis to transport residents to key local destinations on set hail’n’ride routes and include bus interchanges or railway stations during peak periods and operates on a regular cycle.
Financial and non-financial targets
In 2017-18, achieve:• mean customer satisfaction with bus services of not less than 6.5 • take delivery of 60 new rigid equivalent buses
7

Businesses and Council Providers
Council public transport operating subsidy
Council subsidises Transport for Brisbane for the services it operates to enable better service to Brisbane ratepayers.
Notional capital structure and surpluses
Transport for Brisbane’s notional capital structure is via equity funding from Council. Surpluses are treated in accordance with Council's dividend policy for Business Units after the application of the requirements of the TER with any TER income tax remitted to Council.
Proposed major investments
Transport for Brisbane will take delivery of 60 new rigid equivalent buses which help ensure the comfort of our bus fleet.
Borrowings
Transport for Brisbane has nil outstanding or proposed borrowings.
Service quality
Transport for Brisbane will provide frequent, reliable and safe services at the most comfortable standard possible for passengers.
Delegations
The position of Divisional Manager, Transport for Brisbane has delegations under the Council's Administrative Arrangements for the general working and business operations of Transport for Brisbane, with responsibility to the Chief Executive Officer of Council.
Reportable information
Transport for Brisbane will report to Council regarding its operations and performance, including financial and non-financial targets.
8

Businesses and Council Providers
Transport for Brisbane 2016-17 2017-18 2018-19 2019-20Budgeted Income Statement Anticipated Proposed Proposed Proposedfor the year ending 30 June 2018 $000 $000 $000 $000
Revenue
External revenue 318,998 326,743 334,785 343,068Community service obligations 123,907 123,918 127,937 133,495Interest revenue - - - -Other revenue 29,034 28,553 29,156 29,159Gain/(loss) on disposal - -200 -200 -200Total revenue 471,939 479,014 491,678 505,522
Expenses
Employee costs 225,989 232,238 236,883 241,620Materials and services 226,681 221,858 230,098 239,258Depreciation and amortisation 10,770 12,293 12,692 13,104Finance costs - - - -Competitive neutrality costs - - - -Other expenses 22 25 26 26Total expenses 463,462 466,414 479,699 494,008
Less costs allocated to internal services - - - -
Total expenses relating to external services 463,462 466,414 479,699 494,008
Net surplus/(loss) before tax 8,477 12,600 11,979 11,514
Imputed income tax 2,543 3,780 3,594 3,454
Increase/(decrease) in operating capability after tax 5,934 8,820 8,385 8,060
9

Businesses and Council Providers
City Projects Office
The objective of City Projects Office is to provide professional services across project management, built environment and engineering disciplines. As an in-house project management and design group, emphasis is placed on value adding, quality, design best practice, innovation, and environmental sustainability. City Projects Office continues to maintain strong partnerships and stakeholder relationships to ensure expectations are realised, all within the wider goal of contributing to a better Brisbane.
In 2017-18, City Projects Office will continue to deliver high quality professional services to meet Council's engineering, built environment, land management and natural environment needs, within the framework of the Brisbane Vision.
The business will support its partners to deliver across a broad range of programs across Council.
City Projects Office proposed investments in 2017-18 are focused on maintaining industry standard tools of trade through a planned replacement program for high specification technical workstations and related design and modelling software, as well as replacing end-of-life laboratory and survey equipment.
City Projects Office is primarily funded from Council's Annual Plan and Budget, supplemented by revenue from services supplied to Queensland and local government bodies. Surpluses after the application of the requirements of the TER are returned back to Council's consolidated revenue.
City Projects Office has nil outstanding or proposed borrowings.
The position of Executive Manager, City Projects Office has delegations under Council's Administrative Arrangements for the general working and business operations of City Projects Office, with responsibility through the Divisional Manager, Brisbane Infrastructure to the Chief Executive Officer of Council.
City Projects Office will report on financial and non-financial outcomes, indicators and targets as contained in the Annual Plan and Budget document.
10

Businesses and Council Providers
City Projects Office 2016-17 2017-18 2018-19 2019-20Budgeted Income Statement Anticipated Proposed Proposed Proposedfor the year ending 30 June 2018 $000 $000 $000 $000
Revenue
External revenue 330 1,236 1,238 1,258Community service obligations - - - -Interest revenue - - - -Other revenue - - - -Gain/(loss) on disposal - - - -
Total revenue 330 1,236 1,238 1,258
Expenses
Employee costs 45,271 46,952 47,880 48,874Materials and services 66,927 71,306 68,087 43,433Depreciation and amortisation 28 74 74 53Finance costs - - - -Competitive neutrality costs 4 36 36 36Other expenses - - - -Total expenses 112,230 118,368 116,077 92,396
Less costs allocated to internal services 111,961 117,235 114,931 91,225
Total expenses relating to external services
269 1,133 1,146 1,171
Net surplus/(loss) before tax 61 103 92 87
Imputed income tax 18 31 28 26
Increase/(decrease) in operating capability after tax
43 72 64 61
11

Businesses and Council Providers
Civil Construction and Maintenance Operations
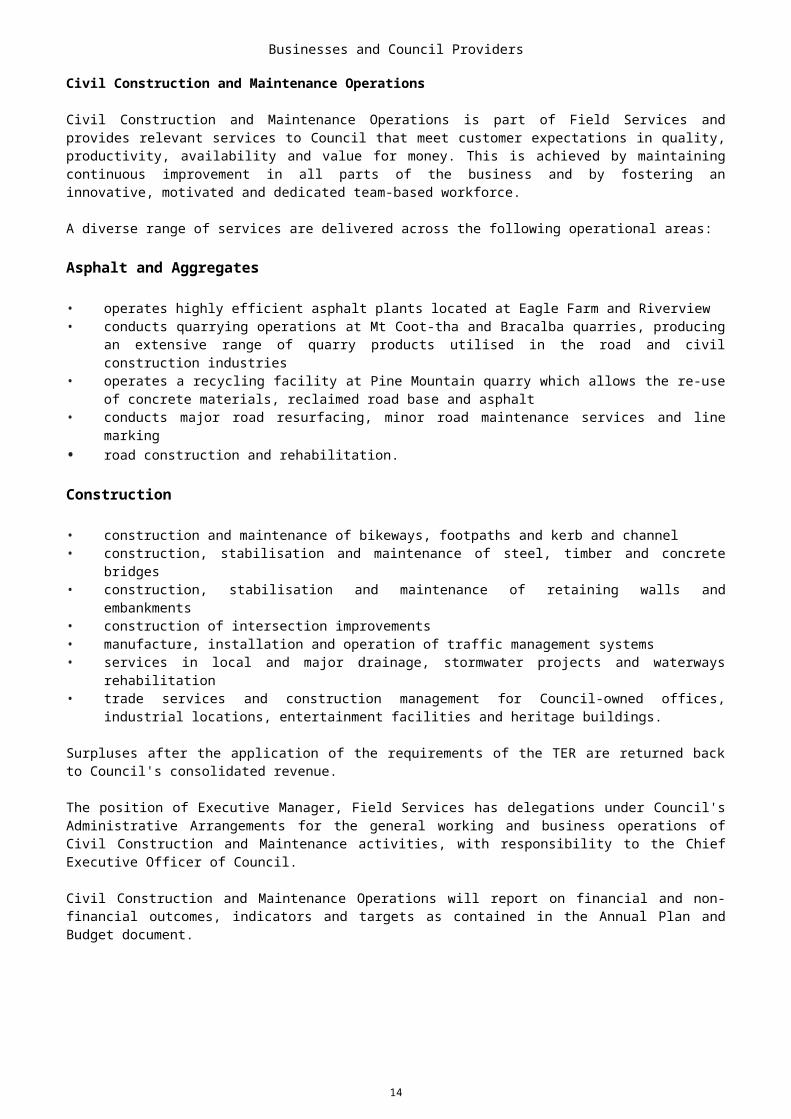
Civil Construction and Maintenance Operations is part of Field Services and provides relevant services to Council that meet customer expectations in quality, productivity, availability and value for money. This is achieved by maintaining continuous improvement in all parts of the business and by fostering an innovative, motivated and dedicated team-based workforce.
A diverse range of services are delivered across the following operational areas:
Asphalt and Aggregates
• operates highly efficient asphalt plants located at Eagle Farm and Riverview• conducts quarrying operations at Mt Coot-tha and Bracalba quarries, producing an extensive range of
quarry products utilised in the road and civil construction industries• operates a recycling facility at Pine Mountain quarry which allows the re-use of concrete materials,
reclaimed road base and asphalt• conducts major road resurfacing, minor road maintenance services and line marking• road construction and rehabilitation.
Construction
• construction and maintenance of bikeways, footpaths and kerb and channel• construction, stabilisation and maintenance of steel, timber and concrete bridges• construction, stabilisation and maintenance of retaining walls and embankments• construction of intersection improvements• manufacture, installation and operation of traffic management systems• services in local and major drainage, stormwater projects and waterways rehabilitation • trade services and construction management for Council-owned offices, industrial locations,
entertainment facilities and heritage buildings.
Surpluses after the application of the requirements of the TER are returned back to Council's consolidated revenue.
The position of Executive Manager, Field Services has delegations under Council's Administrative Arrangements for the general working and business operations of Civil Construction and Maintenance activities, with responsibility to the Chief Executive Officer of Council.
Civil Construction and Maintenance Operations will report on financial and non-financial outcomes, indicators and targets as contained in the Annual Plan and Budget document.
12

Businesses and Council Providers
Civil Construction and Maintenance Operations
2016-17Anticipated
2017-18Proposed
2018-19Proposed
2019-20Proposed
Budgeted Income Statement $000 $000 $000 $000for the year ending 30 June 2018
Revenue
External revenue 38,633 33,891 35,247 36,656Community service obligations - - - -Interest revenue - - - -Other revenue - - - -Gain/(loss) on disposal - - - -Total revenue 38,633 33,891 35,247 36,656
Expenses
Employee costs 38,873 35,828 35,528 37,427Materials and services 82,565 77,231 79,746 82,810Depreciation and amortisation 3,931 4,291 4,294 4,062Finance costs - - - -Competitive neutrality costs 118 111 114 117Other expenses - - - -Total expenses 125,487 117,461 119,682 124,416
Less costs allocated to internal services 92,102 88,962 90,465 94,104
Total expenses relating to external services
33,385 28,499 29,217 30,312
Net surplus/(loss) before tax 5,248 5,392 6,030 6,344
Imputed income tax 1,574 1,618 1,809 1,903
Increase/(decrease) in operating capability after tax
3,674 3,774 4,221 4,441
13
Businesses and Council Providers
Urban Amenity
Urban Amenity delivers a broad range of services including the following:
• cleaning of urban precincts and streets, including bus stops, graffiti removal, road sweeping and stormwater gully cleaning
• delivery of arboriculture, natural area, parkland and horticultural maintenance services, including street tree maintenance
• delivery of pest, weeds and vermin control services• delivery of street and project sign maintenance and installation.
Surpluses after the application of the requirements of the TER are returned back to Council's consolidated revenue.
The position of Executive Manager, Field Services has delegations under the Council's Administrative Arrangements for the general working and business operations of Urban Amenity activities, with responsibility to the Chief Executive Officer of Council.
Urban Amenity will report on financial and non-financial outcomes, indicators and targets as contained in the Annual Plan and Budget document.
14

Businesses and Council Providers
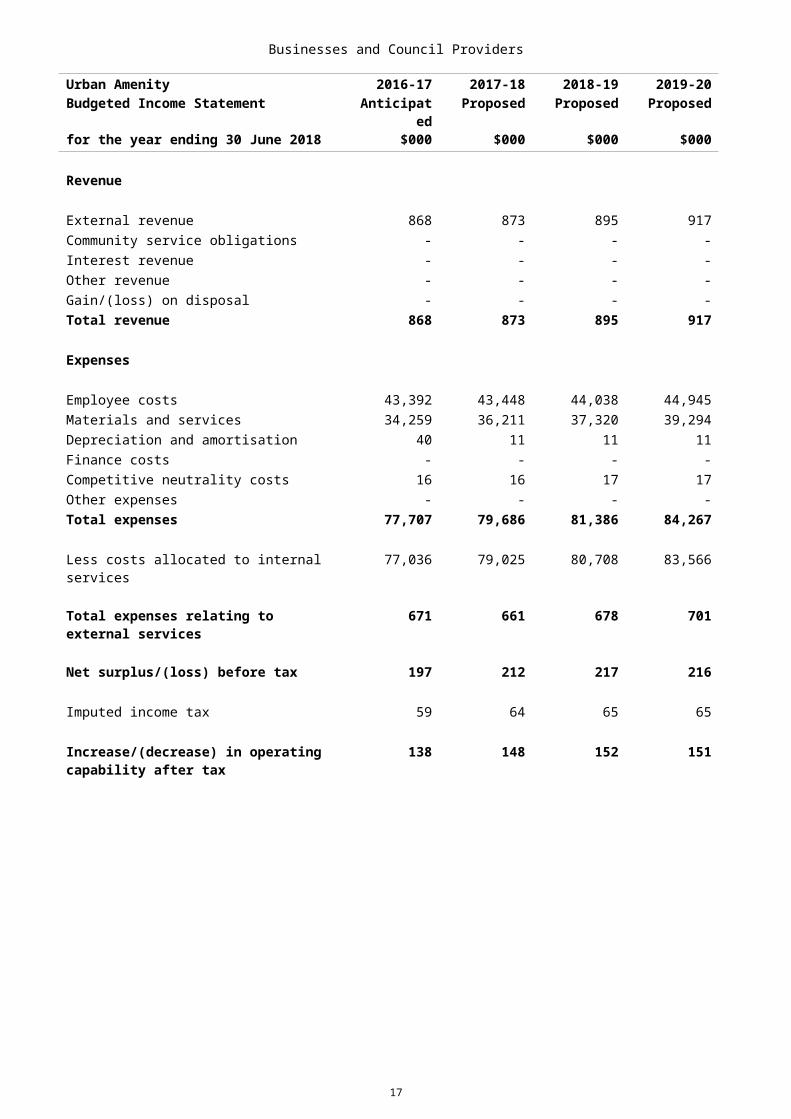
Urban Amenity 2016-17 2017-18 2018-19 2019-20Budgeted Income Statement Anticipated Proposed Proposed Proposedfor the year ending 30 June 2018 $000 $000 $000 $000
Revenue
External revenue 868 873 895 917Community service obligations - - - -Interest revenue - - - -Other revenue - - - -Gain/(loss) on disposal - - - -Total revenue 868 873 895 917
Expenses
Employee costs 43,392 43,448 44,038 44,945Materials and services 34,259 36,211 37,320 39,294Depreciation and amortisation 40 11 11 11Finance costs - - - -Competitive neutrality costs 16 16 17 17Other expenses - - - -Total expenses 77,707 79,686 81,386 84,267
Less costs allocated to internal services 77,036 79,025 80,708 83,566
Total expenses relating to external services
671 661 678 701
Net surplus/(loss) before tax 197 212 217 216
Imputed income tax 59 64 65 65
Increase/(decrease) in operating capability after tax
138 148 152 151
15
Businesses and Council Providers
Waste and Resource Recovery Services
Waste and Resource Recovery Services provides waste management and recycling services that are competitive, sustainable and environmentally responsible. These services reflect a commitment to public health, whole of life cycle waste management and industry best practice.
Waste and Resource Recovery Services will:
• undertake the collection and management of domestic waste and recycling materials• through Brisbane Waste Innovations Alliance, ensure the resource recovery centres at Nudgee,
Willawong, Chandler and Ferny Grove Tips Shops and the Brisbane landfill at Rochedale are effectively managed, with a focus on innovation in the area of environmental sustainability
• strive to achieve environmental excellence through raising the current operating standards by using new technology and investigating Towards Zero Waste solutions
• deliver strategies on waste minimisation and litter in accordance with the ’Brisbane. Clean, green, sustainable’ plan
• work with industry to develop robust markets for recyclable materials• develop and deliver education and communication on waste management, waste minimisation and litter
to improve community understanding and influence behaviour change• work with the Queensland Government to deliver waste reduction programs in accordance with the
current legislation.
Surpluses after the application of the requirements of the TER are returned back to Council's consolidated revenue.
The position of Executive Manager, Field Services has delegations under Council's Administrative Arrangements for the general working and business operations of Waste and Resource Recovery Services activities, with responsibility to the Chief Executive Officer of Council.
Waste and Resource Recovery Services will report on financial and non-financial outcomes, indicators and targets as contained in the Annual Plan and Budget document.
16
Businesses and Council Providers
Waste and Resource Recovery Services 2016-17 2017-18 2018-19 2019-20Budgeted Income Statement Anticipated Proposed Proposed Proposedfor the year ending 30 June 2018 $000 $000 $000 $000
Revenue
External revenue 146,856 154,361 164,858 176,389Community service obligations - - - -Interest revenue - - - -Other revenue 4,016 3,263 1,898 1,901Gain/(loss) on disposal -93 - - -Total revenue 150,779 157,624 166,756 178,290
Expenses
Employee costs 4,918 5,097 5,022 4,968Materials and services 127,149 130,291 141,083 150,083Depreciation and amortisation 4,102 3,654 3,499 3,431Finance costs - - - -Competitive neutrality costs 206 223 229 235Other expenses - - - -Total expenses 136,375 139,265 149,833 158,717
Less costs allocated to internal services - - - -
Total expenses relating to external services
136,375 139,265 149,833 158,717
Net surplus/(loss) before lax 14,404 18,359 16,923 19,573
Imputed income tax 4,321 5,508 5,077 5,872
Increase/(decrease) in operating capability after tax
10,083 12,851 11,846 13,701
17

Businesses and Council Providers
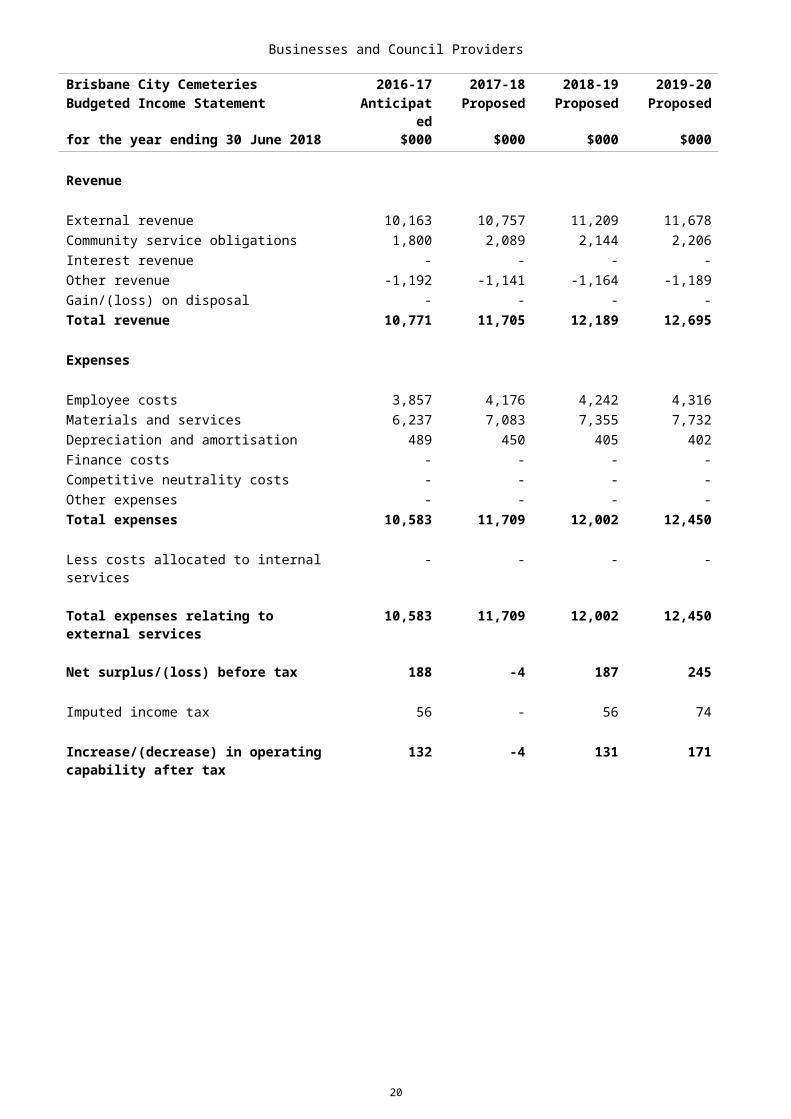
Brisbane City Cemeteries 2016-17 2017-18 2018-19 2019-20Budgeted Income Statement Anticipated Proposed Proposed Proposedfor the year ending 30 June 2018 $000 $000 $000 $000
Revenue
External revenue 10,163 10,757 11,209 11,678Community service obligations 1,800 2,089 2,144 2,206Interest revenue - - - -Other revenue -1,192 -1,141 -1,164 -1,189Gain/(loss) on disposal - - - -Total revenue 10,771 11,705 12,189 12,695
Expenses
Employee costs 3,857 4,176 4,242 4,316Materials and services 6,237 7,083 7,355 7,732Depreciation and amortisation 489 450 405 402Finance costs - - - -Competitive neutrality costs - - - -Other expenses - - - -Total expenses 10,583 11,709 12,002 12,450
Less costs allocated to internal services - - - -
Total expenses relating to external services
10,583 11,709 12,002 12,450
Net surplus/(loss) before tax 188 -4 187 245
Imputed income tax 56 - 56 74
Increase/(decrease) in operating capability after tax
132 -4 131 171
18

Businesses and Council Providers
City Parking
Objectives
City Parking’s objective is to meet customer needs and contribute to both liveability and economic outcomes by delivering accessible and reliable parking services.
Role
City Parking manages parking services in Council’s off street parking stations as well as temporary and event parking. In this role City Parking:
• provides competitive car parking services to all customers• ensures customer focused service• partners with Council Programs to ensure Brisbane’s liveability• partners with third parties to establish cohesive working relationships• maintains Council assets and equipment to best practice standards.
Financial and non-financial targets
In 2017-18 achieve:
• net surplus before tax as stated in Budgeted Financial Statement• Average number of vehicles per bay per day in King George Square car park• Average number of vehicles per bay per day in Wickham Terrace car park.
Community service obligations
City Parking has no community service obligations.
Notional capital structure and surpluses
City Parking’s notional capital structure is by way of equity funding from Council. Surpluses are treated in accordance with Council’s dividend policy for Business Units after the application of the requirements of the TER with any TER income tax remitted to Council.
Proposed major investments
There are no proposed major investments.
Borrowings
City Parking has no outstanding or proposed borrowings.
Service quality
City Parking will provide accessible, reliable and competitive services.
Delegations
The positions of City Parking and Asset Portfolio Management Manager have delegations under the Council’s Administrative Arrangements for the working and business operations of City Parking with responsibility to the Chief Executive Officer of Council.
Reportable information
City Parking will report to Council regarding its operations and performance including financial and non-financial targets.
19
Businesses and Council Providers
City Parking 2016-17 2017-18 2018-19 2019-20Budgeted Income Statement Anticipated Proposed Proposed Proposedfor the year ending 30 June 2018 $000 $000 $000 $000
Revenue
External revenue 30,445 31,112 31,784 32,471Community service obligations - - - -Interest revenue - - - -Other revenue - - - -Gain/(loss) on disposal - - - -Total revenue 30,445 31,112 31,784 32,471
Expenses
Employee costs 2,529 2,420 2,394 2,390Materials and services 7,815 9,228 9,513 10,353Depreciation and amortisation 1,060 1,439 1,403 1,201Finance costs - - - -Competitive neutrality costs - - - -Other expenses 3 4 4 4Total expenses 11,407 13,091 13,314 13,948
Less costs allocated to internal services - - - -
Total expenses relating to external services
11,407 13,091 13,314 13,948
Net surplus/(loss) before tax 19,038 18,021 18,470 18,523
Imputed income tax 696 362 378 333
Increase/(decrease) in operating capability after tax
18,342 17,659 18,092 18,190
20

Businesses and Council Providers
City Venues
Lifestyle and Community Services Division manages community facilities including golf courses, swimming pools, sports facilities, the Riverstage and the Sir Thomas Brisbane Planetarium. In addition to the venue management services associated with these facilities, Lifestyle and Community Services also provides event management and community contract management services to Council and community organisations.
Lifestyle and Community Services will:
• provide a high level of customer service• provide value for money products and services• explore innovative and sustainable improvements to the productivity of its facilities• explore opportunities with private enterprise to improve services • manage events on behalf of Council and the community in a professional and cost-effective manner• maintain all venues to a high standard.
Golf Courses
Lifestyle and Community Services Division manages the two Council Golf Courses, St Lucia Golf Links and the Victoria Park Golf Complex. In addition to the venue maintenance services associated with these two courses, Lifestyle and Community Services also provides contract management of the leases and licences in place to operate the function centres and ancillary services at these sites.
Lifestyle and Community Services will:
• provide a high level of customer service• provide value for money products and services• explore innovative and sustainable improvements to the productivity of its golf facilities• explore opportunities with private enterprise to improve services• maintain both golf courses to a high standard.
Surpluses after the application of the requirements of the TER are returned back to Council's consolidated revenue.
The position of Divisional Manager, Lifestyle and Community Services has delegations under the Council's Administrative Arrangements for the general working and business operations of City Venues, with responsibility to the Chief Executive Officer of Council.
City Venues will report on financial and non-financial outcomes, indicators and targets as contained in the Annual Plan and Budget document.
Riverstage
Lifestyle and Community Services Division manages Riverstage outdoor venue, located in the City Botanic Gardens. In addition to the venue operations associated with Riverstage, Lifestyle and Community Services also manages the venue maintenance services at this site.
Lifestyle and Community Services will:• provide a high level of customer service• provide value for money products and services• explore innovative and sustainable improvements to the productivity of Riverstage• explore opportunities with private enterprise to improve services• maintain the venue to a high standard.
Surpluses after the application of the requirements of the TER are returned back to Council's consolidated revenue.
The position of Divisional Manager, Lifestyle and Community Services has delegations under the Council's Administrative Arrangements for the general working and business operations of City Venues, with responsibility to the Chief Executive Officer of Council.
City Venues will report on financial and non-financial outcomes, indicators and targets as contained in the Annual Plan and Budget document.
21

Businesses and Council Providers
Golf Courses 2016-17 2017-18 2018-19 2019-20Budgeted Income Statement Anticipated Proposed Proposed Proposedfor the year ending 30 June 2018 $000 $000 $000 $000
Revenue
External revenue 3,399 3,484 3,672 3,761Community service obligations 48 1,274 1,390 1,512Interest revenue - - - -Other revenue - - - -Gain/(loss) on disposal - - - -Total revenue 3,447 4,758 5,062 5,273
Expenses
Employee costs 1,091 1,045 1,058 1,089Materials and services 2,104 2,610 2,793 2,923Depreciation and amortisation - 891 994 1,040Finance costs - - - -Competitive neutrality costs - - - -Other expenses 207 212 217 221Total expenses 3,402 4,758 5,062 5,273
Less costs allocated to internal services - - - -
Total expenses relating to external services
3,402 4,758 5,062 5,273
Net surplus/(loss) before tax 45 - - -
Imputed income tax 14 - - -
Increase/(decrease) in operating capability after tax
31 - - -
22

Businesses and Council Providers
Riverstage 2017-18 2018-19 2019-20Budgeted Income Statement Proposed Proposed Proposedfor the year ending 30 June 2018 $000 $000 $000
Revenue
External revenue 2,417 2,477 2,539Community service obligations 539 571 602Interest revenue - - -Other revenue - - -Gain/(loss) on disposal - - -Total revenue 2,956 3,048 3,141
Expenses
Employee costs 343 363 359Materials and services 2,510 2,581 2,677Depreciation and amortisation 103 104 105Finance costs - - -Competitive neutrality costs - - -Other expenses - - -Total expenses 2,956 3,048 3,141
Less costs allocated to internal services - - -
Total expenses relating to external services 2,956 3,048 3,141
Net surplus/(loss) before tax - - -
Imputed income tax - - -
Increase/(decrease) in operating capability after tax - - -
23

Businesses and Council Providers
Asset Portfolio Management
Asset Portfolio Management's aim is to deliver and manage a corporate real estate property portfolio to Council which can be benchmarked against industry standards.
Activities undertaken to achieve this aim include:
• providing a knowledgeable resource for the management and delivery of property asset management across the organisation
• managing Council’s real estate portfolio in a manner that optimises the financial return and benefit to the organisation, while facilitating Council’s urban renewal and development initiatives
• managing Council's property lease portfolio for land, buildings (commercial, retail, industrial, residential), advertising signs/billboards and telecommunication installations from initial identification of need through to surrender/termination.
• providing comprehensive property services including management of the assigned built environment particularly relating to maintenance initiatives, corporate property services contracts, risk management practices and legislative and statutory compliance matters such as environmental and heritage management and workplace health and safety.
• Fire and Life Safety - provide Council sites with "Building Fire and Life Safety" maintenance standards and compliance. Manage and reduce risk of loss of life and property. Ensure sites are safe to occupy. Liaise with authorities and regulatory bodies on compliance. Work with FPAA on improved standards.
Community service obligations
With the inclusion of City Hall building and Sport and Aquatic Centres within the Asset Portfolio Management business activity, this has given rise to a CSO from this financial year, in consideration of the significant involvement of those facilities in achieving community objectives for which full cost recovery is not undertaken.
City Hall administers the Lord Mayor’s Community Service Obligation fund that supports community use of the facility for functions and events. The City Hall facility remains accessible to residents and visitors of Brisbane. Public areas in the facility are open daily. The facility is closed three days per year and open from 8am-5pm weekdays and 9am-5pm weekends.
Similarly, managing the Sports and Aquatic Centres incorporates Calamvale Community Sports Centre, Acacia Ridge Leisure Centre, Hibiscus Sports Complex and the 21 community pools. APM provides the operational maintenance and asset coordination at the venues.
In meeting community objectives, Asset Portfolio Management seeks to:
• facilitate the service operators to provide a high level of customer service• facilitates the provision of value for money products and services which involves subsidising services• explore innovative and sustainable improvements to the productivity of its sports and aquatic facilities• explore opportunities with private enterprise to improve services• manage events on behalf of Council and the community in a professional and cost-effective manner• maintain facilities to a high standard and maintain the heritage facility to a high standard
24

Businesses and Council Providers
Asset Portfolio Management 2016-17 2017-18 2018-19 2019-20Budgeted Income Statement Anticipate
d Proposed Proposed Proposedfor the year ending 30 June 2018 $000 $000 $000 $000
Revenue
External revenue 11,278 11,198 10,887 11,209Community service obligations 10,556 11,160 11,862 12,355Interest revenue - - - -Other revenue - - - -Gain/(loss) on disposal - - - -Total revenue 21,834 22,358 22,749 23,564
Expenses
Employee costs 480 482 492 504Materials and services 84,784 90,938 94,189 96,663Depreciation and amortisation 16,713 17,653 18,609 19,250Finance costs 10,313 10,311 10,300 10,080Competitive neutrality costs - - - -Other expenses - - - -Total expenses 112,290 119,384 123,590 126,497
Less costs allocated to internal services 96,582 103,047 106,214 108,400
Total expenses relating to external services 15,708 16,337 17,376 18,097
Net surplus/(loss) before tax 6,126 6,021 5,373 5,467
Imputed income tax 1,838 1,806 1,612 1,640
Increase/(decrease) in operating capability after tax 4,288 4,215 3,761 3,827
25