Embed Size (px)
Citation preview
January 7, 2015
Initiating Coverage
ICICI Securities Ltd | Retail Equity Research
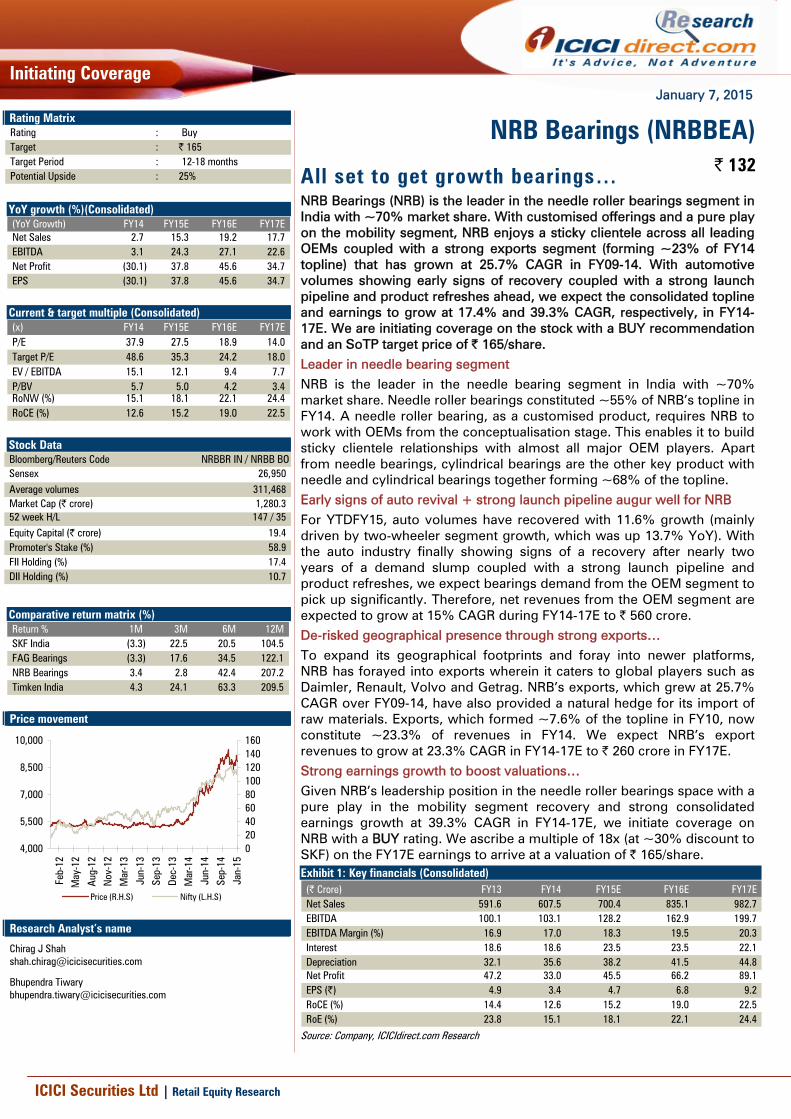
All set to get growth bearings… NRB Bearings (NRB) is the leader in the needle roller bearings segment in India with ~70% market share. With customised offerings and a pure play on the mobility segment, NRB enjoys a sticky clientele across all leading OEMs coupled with a strong exports segment (forming ~23% of FY14 topline) that has grown at 25.7% CAGR in FY09-14. With automotive volumes showing early signs of recovery coupled with a strong launch pipeline and product refreshes ahead, we expect the consolidated topline and earnings to grow at 17.4% and 39.3% CAGR, respectively, in FY14-17E. We are initiating coverage on the stock with a BUY recommendation and an SoTP target price of | 165/share. Leader in needle bearing segment NRB is the leader in the needle bearing segment in India with ~70% market share. Needle roller bearings constituted ~55% of NRB’s topline in FY14. A needle roller bearing, as a customised product, requires NRB to work with OEMs from the conceptualisation stage. This enables it to build sticky clientele relationships with almost all major OEM players. Apart from needle bearings, cylindrical bearings are the other key product with needle and cylindrical bearings together forming ~68% of the topline. Early signs of auto revival + strong launch pipeline augur well for NRB For YTDFY15, auto volumes have recovered with 11.6% growth (mainly driven by two-wheeler segment growth, which was up 13.7% YoY). With the auto industry finally showing signs of a recovery after nearly two years of a demand slump coupled with a strong launch pipeline and product refreshes, we expect bearings demand from the OEM segment to pick up significantly. Therefore, net revenues from the OEM segment are expected to grow at 15% CAGR during FY14-17E to | 560 crore. De-risked geographical presence through strong exports… To expand its geographical footprints and foray into newer platforms, NRB has forayed into exports wherein it caters to global players such as Daimler, Renault, Volvo and Getrag. NRB’s exports, which grew at 25.7% CAGR over FY09-14, have also provided a natural hedge for its import of raw materials. Exports, which formed ~7.6% of the topline in FY10, now constitute ~23.3% of revenues in FY14. We expect NRB’s export revenues to grow at 23.3% CAGR in FY14-17E to | 260 crore in FY17E. Strong earnings growth to boost valuations… Given NRB’s leadership position in the needle roller bearings space with a pure play in the mobility segment recovery and strong consolidated earnings growth at 39.3% CAGR in FY14-17E, we initiate coverage on NRB with a BUY rating. We ascribe a multiple of 18x (at ~30% discount to SKF) on the FY17E earnings to arrive at a valuation of | 165/share.
Exhibit 1: Key financials (Consolidated) (| Crore) FY13 FY14 FY15E FY16E FY17ENet Sales 591.6 607.5 700.4 835.1 982.7 EBITDA 100.1 103.1 128.2 162.9 199.7 EBITDA Margin (%) 16.9 17.0 18.3 19.5 20.3 Interest 18.6 18.6 23.5 23.5 22.1 Depreciation 32.1 35.6 38.2 41.5 44.8 Net Profit 47.2 33.0 45.5 66.2 89.1 EPS (|) 4.9 3.4 4.7 6.8 9.2 RoCE (%) 14.4 12.6 15.2 19.0 22.5 RoE (%) 23.8 15.1 18.1 22.1 24.4
Source: Company, ICICIdirect.com Research
NRB Bearings (NRBBEA)| 132
Rating Matrix Rating : BuyTarget : | 165Target Period : 12-18 monthsPotential Upside : 25%
YoY growth (%)(Consolidated)
(YoY Growth) FY14 FY15E FY16E FY17ENet Sales 2.7 15.3 19.2 17.7 EBITDA 3.1 24.3 27.1 22.6 Net Profit (30.1) 37.8 45.6 34.7 EPS (30.1) 37.8 45.6 34.7
Current & target multiple (Consolidated)
(x) FY14 FY15E FY16E FY17EP/E 37.9 27.5 18.9 14.0 Target P/E 48.6 35.3 24.2 18.0 EV / EBITDA 15.1 12.1 9.4 7.7 P/BV 5.7 5.0 4.2 3.4 RoNW (%) 15.1 18.1 22.1 24.4 RoCE (%) 12.6 15.2 19.0 22.5
Stock Data Bloomberg/Reuters Code NRBBR IN / NRBB BOSensex 26,950 Average volumes 311,468 Market Cap (| crore) 1,280.3 52 week H/L 147 / 35Equity Capital (| crore) 19.4 Promoter's Stake (%) 58.9 FII Holding (%) 17.4 DII Holding (%) 10.7
Comparative return matrix (%)
Return % 1M 3M 6M 12MSKF India (3.3) 22.5 20.5 104.5 FAG Bearings (3.3) 17.6 34.5 122.1 NRB Bearings 3.4 2.8 42.4 207.2 Timken India 4.3 24.1 63.3 209.5
Price movement
020406080100120140160
Jan-
15
Sep-
14
Jun-
14
Mar
-14
Dec-
13
Sep-
13
Jun-
13
Mar
-13
Nov
-12
Aug
-12
May
-12
Feb-
12
4,000
5,500
7,000
8,500
10,000
Price (R.H.S) Nifty (L.H.S)
Research Analyst’s name
Chirag J Shah [email protected]
Bhupendra Tiwary [email protected]
Page 2ICICI Securities Ltd | Retail Equity Research
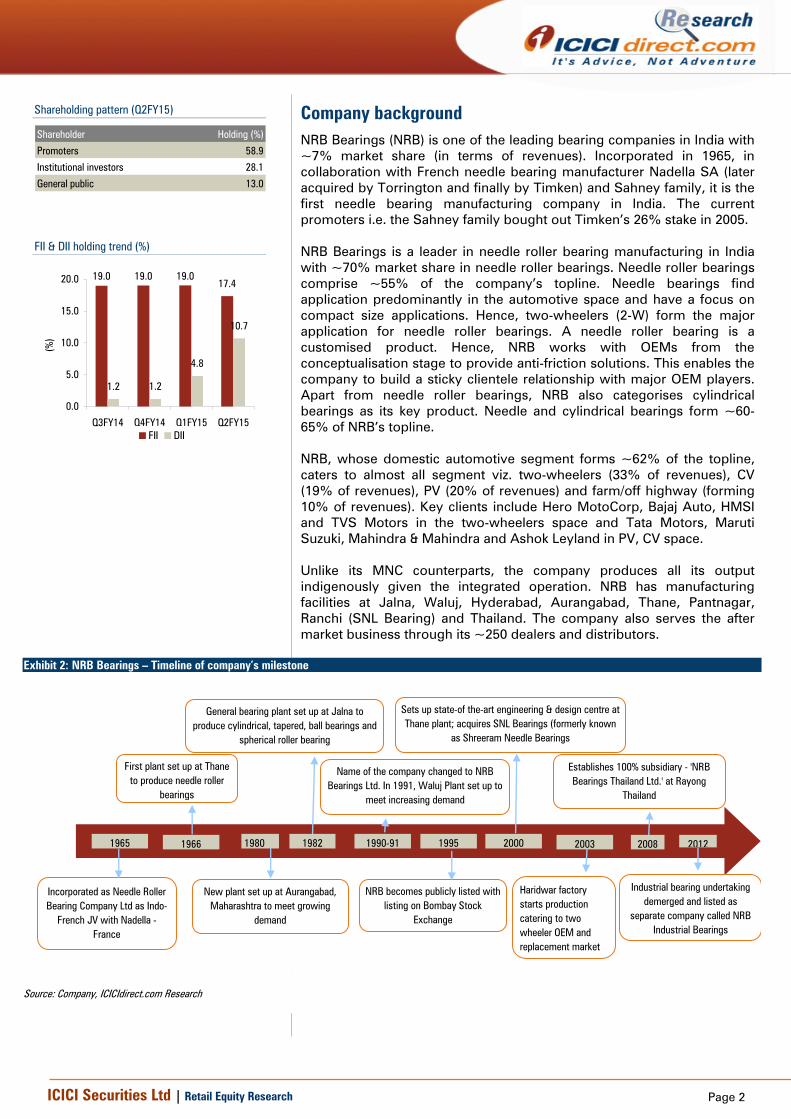
Company background NRB Bearings (NRB) is one of the leading bearing companies in India with ~7% market share (in terms of revenues). Incorporated in 1965, in collaboration with French needle bearing manufacturer Nadella SA (later acquired by Torrington and finally by Timken) and Sahney family, it is the first needle bearing manufacturing company in India. The current promoters i.e. the Sahney family bought out Timken’s 26% stake in 2005. NRB Bearings is a leader in needle roller bearing manufacturing in India with ~70% market share in needle roller bearings. Needle roller bearings comprise ~55% of the company’s topline. Needle bearings find application predominantly in the automotive space and have a focus on compact size applications. Hence, two-wheelers (2-W) form the major application for needle roller bearings. A needle roller bearing is a customised product. Hence, NRB works with OEMs from the conceptualisation stage to provide anti-friction solutions. This enables the company to build a sticky clientele relationship with major OEM players. Apart from needle roller bearings, NRB also categorises cylindrical bearings as its key product. Needle and cylindrical bearings form ~60-65% of NRB’s topline. NRB, whose domestic automotive segment forms ~62% of the topline, caters to almost all segment viz. two-wheelers (33% of revenues), CV (19% of revenues), PV (20% of revenues) and farm/off highway (forming 10% of revenues). Key clients include Hero MotoCorp, Bajaj Auto, HMSI and TVS Motors in the two-wheelers space and Tata Motors, Maruti Suzuki, Mahindra & Mahindra and Ashok Leyland in PV, CV space. Unlike its MNC counterparts, the company produces all its output indigenously given the integrated operation. NRB has manufacturing facilities at Jalna, Waluj, Hyderabad, Aurangabad, Thane, Pantnagar, Ranchi (SNL Bearing) and Thailand. The company also serves the after market business through its ~250 dealers and distributors.
Exhibit 2: NRB Bearings – Timeline of company’s milestone
First plant set up at Thane to produce needle roller
bearings
General bearing plant set up at Jalna to produce cylindrical, tapered, ball bearings and
spherical roller bearing
Incorporated as Needle Roller Bearing Company Ltd as Indo-
French JV with Nadella - France
New plant set up at Aurangabad, Maharashtra to meet growing
demand
NRB becomes publicly listed with listing on Bombay Stock
Exchange
Haridwar factory starts production catering to two wheeler OEM and replacement market
1965 1980
Name of the company changed to NRB Bearings Ltd. In 1991, Waluj Plant set up to
meet increasing demand
Sets up state-of the-art engineering & design centre at Thane plant; acquires SNL Bearings (formerly known
as Shreeram Needle Bearings
Establishes 100% subsidiary - 'NRB Bearings Thailand Ltd.' at Rayong
Thailand
2012
Industrial bearing undertaking demerged and listed as
separate company called NRB Industrial Bearings
20081966 1982 1990-91 1995 2000 2003
Source: Company, ICICIdirect.com Research
Shareholding pattern (Q2FY15)
Shareholder Holding (%)
Promoters 58.9
Institutional investors 28.1
General public 13.0
FII & DII holding trend (%)
19.0 19.0 19.017.4
1.2 1.2
4.8
10.7
0.0
5.0
10.0
15.0
20.0
Q3FY14 Q4FY14 Q1FY15 Q2FY15
(%)
FII DII
Page 3ICICI Securities Ltd | Retail Equity Research
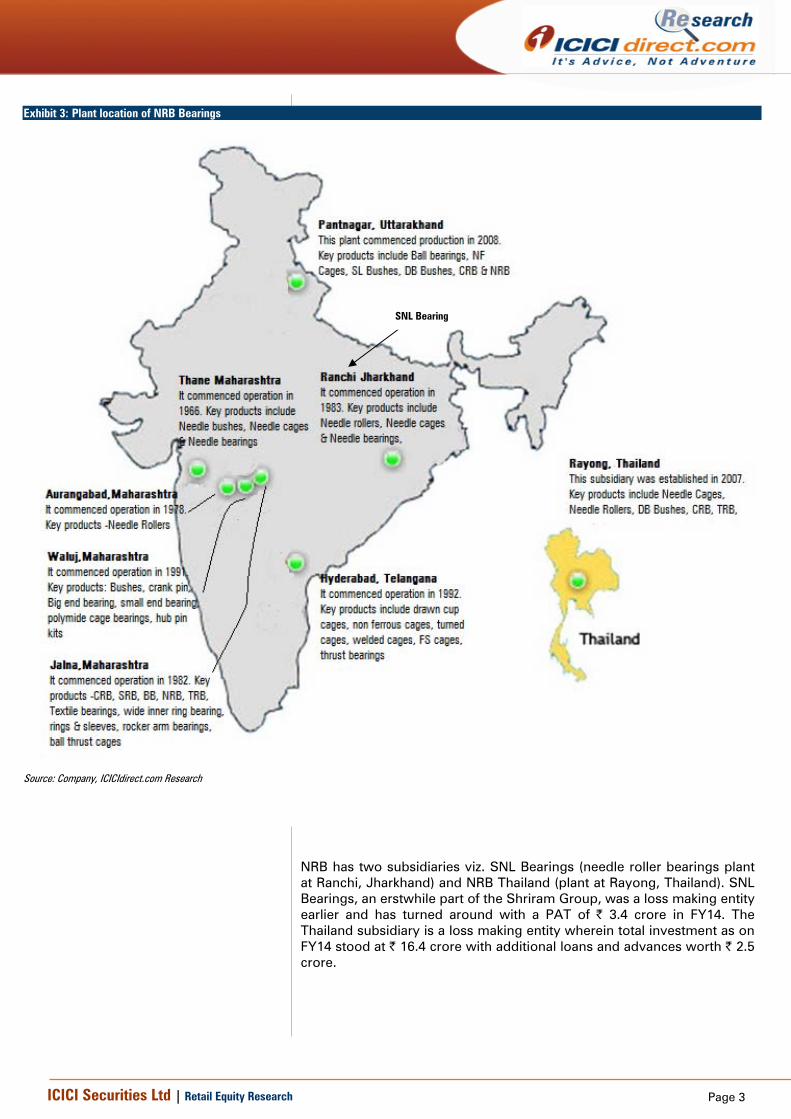
Exhibit 3: Plant location of NRB Bearings
Source: Company, ICICIdirect.com Research
NRB has two subsidiaries viz. SNL Bearings (needle roller bearings plant at Ranchi, Jharkhand) and NRB Thailand (plant at Rayong, Thailand). SNL Bearings, an erstwhile part of the Shriram Group, was a loss making entity earlier and has turned around with a PAT of | 3.4 crore in FY14. The Thailand subsidiary is a loss making entity wherein total investment as on FY14 stood at | 16.4 crore with additional loans and advances worth | 2.5 crore.
SNL Bearing
Page 4ICICI Securities Ltd | Retail Equity Research
Investment Rationale Leader in needle bearings segment
Needle bearings form ~5% of total bearings in India
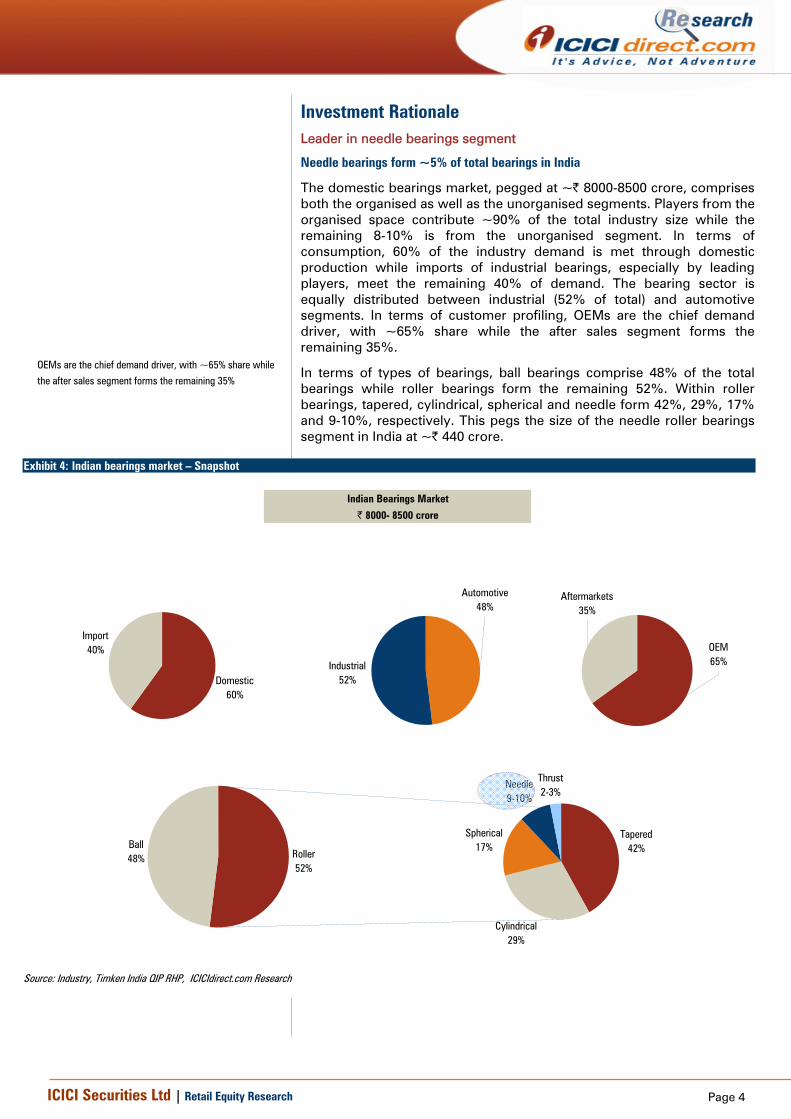
The domestic bearings market, pegged at ~| 8000-8500 crore, comprises both the organised as well as the unorganised segments. Players from the organised space contribute ~90% of the total industry size while the remaining 8-10% is from the unorganised segment. In terms of consumption, 60% of the industry demand is met through domestic production while imports of industrial bearings, especially by leading players, meet the remaining 40% of demand. The bearing sector is equally distributed between industrial (52% of total) and automotive segments. In terms of customer profiling, OEMs are the chief demand driver, with ~65% share while the after sales segment forms the remaining 35%.
In terms of types of bearings, ball bearings comprise 48% of the total bearings while roller bearings form the remaining 52%. Within roller bearings, tapered, cylindrical, spherical and needle form 42%, 29%, 17% and 9-10%, respectively. This pegs the size of the needle roller bearings segment in India at ~| 440 crore.
Exhibit 4: Indian bearings market – Snapshot
Indian Bearings Market
| 8000- 8500 crore
Domestic60%
Import40%
Automotive48%
Industrial52%
Roller52%
Ball48%
Tapered42%
Cylindrical29%
Spherical17%
Needle9-10%
Thrust2-3%
OEM65%
Aftermarkets35%
Source: Industry, Timken India QIP RHP, ICICIdirect.com Research
OEMs are the chief demand driver, with ~65% share while
the after sales segment forms the remaining 35%
Page 5ICICI Securities Ltd | Retail Equity Research
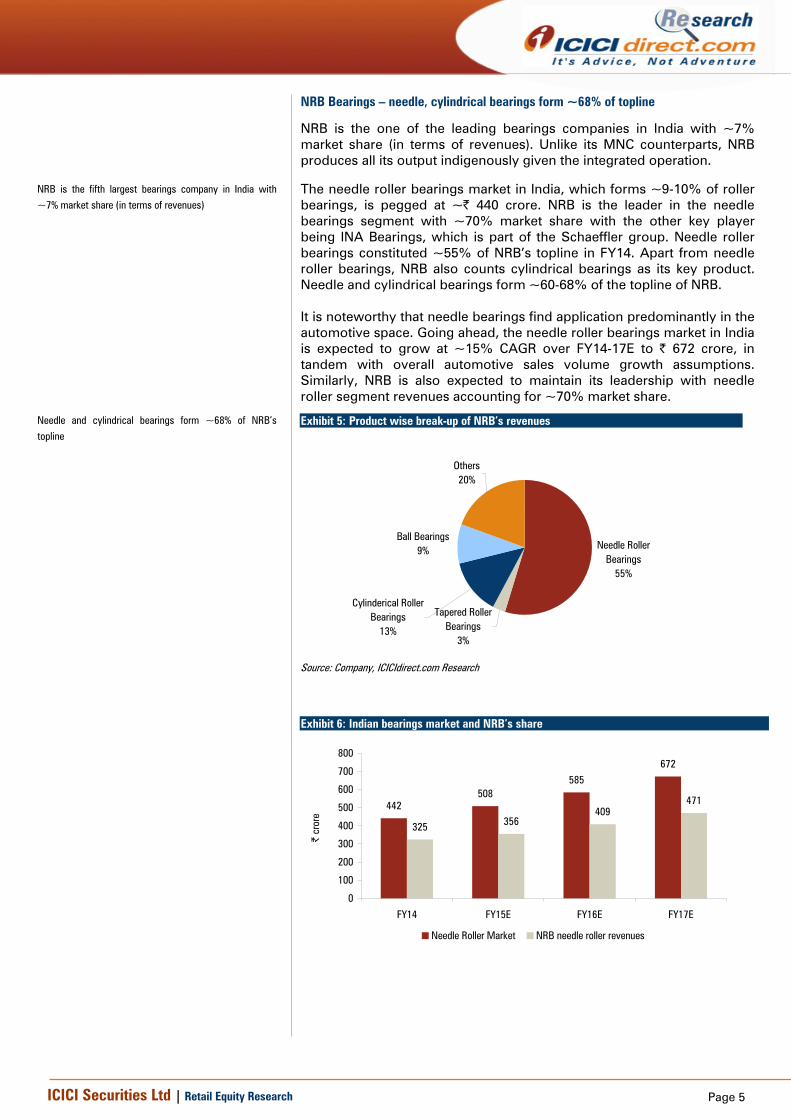
NRB Bearings – needle, cylindrical bearings form ~68% of topline
NRB is the one of the leading bearings companies in India with ~7% market share (in terms of revenues). Unlike its MNC counterparts, NRB produces all its output indigenously given the integrated operation.
The needle roller bearings market in India, which forms ~9-10% of roller bearings, is pegged at ~| 440 crore. NRB is the leader in the needle bearings segment with ~70% market share with the other key player being INA Bearings, which is part of the Schaeffler group. Needle roller bearings constituted ~55% of NRB’s topline in FY14. Apart from needle roller bearings, NRB also counts cylindrical bearings as its key product. Needle and cylindrical bearings form ~60-68% of the topline of NRB. It is noteworthy that needle bearings find application predominantly in the automotive space. Going ahead, the needle roller bearings market in India is expected to grow at ~15% CAGR over FY14-17E to | 672 crore, in tandem with overall automotive sales volume growth assumptions. Similarly, NRB is also expected to maintain its leadership with needle roller segment revenues accounting for ~70% market share.
Exhibit 6: Indian bearings market and NRB’s share
442508
585672
325 356409
471
0
100
200
300
400
500
600
700
800
FY14 FY15E FY16E FY17E
| cr
ore
Needle Roller Market NRB needle roller revenues
NRB is the fifth largest bearings company in India with
~7% market share (in terms of revenues)
Exhibit 5: Product wise break-up of NRB’s revenues
Needle Roller Bearings
55%
Tapered Roller Bearings
3%
Cylinderical Roller Bearings
13%
Ball Bearings9%
Others20%
Source: Company, ICICIdirect.com Research
Needle and cylindrical bearings form ~68% of NRB’s
topline
Page 6ICICI Securities Ltd | Retail Equity Research
Strong clientele base – Presence, diversification
Presence across major OEM players, new segments to open up opportunities
NRB is present across the auto OEM space through its exposure to the two-wheelers, four-wheelers, commercial vehicles (CV), passenger vehicles (PV) and off highway segments. With a proven track record over 49 years, it is a preferred supplier to leading domestic OEMs such as Hero MotoCorp, Bajaj Auto, Maruti Suzuki, Tata Motors, Ashok Leyland, etc. which is clearly depicted in the staggering 70% market share commanded by the company in the needle roller bearings space. A needle roller bearing is a customised product. Hence, the company works with OEMs from the conceptualisation stage to provide anti-friction solutions. This enables NRB to build a sticky clientele relationship with major OEM players.
Apart from the automotive segment, the company also enjoys a presence in the race boats segment wherein Ingersoll Rand is one of the key customers. Furthermore, NRB has also outlined growth opportunities in other mobility segments such as defence in the form of gun carriers, marine, Railways and MRTS wherein rising investment could open up avenues for bearings demands.
NRB, whose domestic automotive segment, forms ~62% of the topline, caters to almost all segment viz. two-wheelers (33% of revenues), CV (19% of revenues), PV (20% of revenues) and farm/off highway (forming 10% of revenues). Domestic automotive OEM revenues of NRB have grown at 14.3% CAGR during FY09-14 to | 368.6 crore.
Exhibit 7: Key customers of NRB Category Key customersTwo-wheeler OEMs Hero MotoCorp, HMSI, Bajaj Auto, TVS MotorPV Maruti Suzuki, Tata MotorsCV/Utility vehicle Mahindra & Mahindra, Ashok Leyland
Source: Company, ICICIdirect.com Research
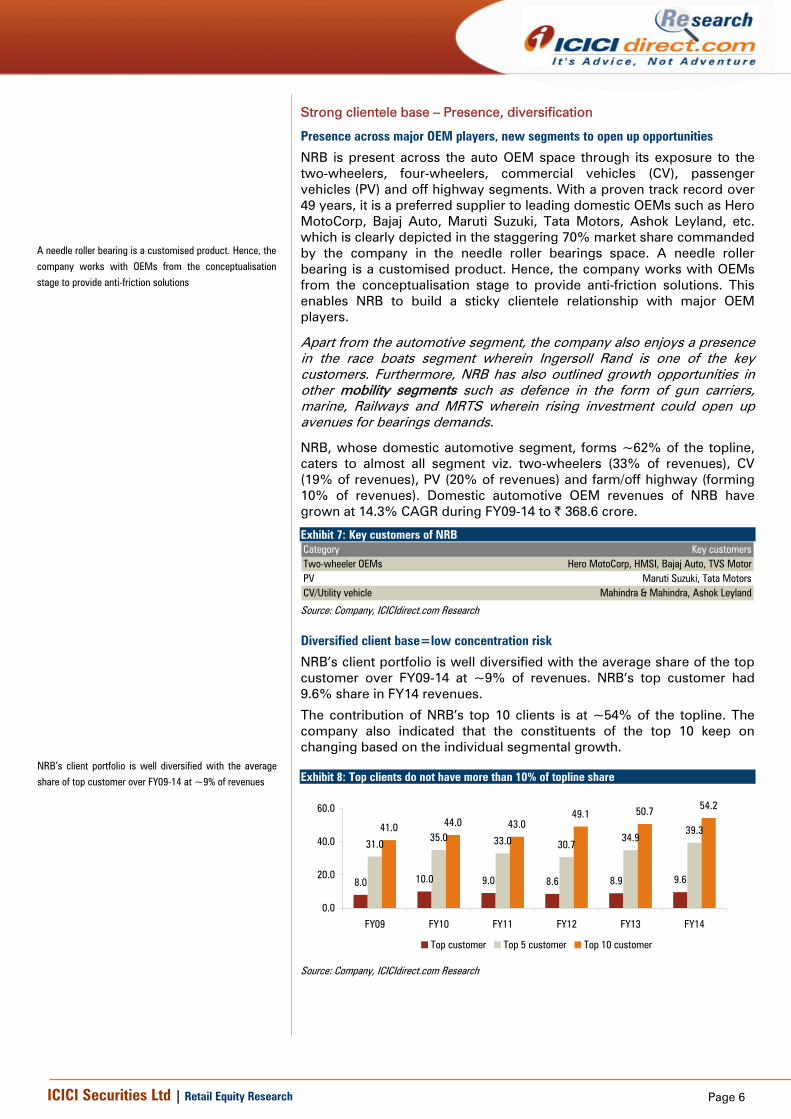
Diversified client base=low concentration risk
NRB’s client portfolio is well diversified with the average share of the top customer over FY09-14 at ~9% of revenues. NRB’s top customer had 9.6% share in FY14 revenues.
The contribution of NRB’s top 10 clients is at ~54% of the topline. The company also indicated that the constituents of the top 10 keep on changing based on the individual segmental growth.
Exhibit 8: Top clients do not have more than 10% of topline share
8.0 10.0 9.0 8.6 8.9 9.6
31.035.0 33.0 30.7
34.939.341.0 44.0 43.0
49.1 50.7 54.2
0.0
20.0
40.0
60.0
FY09 FY10 FY11 FY12 FY13 FY14
Top customer Top 5 customer Top 10 customer
Source: Company, ICICIdirect.com Research
A needle roller bearing is a customised product. Hence, the
company works with OEMs from the conceptualisation
stage to provide anti-friction solutions
NRB’s client portfolio is well diversified with the average
share of top customer over FY09-14 at ~9% of revenues
Page 7ICICI Securities Ltd | Retail Equity Research
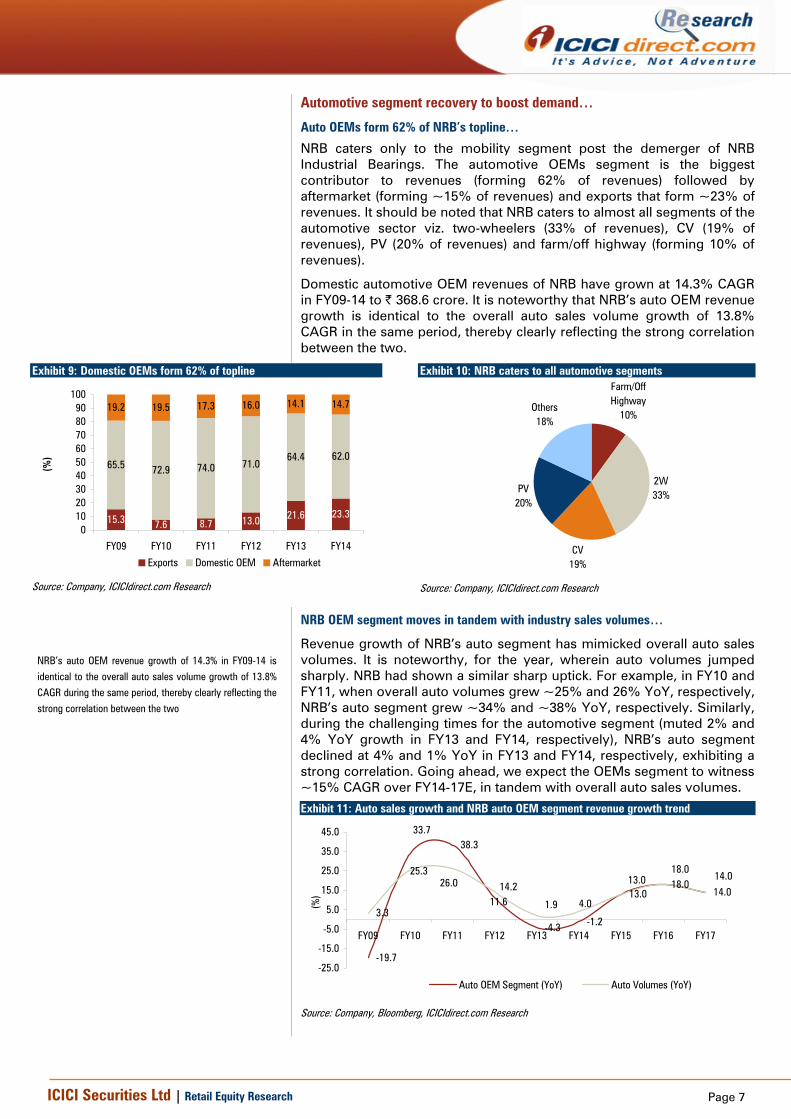
Automotive segment recovery to boost demand…
Auto OEMs form 62% of NRB’s topline…
NRB caters only to the mobility segment post the demerger of NRB Industrial Bearings. The automotive OEMs segment is the biggest contributor to revenues (forming 62% of revenues) followed by aftermarket (forming ~15% of revenues) and exports that form ~23% of revenues. It should be noted that NRB caters to almost all segments of the automotive sector viz. two-wheelers (33% of revenues), CV (19% of revenues), PV (20% of revenues) and farm/off highway (forming 10% of revenues).
Domestic automotive OEM revenues of NRB have grown at 14.3% CAGR in FY09-14 to | 368.6 crore. It is noteworthy that NRB’s auto OEM revenue growth is identical to the overall auto sales volume growth of 13.8% CAGR in the same period, thereby clearly reflecting the strong correlation between the two.
Exhibit 9: Domestic OEMs form 62% of topline
15.3 7.6 8.7 13.0 21.6 23.3
65.5 72.9 74.0 71.064.4 62.0
19.2 19.5 17.3 16.0 14.1 14.7
0102030405060708090
100
FY09 FY10 FY11 FY12 FY13 FY14
(%)
Exports Domestic OEM Aftermarket
Source: Company, ICICIdirect.com Research
Exhibit 10: NRB caters to all automotive segments Farm/Off Highway
10%
2W33%
CV19%
PV20%
Others18%
Source: Company, ICICIdirect.com Research
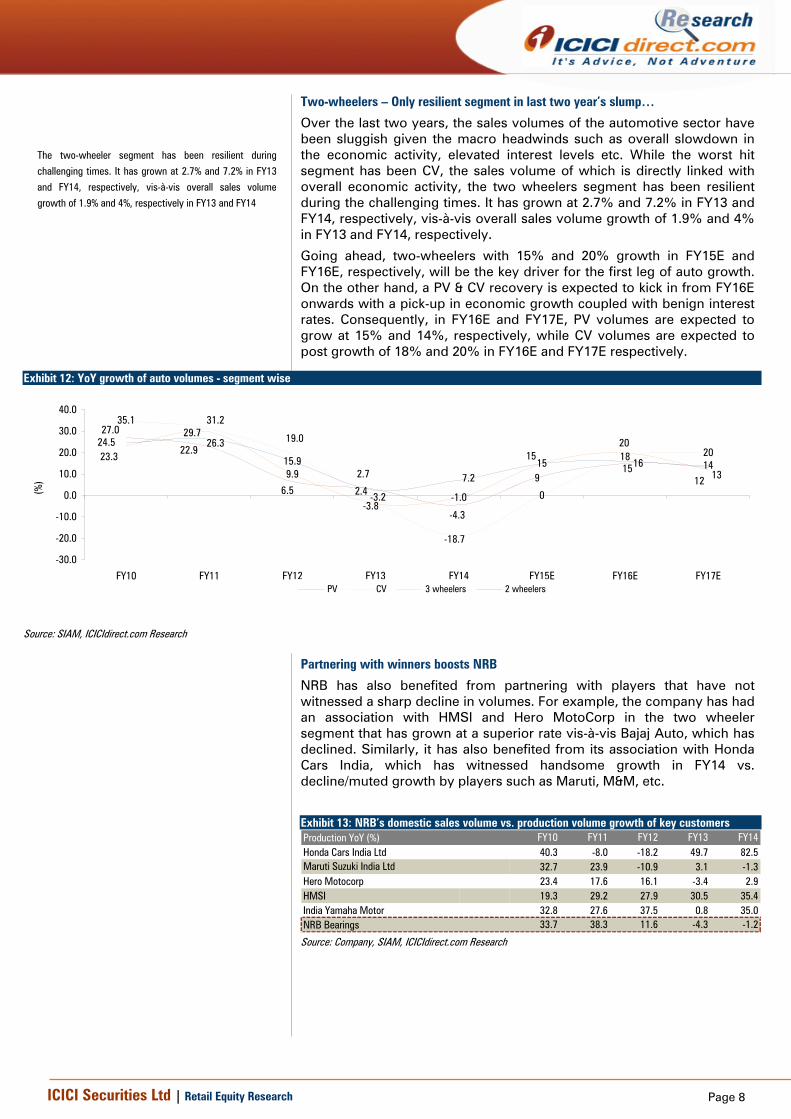
NRB OEM segment moves in tandem with industry sales volumes…
Revenue growth of NRB’s auto segment has mimicked overall auto sales volumes. It is noteworthy, for the year, wherein auto volumes jumped sharply. NRB had shown a similar sharp uptick. For example, in FY10 and FY11, when overall auto volumes grew ~25% and 26% YoY, respectively, NRB’s auto segment grew ~34% and ~38% YoY, respectively. Similarly, during the challenging times for the automotive segment (muted 2% and 4% YoY growth in FY13 and FY14, respectively), NRB’s auto segment declined at 4% and 1% YoY in FY13 and FY14, respectively, exhibiting a strong correlation. Going ahead, we expect the OEMs segment to witness ~15% CAGR over FY14-17E, in tandem with overall auto sales volumes.
NRB’s auto OEM revenue growth of 14.3% in FY09-14 is
identical to the overall auto sales volume growth of 13.8%
CAGR during the same period, thereby clearly reflecting the
strong correlation between the two
Exhibit 11: Auto sales growth and NRB auto OEM segment revenue growth trend
-19.7
38.3
-4.3 -1.2
13.018.0
14.0
3.311.6
33.7
14.2
1.9 4.0
14.013.025.3
26.018.0
-25.0
-15.0
-5.0
5.0
15.0
25.0
35.0
45.0
FY09 FY10 FY11 FY12 FY13 FY14 FY15 FY16 FY17
(%)
Auto OEM Segment (YoY) Auto Volumes (YoY)
Source: Company, Bloomberg, ICICIdirect.com Research
Page 8ICICI Securities Ltd | Retail Equity Research
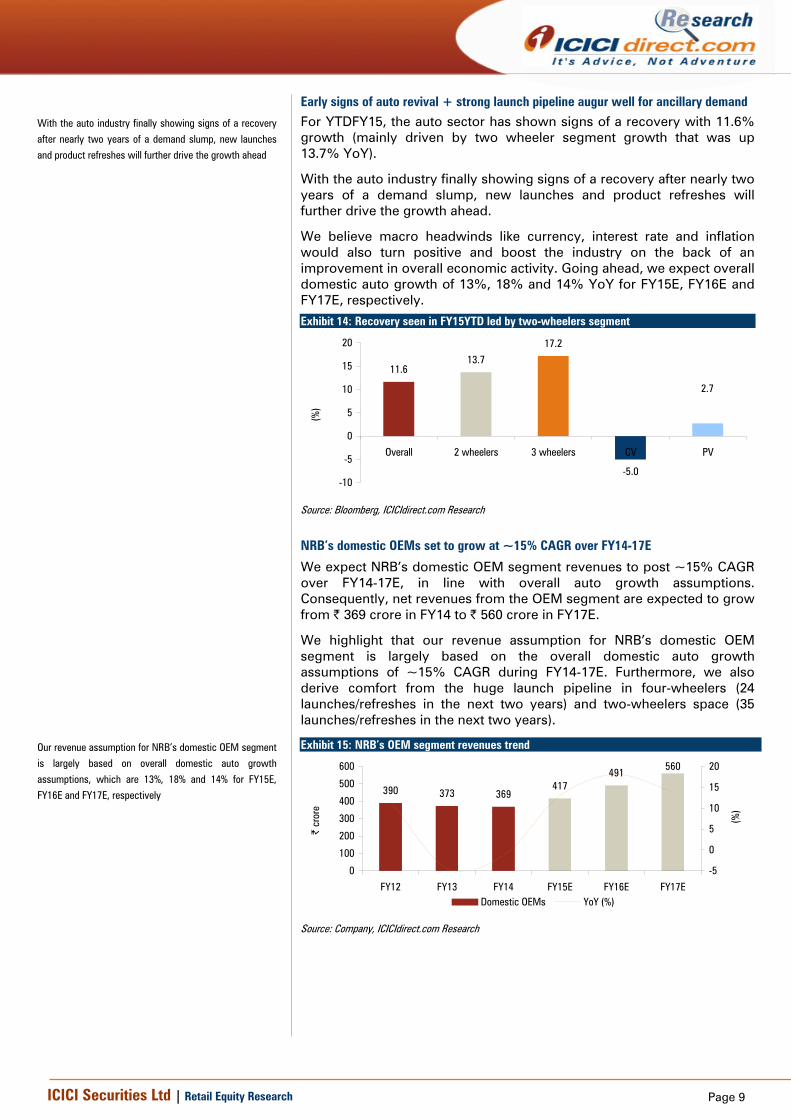
Two-wheelers – Only resilient segment in last two year’s slump…
Over the last two years, the sales volumes of the automotive sector have been sluggish given the macro headwinds such as overall slowdown in the economic activity, elevated interest levels etc. While the worst hit segment has been CV, the sales volume of which is directly linked with overall economic activity, the two wheelers segment has been resilient during the challenging times. It has grown at 2.7% and 7.2% in FY13 and FY14, respectively, vis-à-vis overall sales volume growth of 1.9% and 4% in FY13 and FY14, respectively.
Going ahead, two-wheelers with 15% and 20% growth in FY15E and FY16E, respectively, will be the key driver for the first leg of auto growth. On the other hand, a PV & CV recovery is expected to kick in from FY16E onwards with a pick-up in economic growth coupled with benign interest rates. Consequently, in FY16E and FY17E, PV volumes are expected to grow at 15% and 14%, respectively, while CV volumes are expected to post growth of 18% and 20% in FY16E and FY17E respectively.
Exhibit 12: YoY growth of auto volumes - segment wise
14
35.1
0
18 20
9.9
-1.0
1515.9
27.0
22.9
6.5
2.7
-4.3
915
31.2
19.0
-3.2
-18.7
23.3
29.7
-3.8
20
12
24.5 26.3
2.47.2
1516
13
-30.0
-20.0
-10.0
0.0
10.0
20.0
30.0
40.0
FY10 FY11 FY12 FY13 FY14 FY15E FY16E FY17E
(%)
PV CV 3 wheelers 2 wheelers
Source: SIAM, ICICIdirect.com Research
Partnering with winners boosts NRB
NRB has also benefited from partnering with players that have not witnessed a sharp decline in volumes. For example, the company has had an association with HMSI and Hero MotoCorp in the two wheeler segment that has grown at a superior rate vis-à-vis Bajaj Auto, which has declined. Similarly, it has also benefited from its association with Honda Cars India, which has witnessed handsome growth in FY14 vs. decline/muted growth by players such as Maruti, M&M, etc.
Exhibit 13: NRB’s domestic sales volume vs. production volume growth of key customers Production YoY (%) FY10 FY11 FY12 FY13 FY14Honda Cars India Ltd 40.3 -8.0 -18.2 49.7 82.5Maruti Suzuki India Ltd 32.7 23.9 -10.9 3.1 -1.3Hero Motocorp 23.4 17.6 16.1 -3.4 2.9HMSI 19.3 29.2 27.9 30.5 35.4India Yamaha Motor 32.8 27.6 37.5 0.8 35.0NRB Bearings 33.7 38.3 11.6 -4.3 -1.2
Source: Company, SIAM, ICICIdirect.com Research
The two-wheeler segment has been resilient during
challenging times. It has grown at 2.7% and 7.2% in FY13
and FY14, respectively, vis-à-vis overall sales volume
growth of 1.9% and 4%, respectively in FY13 and FY14
Page 9ICICI Securities Ltd | Retail Equity Research
Early signs of auto revival + strong launch pipeline augur well for ancillary demand For YTDFY15, the auto sector has shown signs of a recovery with 11.6% growth (mainly driven by two wheeler segment growth that was up 13.7% YoY).
With the auto industry finally showing signs of a recovery after nearly two years of a demand slump, new launches and product refreshes will further drive the growth ahead.
We believe macro headwinds like currency, interest rate and inflation would also turn positive and boost the industry on the back of an improvement in overall economic activity. Going ahead, we expect overall domestic auto growth of 13%, 18% and 14% YoY for FY15E, FY16E and FY17E, respectively.
NRB’s domestic OEMs set to grow at ~15% CAGR over FY14-17E
We expect NRB’s domestic OEM segment revenues to post ~15% CAGR over FY14-17E, in line with overall auto growth assumptions. Consequently, net revenues from the OEM segment are expected to grow from | 369 crore in FY14 to | 560 crore in FY17E.
We highlight that our revenue assumption for NRB’s domestic OEM segment is largely based on the overall domestic auto growth assumptions of ~15% CAGR during FY14-17E. Furthermore, we also derive comfort from the huge launch pipeline in four-wheelers (24 launches/refreshes in the next two years) and two-wheelers space (35 launches/refreshes in the next two years).
Exhibit 15: NRB’s OEM segment revenues trend
390 373 369417
491560
0
100
200
300
400
500
600
FY12 FY13 FY14 FY15E FY16E FY17E
| cr
ore
-5
0
5
10
15
20
(%)
Domestic OEMs YoY (%)
Source: Company, ICICIdirect.com Research
With the auto industry finally showing signs of a recovery
after nearly two years of a demand slump, new launches
and product refreshes will further drive the growth ahead
Exhibit 14: Recovery seen in FY15YTD led by two-wheelers segment
11.613.7
17.2
-5.0
2.7
-10
-5
0
5
10
15
20
Overall 2 wheelers 3 wheelers CV PV
(%)
Source: Bloomberg, ICICIdirect.com Research
Our revenue assumption for NRB’s domestic OEM segment
is largely based on overall domestic auto growth
assumptions, which are 13%, 18% and 14% for FY15E,
FY16E and FY17E, respectively
Page 10ICICI Securities Ltd | Retail Equity Research
Exhibit 16: Launches by various automakers Company Launch PlansTwo wheelersHero MotoCorp 10 launches/refreshes over next two years including Dare, Dash, Leap in the scooter segment and HX250R in motorcyclesBajaj Auto Two new Pulsar and one Discover variant in next year TVS Motors Two commuter bikes, one scooter and refreshesHMSI Honda CBR300 and one commuter bike over the next yearMahindra Two Wheelers Two new scooters and two bikes launchedFour wheelersMaruti Suzuki Launches in the form of Dzire and Swift facelift and new products like XA Alpha and S-Cross SX4 Tata Motors Bolt and Nano Diesel M&M Two UVs in the compact SUV segment, one LCV, Scorpio refresh and other faceliftsHyundai Refreshes of existing productsHonda Vezel in the SUV segment and the new Jazz Nissan Datsun Go Plus & Datsun Go Sedan
Source: ICICIdirect.com Research
Exhibit 17: Upcoming launches for car and bikes
Mahindra Scorpio Facelift Renault Lodgy Kawasaki Z250 Hero Dare Hero Leap Hybrid SES
Fiat Avventura Ford Ka Mahindra Gusto Bajaj Pulsar SS200 Bajaj Pulsar CS400
Maruti Suzuki Ciaz Volkswagen Taigun Vespa 946 Vespa Fly125 Hero ZIR
Renault Duster AWD Datsun Redi GO Hero Splendor Pro Classic Yamaha YZF R25 Honda CBR 650F
Maruti Suzuki Swift Facelift Maruti Suzuki S-Cross SX4 Kawasaki Versys 1000 Mahindra Mojo 300 Honda CBR300R
Maruti Suzuki Swift Dzire Facelift Toyota Vios Bajaj Pulsar 180NS Hero Dash Suzuki Gladius 650
Volkswagen Vento Facelift Honda Jazz Hero Xtreme Sports Hero Impulse 250 Hero RNT
Ford Figo Concept Sedan Ford B-MAX MPV Piaggio Liberty 125 Harley Davidson Street 500 Yamaha Ray 125
Tata Bolt Datsun Go Plus Bajaj Pulsar 200NS FI Honda CB500X Honda PCX125
Skoda Octavia vRS Renault Duster Facelift Bajaj Pulsar 150NS Hero HX250R KTM 390 Adventure
Mahindra Quanto AT Mahindra XUV500 Hybrid Kawasaki ER-6n Honda CB500F Hero Hastur
Mahindra S101 Fiat Punto Abarth Bajaj Pulsar SS400 Honda CBR500R
Upcoming bike launchesUpcoming car Launches
Source: www.carwale.com, www.bikewale.com, ICICIdirect.com Research
Page 11ICICI Securities Ltd | Retail Equity Research
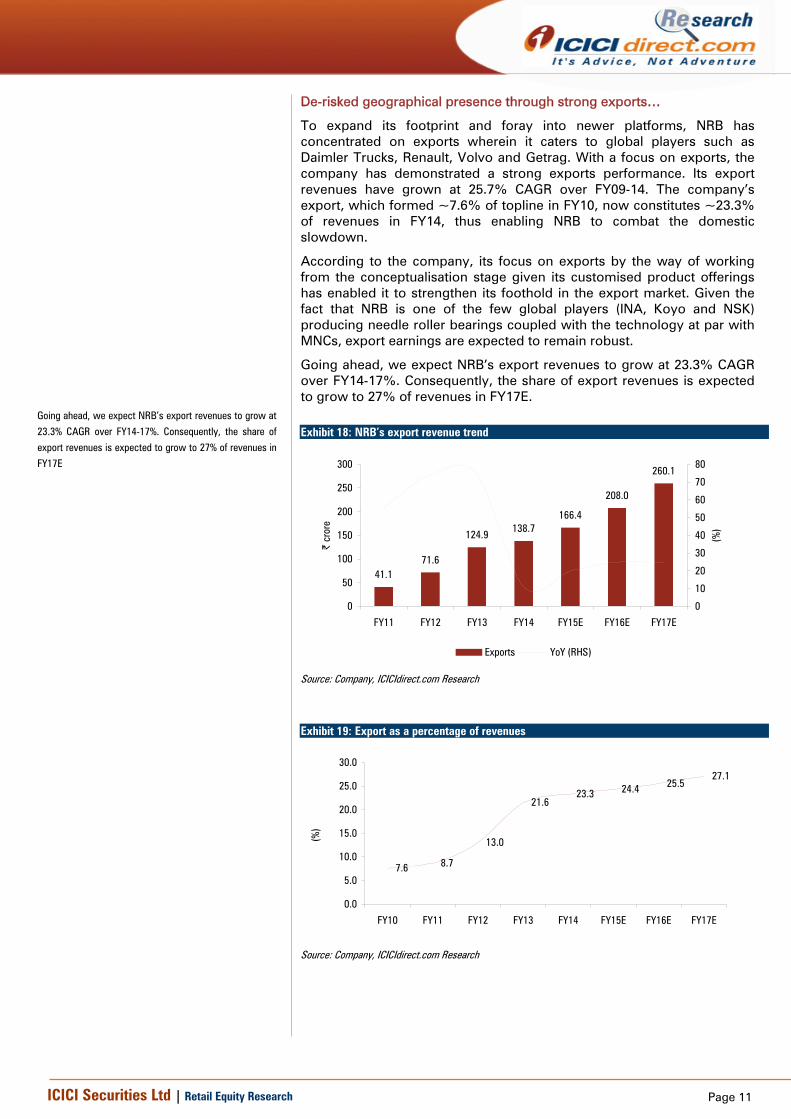
De-risked geographical presence through strong exports…
To expand its footprint and foray into newer platforms, NRB has concentrated on exports wherein it caters to global players such as Daimler Trucks, Renault, Volvo and Getrag. With a focus on exports, the company has demonstrated a strong exports performance. Its export revenues have grown at 25.7% CAGR over FY09-14. The company’s export, which formed ~7.6% of topline in FY10, now constitutes ~23.3% of revenues in FY14, thus enabling NRB to combat the domestic slowdown.
According to the company, its focus on exports by the way of working from the conceptualisation stage given its customised product offerings has enabled it to strengthen its foothold in the export market. Given the fact that NRB is one of the few global players (INA, Koyo and NSK) producing needle roller bearings coupled with the technology at par with MNCs, export earnings are expected to remain robust.
Going ahead, we expect NRB’s export revenues to grow at 23.3% CAGR over FY14-17%. Consequently, the share of export revenues is expected to grow to 27% of revenues in FY17E.
Exhibit 18: NRB’s export revenue trend
41.171.6
124.9 138.7166.4
208.0
260.1
0
50
100
150
200
250
300
FY11 FY12 FY13 FY14 FY15E FY16E FY17E
| cr
ore
0
10
20
30
40
50
60
70
80
(%)
Exports YoY (RHS)
Source: Company, ICICIdirect.com Research
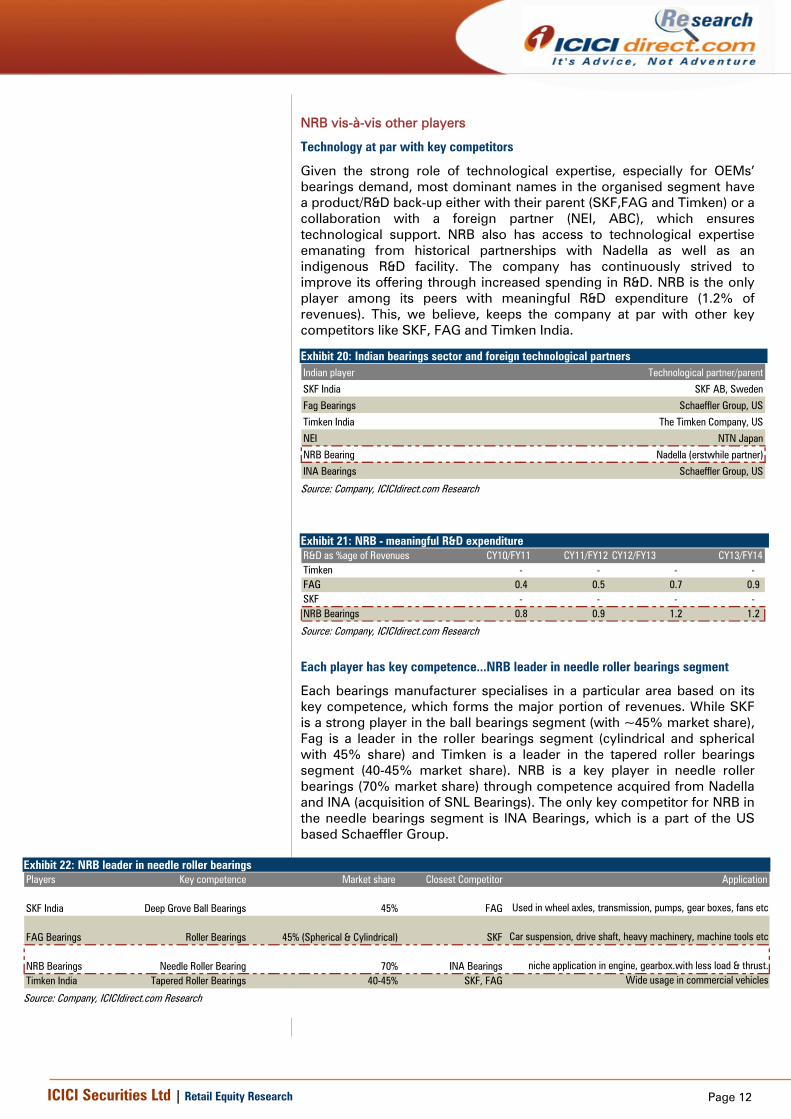
Exhibit 19: Export as a percentage of revenues
7.6 8.7
13.0
21.623.3 24.4 25.5
27.1
0.0
5.0
10.0
15.0
20.0
25.0
30.0
FY10 FY11 FY12 FY13 FY14 FY15E FY16E FY17E
(%)
Source: Company, ICICIdirect.com Research
Going ahead, we expect NRB’s export revenues to grow at
23.3% CAGR over FY14-17%. Consequently, the share of
export revenues is expected to grow to 27% of revenues in
FY17E
Page 12ICICI Securities Ltd | Retail Equity Research
NRB vis-à-vis other players
Technology at par with key competitors
Given the strong role of technological expertise, especially for OEMs’ bearings demand, most dominant names in the organised segment have a product/R&D back-up either with their parent (SKF,FAG and Timken) or a collaboration with a foreign partner (NEI, ABC), which ensures technological support. NRB also has access to technological expertise emanating from historical partnerships with Nadella as well as an indigenous R&D facility. The company has continuously strived to improve its offering through increased spending in R&D. NRB is the only player among its peers with meaningful R&D expenditure (1.2% of revenues). This, we believe, keeps the company at par with other key competitors like SKF, FAG and Timken India.
Exhibit 20: Indian bearings sector and foreign technological partners Indian player Technological partner/parent
SKF India SKF AB, Sweden
Fag Bearings Schaeffler Group, US
Timken India The Timken Company, US
NEI NTN Japan
NRB Bearing Nadella (erstwhile partner)
INA Bearings Schaeffler Group, US
Source: Company, ICICIdirect.com Research
Exhibit 21: NRB - meaningful R&D expenditure R&D as %age of Revenues CY10/FY11 CY11/FY12 CY12/FY13 CY13/FY14Timken - - - - FAG 0.4 0.5 0.7 0.9 SKF - - - - NRB Bearings 0.8 0.9 1.2 1.2
Source: Company, ICICIdirect.com Research
Each player has key competence...NRB leader in needle roller bearings segment
Each bearings manufacturer specialises in a particular area based on its key competence, which forms the major portion of revenues. While SKF is a strong player in the ball bearings segment (with ~45% market share), Fag is a leader in the roller bearings segment (cylindrical and spherical with 45% share) and Timken is a leader in the tapered roller bearings segment (40-45% market share). NRB is a key player in needle roller bearings (70% market share) through competence acquired from Nadella and INA (acquisition of SNL Bearings). The only key competitor for NRB in the needle bearings segment is INA Bearings, which is a part of the US based Schaeffler Group.
Exhibit 22: NRB leader in needle roller bearings Players Key competence Market share Closest Competitor Application
SKF India Deep Grove Ball Bearings 45% FAG Used in wheel axles, transmission, pumps, gear boxes, fans etc
FAG Bearings Roller Bearings 45% (Spherical & Cylindrical) SKF Car suspension, drive shaft, heavy machinery, machine tools etc
NRB Bearings Needle Roller Bearing 70% INA Bearings niche application in engine, gearbox.with less load & thrust.Timken India Tapered Roller Bearings 40-45% SKF, FAG Wide usage in commercial vehicles
Source: Company, ICICIdirect.com Research
Page 13ICICI Securities Ltd | Retail Equity Research
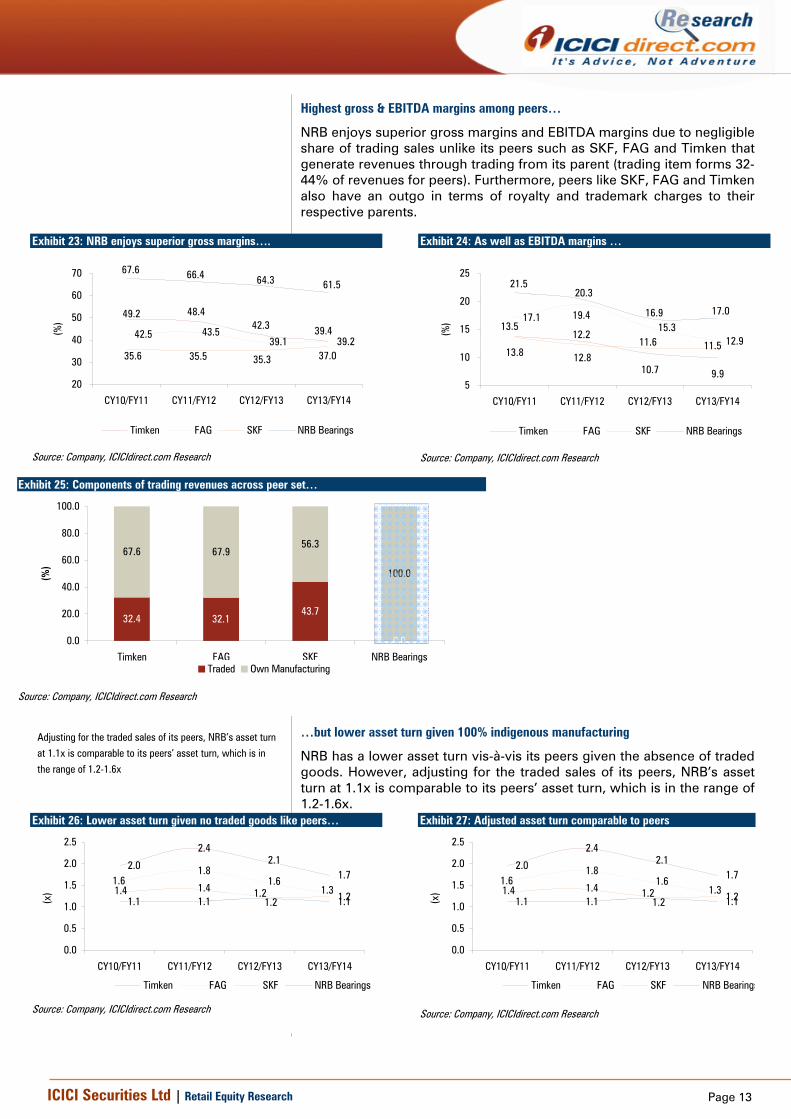
Highest gross & EBITDA margins among peers…
NRB enjoys superior gross margins and EBITDA margins due to negligible share of trading sales unlike its peers such as SKF, FAG and Timken that generate revenues through trading from its parent (trading item forms 32-44% of revenues for peers). Furthermore, peers like SKF, FAG and Timken also have an outgo in terms of royalty and trademark charges to their respective parents.
Exhibit 23: NRB enjoys superior gross margins….
42.5 43.539.1 39.2
39.442.348.449.2
35.6 35.5 35.3 37.0
61.564.366.467.6
20
30
40
50
60
70
CY10/FY11 CY11/FY12 CY12/FY13 CY13/FY14
(%)
Timken FAG SKF NRB Bearings
Source: Company, ICICIdirect.com Research
Exhibit 24: As well as EBITDA margins …
17.115.3
12.913.8 12.8
10.7 9.9
19.4
11.511.612.2
13.5
21.520.3
16.9 17.0
5
10
15
20
25
CY10/FY11 CY11/FY12 CY12/FY13 CY13/FY14
(%)
Timken FAG SKF NRB Bearings
Source: Company, ICICIdirect.com Research
Exhibit 25: Components of trading revenues across peer set…
32.4 32.143.7
0.0
67.6 67.956.3
100.0
0.0
20.0
40.0
60.0
80.0
100.0
Timken FAG SKF NRB Bearings
(%)
Traded Own Manufacturing
Source: Company, ICICIdirect.com Research
…but lower asset turn given 100% indigenous manufacturing
NRB has a lower asset turn vis-à-vis its peers given the absence of traded goods. However, adjusting for the traded sales of its peers, NRB’s asset turn at 1.1x is comparable to its peers’ asset turn, which is in the range of 1.2-1.6x.
Exhibit 26: Lower asset turn given no traded goods like peers…
2.0
2.42.1
1.71.81.6
1.21.1 1.1 1.11.3
1.6
1.21.41.4 1.2
0.0
0.5
1.0
1.5
2.0
2.5
CY10/FY11 CY11/FY12 CY12/FY13 CY13/FY14
(x)
Timken FAG SKF NRB Bearings
Source: Company, ICICIdirect.com Research
Exhibit 27: Adjusted asset turn comparable to peers
2.0
2.42.1
1.71.81.6
1.21.1 1.1 1.11.3
1.6
1.21.41.4 1.2
0.0
0.5
1.0
1.5
2.0
2.5
CY10/FY11 CY11/FY12 CY12/FY13 CY13/FY14
(x)
Timken FAG SKF NRB Bearings
Source: Company, ICICIdirect.com Research
Adjusting for the traded sales of its peers, NRB’s asset turn
at 1.1x is comparable to its peers’ asset turn, which is in
the range of 1.2-1.6x
Page 14ICICI Securities Ltd | Retail Equity Research
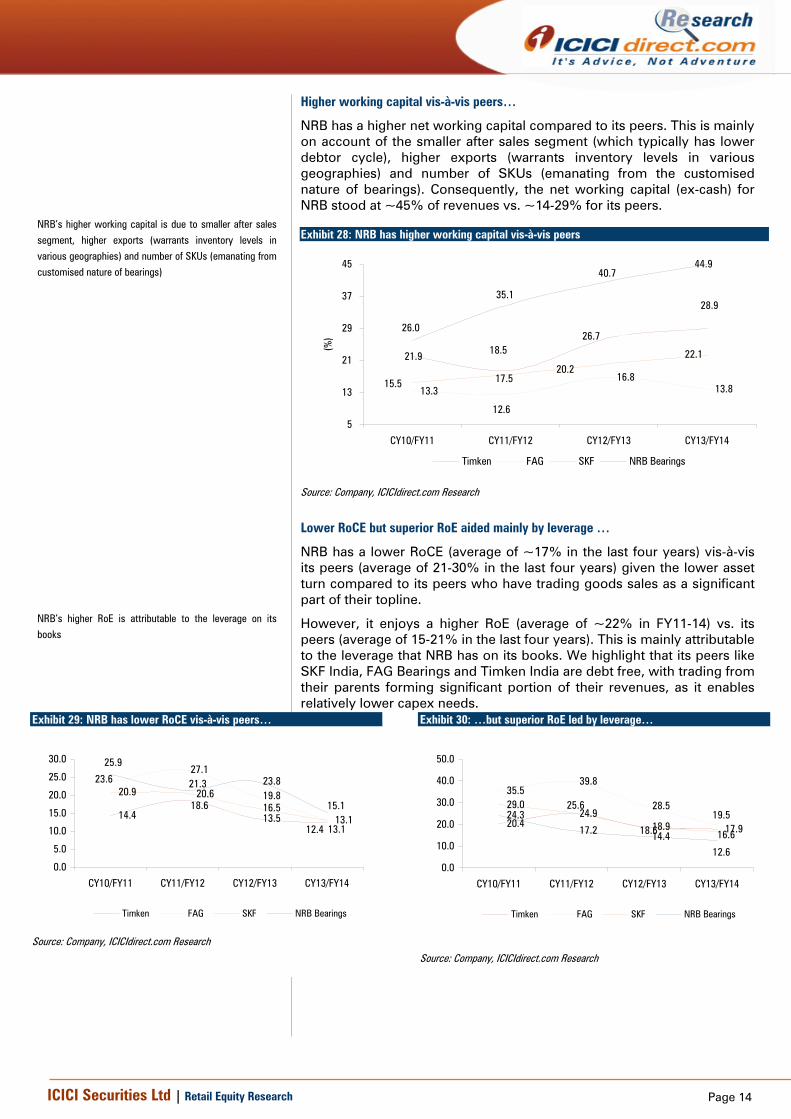
Higher working capital vis-à-vis peers…
NRB has a higher net working capital compared to its peers. This is mainly on account of the smaller after sales segment (which typically has lower debtor cycle), higher exports (warrants inventory levels in various geographies) and number of SKUs (emanating from the customised nature of bearings). Consequently, the net working capital (ex-cash) for NRB stood at ~45% of revenues vs. ~14-29% for its peers.
Exhibit 28: NRB has higher working capital vis-à-vis peers
13.316.8
13.8
28.9
26.718.521.9
12.6
15.5 17.520.2
22.1
44.940.7
35.1
26.0
5
13
21
29
37
45
CY10/FY11 CY11/FY12 CY12/FY13 CY13/FY14
(%)
Timken FAG SKF NRB Bearings
Source: Company, ICICIdirect.com Research
Lower RoCE but superior RoE aided mainly by leverage …
NRB has a lower RoCE (average of ~17% in the last four years) vis-à-vis its peers (average of 21-30% in the last four years) given the lower asset turn compared to its peers who have trading goods sales as a significant part of their topline.
However, it enjoys a higher RoE (average of ~22% in FY11-14) vs. its peers (average of 15-21% in the last four years). This is mainly attributable to the leverage that NRB has on its books. We highlight that its peers like SKF India, FAG Bearings and Timken India are debt free, with trading from their parents forming significant portion of their revenues, as it enables relatively lower capex needs.
Exhibit 29: NRB has lower RoCE vis-à-vis peers…
14.4 13.5
27.1
19.8
13.1
20.916.5
23.8
18.6
12.4
23.620.6
13.1
15.1
25.9
21.3
0.0
5.0
10.0
15.0
20.0
25.0
30.0
CY10/FY11 CY11/FY12 CY12/FY13 CY13/FY14
Timken FAG SKF NRB Bearings
Source: Company, ICICIdirect.com Research
Exhibit 30: …but superior RoE led by leverage…
20.424.9
18.9 17.9
35.539.8
28.529.024.3
17.2 14.4
19.5
16.6
25.6
18.6
12.60.0
10.0
20.0
30.0
40.0
50.0
CY10/FY11 CY11/FY12 CY12/FY13 CY13/FY14
Timken FAG SKF NRB Bearings
Source: Company, ICICIdirect.com Research
NRB’s higher working capital is due to smaller after sales
segment, higher exports (warrants inventory levels in
various geographies) and number of SKUs (emanating from
customised nature of bearings)
NRB’s higher RoE is attributable to the leverage on its
books
Page 15ICICI Securities Ltd | Retail Equity Research
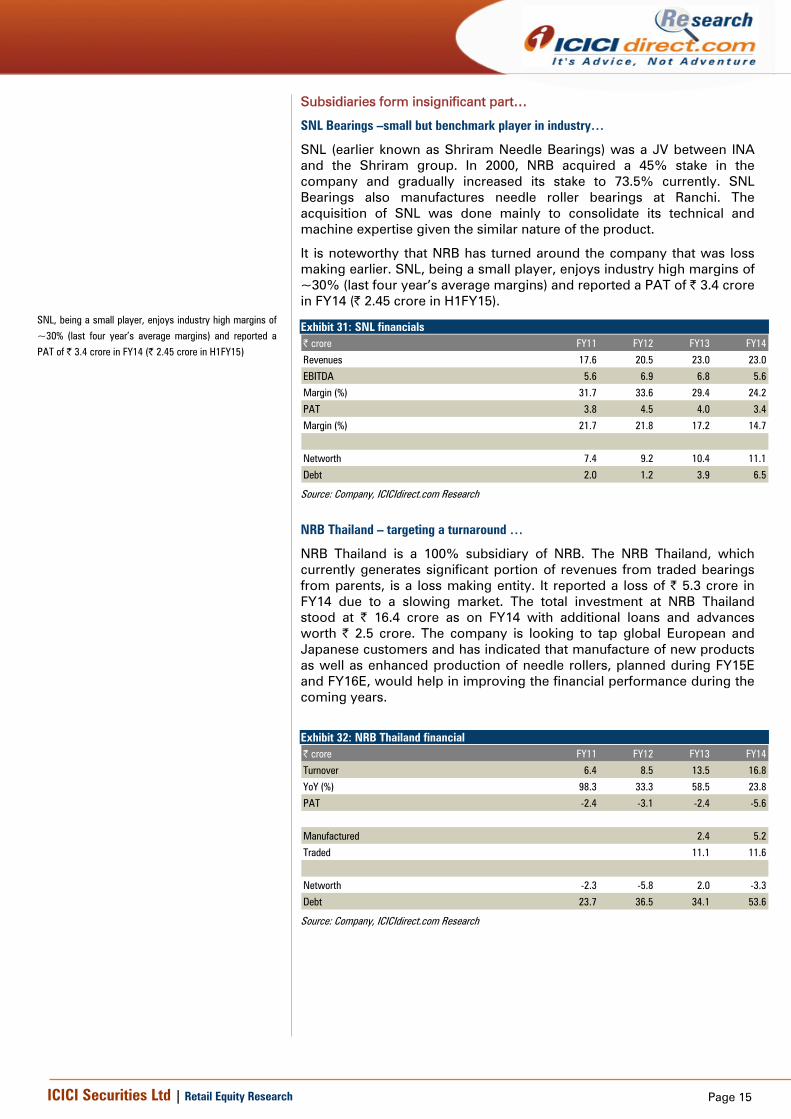
Subsidiaries form insignificant part…
SNL Bearings –small but benchmark player in industry…
SNL (earlier known as Shriram Needle Bearings) was a JV between INA and the Shriram group. In 2000, NRB acquired a 45% stake in the company and gradually increased its stake to 73.5% currently. SNL Bearings also manufactures needle roller bearings at Ranchi. The acquisition of SNL was done mainly to consolidate its technical and machine expertise given the similar nature of the product.
It is noteworthy that NRB has turned around the company that was loss making earlier. SNL, being a small player, enjoys industry high margins of ~30% (last four year’s average margins) and reported a PAT of | 3.4 crore in FY14 (| 2.45 crore in H1FY15).
Exhibit 31: SNL financials | crore FY11 FY12 FY13 FY14
Revenues 17.6 20.5 23.0 23.0
EBITDA 5.6 6.9 6.8 5.6
Margin (%) 31.7 33.6 29.4 24.2
PAT 3.8 4.5 4.0 3.4
Margin (%) 21.7 21.8 17.2 14.7
Networth 7.4 9.2 10.4 11.1
Debt 2.0 1.2 3.9 6.5
Source: Company, ICICIdirect.com Research
NRB Thailand – targeting a turnaround …
NRB Thailand is a 100% subsidiary of NRB. The NRB Thailand, which currently generates significant portion of revenues from traded bearings from parents, is a loss making entity. It reported a loss of | 5.3 crore in FY14 due to a slowing market. The total investment at NRB Thailand stood at | 16.4 crore as on FY14 with additional loans and advances worth | 2.5 crore. The company is looking to tap global European and Japanese customers and has indicated that manufacture of new products as well as enhanced production of needle rollers, planned during FY15E and FY16E, would help in improving the financial performance during the coming years.
Exhibit 32: NRB Thailand financial | crore FY11 FY12 FY13 FY14
Turnover 3.2322 6.4 8.5 13.5 16.8
YoY (%) 98.3 33.3 58.5 23.8
PAT -2.4 -3.1 -2.4 -5.6
Manufactured 2.4 5.2
Traded 11.1 11.6
Networth -2.3 -5.8 2.0 -3.3
Debt 23.7 36.5 34.1 53.6
Source: Company, ICICIdirect.com Research
SNL, being a small player, enjoys industry high margins of
~30% (last four year’s average margins) and reported a
PAT of | 3.4 crore in FY14 (| 2.45 crore in H1FY15)
Page 16ICICI Securities Ltd | Retail Equity Research
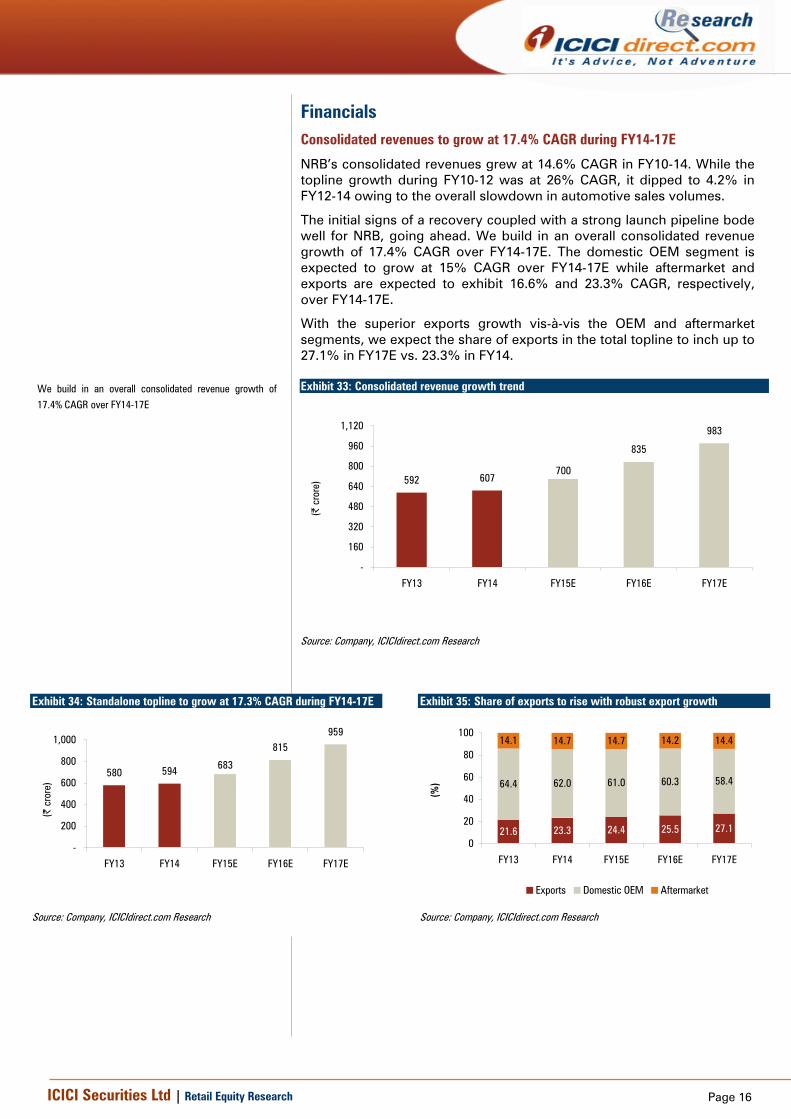
Financials Consolidated revenues to grow at 17.4% CAGR during FY14-17E
NRB’s consolidated revenues grew at 14.6% CAGR in FY10-14. While the topline growth during FY10-12 was at 26% CAGR, it dipped to 4.2% in FY12-14 owing to the overall slowdown in automotive sales volumes.
The initial signs of a recovery coupled with a strong launch pipeline bode well for NRB, going ahead. We build in an overall consolidated revenue growth of 17.4% CAGR over FY14-17E. The domestic OEM segment is expected to grow at 15% CAGR over FY14-17E while aftermarket and exports are expected to exhibit 16.6% and 23.3% CAGR, respectively, over FY14-17E.
With the superior exports growth vis-à-vis the OEM and aftermarket segments, we expect the share of exports in the total topline to inch up to 27.1% in FY17E vs. 23.3% in FY14.
Exhibit 33: Consolidated revenue growth trend
592 607
835
983
700
-
160
320
480
640
800
960
1,120
FY13 FY14 FY15E FY16E FY17E
(| c
rore
)
Source: Company, ICICIdirect.com Research
Exhibit 34: Standalone topline to grow at 17.3% CAGR during FY14-17E
580 594
815959
683
-
200
400
600
800
1,000
FY13 FY14 FY15E FY16E FY17E
(| c
rore
)
Source: Company, ICICIdirect.com Research
Exhibit 35: Share of exports to rise with robust export growth
21.6 23.3 24.4 25.5 27.1
64.4 62.0 61.0 60.3 58.4
14.1 14.7 14.7 14.2 14.4
0
20
40
60
80
100
FY13 FY14 FY15E FY16E FY17E
(%)
Exports Domestic OEM Aftermarket
Source: Company, ICICIdirect.com Research
We build in an overall consolidated revenue growth of
17.4% CAGR over FY14-17E
Page 17ICICI Securities Ltd | Retail Equity Research
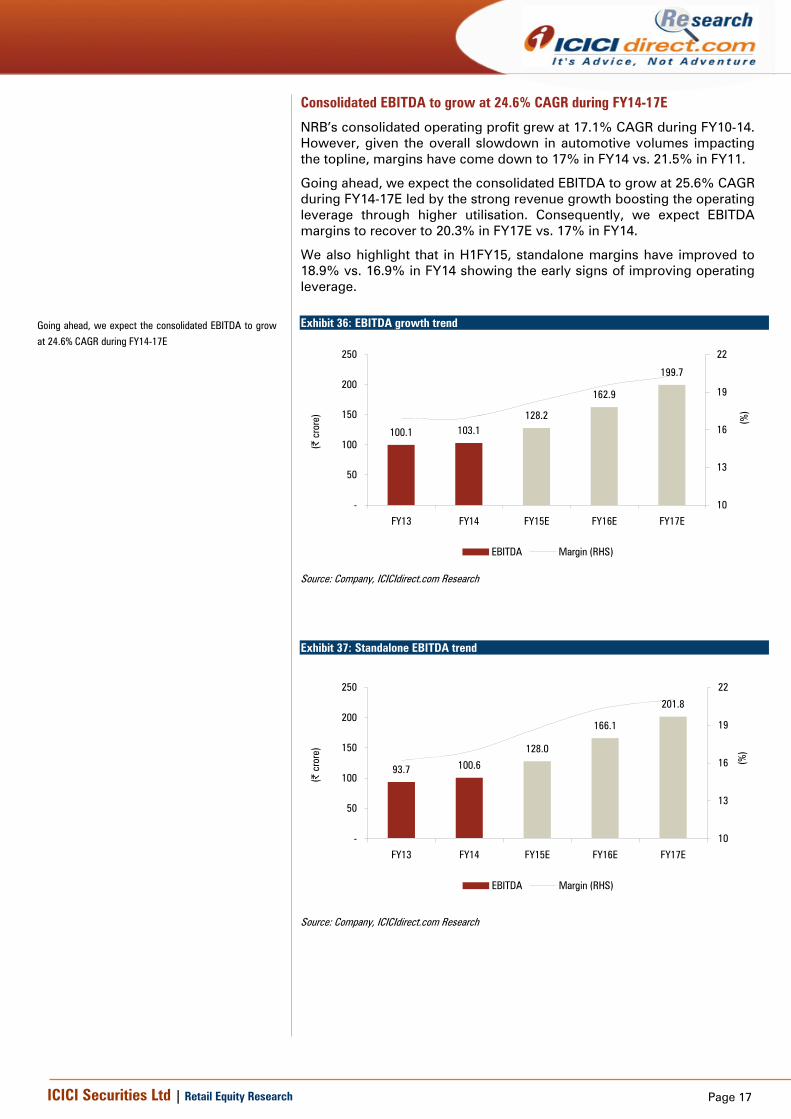
Consolidated EBITDA to grow at 24.6% CAGR during FY14-17E
NRB’s consolidated operating profit grew at 17.1% CAGR during FY10-14. However, given the overall slowdown in automotive volumes impacting the topline, margins have come down to 17% in FY14 vs. 21.5% in FY11.
Going ahead, we expect the consolidated EBITDA to grow at 25.6% CAGR during FY14-17E led by the strong revenue growth boosting the operating leverage through higher utilisation. Consequently, we expect EBITDA margins to recover to 20.3% in FY17E vs. 17% in FY14.
We also highlight that in H1FY15, standalone margins have improved to 18.9% vs. 16.9% in FY14 showing the early signs of improving operating leverage.
Exhibit 36: EBITDA growth trend
100.1 103.1128.2
162.9
199.7
-
50
100
150
200
250
FY13 FY14 FY15E FY16E FY17E
(| c
rore
)
10
13
16
19
22
(%)
EBITDA Margin (RHS)
Source: Company, ICICIdirect.com Research
Exhibit 37: Standalone EBITDA trend
93.7 100.6
128.0
166.1
201.8
-
50
100
150
200
250
FY13 FY14 FY15E FY16E FY17E
(| c
rore
)
10
13
16
19
22
(%)
EBITDA Margin (RHS)
Source: Company, ICICIdirect.com Research
Going ahead, we expect the consolidated EBITDA to grow
at 24.6% CAGR during FY14-17E
Page 18ICICI Securities Ltd | Retail Equity Research
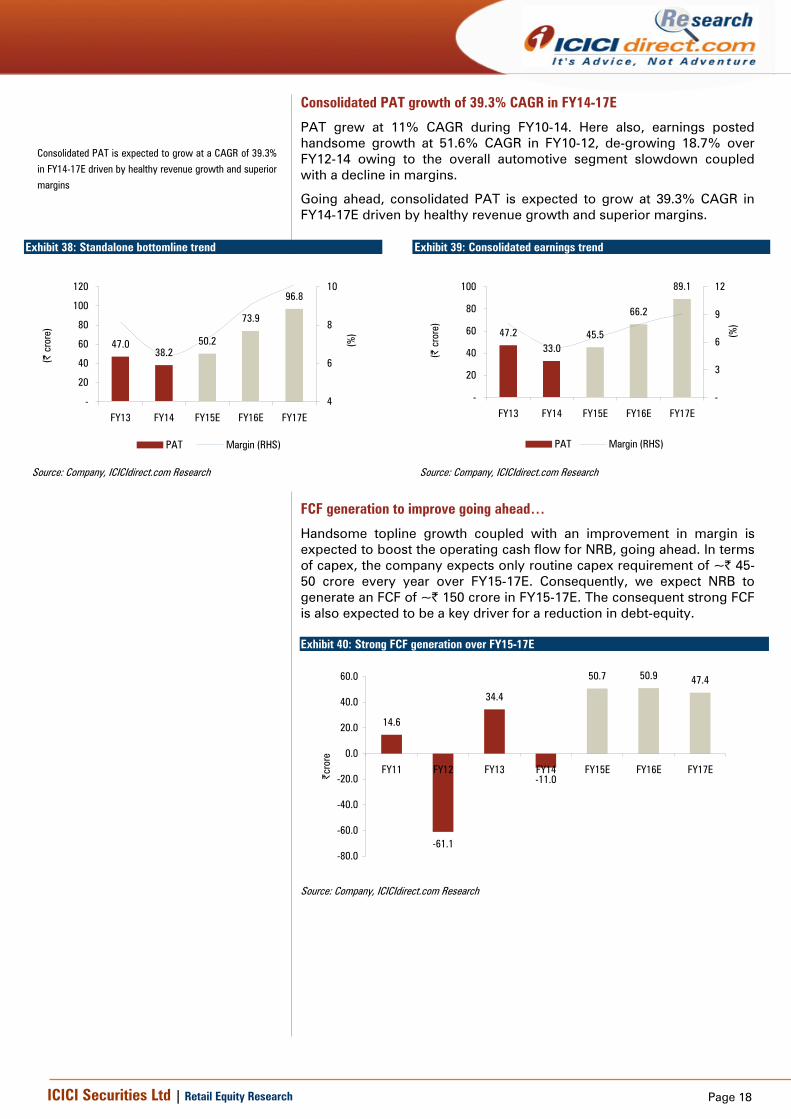
Consolidated PAT growth of 39.3% CAGR in FY14-17E
PAT grew at 11% CAGR during FY10-14. Here also, earnings posted handsome growth at 51.6% CAGR in FY10-12, de-growing 18.7% over FY12-14 owing to the overall automotive segment slowdown coupled with a decline in margins.
Going ahead, consolidated PAT is expected to grow at 39.3% CAGR in FY14-17E driven by healthy revenue growth and superior margins.
Exhibit 38: Standalone bottomline trend
47.038.2
50.2
73.9
96.8
-
20
40
60
80
100
120
FY13 FY14 FY15E FY16E FY17E
(| c
rore
)
4
6
8
10
(%)
PAT Margin (RHS)
Source: Company, ICICIdirect.com Research
Exhibit 39: Consolidated earnings trend
47.233.0
45.5
66.2
89.1
-
20
40
60
80
100
FY13 FY14 FY15E FY16E FY17E
(| c
rore
)
-
3
6
9
12
(%)
PAT Margin (RHS)
Source: Company, ICICIdirect.com Research
FCF generation to improve going ahead…
Handsome topline growth coupled with an improvement in margin is expected to boost the operating cash flow for NRB, going ahead. In terms of capex, the company expects only routine capex requirement of ~| 45-50 crore every year over FY15-17E. Consequently, we expect NRB to generate an FCF of ~| 150 crore in FY15-17E. The consequent strong FCF is also expected to be a key driver for a reduction in debt-equity. Exhibit 40: Strong FCF generation over FY15-17E
14.6
-61.1
34.4
-11.0
50.7 50.9 47.4
-80.0
-60.0
-40.0
-20.0
0.0
20.0
40.0
60.0
FY11 FY12 FY13 FY14 FY15E FY16E FY17E|cro
re
Source: Company, ICICIdirect.com Research
Consolidated PAT is expected to grow at a CAGR of 39.3%
in FY14-17E driven by healthy revenue growth and superior
margins
Page 19ICICI Securities Ltd | Retail Equity Research
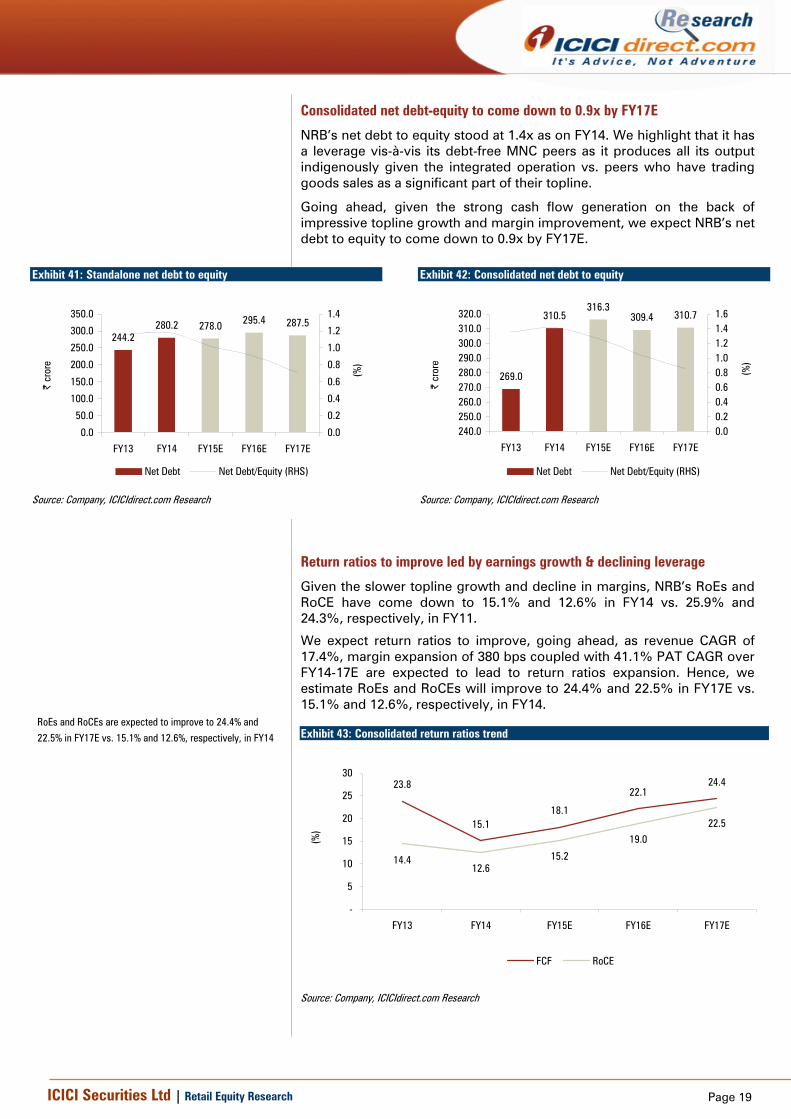
Consolidated net debt-equity to come down to 0.9x by FY17E
NRB’s net debt to equity stood at 1.4x as on FY14. We highlight that it has a leverage vis-à-vis its debt-free MNC peers as it produces all its output indigenously given the integrated operation vs. peers who have trading goods sales as a significant part of their topline.
Going ahead, given the strong cash flow generation on the back of impressive topline growth and margin improvement, we expect NRB’s net debt to equity to come down to 0.9x by FY17E.
Exhibit 41: Standalone net debt to equity
244.2280.2 278.0 295.4 287.5
0.0
50.0
100.0
150.0
200.0
250.0
300.0
350.0
FY13 FY14 FY15E FY16E FY17E
| cr
ore
0.0
0.2
0.4
0.6
0.8
1.0
1.2
1.4
(%)
Net Debt Net Debt/Equity (RHS)
Source: Company, ICICIdirect.com Research
Exhibit 42: Consolidated net debt to equity
269.0
310.5316.3
309.4 310.7
240.0250.0260.0270.0280.0290.0300.0310.0320.0
FY13 FY14 FY15E FY16E FY17E|
cror
e0.00.20.40.60.81.01.21.41.6
(%)
Net Debt Net Debt/Equity (RHS)
Source: Company, ICICIdirect.com Research
Return ratios to improve led by earnings growth & declining leverage
Given the slower topline growth and decline in margins, NRB’s RoEs and RoCE have come down to 15.1% and 12.6% in FY14 vs. 25.9% and 24.3%, respectively, in FY11.
We expect return ratios to improve, going ahead, as revenue CAGR of 17.4%, margin expansion of 380 bps coupled with 41.1% PAT CAGR over FY14-17E are expected to lead to return ratios expansion. Hence, we estimate RoEs and RoCEs will improve to 24.4% and 22.5% in FY17E vs. 15.1% and 12.6%, respectively, in FY14.
Exhibit 43: Consolidated return ratios trend
23.8
15.118.1
22.124.4
14.412.6
15.2
19.022.5
-
5
10
15
20
25
30
FY13 FY14 FY15E FY16E FY17E
(%)
FCF RoCE
Source: Company, ICICIdirect.com Research
RoEs and RoCEs are expected to improve to 24.4% and
22.5% in FY17E vs. 15.1% and 12.6%, respectively, in FY14
Page 20ICICI Securities Ltd | Retail Equity Research
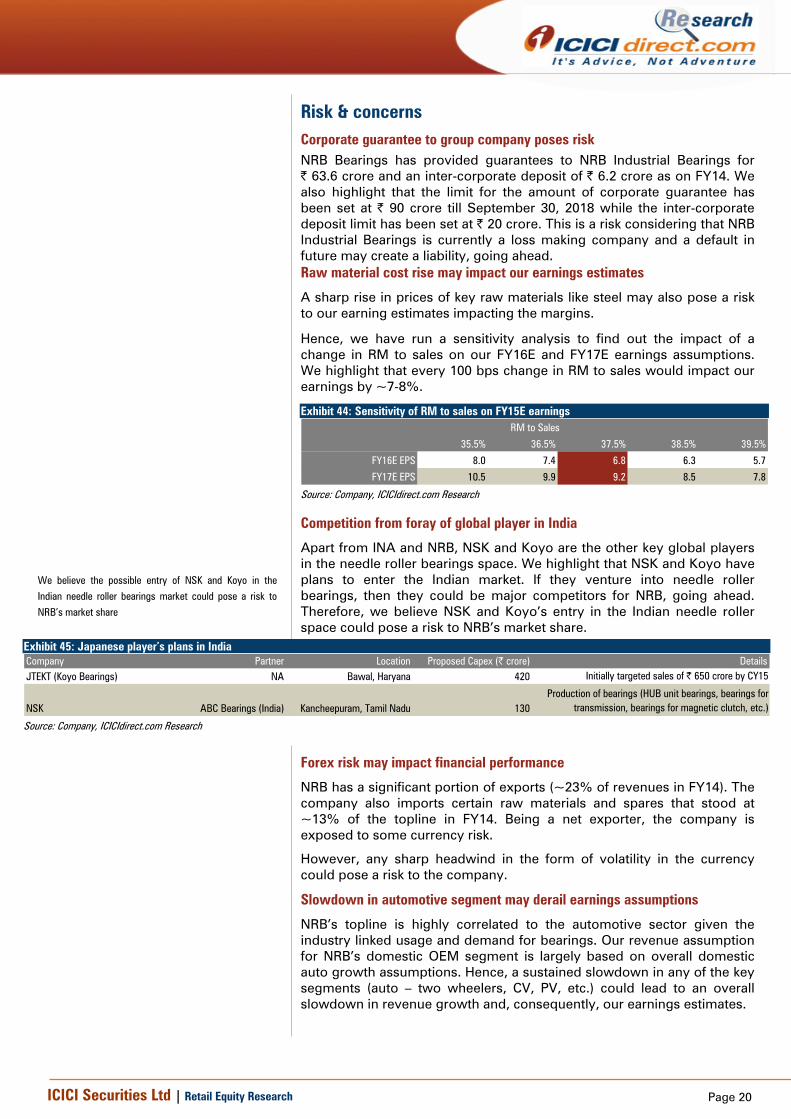
Risk & concerns Corporate guarantee to group company poses risk NRB Bearings has provided guarantees to NRB Industrial Bearings for | 63.6 crore and an inter-corporate deposit of | 6.2 crore as on FY14. We also highlight that the limit for the amount of corporate guarantee has been set at | 90 crore till September 30, 2018 while the inter-corporate deposit limit has been set at | 20 crore. This is a risk considering that NRB Industrial Bearings is currently a loss making company and a default in future may create a liability, going ahead. Raw material cost rise may impact our earnings estimates
A sharp rise in prices of key raw materials like steel may also pose a risk to our earning estimates impacting the margins.
Hence, we have run a sensitivity analysis to find out the impact of a change in RM to sales on our FY16E and FY17E earnings assumptions. We highlight that every 100 bps change in RM to sales would impact our earnings by ~7-8%.
Exhibit 44: Sensitivity of RM to sales on FY15E earnings
35.5% 36.5% 37.5% 38.5% 39.5%
FY16E EPS 8.0 7.4 6.8 6.3 5.7
FY17E EPS 10.5 9.9 9.2 8.5 7.8
RM to Sales
Source: Company, ICICIdirect.com Research
Competition from foray of global player in India
Apart from INA and NRB, NSK and Koyo are the other key global players in the needle roller bearings space. We highlight that NSK and Koyo have plans to enter the Indian market. If they venture into needle roller bearings, then they could be major competitors for NRB, going ahead. Therefore, we believe NSK and Koyo’s entry in the Indian needle roller space could pose a risk to NRB’s market share.
Exhibit 45: Japanese player’s plans in India Company Partner Location Proposed Capex (| crore) DetailsJTEKT (Koyo Bearings) NA Bawal, Haryana 420 Initially targeted sales of | 650 crore by CY15
NSK ABC Bearings (India) Kancheepuram, Tamil Nadu 130Production of bearings (HUB unit bearings, bearings for
transmission, bearings for magnetic clutch, etc.)
Source: Company, ICICIdirect.com Research
Forex risk may impact financial performance
NRB has a significant portion of exports (~23% of revenues in FY14). The company also imports certain raw materials and spares that stood at ~13% of the topline in FY14. Being a net exporter, the company is exposed to some currency risk.
However, any sharp headwind in the form of volatility in the currency could pose a risk to the company.
Slowdown in automotive segment may derail earnings assumptions
NRB’s topline is highly correlated to the automotive sector given the industry linked usage and demand for bearings. Our revenue assumption for NRB’s domestic OEM segment is largely based on overall domestic auto growth assumptions. Hence, a sustained slowdown in any of the key segments (auto – two wheelers, CV, PV, etc.) could lead to an overall slowdown in revenue growth and, consequently, our earnings estimates.
We believe the possible entry of NSK and Koyo in the
Indian needle roller bearings market could pose a risk to
NRB’s market share
Page 21ICICI Securities Ltd | Retail Equity Research
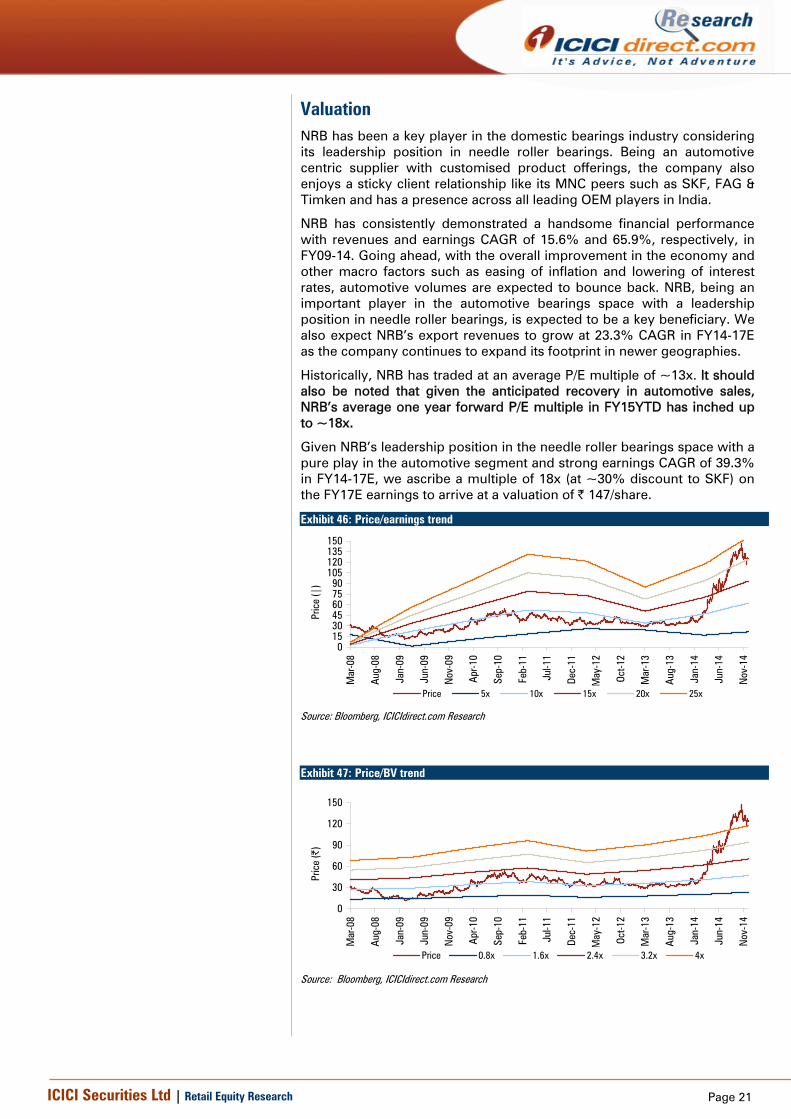
Valuation NRB has been a key player in the domestic bearings industry considering its leadership position in needle roller bearings. Being an automotive centric supplier with customised product offerings, the company also enjoys a sticky client relationship like its MNC peers such as SKF, FAG & Timken and has a presence across all leading OEM players in India.
NRB has consistently demonstrated a handsome financial performance with revenues and earnings CAGR of 15.6% and 65.9%, respectively, in FY09-14. Going ahead, with the overall improvement in the economy and other macro factors such as easing of inflation and lowering of interest rates, automotive volumes are expected to bounce back. NRB, being an important player in the automotive bearings space with a leadership position in needle roller bearings, is expected to be a key beneficiary. We also expect NRB’s export revenues to grow at 23.3% CAGR in FY14-17E as the company continues to expand its footprint in newer geographies.
Historically, NRB has traded at an average P/E multiple of ~13x. It should also be noted that given the anticipated recovery in automotive sales, NRB’s average one year forward P/E multiple in FY15YTD has inched up to ~18x.
Given NRB’s leadership position in the needle roller bearings space with a pure play in the automotive segment and strong earnings CAGR of 39.3% in FY14-17E, we ascribe a multiple of 18x (at ~30% discount to SKF) on the FY17E earnings to arrive at a valuation of | 147/share.
Exhibit 46: Price/earnings trend
0153045607590
105120135150
Mar
-08
Aug-
08
Jan-
09
Jun-
09
Nov
-09
Apr-1
0
Sep-
10
Feb-
11
Jul-1
1
Dec-
11
May
-12
Oct-1
2
Mar
-13
Aug-
13
Jan-
14
Jun-
14
Nov
-14
Pric
e (|
)
Price 5x 10x 15x 20x 25x
Source: Bloomberg, ICICIdirect.com Research
Exhibit 47: Price/BV trend
0
30
60
90
120
150
Mar
-08
Aug-
08
Jan-
09
Jun-
09
Nov
-09
Apr-1
0
Sep-
10
Feb-
11
Jul-1
1
Dec-
11
May
-12
Oct-1
2
Mar
-13
Aug-
13
Jan-
14
Jun-
14
Nov
-14
Pric
e (|
)
Price 0.8x 1.6x 2.4x 3.2x 4x
Source: Bloomberg, ICICIdirect.com Research
Page 22ICICI Securities Ltd | Retail Equity Research
Exhibit 48: I-direct estimate vs. consensus | crore Consensus I-Direct Deviation over consensus (%)
Revenues
FY15E 712.7 700.4 -1.7
FY16E 851.2 835.1 -1.9
FY17E 990.2 982.7 -0.8
EBITDA
FY15E 134.5 128.2 -4.7
FY16E 164.7 162.9 -1.1
FY17E 194.4 199.7 2.7
PAT
FY15E 57.5 45.5 -20.9
FY16E 76.0 66.2 -12.9
FY17E 96.8 89.1 -7.9
Source: Bloomberg. ICICIdirect.com Research
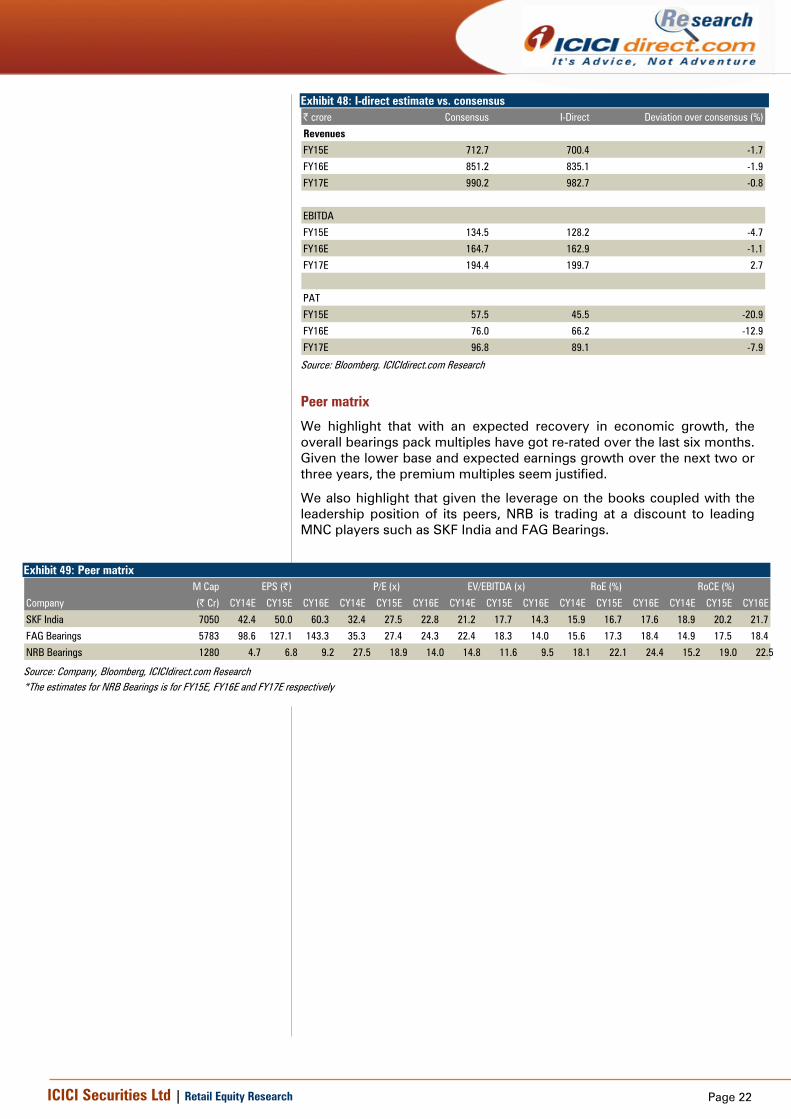
Peer matrix
We highlight that with an expected recovery in economic growth, the overall bearings pack multiples have got re-rated over the last six months. Given the lower base and expected earnings growth over the next two or three years, the premium multiples seem justified.
We also highlight that given the leverage on the books coupled with the leadership position of its peers, NRB is trading at a discount to leading MNC players such as SKF India and FAG Bearings.
Exhibit 49: Peer matrix
M Cap
(| Cr) CY14E CY15E CY16E CY14E CY15E CY16E CY14E CY15E CY16E CY14E CY15E CY16E CY14E CY15E CY16E
SKF India 7050 42.4 50.0 60.3 32.4 27.5 22.8 21.2 17.7 14.3 15.9 16.7 17.6 18.9 20.2 21.7
FAG Bearings 5783 98.6 127.1 143.3 35.3 27.4 24.3 22.4 18.3 14.0 15.6 17.3 18.4 14.9 17.5 18.4
NRB Bearings 1280 4.7 6.8 9.2 27.5 18.9 14.0 14.8 11.6 9.5 18.1 22.1 24.4 15.2 19.0 22.5
RoE (%) RoCE (%)
Company
EPS (|) P/E (x) EV/EBITDA (x)
Source: Company, Bloomberg, ICICIdirect.com Research *The estimates for NRB Bearings is for FY15E, FY16E and FY17E respectively
Page 23ICICI Securities Ltd | Retail Equity Research
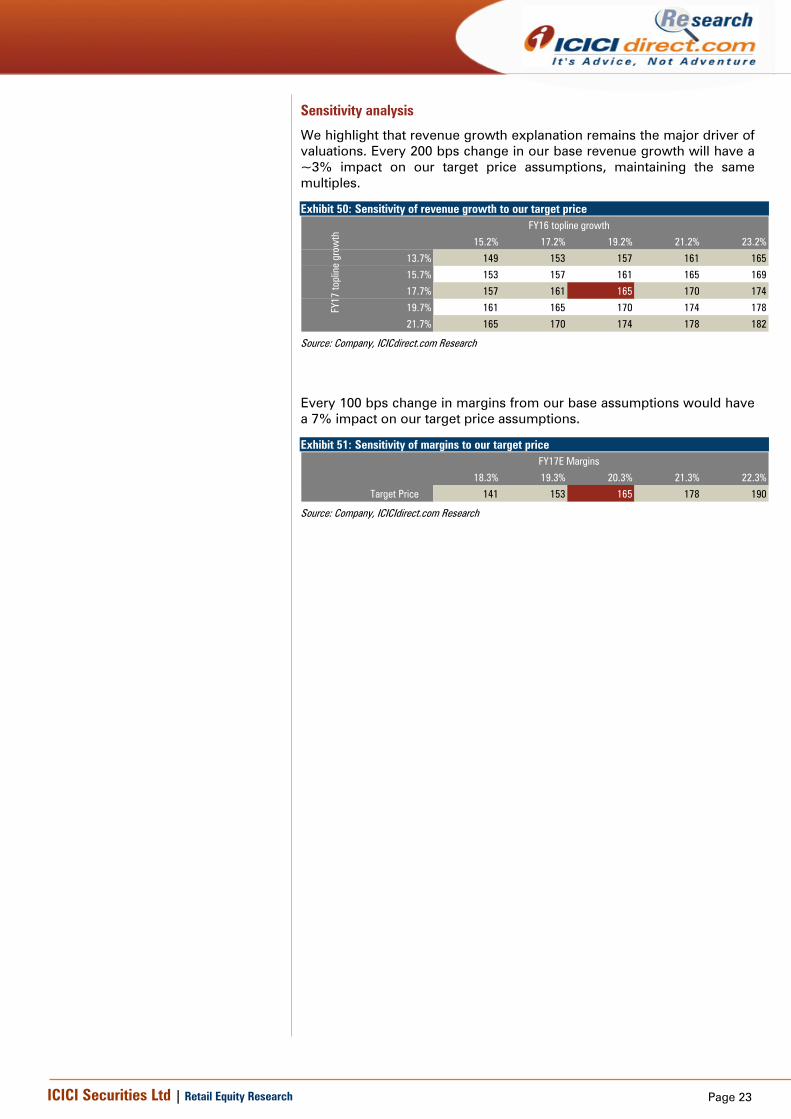
Sensitivity analysis
We highlight that revenue growth explanation remains the major driver of valuations. Every 200 bps change in our base revenue growth will have a ~3% impact on our target price assumptions, maintaining the same multiples.
Exhibit 50: Sensitivity of revenue growth to our target price
165 15.2% 17.2% 19.2% 21.2% 23.2%
13.7% 149 153 157 161 165
15.7% 153 157 161 165 169
17.7% 157 161 165 170 174
19.7% 161 165 170 174 178
21.7% 165 170 174 178 182 F
Y17
topl
ine
grow
th
FY16 topline growth
Source: Company, ICICdirect.com Research
Every 100 bps change in margins from our base assumptions would have a 7% impact on our target price assumptions.
Exhibit 51: Sensitivity of margins to our target price
18.3% 19.3% 20.3% 21.3% 22.3%
Target Price 141 153 165 178 190
FY17E Margins
Source: Company, ICICIdirect.com Research
Page 24ICICI Securities Ltd | Retail Equity Research
Tables and ratios (Consolidated)
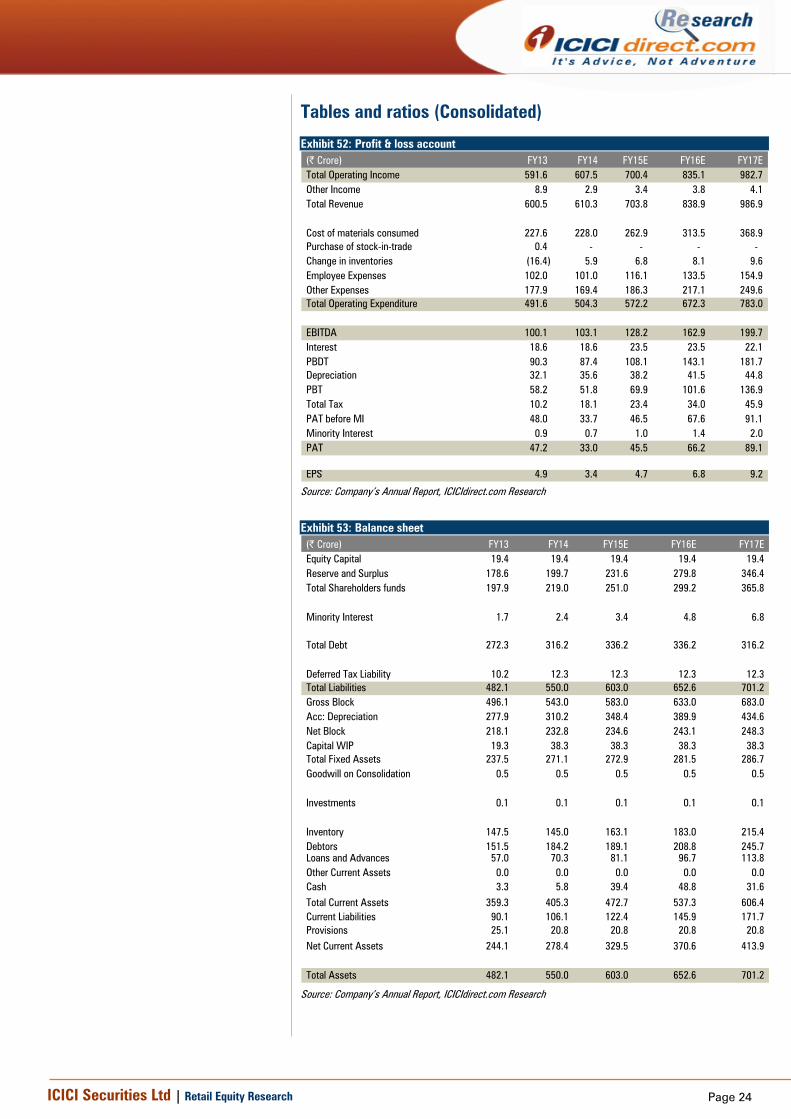
Exhibit 52: Profit & loss account (| Crore) FY13 FY14 FY15E FY16E FY17ETotal Operating Income 591.6 607.5 700.4 835.1 982.7 Other Income 8.9 2.9 3.4 3.8 4.1 Total Revenue 600.5 610.3 703.8 838.9 986.9
Cost of materials consumed 227.6 228.0 262.9 313.5 368.9 Purchase of stock-in-trade 0.4 - - - - Change in inventories (16.4) 5.9 6.8 8.1 9.6 Employee Expenses 102.0 101.0 116.1 133.5 154.9 Other Expenses 177.9 169.4 186.3 217.1 249.6 Total Operating Expenditure 491.6 504.3 572.2 672.3 783.0
EBITDA 100.1 103.1 128.2 162.9 199.7 Interest 18.6 18.6 23.5 23.5 22.1 PBDT 90.3 87.4 108.1 143.1 181.7 Depreciation 32.1 35.6 38.2 41.5 44.8 PBT 58.2 51.8 69.9 101.6 136.9 Total Tax 10.2 18.1 23.4 34.0 45.9 PAT before MI 48.0 33.7 46.5 67.6 91.1 Minority Interest 0.9 0.7 1.0 1.4 2.0 PAT 47.2 33.0 45.5 66.2 89.1
EPS 4.9 3.4 4.7 6.8 9.2
Source: Company’s Annual Report, ICICIdirect.com Research
Exhibit 53: Balance sheet (| Crore) FY13 FY14 FY15E FY16E FY17EEquity Capital 19.4 19.4 19.4 19.4 19.4 Reserve and Surplus 178.6 199.7 231.6 279.8 346.4 Total Shareholders funds 197.9 219.0 251.0 299.2 365.8
Minority Interest 1.7 2.4 3.4 4.8 6.8
Total Debt 272.3 316.2 336.2 336.2 316.2
Deferred Tax Liability 10.2 12.3 12.3 12.3 12.3 Total Liabilities 482.1 550.0 603.0 652.6 701.2 Gross Block 496.1 543.0 583.0 633.0 683.0 Acc: Depreciation 277.9 310.2 348.4 389.9 434.6 Net Block 218.1 232.8 234.6 243.1 248.3 Capital WIP 19.3 38.3 38.3 38.3 38.3 Total Fixed Assets 237.5 271.1 272.9 281.5 286.7 Goodwill on Consolidation 0.5 0.5 0.5 0.5 0.5
Investments 0.1 0.1 0.1 0.1 0.1
Inventory 147.5 145.0 163.1 183.0 215.4 Debtors 151.5 184.2 189.1 208.8 245.7 Loans and Advances 57.0 70.3 81.1 96.7 113.8 Other Current Assets 0.0 0.0 0.0 0.0 0.0 Cash 3.3 5.8 39.4 48.8 31.6 Total Current Assets 359.3 405.3 472.7 537.3 606.4 Current Liabilities 90.1 106.1 122.4 145.9 171.7 Provisions 25.1 20.8 20.8 20.8 20.8 Net Current Assets 244.1 278.4 329.5 370.6 413.9
Total Assets 482.1 550.0 603.0 652.6 701.2
Source: Company’s Annual Report, ICICIdirect.com Research
Page 25ICICI Securities Ltd | Retail Equity Research
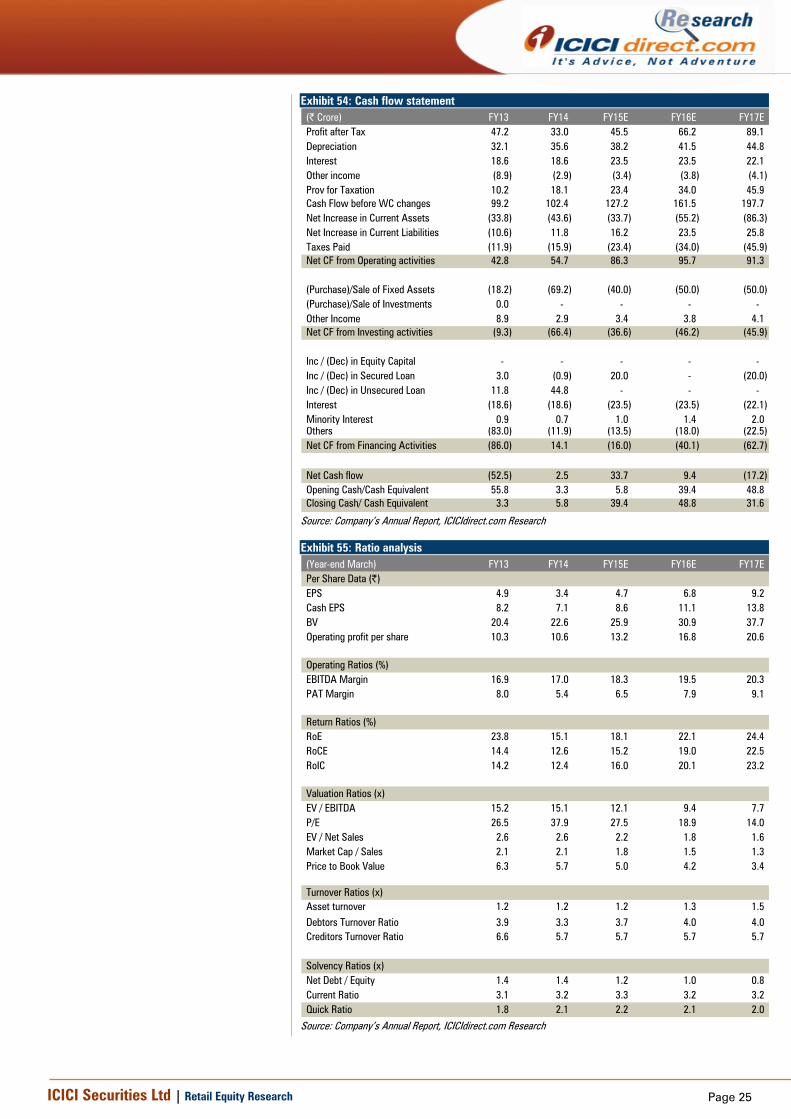
Exhibit 54: Cash flow statement (| Crore) FY13 FY14 FY15E FY16E FY17EProfit after Tax 47.2 33.0 45.5 66.2 89.1 Depreciation 32.1 35.6 38.2 41.5 44.8 Interest 18.6 18.6 23.5 23.5 22.1 Other income (8.9) (2.9) (3.4) (3.8) (4.1) Prov for Taxation 10.2 18.1 23.4 34.0 45.9 Cash Flow before WC changes 99.2 102.4 127.2 161.5 197.7 Net Increase in Current Assets (33.8) (43.6) (33.7) (55.2) (86.3) Net Increase in Current Liabilities (10.6) 11.8 16.2 23.5 25.8 Taxes Paid (11.9) (15.9) (23.4) (34.0) (45.9) Net CF from Operating activities 42.8 54.7 86.3 95.7 91.3
(Purchase)/Sale of Fixed Assets (18.2) (69.2) (40.0) (50.0) (50.0) (Purchase)/Sale of Investments 0.0 - - - - Other Income 8.9 2.9 3.4 3.8 4.1 Net CF from Investing activities (9.3) (66.4) (36.6) (46.2) (45.9)
Inc / (Dec) in Equity Capital - - - - - Inc / (Dec) in Secured Loan 3.0 (0.9) 20.0 - (20.0) Inc / (Dec) in Unsecured Loan 11.8 44.8 - - - Interest (18.6) (18.6) (23.5) (23.5) (22.1) Minority Interest 0.9 0.7 1.0 1.4 2.0 Others (83.0) (11.9) (13.5) (18.0) (22.5) Net CF from Financing Activities (86.0) 14.1 (16.0) (40.1) (62.7)
Net Cash flow (52.5) 2.5 33.7 9.4 (17.2) Opening Cash/Cash Equivalent 55.8 3.3 5.8 39.4 48.8 Closing Cash/ Cash Equivalent 3.3 5.8 39.4 48.8 31.6
Source: Company’s Annual Report, ICICIdirect.com Research
Exhibit 55: Ratio analysis (Year-end March) FY13 FY14 FY15E FY16E FY17EPer Share Data (|)EPS 4.9 3.4 4.7 6.8 9.2 Cash EPS 8.2 7.1 8.6 11.1 13.8 BV 20.4 22.6 25.9 30.9 37.7 Operating profit per share 10.3 10.6 13.2 16.8 20.6
Operating Ratios (%)EBITDA Margin 16.9 17.0 18.3 19.5 20.3 PAT Margin 8.0 5.4 6.5 7.9 9.1
Return Ratios (%)RoE 23.8 15.1 18.1 22.1 24.4 RoCE 14.4 12.6 15.2 19.0 22.5 RoIC 14.2 12.4 16.0 20.1 23.2
Valuation Ratios (x)EV / EBITDA 15.2 15.1 12.1 9.4 7.7 P/E 26.5 37.9 27.5 18.9 14.0 EV / Net Sales 2.6 2.6 2.2 1.8 1.6 Market Cap / Sales 2.1 2.1 1.8 1.5 1.3 Price to Book Value 6.3 5.7 5.0 4.2 3.4
- - - - Turnover Ratios (x)Asset turnover 1.2 1.2 1.2 1.3 1.5 Debtors Turnover Ratio 3.9 3.3 3.7 4.0 4.0 Creditors Turnover Ratio 6.6 5.7 5.7 5.7 5.7
Solvency Ratios (x)Net Debt / Equity 1.4 1.4 1.2 1.0 0.8 Current Ratio 3.1 3.2 3.3 3.2 3.2 Quick Ratio 1.8 2.1 2.2 2.1 2.0
Source: Company’s Annual Report, ICICIdirect.com Research
Page 26ICICI Securities Ltd | Retail Equity Research
RATING RATIONALE ICICIdirect.com endeavours to provide objective opinions and recommendations. ICICIdirect.com assigns ratings to its stocks according to their notional target price vs. current market price and then categorises them as Strong Buy, Buy, Hold and Sell. The performance horizon is two years unless specified and the notional target price is defined as the analysts' valuation for a stock. Strong Buy: >15%/20% for large caps/midcaps, respectively, with high conviction; Buy: >10%/15% for large caps/midcaps, respectively; Hold: Up to +/-10%; Sell: -10% or more;
Pankaj Pandey Head – Research [email protected]
ICICIdirect.com Research Desk, ICICI Securities Limited, 1st Floor, Akruti Trade Centre, Road No. 7, MIDC, Andheri (East) Mumbai – 400 093
Page 27ICICI Securities Ltd | Retail Equity Research
ANALYST CERTIFICATION
We /I, Chirag Shah PGDBM; Bhupendra Tiwary MBA (FINANCE), Research Analysts, authors and the names subscribed to this report, hereby certify that all of the views expressed in this research report accurately reflect our views about the subject issuer(s) or securities. We also certify that no part of our compensation was, is, or will be directly or indirectly related to the specific recommendation(s) or view(s) in this report.
Terms & conditions and other disclosures: ICICI Securities Limited (ICICI Securities) is a full-service, integrated investment banking and is, inter alia, engaged in the business of stock brokering and distribution of financial products. ICICI Securities is a wholly-owned subsidiary of ICICI Bank which is India’s largest private sector bank and has its various subsidiaries engaged in businesses of housing finance, asset management, life insurance, general insurance, venture capital fund management, etc. (“associates”), the details in respect of which are available on www.icicibank.com. ICICI Securities is one of the leading merchant bankers/ underwriters of securities and participate in virtually all securities trading markets in India. We and our associates might have investment banking and other business relationship with a significant percentage of companies covered by our Investment Research Department. ICICI Securities generally prohibits its analysts, persons reporting to analysts and their relatives from maintaining a financial interest in the securities or derivatives of any companies that the analysts cover. The information and opinions in this report have been prepared by ICICI Securities and are subject to change without any notice. The report and information contained herein is strictly confidential and meant solely for the selected recipient and may not be altered in any way, transmitted to, copied or distributed, in part or in whole, to any other person or to the media or reproduced in any form, without prior written consent of ICICI Securities. While we would endeavour to update the information herein on a reasonable basis, ICICI Securities is under no obligation to update or keep the information current. Also, there may be regulatory, compliance or other reasons that may prevent ICICI Securities from doing so. Non-rated securities indicate that rating on a particular security has been suspended temporarily and such suspension is in compliance with applicable regulations and/or ICICI Securities policies, in circumstances where ICICI Securities might be acting in an advisory capacity to this company, or in certain other circumstances. This report is based on information obtained from public sources and sources believed to be reliable, but no independent verification has been made nor is its accuracy or completeness guaranteed. This report and information herein is solely for informational purpose and shall not be used or considered as an offer document or solicitation of offer to buy or sell or subscribe for securities or other financial instruments. Though disseminated to all the customers simultaneously, not all customers may receive this report at the same time. ICICI Securities will not treat recipients as customers by virtue of their receiving this report. Nothing in this report constitutes investment, legal, accounting and tax advice or a representation that any investment or strategy is suitable or appropriate to your specific circumstances. The securities discussed and opinions expressed in this report may not be suitable for all investors, who must make their own investment decisions, based on their own investment objectives, financial positions and needs of specific recipient. This may not be taken in substitution for the exercise of independent judgment by any recipient. The recipient should independently evaluate the investment risks. The value and return on investment may vary because of changes in interest rates, foreign exchange rates or any other reason. ICICI Securities accepts no liabilities whatsoever for any loss or damage of any kind arising out of the use of this report. Past performance is not necessarily a guide to future performance. Investors are advised to see Risk Disclosure Document to understand the risks associated before investing in the securities markets. Actual results may differ materially from those set forth in projections. Forward-looking statements are not predictions and may be subject to change without notice. ICICI Securities or its associates might have managed or co-managed public offering of securities for the subject company or might have been mandated by the subject company for any other assignment in the past twelve months. ICICI Securities or its associates might have received any compensation from the companies mentioned in the report during the period preceding twelve months from the date of this report for services in respect of managing or co-managing public offerings, corporate finance, investment banking or merchant banking, brokerage services or other advisory service in a merger or specific transaction. ICICI Securities or its associates might have received any compensation for products or services other than investment banking or merchant banking or brokerage services from the companies mentioned in the report in the past twelve months. ICICI Securities encourages independence in research report preparation and strives to minimize conflict in preparation of research report. ICICI Securities or its analysts did not receive any compensation or other benefits from the companies mentioned in the report or third party in connection with preparation of the research report. Accordingly, neither ICICI Securities nor Research Analysts have any material conflict of interest at the time of publication of this report. It is confirmed that Chirag Shah PGDBM; Bhupendra Tiwary MBA (FINANCE), Research Analysts of this report have not received any compensation from the companies mentioned in the report in the preceding twelve months. Compensation of our Research Analysts is not based on any specific merchant banking, investment banking or brokerage service transactions. ICICI Securities or its subsidiaries collectively or Research Analysts do not own 1% or more of the equity securities of the Company mentioned in the report as of the last day of the month preceding the publication of the research report. Since associates of ICICI Securities are engaged in various financial service businesses, they might have financial interests or beneficial ownership in various companies including the subject company/companies mentioned in this report. It is confirmed Chirag Shah PGDBM; Bhupendra Tiwary MBA (FINANCE), Research Analysts do not serve as an officer, director or employee of the companies mentioned in the report. ICICI Securities may have issued other reports that are inconsistent with and reach different conclusion from the information presented in this report. Neither the Research Analysts nor ICICI Securities have been engaged in market making activity for the companies mentioned in the report. We submit that no material disciplinary action has been taken on ICICI Securities by any Regulatory Authority impacting Equity Research Analysis activities. This report is not directed or intended for distribution to, or use by, any person or entity who is a citizen or resident of or located in any locality, state, country or other jurisdiction, where such distribution, publication, availability or use would be contrary to law, regulation or which would subject ICICI Securities and affiliates to any registration or licensing requirement within such jurisdiction. The securities described herein may or may not be eligible for sale in all jurisdictions or to certain category of investors. Persons in whose possession this document may come are required to inform themselves of and to observe such restriction.


![Reliance Capital Limited - ICICI Directcontent.icicidirect.com/Mailimages/IM_MLD_B275.pdf · email: mohan.vellore@relianceada.com] information memorandum of private placement for](https://img.pdfslide.net/doc/110x75/5eaa30f8b27ced36813c42d2/reliance-capital-limited-icici-email-mohanvellorerelianceadacom-information.jpg)