Embed Size (px)
Citation preview
May 15, 2017
ICICI Securities Ltd | Retail Equity Research
Result Update
US performance continues to weigh on numbers… • Revenues declined 5% YoY to | 3554 crore (I-direct estimate: | 3632
crore) mainly due to 19% decline in US sales to | 1535 crore (I-direct estimate: | 1610 crore) led by increased competition in key products coupled with discontinuance of McNeil contract
• EBITDA margins declined 643 bps to 15.1% (I-direct estimate: 21.3%) mainly due to a sharp decline in gross margins by 549 bps to 51.2% (I-direct estimate: 56%) led by one-offs
• Adjusted net profit fell 40% YoY to | 338 crore (I-direct estimate: | 406 crore) mainly due to lower operational performance
US business passing through rough patch US business grew 15% to | 6360 crore over FY12-17 mainly driven by new launches. US remains a key driver for the company, contributing ~45% to total revenues. Current US pending pipeline comprises 101 pending approvals (62 Para IV filings and 21 FTFs) including two NDAs. The company has developed a knack for exclusivity/FTF launches on a fairly continuous basis in US. However, warning letter for its Srikakulam API and other facilities besides price erosion in key products has changed equations. We expect DRL’s US revenues to normalise from H2FY18 by resolution of warning letter and incremental product launches. We expect US sales to grow at a CAGR of 10% to | 7653 crore in FY17-19E. Russia CIS provides strong growth, India to provide more stability Global generics (ex US, Europe) is likely to grow at a steady CAGR of 8% in FY17-19E driven by growth in India as the Russian performance remains volatile. These two markets are more or less identical in nature (branded generics and OTC) with similar growth potential and similar kinds of risks. DRL is well versed with the dynamics in Russia by virtue of being an early mover. We expect strong growth in these markets on the back of stabilise currency, geographical expansion, robust biological portfolio and ramp up in institutional business. For India, growth is expected to be largely from launches in the oncology and biosimilars space, UCB like acquisitions besides an improvement in productivity. Portfolio realignment eminent We envisage a fall in share of low margin segments such as PSAI, going ahead. Thus, growth in FY17-19E is likely to emanate from more productive and sustainable segments such as the US, India and biosimilar in emerging markets. Similarly, in terms of product offering, we envisage more launches in the fields of injectables, OTC, complex/limited competition products, proprietary products and biosimilars. Recovery in US key event to be watched; maintain HOLD The company witnessed perhaps the worst FY17 performance in recent times wherein revenues were impacted by US warning letter, pricing pressure in the base business, delay in approvals and issues in Venezuela. Profitability was affected due to adverse product mix, higher remedial costs and one-offs. Despite bolstering a sound US portfolio, pricing pressure owning to client consolidation and macroeconomic headwinds along with cGMP issues and delay in product approvals have emerged as major stumbling block. The management expects gradual recovery in the overall performance but remains cautiously optimistic about US prospects. Some hope of US recovery can be attributable to aggressive ANDA filings (13) in Q4. Apart from US, Global Generics (ex US, Europe) growth is expected to recover on the back of stabilise currency, geographical expansion, robust biosimilar portfolio and ramp up in institutional business. We have ascribed a target price of | 2610 based on 19x FY19E EPS of | 137.
Rating matrix Rating : Hold
Target : | 2610
Target Period : 12-15 months
Potential Upside : -2%
What’s Changed?
Target Changed from | 3300 to | 2610
EPS FY18E Changed from | 114.1 to | 106.1
EPS FY19E Changed from | 154.3 to | 137.3
Rating Unchanged
Quarterly Performance
Q4FY17 Q4FY16 YoY (%) Q3FY17 QoQ (%)Revenue 3,554.2 3,756.2 -5.4 3,706.5 -4.1EBITDA 538.3 810.4 -33.6 871.3 -38.2EBITDA (%) 15.1 21.6 -643.0 23.5 -836.2Adjusted PAT 302.3 499.6 -39.5 461.2 -34.5
Key Financials (|crore) FY16 FY17E FY18E FY19E
Revenues 15470.9 14080.9 15176.9 17301.2
EBITDA 3982.5 2426.5 3424.5 4160.9
Adjusted PAT 2409.5 1169.5 1808.4 2339.1
EPS (Adjusted) 141.4 68.6 106.1 137.3
Valuation summary
FY16 FY17E FY18E FY19E
PE (x) 22.7 37.8 24.9 19.3
Target PE (x) 18.5 38.0 24.6 19.0
EV to EBITDA (x) 11.3 19.1 13.0 10.4
Price to book (x) 3.9 3.7 3.3 2.9
RoNW (%) 20.6 9.4 13.0 14.7
RoCE (%) 17.3 6.3 10.8 13.7
Stock data
Particular
Market Capitalisation
Debt (FY17E)
Cash & cash equivalents (FY17E)
EV
52 week H/L (|) 3690/2555
Equity capital
Face value | 5
| 82.8 crore
| 48010 crore
Amount
| 44256 crore
| 4919 crore
| 1165 crore
Price performance (%) 1M 3M 6M 1Y
Dr Reddy's Labs -2.4 -13.3 -20.7 -13.1Sun Pharma -4.1 0.0 -4.8 -18.5Lupin -12.9 -14.5 -14.0 -22.4
Dr Reddy’s Laboratories (DRREDD) | 2671
Research Analyst
Siddhant Khandekar [email protected] Mitesh Shah [email protected] Harshal Mehta [email protected]
ICICI Securities Ltd | Retail Equity Research Page 2
Variance analysis Q4FY17 Q4FY17E Q4FY16 Q3FY17 YoY (%) QoQ (%) Comments
Revenue 3,554.2 3,631.7 3,756.2 3,706.5 -5.4 -4.1 YoY decline in sales mainly on the back of price erosion and increased competition in key products in the US and Venezuela
Raw Material Expenses 1,736.0 1,596.2 1,628.6 1,516.6 6.6 14.5Gross Profit 1,818.2 2,035.5 2,127.6 2,189.9 -14.5 -17.0Gross Margins (%) 51.2 56.0 56.6 59.1 -548.6 -792.6 Global generic and PSAI segment gross margins were 61.6% and 21.0%,
respectively. Impairment charge recorded at antibiotics manufacturing facility at Bristol (US) and incremental provision of inventory build-up in anticipation of new product launch that failed to materialise has sequentially reduced overall gross margins by 793 bps
SG&A 872.5 871.6 860.0 841.7 1.5 3.7R&D Expenditure 457.9 399.5 487.9 495.6 -6.1 -7.6Other (income)/expenses -50.5 -9.1 -30.7 -18.7 64.5 170.1EBITDA 538.3 773.5 810.4 871.3 -33.6 -38.2 YoY decline mainly on account adverse product mix. miss vis-à-vis I-direct
estimate was mainly due to lower-than-expected gross margins as well as higher SG&A expenses
EBITDA (%) 15.1 21.3 21.6 23.5 -643.0 -836.2Finance (income)/ expenses 4.8 -37.0 -166.3 -4.4 -102.9 -209.1 Net forex loss of | 7.4 crore against | 413.3 crore in Q4FY16 primarily related to
Venezuela adjustment. Profit from sale of investment increased by | 10.5 crore YoY while interest income declined by | 65 crore
Depreciation 224.8 292.4 303.2 292.4 -25.9 -23.1Exceptional Items 0.0 0.0 430.9 0.0 NA NAForex & EO -10.2 -5.0 -5.9 -8.9 72.9 14.6PBT 318.9 523.0 248.5 592.2 28.3 -46.1
Tax 6.4 112.5 173.9 122.1 -96.3 -94.8 The lower tax rate primarily due to resolution of certain tax matters pertaining to prior years
Net Profit 312.5 410.6 74.6 470.1 318.9 -33.5Adjusted PAT 302.3 405.6 499.6 461.2 -39.5 -34.5 YoY de-growth largely due to weak operational performance Key MetricsUS 1,534.9 1,609.8 1,895.0 1,659.5 -19.0 -7.5 YoY decline primarily on account of increased competition in key products and
loss of McNeil businessEurope 206.6 193.5 175.9 214.8 17.5 -3.8 YoY growth on the back of new product launches and traction in new markets
India 571.1 579.4 526.7 594.7 8.4 -4.0 YoY growth driven by volume growth and new product launchespartly offset by NLEM impact
Russia & Other CIS 450.0 385.6 321.3 410.0 40.1 9.8 Registered 8% constant currency growth YoY in Russia. In Q4, the company has commenced supplies to national tender for rituximab in Russia
RoW 151.2 174.5 158.6 184.8 -4.7 -18.2 YoY growth was impacted by Venezuela. Miss vis-à-vis I-direct estimates was mainly due to lower than expected off take from new geographies and biosimilars portfolio
PSAI 540.1 576.6 576.6 540.0 -6.3 0.0
Source: Company, ICICIdirect.com Research
Change in estimates
(| Crore) Old New % Change Old New % ChangeRevenue 15,857.7 15,176.9 -4.3 18,671.7 17,301.2 -7.3 Reduced mainly due to a higher-than-expected price erosion in base business and
delay in product approvals in the USEBITDA 3,578.1 3,424.5 -4.3 4,490.5 4,160.9 -7.3EBITDA Margin (%) 22.6 22.6 0 bps 24.1 24.1 0 bps
Adjusted PAT 1,955.1 1,808.4 -7.5 2,633.2 2,339.1 -11.2 Changed in sync with EBITDA and change in tax rate as per management guidance
EPS (|) 114.7 106.1 -7.5 154.5 137.3 -11.2
FY18E FY19E
Source: Company, ICICIdirect.com Research Assumptions
Comments(| crore) FY16 FY17E FY18E FY19E FY18E FY19EUS 7,544.5 6,360.1 6,554.3 7,653.4 7,427.1 9,283.8 Reduced mainly due to a higher-than-expected price erosion in base business and
delay in product approvalsEurope 773.2 760.5 872.3 959.6 800.6 880.7India 2,129.2 2,313.2 2,590.8 2,901.7 2,600.0 2,990.1Russia & Other CIS 1,419.1 1,520.0 1,823.0 2,187.6 1,673.9 1,925.0 Increased mainly due to ramp up in biosimilars and institutional businessRoW 940.2 587.1 666.6 760.9 634.4 697.9 Increased mainly due to geographical expansion and better-than-expected ramp-up
in biosimilars segment PSAI 2,238.0 2,127.7 2,170.3 2,213.7 2,207.5 2,251.6
Current Earlier
Source: Company, ICICIdirect.com Research
ICICI Securities Ltd | Retail Equity Research Page 3
Company Analysis Established in 1984, Dr Reddy’s Laboratories (DRL) is one of India’s pedigreed players having a firm footing in the US and other export markets with deep rooted product and market knowledge across therapies. Like Cipla, DRL also recognised the importance of having good manufacturing practices (GMP) accreditation in the eighties and eventually got USFDA approval (first of its kind approval for a formulation facility in India) in 1987. The company owns 22 manufacturing facilities and four developing centres across the globe. The facilities have been approved by various agencies such as the USFDA, WHO-Geneva, UKMHRA, TGA-Australia, MCC-South Africa, DMA Denmark, Brail ANVISA, among others. Over the years, along with generics the company also established itself in the field of discovery of new chemical entities (NCEs) but with little success. DRL’s business can be classified into three broad segments- 1) Global Generics (GG), 2) Pharmaceutical Services and Active Ingredients (PSAI) and 3) Proprietary Products (PP). Global Generics (82% of revenues) includes branded and unbranded prescription and over-the-counter (OTC) products business. It also includes the operations of the biologics business. This segment comprises formulation sales to regulated markets of the US, Europe and emerging markets such as Russia/CIS, India and RoW. Pharmaceutical services and active ingredients (15.1% of the revenues) consist of the active pharmaceutical ingredients (API) business and custom pharmaceutical services (CPS) business. Proprietary products (PP, 3% of revenues) consist of NCEs, differentiated formulations and dermatology focused specialty business operated through Promius Pharma. DRL is one of the few Indian companies to foray into new drug discovery & development (NDDS) and new chemical entity (NCE) research. The company started research operations in 1992 through a non profit organisation, Dr Reddy’s Research Foundation, which was later merged into the company. Despite being an early entrant, the company is yet to taste success in it. DRL is also the first Indian company to out-license molecules to big pharma companies.
DRL has spent around 13.9% of the turnover on R&D in FY17 and is likely to be in the range of 11-12%, going ahead. Beside ANDAs it has also filed three new drug applications (NDAs) in the 505(b)(2) route which are awaiting approval. The company has launched ZEMBRACE SymTouch under 505(b)(2) route in the US. ZEMBRACE SymTouch is a prefilled, low-dose, ready-to-use Sumatriptan. Because ZEMBRACE SymTouch is a subcutaneous injection, it may lead to rapid relief of migraine. It has also Sernivo, a prescription topical steroid spray, used for mild to moderate plaque psoriasis. The company entered into a license agreement with XenoPort for exclusive US rights for XP23829 on milestone and double digit royalty basis. DRL plans to develop XP23829 as a potential treatment for moderate-to-severe chronic plaque psoriasis and may potentially develop XP23829 for relapsing forms of multiple sclerosis (MS). In September 2015, XenoPort announced results of a Phase II clinical trial of XP23829 as
ICICI Securities Ltd | Retail Equity Research Page 4
a potential treatment for moderate-to-severe chronic plaque-type psoriasis. The company also entered in to licensing agreement with Eisai for exclusive worldwide development and commercialisation rights (excluding Japan and Asia) for investigational anticancer agent E7777. A Phase II clinical study of the agent in patients with cutaneous T-cell lymphoma or peripheral T-cell lymphoma is currently underway in Japan. Preparations are simultaneously in progress for a Phase III clinical study of the agent in patients with cutaneous T-cell lymphoma in the US
Exhibit 1: Product Pipeline Compound Therapeutic Area Developments Patents Associated Current Status
DFD 09 Dermatology Successful completion of bioequivalence studies. Patent applications are filed in India. NDA Submitted
DFN 11 Migraine Successful completion of three bioequivalence studies. None. NDA Submitted
DFD 06 Psoriasis
Non clinical activities are in progress, Phase II studiescompleted and Phase III studies initiated. Registrationbatches have been made. No patents granted. Phase III
DFD 01 PsoriasisPhase III studies have been completed and U.S. NDAapplication has been filed in April 2015.
No patents granted. Patent applications are pending in certaincountries. NDA Submitted
DFD 02 MigrainePivotal bioequivalence studies were completed. Patientsafety study initiated.
Patents expiring in: US - 2026; Australia and New Zealand –2029, and South Africa - 2030. Patent applications are pendingin certain other countries. Phase III
Source: Company, ICICIdirect.com Research To strengthen its domestic portfolio, in FY16, the company has acquired selected domestic portfolio from UCB in the areas of dermatology, respiratory and paediatrics diseases. The revenues of the acquired business is ~| 150 crore in 2014. This acquisition has enhanced DRL’s presence into fast growing chronic segments.
In FY15, the company has acquired Habitrol brand, an OTC nicotine replacement therapy transdermal patch, from Novartis Consumer Health Inc as mandated under the competition laws.
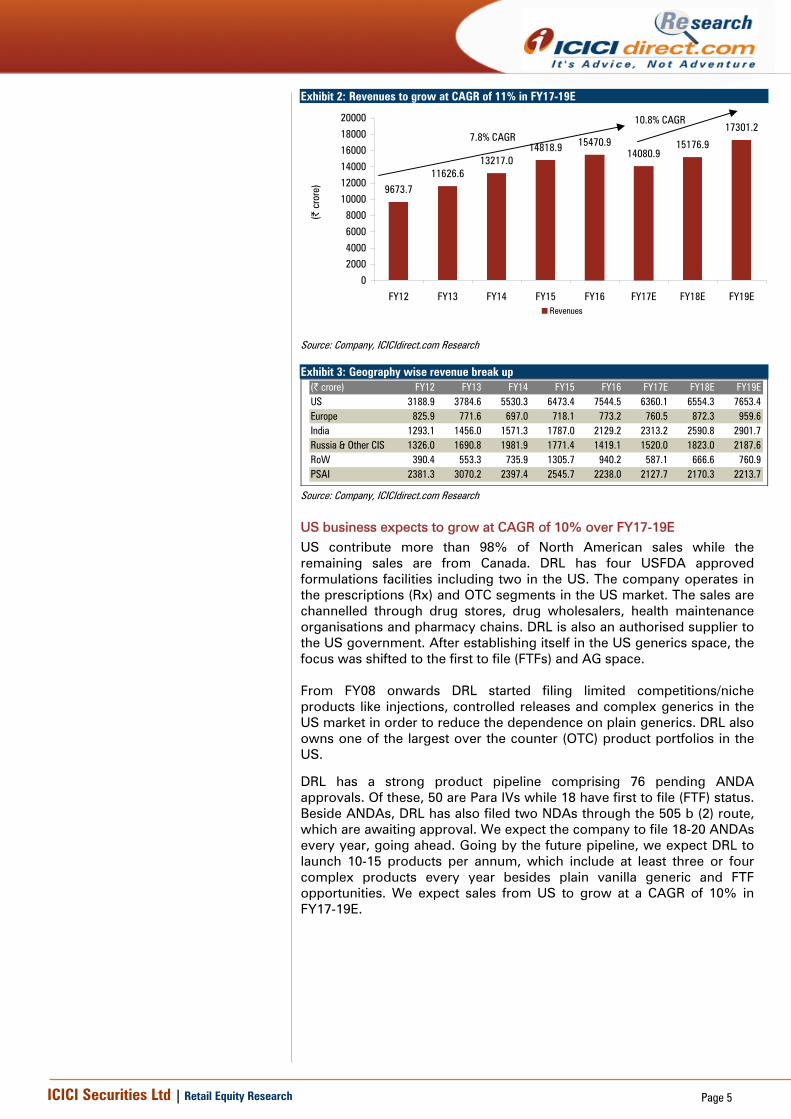
In November 2015, the company received a warning letter from the USFDA for three of its manufacturing facilities. These include two API facilities at Srikakulam, Andhra Pradesh and Miryalaguda, Telangana and one oncology formulation facility at Duvvada, Vishakhapatnam. We expect revenues to grow at a CAGR of 11% to | 17301 crore in FY17-19E. The US is likely to grow at a CAGR of 10% to | 7653 crore during the same period. We expect US revenues to normalise from H2FY18 by resolution of warning letter and incremental product launches. India is showing promising growth as well with a recalibrated approach and the recent acquisition (UCB’s India business) bodes well for the future. Russia, RoW and the PSAI segments have also shown strong growth on the back of geographical expansion, robust biological portfolio and ramp up in institutional business.
ICICI Securities Ltd | Retail Equity Research Page 5
Exhibit 2: Revenues to grow at CAGR of 11% in FY17-19E
9673.711626.6
13217.014818.9 15470.9
14080.915176.9
17301.2
0
2000
4000
6000
8000
10000
12000
14000
16000
18000
20000
FY12 FY13 FY14 FY15 FY16 FY17E FY18E FY19E
(| c
rore
)Revenues
Source: Company, ICICIdirect.com Research
Exhibit 3: Geography wise revenue break up (| crore) FY12 FY13 FY14 FY15 FY16 FY17E FY18E FY19EUS 3188.9 3784.6 5530.3 6473.4 7544.5 6360.1 6554.3 7653.4Europe 825.9 771.6 697.0 718.1 773.2 760.5 872.3 959.6India 1293.1 1456.0 1571.3 1787.0 2129.2 2313.2 2590.8 2901.7Russia & Other CIS 1326.0 1690.8 1981.9 1771.4 1419.1 1520.0 1823.0 2187.6RoW 390.4 553.3 735.9 1305.7 940.2 587.1 666.6 760.9PSAI 2381.3 3070.2 2397.4 2545.7 2238.0 2127.7 2170.3 2213.7
Source: Company, ICICIdirect.com Research
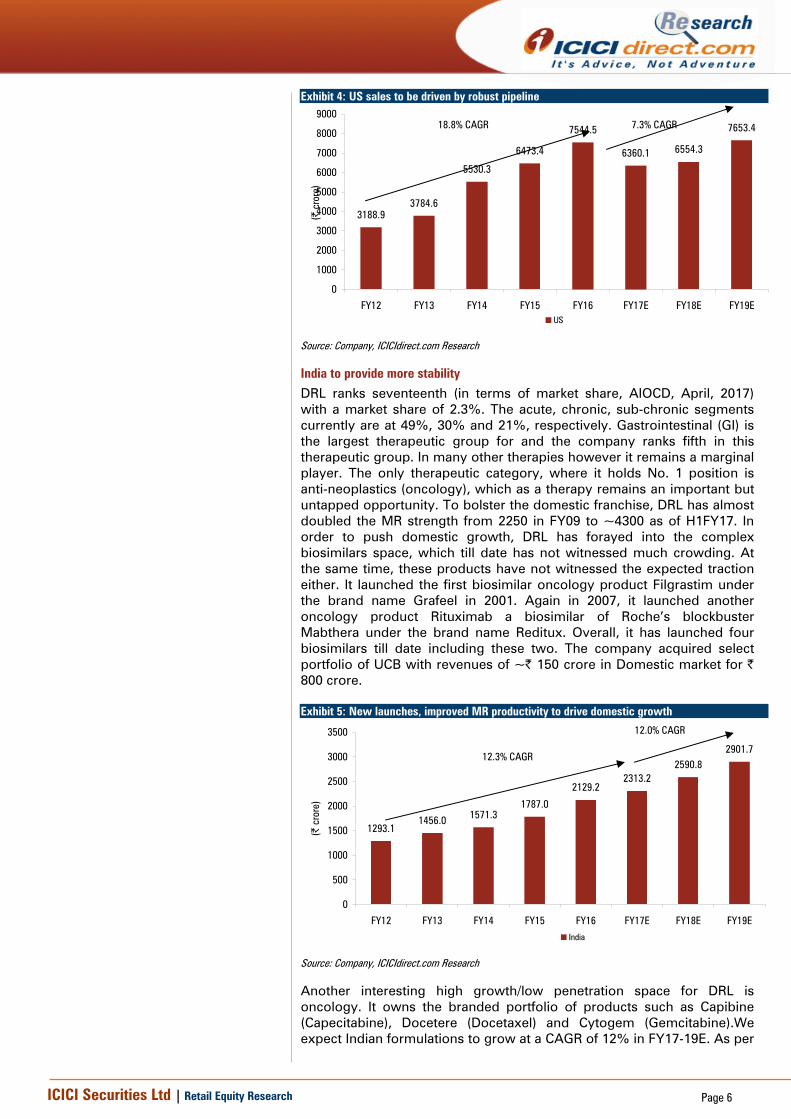
US business expects to grow at CAGR of 10% over FY17-19E US contribute more than 98% of North American sales while the remaining sales are from Canada. DRL has four USFDA approved formulations facilities including two in the US. The company operates in the prescriptions (Rx) and OTC segments in the US market. The sales are channelled through drug stores, drug wholesalers, health maintenance organisations and pharmacy chains. DRL is also an authorised supplier to the US government. After establishing itself in the US generics space, the focus was shifted to the first to file (FTFs) and AG space. From FY08 onwards DRL started filing limited competitions/niche products like injections, controlled releases and complex generics in the US market in order to reduce the dependence on plain generics. DRL also owns one of the largest over the counter (OTC) product portfolios in the US.
DRL has a strong product pipeline comprising 76 pending ANDA approvals. Of these, 50 are Para IVs while 18 have first to file (FTF) status. Beside ANDAs, DRL has also filed two NDAs through the 505 b (2) route, which are awaiting approval. We expect the company to file 18-20 ANDAs every year, going ahead. Going by the future pipeline, we expect DRL to launch 10-15 products per annum, which include at least three or four complex products every year besides plain vanilla generic and FTF opportunities. We expect sales from US to grow at a CAGR of 10% in FY17-19E.
7.8% CAGR
10.8% CAGR
ICICI Securities Ltd | Retail Equity Research Page 6
Exhibit 4: US sales to be driven by robust pipeline
3188.93784.6
5530.3
6473.4
7544.5
6360.1 6554.3
7653.4
0
1000
2000
3000
4000
5000
6000
7000
8000
9000
FY12 FY13 FY14 FY15 FY16 FY17E FY18E FY19E(|
cro
re)
US
Source: Company, ICICIdirect.com Research
India to provide more stability DRL ranks seventeenth (in terms of market share, AIOCD, April, 2017) with a market share of 2.3%. The acute, chronic, sub-chronic segments currently are at 49%, 30% and 21%, respectively. Gastrointestinal (GI) is the largest therapeutic group for and the company ranks fifth in this therapeutic group. In many other therapies however it remains a marginal player. The only therapeutic category, where it holds No. 1 position is anti-neoplastics (oncology), which as a therapy remains an important but untapped opportunity. To bolster the domestic franchise, DRL has almost doubled the MR strength from 2250 in FY09 to ~4300 as of H1FY17. In order to push domestic growth, DRL has forayed into the complex biosimilars space, which till date has not witnessed much crowding. At the same time, these products have not witnessed the expected traction either. It launched the first biosimilar oncology product Filgrastim under the brand name Grafeel in 2001. Again in 2007, it launched another oncology product Rituximab a biosimilar of Roche’s blockbuster Mabthera under the brand name Reditux. Overall, it has launched four biosimilars till date including these two. The company acquired select portfolio of UCB with revenues of ~| 150 crore in Domestic market for | 800 crore. Exhibit 5: New launches, improved MR productivity to drive domestic growth
1293.11456.0 1571.3
1787.0
2129.22313.2
2590.82901.7
0
500
1000
1500
2000
2500
3000
3500
FY12 FY13 FY14 FY15 FY16 FY17E FY18E FY19E
(| c
rore
)
India
Source: Company, ICICIdirect.com Research
Another interesting high growth/low penetration space for DRL is oncology. It owns the branded portfolio of products such as Capibine (Capecitabine), Docetere (Docetaxel) and Cytogem (Gemcitabine).We expect Indian formulations to grow at a CAGR of 12% in FY17-19E. As per
18.8% CAGR 7.3% CAGR
12.3% CAGR
12.0% CAGR
ICICI Securities Ltd | Retail Equity Research Page 7
the management, the NLEM 2011 impact is confined to just ~3-5% of domestic sales.
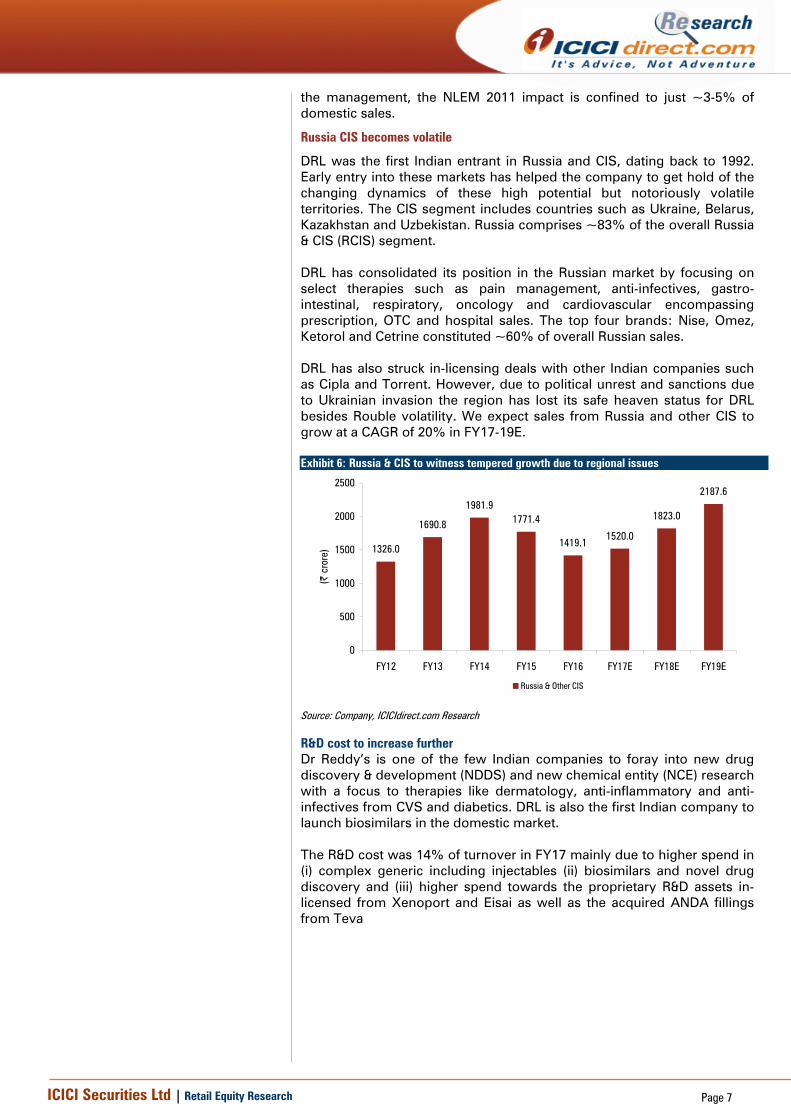
Russia CIS becomes volatile
DRL was the first Indian entrant in Russia and CIS, dating back to 1992. Early entry into these markets has helped the company to get hold of the changing dynamics of these high potential but notoriously volatile territories. The CIS segment includes countries such as Ukraine, Belarus, Kazakhstan and Uzbekistan. Russia comprises ~83% of the overall Russia & CIS (RCIS) segment. DRL has consolidated its position in the Russian market by focusing on select therapies such as pain management, anti-infectives, gastro-intestinal, respiratory, oncology and cardiovascular encompassing prescription, OTC and hospital sales. The top four brands: Nise, Omez, Ketorol and Cetrine constituted ~60% of overall Russian sales. DRL has also struck in-licensing deals with other Indian companies such as Cipla and Torrent. However, due to political unrest and sanctions due to Ukrainian invasion the region has lost its safe heaven status for DRL besides Rouble volatility. We expect sales from Russia and other CIS to grow at a CAGR of 20% in FY17-19E. Exhibit 6: Russia & CIS to witness tempered growth due to regional issues
1326.0
1690.8
1981.91771.4
1419.11520.0
1823.0
2187.6
0
500
1000
1500
2000
2500
FY12 FY13 FY14 FY15 FY16 FY17E FY18E FY19E
(| c
rore
)
Russia & Other CIS
Source: Company, ICICIdirect.com Research
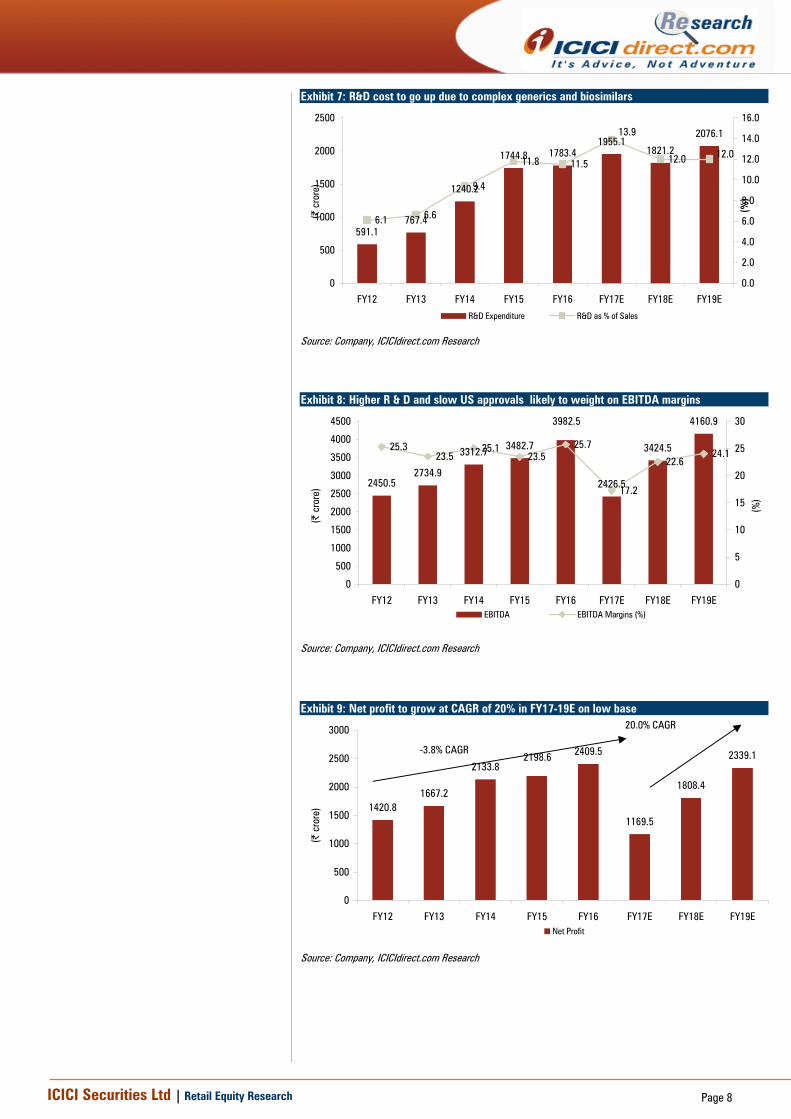
R&D cost to increase further Dr Reddy’s is one of the few Indian companies to foray into new drug discovery & development (NDDS) and new chemical entity (NCE) research with a focus to therapies like dermatology, anti-inflammatory and anti-infectives from CVS and diabetics. DRL is also the first Indian company to launch biosimilars in the domestic market. The R&D cost was 14% of turnover in FY17 mainly due to higher spend in (i) complex generic including injectables (ii) biosimilars and novel drug discovery and (iii) higher spend towards the proprietary R&D assets in-licensed from Xenoport and Eisai as well as the acquired ANDA fillings from Teva
ICICI Securities Ltd | Retail Equity Research Page 8
Exhibit 7: R&D cost to go up due to complex generics and biosimilars
591.1767.4
1240.2
1744.8 1783.41955.1
1821.2
2076.1
6.1 6.6
9.4
11.8 11.5 12.0
13.9
12.0
0
500
1000
1500
2000
2500
FY12 FY13 FY14 FY15 FY16 FY17E FY18E FY19E(|
cro
re)
0.0
2.0
4.0
6.0
8.0
10.0
12.0
14.0
16.0
(%)
R&D Expenditure R&D as % of Sales
Source: Company, ICICIdirect.com Research
Exhibit 8: Higher R & D and slow US approvals likely to weight on EBITDA margins
2450.52734.9
3312.7 3482.7
2426.5
3424.5
4160.93982.5
25.323.5
25.123.5
25.7
17.2
22.624.1
0
500
1000
1500
2000
2500
3000
3500
4000
4500
FY12 FY13 FY14 FY15 FY16 FY17E FY18E FY19E
(| c
rore
)
0
5
10
15
20
25
30
(%)
EBITDA EBITDA Margins (%)
Source: Company, ICICIdirect.com Research
Exhibit 9: Net profit to grow at CAGR of 20% in FY17-19E on low base
1420.81667.2
2133.82409.5
1169.5
1808.4
2339.12198.6
0
500
1000
1500
2000
2500
3000
FY12 FY13 FY14 FY15 FY16 FY17E FY18E FY19E
(| c
rore
)
Net Profit
Source: Company, ICICIdirect.com Research
-3.8% CAGR
20.0% CAGR
ICICI Securities Ltd | Retail Equity Research Page 9
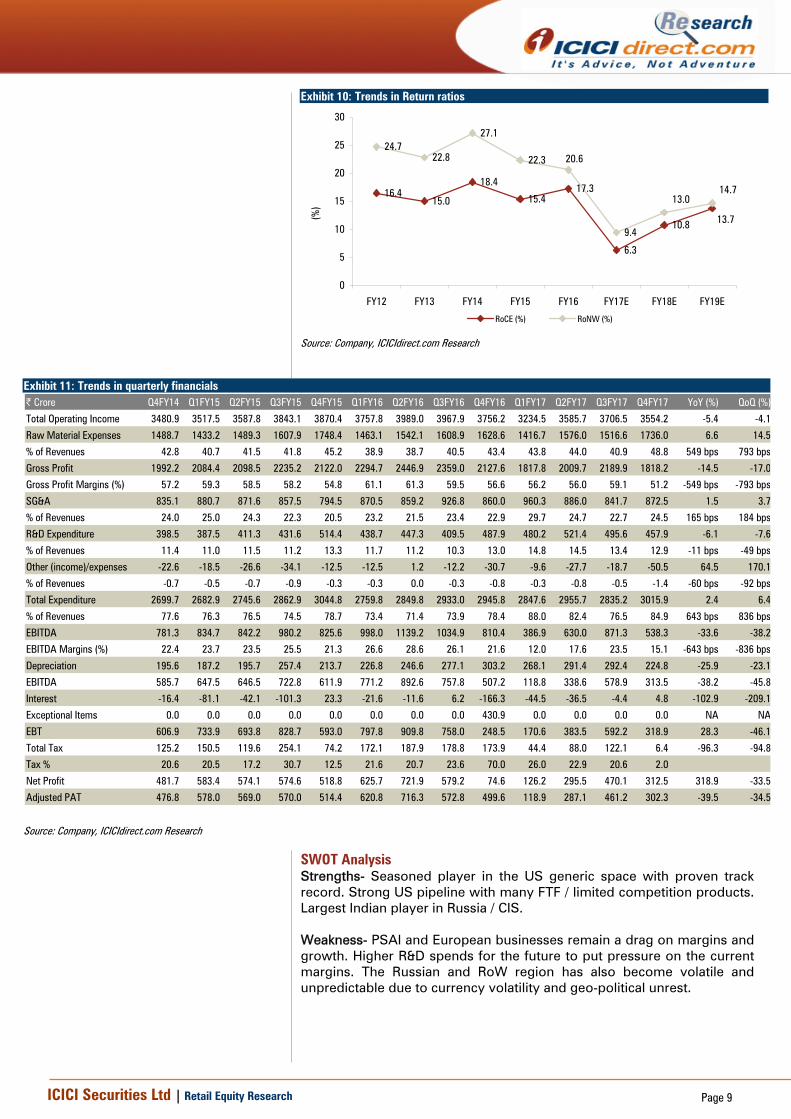
Exhibit 10: Trends in Return ratios
16.415.0
18.4
15.417.3
6.3
24.722.8
27.1
22.3
9.410.8 13.7
20.6
13.014.7
0
5
10
15
20
25
30
FY12 FY13 FY14 FY15 FY16 FY17E FY18E FY19E(%
)RoCE (%) RoNW (%)
Source: Company, ICICIdirect.com Research
Exhibit 11: Trends in quarterly financials | Crore Q4FY14 Q1FY15 Q2FY15 Q3FY15 Q4FY15 Q1FY16 Q2FY16 Q3FY16 Q4FY16 Q1FY17 Q2FY17 Q3FY17 Q4FY17 YoY (%) QoQ (%)
Total Operating Income 3480.9 3517.5 3587.8 3843.1 3870.4 3757.8 3989.0 3967.9 3756.2 3234.5 3585.7 3706.5 3554.2 -5.4 -4.1
Raw Material Expenses 1488.7 1433.2 1489.3 1607.9 1748.4 1463.1 1542.1 1608.9 1628.6 1416.7 1576.0 1516.6 1736.0 6.6 14.5
% of Revenues 42.8 40.7 41.5 41.8 45.2 38.9 38.7 40.5 43.4 43.8 44.0 40.9 48.8 549 bps 793 bps
Gross Profit 1992.2 2084.4 2098.5 2235.2 2122.0 2294.7 2446.9 2359.0 2127.6 1817.8 2009.7 2189.9 1818.2 -14.5 -17.0
Gross Profit Margins (%) 57.2 59.3 58.5 58.2 54.8 61.1 61.3 59.5 56.6 56.2 56.0 59.1 51.2 -549 bps -793 bps
SG&A 835.1 880.7 871.6 857.5 794.5 870.5 859.2 926.8 860.0 960.3 886.0 841.7 872.5 1.5 3.7
% of Revenues 24.0 25.0 24.3 22.3 20.5 23.2 21.5 23.4 22.9 29.7 24.7 22.7 24.5 165 bps 184 bps
R&D Expenditure 398.5 387.5 411.3 431.6 514.4 438.7 447.3 409.5 487.9 480.2 521.4 495.6 457.9 -6.1 -7.6
% of Revenues 11.4 11.0 11.5 11.2 13.3 11.7 11.2 10.3 13.0 14.8 14.5 13.4 12.9 -11 bps -49 bps
Other (income)/expenses -22.6 -18.5 -26.6 -34.1 -12.5 -12.5 1.2 -12.2 -30.7 -9.6 -27.7 -18.7 -50.5 64.5 170.1
% of Revenues -0.7 -0.5 -0.7 -0.9 -0.3 -0.3 0.0 -0.3 -0.8 -0.3 -0.8 -0.5 -1.4 -60 bps -92 bps
Total Expenditure 2699.7 2682.9 2745.6 2862.9 3044.8 2759.8 2849.8 2933.0 2945.8 2847.6 2955.7 2835.2 3015.9 2.4 6.4
% of Revenues 77.6 76.3 76.5 74.5 78.7 73.4 71.4 73.9 78.4 88.0 82.4 76.5 84.9 643 bps 836 bps
EBITDA 781.3 834.7 842.2 980.2 825.6 998.0 1139.2 1034.9 810.4 386.9 630.0 871.3 538.3 -33.6 -38.2
EBITDA Margins (%) 22.4 23.7 23.5 25.5 21.3 26.6 28.6 26.1 21.6 12.0 17.6 23.5 15.1 -643 bps -836 bps
Depreciation 195.6 187.2 195.7 257.4 213.7 226.8 246.6 277.1 303.2 268.1 291.4 292.4 224.8 -25.9 -23.1
EBITDA 585.7 647.5 646.5 722.8 611.9 771.2 892.6 757.8 507.2 118.8 338.6 578.9 313.5 -38.2 -45.8
Interest -16.4 -81.1 -42.1 -101.3 23.3 -21.6 -11.6 6.2 -166.3 -44.5 -36.5 -4.4 4.8 -102.9 -209.1
Exceptional Items 0.0 0.0 0.0 0.0 0.0 0.0 0.0 0.0 430.9 0.0 0.0 0.0 0.0 NA NA
EBT 606.9 733.9 693.8 828.7 593.0 797.8 909.8 758.0 248.5 170.6 383.5 592.2 318.9 28.3 -46.1
Total Tax 125.2 150.5 119.6 254.1 74.2 172.1 187.9 178.8 173.9 44.4 88.0 122.1 6.4 -96.3 -94.8
Tax % 20.6 20.5 17.2 30.7 12.5 21.6 20.7 23.6 70.0 26.0 22.9 20.6 2.0
Net Profit 481.7 583.4 574.1 574.6 518.8 625.7 721.9 579.2 74.6 126.2 295.5 470.1 312.5 318.9 -33.5
Adjusted PAT 476.8 578.0 569.0 570.0 514.4 620.8 716.3 572.8 499.6 118.9 287.1 461.2 302.3 -39.5 -34.5
Source: Company, ICICIdirect.com Research
SWOT Analysis Strengths- Seasoned player in the US generic space with proven track record. Strong US pipeline with many FTF / limited competition products. Largest Indian player in Russia / CIS. Weakness- PSAI and European businesses remain a drag on margins and growth. Higher R&D spends for the future to put pressure on the current margins. The Russian and RoW region has also become volatile and unpredictable due to currency volatility and geo-political unrest.
ICICI Securities Ltd | Retail Equity Research Page 10
Opportunities- The US Generics space with scope for complex / limited competition products. Biosimilars space across the globe. Indian franchise is still pretty small for a player of DRL’s calibre. Threats- Increased USFDA scrutiny across the globe regarding cGMP issues, pricing pressure due to client consolidation in the US, pricing probe by the Department of Justice (DoJ) in the US, proposed tightening by the new regime by adapting to the bidding process and imposition of border adjustment tax on imported drugs in the US. Currency volatility in ROW markets and Russia. Conference call Highlights
• The company currently owns 101 pending ANDA approvals (62 Para IV filings and 21 FTFs) including two NDAs
• In all 26 ANDAs filed in FY17 of which 13 ANDAs filed in Q4 FY17 • The company expects 10+ US launches in FY18 • Guided for 23-25% tax rate in FY18 • In the domestic market, the company growth of 10-12% in FY18 • The company expects gross margins to remain at ~55% (+/- 200
bps) • The Miryalaguda API facility (which was under the warning letter)
has received first USFDA approval in Q1FY18 • Foreign currency cash flow hedges for the next 12 months are
~US$235 million, largely hedged around the range of | 66.78-69.23/US$. In addition, it has balance sheet hedges of ~US$273.5 million. It also has foreign currency cash flow hedges of RUB 150 million at the rate of |1.137/RUB, maturing over next three months.
• In April 2017, the company has launched Ezetimibe Simavastatin (gVytorin), which is the first of the eight products acquired from Teva. As per IMS this product had annual brand sales of ~US$ 678 million in the US
• Sharp decline in employee cost (18% QoQ) in Q4FY17 was mainly due to decline in variable pay at the senior level.
• In FY17, the company has faced high single digit to low double digit price erosion in the US
• Over the next three to four years, the company expects positive cash-flows from its proprietary business
• The company has received Complete Response Letter (CRL) from USFDA for NuvaRing (contraceptive; largest product acquired from Teva).
• For its proprietary products Zembrace (CNS) and Sernivo spray (plaque psoriasis), the company expects to reach peak sales of US$30-US$50 million each in the next 3 years
ICICI Securities Ltd | Retail Equity Research Page 11
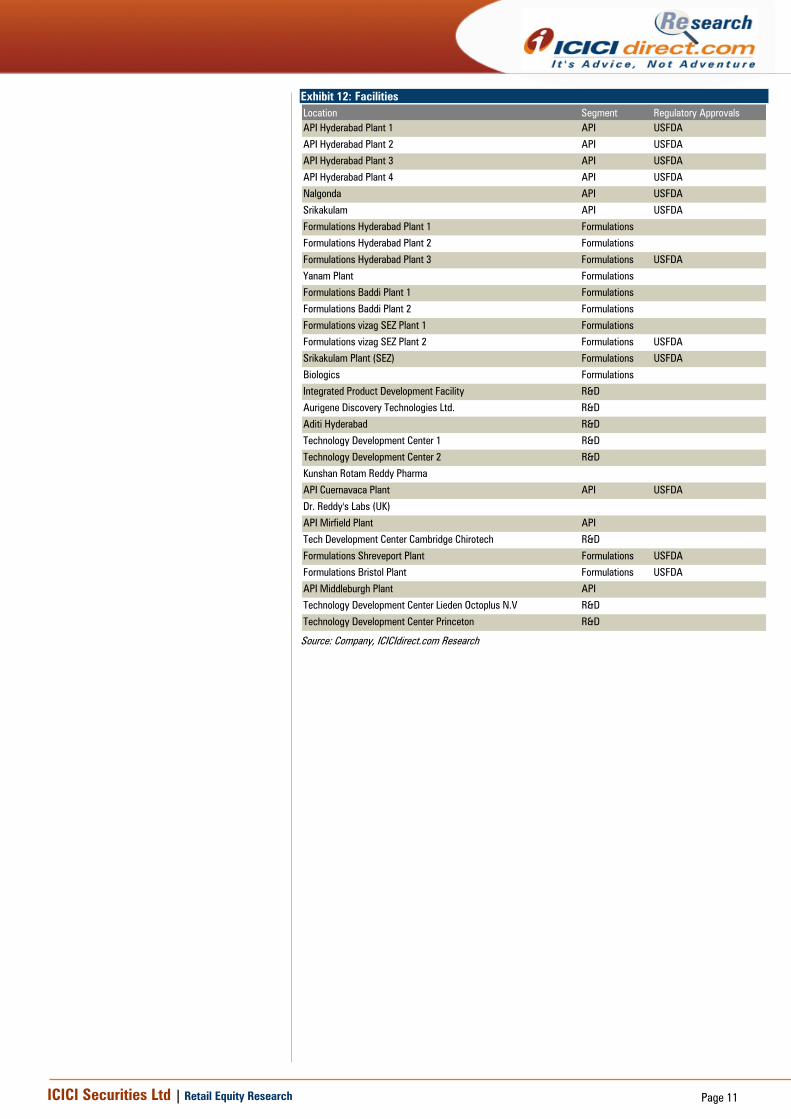
Exhibit 12: Facilities Location Segment Regulatory ApprovalsAPI Hyderabad Plant 1 API USFDA
API Hyderabad Plant 2 API USFDA
API Hyderabad Plant 3 API USFDA
API Hyderabad Plant 4 API USFDA
Nalgonda API USFDA
Srikakulam API USFDA
Formulations Hyderabad Plant 1 Formulations
Formulations Hyderabad Plant 2 Formulations
Formulations Hyderabad Plant 3 Formulations USFDA
Yanam Plant Formulations
Formulations Baddi Plant 1 Formulations
Formulations Baddi Plant 2 Formulations
Formulations vizag SEZ Plant 1 Formulations
Formulations vizag SEZ Plant 2 Formulations USFDA
Srikakulam Plant (SEZ) Formulations USFDA
Biologics Formulations
Integrated Product Development Facility R&D
Aurigene Discovery Technologies Ltd. R&D
Aditi Hyderabad R&D
Technology Development Center 1 R&D
Technology Development Center 2 R&D
Kunshan Rotam Reddy Pharma
API Cuernavaca Plant API USFDA
Dr. Reddy's Labs (UK)
API Mirfield Plant API
Tech Development Center Cambridge Chirotech R&D
Formulations Shreveport Plant Formulations USFDA
Formulations Bristol Plant Formulations USFDA
API Middleburgh Plant API
Technology Development Center Lieden Octoplus N.V R&D
Technology Development Center Princeton R&D
Source: Company, ICICIdirect.com Research
ICICI Securities Ltd | Retail Equity Research Page 12
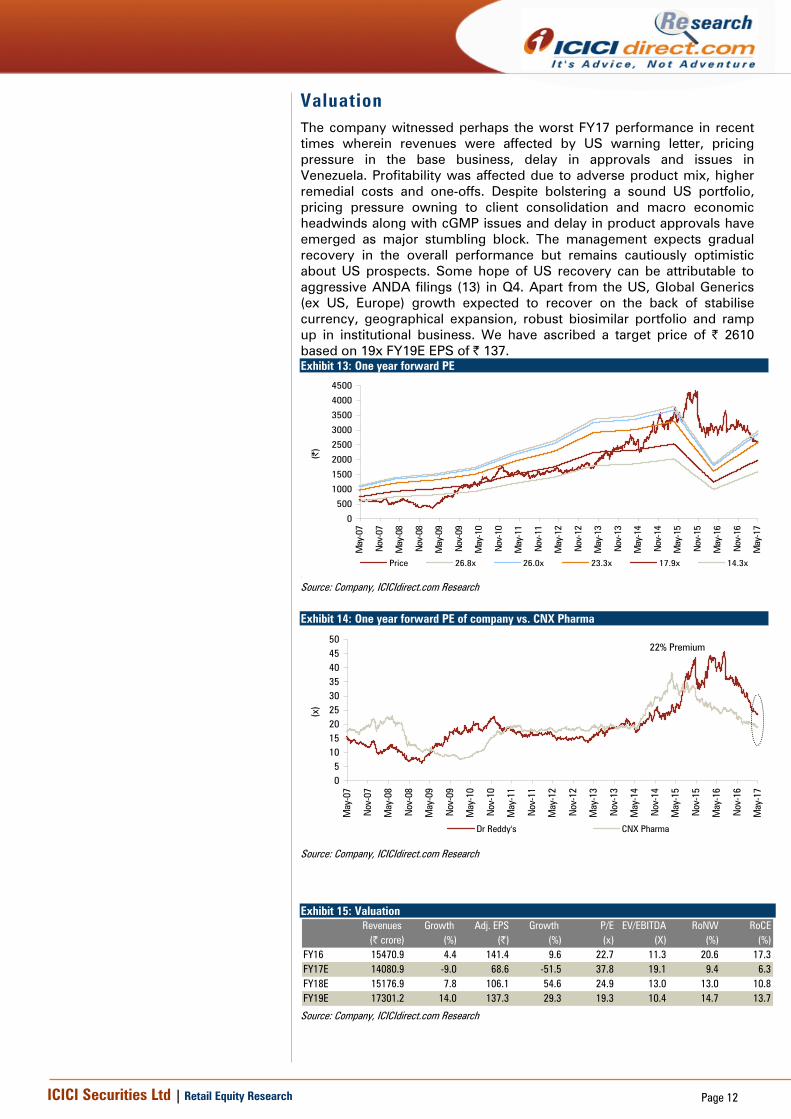
Valuation The company witnessed perhaps the worst FY17 performance in recent times wherein revenues were affected by US warning letter, pricing pressure in the base business, delay in approvals and issues in Venezuela. Profitability was affected due to adverse product mix, higher remedial costs and one-offs. Despite bolstering a sound US portfolio, pricing pressure owning to client consolidation and macro economic headwinds along with cGMP issues and delay in product approvals have emerged as major stumbling block. The management expects gradual recovery in the overall performance but remains cautiously optimistic about US prospects. Some hope of US recovery can be attributable to aggressive ANDA filings (13) in Q4. Apart from the US, Global Generics (ex US, Europe) growth expected to recover on the back of stabilise currency, geographical expansion, robust biosimilar portfolio and ramp up in institutional business. We have ascribed a target price of | 2610 based on 19x FY19E EPS of | 137. Exhibit 13: One year forward PE
0
500
1000
1500
2000
2500
3000
3500
4000
4500
May
-07
Nov
-07
May
-08
Nov
-08
May
-09
Nov
-09
May
-10
Nov
-10
May
-11
Nov
-11
May
-12
Nov
-12
May
-13
Nov
-13
May
-14
Nov
-14
May
-15
Nov
-15
May
-16
Nov
-16
May
-17
(|)
Price 26.8x 26.0x 23.3x 17.9x 14.3x [
Source: Company, ICICIdirect.com Research
Exhibit 14: One year forward PE of company vs. CNX Pharma
05
101520253035404550
May
-07
Nov
-07
May
-08
Nov
-08
May
-09
Nov
-09
May
-10
Nov
-10
May
-11
Nov
-11
May
-12
Nov
-12
May
-13
Nov
-13
May
-14
Nov
-14
May
-15
Nov
-15
May
-16
Nov
-16
May
-17
(x)
Dr Reddy's CNX Pharma
22% Premium
Source: Company, ICICIdirect.com Research
Exhibit 15: Valuation
Revenues Growth Adj. EPS Growth P/E EV/EBITDA RoNW RoCE(| crore) (%) (|) (%) (x) (X) (%) (%)
FY16 15470.9 4.4 141.4 9.6 22.7 11.3 20.6 17.3FY17E 14080.9 -9.0 68.6 -51.5 37.8 19.1 9.4 6.3FY18E 15176.9 7.8 106.1 54.6 24.9 13.0 13.0 10.8FY19E 17301.2 14.0 137.3 29.3 19.3 10.4 14.7 13.7
Source: Company, ICICIdirect.com Research
ICICI Securities Ltd | Retail Equity Research Page 13
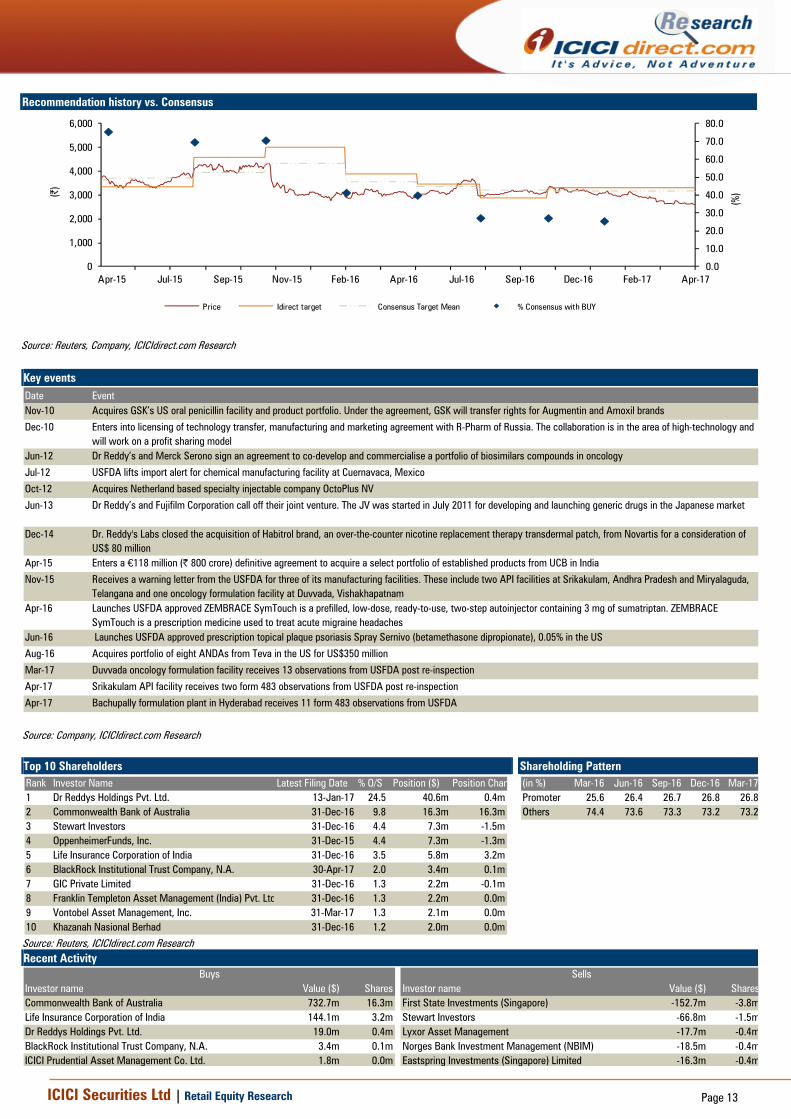
Recommendation history vs. Consensus
0.0
10.0
20.0
30.0
40.0
50.0
60.0
70.0
80.0
0
1,000
2,000
3,000
4,000
5,000
6,000
Apr-17Feb-17Dec-16Sep-16Jul-16Apr-16Feb-16Nov-15Sep-15Jul-15Apr-15
(%)(|
)
Price Idirect target Consensus Target Mean % Consensus with BUY
Source: Reuters, Company, ICICIdirect.com Research Key events Date EventNov-10 Acquires GSK’s US oral penicillin facility and product portfolio. Under the agreement, GSK will transfer rights for Augmentin and Amoxil brands
Dec-10 Enters into licensing of technology transfer, manufacturing and marketing agreement with R-Pharm of Russia. The collaboration is in the area of high-technology and will work on a profit sharing model
Jun-12 Dr Reddy’s and Merck Serono sign an agreement to co-develop and commercialise a portfolio of biosimilars compounds in oncology
Jul-12 USFDA lifts import alert for chemical manufacturing facility at Cuernavaca, Mexico
Oct-12 Acquires Netherland based specialty injectable company OctoPlus NV
Jun-13 Dr Reddy’s and Fujifilm Corporation call off their joint venture. The JV was started in July 2011 for developing and launching generic drugs in the Japanese market
Dec-14 Dr. Reddy's Labs closed the acquisition of Habitrol brand, an over-the-counter nicotine replacement therapy transdermal patch, from Novartis for a consideration of US$ 80 million
Apr-15 Enters a €118 million (| 800 crore) definitive agreement to acquire a select portfolio of established products from UCB in India
Nov-15 Receives a warning letter from the USFDA for three of its manufacturing facilities. These include two API facilities at Srikakulam, Andhra Pradesh and Miryalaguda, Telangana and one oncology formulation facility at Duvvada, Vishakhapatnam
Apr-16 Launches USFDA approved ZEMBRACE SymTouch is a prefilled, low-dose, ready-to-use, two-step autoinjector containing 3 mg of sumatriptan. ZEMBRACE SymTouch is a prescription medicine used to treat acute migraine headaches
Jun-16 Launches USFDA approved prescription topical plaque psoriasis Spray Sernivo (betamethasone dipropionate), 0.05% in the US
Aug-16 Acquires portfolio of eight ANDAs from Teva in the US for US$350 million
Mar-17 Duvvada oncology formulation facility receives 13 observations from USFDA post re-inspection
Apr-17 Srikakulam API facility receives two form 483 observations from USFDA post re-inspection
Apr-17 Bachupally formulation plant in Hyderabad receives 11 form 483 observations from USFDA
Source: Company, ICICIdirect.com Research Top 10 Shareholders Shareholding Pattern Rank Investor Name Latest Filing Date % O/S Position ($) Position Chan1 Dr Reddys Holdings Pvt. Ltd. 13-Jan-17 24.5 40.6m 0.4m2 Commonwealth Bank of Australia 31-Dec-16 9.8 16.3m 16.3m3 Stewart Investors 31-Dec-16 4.4 7.3m -1.5m4 OppenheimerFunds, Inc. 31-Dec-15 4.4 7.3m -1.3m5 Life Insurance Corporation of India 31-Dec-16 3.5 5.8m 3.2m6 BlackRock Institutional Trust Company, N.A. 30-Apr-17 2.0 3.4m 0.1m7 GIC Private Limited 31-Dec-16 1.3 2.2m -0.1m8 Franklin Templeton Asset Management (India) Pvt. Ltd 31-Dec-16 1.3 2.2m 0.0m9 Vontobel Asset Management, Inc. 31-Mar-17 1.3 2.1m 0.0m10 Khazanah Nasional Berhad 31-Dec-16 1.2 2.0m 0.0m
(in %) Mar-16 Jun-16 Sep-16 Dec-16 Mar-17Promoter 25.6 26.4 26.7 26.8 26.8Others 74.4 73.6 73.3 73.2 73.2
Source: Reuters, ICICIdirect.com Research Recent Activity
Investor name Value ($) Shares Investor name Value ($) SharesCommonwealth Bank of Australia 732.7m 16.3m First State Investments (Singapore) -152.7m -3.8mLife Insurance Corporation of India 144.1m 3.2m Stewart Investors -66.8m -1.5mDr Reddys Holdings Pvt. Ltd. 19.0m 0.4m Lyxor Asset Management -17.7m -0.4mBlackRock Institutional Trust Company, N.A. 3.4m 0.1m Norges Bank Investment Management (NBIM) -18.5m -0.4mICICI Prudential Asset Management Co. Ltd. 1.8m 0.0m Eastspring Investments (Singapore) Limited -16.3m -0.4m
Buys Sells
ICICI Securities Ltd | Retail Equity Research Page 14
.
Financial summary
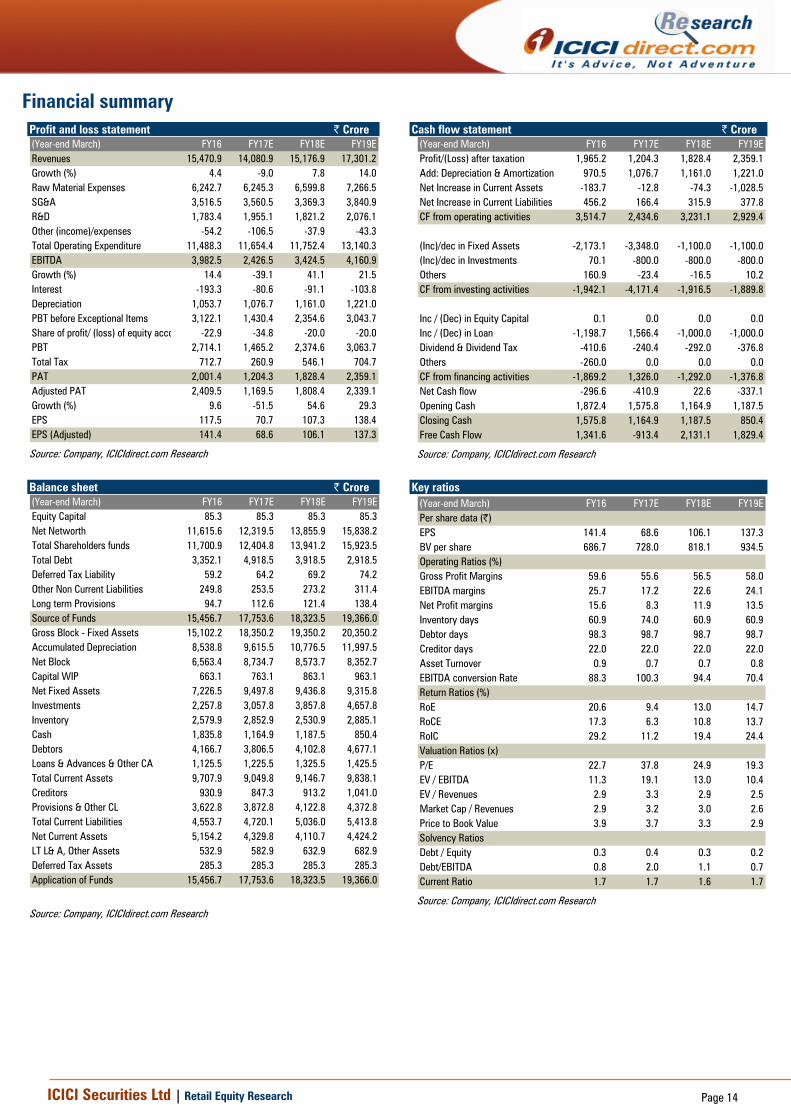
Profit and loss statement | Crore (Year-end March) FY16 FY17E FY18E FY19ERevenues 15,470.9 14,080.9 15,176.9 17,301.2Growth (%) 4.4 -9.0 7.8 14.0Raw Material Expenses 6,242.7 6,245.3 6,599.8 7,266.5SG&A 3,516.5 3,560.5 3,369.3 3,840.9R&D 1,783.4 1,955.1 1,821.2 2,076.1Other (income)/expenses -54.2 -106.5 -37.9 -43.3Total Operating Expenditure 11,488.3 11,654.4 11,752.4 13,140.3EBITDA 3,982.5 2,426.5 3,424.5 4,160.9Growth (%) 14.4 -39.1 41.1 21.5Interest -193.3 -80.6 -91.1 -103.8Depreciation 1,053.7 1,076.7 1,161.0 1,221.0PBT before Exceptional Items 3,122.1 1,430.4 2,354.6 3,043.7Share of profit/ (loss) of equity acco -22.9 -34.8 -20.0 -20.0PBT 2,714.1 1,465.2 2,374.6 3,063.7Total Tax 712.7 260.9 546.1 704.7PAT 2,001.4 1,204.3 1,828.4 2,359.1Adjusted PAT 2,409.5 1,169.5 1,808.4 2,339.1Growth (%) 9.6 -51.5 54.6 29.3EPS 117.5 70.7 107.3 138.4EPS (Adjusted) 141.4 68.6 106.1 137.3
Source: Company, ICICIdirect.com Research
Cash flow statement | Crore (Year-end March) FY16 FY17E FY18E FY19EProfit/(Loss) after taxation 1,965.2 1,204.3 1,828.4 2,359.1Add: Depreciation & Amortization 970.5 1,076.7 1,161.0 1,221.0Net Increase in Current Assets -183.7 -12.8 -74.3 -1,028.5Net Increase in Current Liabilities 456.2 166.4 315.9 377.8CF from operating activities 3,514.7 2,434.6 3,231.1 2,929.4
(Inc)/dec in Fixed Assets -2,173.1 -3,348.0 -1,100.0 -1,100.0(Inc)/dec in Investments 70.1 -800.0 -800.0 -800.0Others 160.9 -23.4 -16.5 10.2CF from investing activities -1,942.1 -4,171.4 -1,916.5 -1,889.8
Inc / (Dec) in Equity Capital 0.1 0.0 0.0 0.0Inc / (Dec) in Loan -1,198.7 1,566.4 -1,000.0 -1,000.0Dividend & Dividend Tax -410.6 -240.4 -292.0 -376.8Others -260.0 0.0 0.0 0.0CF from financing activities -1,869.2 1,326.0 -1,292.0 -1,376.8Net Cash flow -296.6 -410.9 22.6 -337.1Opening Cash 1,872.4 1,575.8 1,164.9 1,187.5Closing Cash 1,575.8 1,164.9 1,187.5 850.4Free Cash Flow 1,341.6 -913.4 2,131.1 1,829.4
Source: Company, ICICIdirect.com Research
Balance sheet | Crore (Year-end March) FY16 FY17E FY18E FY19EEquity Capital 85.3 85.3 85.3 85.3Net Networth 11,615.6 12,319.5 13,855.9 15,838.2Total Shareholders funds 11,700.9 12,404.8 13,941.2 15,923.5Total Debt 3,352.1 4,918.5 3,918.5 2,918.5Deferred Tax Liability 59.2 64.2 69.2 74.2Other Non Current Liabilities 249.8 253.5 273.2 311.4Long term Provisions 94.7 112.6 121.4 138.4Source of Funds 15,456.7 17,753.6 18,323.5 19,366.0Gross Block - Fixed Assets 15,102.2 18,350.2 19,350.2 20,350.2Accumulated Depreciation 8,538.8 9,615.5 10,776.5 11,997.5Net Block 6,563.4 8,734.7 8,573.7 8,352.7Capital WIP 663.1 763.1 863.1 963.1Net Fixed Assets 7,226.5 9,497.8 9,436.8 9,315.8Investments 2,257.8 3,057.8 3,857.8 4,657.8Inventory 2,579.9 2,852.9 2,530.9 2,885.1Cash 1,835.8 1,164.9 1,187.5 850.4Debtors 4,166.7 3,806.5 4,102.8 4,677.1Loans & Advances & Other CA 1,125.5 1,225.5 1,325.5 1,425.5Total Current Assets 9,707.9 9,049.8 9,146.7 9,838.1Creditors 930.9 847.3 913.2 1,041.0Provisions & Other CL 3,622.8 3,872.8 4,122.8 4,372.8Total Current Liabilities 4,553.7 4,720.1 5,036.0 5,413.8Net Current Assets 5,154.2 4,329.8 4,110.7 4,424.2LT L& A, Other Assets 532.9 582.9 632.9 682.9Deferred Tax Assets 285.3 285.3 285.3 285.3Application of Funds 15,456.7 17,753.6 18,323.5 19,366.0
Source: Company, ICICIdirect.com Research
Key ratios es
(Year-end March) FY16 FY17E FY18E FY19EPer share data (|)EPS 141.4 68.6 106.1 137.3BV per share 686.7 728.0 818.1 934.5Operating Ratios (%)Gross Profit Margins 59.6 55.6 56.5 58.0EBITDA margins 25.7 17.2 22.6 24.1Net Profit margins 15.6 8.3 11.9 13.5Inventory days 60.9 74.0 60.9 60.9Debtor days 98.3 98.7 98.7 98.7Creditor days 22.0 22.0 22.0 22.0Asset Turnover 0.9 0.7 0.7 0.8EBITDA conversion Rate 88.3 100.3 94.4 70.4Return Ratios (%)RoE 20.6 9.4 13.0 14.7RoCE 17.3 6.3 10.8 13.7RoIC 29.2 11.2 19.4 24.4Valuation Ratios (x)P/E 22.7 37.8 24.9 19.3EV / EBITDA 11.3 19.1 13.0 10.4EV / Revenues 2.9 3.3 2.9 2.5Market Cap / Revenues 2.9 3.2 3.0 2.6Price to Book Value 3.9 3.7 3.3 2.9Solvency RatiosDebt / Equity 0.3 0.4 0.3 0.2Debt/EBITDA 0.8 2.0 1.1 0.7Current Ratio 1.7 1.7 1.6 1.7
Source: Company, ICICIdirect.com Research
ICICI Securities Ltd | Retail Equity Research Page 15
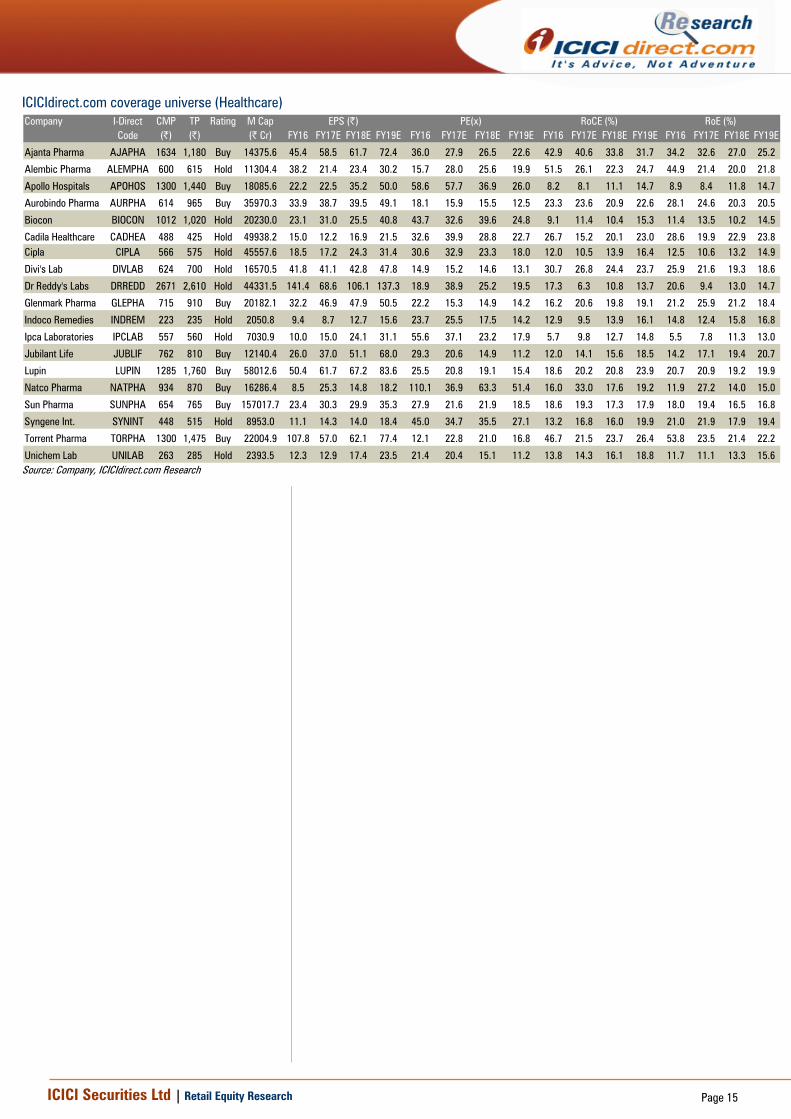
ICICIdirect.com coverage universe (Healthcare) Company I-Direct CMP TP Rating M Cap
Code (|) (|) (| Cr) FY16 FY17E FY18E FY19E FY16 FY17E FY18E FY19E FY16 FY17E FY18E FY19E FY16 FY17E FY18E FY19E
Ajanta Pharma AJAPHA 1634 1,180 Buy 14375.6 45.4 58.5 61.7 72.4 36.0 27.9 26.5 22.6 42.9 40.6 33.8 31.7 34.2 32.6 27.0 25.2
Alembic Pharma ALEMPHA 600 615 Hold 11304.4 38.2 21.4 23.4 30.2 15.7 28.0 25.6 19.9 51.5 26.1 22.3 24.7 44.9 21.4 20.0 21.8
Apollo Hospitals APOHOS 1300 1,440 Buy 18085.6 22.2 22.5 35.2 50.0 58.6 57.7 36.9 26.0 8.2 8.1 11.1 14.7 8.9 8.4 11.8 14.7
Aurobindo Pharma AURPHA 614 965 Buy 35970.3 33.9 38.7 39.5 49.1 18.1 15.9 15.5 12.5 23.3 23.6 20.9 22.6 28.1 24.6 20.3 20.5
Biocon BIOCON 1012 1,020 Hold 20230.0 23.1 31.0 25.5 40.8 43.7 32.6 39.6 24.8 9.1 11.4 10.4 15.3 11.4 13.5 10.2 14.5
Cadila Healthcare CADHEA 488 425 Hold 49938.2 15.0 12.2 16.9 21.5 32.6 39.9 28.8 22.7 26.7 15.2 20.1 23.0 28.6 19.9 22.9 23.8Cipla CIPLA 566 575 Hold 45557.6 18.5 17.2 24.3 31.4 30.6 32.9 23.3 18.0 12.0 10.5 13.9 16.4 12.5 10.6 13.2 14.9
Divi's Lab DIVLAB 624 700 Hold 16570.5 41.8 41.1 42.8 47.8 14.9 15.2 14.6 13.1 30.7 26.8 24.4 23.7 25.9 21.6 19.3 18.6
Dr Reddy's Labs DRREDD 2671 2,610 Hold 44331.5 141.4 68.6 106.1 137.3 18.9 38.9 25.2 19.5 17.3 6.3 10.8 13.7 20.6 9.4 13.0 14.7
Glenmark Pharma GLEPHA 715 910 Buy 20182.1 32.2 46.9 47.9 50.5 22.2 15.3 14.9 14.2 16.2 20.6 19.8 19.1 21.2 25.9 21.2 18.4
Indoco Remedies INDREM 223 235 Hold 2050.8 9.4 8.7 12.7 15.6 23.7 25.5 17.5 14.2 12.9 9.5 13.9 16.1 14.8 12.4 15.8 16.8
Ipca Laboratories IPCLAB 557 560 Hold 7030.9 10.0 15.0 24.1 31.1 55.6 37.1 23.2 17.9 5.7 9.8 12.7 14.8 5.5 7.8 11.3 13.0
Jubilant Life JUBLIF 762 810 Buy 12140.4 26.0 37.0 51.1 68.0 29.3 20.6 14.9 11.2 12.0 14.1 15.6 18.5 14.2 17.1 19.4 20.7
Lupin LUPIN 1285 1,760 Buy 58012.6 50.4 61.7 67.2 83.6 25.5 20.8 19.1 15.4 18.6 20.2 20.8 23.9 20.7 20.9 19.2 19.9
Natco Pharma NATPHA 934 870 Buy 16286.4 8.5 25.3 14.8 18.2 110.1 36.9 63.3 51.4 16.0 33.0 17.6 19.2 11.9 27.2 14.0 15.0
Sun Pharma SUNPHA 654 765 Buy 157017.7 23.4 30.3 29.9 35.3 27.9 21.6 21.9 18.5 18.6 19.3 17.3 17.9 18.0 19.4 16.5 16.8
Syngene Int. SYNINT 448 515 Hold 8953.0 11.1 14.3 14.0 18.4 45.0 34.7 35.5 27.1 13.2 16.8 16.0 19.9 21.0 21.9 17.9 19.4
Torrent Pharma TORPHA 1300 1,475 Buy 22004.9 107.8 57.0 62.1 77.4 12.1 22.8 21.0 16.8 46.7 21.5 23.7 26.4 53.8 23.5 21.4 22.2
Unichem Lab UNILAB 263 285 Hold 2393.5 12.3 12.9 17.4 23.5 21.4 20.4 15.1 11.2 13.8 14.3 16.1 18.8 11.7 11.1 13.3 15.6
RoE (%)EPS (|) PE(x) RoCE (%)
Source: Company, ICICIdirect.com Research
ICICI Securities Ltd | Retail Equity Research Page 16
RATING RATIONALE ICICIdirect.com endeavours to provide objective opinions and recommendations. ICICIdirect.com assigns ratings to its stocks according to their notional target price vs. current market price and then categorises them as Strong Buy, Buy, Hold and Sell. The performance horizon is two years unless specified and the notional target price is defined as the analysts' valuation for a stock. Strong Buy: >15%/20% for large caps/midcaps, respectively, with high conviction; Buy: >10%/15% for large caps/midcaps, respectively; Hold: Up to +/-10%; Sell: -10% or more;
Pankaj Pandey Head – Research [email protected]
ICICIdirect.com Research Desk, ICICI Securities Limited, 1st Floor, Akruti Trade Centre, Road No 7, MIDC, Andheri (East) Mumbai – 400 093
ICICI Securities Ltd | Retail Equity Research Page 17
ANALYST CERTIFICATION We /I, Siddhant Khandekar CA-INTER, Mitesh Shah MS (Finance) Harshal Mehta MTech (Biotechnology) Research Analysts, authors and the names subscribed to this report, hereby certify that all of the views expressed in this research report accurately reflect our views about the subject issuer(s) or securities. We also certify that no part of our compensation was, is, or will be directly or indirectly related to the specific recommendation(s) or view(s) in this report.
Terms & conditions and other disclosures: ICICI Securities Limited (ICICI Securities) is a full-service, integrated investment banking and is, inter alia, engaged in the business of stock brokering and distribution of financial products. ICICI Securities Limited is a Sebi registered Research Analyst with Sebi Registration Number – INH000000990. ICICI Securities is a wholly-owned subsidiary of ICICI Bank which is India’s largest private sector bank and has its various subsidiaries engaged in businesses of housing finance, asset management, life insurance, general insurance, venture capital fund management, etc. (“associates”), the details in respect of which are available on www.icicibank.com. ICICI Securities is one of the leading merchant bankers/ underwriters of securities and participate in virtually all securities trading markets in India. We and our associates might have investment banking and other business relationship with a significant percentage of companies covered by our Investment Research Department. ICICI Securities generally prohibits its analysts, persons reporting to analysts and their relatives from maintaining a financial interest in the securities or derivatives of any companies that the analysts cover. The information and opinions in this report have been prepared by ICICI Securities and are subject to change without any notice. The report and information contained herein is strictly confidential and meant solely for the selected recipient and may not be altered in any way, transmitted to, copied or distributed, in part or in whole, to any other person or to the media or reproduced in any form, without prior written consent of ICICI Securities. While we would endeavour to update the information herein on a reasonable basis, ICICI Securities is under no obligation to update or keep the information current. Also, there may be regulatory, compliance or other reasons that may prevent ICICI Securities from doing so. Non-rated securities indicate that rating on a particular security has been suspended temporarily and such suspension is in compliance with applicable regulations and/or ICICI Securities policies, in circumstances where ICICI Securities might be acting in an advisory capacity to this company, or in certain other circumstances. This report is based on information obtained from public sources and sources believed to be reliable, but no independent verification has been made nor is its accuracy or completeness guaranteed. This report and information herein is solely for informational purpose and shall not be used or considered as an offer document or solicitation of offer to buy or sell or subscribe for securities or other financial instruments. Though disseminated to all the customers simultaneously, not all customers may receive this report at the same time. ICICI Securities will not treat recipients as customers by virtue of their receiving this report. Nothing in this report constitutes investment, legal, accounting and tax advice or a representation that any investment or strategy is suitable or appropriate to your specific circumstances. The securities discussed and opinions expressed in this report may not be suitable for all investors, who must make their own investment decisions, based on their own investment objectives, financial positions and needs of specific recipient. This may not be taken in substitution for the exercise of independent judgment by any recipient. The recipient should independently evaluate the investment risks. The value and return on investment may vary because of changes in interest rates, foreign exchange rates or any other reason. ICICI Securities accepts no liabilities whatsoever for any loss or damage of any kind arising out of the use of this report. Past performance is not necessarily a guide to future performance. Investors are advised to see Risk Disclosure Document to understand the risks associated before investing in the securities markets. Actual results may differ materially from those set forth in projections. Forward-looking statements are not predictions and may be subject to change without notice. ICICI Securities or its associates might have managed or co-managed public offering of securities for the subject company or might have been mandated by the subject company for any other assignment in the past twelve months. ICICI Securities or its associates might have received any compensation from the companies mentioned in the report during the period preceding twelve months from the date of this report for services in respect of managing or co-managing public offerings, corporate finance, investment banking or merchant banking, brokerage services or other advisory service in a merger or specific transaction. ICICI Securities or its associates might have received any compensation for products or services other than investment banking or merchant banking or brokerage services from the companies mentioned in the report in the past twelve months. ICICI Securities encourages independence in research report preparation and strives to minimize conflict in preparation of research report. ICICI Securities or its associates or its analysts did not receive any compensation or other benefits from the companies mentioned in the report or third party in connection with preparation of the research report. Accordingly, neither ICICI Securities nor Research Analysts and their relatives have any material conflict of interest at the time of publication of this report. It is confirmed that Siddhanth Khandekar CA-INTER, Mitesh Shah MS (Finance) Harshal Mehta MTech (Biotechnology) Research Analysts of this report have not received any compensation from the companies mentioned in the report in the preceding twelve months. Compensation of our Research Analysts is not based on any specific merchant banking, investment banking or brokerage service transactions. ICICI Securities or its subsidiaries collectively or Research Analysts or their relatives do not own 1% or more of the equity securities of the Company mentioned in the report as of the last day of the month preceding the publication of the research report. Since associates of ICICI Securities are engaged in various financial service businesses, they might have financial interests or beneficial ownership in various companies including the subject company/companies mentioned in this report. It is confirmed that Siddhant Khandekar CA-INTER, Mitesh Shah MS (Finance) Harshal Mehta MTech (Biotechnology) Research Analysts do not serve as an officer, director or employee of the companies mentioned in the report. ICICI Securities may have issued other reports that are inconsistent with and reach different conclusion from the information presented in this report. Neither the Research Analysts nor ICICI Securities have been engaged in market making activity for the companies mentioned in the report. We submit that no material disciplinary action has been taken on ICICI Securities by any Regulatory Authority impacting Equity Research Analysis activities. This report is not directed or intended for distribution to, or use by, any person or entity who is a citizen or resident of or located in any locality, state, country or other jurisdiction, where such distribution, publication, availability or use would be contrary to law, regulation or which would subject ICICI Securities and affiliates to any registration or licensing requirement within such jurisdiction. The securities described herein may or may not be eligible for sale in all jurisdictions or to certain category of investors. Persons in whose possession this document may come are required to inform themselves of and to observe such restriction. report and information herein is solely for informational purpose and shall not be used or considered as an offer document or solicitation of offer to buy or sell or subscribe for securities or other financial instruments. Though disseminated to all the customers simultaneously, not all customers may receive this report at the same time. ICICI Securities will not treat recipients as customers by virtue of their receiving this report. Nothing in this report constitutes investment, legal, accounting and tax advice or a representation that any investment or strategy is suitable or appropriate to your specific circumstances. The securities discussed and opinions expressed in this report may not be suitable for all investors, who must make their own investment decisions, based on their own investment objectives, financial positions and needs of specific recipient. This may not be taken in substitution for the exercise of independent judgment by any recipient. The recipient should independently evaluate the investment risks. The value and return on investment may vary because of changes in interest rates, foreign exchange rates or any other reason. ICICI Securities accepts no liabilities whatsoever for any loss or damage of any kind arising out of the use of this report. Past performance is not necessarily a guide to future performance. Investors are advised to see Risk Disclosure Document to understand the risks associated before investing in the securities markets. Actual results may differ materially from those set forth in projections. Forward-looking statements are not predictions and may be subject to change without notice. ICICI Securities or its associates might have managed or co-managed public offering of securities for the subject company or might have been mandated by the subject company for any other assignment in the past twelve months. ICICI Securities or its associates might have received any compensation from the companies mentioned in the report during the period preceding twelve months from the date of this report for services in respect of managing or co-managing public offerings, corporate finance, investment banking or merchant banking, brokerage services or other advisory service in a merger or specific transaction. ICICI Securities or its associates might have received any compensation for products or services other than investment banking or merchant banking or brokerage services from the companies mentioned in the report in the past twelve months. ICICI Securities encourages independence in research report preparation and strives to minimize conflict in preparation of research report. ICICI Securities or its analysts did not receive any compensation or other benefits from the companies mentioned in the report or third party in connection with preparation of the research report. Accordingly, neither ICICI Securities nor Research Analysts have any material conflict of interest at the time of publication of this report. It is confirmed that Siddhant Khandekar CA-INTER Mitesh Shah MS (Finance), Harshal Mehta MTech (Biotechnology) Research Analysts of this report have not received any compensation from the companies mentioned in the report in the preceding twelve months. Compensation of our Research Analysts is not based on any specific merchant banking, investment banking or brokerage service transactions.


![Reliance Capital Limited - ICICI Directcontent.icicidirect.com/Mailimages/IM_MLD_B275.pdf · email: mohan.vellore@relianceada.com] information memorandum of private placement for](https://img.pdfslide.net/doc/110x75/5eaa30f8b27ced36813c42d2/reliance-capital-limited-icici-email-mohanvellorerelianceadacom-information.jpg)