Embed Size (px)
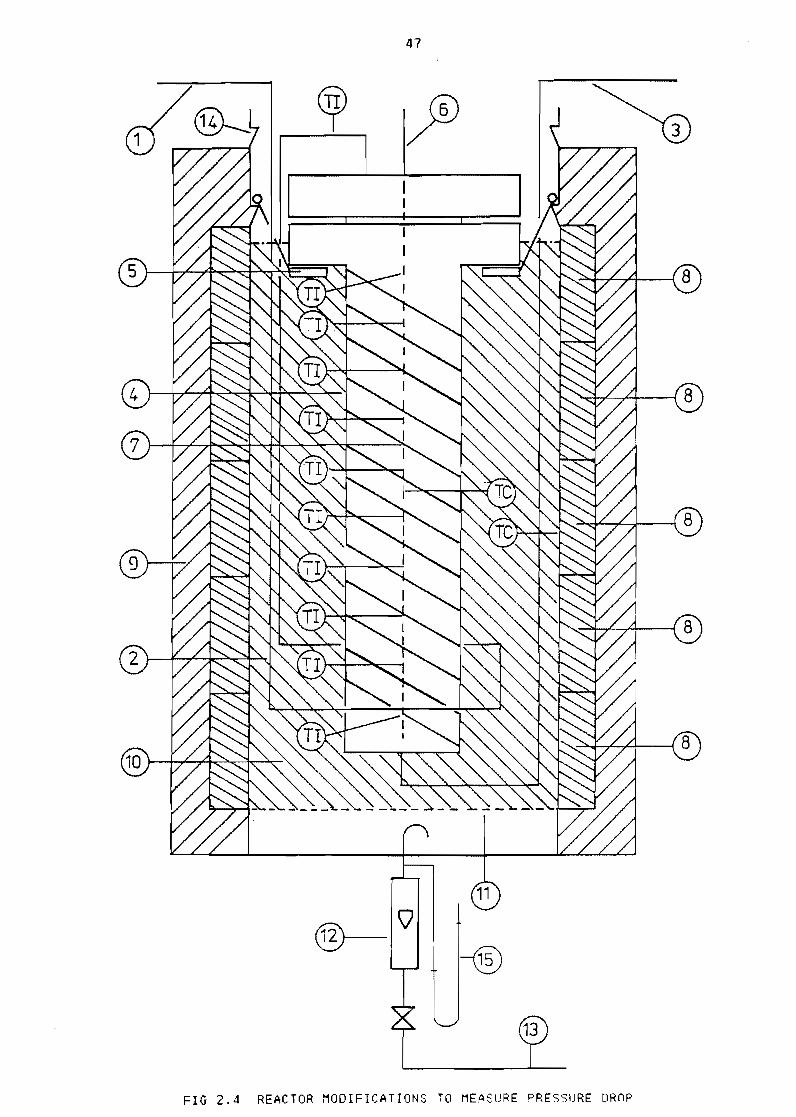
Citation preview
Unives
ity of
Cap
e Tow
n
I
THE OLIGOMERISATION OF PROPENE OVER
NICKEL OXIDE SILICA ALUMINA
BY
STEFAN MATHIAS HARMS
BSe (En3) (Cape Ton)
Submitted to the University of Caoe Town in
fulfilment of the requirements for the de3ree
Master of SCience in Englneerlng
( 1987)
The copyright of this thesis vests in the author No quotation from it or information derived from it is to be published without full acknowledgement of the source The thesis is to be used for private study or non-commercial research purposes only
Published by the University of Cape Town (UCT) in terms of the non-exclusive license granted to UCT by the author
Univers
ity of
Cap
e Tow
n
II
SYNOPSIS
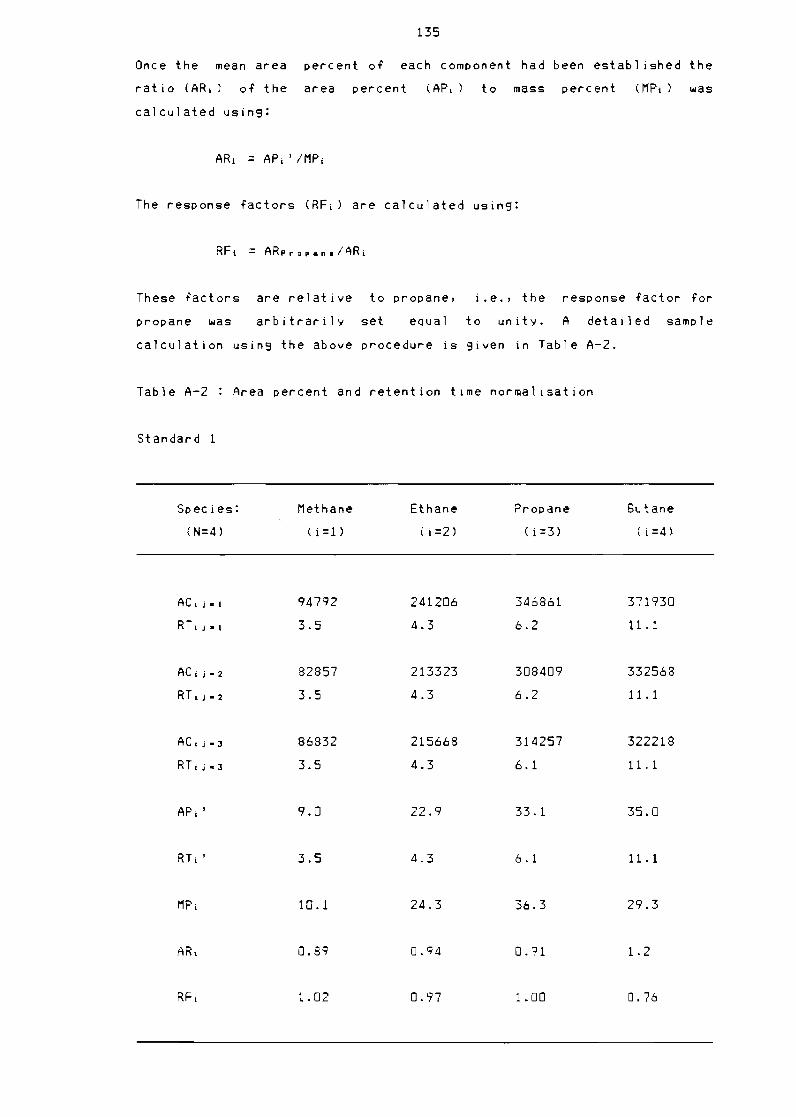
A synthesis techniQue was developed for the preparation of a nickel
oxide sil ica alumina catalyst The propene oligomerisation activity and
the selectivity of the catalysts prepared by homogeneous decomposition
deposition (HDD) were investigated and compared with nickel oxide silica
alumina catalysts prepared by the techniQues of impregnation (IMP) and
co-precipitation (SG) Amongst others the effect of the nickel content
reacti6n temperature and pressure and water content of the feed on the
activity and selectivity were investigated Also investigated were the
lifetime of the various catalysts and in the case of HDD type
catalysts the ability to 01 igomerise high molecular weight hydrocarbons
(Cb)
Nickel oxide silica alumina prepared by the HDD method is more active
for the propene 01 igomerisation than catalysts prepared by the IMP and
SG methods The product spectrum in the case of IMP and HDD type
catalysts are similar with a propene dimer (Cb) being the main product
In the case of SG type catalysts however a shift to heavier products
was observed ie propene dimer (Cb) and trimer (Cq) were formed in
eQual Quantities It is proposed that the increase in activity of HDD
type catalysts was due to a large extent of metal dispersion and
distribution and a stronger interaction between the metal and the
support It is also proposed that the metal is readily accessible to the
reactant molecules
The activity and selectivity of catalysts prepared by the HDD method
were independent of the nickel content This was not the case for IMP
and SG type catalysts both of which showed decreasing activity with
increasing nickel content when the nicke1 content was increased beyond 5
wtX
The lifetimes of the various catalysts were also examined From the
results obtained over the first 10 h the lifetime of HOD type
catalysts was superior to that of the other catalysts studied The
activity and selectivity of the various catalysts were sensitive to the
reaction conditions Thus moving into the vapour phase by either
increasing the temperature at a fixed pressure or decreasing the
pressure at a fixed temperature was in each case acCompanied by a shift
to heavier products and a decrease in activity
I
THE OLIGOMERISATION OF PROPENE OVER
NICKEL OXIDE SILICA ALUMINA
BY
STEFAN MATHIAS HARMS
BSc (Eng) (Cape Town)
Submitted to the University of Gape Town in
fulfilment of the requirements For the de3ree
Master of SCIence in Engneerlng
( 1987)
II
SYNOPSIS
A synthesis technique was developed tor the preparation Ot a nickel
oxide silica alumina catalyst The propene oligomerisation activity and
the selectivity Ot the catalysts prepared by homogeneous decomposition
deposition (HOD) were investigated and compared with nickel oxide sil ica
alumina catalysts prepared by the techniques ot impregnation (IMP) and
co-precipitation (SG) Amongst others the ettect Ot the nickel content
reaction temperature and pressure and water content ot the teed on the
activity and selectivity were investigated Also investigated were the
1 ifetime Ot the various catalysts and in the case ot HOD type
catalysts the ability to 01 igomerise high molecular weight hydrocarbons
(Cb ) bull
Nickel oxide silica alumina prepared by the HOD method is more active
for the propene 01 igomerisation than catalysts prepared by the IMP and
SG methods The product spectrum in the case ot IMP and HOD type
catalysts are similar with a propene dimer (C~) being the main product
In the case Ot SG type catalysts however a shift to heavier products
was observed i e propene dimer (C6) and trimer (C~) were formed in
equal Quantities It 19 proposed that the increase in activity Ot HOD
type catalysts was due to a large extent of metal dispersion and
distribution and a stronger interaction between the metal and the
support It is also proposed that the metal is readily accessible to the
reactant molecules
The activity and selectivity of catalysts prepared by the HOD method
were independent of the nickel content This was not the case tor IMP
and SG type catalysts both of which showed decreasing activity with
increasing nickel content when the nickel content was increased beyond 5
wt
The 1itetimes ot the various ctalysts were also examined From the
results obtained over the first 10 h the 1 itetime egtf HOD tlpe
catalysts was superior to that ot the other catalysts studied The
activity and selectvity of the varIous catalysts were senSlt ive to the
reaction Conditions Thus moving into the vapour phase by either
increasln9 the temperature at a fi_ed press~re 0r decreasing the
pressure at a fixed temperature was In each case accompanied by a shif~
to heavier products and a decrease in actvity
III
The catalysts studied were very sensitive to the feed moisture content
The introduction of an undried feed resulted in a hi9h initial activity
followed by rapid deactivation IMP and HOD type catalysts after bein9
exposed to a wet feed were shown to be able to resain their normal
activity and selectivity after calcination
IV
AC KNOWLEDGEtlErHS
I would 1 Ike to express my sincere appreciatIon to Dr H KOJima and
Prof CT OConnor for their assistance and gUidance throughout the
duration of my study
Many thanks to Messrs D McClean L Jacobs) PM DIckens K Moller and
SSchwarz) for their friendshiP and helpful advice over the years
The following people and institullons are also gratefully acknowledged
SASOL and the Council for SIfrtific arid Industrial Research for
financial assistance
All on the ChemIcal Engineering Department stafF
Dr K Herzog for his assistance with the TG-OTA anAlysis
Miss 8 Williams for lhe mass spe(trosCopiC analmiddotSIS
Dr M Rautenbach for the use of his compuier pro9ramn
A speCial thanks to Alexandra For her help and patience
I would also like tegt thank my frmiddotgtther In3-br3 tor het cord Inou
support and patience
TABLE OF CONTENT
PAGE
SYNOPSIS II
ACKNOIIILEDGEMENTS IV
TABLE OF CONTENTS v
LI ST OF FIGURES x
LIST OF TABLES XVI
1 INTRODUCTION
11 Heterogeneous catalysis 2
12 Polymerisation using heterogeneous catalysts 3
121 Kinetics of the overall process 3
122 Polymerisation 6
1221 True polymerisation 6
1222 Conjunct polymerisation 9
123 Polymerisation on si 1 ica alumina 10
1231 Nature of active sites on sil ica alumina 10
1232 Structure of the products and proposed mechanism
on sll ica alumina 10
124 Polymer1sation on nickel OXide sll ica alumIna 12
1241 Nature of active sItes on nickel OXide sil ica alumina 12
1242 Structure of the products on nickel oxide 511 iea
alumina 13
1 25 Thermodnamics 15
13 Catalyst characterisation
131 Introduction 13
132 Catalyst syntheSIS methods 19
1321 Preparation with adsorption 19
VI
1322
1323
1324
133
1331
1332
1 34
14
1 41
1411
1412
1413
142
1421
1422
1423
1424
15
1 51
1511
1512
1513
1514
1515
152
1521
1522
1523
1524
1525
1526
1527
1528
152Q
16
17
Dryin9 of adsorbent sol ids
Preparation without adsorption
Dryin9 of non-adsorbed sol ids
Hom0geneous decomposition deposition
Theory of hom0geneous decomposition deposition
Nickel oxide silica alumina preparation usin9 a
hom0geneous solution
Co-precipitation
Physical characterisatlcs of the catalyst
Properties of sil ica alumina
Sur face area
Pore structure
Surface aCidity
Properties of nickel oxide on si1 ica alumina
Total surface area
Metal surface area and crystal size
Pore volume and size distribution
Metal support interaction
Catalyst po1ymerisation properties
Si1 ica alumina properties
Effect of Silica to alumina ratio
Effect of reaction temperature
Effect of space velocity
Product spectrum
Effect of activation
Nickel oxide si1 iea alumina properties
Effect of synthesis procedure
Effect of metal content
Effect of reaction temperature anJ pressure
Effect of feed compOSition and space velOCity
Effect of feed impurities
Effect of activation procedure
Effect of regeneration
Product spectrum
Lifeiime
ConclUSIon
Objective 0f research
PAGE
21
21
22
23
23
24
25
26
26
26
26
28
28
28
29
30
31
32
32
32
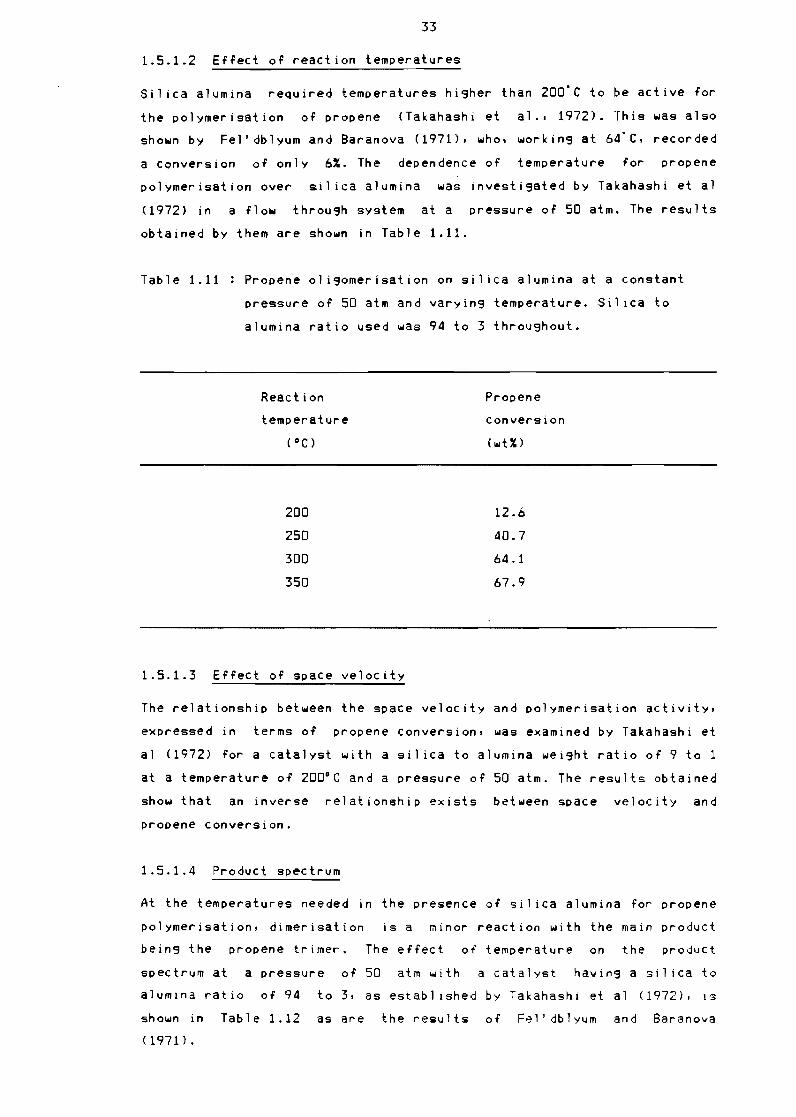
33
33
33
34
34
34
35
35
35
36
37 7-
37
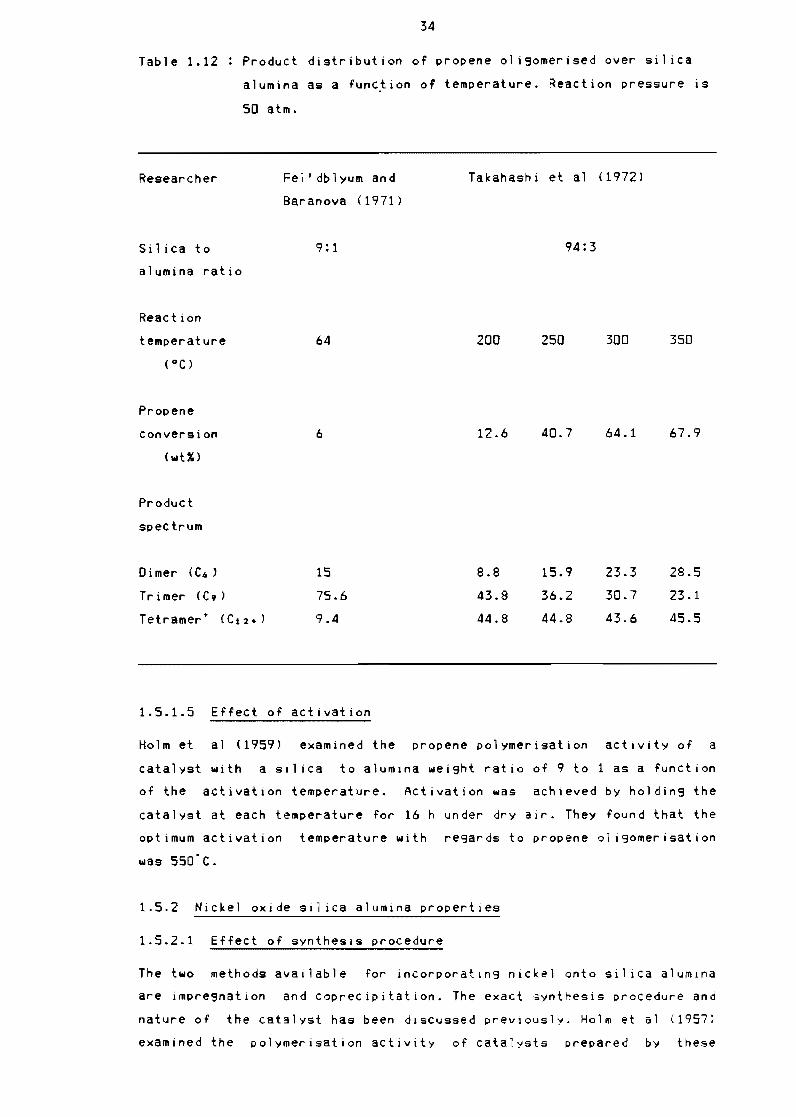
38
VI
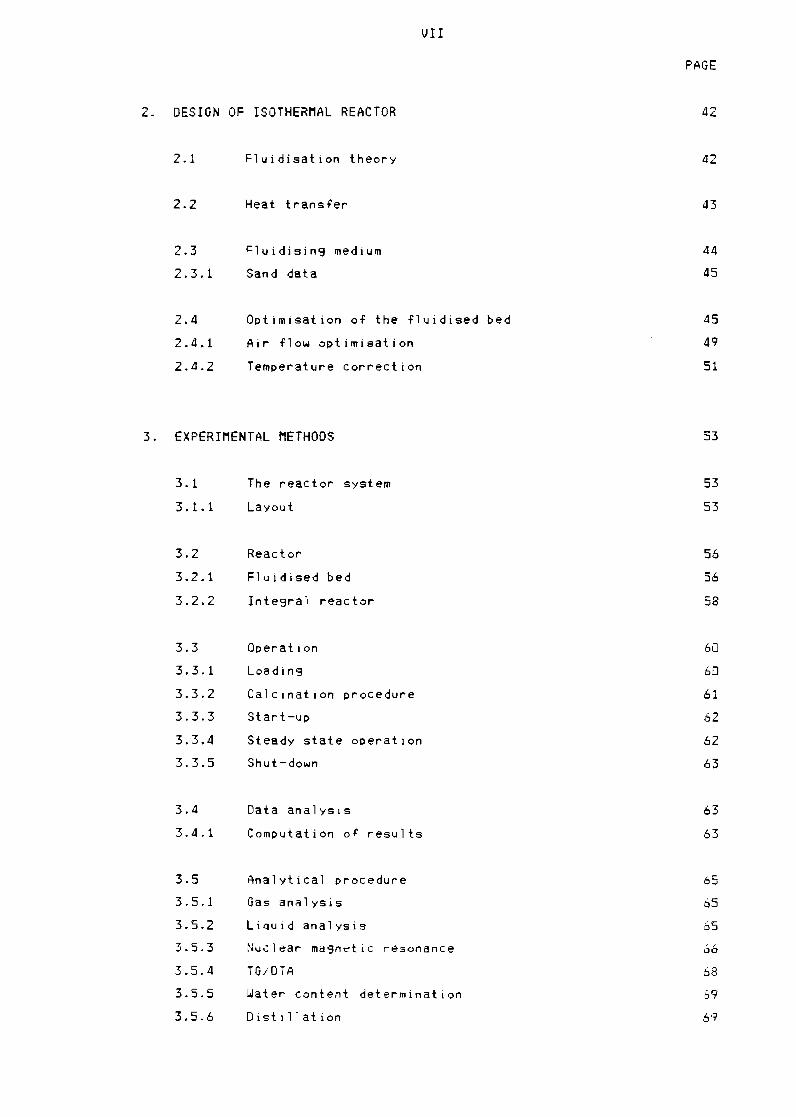
2 DESIGN OF ISOTHERMAL REACTOR
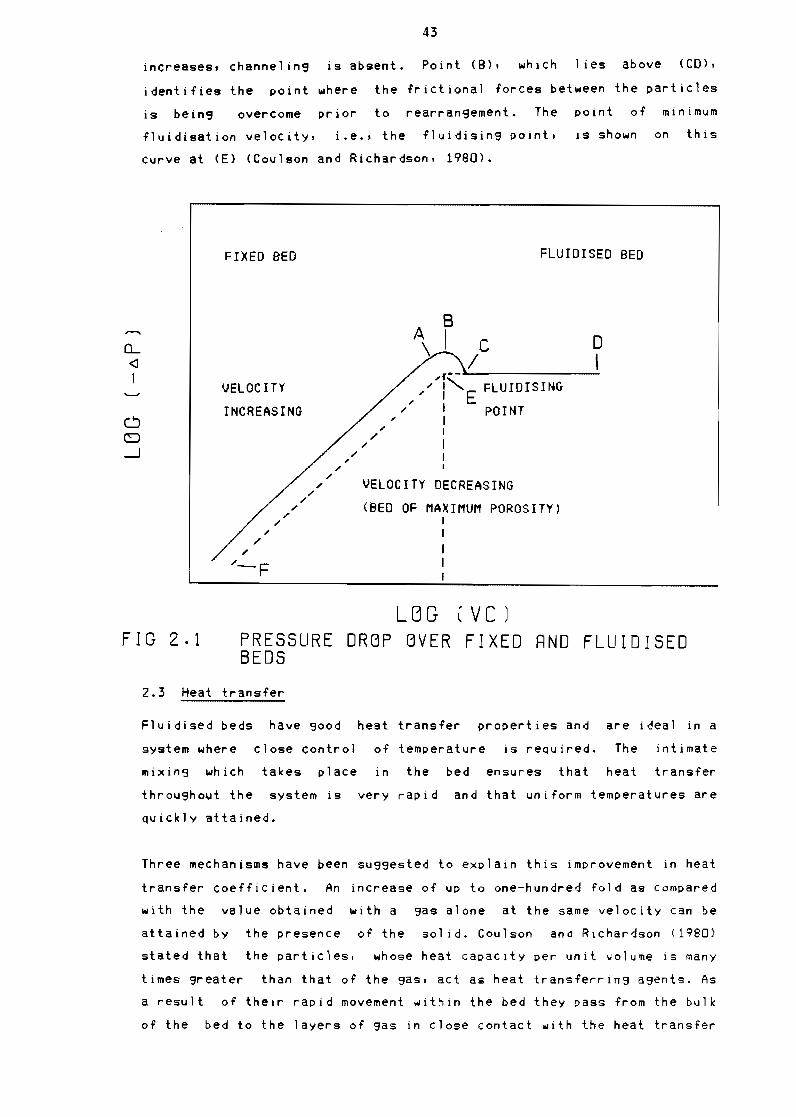
21 Fluidisation theory
22 Heat transfer
Fluidising medium23
231 Sand data
24 Optimisation of the fluidised bed
241 Air flow optimisation
242 Temperature correction
3 EXPERIMENTAL METHODS
31 The reactor system
311 Layout
32 Reactor
321 Fluidised bed
322 Integra1 reactor
33 Operation
331 Loading
332 Calcination procedure
333 Start-up
334 Steady state operation
335 Shut-down
34 Data analysIs
341 Computation of results
35 Analytical procedure
351 Gas analysis
352 UqU i d analysis
353 Nuclear masnetic resonance
354 TGDTA
355 Water content determination
356 o i st ill at ion
PAGE
42
42
43
44
45
45
49
51
53
53
53
56
56
58
60
60
61
62
62
63
63
63
65
65
65
tS6
68
69
69
VIII
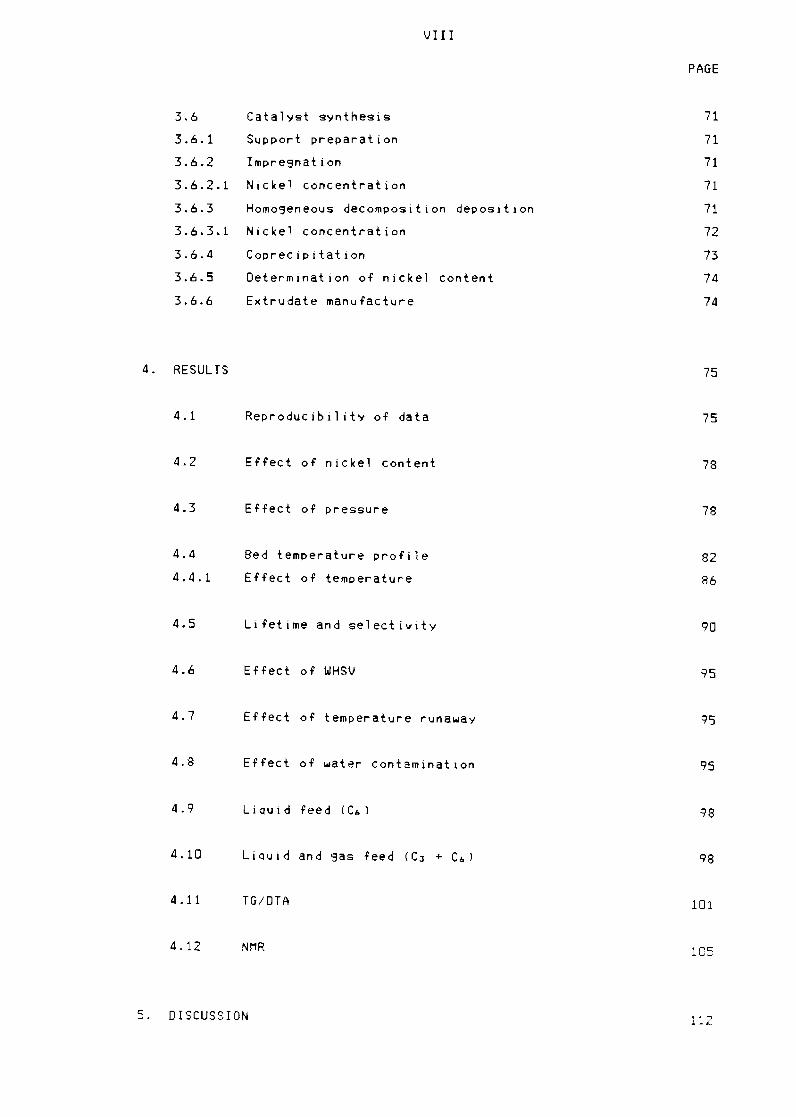
36 Catalyst synthesis
361 Support preparation
362 Impre9nation
3621 Nickel concentration
363 Hom0geneous decomposition depositlon
3631 Nickel concentration
364 Coprecipitation
365 Determination of nickel content
366 Extrudate manufacture
4 RESULTS
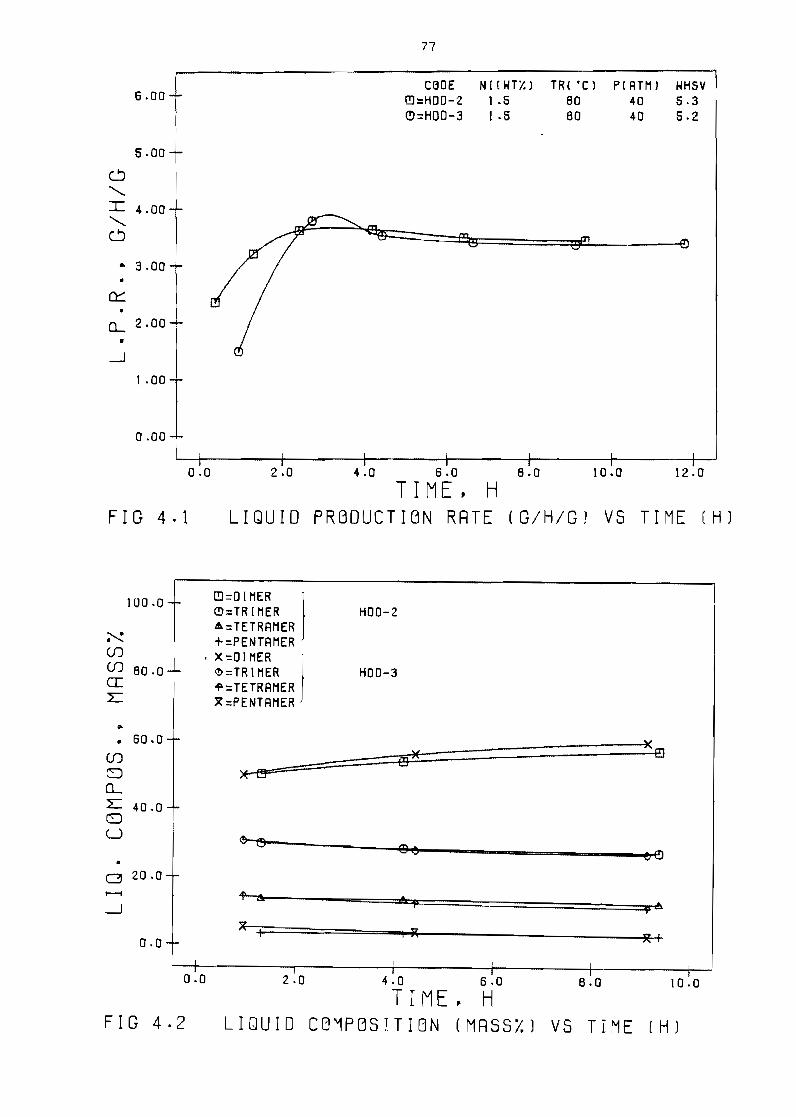
41 Reproducibility of data
42 Effect of nickel content
43 Effect of pressure
44 Bed temperature profile
441 Effect of temperature
45 Lifetime and selectivity
46 Effect of WHSV
47 Effect of temperature runaway
48 Effect of water contaminatlon
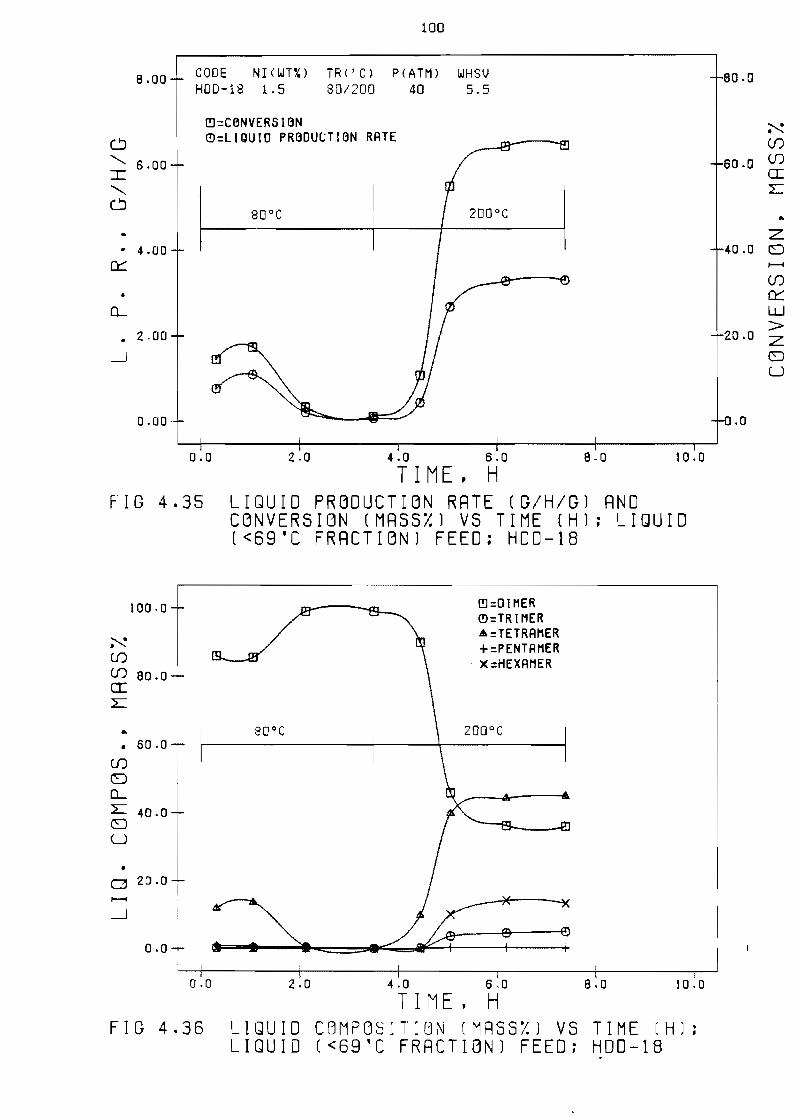
49 liquid feed (Cit )
410 liquid and gas feed (Cl + Cit)
411 TGDTA
412 NMR
PAGE
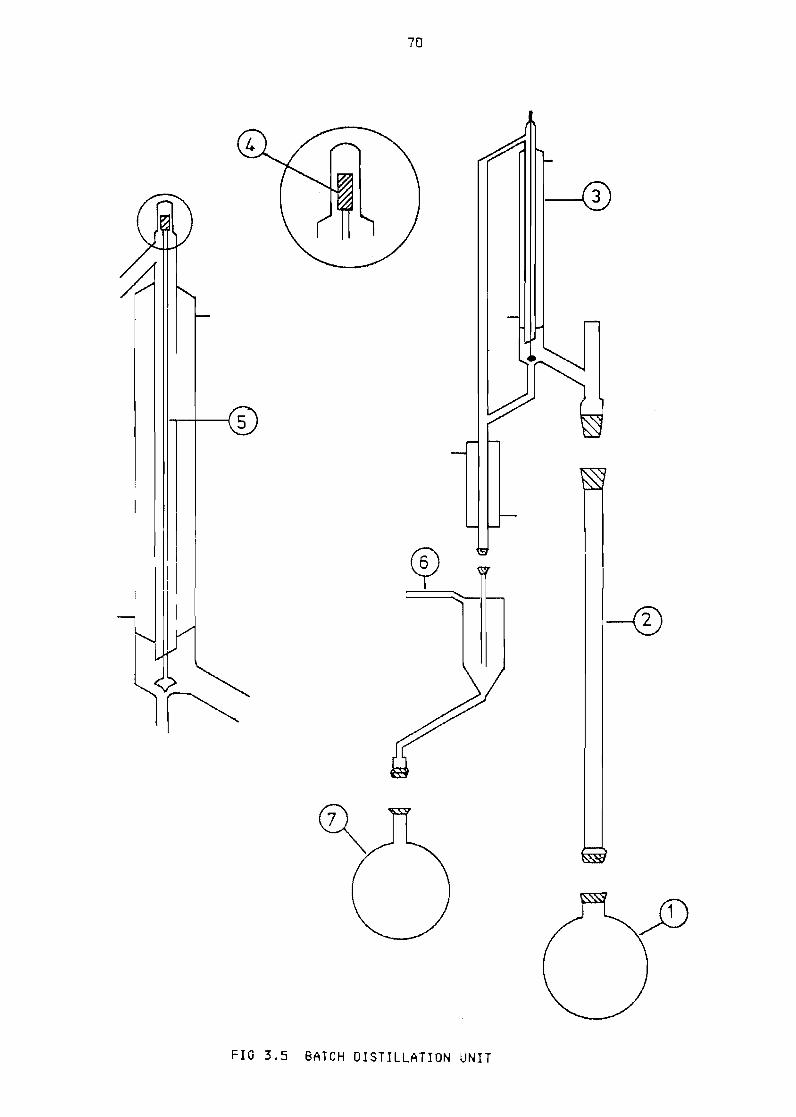
71
71
71
71
71
72
73
74
74
7S
75
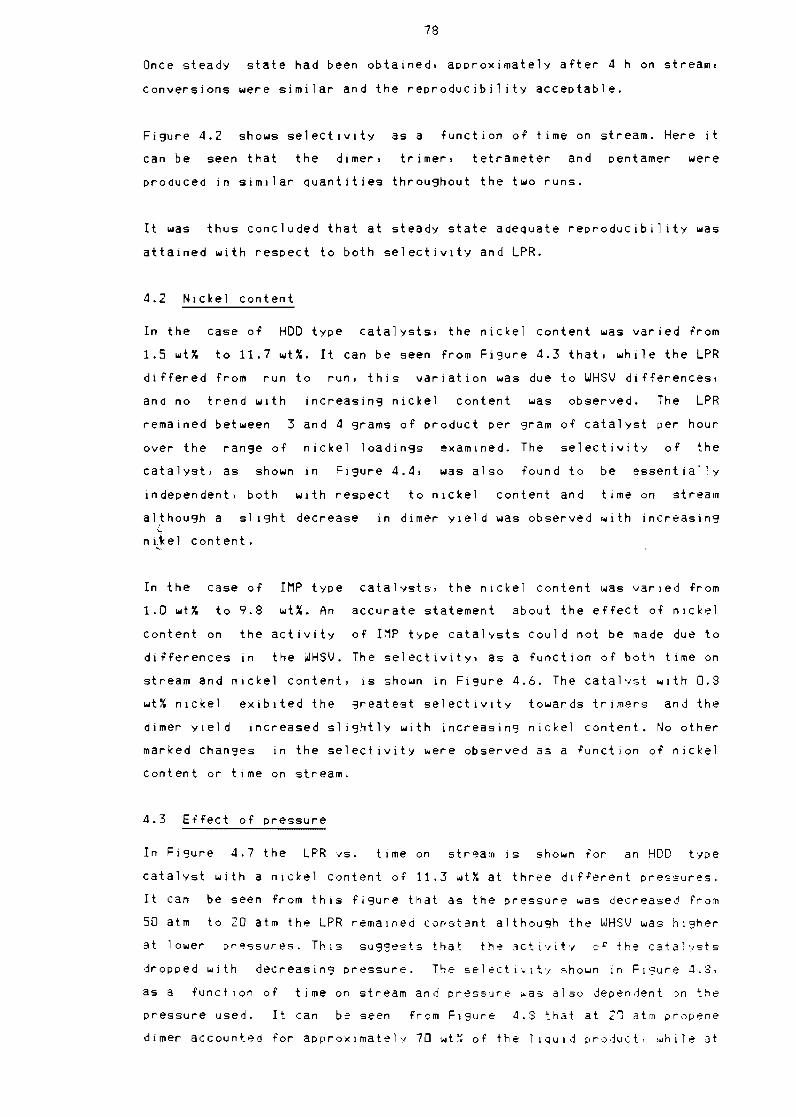
78
7S
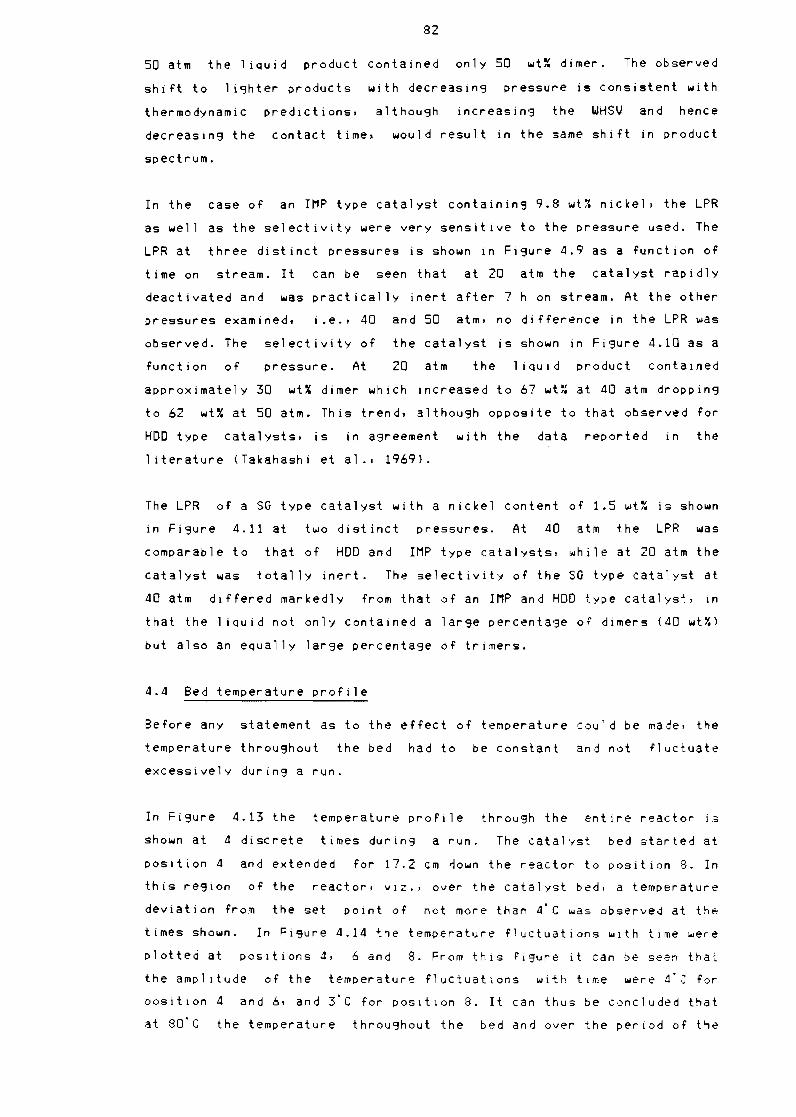
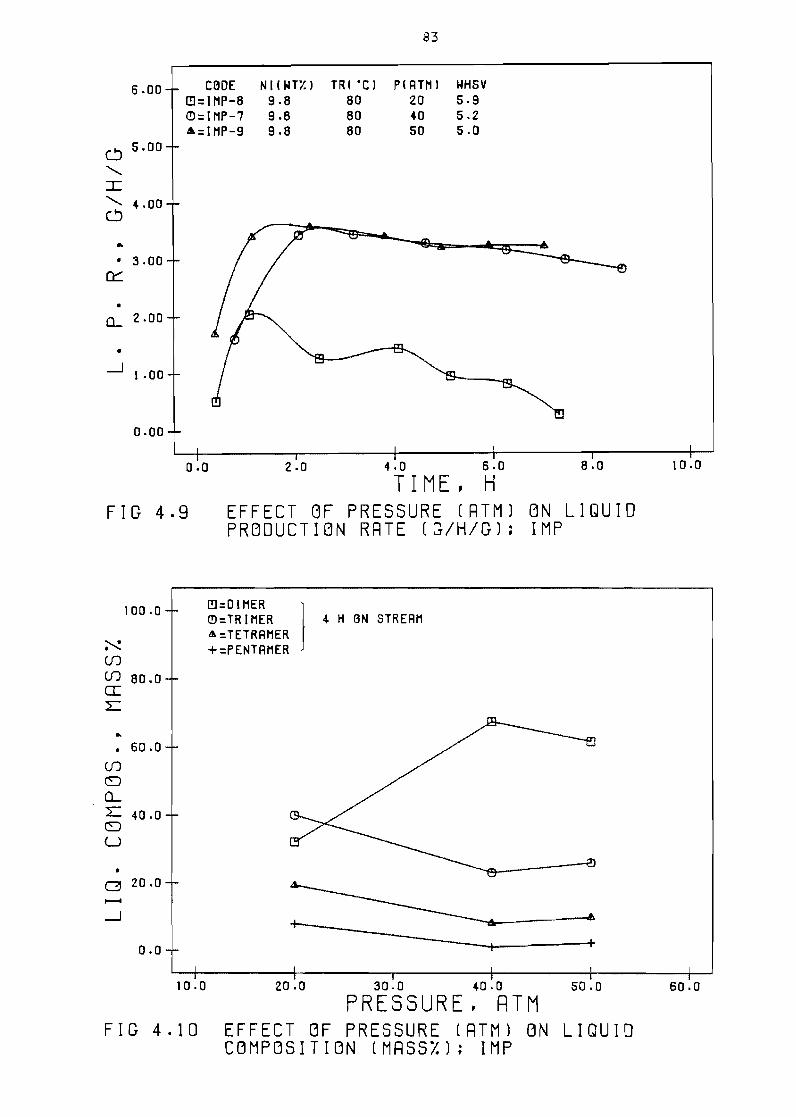
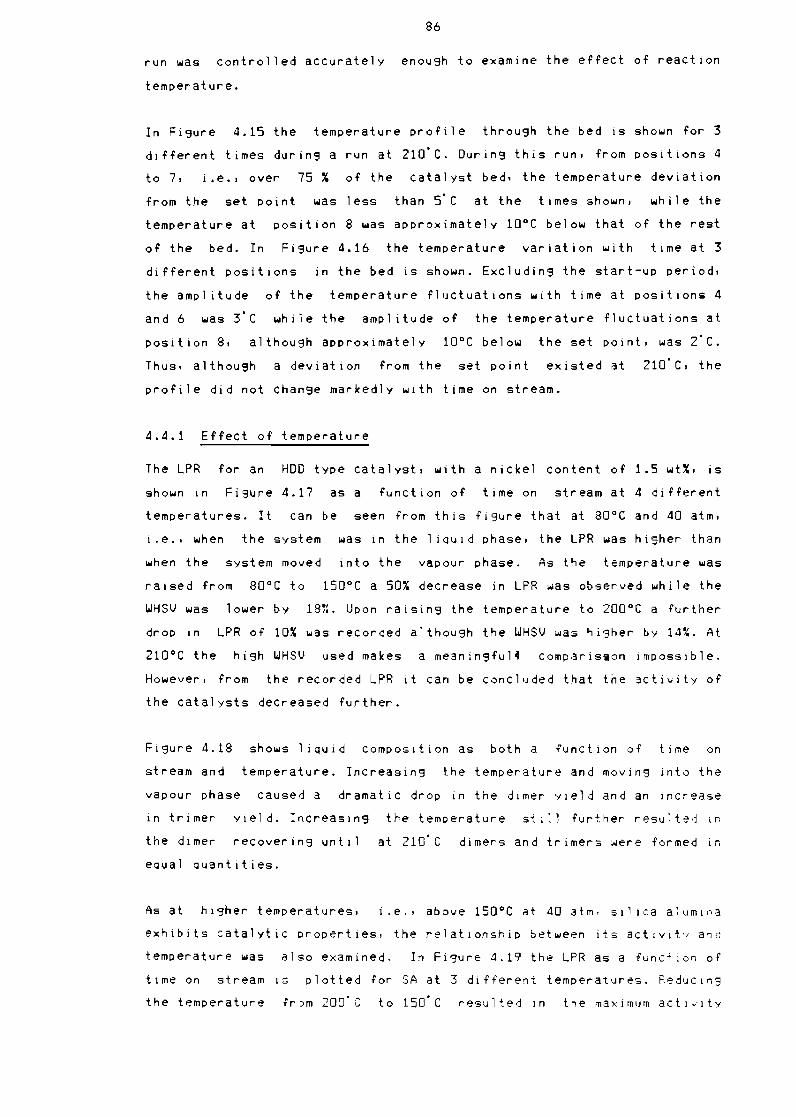
82
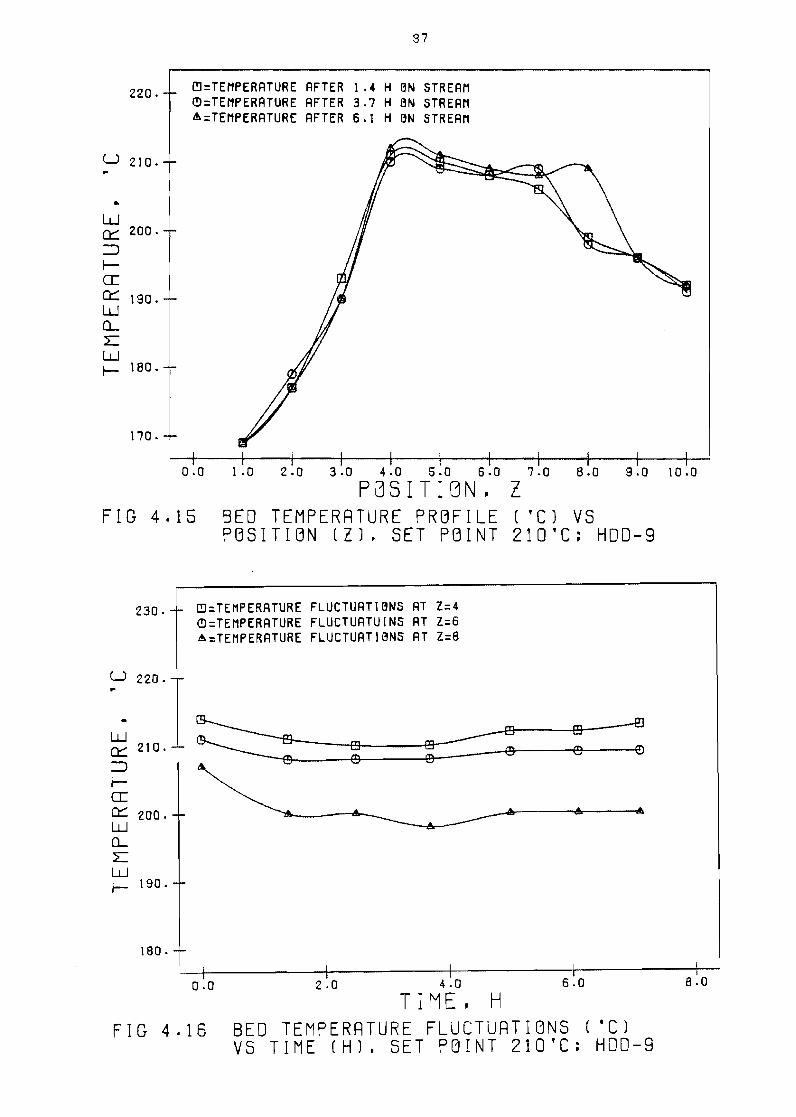
86
90
95
95
95
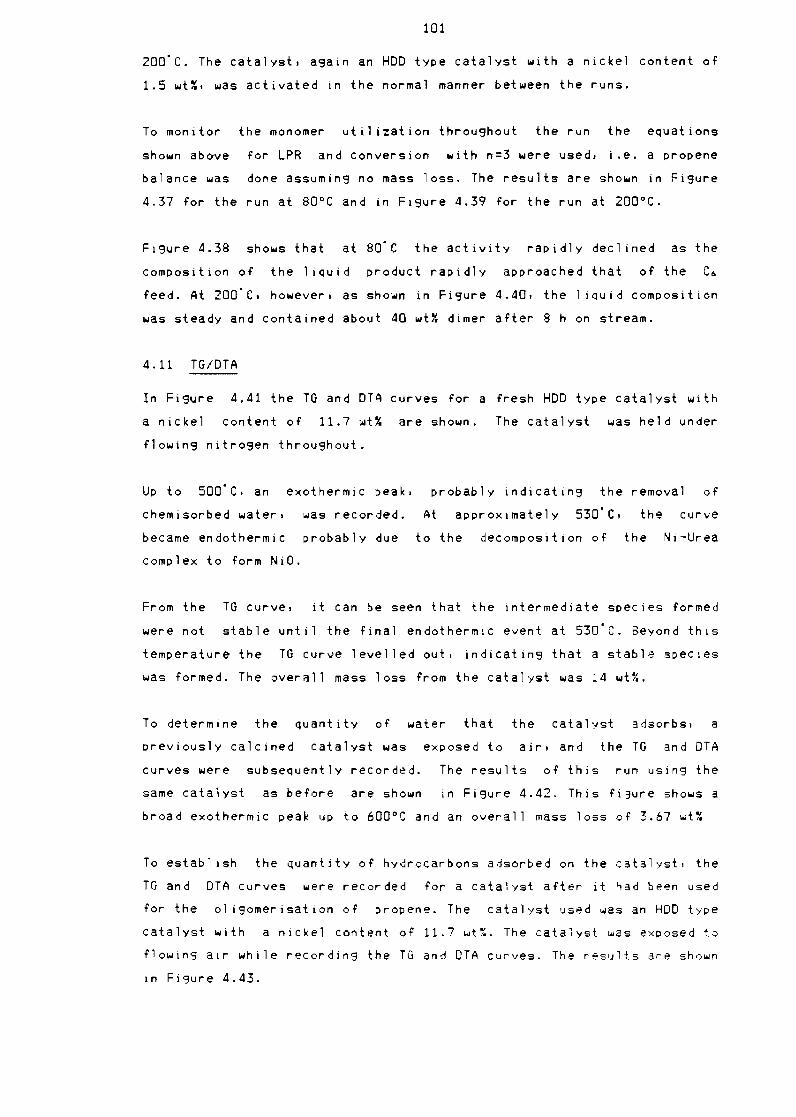
98
98
101
5 DISCUSSION
105
112
129
133
IX
PAGE
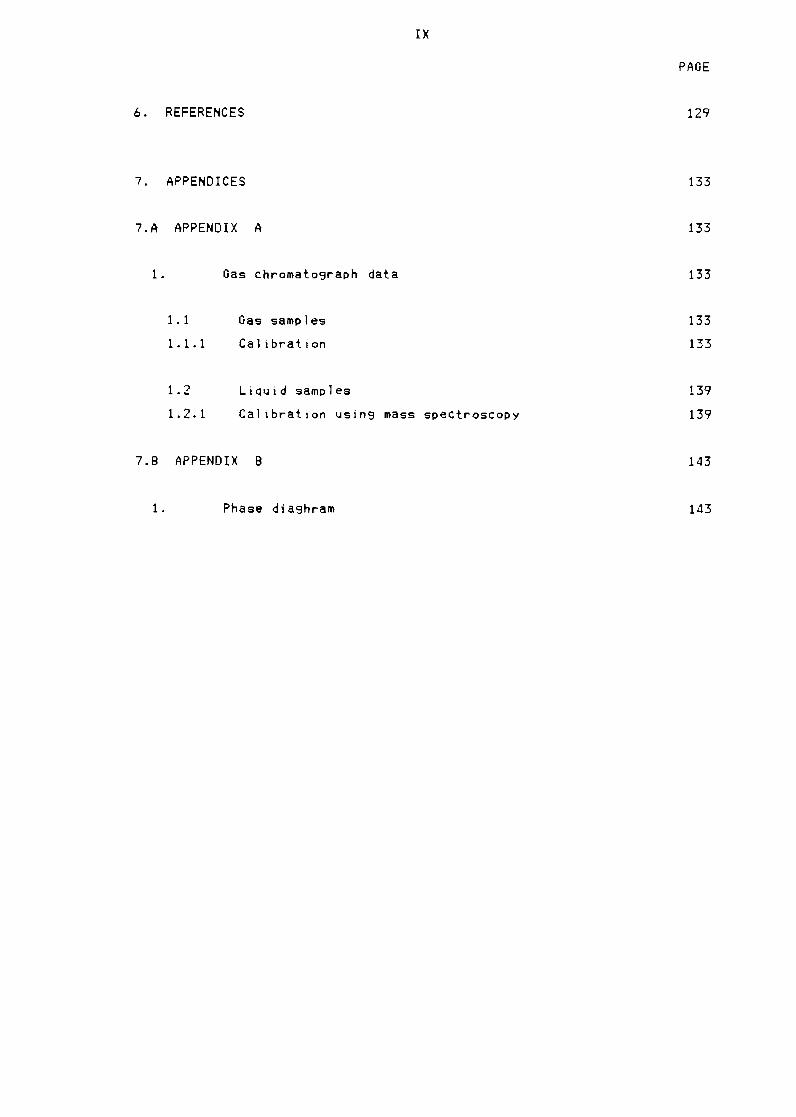
6 REFERENCES
7 APPENDICES
7A APPENDIX A 133
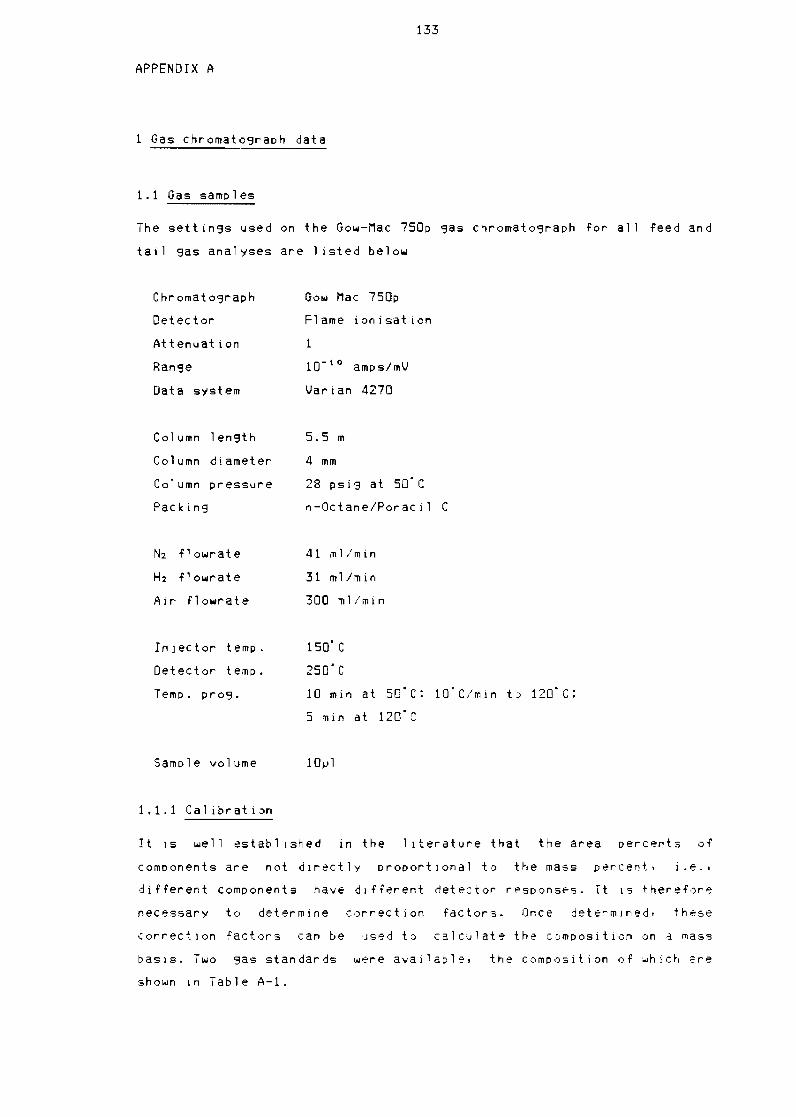
1 Gas chromatograph data 133
11 Gas samples 133
111 Calibration 133
12 li QU i d samp 1es 139
1 21 Cal ibration using mass spectroscopy 139
7B APPENDIX B 143
1 Phase diaghram 143
x
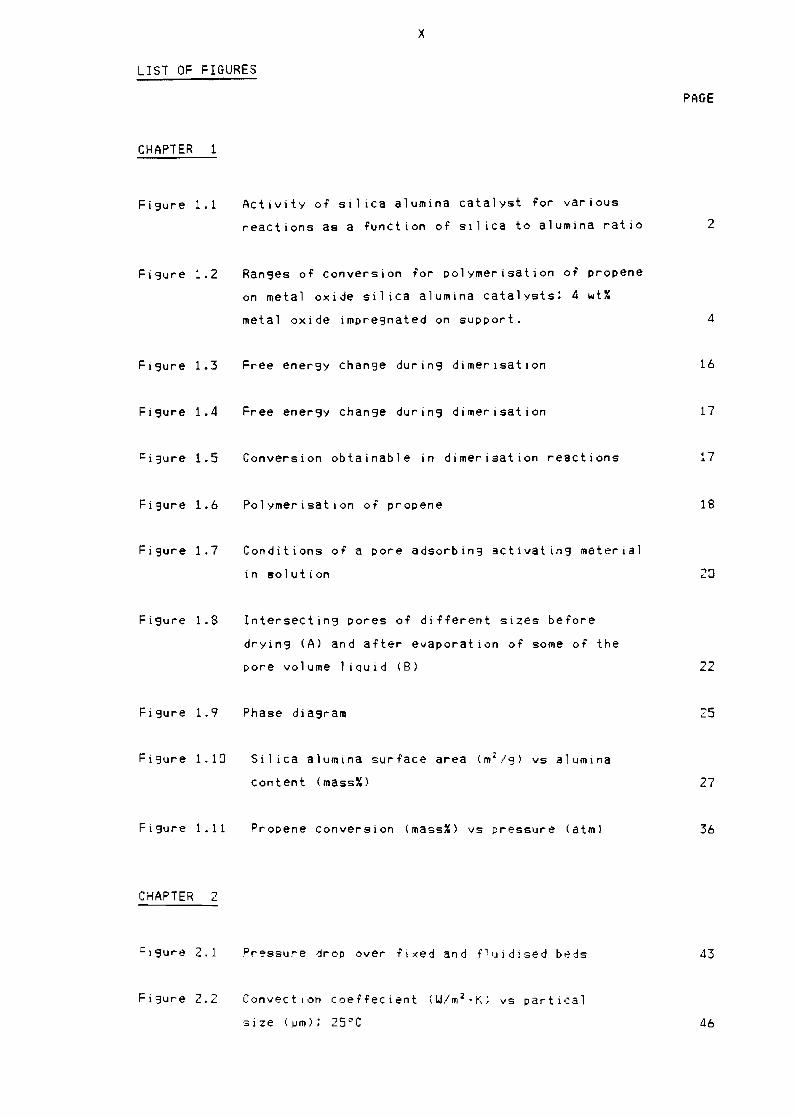
LIST OF FIGURES
PAGE
CHAPTER 1
Figure 11 Activity of sil ica alumina catalyst for various
reactions as a function of sil ica to alumina ratio 2
Figure 12 Ranges of conversion for polymerisation of propene
on metal oxide sil ica alumina catalysts 4 wt~
Fi3ure 1 7 Conditions of a pore adsorbin3 activating material
Intersectin3 pores of different sizes before
dryin3 (A) and after evaporation of some of the
metal oxide impregnated on support 4
Figure 13 Free energy chan3e during dimerisation 16
Figure 14 Free energy change during dimerisation 17
Figure 15 Conversion obtainable in dimerisation reactions 17
Fi3ure 16 Polymerisation of propene 18
in solution 20
pore volume 1 iQuid (B) 22
Fi3ure 19 Phase diagram 25
Fi3ure 110 Si1 ica alumina surface area (m 2 g) vs alumina
content (mass~O 27
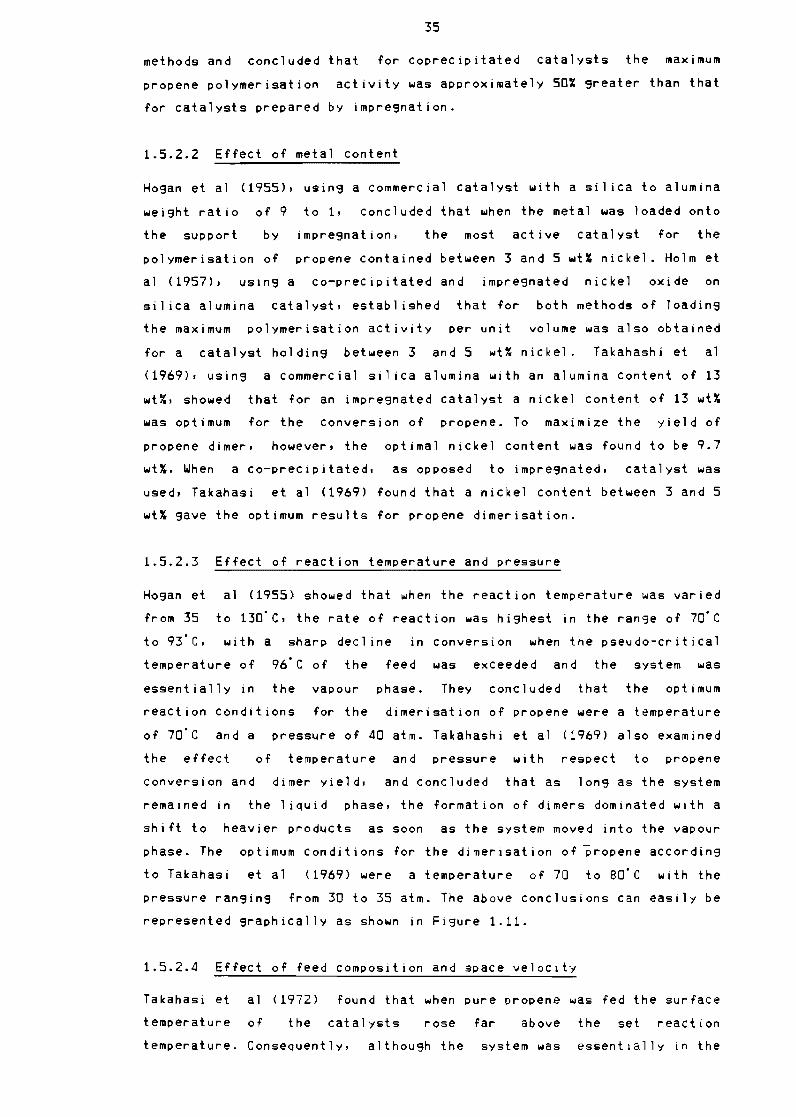
Fi3ure 111 Propene conversion (mass~) vs pressure (atm) 36
CHAPTER 2
Pressure drop over fixed and fluidised beds
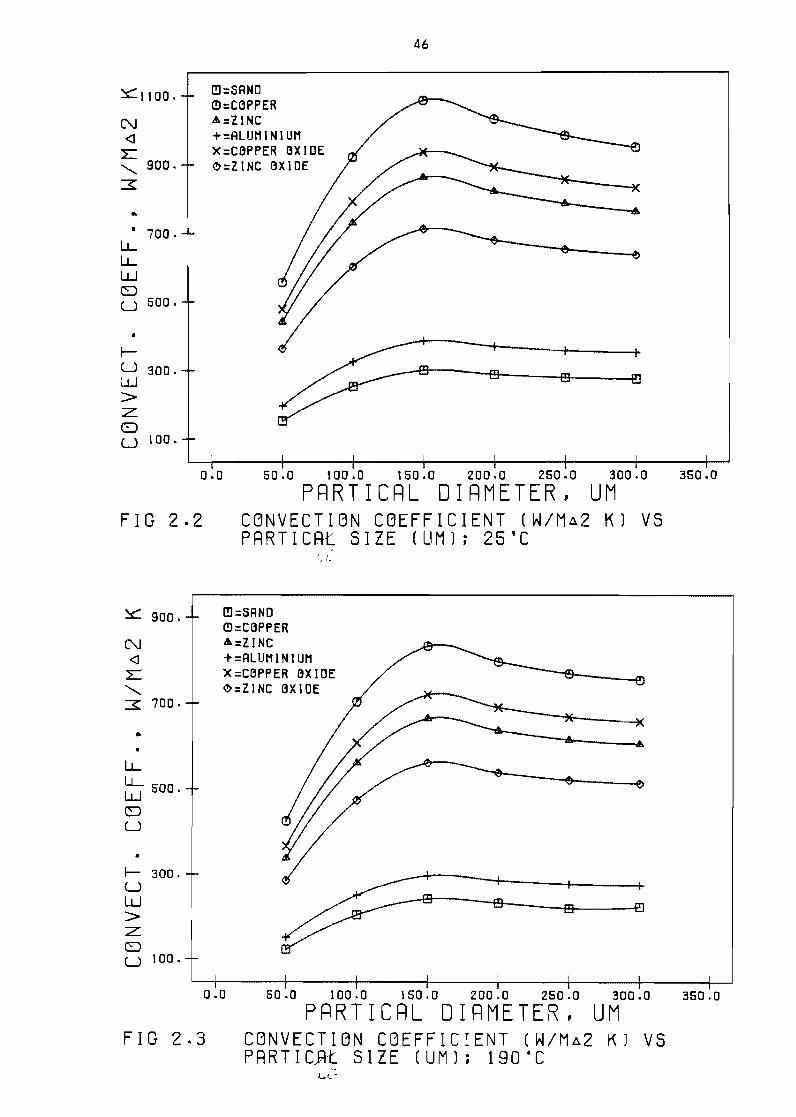
Fi3ure 22 Convection coeffecient (Wm 2 K) vs partical
size (pm) 25 Q C
43
46
XI
Figure 23
Figure 24
Figure 25
Figure 26
Figure 27
Figure 28
CHAPTER 3
Figure 31
Figure 32
Figure 33
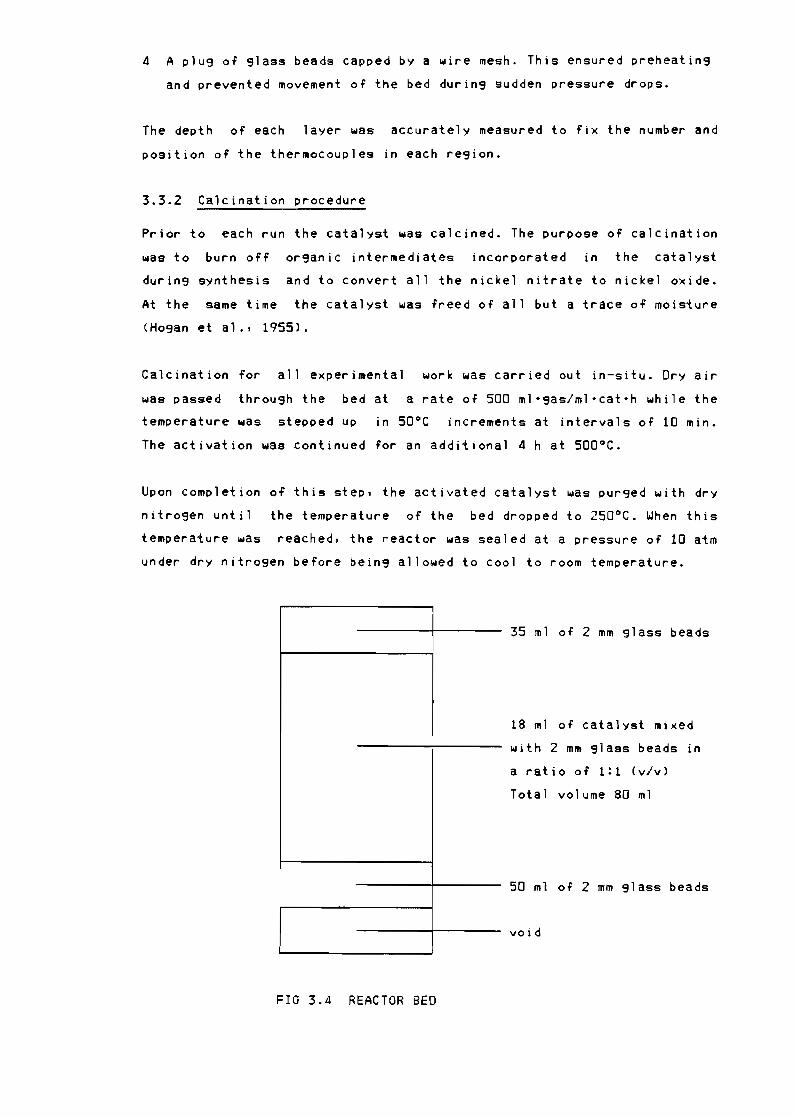
Figure 34
Figure 35
Figure 36
Figure 37
CHAPTER 4
PAGE
Convection coeffecient (Wm 2 K) vs partical
size (lim) 190degC 46
Reactor modifications to measure pressure drop 47
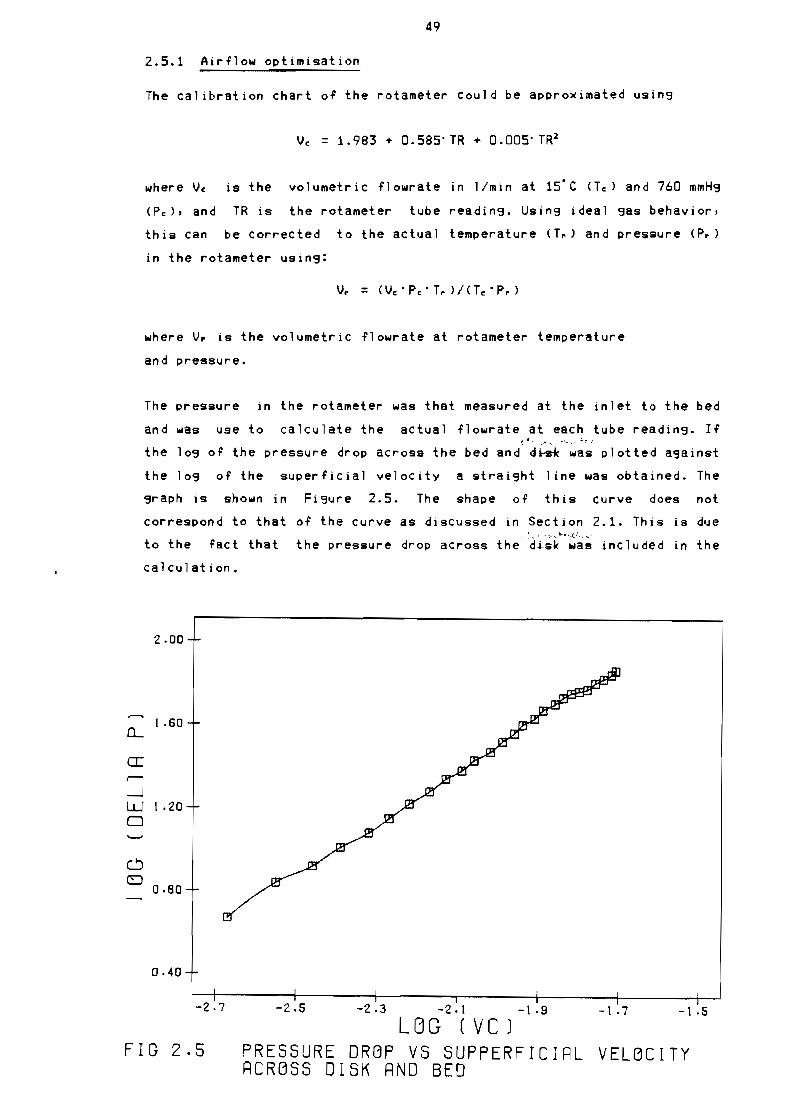
Pressure drop vs supperficial velocity aCross
disk and bed 49
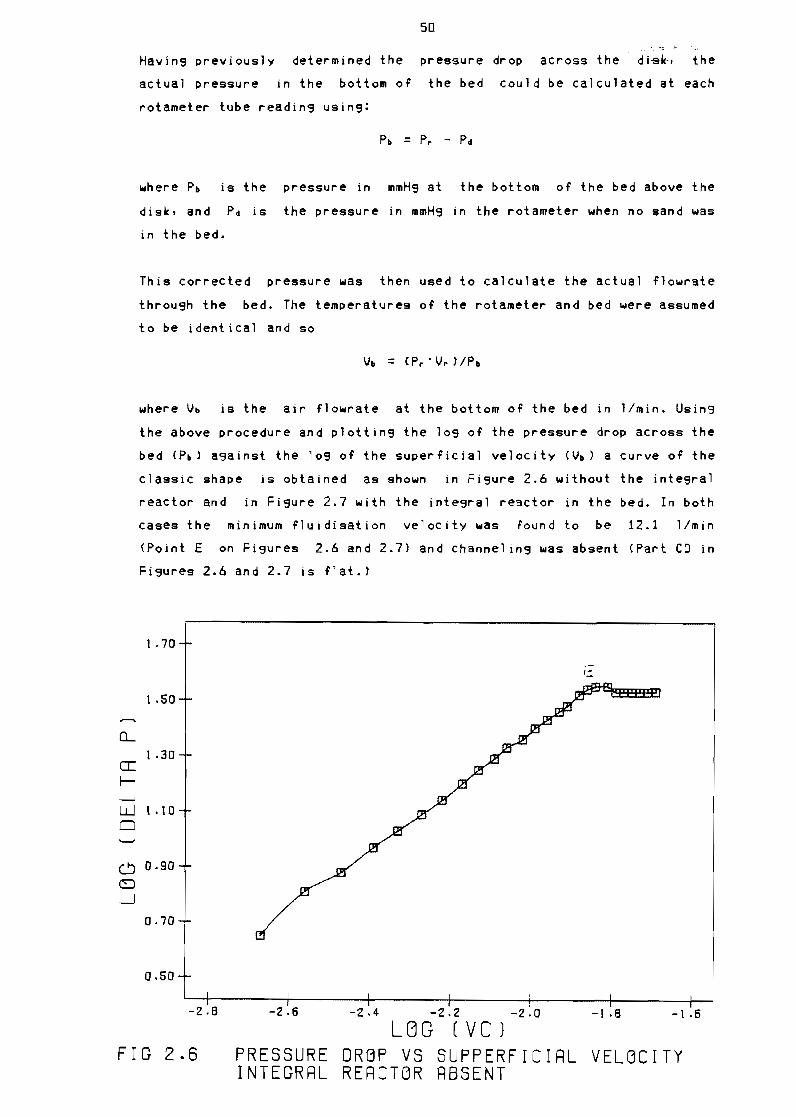
Pressure drop vs supperficial velocity Integral
reactor absent 50
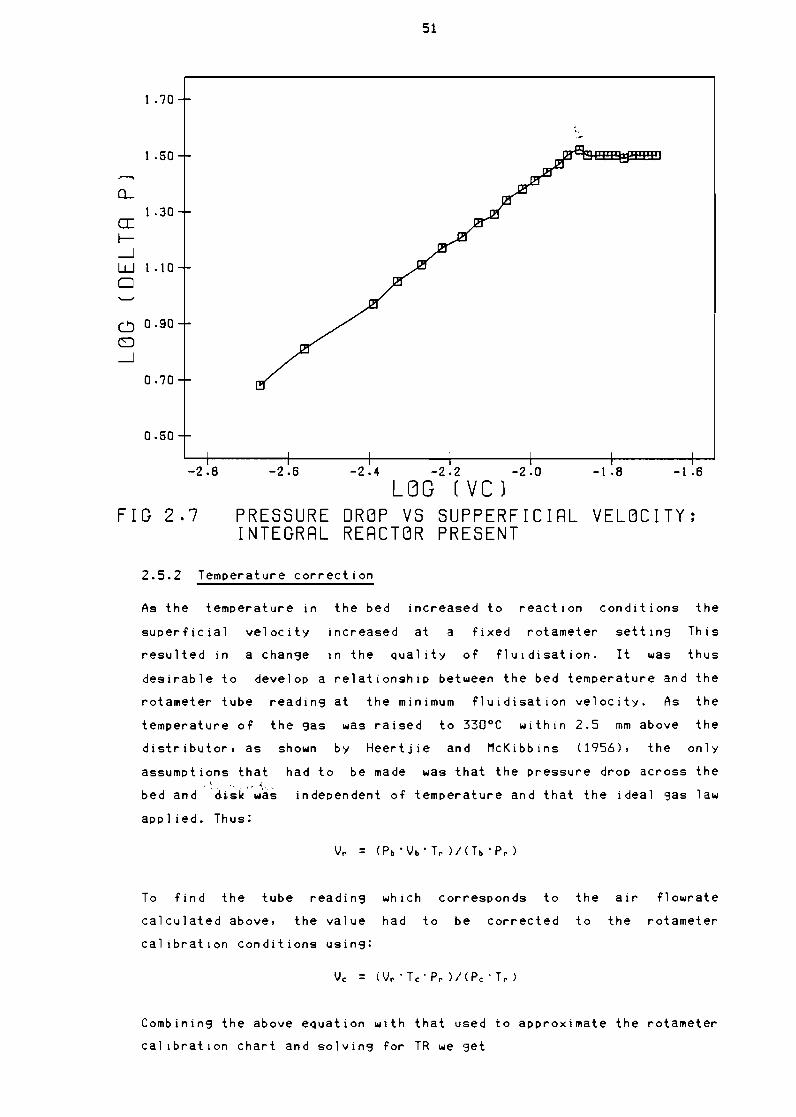
Pressure drop vs supperfictal velocity Integral
reactor present 51
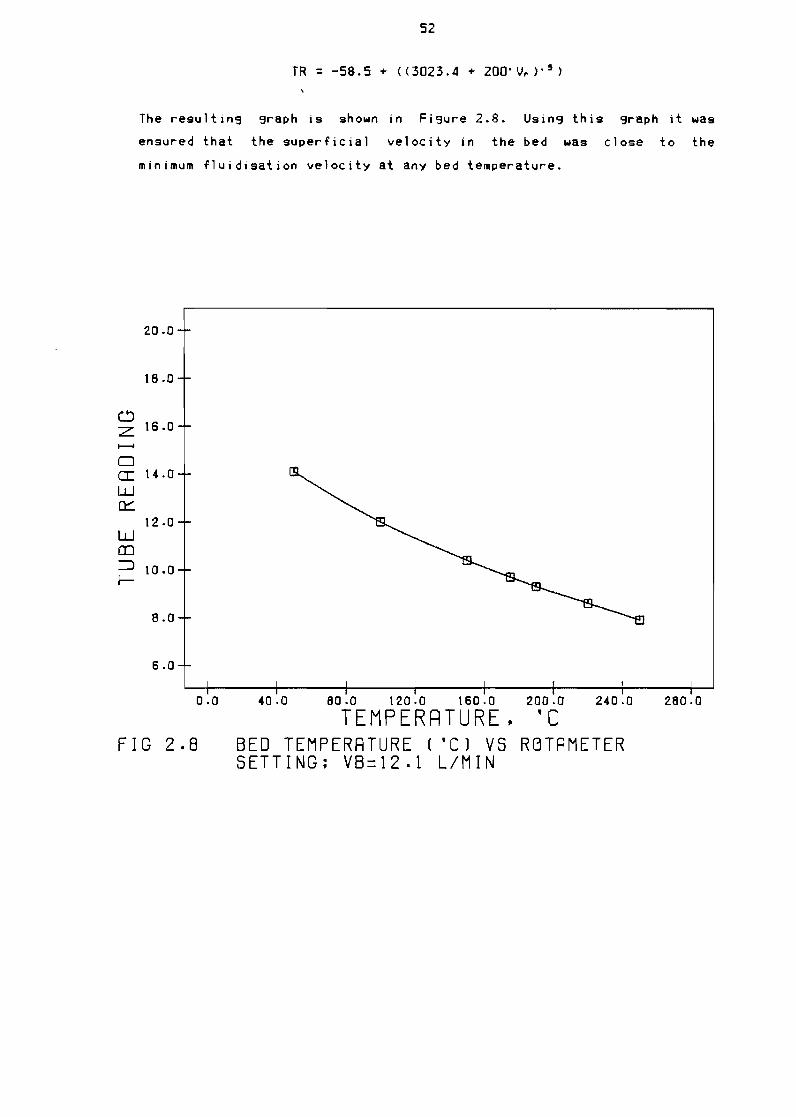
Bed temperature (OC) vs rotameter tube reading (TR) 52
Vb=12 lmin
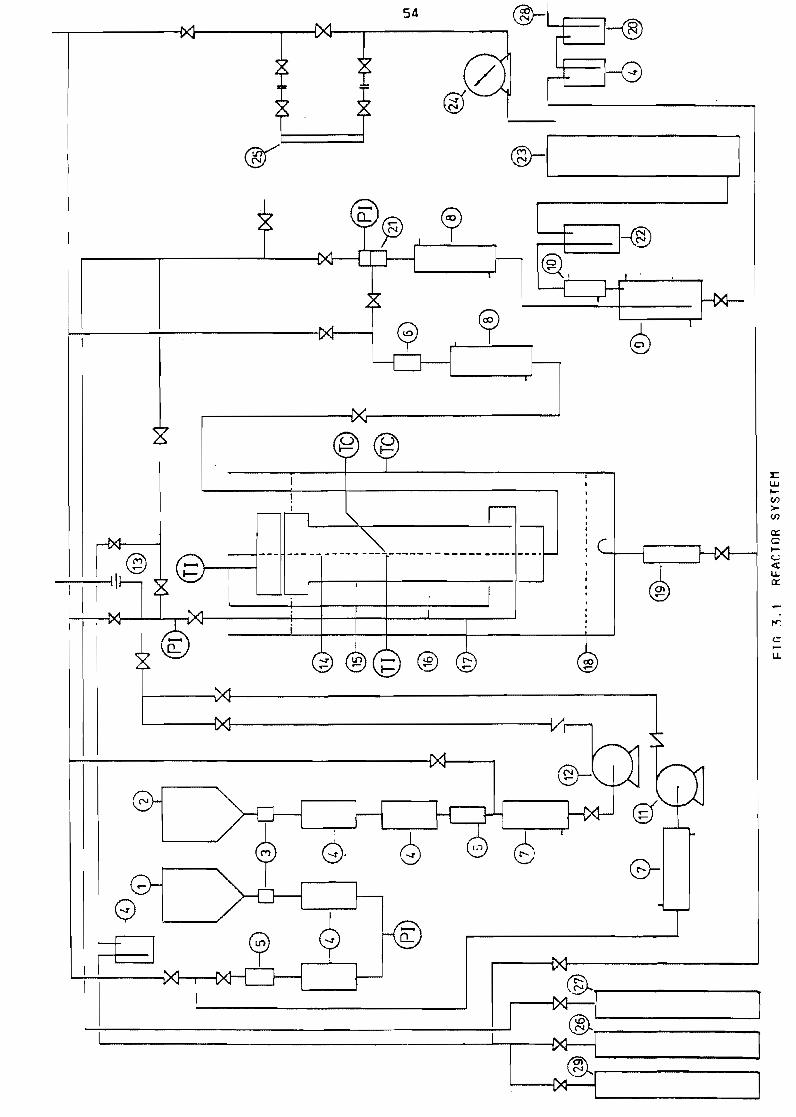
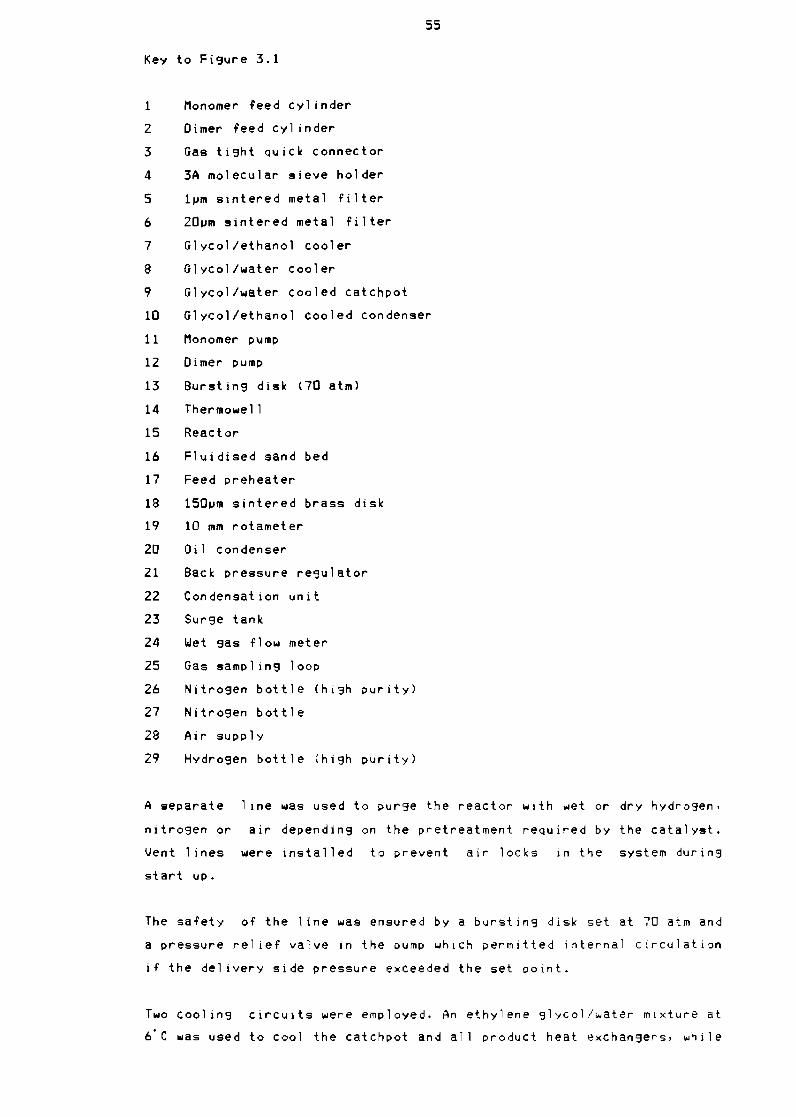
Reactor system 54
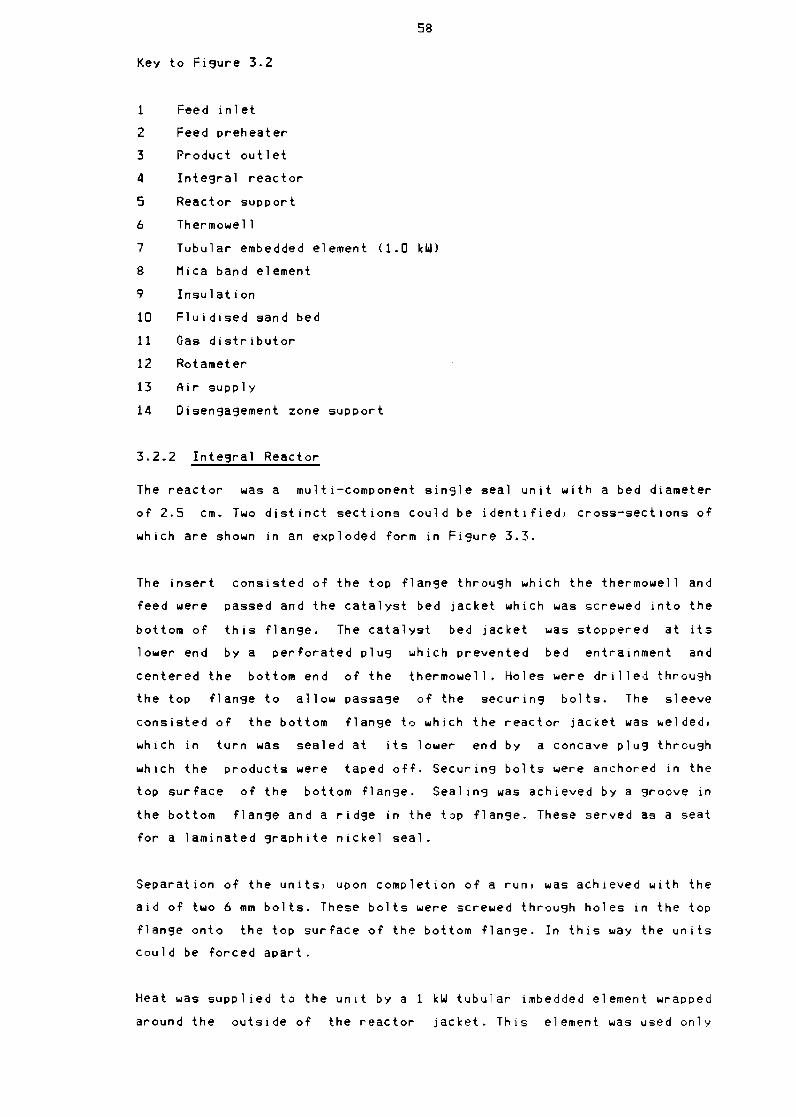
Integral reactor and fluidised sand bed 57
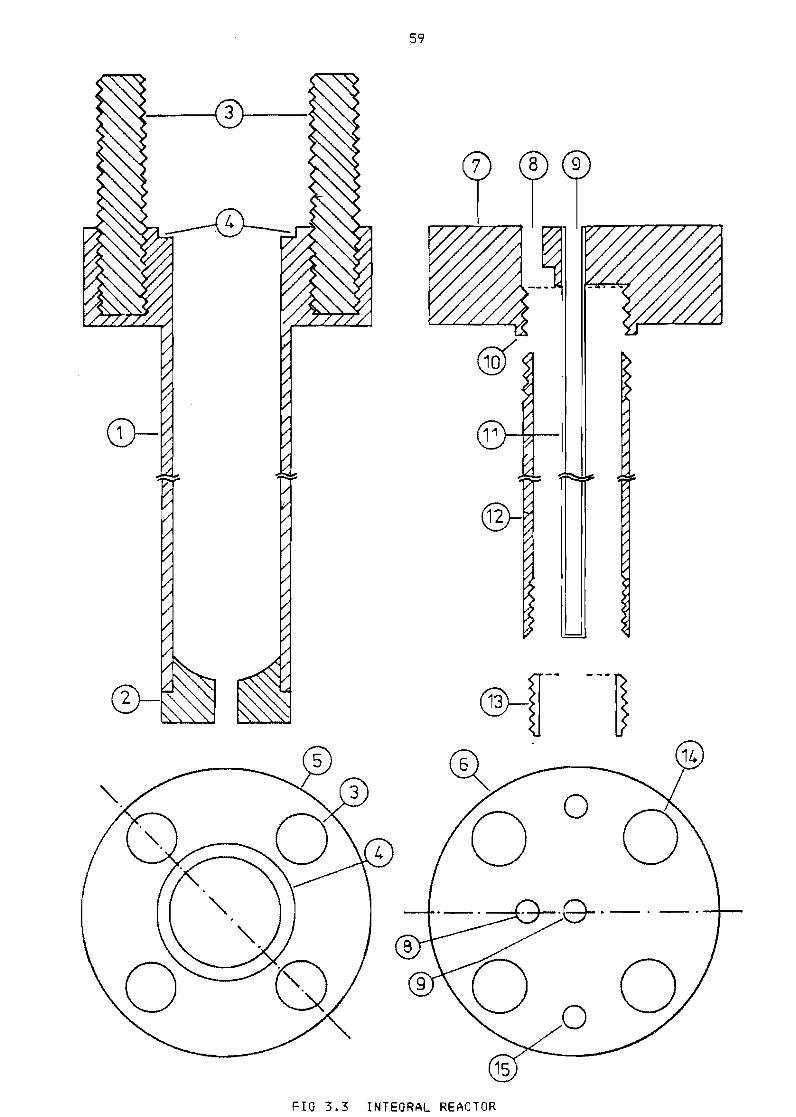
Integral reactor 59
Reactor bed 61
Batch distillation unit 70
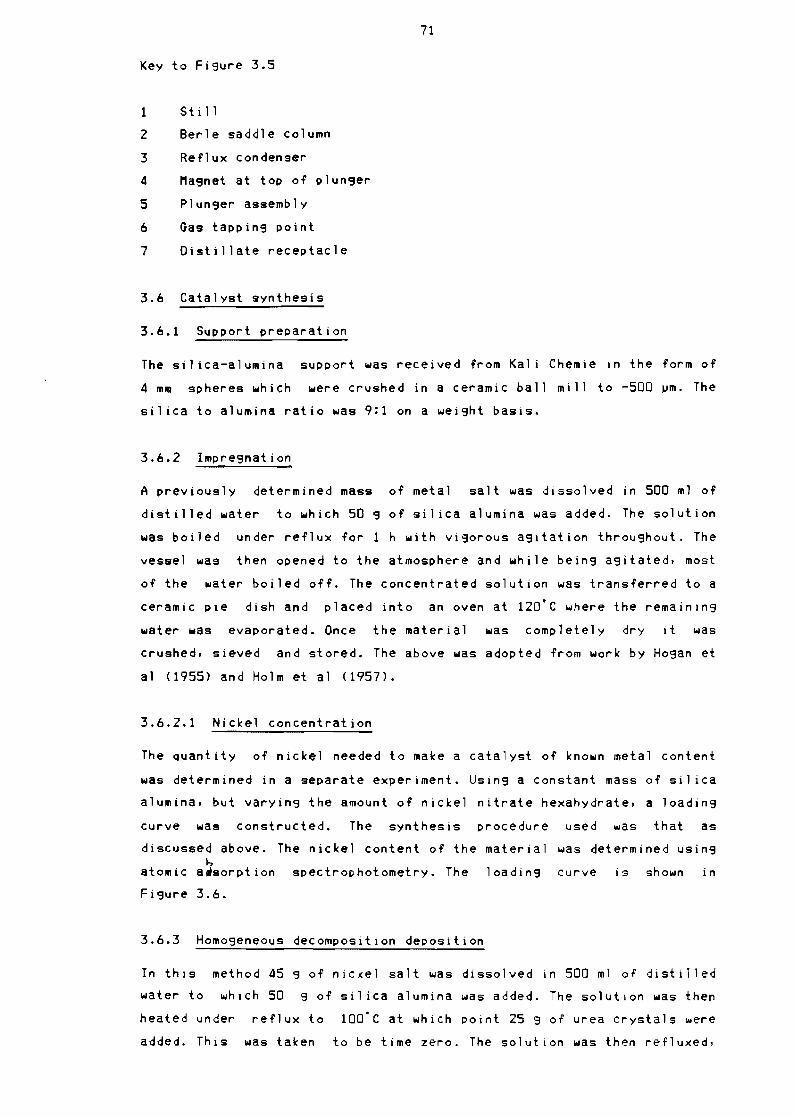
Nickel content (massYo) vs mass of nickel nitrate
hexahydrate (g) 72
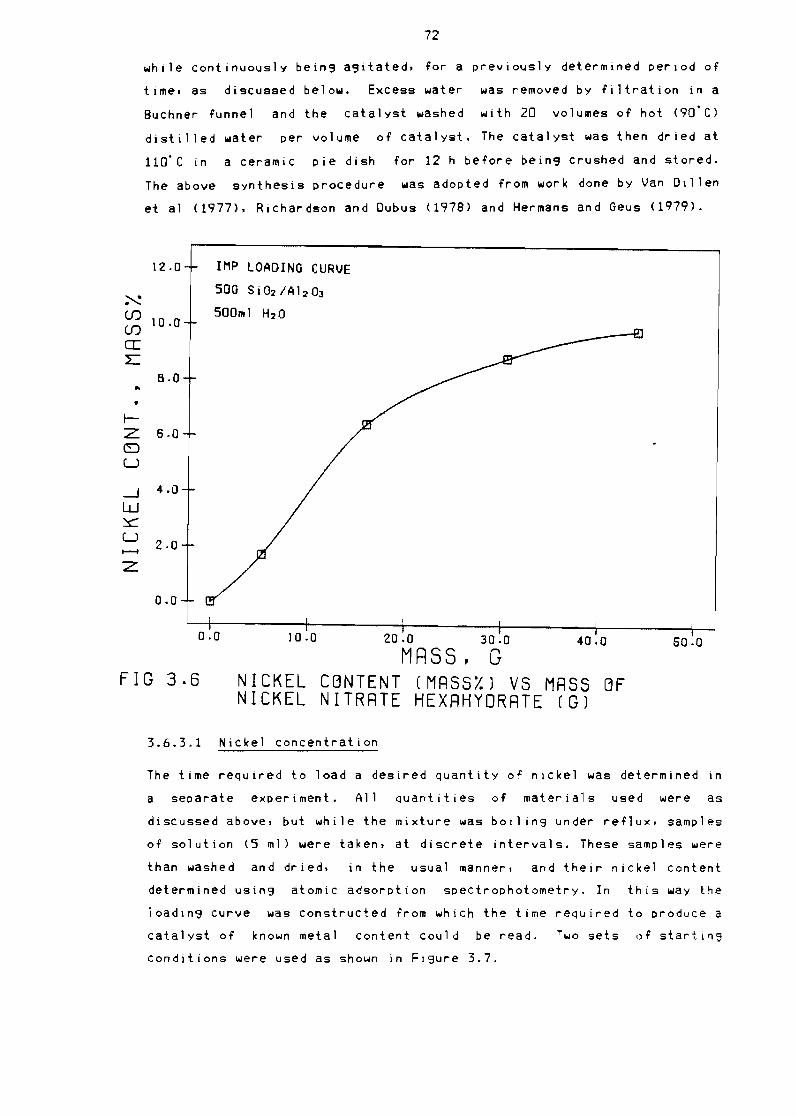
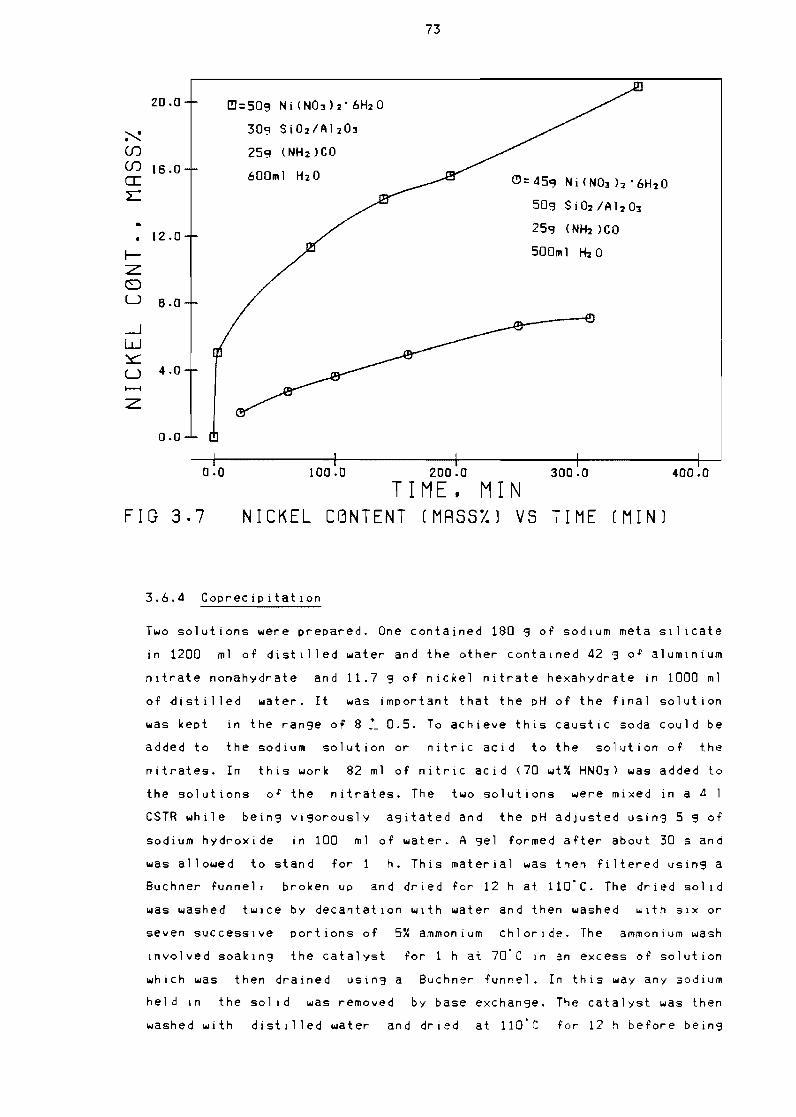
Nickel content (mass~O vs time (min) 73
Liquid production rate (Shgl vs time (h) 77
XII
FiSure 42
FiSure 43
Fisure 44
Fisure 45
FiSure 46
Figure 47
Fisure 48
FiSure 49
Figure 410
Figure 411
Figure 412
Figure 413
Figure 414
Fi3ure 415
PAGE
Liquid composition (mass)) vs time ( h ) 77
EHec t of nickel content
product ion rate (9hS)
(mass))
HOD
on 1 iQuid
79
EHect of nickel content
composition (mass) HOD
(mass~) on 1 iQuid
79
Effect of nickel content
production rate (ghg)
(mass~)
IMP
on liquid
80
EHect of nickel content
composition (mass~) IMP
(mass~O on 1 iQuid
80
Effect of pressure
rate (ghg) HO~
Effect of pressure
(mass) HOD
Effect of pressure
rate (ghg) IMP
Effect of pressure
(mass) IMP
Effect of pressure
rate (Shg) SG
Liquid composition
at 40 atm SG
(atm) on
(atm) on
(atm) on
(atm) on
(atm) on
(mass~)
1 iquid production
81
1 iQuid composition
81
1 iQuid production
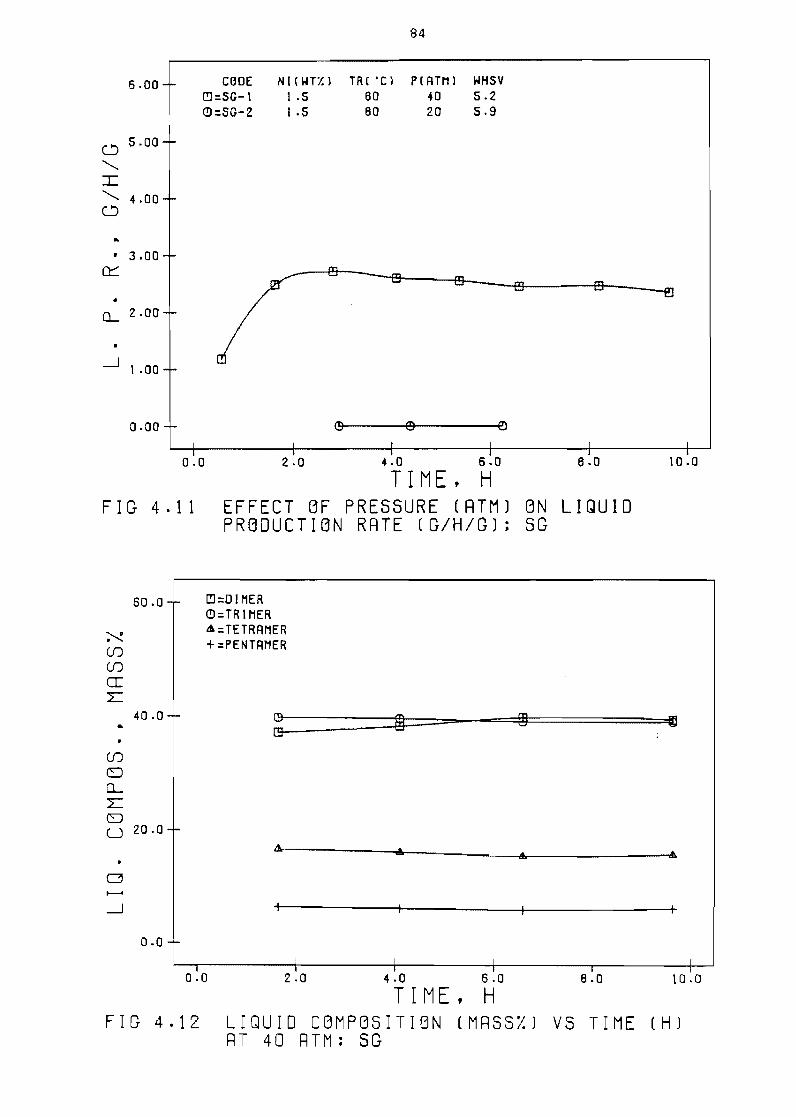
83
1 iQuid composition
83
liquid production
84
vs time (h) 84
Bed
set
temperature profile ( deg C )
point 80degC SG-1
vs position ( Z ) I
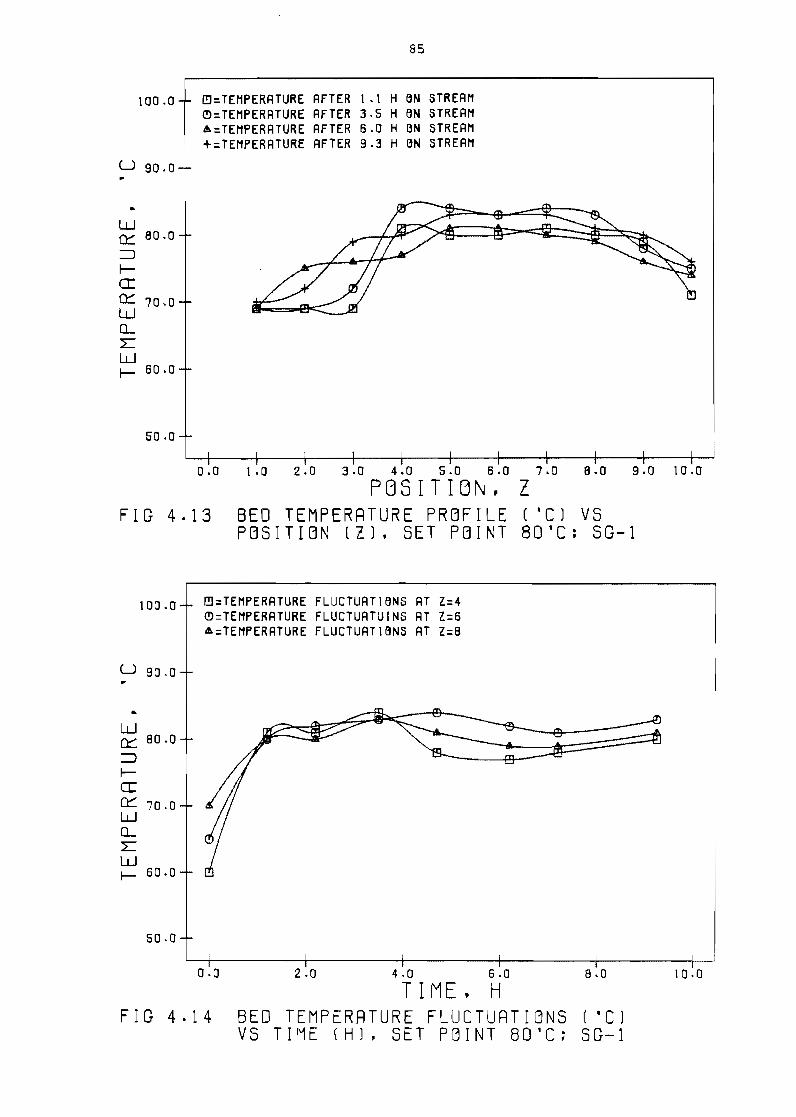
85
Bed
set
temperature +PO n _ 80degC
fluctuations
S(7-1
( lt) C ) vs time (h) I
85
Bed
set
temperature profi le
point 210degC HDD-9
( 0 C ) vs POSition (Z)
87
XIII
PAGE
Figure 416 Bed
set
temperature fluctuations
point 210degC HOO-9
(OC) vs time (hl
87
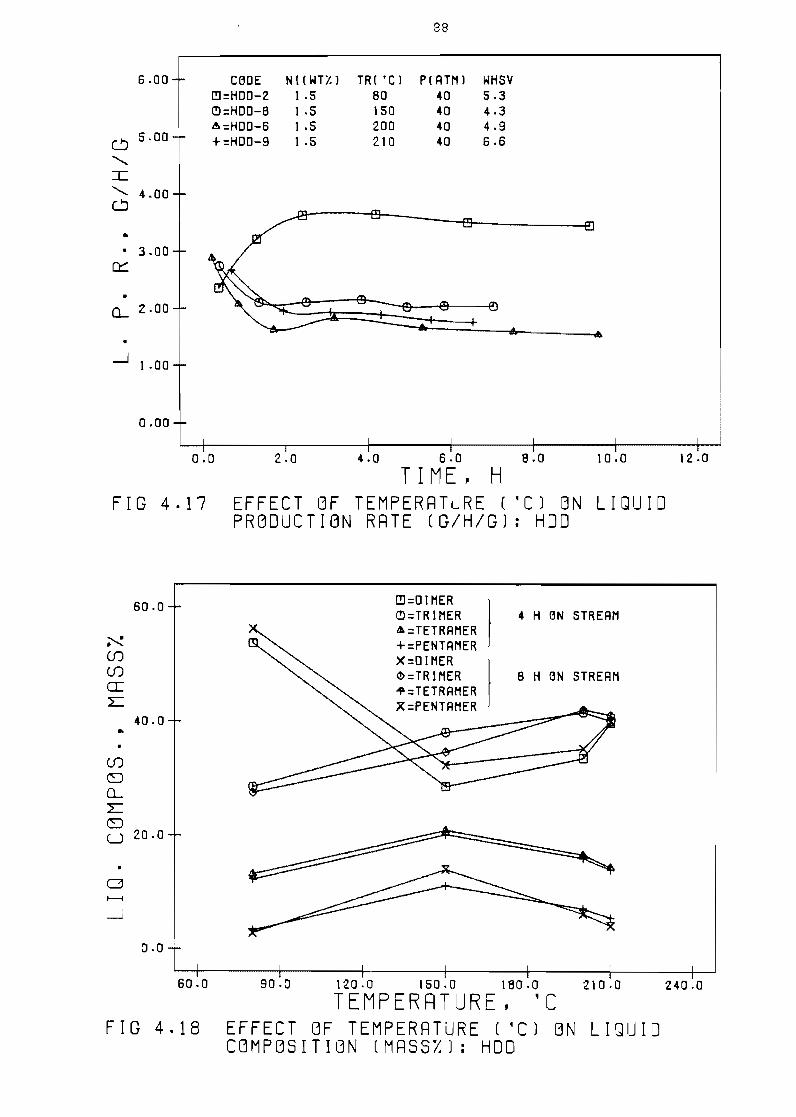
Figure 417 Effect of temperature (OCl on 1 iQuid production
rate (ghg) HOD
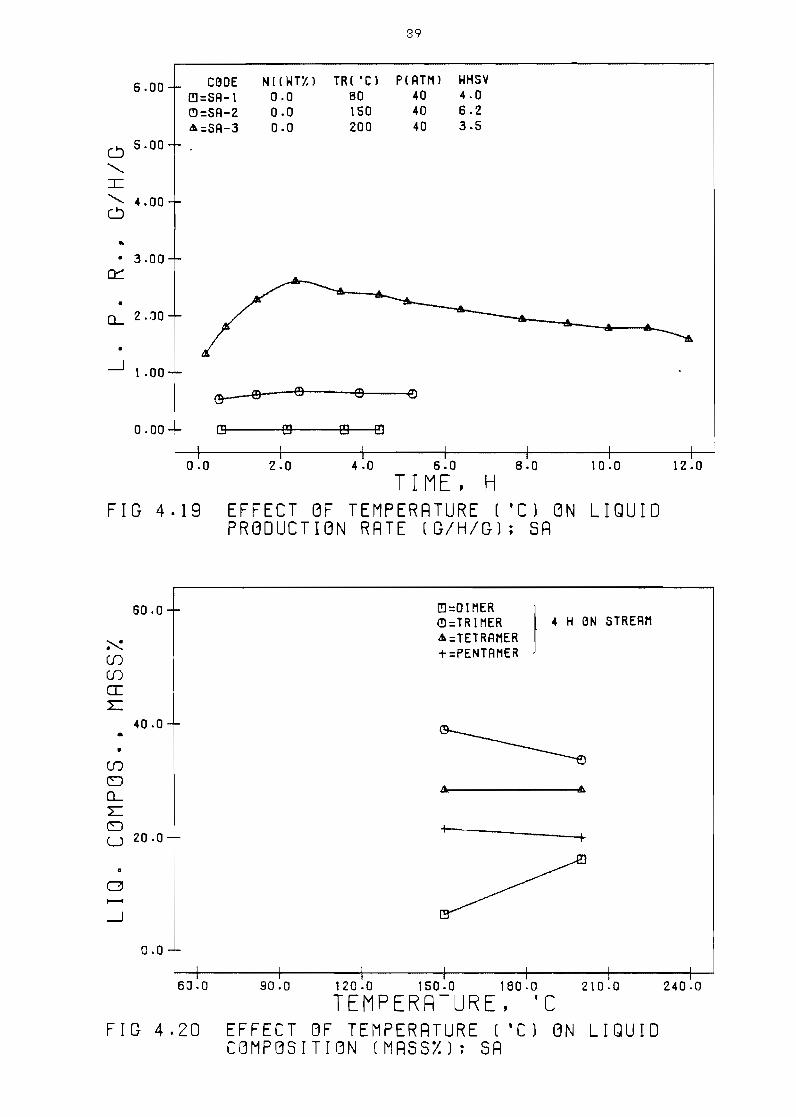
Figure 418 Effect of temperature
(mass~) HOD
(OC) on
Figure 419 Effect of temperature
rate (ghg) SA
(OC) on
Figure 420 Effect of temperature
(mass~) SA
(OC) on
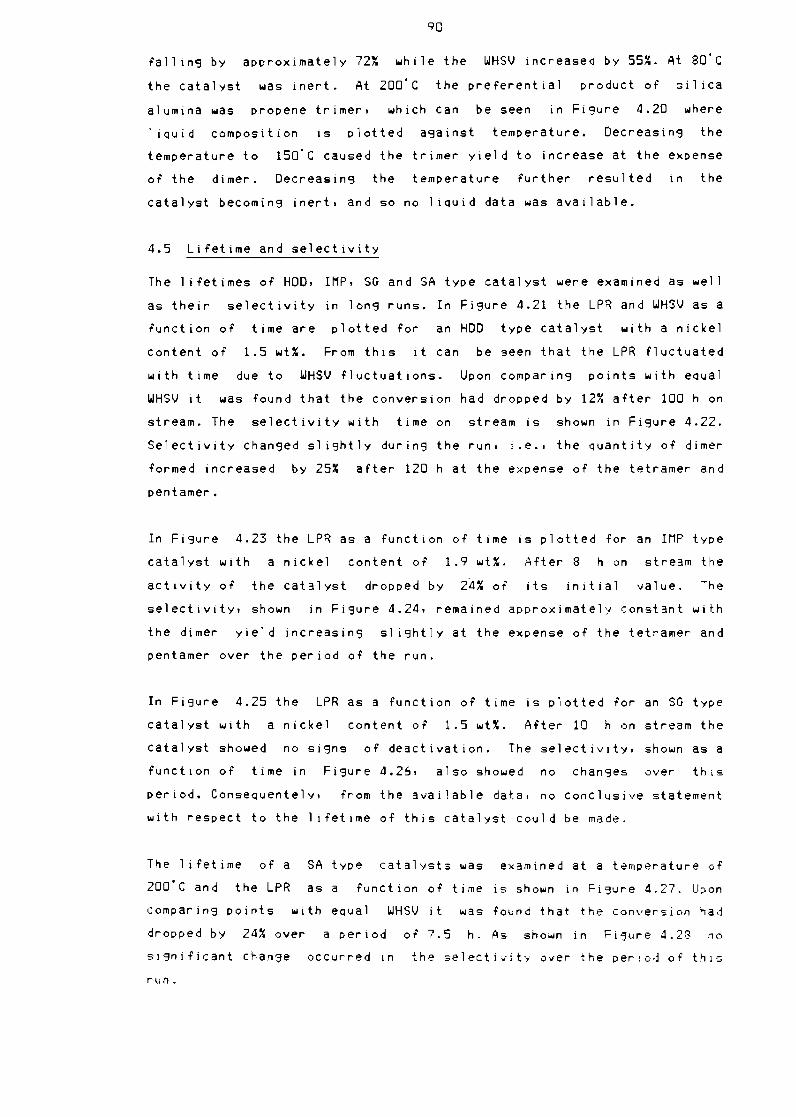
Figure 421 Liquid production rate
space velocity (ghg)
(ghg)
vs time
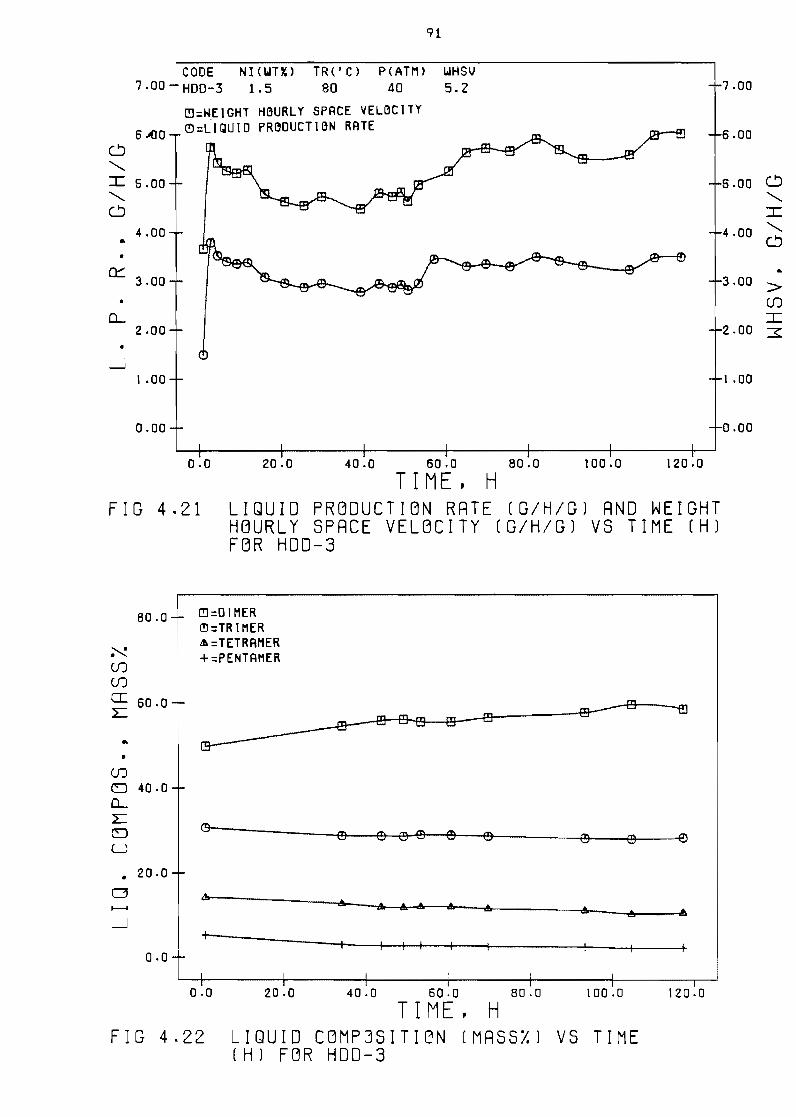
Figure 422 Liquid composition (mass) vs
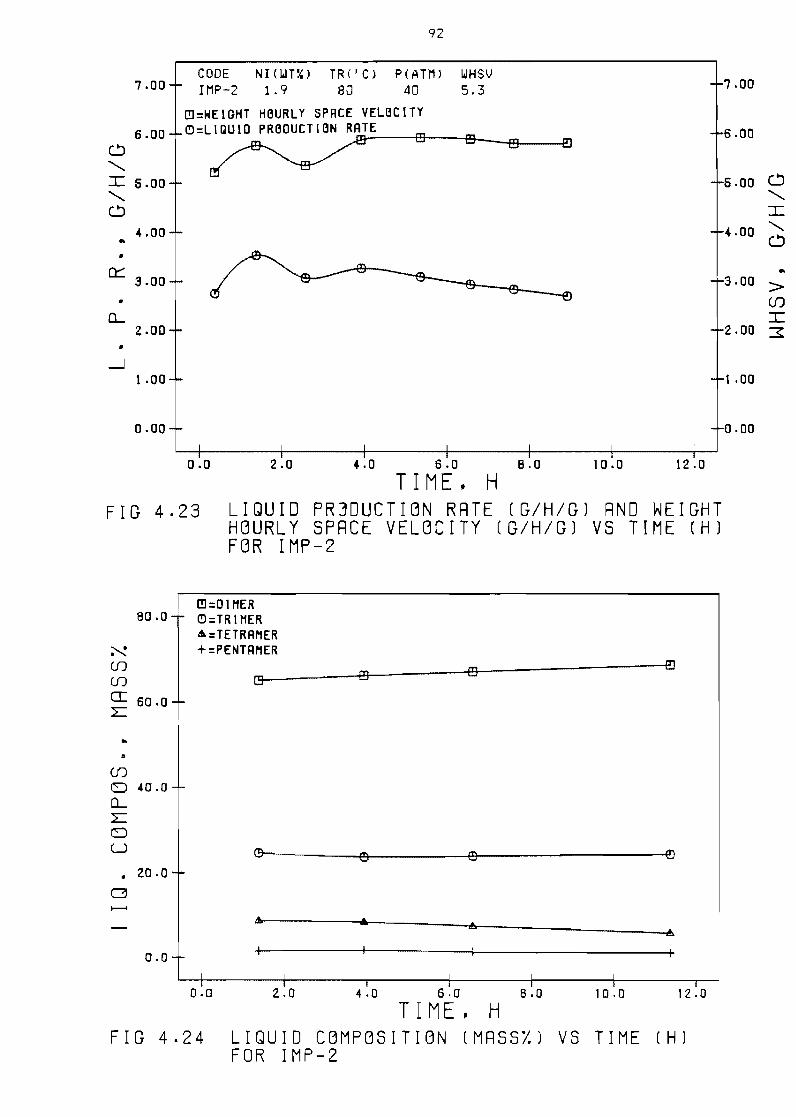
Figure 423 Liquid production rate
space velocity (ghg)
(ghg)
vs time
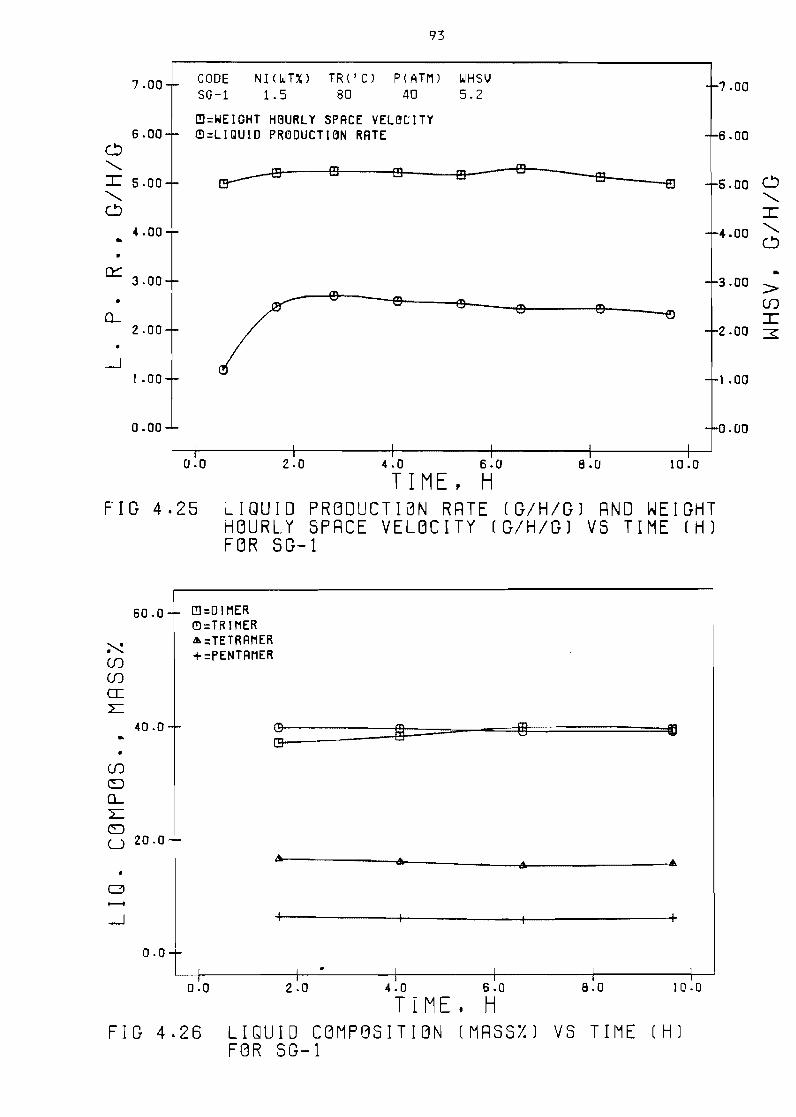
Figure 424 Liquid composition (mass) vs
Figure 425 Liquid production rate
space velocity (ghg)
(ghg)
vs time
Figure 426 Liquid composition (mass) vs
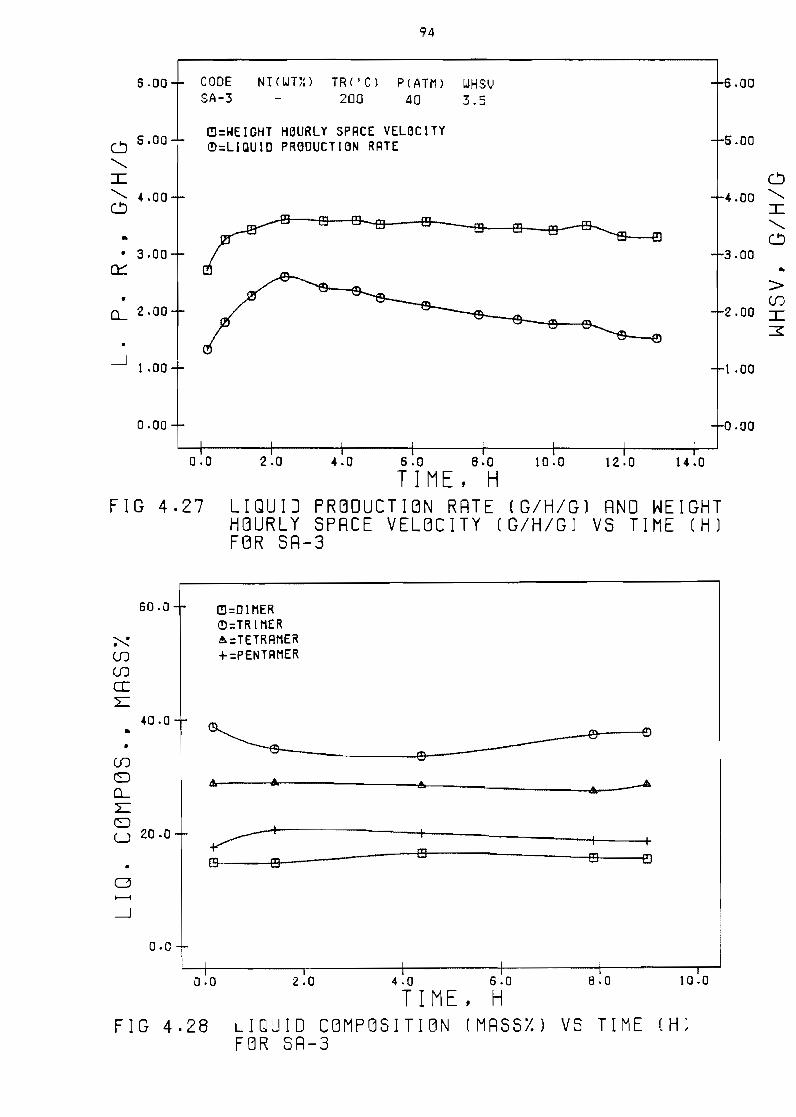
Figure 427 Liquid production rate
space velocity (ghgl
(ghg)
vs time
Figure 428 Liquid c~mpositlon (massl) vs
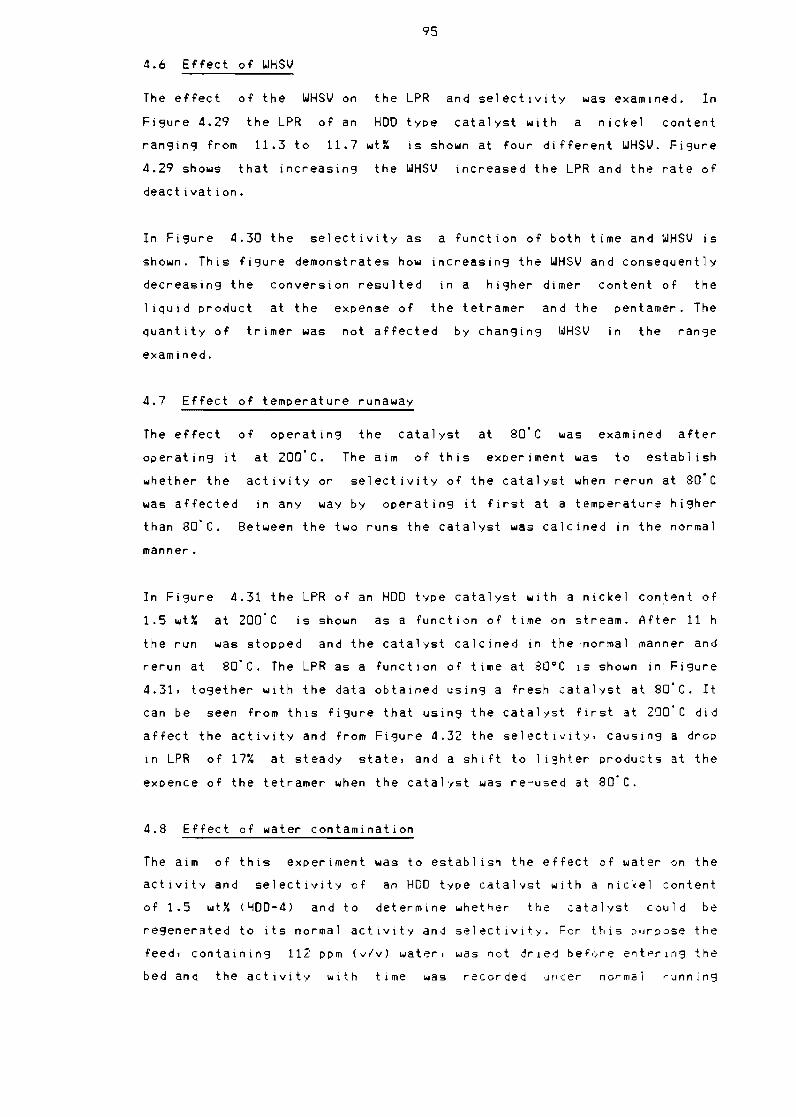
Figure 429 Effect of weight hourly space
88
liquid composition
S8
liquid production
89
liquid composition
89
and weight hourly
(h) for HDD-3 91
time (hl for HDD-3 91
and weight hourly
(hl for IMP-2 92
time (h) for IMP-2 92
and weight hourly
(h) for SG-1 93
time (h) for 3G-1 93
and weight hourly
(h) for SA-3 94
time (hI for SA-3 94
velocity (ghg)
on 1 iQUld production rate IShg HOD 96
Figure 430 Effect of weight hourly space velocity (ghg)
on 1 iQuid composition (ma9s~) HOD 96
XIV
PAGE
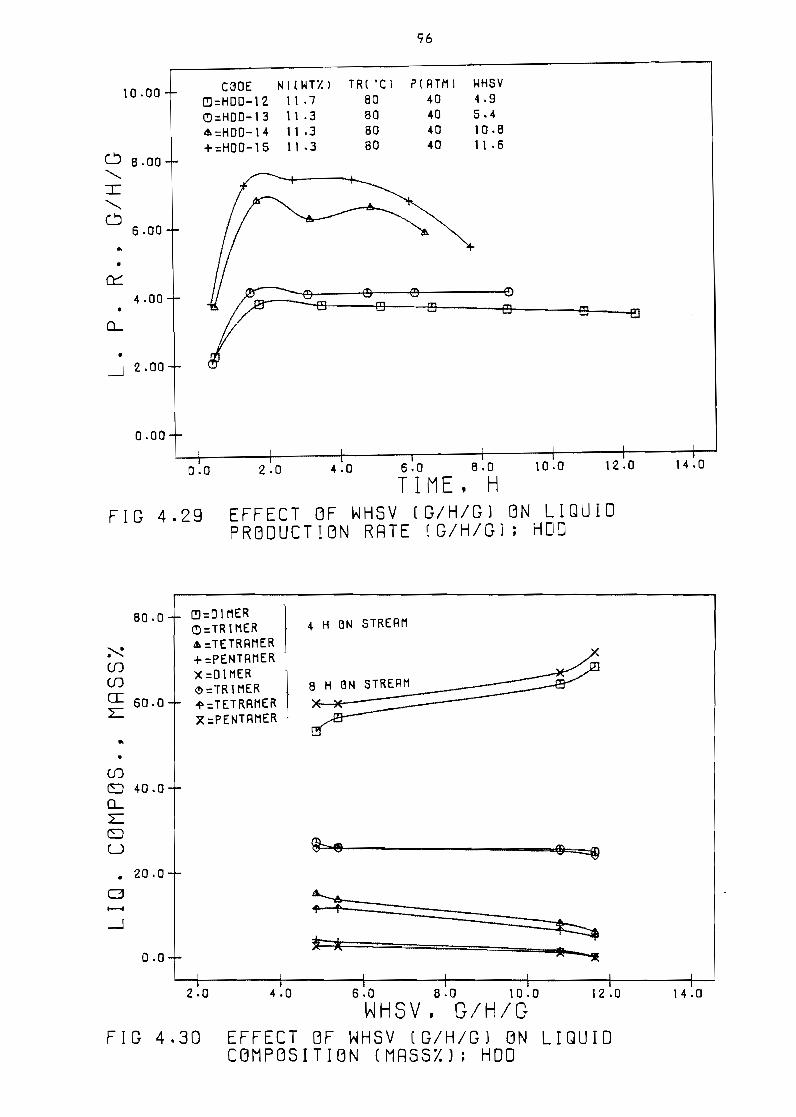
Fi~ure 431 Effect of temperature runaway
rate (~h~) HDO-6 and HDO-7
usin~ same catalyst
on 1 iQuid production
consecutive runs
97
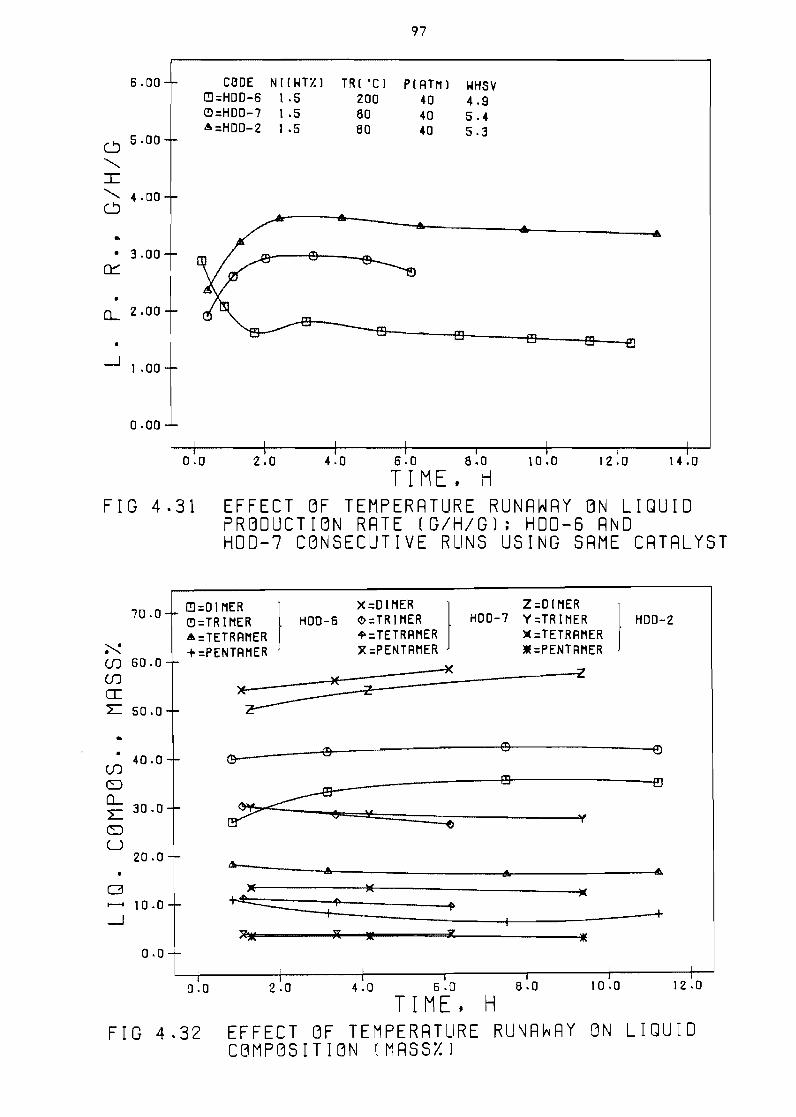
Fi~ure 432 Effect of temperature
composition (mass~)
(OC) runaway on liQuid
97
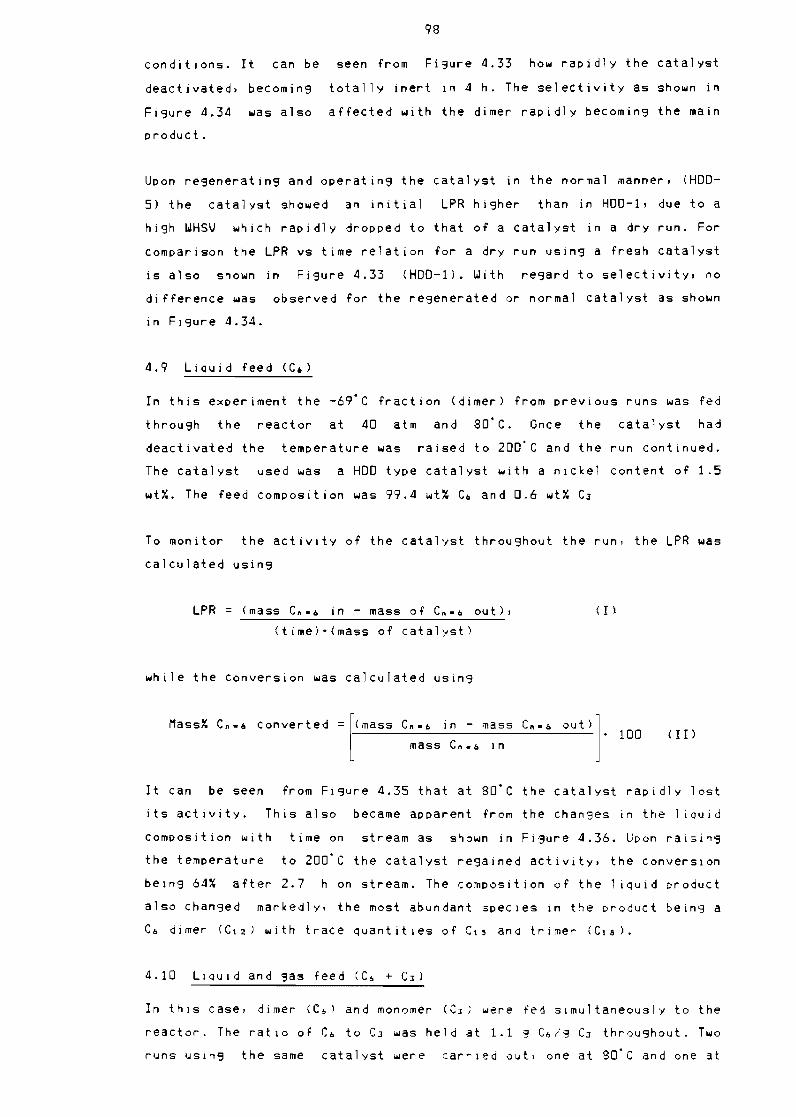
Fi~ure 433 Effect of water on 1 iQuid production rate
(~h~) HDO-5 re~eneration after HOD-4 99
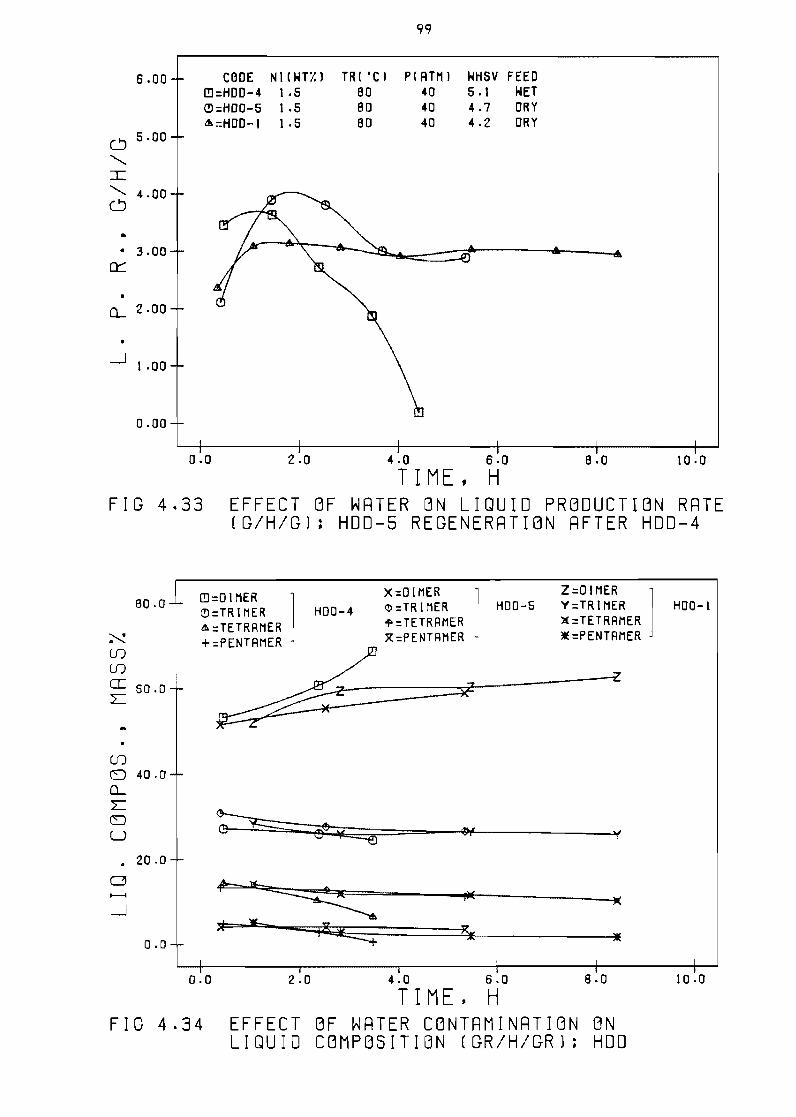
Fi~ure 434 Effect of water contamination
composition (~h~) HO~
on 1 iQuid
99
Fi~ure 435 LiQuid production rate (~hg) and
(mass~) vs time (h) 1 iQuid laquo69degC
feed HOD-IS
conversion
fraction)
100
Figure 436 LiQuid composition (massYo) vs
laquo69degC fraction) feed HDD-1S
time (h) 1 iQuid
100
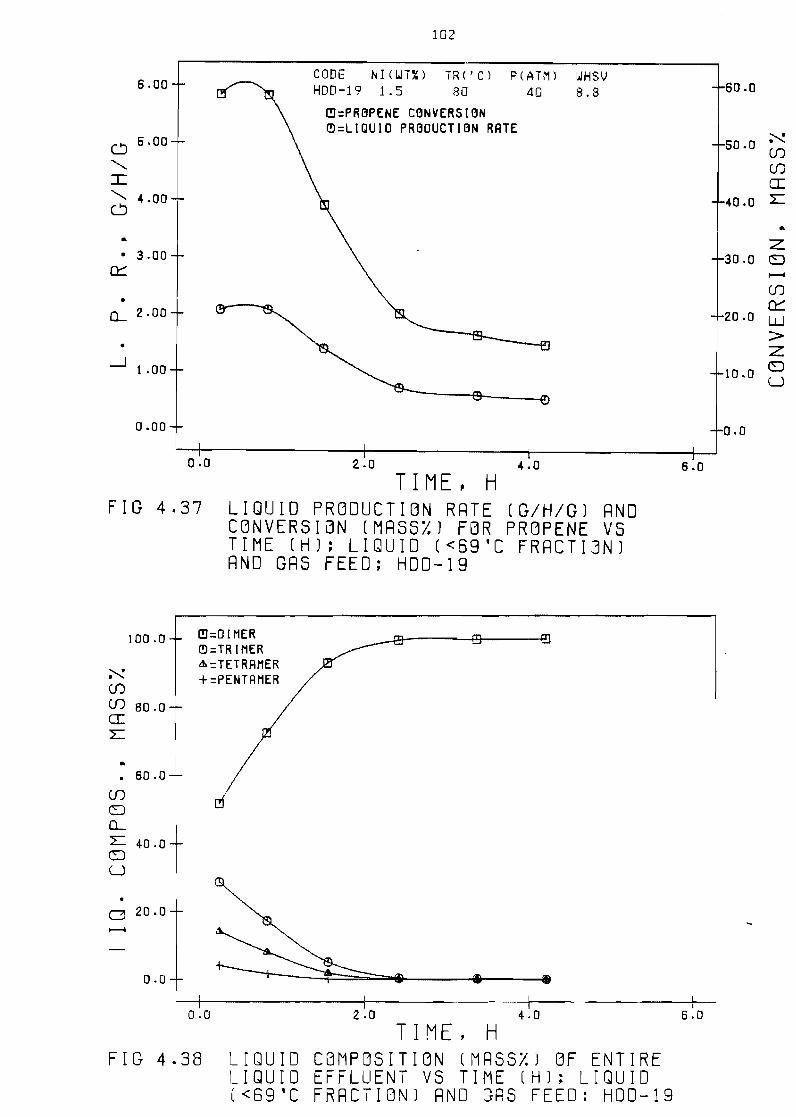
Fi~ure 437 LiQuid production rate (~hg) and conversion
(mass~) for propene vs time (h) liQuid
laquo69degC fraction) and gas feed HDD-19 102
Figure 438 LiQuid composition (mass~) of entire 1 iQuid
effluent vs time (h) liQuid laquo69degC fraction)
gas feed HDD-19
and
102
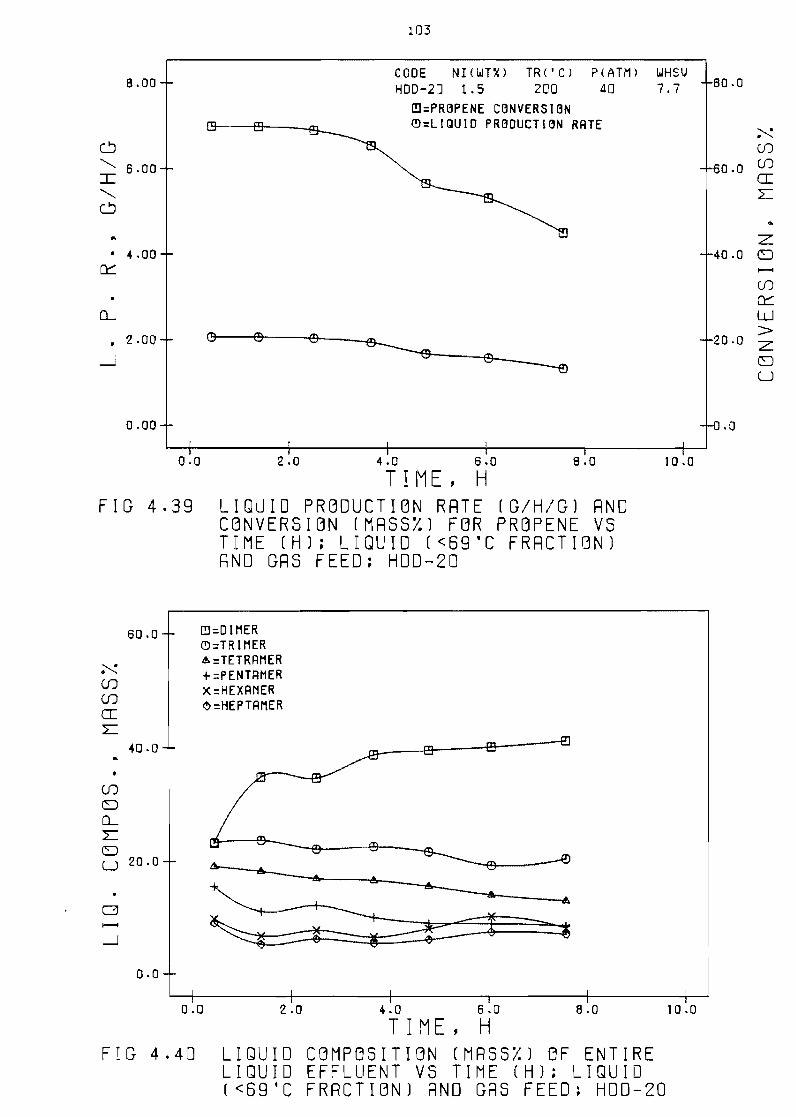
Fi~ure 439 LiQuid production rate (ghg) and conversion
(mass~) for propene vs time (h) liquid laquo69degC
fraction) and gas feed HDD-20 103
Figure 440 Liquid composition (mass)
sample vs time (h) 1 iquid
gas feed HDD-20
of entire 1 iQuid
laquo69degC fraction) and
103
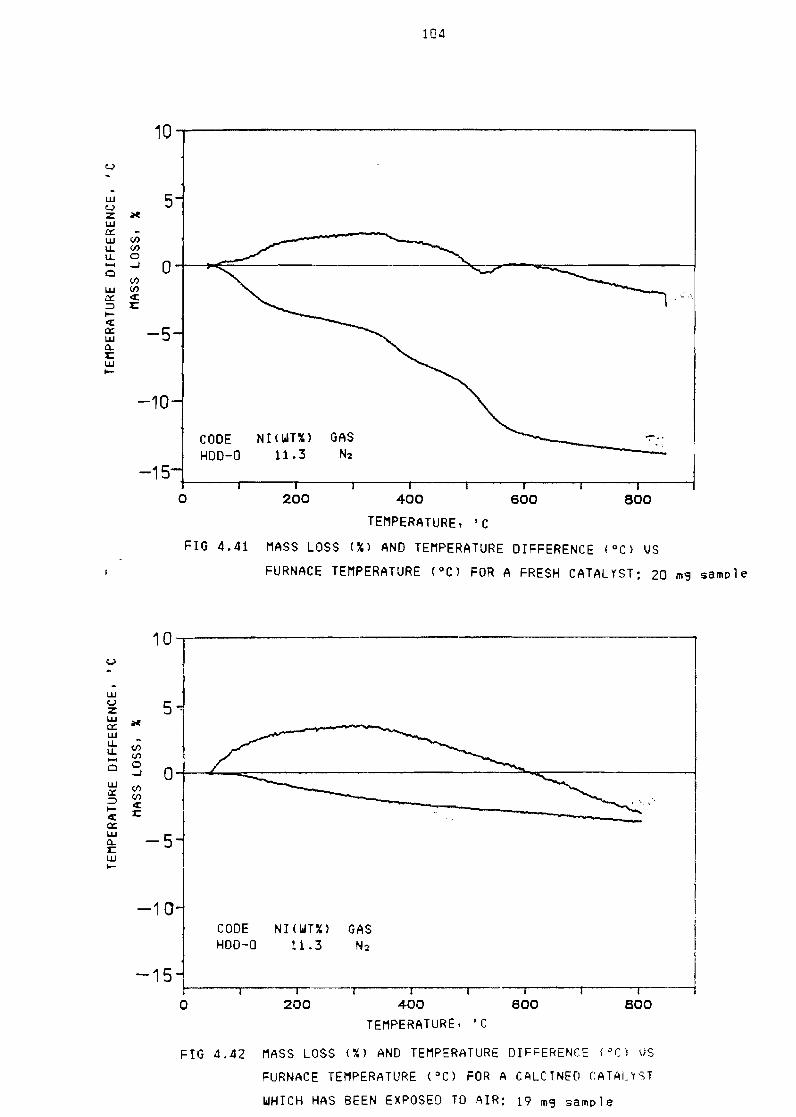
~i9ure 441 Mass loss
for fresh
(X) and temperature ~iffe~ences (O()
catalyst 20 mg sample 104
104
xv
PAGE
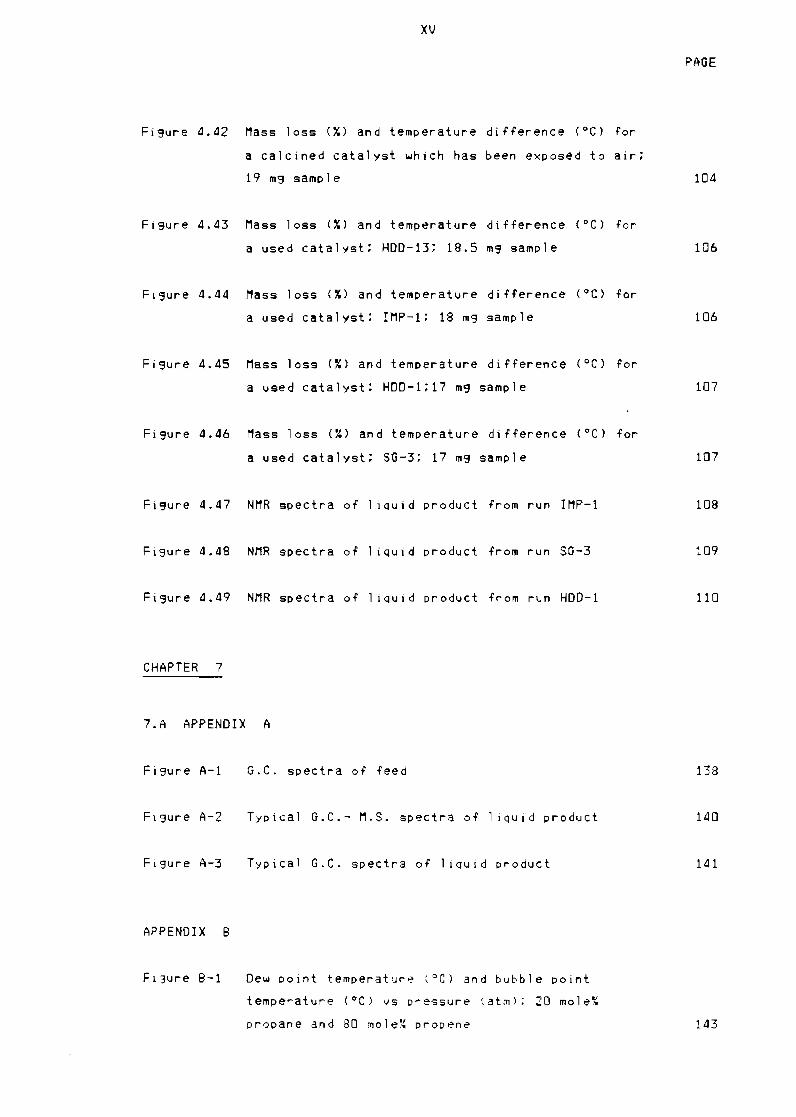
Fi~ure 442 Mass loss (~) and temperature difference (OC) for
a calcined catalyst which has been exposed to air
19 m~ sample
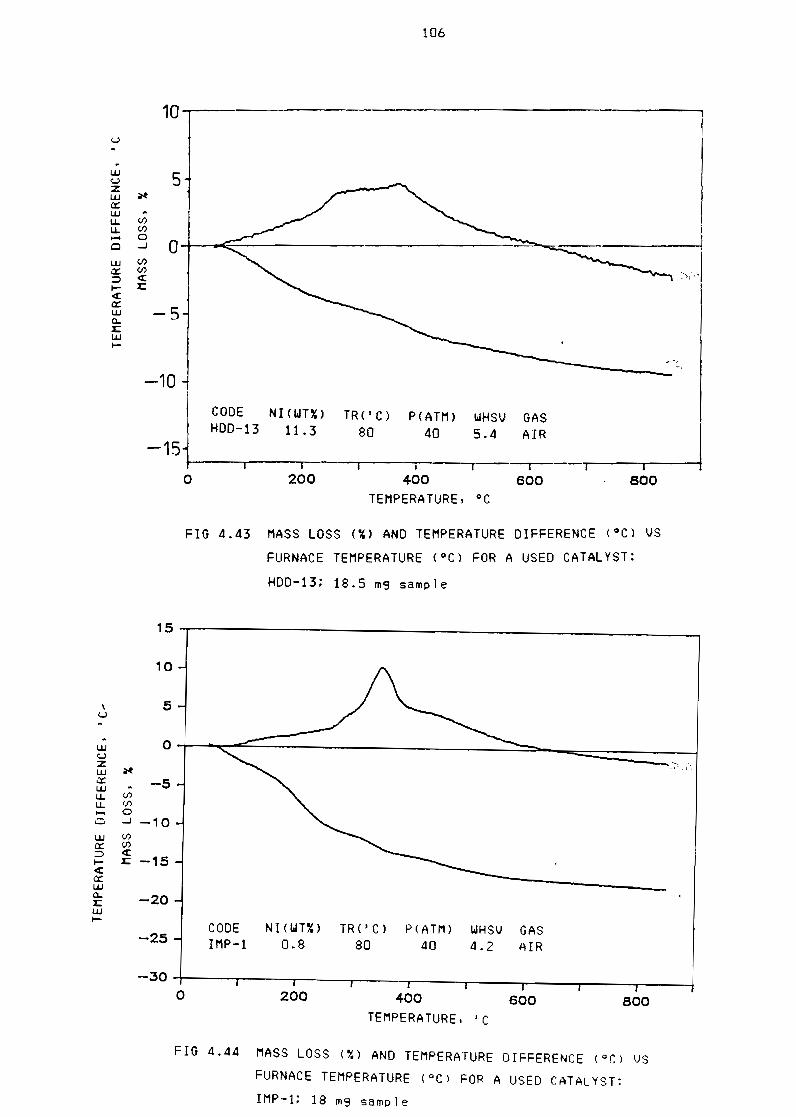
Fi~ure 443 Mass loss (~) and temperature difference (OC) for
a used catalyst HDD-13 185 mg sample 106
Figure 444 Mass loss (X) and temperature difference (OC) for
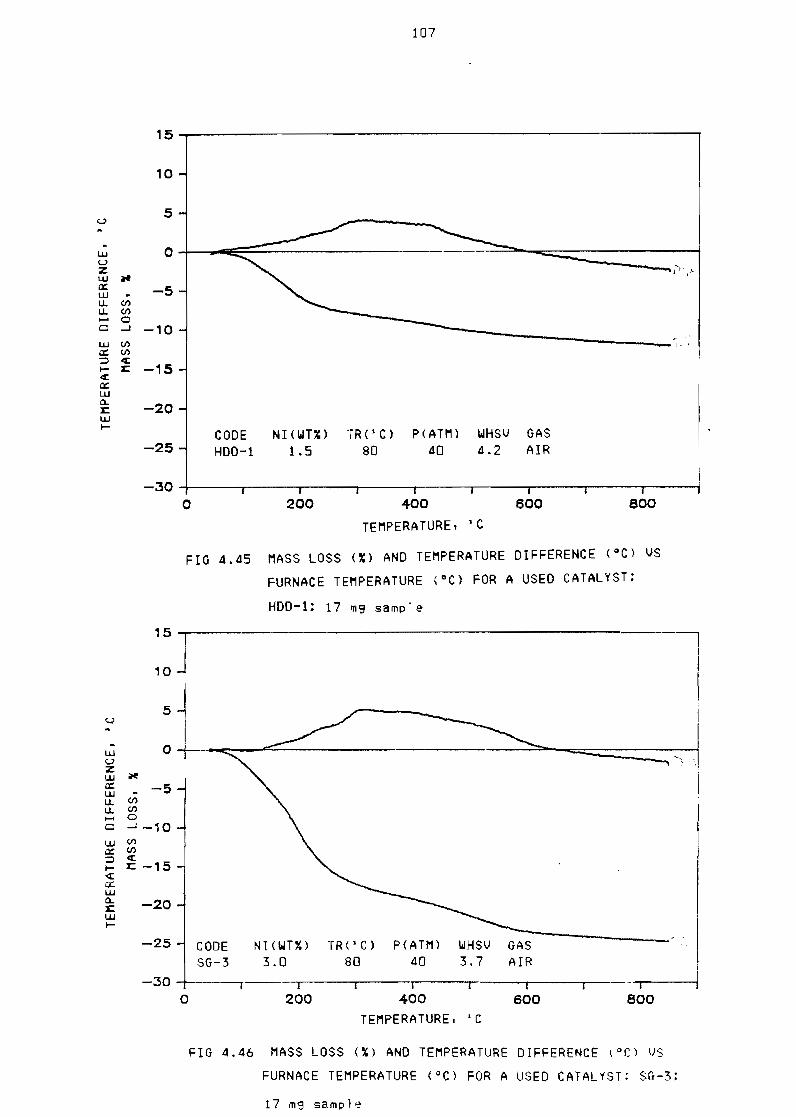
Figure 445 Mass loss (X) and temperature difference (OC) for
Figure 446 Mass loss (~) and temperature difference (OC) for
a used catalyst IMP-1 18 mg sample 106
a used catalyst HDD-l17 m9 sample 107
a used catalyst SG-3 17 m9 sample 107
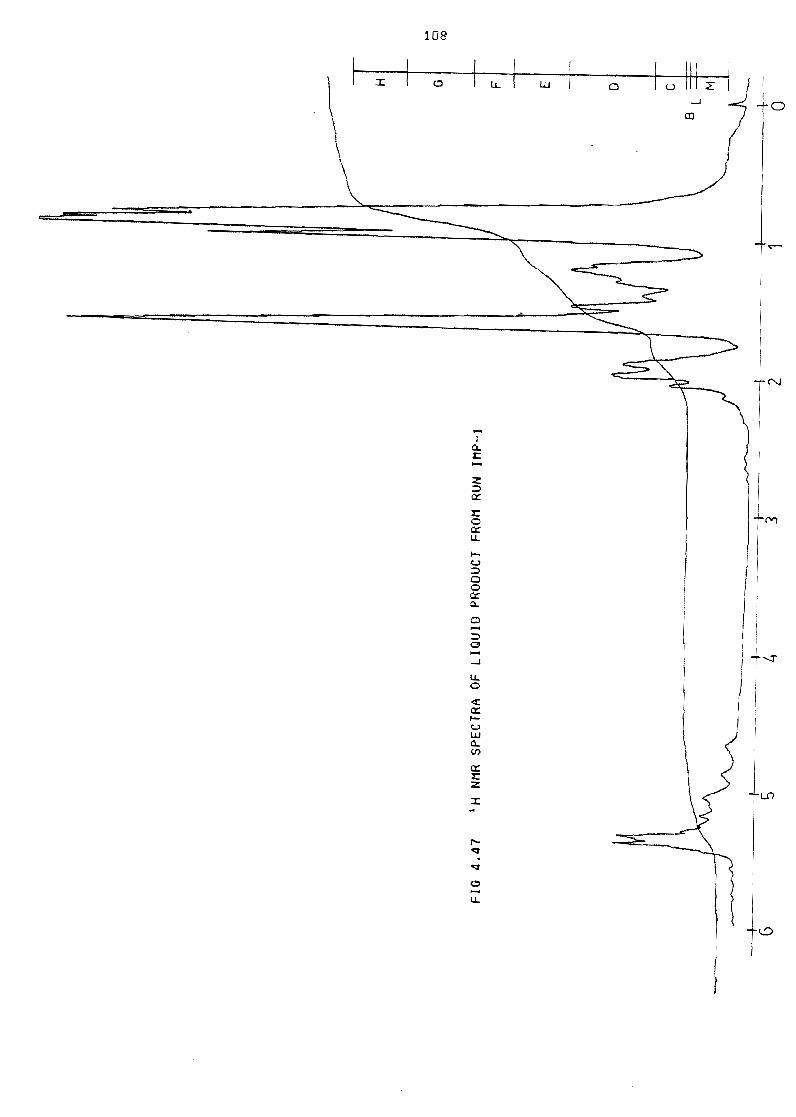
Figure 447 NMR spectra of 1 iquid product from run IMP-l 108
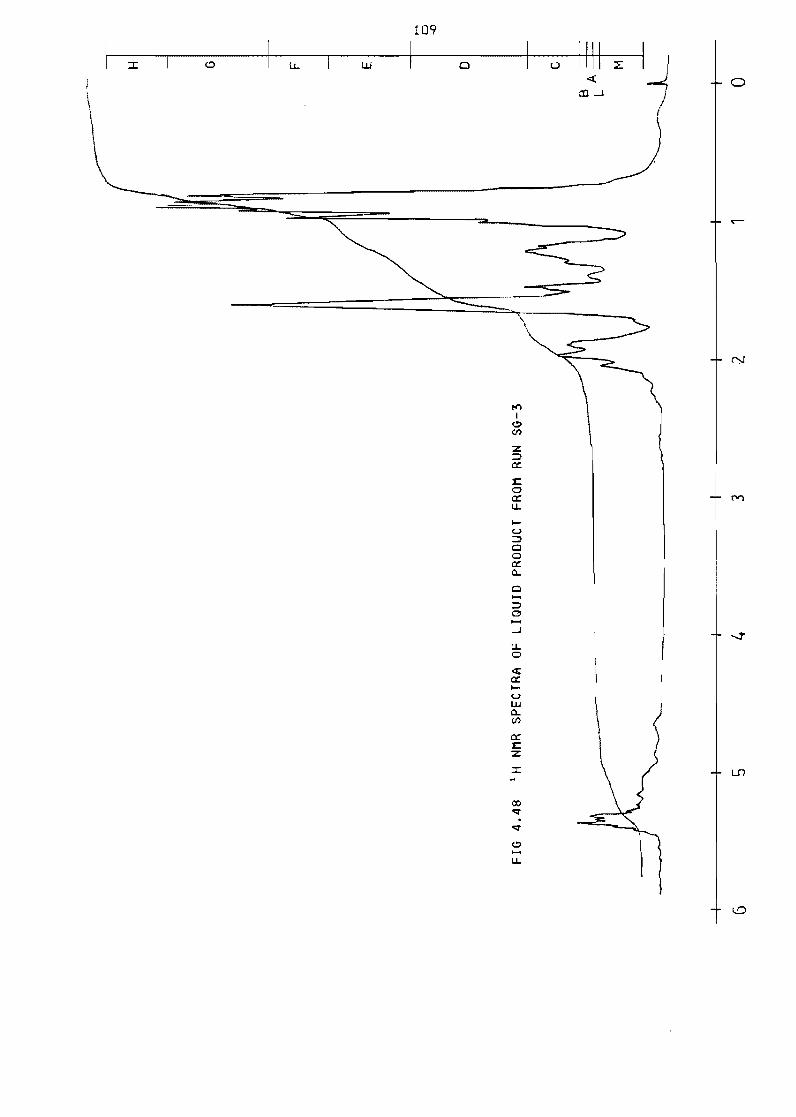
Fi~ure 448 NMR spectra of liquid product from run SG-3 109
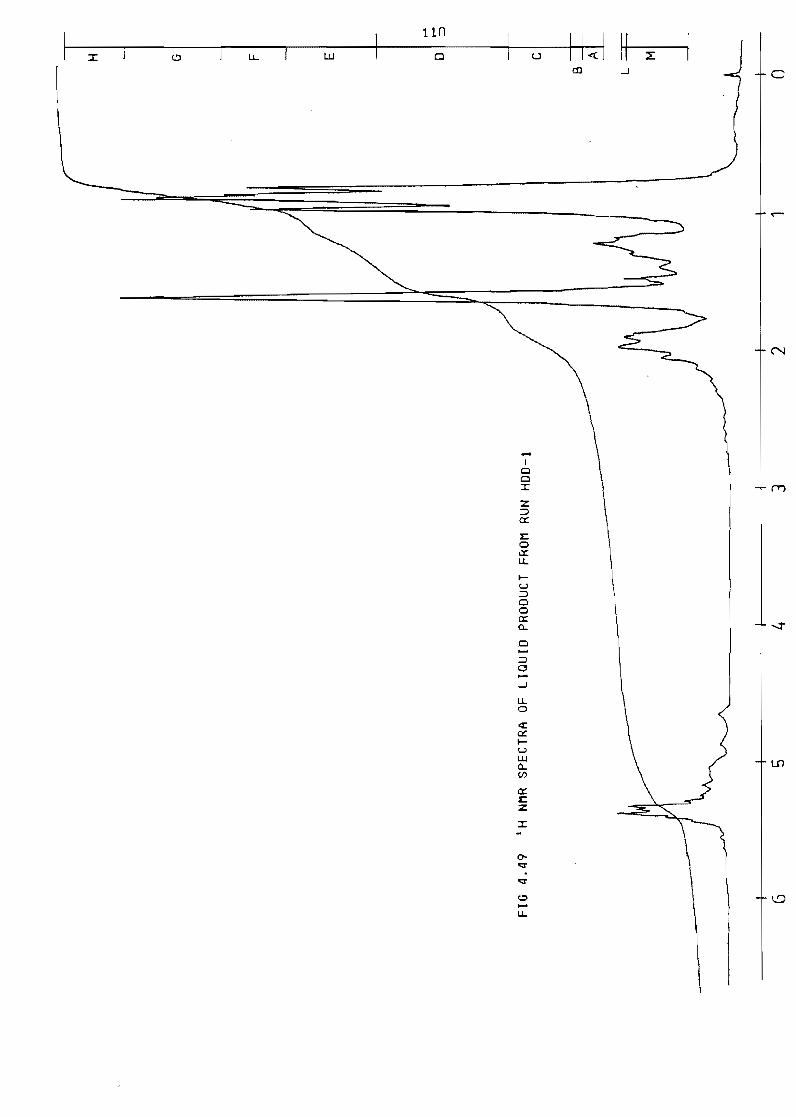
Figure 449 NMR spectra of liquid product from run HDD-l 110
CHAPTER 7
7A APPENDIX A
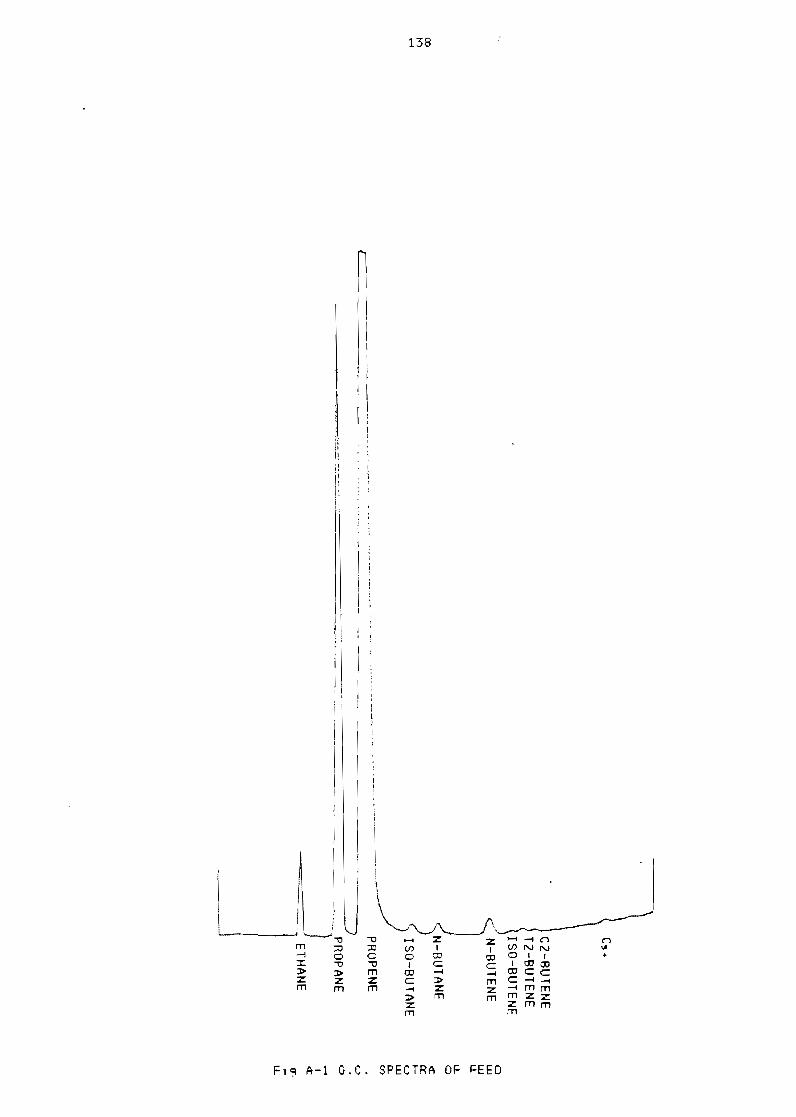
Figure A-I GC spectra of feed 138
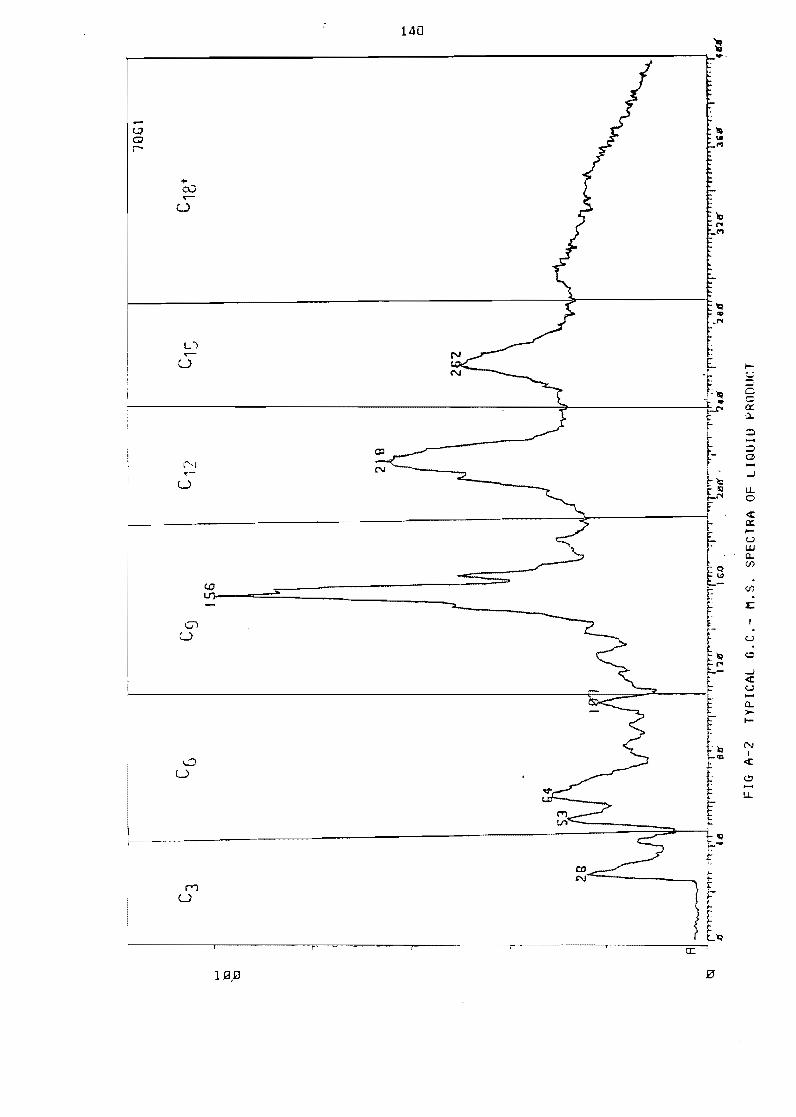
Figure A-2 Typical GC- MS spectra of 1 iquid product 140
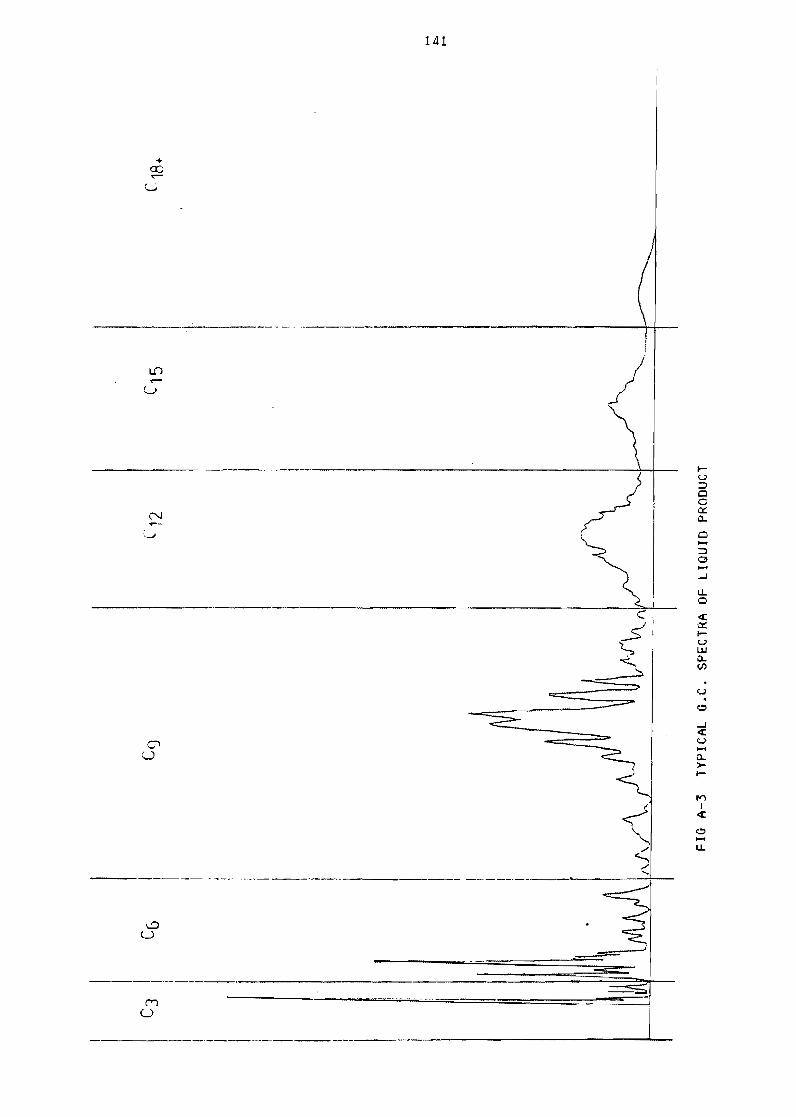
Figure A-3 Typical GC spectra of liquid product 141
APPENDIX B
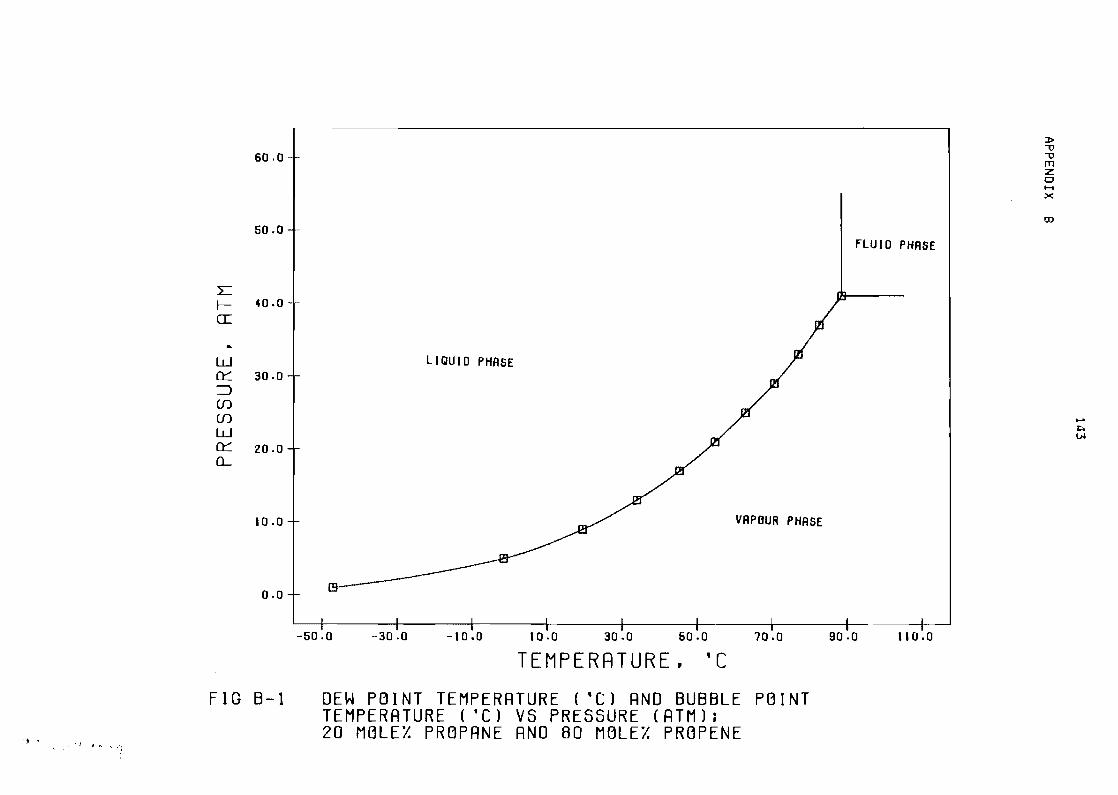
Figure B-1 Dew point temperatYre (OCI and bubble point
temperature (OC) vs pressure (atm) 20 mole~
propane and 80 mole~ propene 143
XVI
LIST OF TABLES
PAGE
CHAPTER 1
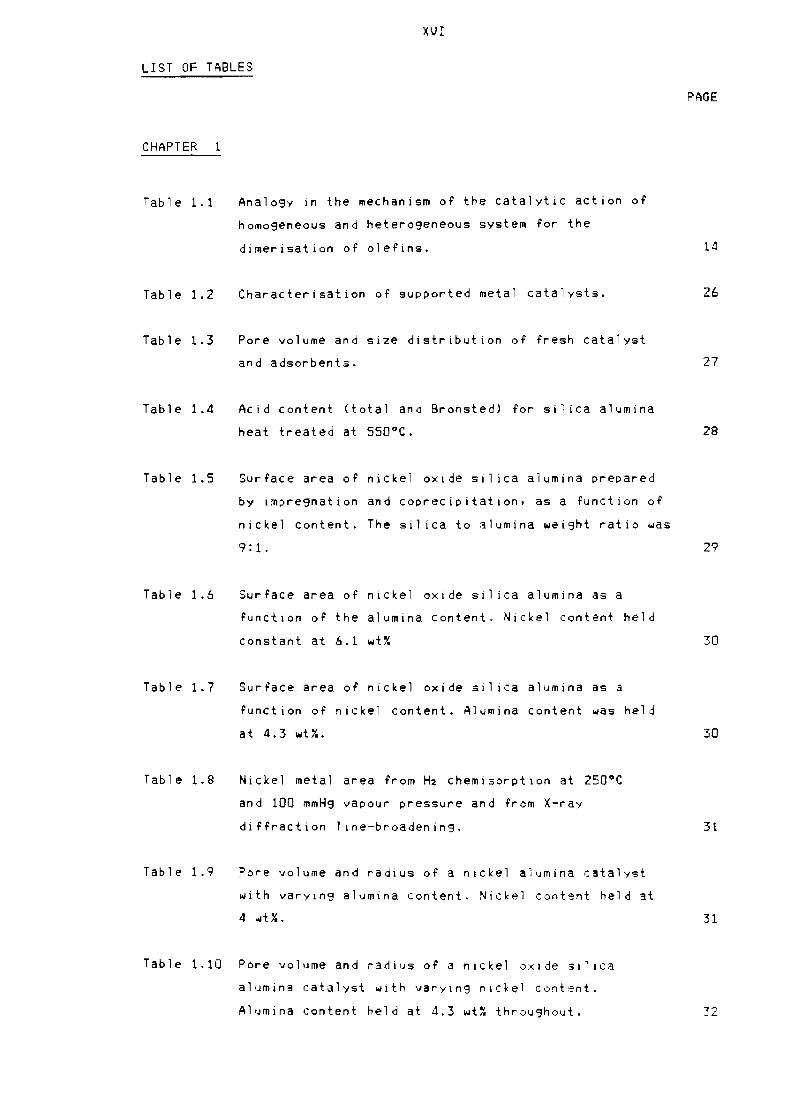
Table 11 Analogy in the mechanism of the catalytic action
homogeneous and heterogeneous system for the
dimerisation of olefins
of
14
Table 12 Characterisation of supported metal catalysts 26
Table 13 Pore volume and
and adsorbents
size distribution of fresh catalyst
27
Table 14 ACid
heat
content
treated
(total and
at 550degC
Bronsted) for silica alumina
28
Table 15 Surface area of nickel oxide sil ica alumina prepared
by Impregnation and coprecipitation as a function of
nickel content The si1 ica to alumina weight ratio was
91 29
Table 16 Surface area of nickel oxide si1 ica alumina as a
function of the alumina content Nickel content held
constant at 61 wtr 30
Table 17 Surface area of nickel oxide si1 ica
function of nickel content Alumina
at 43 wtr
alumina
content
as a
was held
30
Table 18 Nickel metal area from H2 chemisorption at 250degC
and 100 mmHg vapour pressure and from X-ray
diffraction 1 ine-broadening 31
Table 19 Pore volume and radius of a nickel aiumina ratalyst
with varYing alumina content Nickel content held at
4 wtx 31
Table 110 Pore volume and radius of a nickel oxide si1 ica
alumina catalyst with varYlng nlckel content
Alumina content held at 43 wtX throu9hout 32
XVII
PAGE
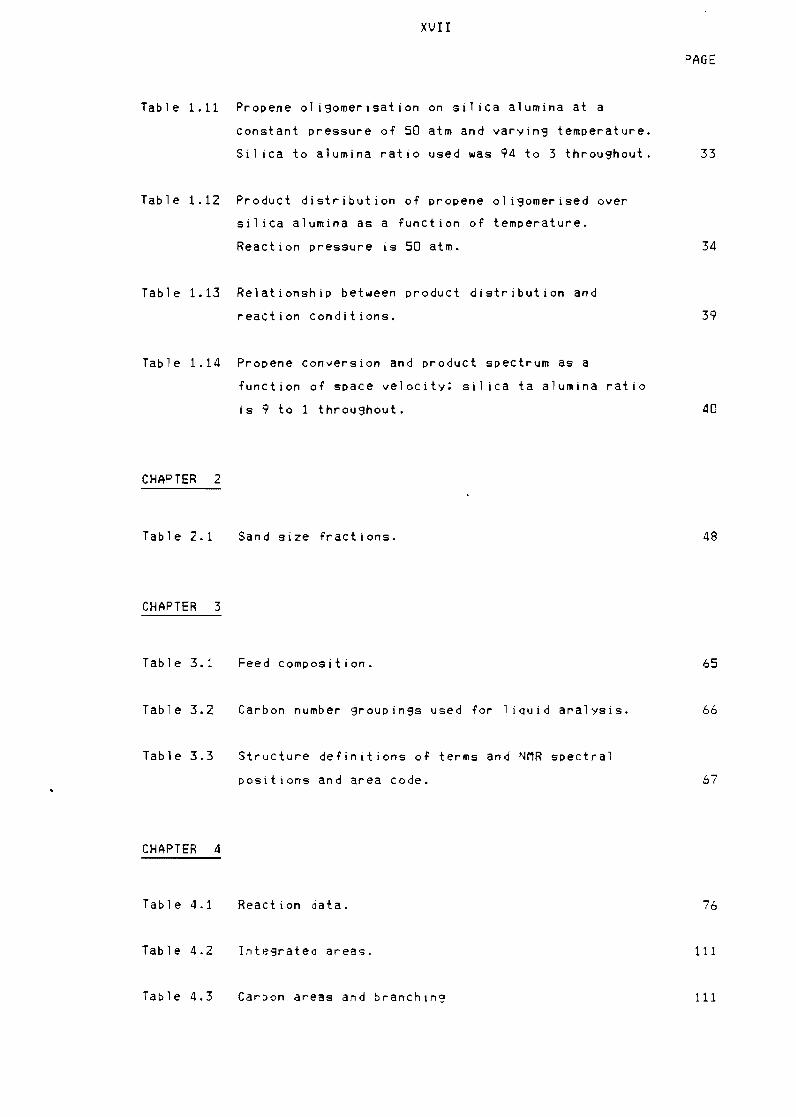
Table 111 Propene 01i90merisation on silica alumina at a
constant pressure of 50 atm and varyin9 temperature
Sil ica to alumina ratio used was 94 to 3 throu9hout 33
Table 112 Product distribution of propene 01 i90merised over
sil ica alumina as a function of temperature
Reaction pressure is 50 atm 34
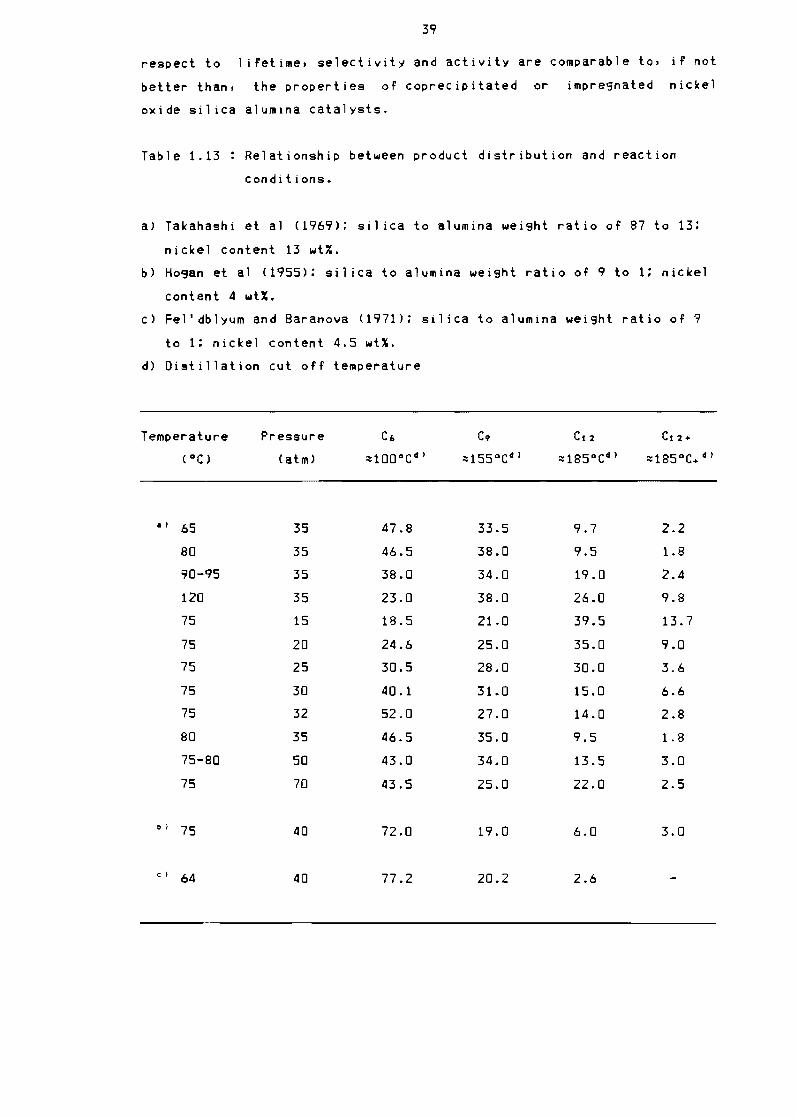
Table 113 Relationship between product distribution and
reaction conditions 39
Table 114 Propene conversion and product spectrum as a
function of space velocity silica ta alumina ratio
is 9 to 1 throu9hout 40
CHAPTER 2
Table 21 Sand size fractions 48
CHAPTER 3
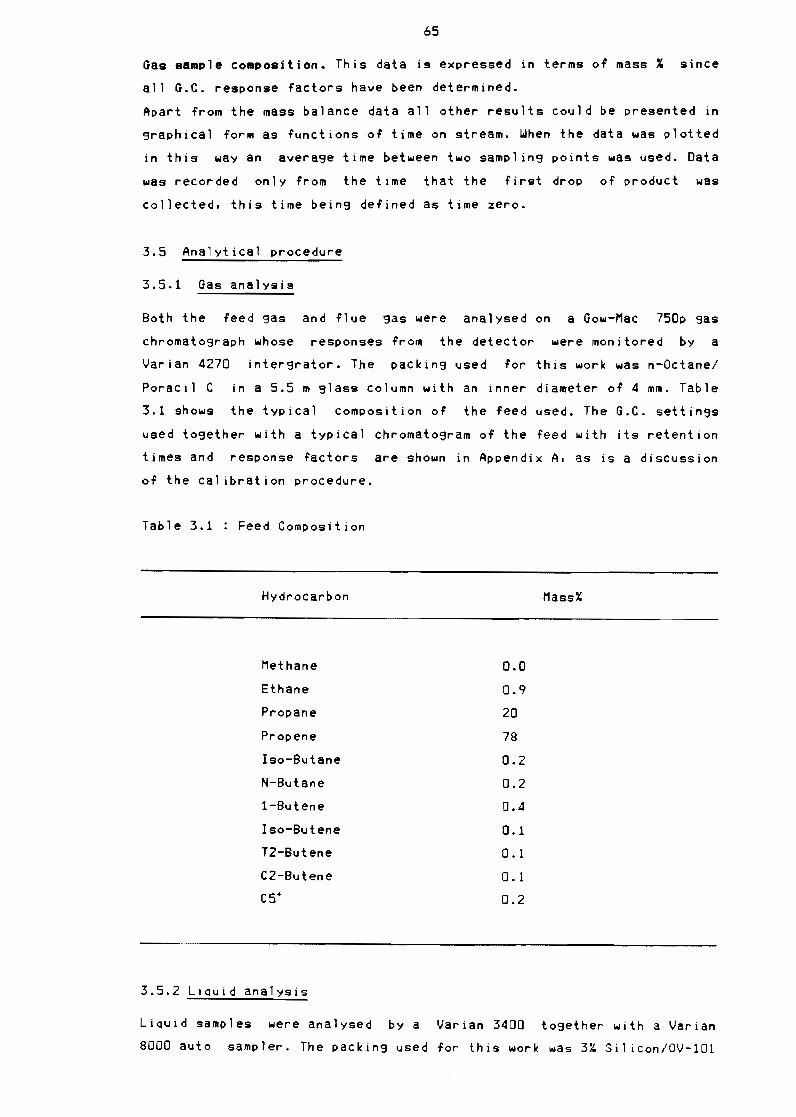
Table 31 Feed composition 65
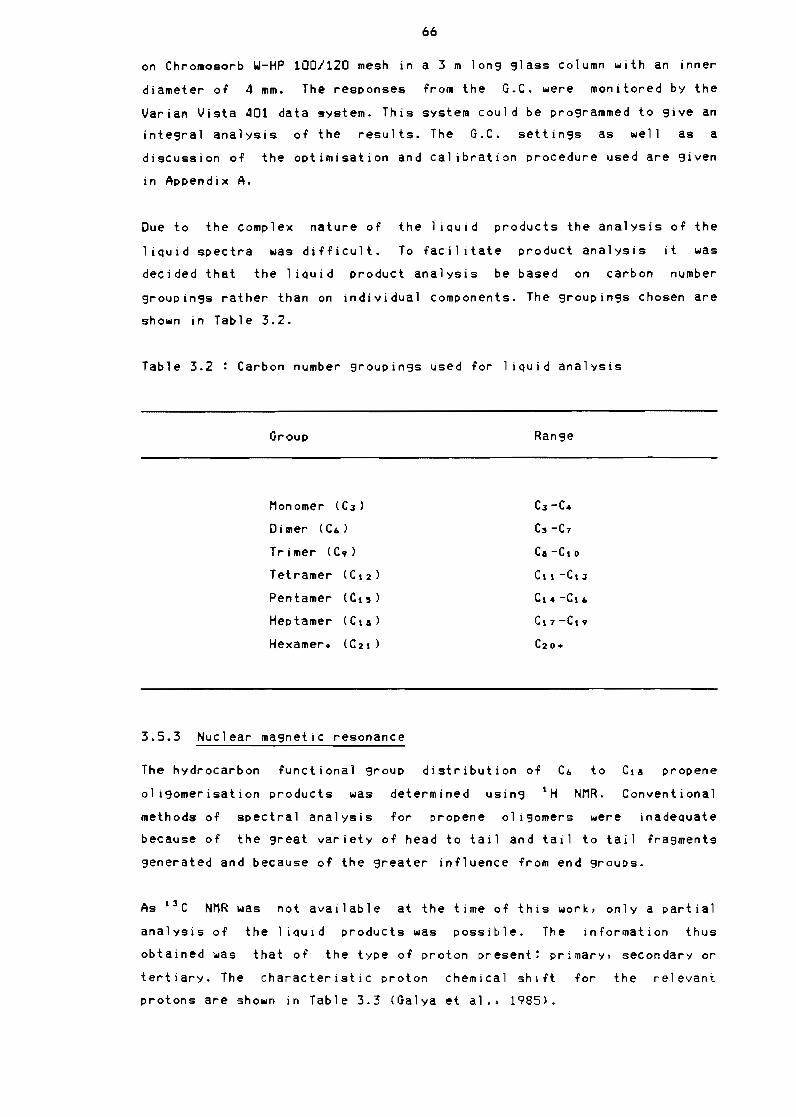
Table 32 Carbon number groupings used for 1 iQuid analysis 66
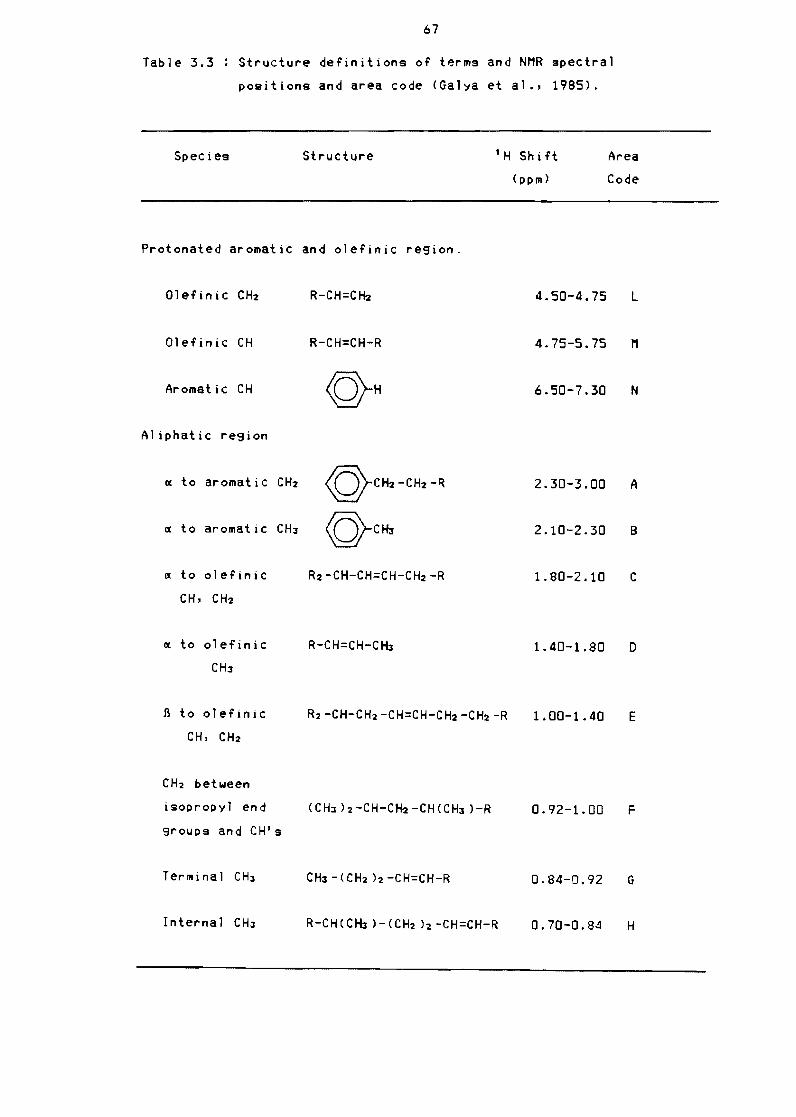
Table 33 Structure definitions of terms and NMR spectral
positions and area code 67
CHAPTER 4
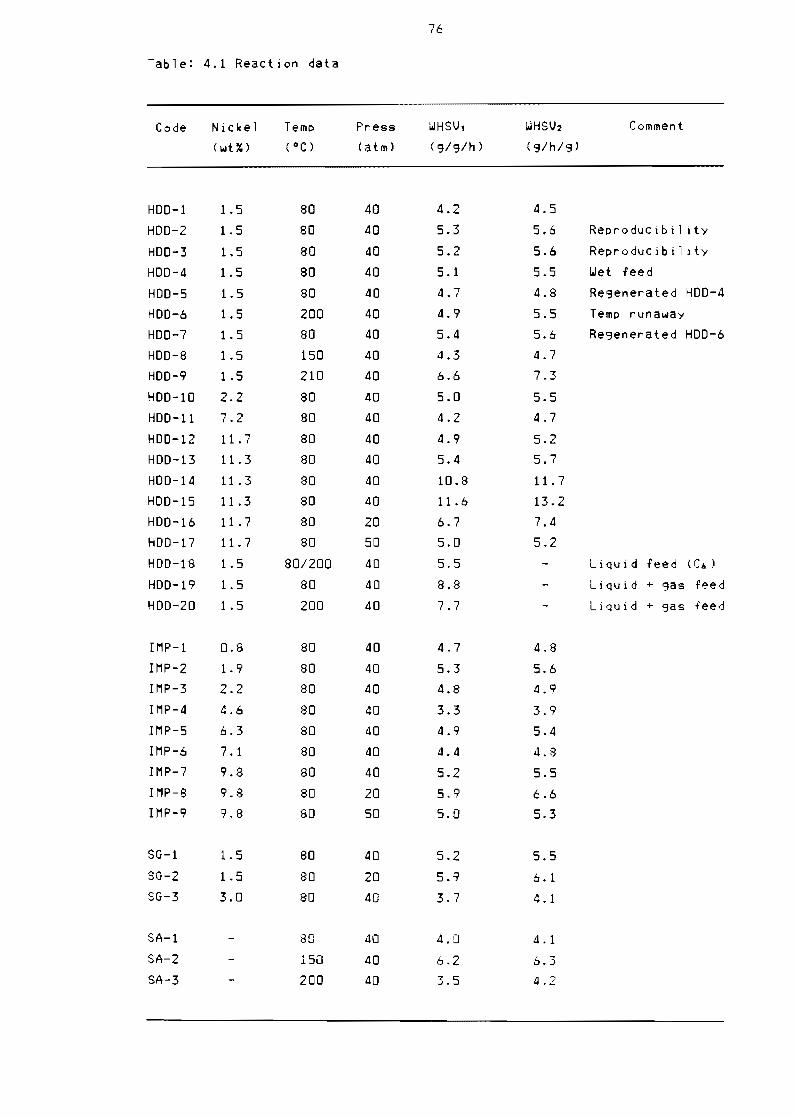
Table 41 Reaction data 76
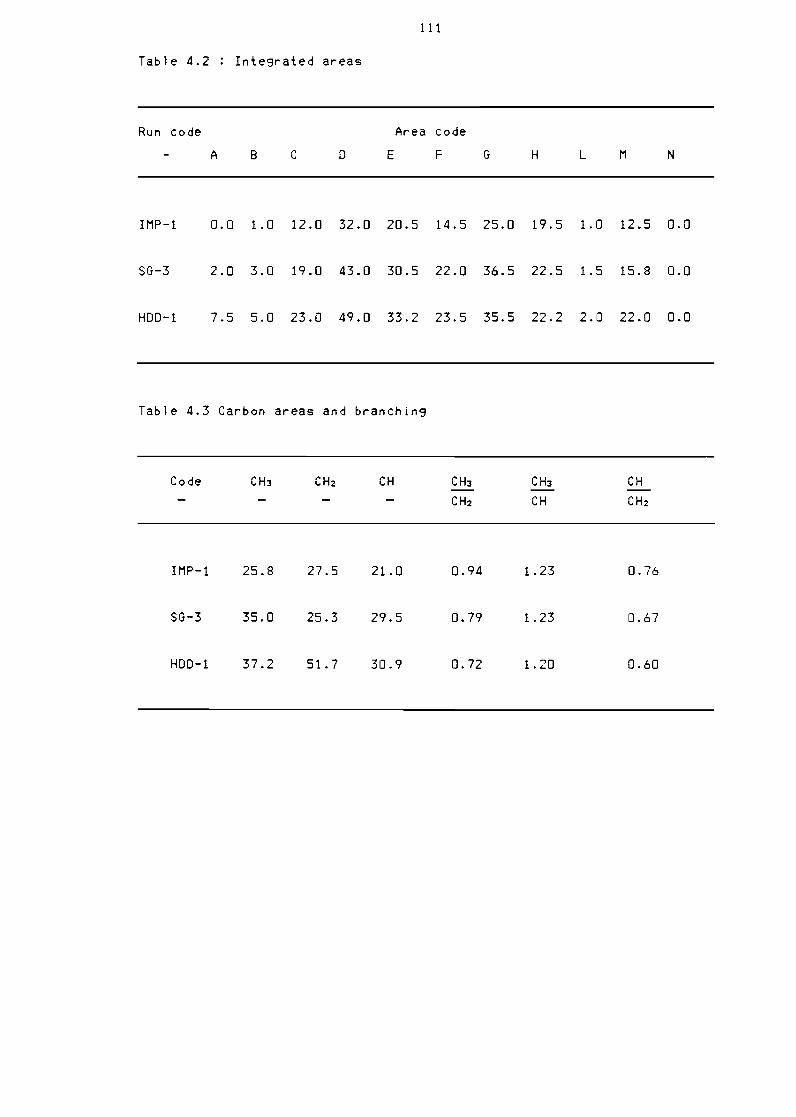
Table 42 Integrated areas 111
Table 43 Carbon areas and branching 111
XVIII
PAGE
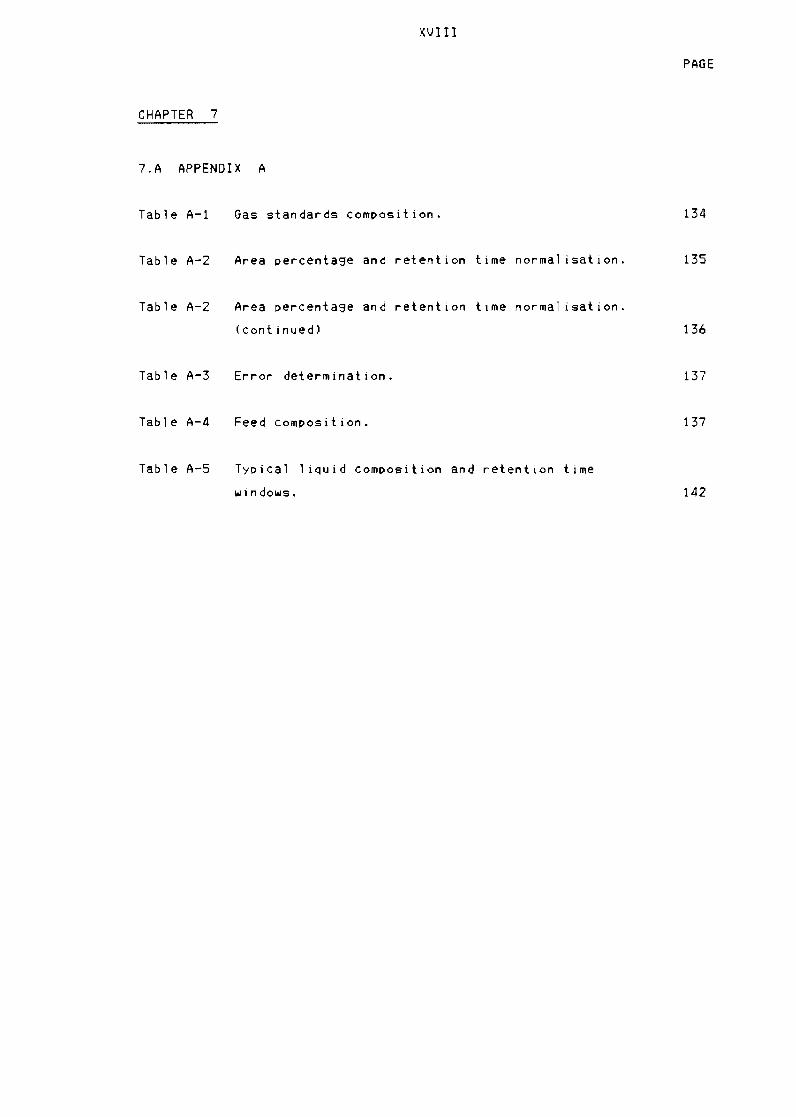
CHAPTER 7
7A APPENDIX A
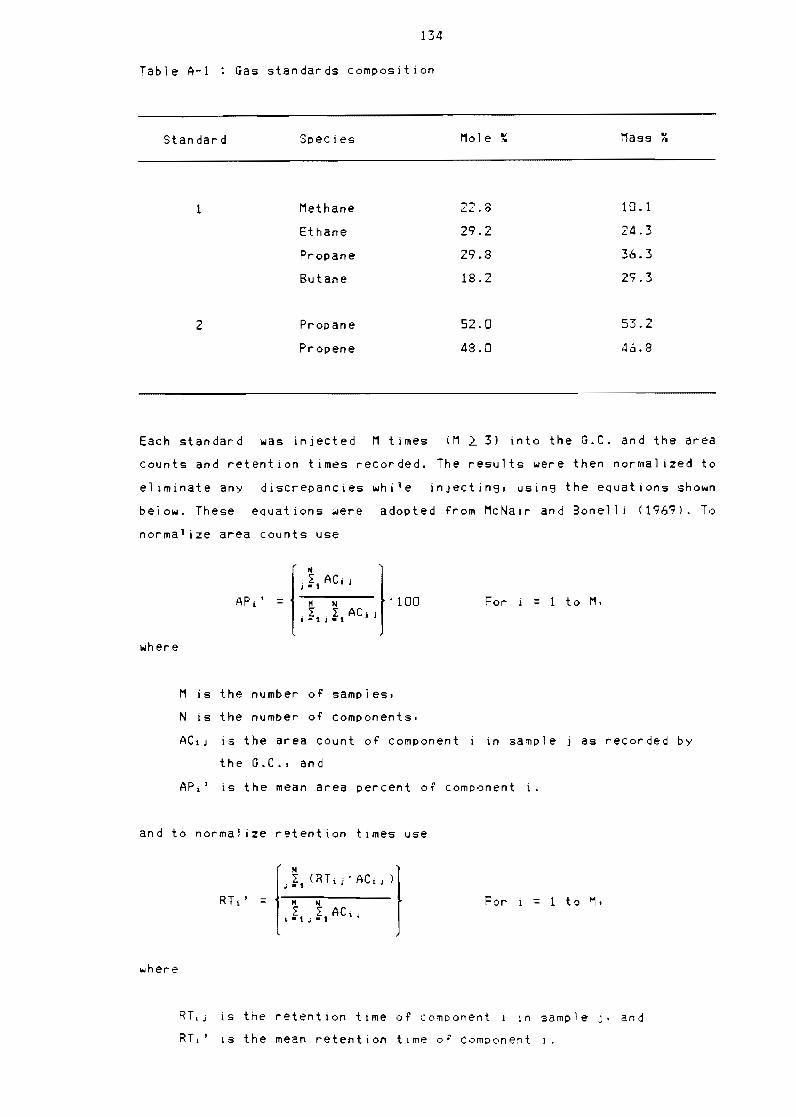
Table A-1
Table A-2
Table A-2
Table A-3
Table A-4
Table A-5
Gas standards composition
Area percentage and retention
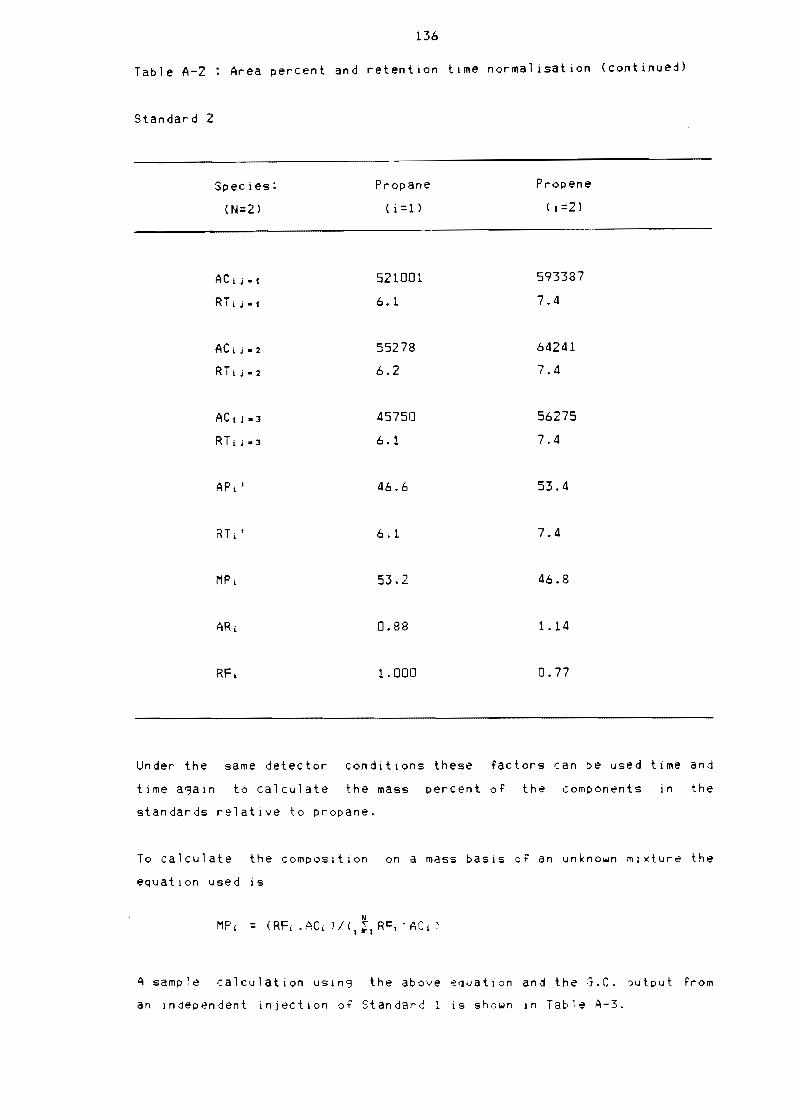
Area percentage and retention
(continued)
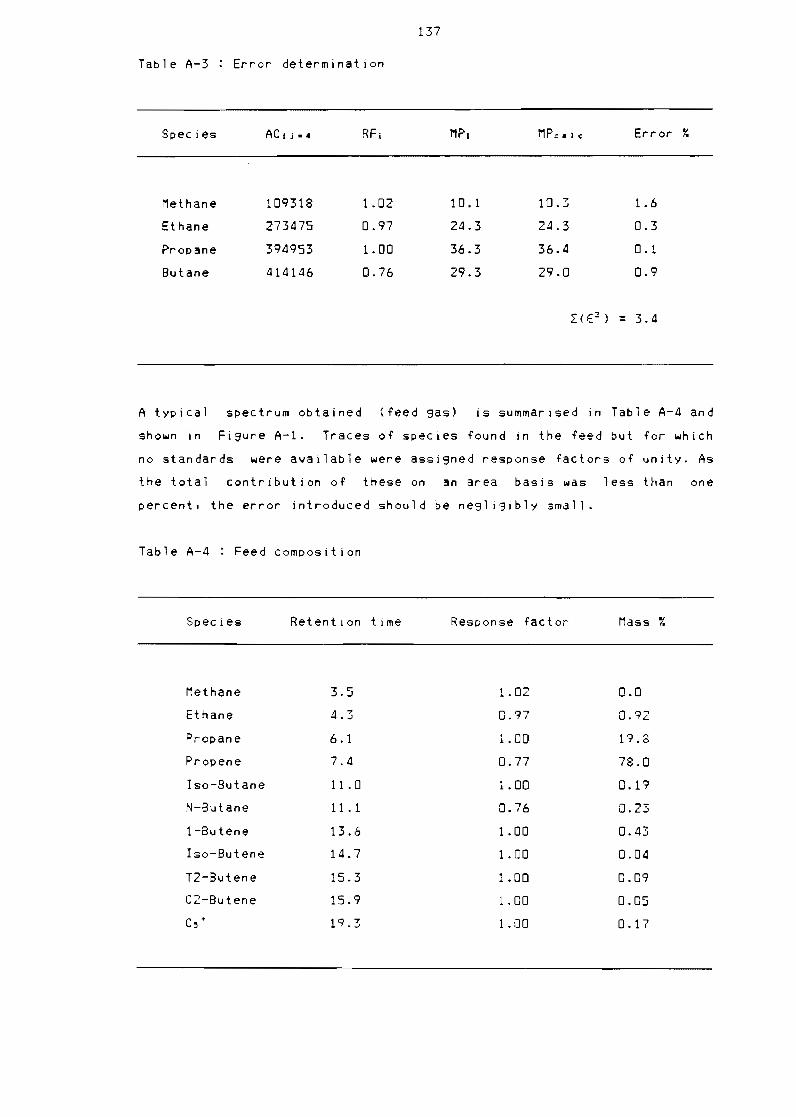
Error determination
Feed composition
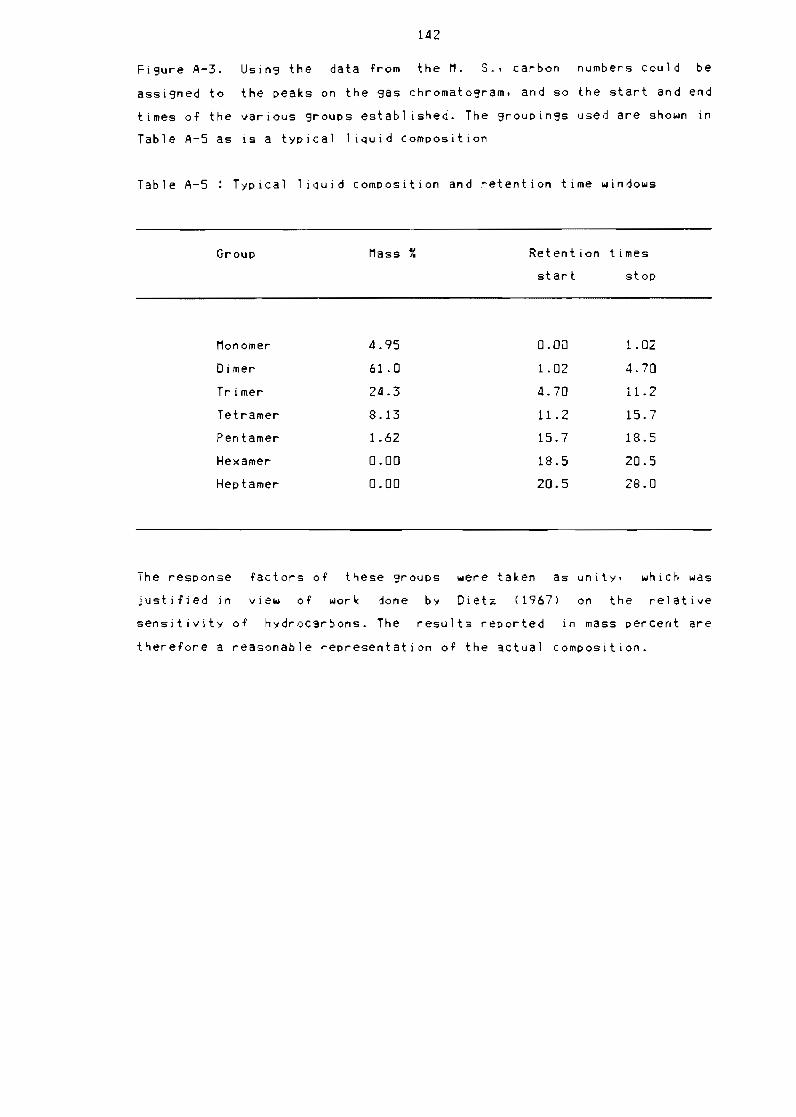
Typical 1 iQuid composition and
windows
134
time normal isation 135
time normal isation
136
137
137
retention time
142
1
1 INTRODUCTION
In South Africa the oil from coal industry has developed the first
commercial process whereby sYnthetic fuels are produced from coal via
gasification usin9 Fisher Tropsch catalysts It started In 1943 when the
AmerIcan rights to the Fischer Tropseh process were purchased by South
A f ric a I n 191 0 the Sou t h Af I i can 0 i 1 C0 a 1 and Gas C() r p 0 r a ti (gt n (S A S 0 Ll
was formed The first plant Sasol I with a capaCity of 4130 barrelsday
went into opel-atlon in 1954 (OUtkUW1CZ 1981ll It used two type of
reactors namelv the Arge fixed bed and synthol fluidlsed bed reactors
Two further plants Sasol II and Sasol III which are Improved and
enlarged versions of Sasol I wert later built eAch having i3 CClfacit (f
35900 barrelsday (Dutkuwicz) 1980) In both of these planl~ onl~ the
synthol reactors are used Due to th~ nature of ihe process Sasol
pr oduces 1ar3e Quant It i es of 1 i ght hvdr ocar bon gilSfS anoun t i n3 to
approximatelv 15-106 mZday These are partly r~tlculated to local
i n d us try and par tl y Con v e r ted I 1 a a cat a 1 yt I C (middot1 i 30 rr euro r I s d ion p r (J C esst (gt
1 i 9h t f IJ e1sth euro r eby inc r e a s Jr13 the 0 I er I 1 r) r (l dII ~t Ion I n t e r mS 0 f
barrels of I iquld fuel produced per ton of coal procESSE-d Currentll
Sasol I can more than satisfv he loal dernnd dnj therefol~ the light
hydrocarbons from Sasol II and Sas()l III represent elaquo~s Buppl
The catalvtic oli90merisation process referred to abrve ISPS the
conventional phosphoric Reid catalyst to oli30fllPrisE lhe light
hydrocarbons to 1 iquid fuels This process howltver ~Ir(gtdIJCeS poor qlal ity
pet r 0 I and dies e I and the (a tal s tis C (I r r lt) s i v
The present study investigated an alternative catalyst For the catalytic
oligomerisation of li3ht hydrocarbons to 11qllid fllel Ilsin3 a nickel
oxide sil iea alumina catalyst synlhesls~d via methorl adopt0d by the
aulhor from (gtlork done bi van Dillen el 031 ()976) Al1l()lgh rlikel (Idne
SilIca alumina catalysts have Geen Ideli stldied (Tahahashi et a1
1969 Hogan et al 195 Holm 1917 [tt) the- ltgtrthe=~ fII~~H)d
developed in this work will produced a moreuro HC t i ve
catalyst With greater resistance to deactivation and greater selectivity
to linear C6 than those recorded f()r nickel oxide silica alJroina
catalysts produced viB the standard impregnation technIQue In this way
it is hoped to produce a beUer qual ity diesel than p~ssjble over the
standard irnprelnated nickel oxi de i I ica alumln1
2
11 Heterogeneous catalysis
As the silica alumina support in a nickel oxide silica alumina catalyst
is a catalytically active solid oxide insulator its catalytic properties
as well as those of nickel oxide on silica alumina have to be examined
In what ollows a brief review 0 the catalytic properties 0 both is
given
The oxides and halides of the lower elements of sroups III IV and V of
the periodiC table tend to cata1yse pOSitive ion or acid type
reactions such as polymerisation alkylation cracking and
isomerisation One of the most active solid oxide insulators is siliCa
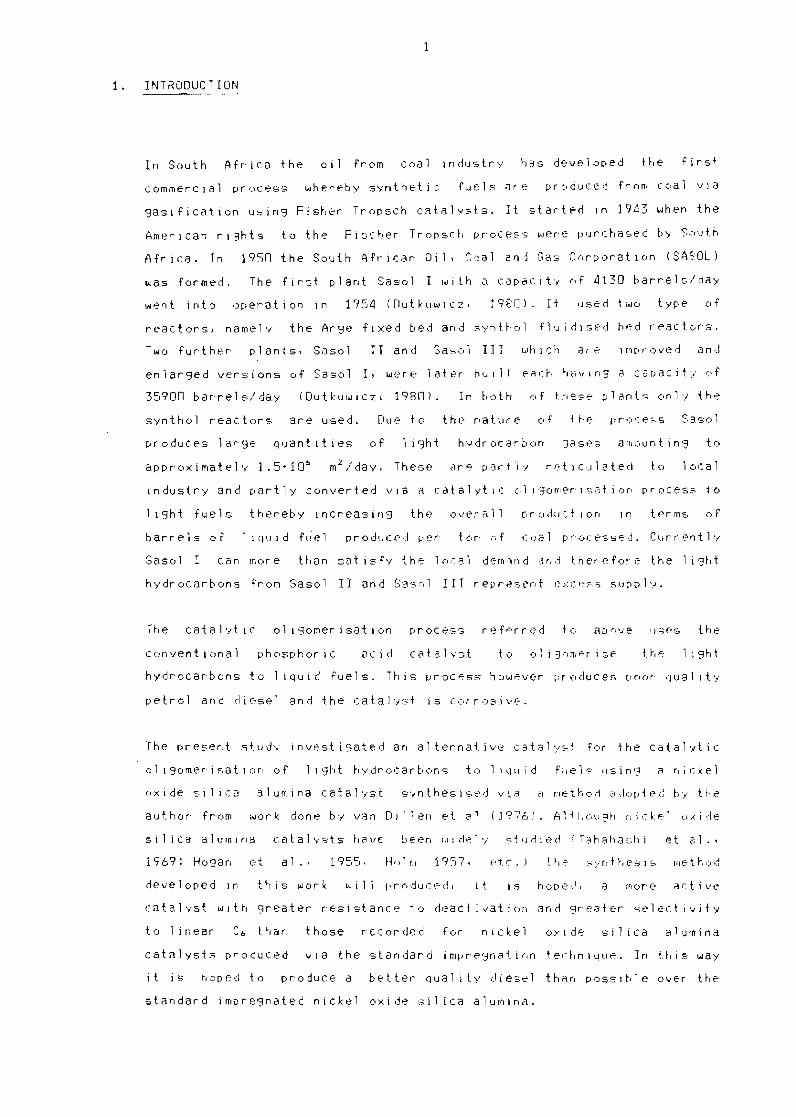
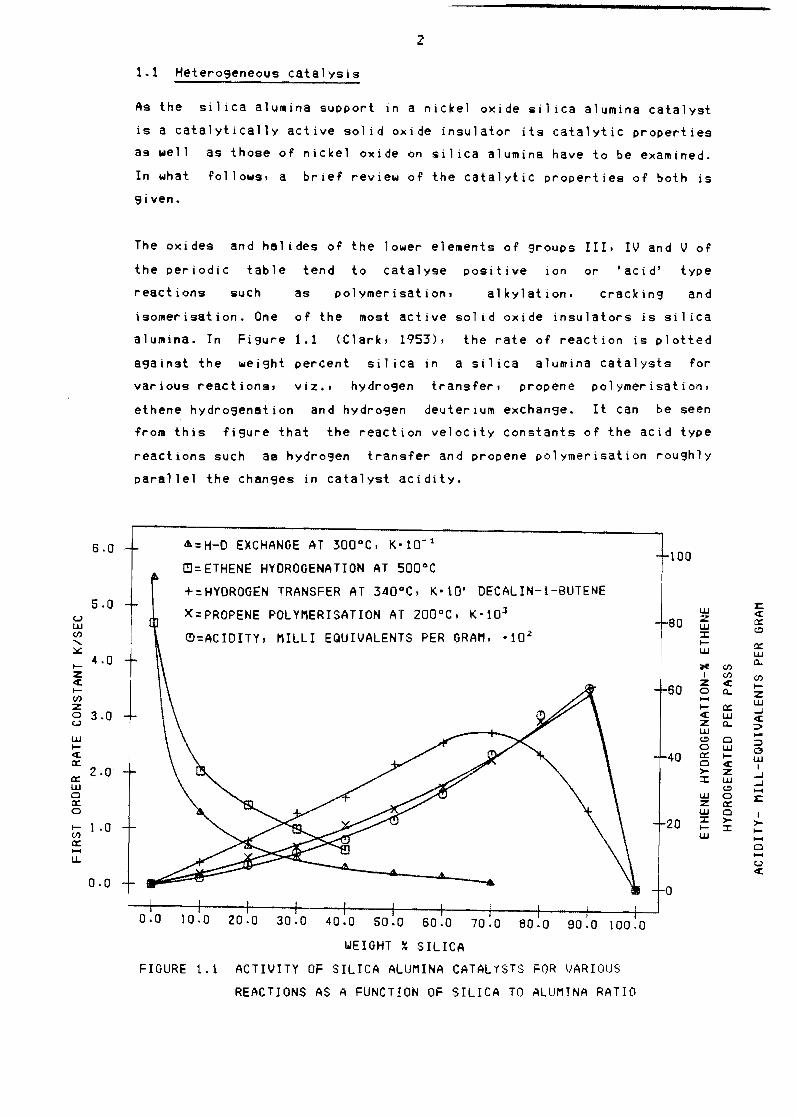
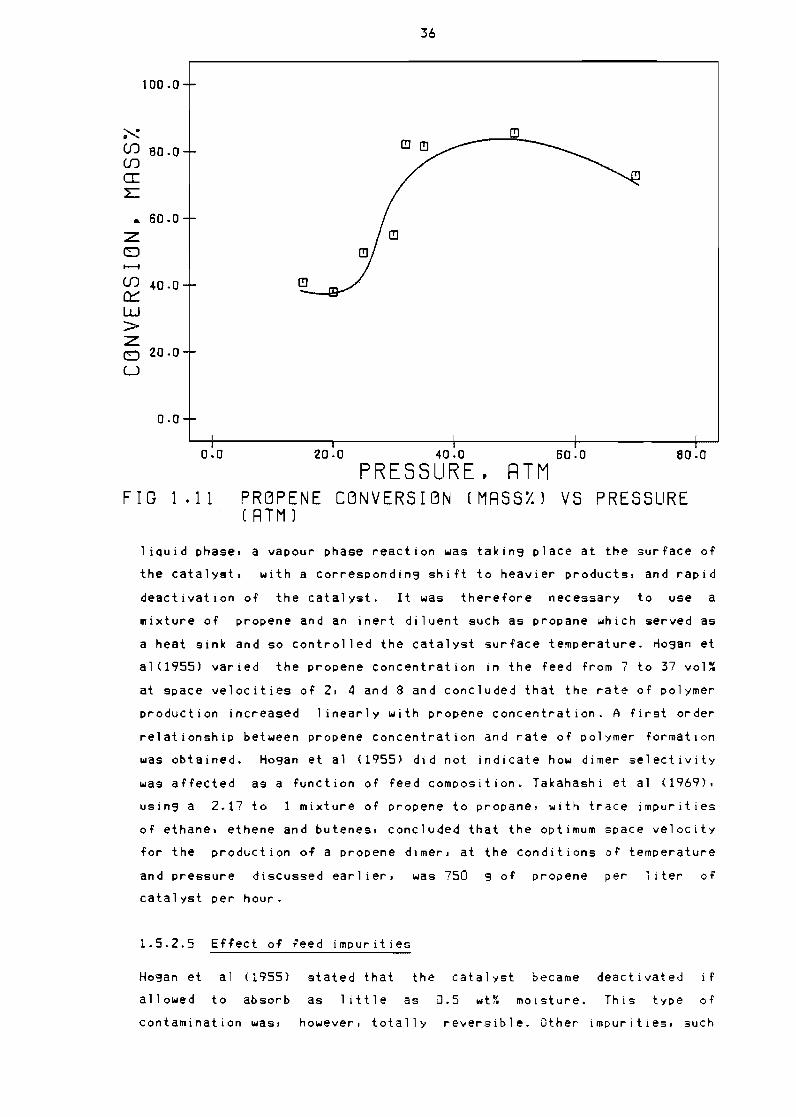
alumina In Fi9ure 11 (Clark 1953) the rate of reaction is plotted
against the weight percent sil ica in a silica alumina catalysts for
various reactions viz bullbull hydrogen transfer propene polymerisation
ethene hydrogenation and hydrogen deuterium exchange It Can be seen
from this figure that the reaction velOCity constants of the acid type
reactions such as hydrosen transfer and propene polymerisation roughly
parallel the changes in catalyst acidity
~=H-D EXCHANGE AT 300degC K-10- t
~=ETHENE HYDROGENATION AT 500degC
+=HYDROGEN TRANSFER AT 340degC K-l0 DECALIN-l-BUTENE
X=PROPENE POLYMERISATION AT 200degC K-l0 J
60
50 u UJ ()
shy I- 40 z ~ lshy()
Z o 30 u
UJ Ishy~ 0
200 UJ 0 0 0
I- 10 ()
0 U
00
00
~=ACIDITY MILLI EQUIVALENTS PER GRAM middot10~
I
700 800 900 1000100 200 300 400 500 600
WEIGHT ~ SILICA
FIGURE 11 ACTIVITY OF SILICA ALUMINA CATAL1STS FOR VARIOUS
REACTIONS AS A FUNCTION OF SILICA TO ALUMINA RATIO
100
xUJ- ~ 060 -UJ ltII
Ishy 0UJ UJ Qltre ()
I () ()z ~ Ishy60 0 Q z UJI- 0 - ~ UJ ~ Z Q gtUJ ltI 0 gt 0 Ishy UJ40 0 UJ 0 ~ Igt- Z -I UJ - ltI UJ 0 xZ 0 UJ 0 II gtshy20 I- gtshyI IshyUJ
0-u ~
o
3
The reactions which occur readily on the transition metal oxides such
as hydrogen-deuterium exchange which gives a reasonably good indication
of hydrogenation-dehydrogenation activity and ethene hydrogenation
proceed slowly even on pure alumina and the rate decrease to
insignificant values with increasing si1 ica content Conversely
transition metals are poor catalysts for aCid-type reactions
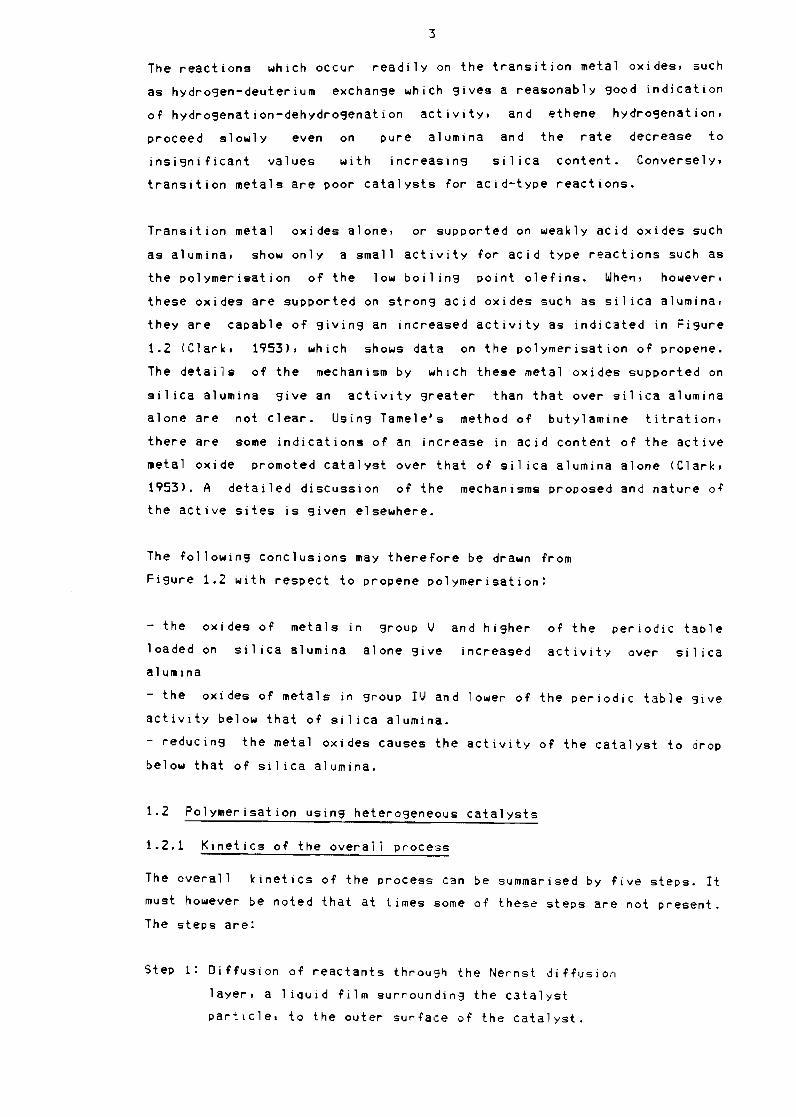
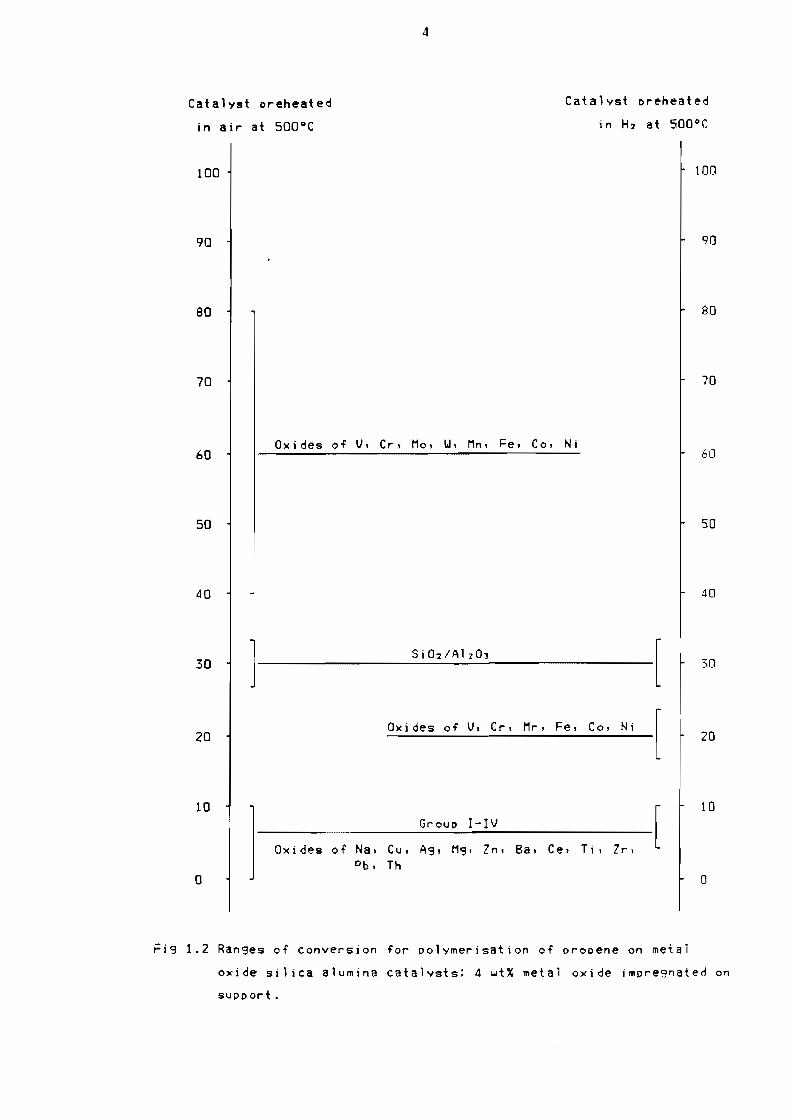
Transition metal oxides alone or supported on weakly acid oxides such
as alumina show only a small activity for acid type reactions such as
the polymerisation of the low boiling point olefins When however
these oxides are supported on strong acid oxides such as silica alumina
they are capable of giving an increased activity as indicated in Figure
12 (Clark 1953) which shows data on the po1ymerisation of propene
The details oT the mechanism by which these metal oxides supported on
silica alumina give an activity greater than that over sil ica alumina
alone are not clear Using Tame1es method of butylamine titration
there are some indications oT an inCrease in acid content of the active
metal oxide promoted catalyst over that of silica alumina alone (Clark
1953) A detailed discussion of the mechanisms proposed and nature of
the active sites is given elsewhere
The following conclusions may therefore be drawn from
Figure 12 with respect to propene polymerisation
- the oxides of metals in group V and higher of the periodiC table
loaded on silica alumina alone give increased activity over silica
alumina
- the oxides of metals in group IV and lower of the periodiC table give
activity below that of sil ica alumina
- redUCing the metal oxides causes the activity oT the catalyst to drop
below that of silica alumina
12 Polymerisation using heterogeneous catalysts
121 Kinetics of the overall process
The overall kinetics of the process can be summarised by five steps It
must however be noted that at times some of these steps are not present
The steps are
Step 1 Diffusion of reactants through the Nernst diffusion
layer a 1 iquld film surrounding the catalyst
particle to the outer surface of the catalyst
4
Catalyst preheated Catalyst oreheated
in H at 500degCin air at 500degC
100100
9090
so80
7070
Oxides Ot V Cr Mo ~ Mn Fe Co Ni 6060
50so
ao40
SiOmiddotdAlzO 3030 1 [
Oxides ot V Cr Mr Fe Co Ni 2020 [ 10
Group I-IV
1 Oxides Ot Na Cu Ag M3 Zn Ba ICe Ti Z r bull
Pb Th
10
[ 00
Fig 12 Ranges Ot conversion tor polymerisation Ot oropene on metal
oxide silica alumina catalysts 4 ~t~ metal oxide impregnated on
support
5
Step 2 Penetration and diffusion of the reactants through
the blanket of graphitic carbon andor hydrocarbon
deposits to the internal surface and into the
unreacted core
Step 3 Reaction of the reactants at an active site
Step 4 Diffusion of the products through the unreacted core
and the blanket of graphitic carbon andor
hydrocarbon deposits back to the outer surface of
the solid
Step 5 Diffusion of the products through the fluid film
back into the main body of the fluid
The resistances of the different steps usually vary greatly from one
another The step with the highest resistance is considered to be the
rate controll ing step This rate controll ing step can often be
identified via simple tests (see Levenspiel 1972)
For optimum catalyst util isation a high matrix diffusivity is
desirable At any given condition if the rate of chemical reaction is
higher than the rate of diffusion reactants cannot be supplied fast
enough to the active site to establish an eQuil ibrium concentration The
reaction therefore oCcurs only in the outer shell of the catalyst
particles and a significant number of active sites inside the particle
are unused Large matrix diffusion resistance therefore results in
molecules reacting before they penetrate into the interior of the
catalyst particle The rate is then controlled by either film diffusion
or the rate of chemical reaction on the active surface whichever is the
slower step
The overall reaction rate is also influenced by the reaction
temperature The rate of diffusion however increases at a slower rate
than that of the chemical reaction and so at high temperatures pore
diffusion or film diffusion becomes the rate controll in9 step
Insufficient agitation and a hi9h viscosity of the solution can result
in large film thickness and hence favour a film diffusion controll in9
mechanism
6
122 Polymerisation
To date the most widely accepted mechanism for the polymerisation of
olefins is that proposed by Whitmore (1934) and involves the carbonium
ion One of the most pronounced characteristics of acid catalysed
reactions involving the carbonium ion is the lack of specificity
(Langlois 1953l Almost never is only a single product formed and even
under the mildest conditions a large number of compounds are formed
Schmerling and Ipatieff (1950) have distinguished two classes of
polymerisation true polymerisation in which the reaction prodycts are
mono-olefins with molecular weights intergral multiples of the monomer
molecular weight and Conjunct polymerisation in which the reaction
products are a complex mixture of olefinSt diolefins paraffins
naphthenes cyclo-olefins and aromatics Both will now be discyssed in
deb i 1
1221 True polymerisation
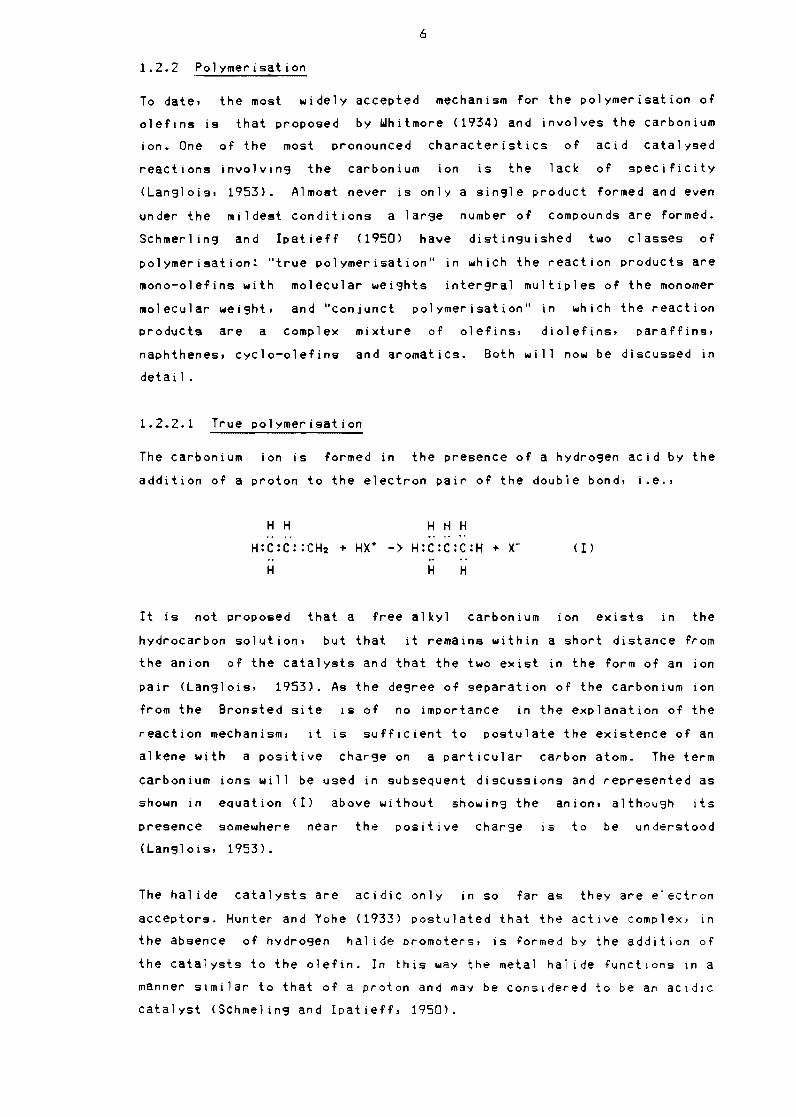
The carboniYm ion is formed in the presence of a hydrogen acid by the
addition of a proton to the electron pair of the double bond ie bull
H H H H H H C C C H2 + HX+ - gt H C C C H + X- ( I )
H H H
It is not proposed that a free alkyl carbonium ion exists in the
hydrocarbon solytion but that it remains within a short distance from
the anion of the catalysts and that the two exist in the form of an ion
pair (Langlois 1953) As the degree of separation of the carboniym ion
from the Bronsted site is of no importance in the explanation of the
reaction mechanism it is sufficient to postulate the existence of an
alkene with a positive charge on a particular carbon atom The term
carbonium ions will be ysed in subseQuent discussions and represented as
shown in eQyation (I) above without showing the anion although its
presence somewhere near the pOSitive charge IS to be ynderstood
(Langlois 1953)
The halide catalysts are aCidic only in so far as they are electron
acceptors Hunter and Yohe (1933) postulated that the active complex in
the absence of hydrogen halide oromoters is formed by the addition of
the catalysts to the olefin In this way the metal hal ide functions in a
manner similar to that of a proton and may be considered to be an aCidiC
catalyst (Schmeling and IpatieH 1950gt
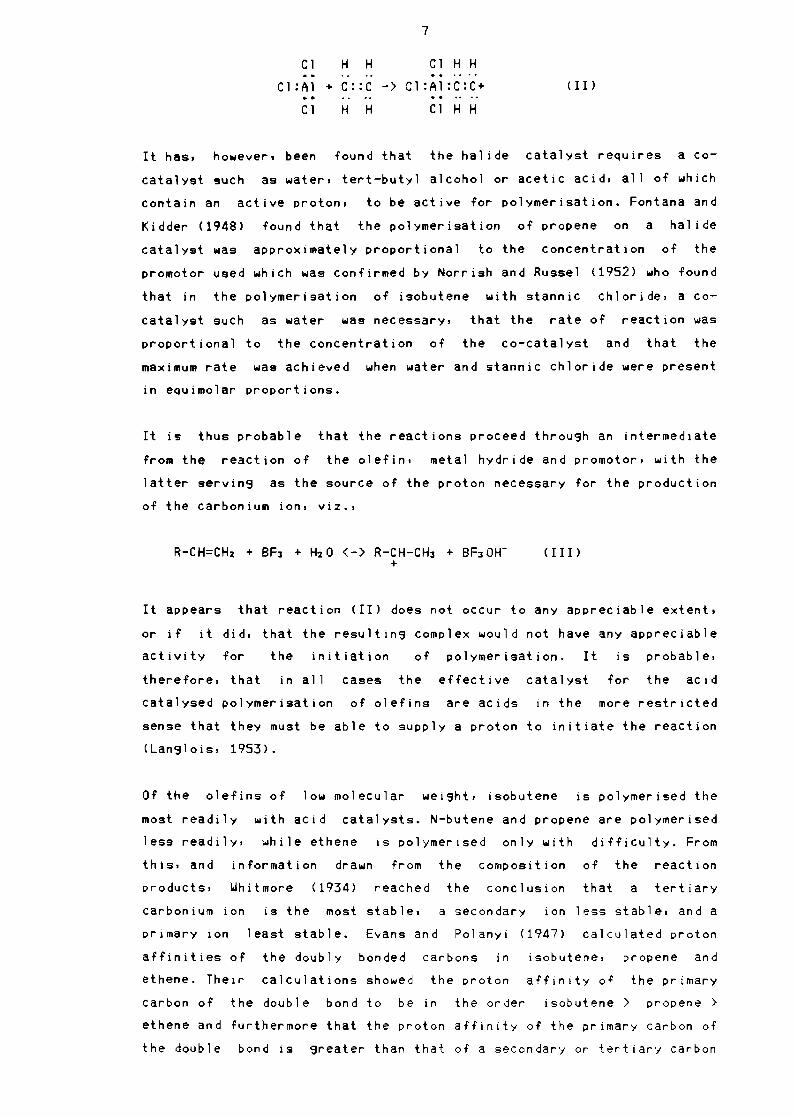
7
Cl H H Cl H H
Cl Al + CC -) Cl Al CC+ (II ) ~ ~
Cl H H Cl H H
It has however been found that the halide catalyst requires a coshy
catalyst such as water tert-buty1 alcohol or acetic acid all of which
contain an active proton to be active for polymerisation Fontana and
Kidder (1948) found that the polymerisation of propene on a halide
catalyst was approximately proportional to the concentration of the
promotor used which was confirmed by Norrish and Russel (1952) who found
that in the polymerisation of isobutene with stannic chloride a Coshy
catalyst such as water was necessary that the rate of reaction was
proportional to the concentration of the co-catalyst and that the
maximum rate was achieved when water and stannic chloride were present
in eQuimo1ar proportions
It is thus probable that the reactions proceed throu~h an intermediate
from the reaction of the olefin metal hydride and promotor with the
latter servin~ as the source of the proton necessary for the production
of the carbonium ion viz bull
R-CH=CH2 + BF3 + H20 (-) R-CH-CH3 + BF30Hshy (II I) +
It appears that reaction (II) does not oCCur to any appreciable extent
or if it did that the resu1tin~ complex would not have any appreciable
activity for the initiation of po1ymerisation It is probable
therefore that in all cases the effective catalyst for the acid
cata1ysed po1ymerisation of olefins are acids In the more restricted
sense that they must be able to supply a proton to initiate the reaction
(Lan~lois 1953)
Of the olefins of low molecular weisht isobutene is polymerised the
most readily with acid catalysts N-butene and propene are polymerised
less readily while ethene is polymerised only with difficulty From
this and information drawn from the composition of the reaction
products ~hitmore (1934) reached the conclusion that a tertiary
carbonium ion is the most stable a secondary ion less stable and a
primary ion least stable Evans and Polanyi (1947) calculated proton
affinities of the doubly bonded carbons in isobutene propene and
ethene Their calculations showed the proton affinity of the primary
carbon of the double bond to be in the order isobutene gt propenegt
ethene and furthermore that the proton affinity of the primary carbon of
the double bond is sreater than that of a secondary or tertiary carbon
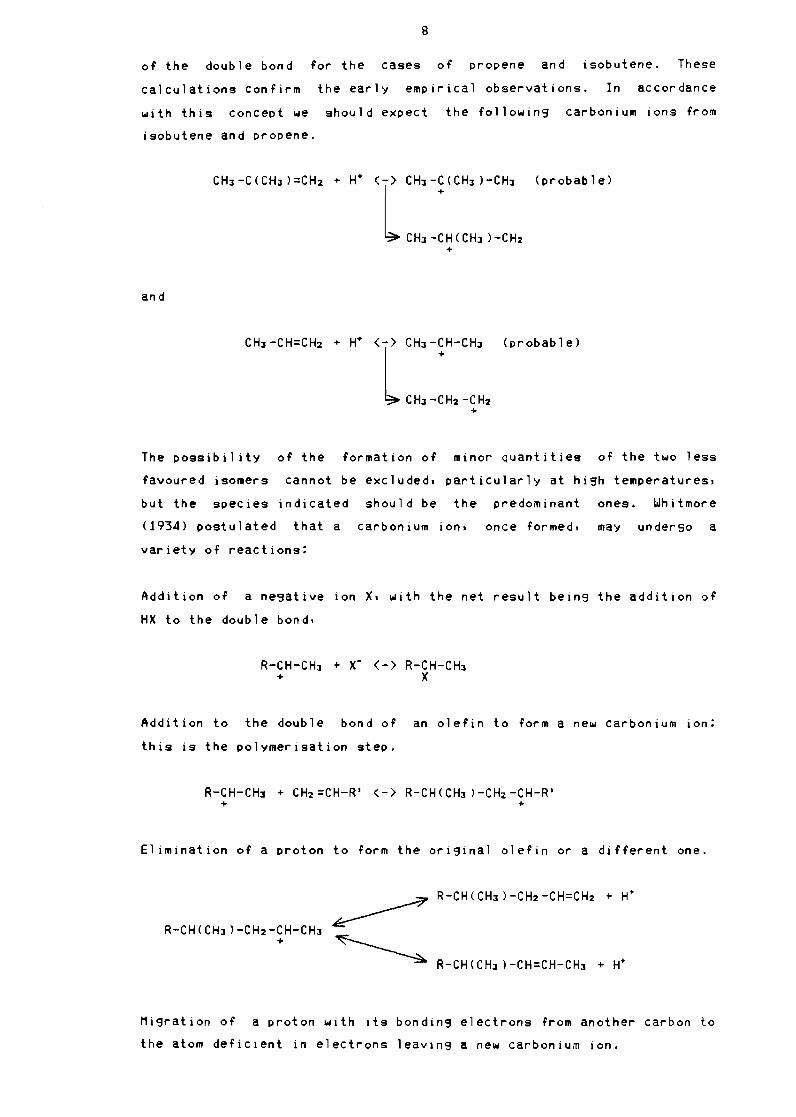
8
of the double bond for the cases of propene and isobutene These
calculations confirm the early empirical observations In accordance
with this concept we should expect the followins carbonium ions fro~
isobutene and propene
(probable)
and
(probable)
The possibil ity of the formation of minor quantities of the two less
favoured isomers cannot be excluded particularly at hish temperatures
but the species indicated should be the predominant ones Whitmore
(1934) postulated that a carbonium ion once formed may underso a
variety of reactions
Addition of a nesative ion X with the net result beins the addition of
HX to the double bond
R-CH-CHJ + X- (-) R-CH-CHJ + X
Addition to the double bond of an olefin to form a new carbonium ion
this is the polymerisation step
R-CH-CHJ + CH2=CH-R (-) R-CH(CHJ)-CH2-CH-R + +
Elimination of a proton to form the oriSinal olefin or a different one
R-CH(CHJJ-CH2-CH-CHJ +
R-CH(CHJ )-CH=CH-CHJ + H+
Migration of a proton with its bonding electrons from another carbon to
the atom deficient in electrons leaVing a new carbonium ion
9
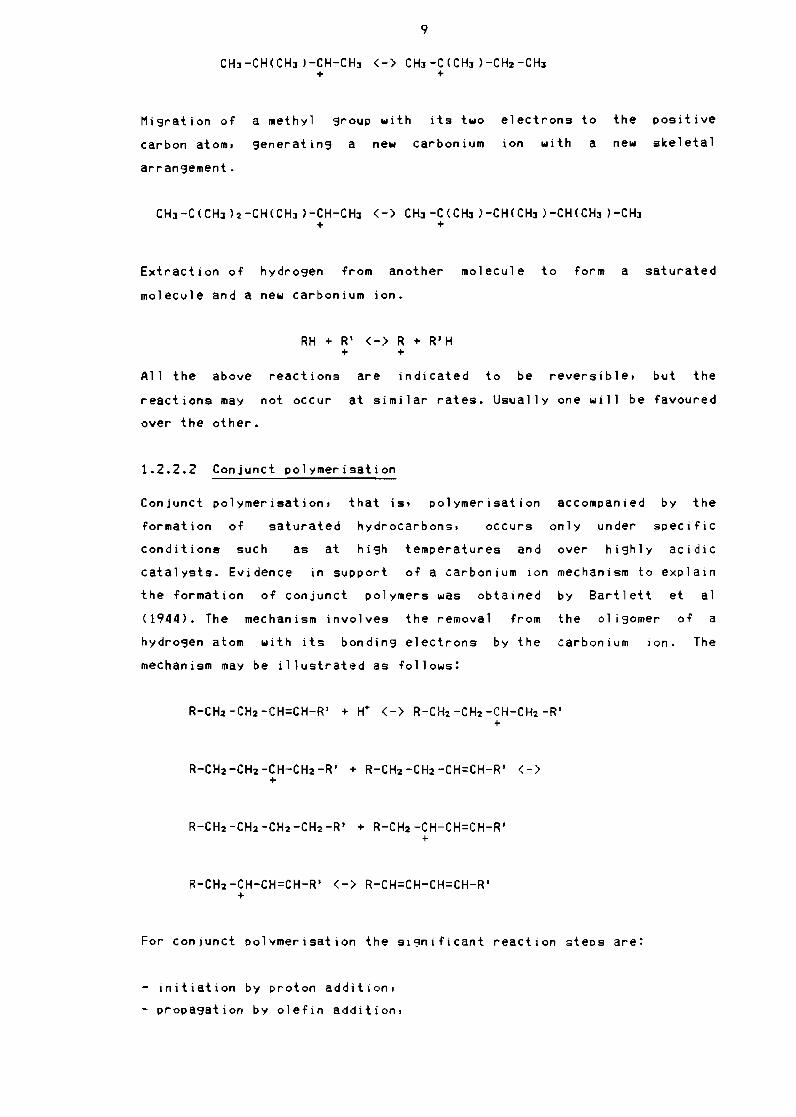
CHJ-CH(CHJ)-CH-CHJ (-) CHJ-C(CHJ)-CH-CHJ + +
Mi~ration of a methyl ~roup with its two electrons to the positive
carbon atom generating a new carbonium ion with a new skeletal
arran~ement
CHJ-C(CHJ)2-CH(CHJ)-CH-CHJ (-) CH3-CCH3 )-CH(CHJ)-CH(CH3)-CH3+ +
Extraction of hydro~en from another molecule to form a saturated
molecule and a new carbonium ion
RH + R (-) R + RH + +
All the above reactions are indicated to be reversible but the
reactions may not oCcur at similar rates Usually one will be favoured
over the other
1222 Conjunct polymerisation
Conjunct polymerisation that is polymerisation accompanied by the
formation of saturated hydrocarbons oCCurs only under specific
conditions such as at high temperatures and over highly acidic
catalysts Evidence in support of a carbonium ion mechanism to explain
the formation of conjunct polymers was obtained by Bartlett et a1
(1944) The mechanism involves the removal from the oligomer of a
hydrogen atom with its bonding electrons by the carbonium ion The
mechanism may be illustrated as follows
R-CH2-CH2-CH=CH-R + H+ (-) R-CH2-CH2-CH-CH2-R +
R-CH2-CH2-CH-CH2-R + R-CH2-CH2-CH=CH-R lt-)+
R-CH2-CH2-CH2-CH2-R + R-CH2-CH-CH=CH-R +
R-CH2-CH-CH=CH-R (-) R-CH=CH-CH=CH-R +
For conjunct polvmerisation the si~nificant reaction steos are
- initiation by proton addition
- propa~ation by olefin addition
10
- chain termination by proton expulsion
- chain termination by proton transfer
- chain termination by addition of hydride ion
- depolymerisation to same or chain length other than that of the
or i gin a 1 olefin t
- isomerisation
- hydrogen exchange
- cyclysation equivalent to self-alkylation or self shy
polymerisation and
loss of hydride ion
123 Polymerisation on silica alumina
1231 Nature of active sites on si1 ica alumina
Si1 ica a1uminas differ widely in properties and have been the subject of
much research (Mizuno et a1 bullbull 1976 Finch and Clark 1969 Peri 1976)
The nature of the active sites in the polymeric olefin formation is
controversial because of the lack of conclusive evidence
Ozaki and Kimura (1964) speculated that the olefin chemisorbed on Lewis
acid sites as a monomer Hirschler (1970) concluded that Bronsted acid
sites were the active sites over sil ica alumina on the basis of the
similarity in composition of polymeriC species formed over sil ica
alumina and those formed over deammoniated Y-zeol ite On the contrary
Weeks et a1 (1974) concluded that the active sites were Lewis sites
formed upon dehydroxylation Ot Y-zeolite because no signitlcant
difference was found between products over deammoniated and
dehydroxylated zeolites Peri (1976) regarded an alpha site a pair
consisting of a Lewis site and an oxide ion to be active Holm et al
(1959) and Sato et a1 (1965) reported that propene po1ymerisation at an
elevated temperature varied in proportion to the Bronsted acid content
However objections have been raised to their determination Ot the
Bronsted acid content (Forni 1974) Mizuno et a1 (1976) on the other
hand showed that the catalytic activity tor the polymeric oletin
tormation declined sharply as the extent ot selective poisoning Ot the
Lewis acid sites increased
1232 Structure Ot the products and proposed mechanism on SIlica
alumina
Silica-alumina has a low activity tor the oligomerisation of propene at
low reaction temperatures the main product being propene trimers
11
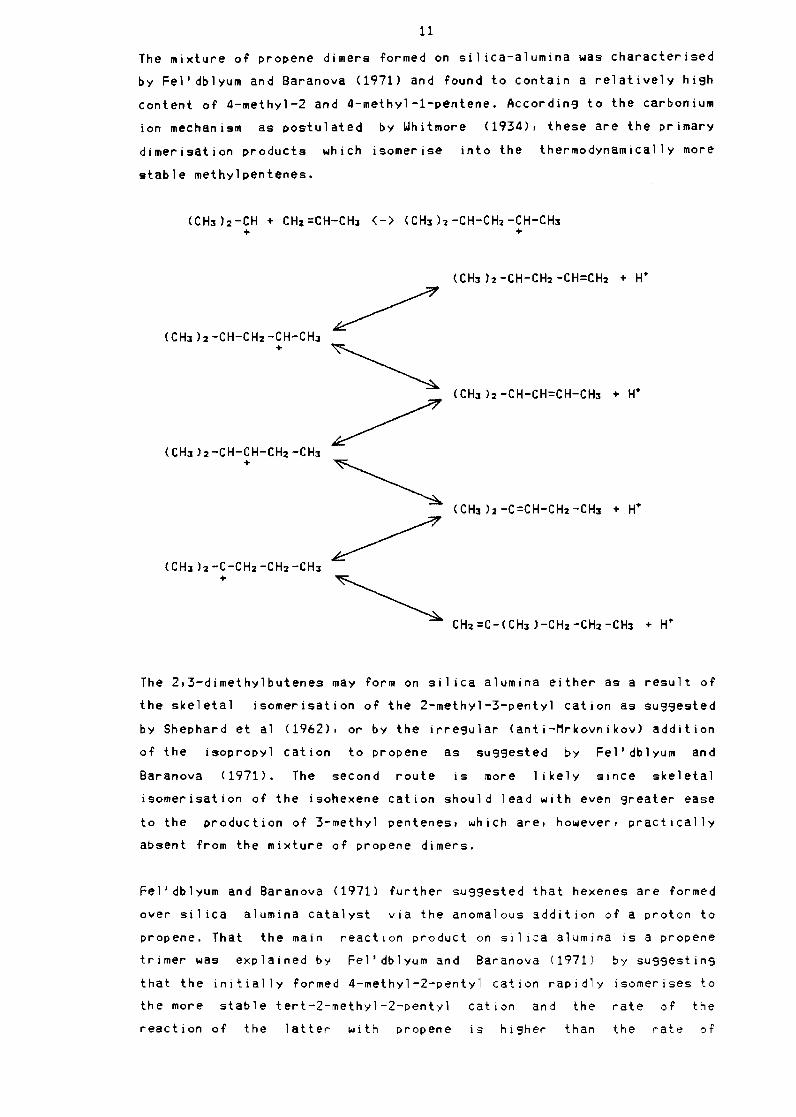
The mixture of propene dimers formed on sil ica-alumina was characterised
by Feldblyum and Baranova (1971) and found to contain a relatively high
content of 4-methyl-2 and 4-methyl-1-pentene According to the carbonium
ion mechanism as postulated by Whitmore (1934) these are the primary
dimerisation products which isomerise into the thermodynamically more
stable methylpentenes
(CHJgt2-CH + CH2=CH-CHs (-) (CHS)2-CH-CH2-CH-CH3 + +
(CHl)2-CH-CH2-CH-CHl +
(CHl)2-CH-CH-CH2-CHl +
(CHl)2-C-CH2-CH2-CHl +
The 23-dimethylbutenes may form on sil ica alumina either as a result of
the skeletal isomerisation of the 2-methyl-3-pentyl cation as suggested
by Shephard et al (1962) or by the irregular (anti-Mrkovnikov) addition
of the isopropyl cation to propene as suggested by Fe 1 db 1yu m an d
Baranova (1971) The second route is more 1 ikely since skeletal
isomerisation of the isohexene cation should lead with even greater ease
to the production of 3-methyl pentenes which are however practically
absent from the mixture of propene dimers
Fe1dblyum and Baranova (1971) further sugsested that hexenes are formed
over sil ica alumina catalyst via the anomalous addition of a proton to
propene That the main reaction product on si 11ca alumina is a propene
trimer was explained by Feldb1yum and Baranova (1971) by suggesting
that the initially formed 4-methyl-2-pentyl cation rapidly isomerises to
the more stable tert-2-methyl-2-pentyl cation and the rate of the
reaction of the latter with propene is higher than the rate of
12
desorption of the dimer from the active center of the catalyst At the
same time the reaction of the 2-methyl-2 pentyl cation with propene
should lead to the formation of the propene trimer with a 44 dimethyl
heptane carbon skeleton This was found to be the case by Fe1db1yum and
Baranova (1971)
It can thus be seen that the silica alumina carrier leads to the
oligomerisation of propene by a carbonium ion mechanism as proposed by
Whitmore (1948) with the product being a propene trimer
124 Po1ymerisation on nickel oxide sil ica alumina
1241 Nature of active sites on nickel oxide sil ica alumina
Hogen et a1 (1955) established that hexenes and methyl pentenes were the
main products formed during the oligomerisation of propene under the
influence of nickel oxide on si1 ica alumina While explaining this
observation from the standpoint of the carbonium ion mechanism Hogan et
a1 (1955) at the same time admitted that the reaction mechanisms
differed substantially from that found in the usual acid catalysts It
was proposed by Ushida and Imai (1962) that two types of protonic acid
centers existed and they ascribed the observed product selectivity to
the isomerisation of the olefin over the protonic acid site attached to
the aluminium Imai et a1 (1968) however proposed that 3-methy1-1- and
3-methyl-2-pentenes were formed via a cyc10 butene intermediate At the
conditions used by Imai et a1 (1968) ie a temperature of 200 C
skeletal isomerisation of the primary oligomers was entirely possible
At lower reaction temperatures eg 64C as used by Feldblyum and
Baranova (1971) 3-methyl-pentenes were hardly formed The dimerisation
reactivity of ethene propene and 1-butene under the influence of nickel
oxide on si1 ica alumina was established by Ozaki et a1 (1968) to vary In
the ratio of 100101 Le in an order opposite to that which occurs
on typical acidic catalysts This was explained by them via the
existence of hydrogen atoms on the catalyst surface The hydrogen atoms
were capable of adding to the olefin to form free radicals which are
then involved in the dimerisation According to Ozaki et al (1968) the
role of the acidic carrier is unimportant Schultz et al (1966) examined
the dimerisation of propene in the presence of Cobalt oxide on a nonshy
acidic carrier activated charcoal A positive result was obtained with
cobalt oxide while nickel oxide on the same support was inactive
In view of the foregoing the nature of the products from the
01 igomerisation of propene under the influence of nickel oxide on silica
13
alumina is discussed in greater detail below to deepen our understanding
of the reaction mechanism and the active sites
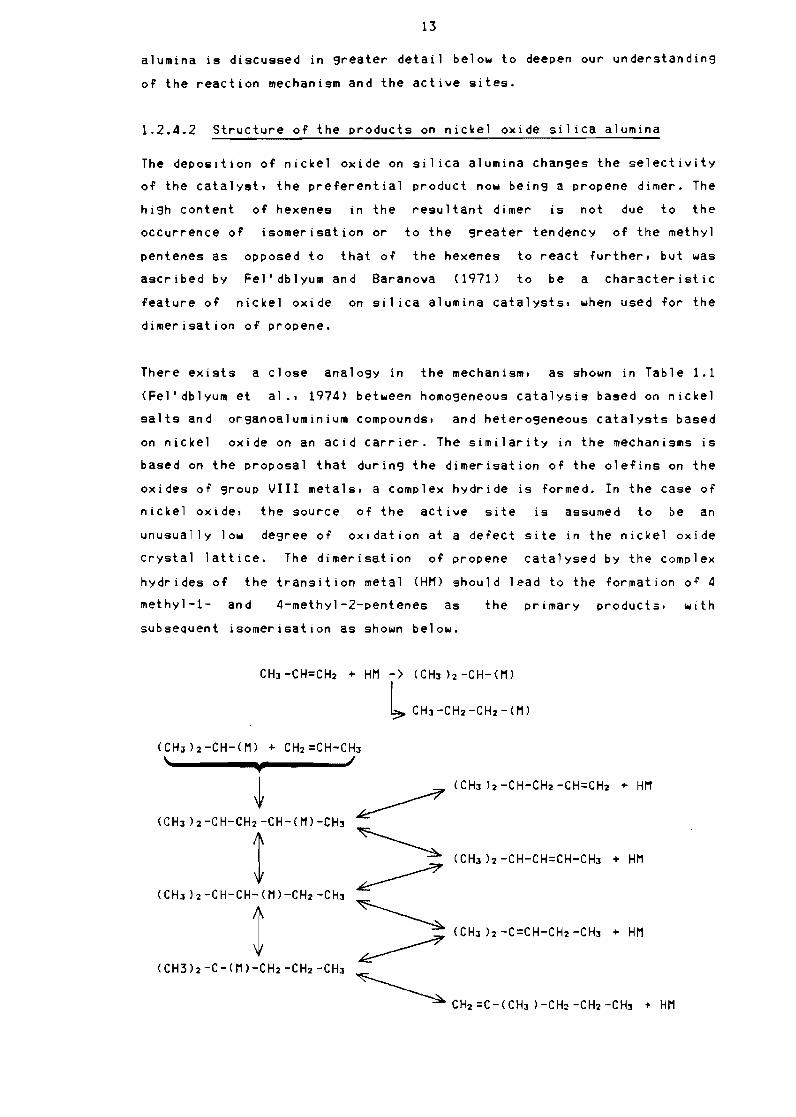
1242 Structure of the products on nickel oxide si1 ica alumina
The deposition of nickel oxide on silica alumina changes the selectivity
of the catalyst the preferential product now being a propene dimer The
high content of hexenes in the resultant dimer is not due to the
occurrence of isomerisation or to the greater tendency of the methyl
pentenes as opposed to that of the hexenes to react turther but was
ascribed by Feldblyum and Baranova (1971) to be a characteristic
feature of nickel oxide on silica alumina catalysts) when used tor the
dimerisation of propene
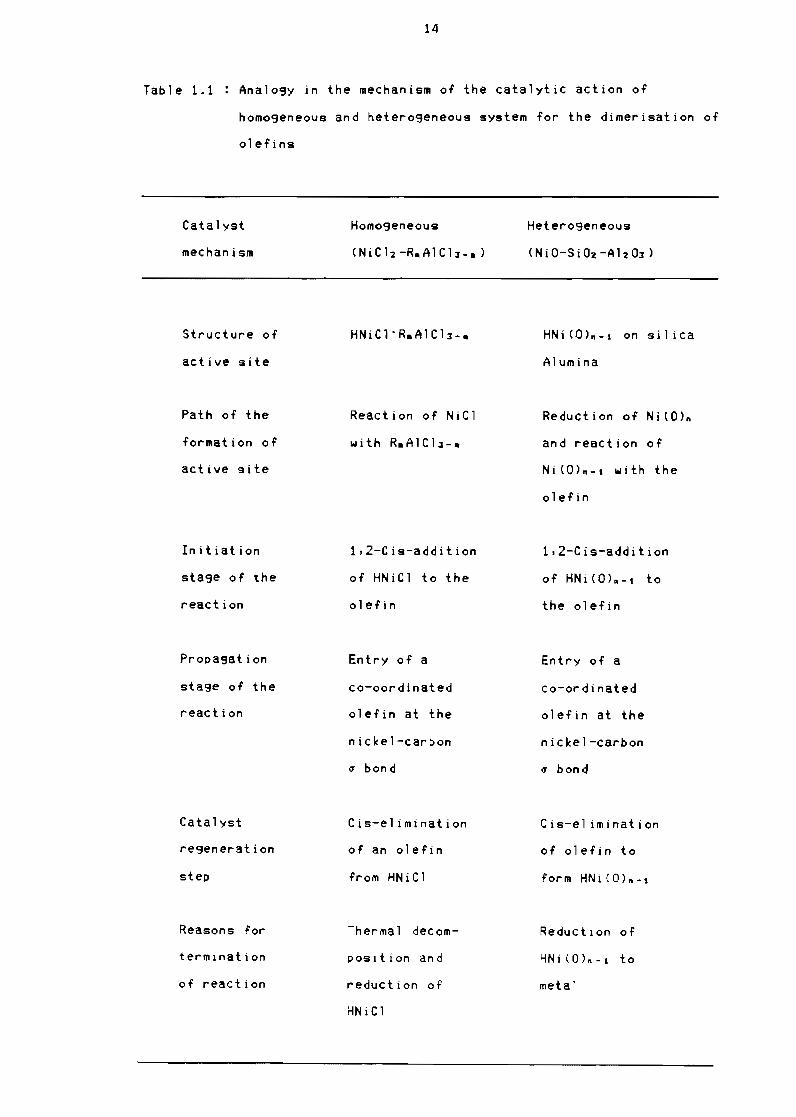
There exists a close analogy in the mechanism as shown in Table 11
(Feldblyum et al bull 1974) between homogeneous catalysis based on nickel
salts and organoaluminium compounds and heterogeneous catalysts based
on nickel oxide on an aCid carrier The similarity in the mechanisms is
based on the proposal that during the dimerisation of the olefins on the
oxides of group VIII metals) a complex hydride is formed In the case of
nickel oxide the source of the active site is assumed to be an
unusually low degree of oxidation at a defect site in the nickel oxide
crystal lattice The dimerisation of propene catalysed by the complex
hydrides of the transition metal (HM) should lead to the formation of 4
methyl-1shy and 4-methyl-2-pentenes as the primary products with
subsequent isomerisation as shown below
CHJ-CH=CH2 + HM -) (CHJ )2-CH-(M)
l CHJ-CH2-CH2-(M)
(CHJ h -C=CH-CH2 -CHJ + HM
+ HM
14
Tab 1e 1 1 Anal09Y in the mechanism of the catalytic action of
homogeneous and heterogeneous system for the dimerisation of
olefins
Catalyst Homogeneous Heterogeneous
mechanism (N i Ch -R A 1 C 13 - ) (NiO-Si02-AhOl)
Structure of
active site
Path of the
format ion of
active site
Initiation
sta3e of the
reaction
Propa3stion
sta3e of the
reaction
Cata 1yst
re3eneration
step
Reasons for
termination
of reacti on
HNiClmiddotRA1Cll-
Reaction of NiCl
wit h R A1C13 - bull
12-Cis-addition
of HNiCl to the
olefin
Entry of a
Co-oord inated
olefin at the
nickel-carbon
lt1 bond
Cis-el imination
of an ole fin
from HN i C 1
Thermal decomshy
posH ion and
reduction of
HNiCl
HNi(Q)n-t on silica
Alumina
Reduction of Ni(O)n
and reaction of
Ni(O)n-t with the
olefin
1 2-C is-add it ion
of HNi (0)-1 to
the olefin
Entry of a
co-ordinated
olefin at the
nickel-carbon
lt1 bon d
Cis-el imination
of olefin to
form HNi (0)n-1
Reducti on of
HNHOln-t to
metal
15
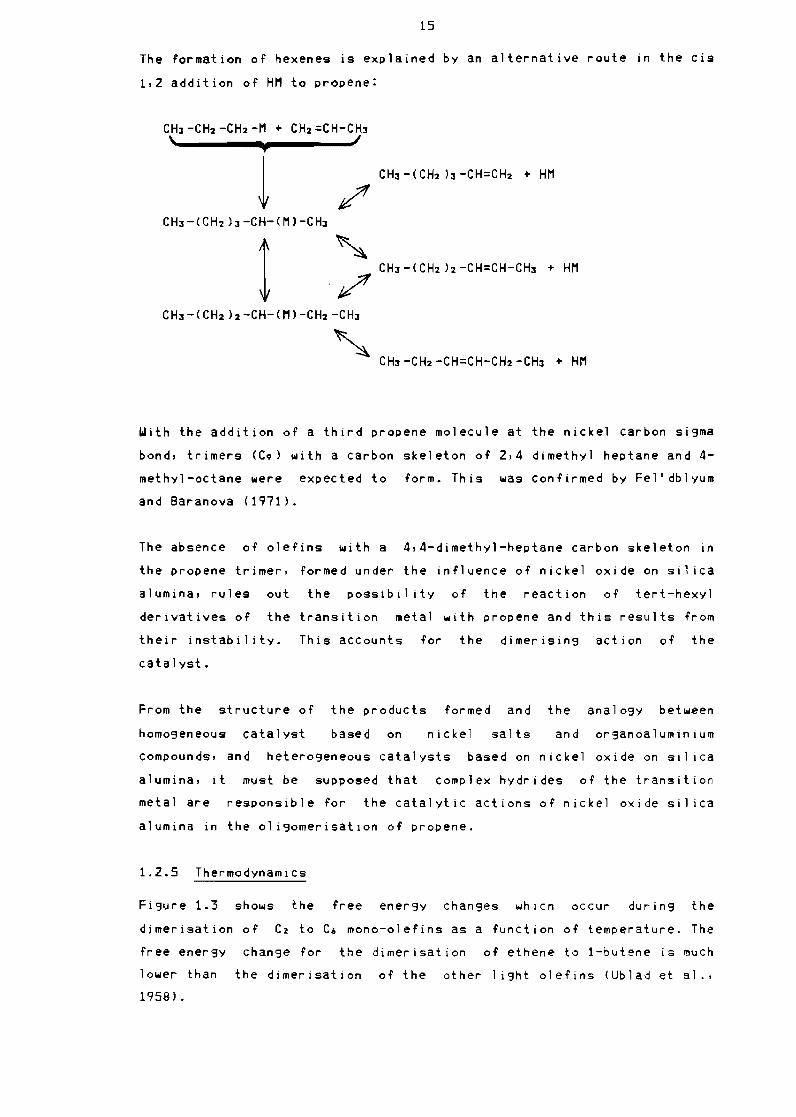
The formation Of hexenes is explained by an alternative route in the cis
12 addition Of HM to propene
1
With the addition Of a third propene molecule at the nickel carbon sigma
bond trimers (C9) with a carbon skeleton Of 24 dimethyl heptane and 4shy
methyl-octane were expected to form This was Confirmed by Feldblyum
and Baranova (1971)
The absence Of olefins with a 44-dimethyl-heptane carbon skeleton in
the propene trimer formed under the influence Of nickel oxide on si~ica
alumina rules out the possibil ity of the reaction Of tert-hexy1
derivatives of the transition metal with propene and this results from
their instability This accounts for the dimerising action of the
catalyst
From the structure of the products formed and the analogy between
homogeneous catalyst based on nickel salts and organoaluminium
compounds and heterogeneous catalysts based on nickel oxide on si1 ica
alumina it must be supposed that complex hydrides of the transition
metal are responsible for the catalytic actions of nickel oxide silica
alumina in the oligomerisatlon of propene
125 ThermodynamiCs
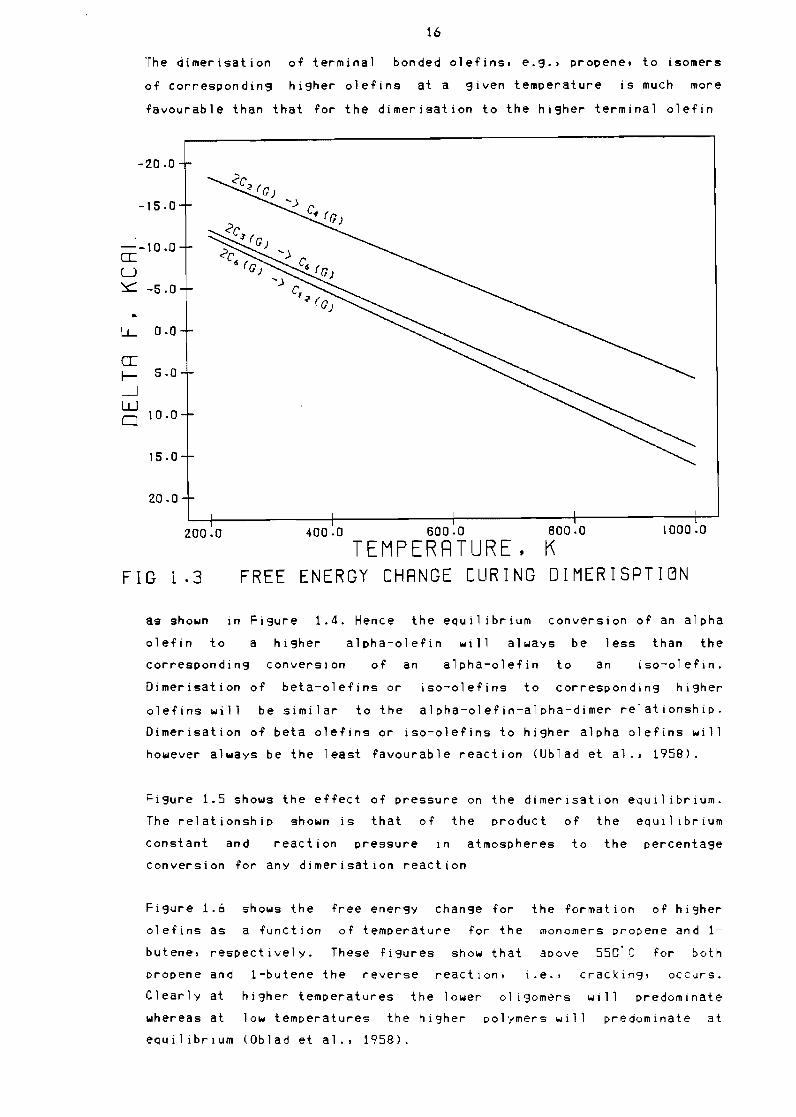
Figure 13 shows the free energy changes which occur during the
dimerisation Of C2 to Co mono-olefins as a function of temperature The
free energy change for the dimerisation of ethene to 1-butene is much
lower than the dimerisation of the other 1 ight olefins (Ublad et alJ
1958)
16
The dimerisation of terminal bonded olefins eg bullbull propene to isomers
of corresponding higher olefins at a given temperature is much more
favourable than that for the dimerisation to the hi9her terminal olefin
-200
-150
-J- 10 0a U c -60
Lshy 00
(I
Ishy 50 -J W 0 100
150
200
2000 4000 6000 6000 10000
TEMPERRTURE K FIG 13 FREE ENERGY CHRNGE DURING DIMERISRTIBN
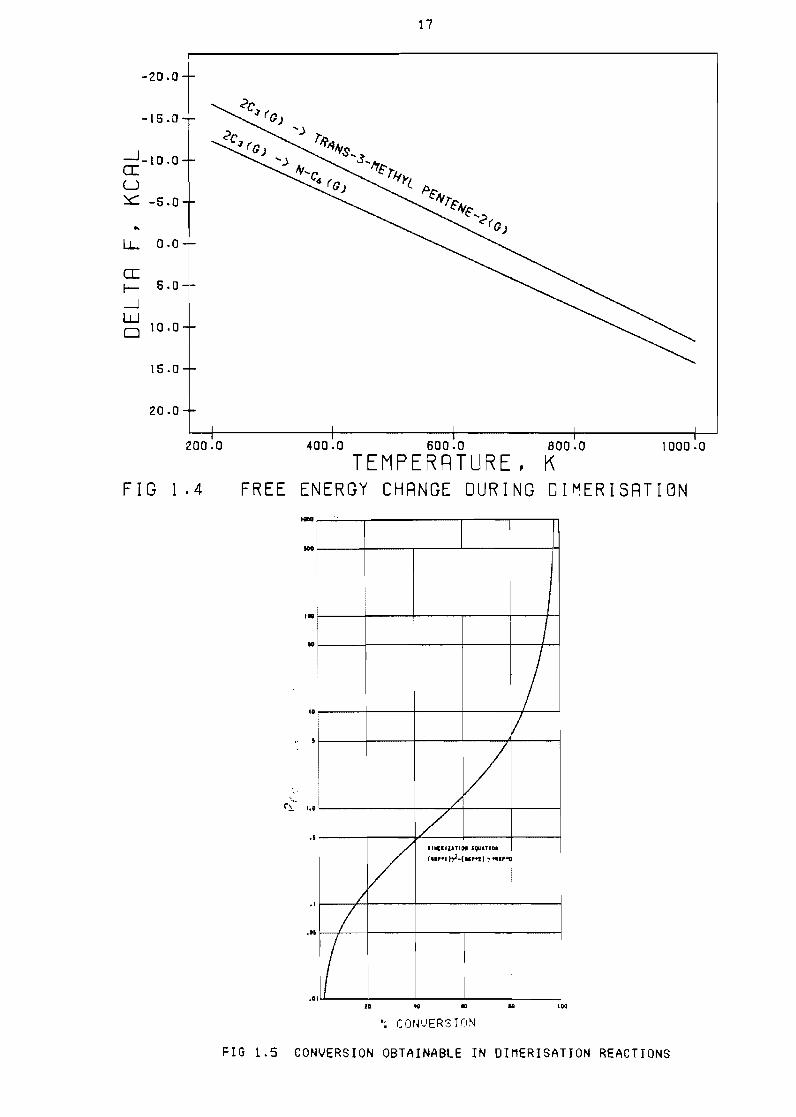
as shown in Figure 14 Hence the equil ibrium conversion of an alpha
olefin to a higher alpha-olefin will always be less than the
corresponding conversion of an alpha-olefin to an iso-olefin
Dimerisation of beta-olefins or iso-olefins to corresponding higher
olefins will be similar to the alpha-olefin-alpha-dimer relationship
Dimerisation of beta olefins or iso-olefins to higher alpha olefins will
however always be the least ravourable reaction (Ublad et al bull 1958)
Figure 15 shows the effect of pressure on the dimerisation eQuil ibrium
The relationship shown is that or the product of the equil ibrium
constant and reaction pressure in atmospheres to the percentage
Conversion for any dimerisation reaction
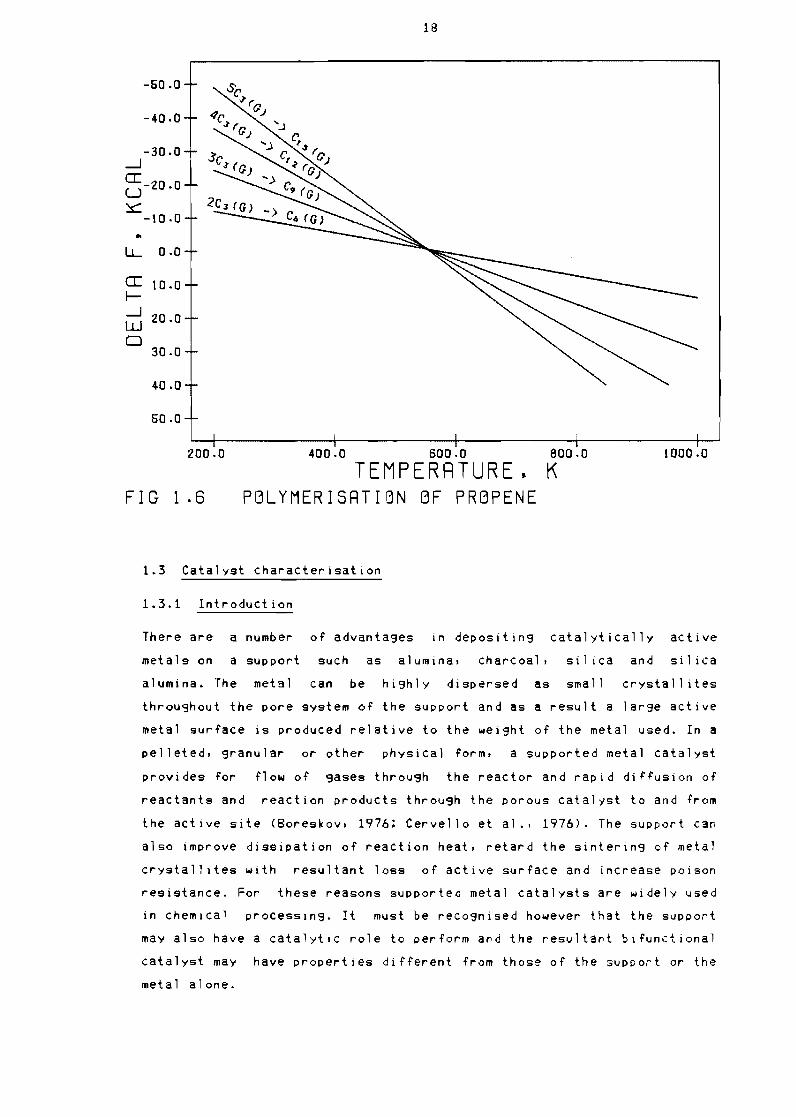
Figure 16 shows the rree energy change ror the formation of higher
olerins as a function or temperature ror the monomers propene and 1
butene respectively These rigures show that above 550C ror both
propene and 1-butene the reverse reaction ie bull cracking oCCurs
Clearly at higher temperatures the lower 01 igomers will predominate
whereas at low temperatures the higher polymers will predominate at
equilibrium (Oblad et a1 1958)
17
-200
-160
-J- 10 0 CI U ~ -60
LL 00
CI I- 60 -J W
100o
150
200
FIG
2000
14
4000 6000 6000 10000
TEMPERRTURE K FREE ENERGY CHRNGE DURING DIMERISRTIBN
shyi J
i I 100
It
s
V0
s
DUCltUTIH iquarlO
(01 n-(HMl ~91
0
bull
I
YIt 10 00
~ C OtNERS I n~~
FIG 15 CONVERSION OBTAINABLE IN OIMERISATION REACTIONS
18
-500
-400
-300 J aU-20 0
~ -100
LL 00
a 100 r shyJ 200W 0
300
400
500
2000 4000 6000 8000 10000
TEMPERRTURE K FIG 16 PBLYMERISRTIBN BF PRBPENE
13 Catalyst characterisation
131 Introduction
There are a number of advantages in depositing catalytically active
metals on a support such as alumina charcoal sil ica and silica
alumina The metal can be highly dispersed as small crysta1l ites
throughout the pore System of the support and as a result a large active
metal surface is produced relative to the weight of the metal used In a
pelleted granular or other physiCal form a supported metal catalyst
provides for flow of gases through the reactor and rapid diffusion of
reactants and reaction products through the porous catalist to and from
the active site (Boreskov 1976 Cervello et alJ 1976) The support Can
also improve dissipation of reaction heat retard the sintering of metal
crystallites with resultant loss of active surface and increase poison
resistance For these reasons supported metal catalysts are widely used
in chemical processing It must be recognised however that the support
may also have a catalytic role to perform and the resultant bifunctional
catalyst may have properties different from those of the support or the
metal alone
19
To achieve greater ynderstanding or the way in which good catalysts can
be prepared more inrormation is needed aboyt the errect or the synthesis
method and the stryctYre or the catalysts Both will now be discyssed in
detai 1
132 Catalyst synthesis methods
When a pOrOYB solid comes into contact with a liquid capillary rorces
or several hyndred atmospheres draw the 1 iQuid into the pores The
active component may then be adsorbed on the walls or the pore in which
case the method of preparation is described as adsorption rrom solution
or ion exchange Here the volyme or solytion ysed will be larger than
the pore volume of the sypport In other preparation methods where
adsorption is small the catalyst is prodyced by drying Oyt of the
support wetted with a solution of the active component and the term
impregnation is used (Maatman and Prater 1957) At a high degree or
loading greater than 5 ~ the above methods do not lead to unirorm
distribution viz unirorm location of the metal crystallites within
the support or uniform dispersion viz uniform size of the metal
crystallites throughout the support This can however be overcome by
starting from a mixture in which the constituents of the active
component and the support are mixed on an atomic scale U~der certain
conditions a precipitate will be formed with the active phase
atomically spread throughout the support This method of production is
termed co-precipitation and discussed in detai 1 by Holm et al lt1957gt
The factors affecting dispersion and distribution in the various
synthesis routes will now be discussed
1321 Preparation with adsorption
Catalysts are often made by immersing a porous support in a solution of
an active material Catalytic properties can be influenced by the amount
and distribution of this material on the internal surface of the support
which in turn depends on whether the active material (solute) or the
solvent adsorbs on the support and the fraction of pore volume
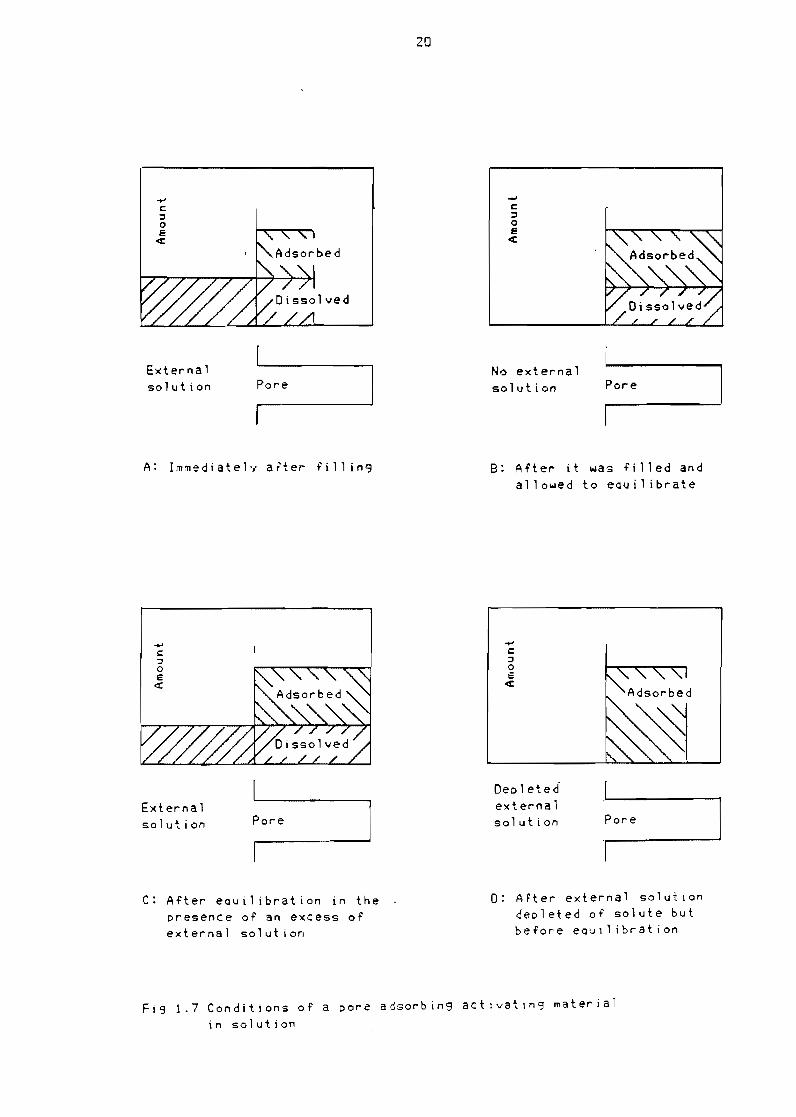
accessible to the solute In Figure 17 the Quantity of active material
found in different parts of a system consisting of an external solution
and a single pore which adsorbs activating material is shown for four
conditions Figure 17a shows the distribution of the active material in
the system when the solution reaches the end of the pore The
assumption is made that the rate of penetration and rate of diffusion of
the solute into the pore are slow compared to the rate of adsorption
All act i ve materia 1 in the penetrati ng 1 i qu i d thus adsorbs on the lola 11
20
c I o e
q
External No external Poresolution Pore solution
A Immediateh after fi 11 in B After it was filled and allowed to eltluilibrate
Dec 1 eted externalExterna 1
Pore solution Poresolution
C After equilibration in the 0 After external solution presence of an excess of depleted of solute but external solution before eQ-Jilibration
Fig 17 Conditions of a pore adsorbing actIvatIng material in solution
21
of the first part of the pore The 1 iauid which passes further into the
pore contains no active material If at this time the solvent is removed
from the pore by dryin9 the active material is found only in the part
of the pore nearest to the external solution If instead of dryin9 the
catalyst at this time the pore is simply removed from the external
solution but left filled with 1 iQuid another phenomenon may be observed
If the active material can desorb at a reasonable rate redistribution
oCcurs by desorption and mi9ration by diffusion This ultimately results
in a uniform distribution of active material within the pore as shown in
Fi9ure 17b This process can be used in catalyst preparation if the
rate of desorption is rapid enou9h If the pore is however left in
contact with the external solution additional active material is
supplied by the external solution by diffusion to the adsorption sites
until either equilibrium with the external solution is reached brin9in9
about a uniform distribution as shown in Figure 17c or the external
solution is depleted of active material before the distribution is
uniform as shown in Figure 17d (Maatman and Prater 1957)
It can thus be seen that the amount of active material found in a porous
support can be much larger than that contained in the original pore
volume of liquid penetratin9 the support If on the other hand the pores
are accessible to the solvent but are too small for the solute to enter
or if the solvent is adsorbed in preference to the solute the Quantity
of active material may be extremely low
1322 Drying of adsorbent solids
In the case of an adsorbent solid the dryin9 process is not expected to
alter the distribution of the active material since it is adsorbed to
the sol id However if the adsorptive properties of the material were to
alter during heating and prior to evaporation of the solvent as by
thermal decomposition to a soluble species which does not adsorb on the
support the distribution of the solute would be markedly altered This
condition is discussed below
1323 Preparation without adsorption
In this case a porous support is submerged in a solution containing the
active material and the metal salt is drawn Into the pores by capillary
forces The solvent is then evaporated and the salt decomposed by
calcination or reduction The metal content can be calCulated from the
Concentration of the solution
22
For impregnated type catalysts Dor1ing et al (1971) predicted that up
to a certain metal content the number of crystallites would increase
the mean crystallite size would vary slowly and the metal area would be
approximately proportional to the metal content Beyond this metal
content the number of crystal1 ites would remain constant if only one
crystal formed in each pore during drying Hence the metal crystall ites
would increase in size and the metal area would be proportional to
(metal content)2J Dor1ing et a1 (1971) predicted that the crystallite
size distribution would reflect the pore size distribution of the
support
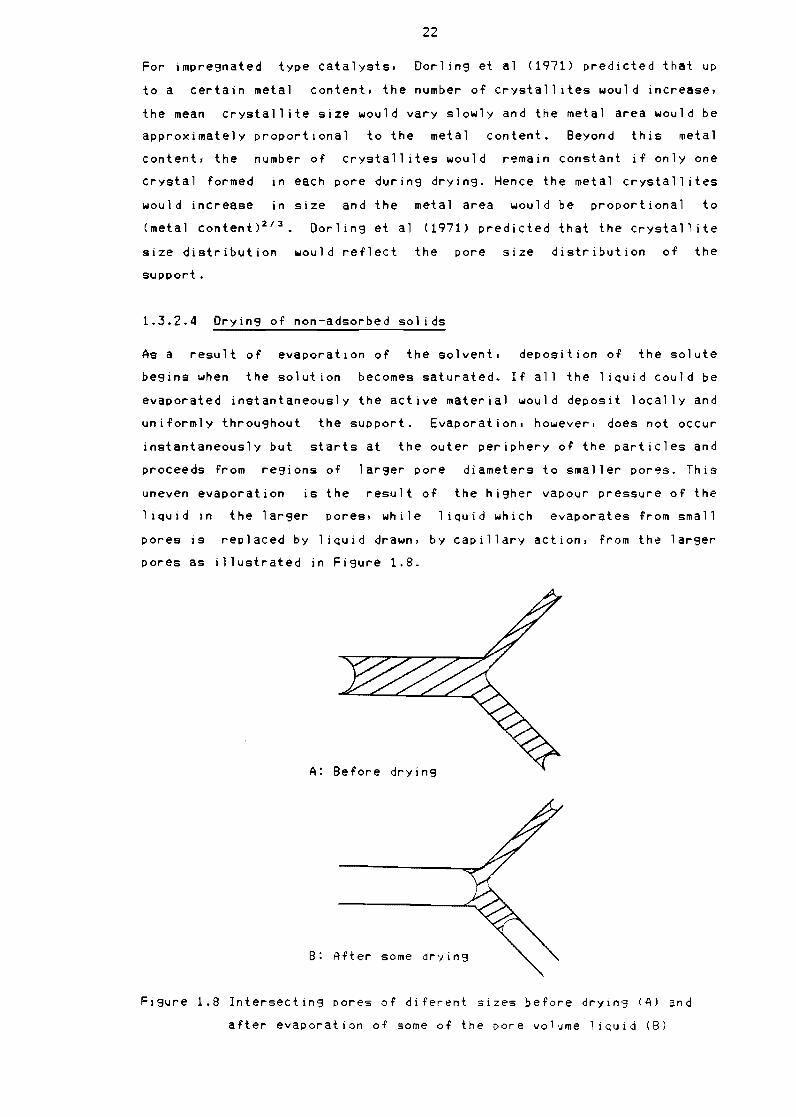
1324 Drying of non-adsorbed solids
As a result of evaporation of the solvent deposition of the solute
begins when the solution becomes saturated If all the liquid could be
evaporated instantaneously the active material would deposit locally and
uniformly throughout the support Evaporation however does not occur
instantaneously but starts at the outer periphery of the particles and
proceeds from regions of larger pore diameters to smaller pores This
uneven evaporation is the result of the higher vapour pressure of the
1 iquid in the larger pores while 1 iquid which evaporates from small
pores is replaced by liquid drawn by capillary action from the larger
pores as illustrated in Figure 18
A Before drying
B After some drying
Figure 18 Intersecting pores of diferent sizes before drying (A) and
after evaporation of some of the pore volume 1 iQUld (8)
23
Thus when drying proceeds slowly enough there is a tendency tor the
active material which is increasing in concentration as the liQuid
volume decreases to redistribute by diffusion into the remaining fluid
This results in an enrichment of the active material in the smaller
pores and towards the center of the particle (Maatman and Prater 1957)
133 Homogeneous decomposition deposition
It can be seen from the above discussion that producing a catalyst by
impregnation or ion exchange with high metal contents leads to the
formation of crystallites with non-uniform distribution and low
dispersion As an active supported catalyst system calls for a highly
dispersed particle with uniform distribution on a highly porous
thermally stable support such as silica alumina it would be desirable
to combine the high degree of penetration of the solute into the support
observed during impregnation with a controlled ion exchange-type
preCipitation The procedure studied by van Dillen (1976) for the
manufacture of highly dispersed nickel silica catalysts with uniform
distribution and a similar system used by Higley (1984) to produce
nickel oxide on silica alumina catalysts was investigated
In the case of this work a suspension of nickel nitrate hexahydrate and
silica alumina was prepared To preCipitate the nickel salt onto the
support the pH had to be lowered This was achieved by Hisley (1984) via
the injection of ammonium hydroxide and in the case ot this work by the
slow and homogeneous decomposition of urea The reason for using urea as
the source of hydroxyl ions as opposed to ammonium hydroxide is
discussed below A detailed disCussion of the synthesis procedure is
given in Section 363
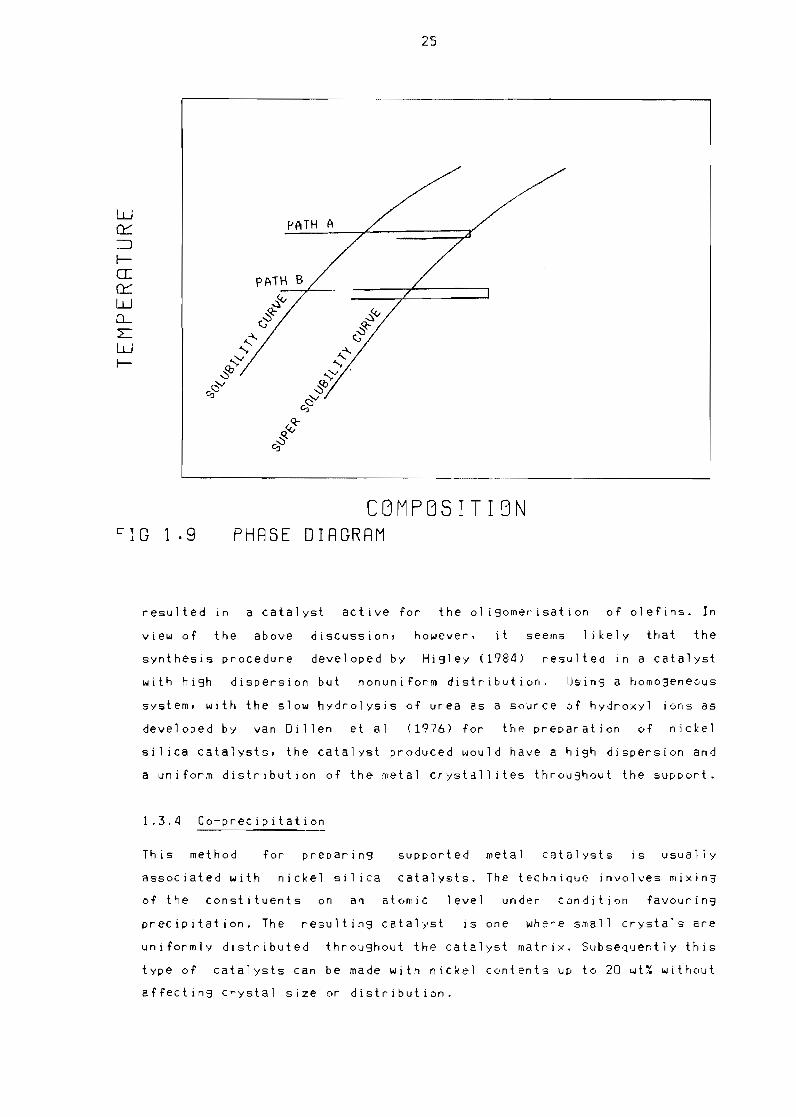
1331 Theory Ot homogeneous decomposition deposition
When the concentration of a homogeneous solution is raised at a constant
temperature as shown by path A in Figure 19 the solubil ity Curve is
reached Crossing the solubil ity curve does not generally lead to the
formation of a preCipitate but to a metastable state When howeverthe
concentration on the solubil ity Curve is exceeded by a critical amount
nuclei of the preCipitate are spontaneously generated brinSins about
the transition to the eQuilibrium state The concentration where nuclei
start to develo~ s~ontaneously l~ homogeneous solutions IS indicated by
the supersolUbil tty Curve which is also shown in Figure 19 (Walton
1969) The fact that no preCipItate grows when the solubil ity Curve 13
crossed is due to the Considerable surface enerSY of very small
24
particles of the precipitate Thus raising the concentration of a
solution to the value on the supersolubil ity Curve leads to the
formation of a limited number of nuclei If the homogeneity of the
solution is maintained the concentration of the solution will remain
between that of the solubil ity and supersolubil ity curves where no new
nuclei can develop Therefore as a result of precipitation from a
homogeneous solution a small number of large particles of the
preCipitate are formed Pouring a precipitant into the suspension on the
other hand gives rise to an inhomogeneous solution as the concentration
will locally be increased far beyond that of the supersolubility curve
as shown by path B in Figure 19 This gives rise to the formation of a
large number of nuclei Before the concentration has decreased by
homogenizing the solution the nuclei have grown sufficiently to be
stable at the lower concentration Working with an inhomogeneous
solution therefore results in a relatively large number of small
particles (Cartwright et al 1967)
It was concluded by Hermans and Geus (1979) that pouring a preCipitant
into a suspension of a porous carrier leads to preCipitation of the
active material where the preCipitant enters the suspension and the
preCipitate will not develop uniformly over the surface of the support
PreCipitation from a homogeneous solution on the other hand proceeds
eQually in the pores of the support and in the bulk of the solution and
so el iminates the inhomogeneous addition of the preCipitate to the
support
In order to produce a catalyst with high dispersion and uniform
distribution a sufficiently stron9 Interaction of the preCipitating
compound with the support is neCessary This interaction must decrease
the nucleation barrier so that nucleation at the surface of the support
can proceed at a concentration between the solubil ity and
supersolubil ity Curves The preCipitate can then nucleate at the ~urface
of the support whereas nucleation in the bulk of the solution is
prevented In addition nucleation at the surface must be rapid to avoid
the growth of a small number of nuclei to large particles of the
preCipitate (Hermans and Geus 1979)
1332 Nickel oxide sil ica alumina preparation usinB homogeneous
decomposition deposition
Higley (1984) showed that incorporating nickel onto sll iea alumina by
the injeCtion of a hydroxide-containing solution (ammonium hydroxide)
25
CBMPBSITIBN FIG 19 PHRSE DIRGRRM
resulted in a catalyst active for the 01 igomerisation of olefins In
view of the above discussion however it seems likely that the
synthesis procedure developed by Higley (1984) resulted in a catalyst
with high dispersion but nonuniform distribution Using a homogeneous
system with the slow hydrolysis of urea as a source of hydroxyl ions as
developed by van Dillen et al (1976) for the preparation of nickel
sil ica catalysts the catalyst produced would have a high dispersion and
a uniform distribution of the metal crystal] ites throughout the support
134 Co-preCipitation
This method for preparing supported metal catalysts is usually
aSSOCiated with nickel 5i I ica catalysts The technique involves mixing
of the constituents on an atomic level under condition favouring
preCipitation The resulting catalyst is one where small crystals are
uniformly distributed throughout the catalyst matrix Subsequently this
type of catalysts can be made with nickel contents up to 20 wtX without
affecting Crystal size or distribution
w n )
fshya n w 0 L W f-
PATH A
26
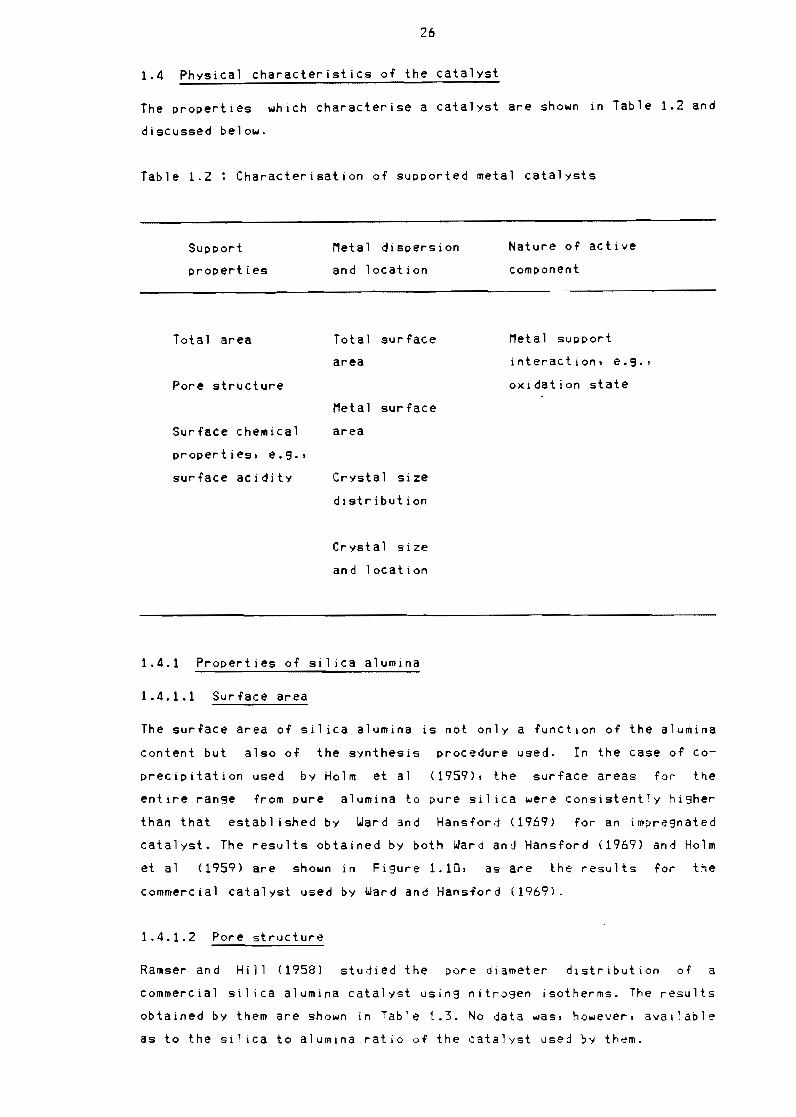
14 PhysiCal characteristics or the catalyst
The properties which characterise a catalyst are shown in Table 12 and
discussed below
Tab 1 e 1 2 Characterisation or supported metal catalysts
Support Metal dispersion Nature or ac ti ve
properties and location component
Total area Total sur race Metal support
area interaction e9
Pore structure oxidation state
Meta 1 sur race
Surface chemical area
properties e9
surface aci dity Crystal size
distribution
Crystal size
an d 1 oC a t ion
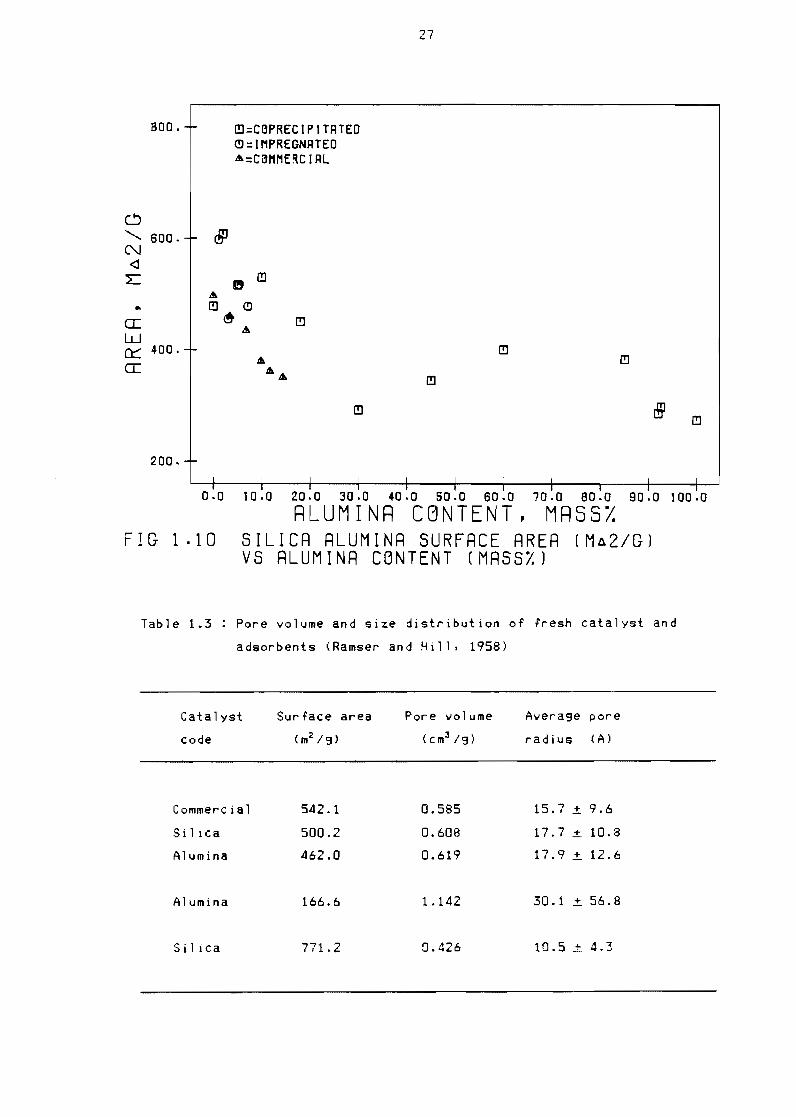
141 Properties or silica alumina
1411 Surrace area
The surrace area or silica alumina is not only a runction or the alumina
content but also or the synthesis procedure used In the case or Coshy
precipitation used by Holm et a1 (1959) the surface areas ror the
entire ranse rrom pure alumina to pure si1 ica were consistently hisher
than that established by Ward and Hansrord (1969) tor an impregnated
catalyst The results obtained by both Ward and Hansrord (1969) and Holm
et al (1959) are shown in Figure 110 as are the results ror the
commercial catalyst used by Ward and Hansford (1969)
1412 Pore structure
Ramser and Hill (1958) studied the pore diameter dIstribution or a
commercial sil ica alumina catalyst usin9 nitrogen isotherms The results
obtained by them are shown in Table 13 No data was however available
as to the silica to alumina ratio of the catalyst used by them
27
800 shy
~ - 600 shyN ltl ~
bull a W
~=cePRECIPITATEO ()= IMPREGNATED eft =CeMMERC I AL
~
eft ~ () ~ ~
eft
400 -- ~a eft ~a efteft ~
~ ~
200 -r-I I I
I I200 300 400 600 600 700 800 900 1000 RLUMINR CBNTENT MRSS
FIG 110 SILICR RLUMINR SURFRCE RRER (Ma2GlVS ALUMINR CGNTENT (MRSS)
Table 13 Pore volume and size distribution of fresh catalyst and
adsorbents (Ramser and Hill 1958)
Catalyst Surface area Pore volume Average pore
code (m2 9 ) (cm3 19) radius (A)
Commercial
Silica
Alumina
Alumina
Silica
5421
5002
4620
1666
7712
0585
0608
0619
1142
0426
157 plusmn 96
177 plusmn 108
179plusmn 126
30 1 plusmn 568
105 plusmn 43
29
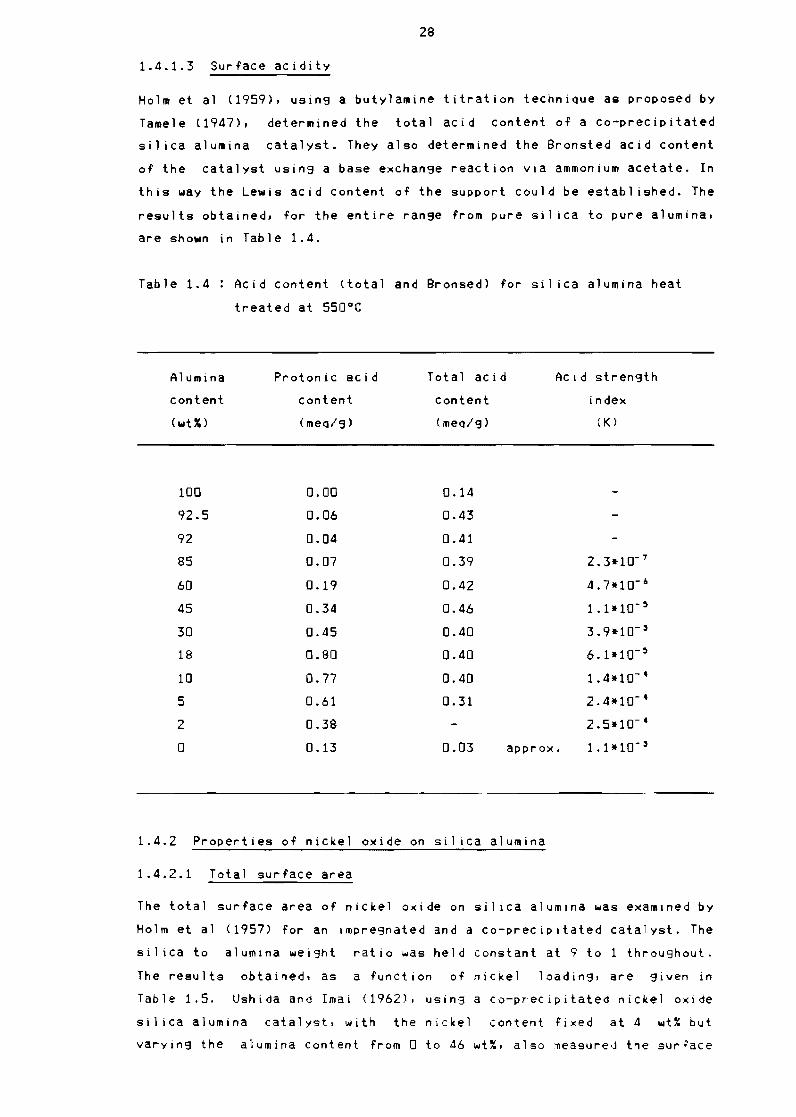
1413 Surface acidity
Holm et a1 (1959) using a butylamine titration techniQue as proposed by
Tame1e (1947) determined the total acid content of a co-precipitated
silica alumina catalyst They also determined the Bronsted acid content
of the catalyst using a base exchange reaction via ammonium acetate In
this way the Lewis acid content of the support could be estab1 ished The
results obtained for the entire range from pure ail ica to pure alumina
are shown in Table 14
Tab 1 e 1 4 Acid content (total and Bronsed) for sil ica alumina heat
treated at 550degC
Alumina Protonic acid Tota 1 ac i d Acid strength
content content content index
(wt~) (meQg) (meQg) (K)
100
925
92
85
60
45
30
18
10
5
2
0
000
006
004
007
019
034
045
080
077
061
038
013
014
043
041
039
042
046
040
040
040
031
003 approx
2310- 7
4710-amp
1110-)
3910-)
6110-)
1410- 4
2410- 4
2510- 4
1110-)
142 Properties of nickel oxide on sil ica alumina
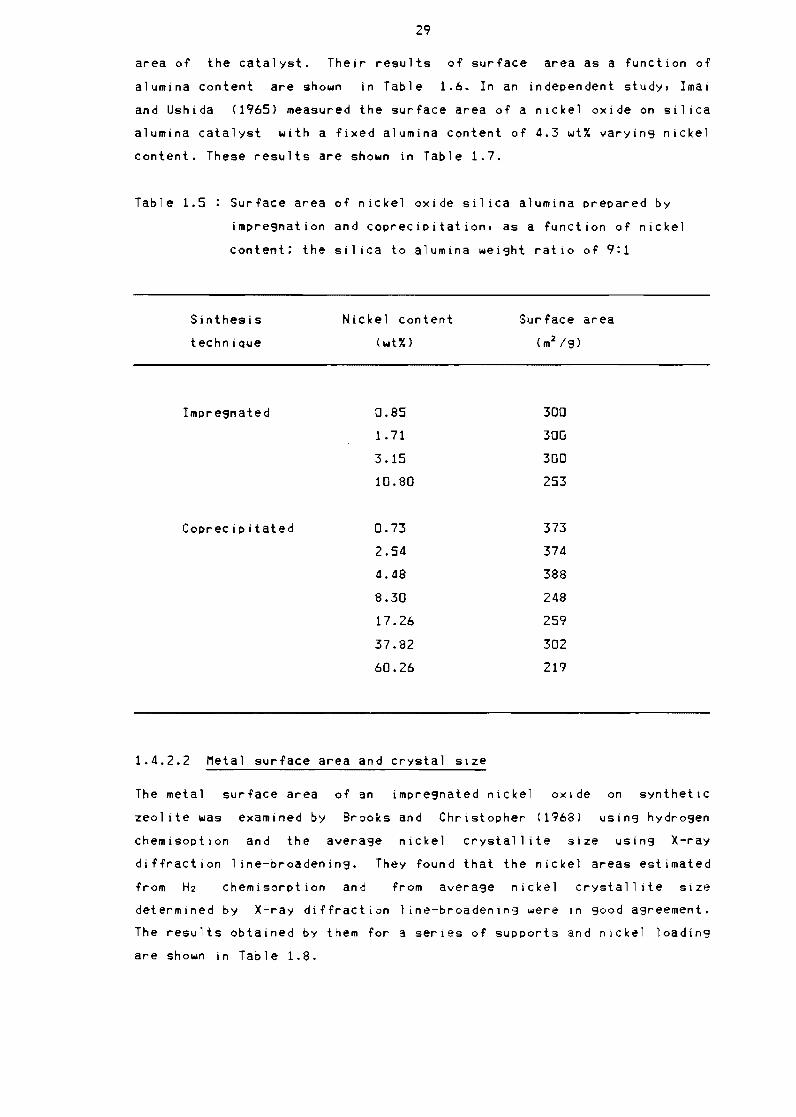
1421 Total surface area
The total surface area of nickel oxide on silica alumina was examined by
Holm et al (1957) for an impregnated and a Co-precipitated catalyst The
sil ica to alum1na weight ratio was held constant at 9 to 1 throughout
The results obtained as a function of nickel loading are given in
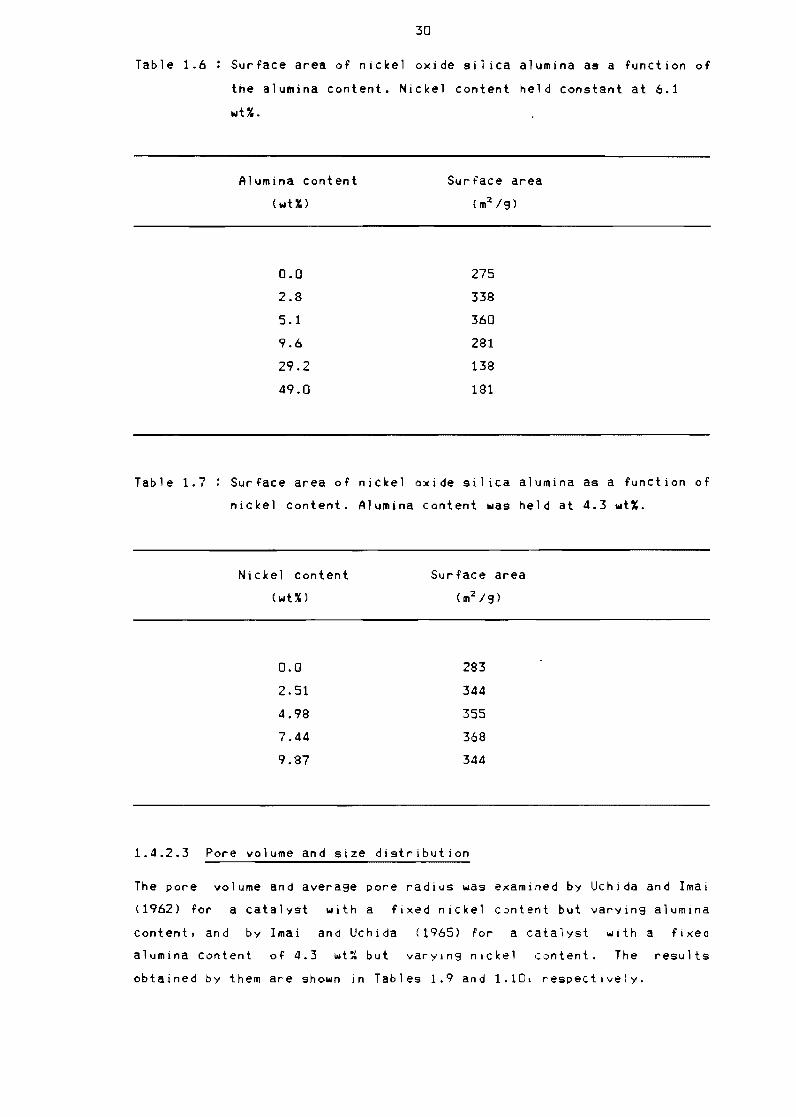
Table 15 Ushida and Imai (1962) using a co-precipitated nickel oxide
si 1 ica alumina catalyst with the nickel content fixed at 4 wt but
varYing the alumina content from 0 to 46 wt also measureJ the surface
29
area of the catalyst Their results of surface area as a function of
alumina content are shown in Table 16 In an independent study Imai
and Ushida (1965) measured the surface area of a nlckel oxide on silica
alumina catalyst with a fixed alumina content of 43 wt~ varyins nickel
content These results are shown in Table 17
Table 15 Surface area of nickel oxide sil ica alumina prepared by
impregnation and coprecipitation as a function of nickel
content the si1 ica to alumina weisht ratio of 91
Sinthesis Nickel content Surface area
technique (wU) (m2 IS)
Impregnated
Coprecipitated
085
1 71
315
1080
073
254
448
830
1726
3782
6026
300
300
300
253
373
374
388
248
259
302
219
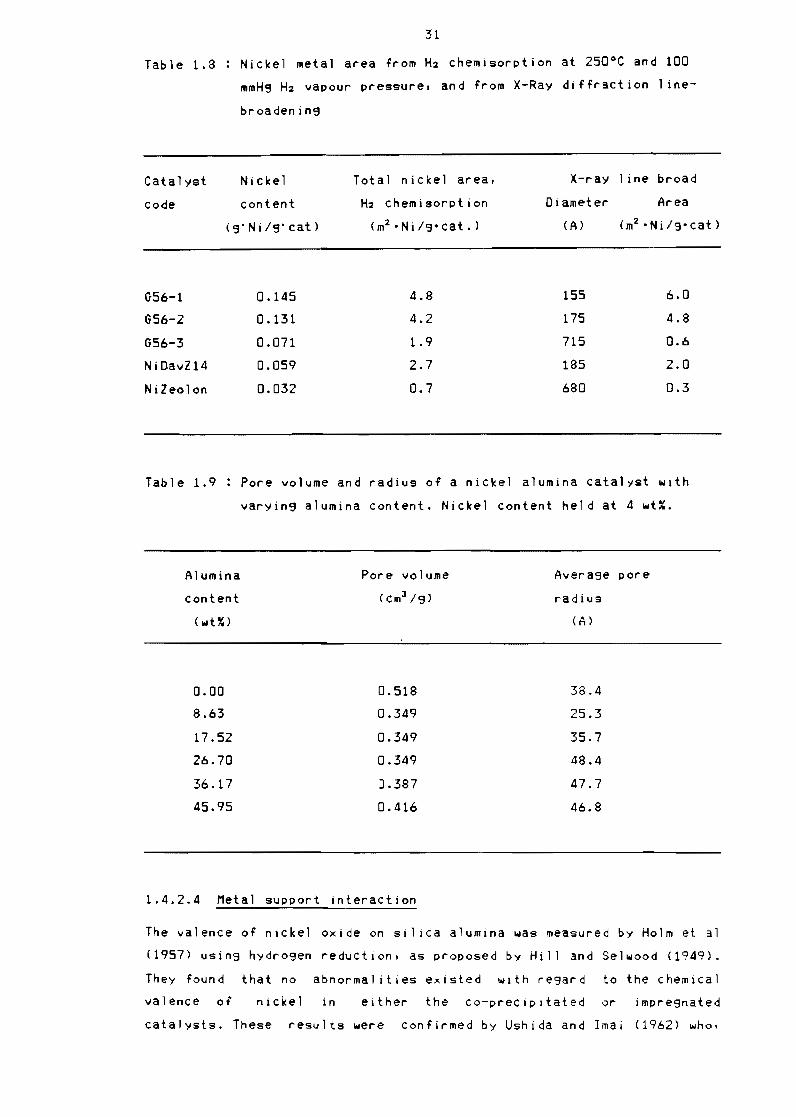
1422 Metal surface area and crystal size
The metal surface area of an impregnated nickel oxide on synthetlc
zeolite was examined by Brooks and Christopher (1968) using hydrogen
chemisoptlon and the average nickel crystallite size usin9 X-ray
diffraction line-broadenins They found that the nickel areas estimated
from H-z chemisorption and from averase nickel crystallite size
determined by X-ray diffraction line-broadening were In soad agreement
The results obtained by them for a series of supports and nickel loadins
are shown in Table 18
30
Table 16 Surface area of nickel oxide sii ica alumina as a function of
the alumina content Nickel content held constant at 61
wtX
Alumina content Surface area
(wtX) (m2 19)
00
28
51
96
292
490
275
338
360
281
138
181
Table 17 Surface area of nickel oxide silica alumina as a function of
nickel content Alumina content was held at 43 wtX
Nickel content Surface area
(wtX) (m2 19)
00
251
498
744
987
283
344
355
368
344
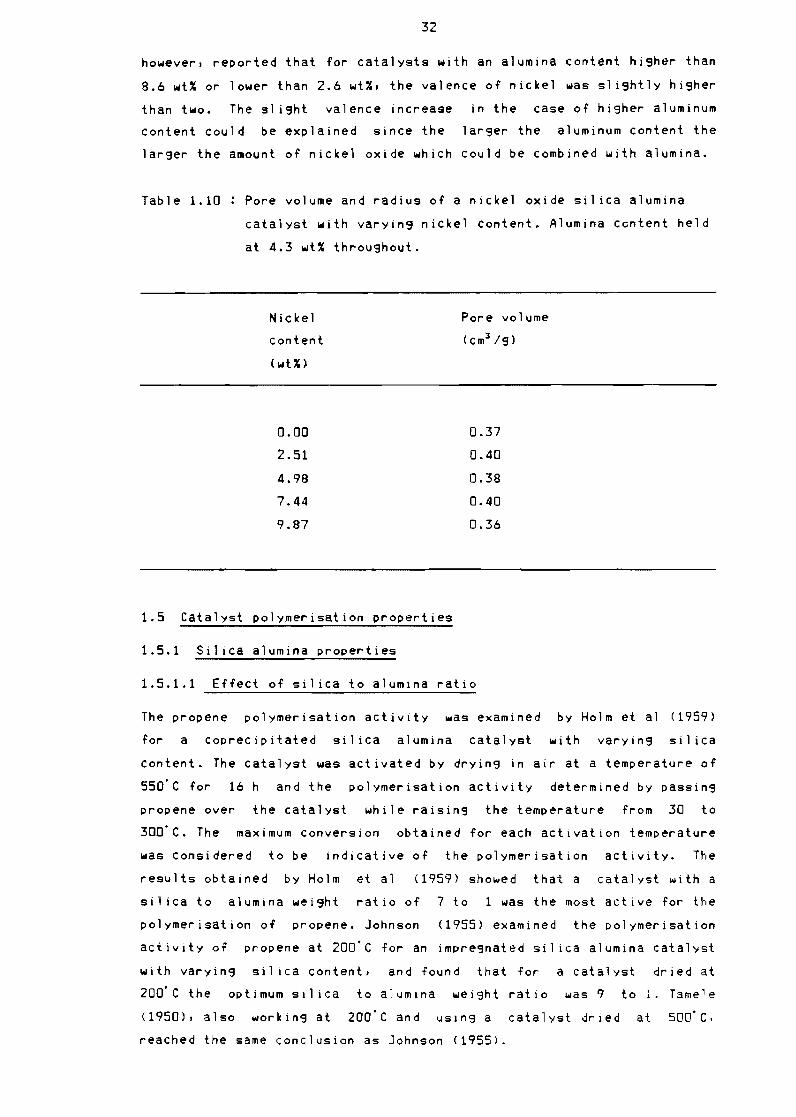
1423 Pore volume and size distribution
The pore volume and average pore radius was examined by Uchida and 1mai
(1962) for a catalyst with a fixed nickel content but varying alumina
content and by 1mai and Uchida (1965) for a catalyst with a fixed
alumina content of 43 wt~ but varYing nickel content The results
obtained by them are shown in Tables 19 and 110 respectively
31
Table 18 Nickel metal area from H2 chemisorption
mmH9 H2 vapour pressure and from X-Ray
broadenin9
at 250degC and 100
diffraction lineshy
Catalyst Nickel Total nickel area X-ray line broad
code content H2 chemisorption Diameter Area
(3Ni9cat) (m2 bull Nif 3 cat ) (A) (m2 bull Nilg cat)
G56-1 0145 48 155 60
G56-2 0131 42 175 48
G56-3 0071 19 715 06
NiDavZ14 0059 27 185 20
Nileolon 0032 07 680 03
Table 19 Pore volume and radius of a nickel alumina catalyst with
varyin9 alumina content Nickel content held at 4 wt~
Alumina Pore volume Avera3e pore
content (cm3 3) radius
(wU)
000
863
1752
2670
3617
4595
0518
0349
0349
0349
0387
0416
384
253
357
484
477
468
1424 Metal support interaction
The valence of nickel oxide on sil ica alumina was measured by Holm et al
(1957) using hydrogen reduction as proposed by Hill and Selwood (1949)
They found that no abnormalities existed with regard to the chemical
valence of nickel in either the co-preciPitated or impre3nated
catalysts These results were confirmed by Ushida and Imai (1962) who
32
however reported that for catalysts with an alumina content higher than
86 wt or lower than 26 wt the valence of nickel was slightly higher
than two The slight valence increase in the case of higher aluminum
content could be explained since the larger the aluminum content the
larger the amount of nickel oxide which could be combined with alumina
Table 110 Pore volume and radius of a nickel oxide sil ica alumina
catalyst with varying nickel content Alumina content held
at 43 wt throughout
Nickel Pore volume
content (cmJ 9)
(wU)
000
251
498
744
987
037
040
038
040
036
15 Catalyst polymerisation properties
151 Silica alumina properties
1511 Effect of sil ica to alumina ratio
The propene polymerisation activity was examined by Holm et al (1959)
for a coprecipitated silica alumina catalyst with varying silica
content The catalyst was activated by drying in air at a temperature of
550C for 16 h and the po1ymerisation activity determined by passing
propene over the catalyst while raising the temperature from 30 to
300middotC The maximum conversion obtained for each activation temperature
was considered to be indicative of the po1ymerisation activity The
results obtained by Holm et a1 (1959) showed that a catalyst With a
silica to alumina weight ratio of 7 to 1 was the most active for the
polymerisation of propene Johnson (1955) examined the polymerisation
activity Of propene at 200C for an impregnated ail ica alumina catalyst
with varying silica content and found that for a catalyst dried at
200C the optimum sll ica to alumIna weight ratio was 9 to 1 Tamele
(1950) also workIng at 200C and uSing a catalyst dried at 500middotC
reached the same conclusion as Johnson (1955)
33
1512 Eftect ot reaction temperatures
Silica alumina required temperatures higher than 200C to be active tor
the polymerisation of propene (Takahashi et a1 bullbull 1972) This was also
shown by Fe1db1yum and Baranova (1971) who working at 64C recorded
a conversion ot only 6~ The dependence Ot temperature tor propene
po1ymerisation over ail ica alumina was investigated by Takahashi et a1
(1972) in a t10w through system at a pressure Ot 50 atm The results
obtained by them are shown in Table 111
Tab 1 e 111 Propene 01 igomerisation on silica alumina at a constant
pressure of 50 atm and varying temperature Silica to
alumina ratio used was 94 to 3 throughout
Reaction Propene
temperature conversion
(OC)
200 126
250 407
300 641
350 679
1513 Ettect of space velocity
The relationship between the space velocity and po1ymerisation activity
expressed in terms of propene conversion was examined by Takahashi et
a1 (1972) tor a catalyst with a sil ica to alumina weight ratio Ot 9 to 1
at a temperature of 200degC and a pressure Ot 50 atm The results obtained
show that an inverse relationship exists between space velocity and
propene conversion
1514 Product spectrum
At the temperatures needed in the presence of silica alumina for propene
po1ymerisation dimerlsation is a minor reaction with the main product
being the propene trimer The effect Ot temperature on the product
spectrum at a pressure Ot 50 atm with a catalyst having a silica to
alUmlna ratio of 94 to 3 as established by Takahashi et al (1972) is
shown in Table 112 as are the results of Feldb1yum and Baranova
( 1971gt
34
Table 112 Product distribution of propene 01i90merised over silica
alumina as a function of temperature Reaction pressure is
50 atm
Researcher Feldblum and Takahashi et al (1972 )
Baranova ( 1971gt
Silica to 91 943
alumina ratio
Reaction
temperature 64 200 250 300 350
( degC )
Propene
conversion 6 126 407 641 679
(wtX)
Product
spectrum
Dimer (Co) 15 88 159 233 285
Trimer (C ) 756 438 362 307 231
Tetramer+ (Ct2+ ) 94 448 448 436 455
1515 Effect of activation
Holm et al (1959) examined the propene polmerisation activit of a
catalyst with a silica to alumina wei9ht ratio of 9 to 1 as a function
of the activation temperature Activation was achieved by holdin9 the
catalyst at each temperature for 16 h under dry air The found that the
optimum activation temperature with regards to propene 01 igomerisation
was 550middotC
152 Nickel oxide sil ica alumina properties
1521 Effect of synthesIs procedure
The two methods available for incorporating nickel onto silica alumina
are impre9nation and Coprecipitation The exact synthesis procedure and
nature of the catalyst has been discussed previously Holm et a1 (1957)
examined the polymerisation activity of catalysts prepared by these
35
methods and concluded that for coprecipitated catalysts the maximum
propene polymerisation activity was approximately 50X greater than that
for catalysts prepared by impregnation
1522 Effect of metal content
Hogan et al (1955) using a commercial catalyst with a sil ica to alumina
weight ratio of 9 to 1 concluded that when the metal was loaded onto
the support by impregnation the most active catalyst for the
po1ymerisation of propene contained between 3 and 5 wtX nickel Holm et
a1 (1957) using a co-precipitated and impregnated nickel oxide on
silica alumina catalyst establ ished that for both methods of loading
the maximum polymerisation activity per unit volume was also obtained
for a catalyst holding between 3 and 5 wtX nickel Takahashi et al
(1969) using a Commercial silica alumina with an alumina content of 13
wtX showed that for an impregnated catalyst a nickel content of 13 wtX
was optimum for the conversion of propene To maximize the yield of
propene dimer however the optimal nickel content was found to be 97
wtX When a co-precipitated as opposed to impregnated catalyst was
used Takahasi et al (1969) found that a nickel content between 3 and 5
wtX gave the optimum results for propene dimerisation
1523 Effect of reaction temperature and pressure
Hogan et a1 (1955) showed that when the reaction temperature was varied
from 35 to 130middotC the rate of reaction was highest in the ran~e of 70C
to 93middotC with a sharp dec1 ine in conversion when the pseudo-critical
temperature of 96C of the feed was exceeded and the system was
essentially in the vapour phase They concluded that the optimum
reaction conditions for the dimerisation of propene were a temperature
of 70C and a pressure of 40 atm Takahashi et a1 (1969) also examined
the effect of temperature and pressure with respect to propene
conversion and dimer yield and concluded that as long as the system
remained in the 1 iQuid phase the formation of dimers dominated with a
shift to heavier products as soon as the system moved into the vapour
phase The optimum conditions for the dimerisation of propene according
to Takahasi et a1 (1969) were a temperature of 70 to 80C with the
pressure ranging from 30 to 35 atm The above conclusions can easily be
represented graphiCally as shown in Figure 111
1524 Effect of feed composition and space velocity
Takahasi et al (1972) found that when pure propene was fed the surface
temperature of the catalysts rose far above the set reaction
temperature Consequently although the system was essentially in the
36
1000
~ (fJ 800 (fJ
II L
600 Z CJ t--I
(fJ 400 []
a w gt z CJ 200 U
00
[]
00 200 400 600 800 PRESSURE RTM
FIG 111 PRBPENE CBNVERSIBN (MRSS) VS PRESSURE (RTM)
1 iQuid phase a vapour phase reaction was taking place at the surface of
the catalyst with a corresponding shift to heavier products and rapid
deactivation of the catalyst It was therefore necessary to use a
mixture of propene and an inert diluent such as propane which served as
a heat sink and so controlled the catalyst surface temperature Hogan et
al(1955) varied the propene concentration in the feed from 7 to 37 vol~
at space velocities of 2 4 and 8 and concluded that the rate of polymer
production increased 1inearly with propene concentration A first order
relationship between propene concentration and rate of polymer formation
was obtained Hogan et a1 (1955) did not indicate how dimer selectivity
was affected as a function of feed composition Takahashi et al (1969)
using a 217 to 1 mixture of propene to propane wIth trace impurities
of ethane ethene and butenes concluded that the optimum space velocity
for the production of a propene dimer at the conditions of temperature
and pressure discussed earl ier was 750 g of propene per 1 iter of
catalyst per hour
1525 Effect of feed impurities
Hosan et a1 (1955) stated that the catalyst became deactivated if
allowed to absorb as 1ittle as 05 wt~ moisture This type of
contamination was however totally reversible Other impurities such
37
as acetelyne and carbon monoxide acted as severe poisons to nickel
oxide silica alumina while oxygen sulphur compounds and butadienes had
only a moderate poisoning effect The poisoning effect of these
materials was apparently not reversible as the catalyst did not
regenerate to any extent after removal of the contaminant from the feed
Takahashi (1969) on the other hand stated that the Scientific Design
Company had shown that by introduCing water or alcohol with the feed
the conversion of propene could be doubled without affecting
dimerisation activity
1526 Effect of activation procedure
The activation time temperature and gas flow rates were examined by
Takahashi et a1 (1969) with respect to acidity structure and propene
dimerisation activity of the catalyst They found when using 200 ml of
catalyst that a space velocity of 100 h- 1 of dry air at a temperature
between 500 and 600C was optimal and that the activity of the
catalysts increased with inCreasing activation time up to 5 h above
which the activity did not change Three distinct temperature regions
were identified by Takahashi et a1 (1969) between 300 and sOOmiddotC
physisorbed water was removed between 500 and 600middotC the concentration
of protoniC sites was highest and above 600 G C Lewis sites were formed
which could not be hydrated back to Bronsted sites
1527 Effect of regeneration
The po1ymerisation activity of the nickel oxide sil ica alumina catalysts
declined at a rate determined largely by the amount and type of
impurities in the feed and eventually regeneration was required (Hogan
et a1 bullbull 1955) The regeneration procedure was to strip the catalyst free
of hydrocarbon vapours and preheat it to a combustion temperature (about
400C) with dry inert gas The small amount of residual deposits were
then burnt off in dry air at 500C and the catalyst cooled under dry air
(Hogan et a1J 1955) After repeated regeneration the nickel oxide
promotor underwent changes which caused the activity to decline The
catalyst could however be restored to its initial activity by wetting
with a nitric acid solution followed by a normal activation
1528 Product spectrum
Takahasi et a1 (1969) together with Hogan et a1 (1955) fOlJnd that the
reaction conditions had a large influence on dimer compOSition The
reslJlts obtained by Takahashi et al (1969) at variolJs reaction
conditions are shown in Table 113 The products obtalned by Hogan et al
(1955) for once through propene conversion uSing a catalyst with 4 wt~
38
nickel at 75middotC and 40 atm and the results of Feldblyum and Baranova
(1971) using a temperature of 64C and a pressure of 50 atm and a
catalyst containing 45 wtX nickel are also shown in Table 113 Hogan
et 81 (1955) working with fixed feed composition and reaction conditions
studied the effect of varying the space velocity on the product
spectrum The results obtained by Hogan et al (1955) are shown in Table
114
1529 Lifetime
Hogan et al (1955) examined the lifetime of an impregnated nickel oxide
sil ica alumina catalyst using a cracked gas containing 25 molX ethene
10 mol~ propene and 12 mol~ butenes with butane as liquid diluent A 100
h run was done by Hogan et al (1955) and data was obtained on conversion
and on the properties of the products in butene-butane recycle
operation The reaction conditions used were a temperature of 65 to 75degC
and a pressure of 34 atm with feed rates of 600 standard volumes of
cracked gas and 4 1 iQuid volumes of butane-butenes per hour per volume
of catalyst The catalyst used contained 4 wtX nickel with a sil ica to
alumina weight ratio of 9 to 1 Hogan et al (1955) showed that the
activity of the catalyst with respect to total olefin conversion after
100 h on stream dropped from 99 to 96X The average rate of polymer
production was 350 ghlmiddotcat The polymer composition by volume was 13~
pentenes 26~ hexenes 20X heptenes and 41X octenes through decenes
In an indepndent study Allum (1974) prepared a nickel oXide silica
alumina catalyst by first impregnating silica gel with aluminium and
then with nickel The final catalyst contained 145 wtX aluminium 036
wtX sodium and 07 wt~ nickel The catalyst which was activated for 4 h
at 550degC under dry nitrogen was used to 01 igomerise 1-butene in daily
batches at aodegc and 54 atm in a 3 1 rocking autoclave for 24 consecutive
days The activity of the catalyst decreased from 020 grams of product
per gram of catalyst per hour (1st day) to 014 grams of product per
gram of catalyst per hour (24th day) Of the liquid 01 igomers 65 wt~
were octenes on the first day which rose to 85 wtX octenes on the 24th
day
16 Conclusion
As can be seen from the above discussion nickel oxide on Silica alumina
catalysts prepared by impregnation and coprecipitation have been studied
in great detail The technique of homogeneous decompositlon depOSition
for incorporating nickel into sil iea alumina is a much simpler technique
than coprecipitation and it is hoped that the catalytic properties with
39
respect to lifetime selectivity and activity are comparable to if not
better than the properties of coprecipitated or impregnated nickel
oxide silica alumIna catalysts
Table 113 Relationship between product distribution and reaction
conditions
a) Takahashi et al (1969) sil ica to alumina wei9ht ratio of 87 to 13
nickel content 13 wt~
b) H09sn et al (1955) silica to alumina wei9ht ratio of 9 to 1 nickel
content 4 wt~
c) Feldblyum and Baranova (1971) silica to alumina weight ratio of 9
to 1 nickel content 45 wtX
d) Distillation cut off temperature
Temperature Pressure
(degc ) (atm)
) 65
SO
90-95
120
75
75
75
75
75
80
75-80
75
35
35
35
35
15
20
25
30
32
35
50
70
47S
465
380
230
185
246
305
401
520
465
430
435
335
3S0
340
3S0
210
250
280
310
270
350
340
250
97
95
190
260
395
350
300
150
140
95
135
220
22
18
24
98
137
90
36
66
28
18
30
25
b ) 75 40 720 190 60 30
c ) 64 40 77 2 202 26
40
Table 114 Propene conversion and product spectrum as a function of
space velocity sil ica to alumina ratio is 9 to 1
throughout
Conversion Space Ct2 Ct 5 +
(wtX) ve 1oC ity
53 2 777 160 61 24
68 4 737 200 70 32
83 8 656 210 88 64
41
17 OBJECTIVE OF RESEARCH
The aim of this study was to investigate the propene oligomerisation
properties of NiOSi02-A1203 catalysts synthesi~ed using three
different techniques impregnation Co-precipitation and homogeneous
decomposition deposition The effect of the following factors on the
activIty selectivity and 1 ifetime of these catalysts for propene
01 igomerisation were investigated
(i) Nickel content of catalysts
(ii) Reaction pressure and temperature
(iii) Weight hourly space velocity
(iv) Reactor temperature stabil ity and
(V) Propene feed moisture content
42
2 DESIGN OF ISOTHERMAL REACTOR
21 Introduction
In order to facilitate interpretation of reactor data it was important
that the reactor used in this study was as isothermal as possible
Various attempts have been made to achieve this Hogan et al (1955)
surrounded the reactor with an electrically heated jacket containing a
liQuid which was boiled at a temperature fixed by the pressure of an
inert gas applied to the top of the reflux condenser Imai (1968) on
the other hand inserted the reactor into a heated bed of iron powder
In the case of the present work a similar system was used to achieve
isothermal conditions A detailed description of the design of this
reactor will now be given
22 F1uidisation theory
If a fluid passes upward through a bed of solids at a low velocity the
pressure drop aCross the bed is the same as that for a downward flow As
the fluid velocity increases the particles become rearranged so that
they offer less resistance to the flow and the bed starts to expand
This process continues as the velocity is increased with the total
frictional force remaining eQual to the weight of the particles until
the bed has assumed the lowest stable form of packing If the velocity
is then increased further the individual particles separate from one
another and become freely supported in the fluid At this stage the bed
is said to be fluidised Further increases in fluid velocity cause the
particles to separate still further from one another and pressure
differences remain approximately eQual to the weight per unit area of
the bed The above phenomenon can be represented graphically if the
pressure drop across the bed is plotted against fluid velocity through
the bed using logarithmic co-ordinates
Thus in Figure 21 (Coulson and Richardson 1980) a 1 inear relation is
obtained on a log log scale up to the point where bed expansion takes
place (A) The slope of the curve then gradually diminishes as the bed
expands As the velOCity is increased the pressure drop passes through
a maximum value (B) and finally falls slightly before attaining an
approximate constant value independent of fluid velocity (CO) The
section (CO) of the Curve is an indication of the Qual ity of
fluidisation for if the pressure drop is constant as the fluid velocity
43
increases channel in~ is absent Point (B) which 1 ies above (CO)
identifies the point where the frictional forces between the particles
is bein~ overcome prior to rearran~ement The point of minimum
fluidisation velocity ie bullbull the fluidising point is shown on this
Curve at (E) (Coulson and Richardson 1980)
FLUIDISED BEDFIXED BED
0shyltl I VELOCITY
INCREASING
FLUIDISING
POINT
VELOCITY DECREASING
(BED OF MAXIMUM I
POROSITY)
I
I I
LBG (Ve) FIG 21 PRESSURE DRep eVER FIXED AND FLUIDISED
BEDS
23 Heat transfer
Fluidised beds have good heat transfer properties and are ideal in a
system where close control of temperature is reQuired The intimate
mixing which takes place in the bed ensures that heat transfer
throughout the system is very rapid and that uniform temperatures are
Quickly attained
Three mechanisms have been suggested to explain this improvement in heat
transfer coefficient An increase of up to one-hundred fold as compared
with the value obtained with a gas alone at the same velOCity can be
attained by the presence of the sol id Coulson and Richardson (1980)
stated that the particles whose heat capacity per unit volume IS many
times greater than that of the gas act as heat transferring agents As
a result of their rapid movement within the bed they pass from the bulk
of the bed to the layers of gas in close contact with the heat transfer
44
surface exchanging heat at this point and returning to the body of the
bed This together with the extremely short physical contact time of
the particle with the surface ensures that the thermal conductivity of
the particle is not an important factor The second mechanism proposed
by Coulson and Richardson (1980) is the erosion of the 1amminar sub1ayer
by the particles and the subsequent reduction in its effective
thickness A third mechanism suggested by Mickley and Fairbanks (1955)
is that packets of particles move to the heat transfer surface and an
unsteady heat transfer process takes place
Many equations are available in the 1 iterature to calculate the
convection heat transfer coefficient of the gas solid system One
equation which seems to be the most re1 iab1e is that of Dow and Jakob
(1951) The Nusse1t number with respect to the tube diameter is
expressed as a function of four dimensionless groups the ratio of tube
diameter to length ratio of tube to particle diameter ratio of heat
capacity per unit volume of the sol id to that of the fluid and finally
the tube Reynolds number These relations are combined as shown below
where h is the heat transfer coefficient
k is the thermal conductivity of the gas
d is the particle diameter
dt is the tube diameter
is the 1ength of the bed
E is the bed voidage
P is the density of the sol i d
p is the density of the gas
c is the specific heat of the sol id
c is the specific heat of the gas
v is the viscosity of the gas and
Uc is the superficial velocity based on the empty tube
At the present stage of our knowledge the above equation seems the most
re1 iab1e and will thus be used to estimate heat transfer coefficients
and optimum particle diameter
24 F1uidising medium
Various materials were investigated It was assumed that each material
had a discreet size fraction As a high heat transfer coefficient was
important if the f1uidised bed was to perform its function effectively
45
the equation developed by Dow and Jakob (1951) as discussed abov~ was
used to compare the various sol ids Furthermore two bed temperatures
were used to identify any changes in heat transfer coefficients as a
function of bed temperature The results are shown in Figures 22 and
23 It can be seen from these figures that a maximum exists at a
particle size of approximately 150 ~m and that the convective heat
transfer coefficient drops slightly as the bed temperature is increased
Copper powder gave the best results a heat transfer coefficient in
excess of 1000 Wm2 K for a particle of 150 ~m The explosive and toxic
nature of meta1l ic dust at the temperatures reached during calCination
made this an undesirable solution Sand however was less dependant on
both the particle size and bed temperature is totally inert and readily
available It was thus decided that sand would be used as fluidising
medium
241 Sand data
Two sands were readily available These were coded by the manufacturer
as No1 and No 12 Their size distributions are shown in Table 21 As
the actual material had a size range rather than a discreet particle
size an effective particle diameter had to be establ ished Using the
relation suggested by Leva (1959)
where d is the effective particle size and Xi is the size fraction of
particles of size dt the effective particle size was calculated
The efficiency of f1uidisation (Leva 1959) of sands with wide (No 12)
as opposed to narrow (No2) size distributions effectively eliminated
sand No 12 from further consideration
25 Optimisation of the fluidised bed
As discussed In Section 21 a bed of sol ids becomes fluidised only when
the superficial velocity exceeds the minimum fluidisation veloCity As
it is important for the bed to be totally fluidised the minimum
fluidising velocity has to be found For this reason the system was
modified as shown in Figure 24 An attempt was made to measure the
pressure drop across the bed Itself but was Tound not to be pOSSible as
the fluidislng medium would block the tapPIng point at the bottom of the
bed
46
c 11 00
N ltl L 900 3
bull bull 700
LL LL W ~ U 500
bull IshyU 300 W gt z CSJU 100
(J=SAND ()=CepPER amp=lINC +=ALUNINIUN X =cepPER ax 1DE 0=ZINC aXIDE
~~---e------pound9-__
00 500 1000 1500 2000 2500 3000 3500
PRRTICRL DIRMETER UM FIG 22 CBNVECTIBN CBEFFICIENT (WMa2 K) VS
PRRTICRt SIZE (UM) 25C shy
c 900
N ltl L
3 700 bull
LL lLW 500
~ U
bull I- 300 U W gt z CSJ U 100
+=ALUNINIUN x =capPER ax I DE 0=lINC eXIDE
(J=SAND ()=cepPER amp=ll NC
00 500 1000 1500 2000 2500 3000 3500
PRRTICRL DIRMETER UM FIG 23 CBNVECTIBN CBEFFICIENT (WMa2 KJ VS
P R R T 1 CAt S I Z E (U M ) 190 bull C
47
11
FIG 24 REACTOR MODIFICATIONS TO MEASURE PRESSURE DROP
48
Key to Figure 24
1 Feed in 1et
2 Feed preheater
3 Product outlet
4 Integral reactor
5 Reactor support
6 Thermowe 11
7 Tubular embedded element (10 kW)
8 Mica band elements (05 kW)
9 Insulation
10 Fluidised sand bed
11 Gas distributor
12 Rotameter
13 Air supply
14 Oisengagement zone support
15 U-tube manometer
The procedure used to determine the data to prepare a plot of pressure
drop across the bed vs the superficial velocity through the bed is
discussed below
Table 21 Sand size fractions
Size No 12 No 2
(vm) (wU) (wU)
-420
420-350
350-297
297-250
250-210
210-177
177-149
149-125
125-105
105-74
74 shy
Mean size
06
190
336
289
155
22
02
(101m) 1668
01
04
21
86
202
153
242
125
117
49
1243
49
251 Airflow optimisation
The calibration chart of the rotameter could be approximated usin9
Vc = 1983 + 0S8SmiddotTR + 0005 TR2
where Vc is the volumetric flowrate in lmin at lSC (Tc) and 760 mmH9
(Pc) and TR is the rotameter tube readin9 Usin9 ideal 9as behavior
this can be corrected to the actual temperature (Tr) and pressure (Pr)
in the rotameter usin9
Vr = (Vc Pc Tr ) I (Tc P r )
where Vr is the volumetric flowrate at rotameter temperature
and pressure
The pressure in the rotameter was that measured at the inlet to the bed
and was use to calculate the actual flowrate at each tube readin9 If
the 109 of the pressure drop across the bed and 4Ha was plotted a96inst
the 109 of the superfiCial velocity a strai9ht line was obtained The
9raph is shown in Fi9ure 25 The shape of this curve does not
correspond to that of the curve as discussed in Section 21 This is due ( l _ -- i~ -()~
to the fact that the pressure drop across the d~sk was included in the
calculation
200
60 0
IT I-shy--J W 20 0
D ~
080--J
040
-27 -25 -23 -2 -9 - 7 - 5
LBG (Vel FIG 25 PRESSURE DRBP VS SUPPERFICIRL VELBCITY
RCRBSS DISK RND BED
50 - ~
Having previously determined the pressure drop across the d~ the
actual pressure in the bottom of the bed could be calculated at each
rotameter tube reading using
Pb = Pr - Pd
where Pb is the pressure in mmHg at the bOttOM of the bed above the
disk and Pd is the pressure in mmHg in the rotameter when no sand was
in the bed
This corrected pressure was then used to calculate the actual flowrate
through the bed The temperatures of the rotameter and bed were assumed
to be identical and so
where Vb is the air flowrate at the bottom of the bed in lmin Using
the above procedure and plotting the log of the pressure drop across the
bed (Pb) against the log of the superficial velocity (Vb) a Curve of the
classic shape is obtained as shown in Figure 26 without the integral
reactor and in Figure 27 with the integral reactor in the bed In both
cases the minimum fluidisation veloCity was round to be 121 llmin
(Point E on Figures 26 and 27) and channel ing was absent (Part CD in
Figures 26 and 27 is flatgt
a
IT Ishy--J W 0 --
0 ~
1 70
1 50
1 30
10
090
070
050
-26 -26 -24 -22 -20 -1 6 -1 6
LBG (VC) FIG 26 PRESSURE DRep VS SUPPERFICIAL VELeCITY
INTEGRAL REACTeR ABSENT
51
1 70
shy
I 50
CL 1 30
CI f shy~ W 1 10 0
0900 a ~
070
050
-28 -26 -24 -22 LBG (Ve)
-20 -1 8 -1 6
FIG 27 PRESSURE INTEGRRL
DRBP VS RERCTBR
SUPPERFICIRL PRESENT
VELBCITY
252 Temperature correction
As the temperature in the bed increased to reaction conditions the
superficial velocity increased at a fixed rotameter setting This
resulted in a change in the Quality of fluidisation It was thus
desirable to develop a relationship between the bed temperature and the
rotameter tube reading at the minimum fluidisation velocity As the
temperature of the gas was raised to 330degC within 25 mm above the
distributor as shown by Heertjie and McKibbins (1956) the only
assumptions that had to be made was that the pressure drop across the
bed and di-~k-~as independent of temperature and that the i deal gas 1aw
applied Thus
To find the tube reading which corresponds to the air flowrate
calculated above the value had to be corrected to the rotameter
cal ibration conditions using
Vc = (VrTcPr)(PcTr)
Combining the above eQuation with that used to approximate the rotameter
cal ibration chart and solving for TR we get
52
TR = -585 + laquo30234 + 200Vr )s)
Tne resultin~ ~rapn is snown in Fi~ure 28 Usin~ tnis ~raph it was
ensured that the superficial velocity in the bed was close to the
minimum fluidisation velocity at any bed temperature
0 Z 0 CI W 0
W CO J I shy
200
180
160
14 0
120
100
80
60
00 400 800 1200 1600 2000 2400 2800
TEMPERRTURE C FIG 28 BED TEMPERATURE ( C) VS RBTAMETER
SETTING VB=121 LIMIN
53
3 EXPERIMENTAL METHODS
31 The reactor system
311 Layout
All experimental work was done in an inte~ra1 hi~h pressure reactor
system A dia~ram of this system is shown in Fi~ure 31 The feed a 41
mixture of propenepropane obtained from SASOL was contained in a
number seven Cadac cy1 inder mounted bottom up to ensure that only 1i~uid
emanated from it Water and entrained impurities were removed from the
feed by passin~ it throu~h a bed of Union Carbide 3 A molecular sieves
and through a 1 ~m sintered metal filter
The vapour pressure of the feed had to be lowered before it could be
pumped by the Lewa hi~h pressure diaphragm pump To achieve this the
feed was piped throu~h a heat exchan~er held at -1SC The pump head was
also cooled to this temperature In this way cavitation was prevented
and efficient workin~ of the pump was ensured From the delivery side of
the pump the feed was piped throu~h a preheater where it was heated to
within 20C of the operatin~ temperature to the top of the integral
reactor
The products from the reactor were piped throu~h a heat exchanger held
at 6C and a 20 ~m sintered metal filter to the Grove Mity Mite back
pressure re~ulator Here the materials were released to atmospheric
pressure The back pressure re~u1ator had to be heated to 60C to
prevent freezin~ of the products due to a Joule Thomson expansion and
subse~uent failure of the unit To achieve this a water bath was used
the liquid bein~ pumped throu~h a pipe wrapped around the outside of the
unit
The products were then piped via a heat exchan~er to a double walled
catchpot where ~as-1 iQuid separation occurred To ensure total
separation the 1 iberated ~as was passed through a Davies double surface
condenser held at -1SC with the condensate fed back to the catchpot
The catchpot was periodically drained and the liquid stored for later
analysIs The flue gas was then piped through a 10 1 surge tank to the
wet ~as flow meter Finally the flue gas was passed through a sampl ing
loop which could be removed from the system and vented to the
atmosphere
54 regshy --
--8
regshyL-------r
middot x lJJ l shymiddotI ltI)
middot I
I gtshyltI)bull
I 0
I C I l shy
( ltr I lJJ
0 I -
rlt
e-uc1
reg-r-------- r-I-rx1---1________J
regt--==-==-=--=-=--=--_==-==-~=r111_~r--------
55
Key to Figure 31
1 Monomer feed cylinder
2 Dimer feed cyl inder
3 Gas tight Quick connector
4 3A molecular sieve holder
5 1~m sintered metal filter
6 20~m sintered metal filter
7 Glycolethanol cooler
8 Glycolwater cooler
9 Glycolwater cooled catchpot
10 Glycolethanol cooled condenser
11 Monomer pump
12 Dimer pump
13 Bursting disk (70 atm)
14 Thermowell
15 Reactor
16 Fluidised sand bed
17 Feed preheater
18 150vm sintered brass disk
19 10 mm rotameter
20 Oil condenser
21 Back pressure regulator
22 Condensation unit
23 Surge tank
24 Wet gas flow meter
25 Gas sampl ing loop
26 Nitrogen bottle (hish purity)
27 Nitrogen bottle
28 Air supply
29 Hydrogen bottle (high purity)
A separate line was used to purge the reactor with wet or dry hydrogen
nitrogen or air depending on the pretreatment required by the catalyst
Vent lines were installed to prevent air locks in the system during
start up
The safety of the line was ensured by a bursting disk set at 70 atm and
a pressure re1 ief valve in the pump which permitted internal circulation
if the del ivery side pressure exceeded the set point
Two cooling Circuits were employed An ethylene glycolwater mixture at
6C was used to cool the catchpot and all product heat exchangers while
56
an ethanolwater mixture at -10C was used to cool the feed heat
exchanger pump head and the flue gas condenser
32 Reactor
Before any statement could be made about the effects of temperature on a
reaction in an integral reactor the latter had to be as nearly
isothermal as possible Various attempts have been made to achieve
isothermal ity eg Hogan et a1 (1955) surrounded the reactor with an
electrically heated jacket containing a 1 iQuid which was boiled at a
temperature fixed by the pressure of inert gas applied to the top of the
reflux condenser 1mai (1968) on the other hand inserted the reactor
into a heated fluidised bed of iron powder In the present work the
system used by Imai (1968) was adopted Sand was however substituted for
iron powder as the explosive and toxic nature of metal1 ic dust at the
temperatures reached during calcination made the latter undesirable The
final result was a reactor where the temperature in the catalyst bed
could be held within 5C of the set point Each aspect of this design
was discussed in Chapter 2 while a description of the reactor is given
below The reactor consisted of two distinct parts the fluidised bed
and the integral reactor Both are shown in Figure 32
321 F1uidised Bed
The fluidised bed consisted of a rolled sheet metal chimney with a
removable disengagement zone An inverted tripod was suspended from the
top of the chimney into which the reactor was hung Air was injected
into a sealed chamber at the bottom of the bed in such a way as to
prevent impingement of the gas on the distributor (see Figure 32) The
distributor used was alSO vm sintered brass disk Great care had to be
taken to mount the gas distributor absolutely horizontally as severe
channeling and corresponding loss in heat transfer efficienCY would
result otherwise The air flow through the bed was controlled usin9 a 10
mm gas rotameter with a stainless steel float
Heat was suppl ied to the fluidised bed by five mica band elements
strapped around the outside of the chimney Each element was rated at
05 k~ The controlling thermocouple Cchromel-alumel) was situated on
the inside wall of the chimney half way up the bed To prevent heat loss
to the surrounding the entire unit was insulated using asbestos cloth
57
reg
FIG 32 INTEGRAL REACTOR AND FLUIDISED SAND BED
58
Key to Figure 32
1 Feed inlet
2 Feed preheater
3 Product outlet
4 Integral reactor
5 Reactor support
6 Thermowell
7 Tubular embedded element (10 kW)
8 Mica band element
9 Insulation
10 Fluidised sand bed
11 Gas distributor
12 Rotameter
13 Air supply
14 Disengagement zone support
322 Integral Reactor
The reactor was a multi-component single seal unit with a bed diameter
of 25 cm Two distinct sections could be identified cross-sections of
which are shown in an exploded form in Figure 33
The insert consisted of the top flange through which the thermowell and
feed were passed and the catalyst bed jacket which was screwed into the
bottom of this flange The catalyst bed jacket was stoppered at its
lower end by a perforated plug which prevented bed entrainment and
centered the bottom end of the thermowell Holes were drilled through
the top flange to allow passage of the securing bolts The sleeve
consisted of the bottom flange to which the reactor jacket was welded
which in turn was sealed at its lower end by a Concave plug through
which the products were taped off Securing bolts were anchored in the
top surface of the bottom flange Sealing was achieved by a groove in
the bottom flange and a ridge in the top flange These served as a seat
for a laminated graphite nickel seal
Separation of the units upon completion of a run was achieved with the
aid of two 6 mm bolts These bolts were screwed through holes in the top
flange onto the top surface of the bottom flange In this way the units
could be forced apart
Heat was supplied to the unit by a 1 kW tubular imbedded element wrapped
around the outside of the reactor jacket This element was used only
59
o
e- _ _--+-shy
FIG 33 INTEGRAL REACTOR
60
Key to Figure 33
1 Reactor sleve
2 Plug
3 Seal ing bolts
4 Sealing groove
5 Bottom flange
6 Top flange
7 Reactor insert
8 Feed inlet
9 Thermowell inlet
10 Sealing ridge
11 Thermowe 11
12 Bed seath
13 Purforated plug
14 Sealing bolt channel
15 Seperation bolt channel
during calcination The controll ing thermocouple (chromel-alume1) was
placed halfway up the thermowel1 running down the center of the catalyst
bed
Temperatures of the reactor fluidised bed and feed were monitored using
a Digitron temperature display connected to 11 iron-constantan
thermocouples Ten of these were situated at regular intervals in the
central thermowe11 to record the catalyst bed temperature profile and
feed temperature The fluidised bed thermocouple was mobile and could be
moved throughout the bed
33 Operation
331 Loading
For every run the reactor was packed in a similar way as shown in Figure
34 Four distinct regions were identified These were from the bottom
up
1 A region of void capped with a wire mesh which prevented the
catalyst and beads from blocking the reactor exit
2 A layer of glass beads which served as a disengagement zone and
prevented catalyst entrainment
3 The catalyst bed which Consisted of 11~ inch extrudates mixed with
2 mm glass beads in a ratio of 11 by volume The beads served as a
heat sink and catalyst diluent
4 A plug of glass beads capped by a wire mesh This ensured preheating
and prevented movement of the bed during sudden pressure drops
The depth of each layer was accurately measured to fix the number and
position of the thermocouples in each region
332 Calcination procedure
Prior to each run the catalyst was calcined The purpose of calcination
was to burn off organic intermediates incorporated in the catalyst
during synthesis and to convert all the nickel nitrate to nickel oxide
At the same time the catalyst was freed of all but a trace of moisture
(Hogan et a1 1955)
Calcination for all experimental work was carried out in-situ Dry air
was passed through the bed at a rate of 500 m1-gasm1-cat-h while the
temperature was stepped up in 50degC increments at intervals of 10 min
The activation was continued for an additional 4 h at 500degC
Upon completion of this step the activated catalyst was purged with dry
nitrogen until the temperature of the bed dropped to 250degC When this
temperature was reached the reactor was sealed at a pressure of 10 atm
under dry nitrogen before being allowed to cool to room temperature
35 ml of 2 mm 91ass beads
18 m1 of catalyst mixed
with 2 mm glass beads in
a ratio of 11 (vv)
Total volume 80 ml
50 ml of 2 mm glass beads
void
FIG 34 REACTOR BED
62
333 Start-up
Prior to introducing the reactants into the system the cooling circuits
and water bath were allowed to operate for a sufficiently long time to
ensure that the temperatures reached steady state The back pressure
regulator was set to the desired value and the fluidising air set to the
value determined previously
The feed cyl inder was then opened and the reactants allowed to flow to
the inlet of the sealed reactor All air was removed from the low
pressure side via a vent 1 ine and the pump started At this time the
reactants were allowed to flow through the reactor and into the rest of
the line When the pressure in the system reached its set point the
pump setting was altered to give the correct feed rate Once this had
been achieved the temperature of the bed was set to the desired value
When the first drops of liquid were collected the feed cyl inder was
changed and the catchpot emptied This was taken as time zero Although
a certain amount of data was lost during start-up this persisted over a
relatively small time fraction of the entire run Little significant
information was therefore lost Furthermore in this way the liquid left
in the line and reactor at the end of a run did not affect the mass
balance
334 Steady state operation
To monitor the performance of the isothermal reactor and the catalyst
the following readings were taken at selected time intervals
- bed temperature profile
- fluidised bed temperature
- fluidising air flow
- 1 iQuid mass and volume
- tail gas meter reading
- tail gas temperature
- GC analysis of tail gas
- GC analysis of 1 iquid
The feed cyl inder was changed when necessary The mass of the used and
fresh cylinder was noted
335 Shut-down
When shutting down the system the feed pump was switched off and the ~~
procedure as outlined above followed The feed cyl inder was however not
replaced Once the relevant data had been collected
- the temperature controllers were switched off
- the coolant and heating flows were stopped
- the system pressure was released to atmosphere
Temperature runaways did not oCcur during start up However it was
found that the degree of control that could be exercised was sensitive
to sand height and the pOSition of the contro11 ing thermocouple in the
fluidised bed which were consequently monitored by visual inspection
throughout the run
34 Data analysis
The data and collected during the run was analysed using a variety of
procedures These are discussed below
341 Computation of results
A computer program was util ised to analyse the data obtained during the
runs The following was computed
Mass balance The percentage mass loss was calculated using
(total liquid out + total gas OUU]X mass loss = 1 - - 100
[ (total weight of feed in)
where the (total liquid out) is measured directly by adding the weight
of all 1 iquid sampled The (total gas out) was calculated using
(P-V-M)total gas out =
(Z-R-rgt
where P = pressure in atm
V = total volume of fl ue gas in 1 i ters
M = molecular weight based on mean over entire run
Z = compressibility factor (0986)
R = universal gas constant (S21xlO- 2 atmlgmoleK) and
T = gas meter temperature In K
64
Two limiting cases of where mass loss could OCcur would be 1) all mass
was lost before the reactor in which case the mass out would be equal to
the effective mass in and 2) all mass was lost after the reactor in
which case the mass in would be equal to the mass out plus the mass
lost To account for the mass lost it was assumed that the rate of mass
loss was constant throughout the run and that the mass was lost in the
form of gas The calculated WHSV and conversion would depend upon where
the mass loss occured The equations used to calculate these are shown
below
Wei9ht Hourly Space Velocity This was the rate of feed in per hour per
gram of catalyst and was calculated usin9
(mass of propene and propane passing over the catalyst)WHSV =
(total time)(catalyst mass)
where n = 1 if it was assumed that all mass was lost before the reactor
n =2 if it was assumed that all mass was lost after the reactor
Liquid production rate This is an indication of the activity of the
catalyst and is expressed in terms of grams of liquid product obtained
per gram of catalyst per hour As it was assumed that all mass lost was
gas the mass of liquid out was that measured and the LPR was calculated
using
(mass of liquid out - mass of dissolved gas)LPR =
(total time)(mass of catalyst)
Liquid mass X conversion This is calculated using the formula
mass X conversion =[ (LPR) ] 100 WHSVn(w)
where n = 1 if it was assumed that all mass was lost before the reactor
n = 2 if it was assumed that all mass was lost after the reactor
w is the mass fraction of propene in the feed
Liquid sample composition The liquid product was grouped into 01 igomers
of propene as dimer trimer tetramer etc The liquid composition was
based on the mass percent output the response factors havin~ been set
equal to one It can be used to compare 01 i~omer production rate between
different runs and variations with time in a particular run
65
Gas sample composition This data is expressed in terms of mass X since
all GC response factors have been determined
Apart from the mass balance data all other results could be presented in
graphiCal form as functions of time on stream ~hen the data was plotted
in this wayan average time between two sampling pOints was used Data
was recorded only from the time that the first drop of product was
collected this time being defined as time zero
35 Analytical procedure
351 Gas analysis
Both the feed gas and flue gas were analysed on a Gow-Mac 750p gas
chromatograph whose responses from the detector were monitored by a
Varian 4270 intergrator The packing used for this work was n-Octane
Poracil C in a 55 m glass column with an inner diameter of 4 mm Table
31 shows the typiCal composition of the feed used The GC settings
used together with a typical chromatogram of the feed with its retention
times and response factors are shown in Appendix A as is a discussion
of the calibration procedure
Table 31 Feed Composition
Hydrocarbon MassX
Methane 00
Ethane 09
Propane 20
Propene 78
Iso-Butane 02
N-Butane 02
1-Butene 04
Iso-Butene 01
T2-Butene 01
C2-Butene 01 C5+ 02
352 LiQuid analysis
LiQuid samples were analysed by a Varian 3400 together with a Varian
8000 auto sampler The packing used for this work was 3 3i1 iconOV-lDl
66
on Chromosorb W-HP 100120 mesh in a 3 m long glass column with an inner
diameter of 4 mm The responses from the GC were monitored by the
Varian Vista 401 data system This system could be programmed to give an
integral analysis of the results The GC settings as well as a
discussion of the optimisation and cal ibration procedure used are given
in Appendix A
Due to the complex nature of the liquid products the analysis of the
liquid spectra was difficult To facilitate product analysis it was
decided that the 1 iquid product analysis be based on carbon number
groupings rather than on individual Components The groupings chosen are
shown in Table 32
Table 32 Carbon number groupings used for 1 iquid analysis
Group Range
Monomer (C3 ) C3 -c Dimer (C ) C~ -C7
Trimer (C ) Ca -Ct 0
Tetramer (C t 2 ) Ctt-Ct3
Pentamer (C t ~ ) Ct -Ct
Heptamer (Cta ) Cn -C
Hexamer (C2 t ) C20+
353 Nuclear magnetic resonance
The hydrocarbon functional group distribution of C to Cta propene
oligomerisation products was determined using lH NMR Conventional
methods of spectral analysis for propene 01 igomers were inadequate
because of the great variety of head to tail and tail to tail fragments
generated and because of the greater influence from end groups
As 13C NMR was not available at the time of this work only a partial
analysis of the 1 iQuid products was possible The information thus
obtained was that of the type of proton present primary secondary or
tertiary The characteristic proton chemical shift for the relevant
protons are shown in Table 33 (Galya et a1 bullbull 1985)
67
Table 33 Structure definitions of terms and NMR spectral
positions and area code (Galya et al bullbull 1985)
Species Structure Area
(ppm) Code
Protonated aromatic
Olefinic CH2
Olefinic CH
Aromatic CH
Aliphatic region
or to aromatic CH2
or to aromatic CH3
or to olefinic
CH CH2
or to olefinic
CH3
11 to olefinic
CH CH2
CH2 between
isopropyl end
groups and CHs
Term i na 1 CH3
Internal CH3
and olefinic region_
R-CH=CH2
R-CH=CH-R
ltO~CH2-CH2-R
ltO~CH3
R2-CH-CH=CH-CH2-R
R-CH=CH-CH3
CH3 -(CH2)2 -CH=CH-R
R-CH(CH3 )-(CH2 )2 -CH=CH-R
450-475 L
475-575 M
650-730 N
230-300 A
210-230 B
180-210 C
1 40-1 80 o
100-140 E
092-1 00 F
084-092 G
070-084 H
68
Using the equations developed by Galya et a1 (1985) for the C6 to Cta
oligomerisation products of propene each lH area was first converted to
a carbon area before the percentage of each was calculated
The carbon area of CH3 was calculated using
(Area G + Area 0 + Area B + Area H)CH3 carbon area =
3
and the carbon areas of CH2 and CH were calculated using
(Area E + Area A + Area C) (Area H)CH2 carbon area = --------------------------- + Area F
2 6
Area HCH carbon area = + Area F
3
The degree of branching ie the CH3 to CH2 CH3 to CH and CH to CH2
ratios could be approximated (Ga1ya et al bullbull 1985) using
2middot(AREA G + AREA 0 + AREA B + AREA H)= CH2 3middot(AREA E + A~EA A + AREA C) - AREA H + 6middotAREA F
(AREA G + AREA 0 +AREA B +AREA H)= (AREA H + 3-AREA F)
CH = CH2 3middot(Area E + Area A + Area C) - Area H + 6middotArea F
The above equations will be used to analyse the NMR spectra in this
work
354 TGOTA
Thermogravimetry (TG) involves measuring the changes in sample mass with
temperature using a thermobalance This is a combination of a suitable
electronic microbalance with a furnace and aSSOCiated temperature
programmer The balance is in an enclosed system so that the atmosphere
can be controlled Differential Thermal Analysis (OTA) involves
measuring the difference in the temperature between the sample and a
reference material while both are being subjected to the same
temperature program Both TG (mass loss In wtX) and OTA (temperature
difference between sample and reference material) are recorded as a
function of furnace temperature The furnace used in this work was a
STA-780 Series with a Stanton Redcroft Thermal Analyser The balance was
69
controlled by a Stanton Redcroft Balance Controller while the
temperature in the furnace was controlled by a Stanton Redcroft
Temperature Controller The si~nals were amplified by a Stanton Redcroft
DC amplifier and recorded by a Bondwe11 Personal Computer
In this work 20 m~ of sample was placed in the furnace and the
temperature raised from 40C to 850C at a rate of lOCmin in flowin~
air or nitro~en
355 Water content determination
The water content of the feed was determined by measurin~ the dew point
temperature of the water in the feed usin~ a Panametrics Hy~rometer
ltModel 7000) with an aluminium oxide sensor Approximately 48 h was
needed for the system to stabilise Once this temperature had been
measured the vapour pressure of the water in the feed was determined (at
1 atm) and the mole fraction of water in the feed determined Usin~ the
above procedure it was found that the feed contained approximately 112
ppm (vv) water
356 Distillation
The 1 iquid products obtained from the high pressure reactor runs were
distilled in a glass distillation column shown in Fi~ure 35 to
separate the C from the heavier fractions After the still was filled
up to 3 liters per batch it was placed into a heatin~ mantle and
connected to the column with a Gduick-fit connector Upon heating the
vapours from the still passed via a column packed with berl saddles to a
condenser Here the condensate was either directed back to the column as
reflux liquid (plun~er down) or to the catchpot (plun~er up) as
product This separation was controlled by a solenoid operatin~ a ma~net
fused to the plun~er The solenoid in turn was controlled by a timing
device with which the total cycle time and reflux time could be set The
reflux ratio was then calculated by the ratio of the time the plun~er
was up to the time that the p1un~er was down For all cases the reflux
ratio used was 29 The cut off temperature was set by a thermostat at
the top of the column When the desired temperature was reached power
to the solenoid was discontinued and subsequently the plunger remained
down (total reflux) The cut point temperature used was 6ZC The
coolant used in the condensers was water Dissolved gases did not
condense and were vented to the atmosphere
70
1-+-+----1 5
FIG 35 BATCH DISTILLATION UNIT
71
Key to Fi9ure 35
1 Still
2 Berle saddle column
3 Reflux condenser
4 Magnet at top of plunger
5 Plunger assembly
6 Gas tappin9 point
7 Distillate receptacle
36 Catalyst synthesis
361 Support preparation
The silica-alumina support was received from Kal i Chemie in the form of
4 mm spheres which were crushed in a ceramic ball mill to -500 ~m The
silica to alumina ratio was 91 on a wei9ht basis
362 Impregnation
A previously determined mass of metal salt was dissolved in 500 ml of
distilled water to which 50 9 of silica alumina was added The solution
was boiled under reflux for 1 h with vigorous agitation throughout The
vessel was then opened to the atmosphere and while being a9itated most
of the water boiled off The concentrated solution was transferred to a
ceramic pie dish and placed into an oven at 120C where the remaining
water was evaporated Once the material was completely dry it was
crushed sieved and stored The above was adopted from work by H09an et
a1 (1955) and Holm et a1 (1957)
3621 Nickel concentration
The Quantity of nickel needed to make a catalyst of known metal content
was determined in a separate experiment Using a constant mass of sil ica
alumina but varyin9 the amount of nickel nitrate hexahydrate a loadin9
curve was constructed The synthesis procedure used was that as
discussed above The nickel content of the material was determined usin9 b
atomic a_sorption spectrophotometry The loadin9 Curve is shown in
Figure 36
363 Hom0geneous decompOSition deposition
In this method 45 9 of nickel salt was dissolved in 500 ml ot distilled
water to which 50 9 of silica alumina was added The solution was then
heated under reflux to 100C at which point 25 9 ot urea crystals were
added This was taken to be time zero The solution was then ret1uxed
72
while continuously being agitated for a previously determined period of
time as discussed below Excess water was removed by filtration in a
Buchner funnel and the catalyst washed with 20 volumes of hot (90C)
distilled water per volume of catalyst The catalyst was then dried at
110C in a ceramic pie dish for 12 h before being crushed and stored
The above synthesis procedure was adopted from work done by Van Dillen
et a1 (1977) Richardson and Dubus (1978) and Hermans and Geus (1979)
120 IMP LOADING CURVE
SOG S i 02 I A h 03 ~
SOOml H2O(f) 100
(f)
a L
60 bull
IshyZ 60 CD U
40-1 W
-~ U 20
Z
00
00 100 200 300 400 500 MRSS G
FIG 36 NICKEL CONTENT (MASSJ VS MRSS OF NICKEL NITRRTE HEXRHYDRRTE (GJ
3631 Nickel concentration
The time required to load a desired Quantity of nickel was determined in
a separate experiment All quantities of materials used were as
discussed above but while the mixture was boil ing under reflux samples
of solution (5 m1) were taken at discrete intervals These samples were
than washed and dried in the usual manner and their nickel content
determined using atomic adsorption spectrophotometry In this way the
loading Curve was constructed from which the time required to produce a
catalyst of known metal content could be read Two sets of startins
conditions were used as shown in F1gure 37
73
200 1I=509 Ni(N03h6H20
309 Si02A1203~ (j) 259 (NH2CO (j) 160 600ml H20CI L
bull 120bull
() 45c1 Ni (N03 h 6H20
503 S i 02 A 12 03
253 (NH-z )CO
50Om 1 H-z 0IshyZ 8 U 80
--J W ~
40U - Z
00
00 1000 2000 3000 4000
TIME MIN FIG 37 NICKEL CBNTENT (MRSS) VS TIME (MIN)
364 Coprecipitation
Two solutions were prepared One contained 180 3 of sodium meta silicate
in 1200 ml of distilled water and the other contained 42 3 of aluminium
nitrate nonahydrate and 117 3 of nickel nitrate hexahydrate in 1000 ml
of ~istilled water It was important that the pH of the final solution
was kept in the ran3e of 8 ~ 05 To achieve this caustic soda could be
added to the sodium solution or nitric acid to the solution of the
nitrates In this work 82 ml of nitric acid (70 wtX HN031 was added to
the solutions ot the nitrates The two solutions were mixed in a ~ 1
CSTR while being vigorously agitated and the pH adjusted using 5 9 of
sodium hydroxide in 100 ml of water A 3e1 formed after about 30 sand
was allowed to stand for 1 h This material was then filtered using a
Buchner funnel broken up and dried for 12 h at 110middotC The dried sol id
was washed twice by decantation with water and then washed ~ith six or
seven successive portions of 5X ammonium chloride The ammonium ~ash
involved soaking the catalyst for 1 h at 70C In an excess of solution
which was then drained using a Buchner funnel In thiS way any sodium
held in the sol id was removed by base exchange The catalyst was then
washed with distIlled water and dried at 110C for 12 h before being
74
crushed sieved and stored (Holm 1957) The si1 ica to alumina ratio of
the final catalyst was 91 while the nickel content was 4 wt~
365 Determination of nickel content
To determine the nickel content of the catalyst an accurately weished
sample approximately 025 s was added to 5 ml of hydrof1uric acid in a
teflon beaker The solution was left for 12 h after which 5 m1 of
concentrated sulphuric acid and 5 m1 of distilled water were added This
was again allowed to stand before being made up to 250 m1 in a
volumetric flask In this way the catalyst was broken down into its
individual elements and the nickel contents determined usins the Varian
SpectrAA-30 Atomic Adsorption spectrophotometer
366 Extrudate manufacture
The powder form of nickel oxide silica alumina was found to be too fine
for effective use in the hiSh pressure intergral reactor as it caused an
excessive pressure drop and downstream plugging problems Breck (1980)
suggested the use of an inorganic binder such as kaolinite in the
formation of extrudates This approach was found to be effective if the
Quantity of binder was sreater than approximately 35 wt At lower
binder mass fractions the material could not be extruded
The binding process consisted of mixins the binder with the catalysts to
form a homogeneous paste the amount of water used carefully judged by
visual inspection When the paste had the desired consistency it was
loaded into a previously wetted stainless steel piston and plunger
assembly and extruded onto filter paper The catalyst was then dried at
80C for 12 h
Breck (1980) further suggested that the extrudates be baked at 370C for
12 h to convert the clay to an amorphous binder of considerable
mechanical strength It was however found that this was not necessary as
the extrudates had sufficient strength after drying at 80middotC
75
4 RESULTS
Various types Ot catalyst synthesis procedures were examined These were
homogeneous decomposition deposition (HOD) i mpregnati on (IMP) an d
brietly coprecipitation (SGb as well as the catalytic properties Ot
the silica alumina support (SA) The si1 ica to alumina weight ratio used
throughout was 9 to 1 The criterion whereby the activity Ot the
catalyst was measured was the 1 iQuid production rate (LPR) The
selectivity of the catalyst expressed in terms Ot massX 1 i~uld
composition gave an indication ot the relative amounts Ot the various
01 igomers formed
The reaction conditions used were a temperature of aoc and a pressure
of 40 atm unless otherwise stated The catalyst size fraction used was
-500 IJm which was made into 110 inch extrudates using 35 wt~ kaol inite
as binder
As mentioned previously the feed used was a 41 mixture ot
propenepropane with trace impurities of C4 and C2 hydrocarbons unless
otherwise stated The exact composition ot the feed is shown in Table
31
The reaction conditions used in all experiments are summarised in Table
41 The WHSVt and WHSV2 were calculated assuming the mass loss occurred
before the reactor and after the reactor respectively in the torm of
gas For the purpose of plotting the results it was assumed that all
mass was lost betore the reactor ie bull ldHSVt was used in all the
figures
41 Reproducibil ity of Data
Two runs were carried out under identical conditions Ot temperature
pressure and WHSV The catalyst used in both runs was an HOD type
catalyst with a nickel content of 15 wt~
Figure 41 shows the LPR for each run as a function of time It can
clearly be seen that the largest discrepancies occurred during start-up
76
Table 41 Reaction data
CommentCode Nickel Press WHSVt (wU) (atm) (ggh)
HDD-1 15 80 40 42 45 HDD-2 1S 80 40 53 56 Reproduc i b i 1 ity
HDD-3 15 80 40 52 56 Reproducibil ity
HDD-4 15 80 40 51 55 Wet feed
HDD-5 15 80 40 47 48 Regenerated HDD-4 HDD-6 15 200 40 49 55 Temp runaway
HDD-7 15 80 40 54 56 Regenerated HDD-6 HDD-8 15 150 40 43 47 HDD-9 15 210 40 66 73
HDD-10 22 80 40 50 55 HDD-ll 72 80 40 42 47 HDD-12 117 80 40 49 52 HDD-13 113 SO 40 54 57 HDD-14 113 80 40 108 117 HDD-15 113 80 40 116 132 HDD-16 117 80 20 67 74 HDD-17 117 80 50 50 52 HDD-1S 15 aO200 40 55 LiQuid feed (C )
HDD-19 15 80 40 SS li QU i d gas f~ed
HDD-20 15 200 40 77 liquid gas feed
IMP-1 OS SO 40 47 4S IMP-2 19 SO 40 53 56 IMP-3 22 SO 40 4S 49 IMP-4 46 80 40 33 39 IMP-5 63 SO 40 49 54 IMP-6 71 80 40 44 48
IMP-7 9S 80 40 52 55 IMP-S 98 SO 20 59 66 IMP-9 9S 80 50 50 53
SG-1 15 SO 40 52 55 SG-2 15 80 20 59 61 SG-3 30 80 40 37 41
SA-1 80 40 40 41 SA-2 150 40 62 63 SA-3 200 40 35 42
77
ceOE NIOll) TR( middotC) P(ATHI WHSV 600 J=HOO-2 1 5 80 40 53
()=HOO-3 I 6 80 40 62
600
300 bull
e 0- 200
bull
1 00
000
00 40 60 80 100 120
TIME H FIG 41 LIQUID PRSDUCTISN RRTE (GHGJ VS TIME (H)
J=O I MER )()=TR I HER HOO-2 =TETRAHER
lUOO
~ +=PENTAHER (j)
X=OI HER )(j) 800 ~=TRIHER HOO-3 IT +=TETRAHER L )( =PENTAHER
bull 600 Il )((j)
o 0- L 400 o U
bull o 200
e
IJ RI00
00 20 40 60 80 100 TIME H
FIG 42 LIOUID CSMPSSITIBN (MRSS) VS TIME (Hl
78
Once steady state had been obtained approximately after 4 h on stream
conversions were similar and the reproducibility acceptable
Figure 42 shows selectivity as a function of time on stream Here it
can be seen that the dimer trimer tetrameter and pentamer were
produced in similar Quantities throughout the two runs
It was thus concluded that at steady state adequate reproducibil ity was
attained with respect to both selectivity and LPR
42 Nickel content
In the case of HOD type catalysts the nickel content was varied from
15 wtX to 117 wt It can be seen from Figure 43 that while the LPR
differed from run to run this variation was due to WHSV differences
and no trend with increasing nickel content was observed The LPR
remained between 3 and 4 grams of product per gram of catalyst per hour
over the range of nickel loadings examined The selectivity of the
catalyst as shown in Figure 44 was also found to be essentially
independent both with respect to nickel content and time on stream
although a sl ight decrease in dimer Yield was observed ~ith increasing ltshy
n lkel content
In the case of IMP type catalysts the nickel content was varied from
10 wtX to 98 wtX An accurate statement about the effect of nickel
content on the activity of IMP type catalysts could not be made due to
differences in the WHSV The selectivity as a function of both time on
stream and nickel content is shown in Figure 46 The catalyst with 08
wtY nickel exibited the greatest selectiVity towards trimers and the
dimer Yield inCreased sl ightly with increasing nickel content No other
marked changes in the selectivity were observed as a function of nickel
content or time on stream
43 Effect of ressure
In Figure 47 the lPR vs time on stream is shown for an HOD type
catalyst with a nickel content of 113 wtX at three different pressures
It can be seen from this figure that as the pressure was decreased from
50 atm to 20 atm the lPR remained constant although the WHSV was higher
at lower pressures This suggests that the activity c~ the catal~sts
dropped with decreasin9 pressure The selectiVIty shown in FI9ure 43
as a function of time on stream and pressure was also dependent ~n the
pressure used It Can be seen from Figure 4S that at 20 atm propene
dimer accounted for approximately 70 wt of the 1 iQuid pr0Juct ~hile at
79
600
o 500
r 400o
bull 300
a
bull CL 200
-1 1 00
000
ceOE Il =HOO-J ()=HOO-I0 4 =HOO- I I +=HOO-12
NI(WTtJ 1 5 22 72 11 7
TR bullC) P(ATMI WHSV 80 40 42 80 40 50 80 40 42 80 40 49
00 20 40 60 80 100 TIME H
FIG 43 EFFECT OF NICKEL CONTENT (MASS) ON
1000
~ (f)
(f) 800 a L
bull 600 (f)
o CL L 400 o U
o 200
00
LIQUID PRODUCTION RATE (GHGl HOD
1l0 I MER l()=TRIMER 4 H eN STREAM 4TETRAMER +PENTAMER XOIMER l~TR[MER 8 H eN STRERM TETRAMER ~ PENTRMER
$lt ~ ~ ~
- - bull ~ J shy
00 20 40 60 80 100 120
NICKEL CONTENT MRSSi FIG 44 EFFECT OF NICKEL CBNTENT (MASS) ON
LIQUID COMPOSITIBN (MRSS) HOD
I
o
o
bull a
bull CL
bull
6middot00
500
400
300
200
ceOE ll=IMP-l ()=INP-2 = I MP-3 +=IMP-4 X=IMP-5 0= INP-6 P=IMP-7
NI(HTI) 08 t9 22 46 63 71 98
TR( middotC) 80 80 80 80 80 80 80
80
P(ATNI 40 40 40 40 40 40 40
HHSV 47 53 48 33 49 44 52
000
00 40 60 80 100 120 TIME H
FIG 45 EFFECT BF NICKEL CBNTENT (MASS) BN LI QU I D PRBDUCT IBN RATE (GHG l IMP
1000
~ (j)
(j) 800 a L
bull 600 (j) (2]
CL L 400 (2]
U
o 200
00
Il=DIMER ()=TR I MER =TETRRMER +=PENTAMER X=Dl MER0=TR IMER P=TETRRMER ~=PENTRMER
~- ~ ~ ~======~
~ ~ JlJl1 -l
) 4 H aN STRERM
1 8 H aN STREAM
00 20 40 60 80 100NICKEL CBNT MRSSi
FIG 46 EFFECT BF NICKEL CeNTENT (MRSS) BN LIQUIDCOMPOS I T I eN (MRSSi) IMP
81
o
600
500
ceDE Il=HDD-16 e)=HDD-13 AHDD-17
NI(WTZ) 117 113 117
TR( C) 80 80 80
P(RTMI 20 40 50
WHSV 67 54 50
r 400 o
bull bull 300
0
bull Q 200
000
00 20 40 60 80 100
TIME H FIG 47 EFFECT OF PRESSURE (RTM) ON LIQUID
PRODUCTION RRTE (GHG) HOD
1000
~ en en 800 a 2
bull bull 600
en ~ Q
2 400 ~ U
bull (3 200
00
Il =0 I MER )e)=TR 1 MER 4 H eN STRERM A=TETRRMER +=PENTRMER X=D I MER ~=TRIMER H 8N STREAMI 8 +=TETRRMER X =PENTRMER
~ e -0
-=+
=
Ii if
100 200 300 400 500 600
PRESSURE RTM FIG 48 EFFECT OF PRESSURE (RTM) ON LIQUID
COMPOSITION (MRSS) HOD
82
50 atm the liquid product Contained only 50 wt~ dimer The observed
shift to li~hter products with decreasin9 pressure is consistent with
thermodynamiC predictions althou9h increasin9 the WHSV and hence
decreasln9 the contact time would result in the same shift in product
spectrum
In the case of an IMP type catalyst containin9 98 wtX nickel the LPR
as well as the selectivity were very sensitive to the pressure used The
LPR at three distinct pressures is shown in Fi9ure 49 as a function of
time on stream It can be seen that at 20 atm the catalyst rapidly
deactivated and was practically inert after 7 h on stream At the other
pressures examined ie bullbull 40 and 50 atm no difference in the LPR was
observed The selectivity of the catalyst is shown in Fi9ure 410 as a
function of pressure At 20 atm the 1 iquid product contained
approximately 30 wt~ dimer which inCreased to 67 wtl at 40 atm dropping
to 62 wt~ at 50 atm This trend althou9h opposite to that observed for
HOD type catalysts is in ailreement with the data reported in the
literature (Takahash i et a 1 bullbull 1969)
The LPR of a SG type catalyst with a nickel content of 15 wtr is shown
in Fiilure 411 at two distinct pressures At 40 atm the LPR was
comparable to that of HO~ and IMP type catalysts while at 20 atm the
catalyst was totally inert The selectivity of the SG type catalyst at
40 atm differed markedly from that of an IMP and HOD type catalyst In
that the liquid not only contained a larile percentage Ot dimers (40 wt~)
but also an equally larile percentage of trimers
44 Bed temperature profile
Before any statement as to the effect of temperature could be made the
temperature throughout the bed had to be constant and not fluctuate
excessively durin9 a run
In Fiilure 413 the temperature profile through the entire reactor is
shown at 4 discrete times ~urin9 a run The catalyst bed started at
position 4 and extended for 172 em down the reactor to position 8 In
this re9ion of the reactor viz bullbull over the catalyst bed a temperature
deviation from the set point of not more than 4C was observed at th~
times shown In FI9ure 414 ~he temperature fluctuations with time were
plotted at positions 4 6 and 8 From this figure it can be seen that
the amplitude of the temperature fluctuations with time were 4C for
position 4 and 6 and 3C for POSition 8 It can thus be concluded that
at aoc the temperature throu~hout the bed and over the period of the
83
600 ceOE Il =I HP-8
N I ( WT ) 98
TRIC) 80
PIATHI 20
WHSV 59
() =I MP-7 98 80 40 52 =lHP-9 98 80 50 50
cJ 500
- I - 400 cJ
bull 300
0
bull 0 200
bull
000
0middot0 20 40 60 80 100
TIME H FIG 49 EFFECT BF PRESSURE (ATM) BN LIQUID
PRBDUCT IBN RATE (GHG) IMP
Il=OIMER 11000 ()=TR 1MER 4 H 6N STRERM 4I=TETRRMER
~ +=PENTRMER (j)
(j) 800 IT L
bull 600
(j) ()
0 L 400 ()
U
bull (3 200
00
100 600
FIG 410 EFFECT SF PRESSURE (ATM) BN LIQUIDCBMPBSITIBN (MRSS) IMP
~---l--_--1-+
200 300 400 500
PRESSURE RTM
84
600 ceDE Nt (WT J TR ( bull C) PlATM) WH5V [J =5G-1 1 5 80 40 52 ()=SG-2 I 5 80 20 59
CJ 500
- I - 400 CJ
bull 300
Ct
bull D- 200
-J 1 00
~-----elE9----egt000
00 20 40 60 80 100
TIME H FIG 411 EFFECT eF PRESSURE (RTM) eN LIQUID
PReDUCTIeN RRTE (GHG) SG
600 [J=O IMER ()=TR I MER ~=TETRAMER
~ +=PENTAMER(J)
(J)
IT L
(J)
~ CL L ~ U 200
~~------~A----~____A_____________6 o
400
00
00 20 40 60 80 100
TIME H FIG 412 LIQUID CBMPBSITIBN (MRSSJ VS TIME (HJ
RT 40 RTM SG
85
1000 Il=TEMPERATURE AFTER ~=TEMPERATURE AFTER A=TEMPERATURE AFTER +=TENPERATURE AFTER
11 H ~N STREAM 35 H ~N STREAM 60 H BN STREAM 93 H eN STREAM
U 900
W 0 800 =)
I shyCI 0 700 W (L
L W I- 600
500
PBSITIBN Z FIG 413 BED TEMPERATURE PRBFILE (tC) VS
PBSITIBN (Z) SET PBINT 80C SG-1
00 10 20 30 40 50 60 70 80 90 100
1000
U 900
Il=TEMPERATURE FLUCTUATleNS AT Z=4 ~=TEMPERATURE FLUCTUATUINS AT Z=6 A=TEMPERATURE FLUCTUATI~NS AT Z=8
W 0 800 =)
I shyCI 0 700 W (L
L W I shy 600
500
20 40 60 8000 100 TIME H
FIG 414 BED TEMPERATURE FLUCTURTIBNS (tC) VS TIME (H) SET PBINT 80C SG-l
86
run was controlled accurately enough to examine the effect of reaction
temperature
In Figure 415 the temperature profile through the bed is shown for 3
different times during a run at 210middotC During this run from positions 4
to 7 ie bullbull over 75 of the catalyst bed the temperature deviation
from the set point was less than SmiddotC at the times shown while the
temperature at position 8 was approximately 10degC below that of the rest
of the bed In Figure 416 the temperature variation with time at 3
different positions in the bed is shown Excluding the start-up period
the ampl itude of the temperature fluctuations with time at positions 4
and 6 was 3C while the amp] itude of the temperature fluctuations at
position 8 although approximately 10degC below the set point was 2middotC
Thus although a deviation from the set point existed at 2l0middotC the
profile did not change markedly with time on stream
441 Effect of temperature
The LPR for an HOD type catalyst with a nickel content of 15 wt~ is
shown In Figure 417 as a function of time on stream at 4 different
temperatures It Can be seen from this figure that at 80degC and 40 atm
ie bull when the system was In the I iquld phase the LPR was higher than
when the system moved into the vapour phase As the temperature was
raised from BOdegC to lSOdegC a 50~ decrease in LPR was observed while the
WHSV was lower by 18 Upon raising the temperature to 200degC a Further
drop In LPR of 10~ was recorded although the WHSV was higher by 14~ At
210degC the high WHSV used makes a meaningful4 comparis$on impossible
However from the recorded LPR it can be concluded that the activity of
the catalysts decreased further
Figure 418 shows I iquid composition as both a Function of time on
stream and temperature Increasing the temperature and moving into the
vapour phase caused a dramatic drop in the dimer yield and an Increase
in trimer yield IncreaSing the temperature still further resulte~ In
the dimer recovering until at 210middotC dimers and trimers were formed in
equal Quantities
As at higher temperatures ie bull above IS0degC at 40 atm Bil iea aluml~a
exhibits catalytiC properties the relationship between its activit and
temperature was also examined In Figure 419 the LPR as a function of
time on stream IS plotted For SA at 3 different temperatures R~ducln9
the temperature Fr~m 200C to lS0C resulted In the maximum activity
87
220
U 210 po
wa 200 =gt l-CC a 190 W a L W I- 180
170
~=TEMPERATURE AFTER 14 H aN STREAM ~=TEMPERATURE AFTER 37 H aN STREAM amp=TEMPERATURE AFTER 61 H aN STREAM
00 10 20 30 40 50 60 70 80 90 100 PBSITIBN Z
FIG 415 BED TEMPERATURE PROFILE (C) VS POSITION (ZJ SET POINT 210C HDD-9
230
U 220 po
wa 210 =gt l-CC 0 200 W a L w I- 190
~=TEMPERATURE FLUCTUATlaNS AT Z=4 ~=TEMPERATURE FLUCTUATUINS AT Z=6 amp=TEMPERATURE FLUCTUATlaNS AT Z=8
180
20 40 60 60
TIME H FIG 416 BED TEMPERATURE FLUCTUAT IONS ( C)
VS TIME (HJ SET POINT 210C HDD-9
00
88
600
CJ 500
400CJ
bull bull 300
0
bull 0- 200
--J 1 00
000
ceDE []=HDD-2 ()=HDD-8 amp=HDD-6 +=HDD-9
N (lH) 1 5 1 5 1 5 1 6
TR( middotC) P(ATM) I1HSV 80 40 53 150 40 43 200 40 49 210 40 66
00 20 40 60 80 100 120 TIME H
FIG 417 EFFECT BF TEMPERRTURE (Cl BN LIQUID PRBOUCTIBN RRTE (GHGl HOD
600
~ (f) (f)
a ~
400 bull
(f)
~ 0shy~ ~ U 200
bull
[]=D IMER 1()=TRIMER 4 H eN STREAM amp=TETRAMER +=PENTAMER X=DI MER 10=TRIMER 8 H eN STRERM i=TETRAMER j =PENTAMER
_----~=i
00
600 900 1200 1S00 1800 2100 2400 TEMPERRTURE C
FIG 418 EFFECT BF TEMPERRTURE (Cl BN LIQUID CBMPBSITIBN (MRSS) HOD
600
89
C) 500
- r - 400 C)
bull 300 ~
Q 2 )0
bull
---l 1 00
000
TR ( bull C) P(ATH) HHSV BO 40 40 150 40 62 200 40 35
ceOE fI =SA-l ()=SA-2 ~=SA-3
N[(HTZl 00 00 00
~e
tI eJ
e e e)
00 20 40 60 80 100 120 TIME H
FIG 4 bull 19 EFFECT BF TEMPERATURE ( bull C ) BN LIQUIDPRBOUCTIBN RATE ( GHG) SA
600
0 (f) (f)
a I
400 (f)
~ Q I ~ U 200
C2I 1--1
---l
00
fI=O IMER )()=TRIHER 4 H aN STREAM ~=TETRAMER +=PENTRMER
+ +
600 900 1200 1500 1800 2100 2400 TEMPERRTURE bull C
FIG 420 EFFECT I3F TEMPERATURE ( C) BN L I QU I 0 CI3MPI3SITII3N (MASS) SA
90
falling by approximately 72X while the WHSV increased by 5S~ At aoc the catalyst was inert At 200C the preferential product of sil ica
alumina was propene trimer which can be seen in Figure 420 where
1 iQuid composition is plotted against temperature Decreasing the
temperature to lSOC caused the trimer yield to increase at the expense
of the dimer Decreasing the temperature further resulted in the
catalyst becoming inert and so no 1 iQuid data was available
45 Lifetime and selectivity
The 1 ifetimes of HOD IMP SG and SA type catalyst were examined as well
as their selectivity in long runs In Figure 421 the LPR and WHSV as a
function of time are plotted for an HOD type catalyst with a nickel
content of 15 wt From this it can be seen that the LPR fluctuated
with time due to WHSV fluctuations Upon comparing points with eQual
WHSV it was found that the conversion had dropped by 12 after 100 h on
stream The selectivity with time on stream is shown in Figure 422
Selectivity chansed sl ightly during the run ie bull the Quantity of dimer
formed increased by 25~ after 120 h at the expense of the tetramer and
pentamer
In Figure 423 the LPR as a function of time is plotted for an IMP type
catalyst with a nickel content of 19 wt After a h on stream the
activity of the catalyst dropped by 24 of its initial value The
selectivity shown in Figure 424 remained approximately constant with
the dimer yield increasing sl ightly at the expense of the tetramer and
pentamer over the period of the run
In Figure 425 the LPR as a function of time is plotted for an SG type
catalyst with a nickel content of 15 wtx After 10 h on stream the
catalyst showed no signs of deactivation The sel~ctivlty shown as a
function of time in Figure 426 also showed no changes over this
period ConseQuentely from the available data no conclusive statement
with respect to the 1 ifetime of this catalyst could be made
The 1 ifetime of a SA type catalysts was examined at a temperature of
200C and the LPR as a function of time is shown in Figure 427 Upon
comparing points with eQual WHSV it was found that the ConverSion had
dropped by 24 over a period of 75 h As shown in Figure 428 10
significant change occurred in the selectivity over the perlo~ of this
run
91
700
6(10 o I 500
o 400
bull a 3 00
bull 0
200
1 00
000
CODE NI(WT~) TR(C) P(ATM) HDD-3 15 80 40
~=HEIGHT HeURLY SPACE VELeCITY ~=LIQUIO PReOUCTleN RATE
WHSV 52 700
600
600
400
0
I 0
300
200
gt (j)
I 3
100
000
00 200 400 600 800 1000 1200
TIME H FIG 421 LIQUID PReDUCTIeN RRTE (GHGJ RND WEIGHT
HeURLY SPRCE VELeCITY (GHGJ VS TIME (H)FeR HDD-3
800
~ (j) (j)
IT L
600
bull
(fJ
~
0 L
400
~ U
bull 200
o
~O IMER ~=TR IMER amp=TETRAMER +=PENTAMER
+
FIG 422 LIQUID ceMPeSITIeN (MRSS) VS TIME (H) FeR HDD-3
92
700
600 CJ
r 500
CJ 400
bull 0 300
bull 0
200
t 00
000
CODE NI(WT~) TR(JC) P(ATM) WHSV IMP-2 19 80 40 53
m=HEIGHT HeURLY SPACE VELeCITY ~=LIQUIO PReOUCTleN RATE
er----El---f9----et-_-poundJ
700
600
600 CJ
r 400 shy
CJ
300 gt
(J)
r 200 ~
t 00
000
00 20 40 60 60 100 120
TIME H FIG 423 LIQUID PRBDUCTIBN RRTE (GHG) RND WEIGHT
HBURLY SPRCE VELBCITY (GHGJ VS TIME (H)FBR IMP-2
CL
93
700
600 cJ shyc 500 shycJ
400 0 300
200
I 00
000
CODE SG-1
NI(Wn) 15
TR(C) eo
P(ATM) 40
WHSV 52 100
rn=WEIGHT HeURLY SPACE VELaCITY ~=LIQUID PReOUCTlaN RATE 600
-eJ 500
400
cJ shyc shycJ
300
200
gt U)
c 3
100
000
00 20 40 60 80 100
TIME H FIG 425 LIQUID PRSDUCTIBN RATE (GHGl AND WEIGHT
HBURLY SPACE VELSCITY (GHGJ VS TIME (HlFeR SG-1
600
~ U) U)
a L
400 bull
U)
~ CL L ~ U 200
bull
rn=D 1MER ~TRIMER
41 =TETRAMER +=PENTANER
amp~----------A------______A__________________~bull
+
Oor ~-~I~------~I--------~I-------+I-------+I-------+I~
00 20 40 60 80 100
TIME H FIG 426 LIQUID CBMPSSITIBN
FeR SG-1 (MASS) VS TIME (H)
94
600 CODE NIIWTX) TRIC) PIATN) WHSV SA-3 200 40 35
m=WEIGHT HeURLY SPACE VELeCITYo 600 ~=LIQUIO PReOUCT6N RATE shyI - 4 00o
bull 300
et
bull CL 200
~ 100
000
00 20 40 60 60 100 120 14 0
TIME H FIG 427 LIQUID PRBDUCTIBN RATE (GHGl AND WEIGHT
HBURLY SPACE VELBCITY (GHGJ VS TIME (HJFBR SA-3
600
500
0 400 shy
I shy0
300 gt (f)
200 I s
1 00
000
600
~ (j)
(j)
IT L
400 (j)
o CL L o U 200
o
m01MER ~TR IMER 6=TETRAMER +PENTAMER
___-tl----------~I-----------r--~V I I
E9 m(9 E9 u El
i I I00 20 40 60 80 100
TIME H FIG 428 LIQUID CBMPBSITIBN (MRSS) VS TIME (H)
FBR SR-3
00
95
46 Effect of WHSV
The effect of the WHSV on the LPR and selectivity was examined In
Fi~ure 429 the LPR of an HOD type catalyst with a nickel content
ranging from 113 to 117 wt~ is shown at four different WHSV Figure
429 shows that increasing the WHSV increased the LPR and the rate of
deactivation
In Fi~ure 430 the selectivity as a function of both time and WHSV is
shown This figure demonstrates how increasing the WHSV and consequently
decreasing the conversion resulted in a higher dimer content of the
liquid product at the expense of the tetramer and the pentamer The
quantity of trimer was not affected by changing WHSV in the range
examined
47 Effect of temperature runaway
The effect of operating the catalyst at 80C was examined after
operating it at 200middotC The aim of this experiment was to establ ish
whether the activity or selectivity of the catalyst when rerun at 80C
was affected in any way by operating it first at a temperature higher
than 80middotC Between the two runs the catalyst was calcined in the normal
manner
In Figure 431 the LPR of an HOD type catalyst with a nickel content of
15 wtX at 200C is shown as a function of time on stream After 11 h
the run was stopped and the catalyst calcined in the -normal manner and
rerun at SOmiddotC The LPR as a function of time at aodegc IS shown In Figure
431 together with the data obtained using a fresh catalyst at SOmiddotC It
can be seen from this figure that usin~ the catalyst first at ZOOC did
affect the activity and from Figure 432 the selectiVIty causing a drop
in LPR of 17X at steady state and a shift to 1 ighter products at the
expence of the tetramer when the catalyst was re-used at 80middotC
4S Effect of water contamination
The aim of thIS experiment was to establ ish the effect of water on the
activity and selectivity of an HOD type catalyst with a nickel content
of 15 wtX (HOD-4) and to determine whether the catalyst could be
regenerated to its normal activity and selectiVity For this ~urDose the
feed containing 112 ppm (vv) water was not dried bef0re ent~rln9 the
bed and the activity with time was recorded ~nder normal running
CL
96
caOE N I (1HZ J TR ( middotc I P(ATNI HHSV1000 (l =HOO-I 2 I I 7 80 40 49 ()=HOO-13 II 3 80 40 54 t =HDD-14 It3 80 40 108 +=HOO-tS 1t 3 80 40 I I 6
cJ 800
I
cJ 600
a 400
bull 200-J
000
00 20 40 60 80 100
TIME H FIG 429 EFFECT BF WHSV (GHG) BN LIQUID
PRBDUCTIBN RRTE (GHG) HOD
800
~ (j) (j)
a 600 L
(j)
~ 400 CL L ~ U
bull 200 C3
00
(l=D I MER )()=TRIMER 4 H eN STREAM t=TETRAMER +=PENTRNER
X=OINER Ie=TRIMER 8 H aN STRERM TETRRMER ===----shyX=PENTANER
~~e-------------------~i~~
20 40 60 80 100 120 t 40WHSV GHG
FIG 430 EFFECT BF WHSV (GHG) BN LIQUIDCBMPBSITIBN (MRSS) HOD
140
97
600
o 500
bull 300
0
bull CL 200
-1 1 00
000
ceDE N I ( loin) TR( C J PlATH) WHSV Il =HDD-6 15 200 40 49 ()=HDO-7 15 60 40 54 AHDD-2 15 60 40 53
00 20 40 60 60 100 120 14 0
TIME H FIG 431 EFFECT BF TEMPERATURE RUNAWAY BN LIQUID
PRBDUCTIBN RATE (GHGl HDD-6 AND HDD-7 CBNSECUTIVE RUNS USING SAME CATALYST
700
~ (f) 600 (f)
IT L 500
bull
(f) 400
cJ CL L 300
cJ U
200
bull CI 100 -1
00
Z=D 1HERIiOIMER 1 XOIMER 1 ()TRIMER HOO-6 ~=TRINER HDD-7 Y=TR I MER HDD-2 ATETRRNER +=TETRRHER )(TETRRHER
+=PENTRNER ~=PENTRNER If =PENTRHER 1 Z~
~ eEl egt
Gshy
E9 fl
)lt~~ V ~
t shy amp
)IE ~ )(
+~ of f -+ J~ R
20 40 60 80 100 12000
TIME H FIG 432 EFFECT BF TEMPERATURE RUNRWRY BN LIQUID
CBMPBSITIBN (MASS)
98
conditions It can be seen from Figure 433 how rapidly the catalyst
deactivated becoming totally inert In 4 h The selectivity as shown in
Figure 434 was also affected with the dimer rapidly becoming the main
product
Upon regenerating and operating the catalyst in the normal manner (HOOshy
5) the catalyst showed an initial LPR higher than in HDD-l due to a
high WHSV which rapidly dropped to that of a catalyst in a dry run For
comparison the LPR vs time relation for a dry run using a fresh catalyst
is also shown in Figure 433 (HOD-l) With regard to selectivity no
difference was observed for the regenerated or normal catalyst as shown
in Figure 434
In this experiment the -69C fraction (dimer) from previous runs was fed
through the reactor at 40 atm and 30C Once the catalyst had
deactivated the temperature was raised to 200C and the run continued
The catalyst used was a HOD type catalyst with a nickel content of 15
wt~ The feed composition was 994 wt~ Cb and 06 wt~ Cl
To monitor the activity of the catalyst throughout the run the LPR was
calculated using
LPR = (mass Cn-b in - mass of Cn-b out) ltI) (time)(mass of catalyst)
while the Conversion was calculated using
Mass~ Cn_b converted =[mass Cn- in - mass ou t ) 1bull 100 ltII)Cn
mass Cnab In
It can be seen from Figure 435 that at aoc the catalyst rapidly lost
its activity This also became apparent from the changes in the 1 iquid
composition with time on stream as shown in Figure 436 Upon raising
the temperature to 200C the catalyst regained activity the conversion
beIng 64~ after 27 h on stream The composition of the 1 iQuid product
also changed markedly the most abundant specIes in the product being a
Cb dimer (CI2) with trace Quantities of Cl and trimer (CIS)
410 Liquid and gas feed (C + C3)
In this case dimer (C ) and monomer (el) were fed simultaneously to the
reactor The ratio of Cb to C3 was held at 11 9 C9 Cl throughout Two
runs using the same catalyst were carried out one at 80C and one at
I
99
600 CeDE NJOHI) TR( middotC) PlATH) HHSV FEED Il=HDD-4 15 80 40 51 HET ~=HOO-5 15 80 40 47 DRY AHOD-I 15 80 40 42 DRY
CJ 500
shy
shy 4 00 CJ
bull 300
0
bull (L 200
1 00
000
00 20 40 60 80 10middot0
TIME H FIG 433 EFFECT BF WRTER BN LIQUID PRBDUCTIBN RRTE
(GHGJ HDD-5 REGENERRTIBN RFTER HDD-4
800
~ (J) (J)
(I 600
(J)
~ 400 (L
L ~ U
bull 200
o
[]=o 1MER 1 ~=TR I MER HOO-4 1 TETRAMER +=PENTAMER
X=OIMER ]~=TRIMER HOO-S +=TETRAMER X=PENTAMER
Zo I MER 1 Y=TRIMER HOO-l )( = TETRAMER =PENTAMER
~ eiICJ)
P=~ if --- I~
Igt(
~
~~ j
)(
00 20 40 60 80 100
TIME H FIG 434 EFFECT SF WRTER CBNTRMINRTIeN eN
LIQUID CBMPeSITIBN (GRHGR1 HOD
00
100
CODE NI (Wa) TR ( C ) P(ATM) WHSV 800600 HDD-18 15 801200 40 55
l =CaNVERS 1aN ~ ~LtQUtO PRaOucTtaN RATE (j)D
(j) r 600 600 a
200degC
L D
bull Z 400 a
bull 400
0 (j)
a CL
bull w gt200bull 200 Z
--J a
000shy
u
00
00 20 40 60 60 100
TIME H FIG 435 LIQUID PRBDUCTIBN RRTE (GHG) RND
CBNVERSIBN (MRSS) VS TIME (H) LIQUIDlaquo69C FRRCTIBNl FEED HDD-18
1000
~ (f)
(f) 600 IT L
bull 600
(f)
a CL L 400 a u
C3 200
l =0 t MER ~=TR t MER TETRAMER +=PENTAMER X=HEXRMER
20 40 60 6000 100
TIME H FIG 436 LIQUID CBMPBSITIBN (MRSS) VS TIME (H)
LIQUID laquo69C FRRCTIBNJ FEED HOD-IS
101
200middotC The catalyst a~ain an HOD type catalyst with a nickel content of
15 wt~ was activated in the normal manner between the runs
To monitor the monomer utilization throu~hout the run the equations
shown above for LPR and conversion with n=3 were used ie a propene
balance was done assumin~ no mass loss The results are shown in Fi~ure
437 for the run at BOdegC and in Fi~ure 439 for the run at 200degC
Figure 438 shows that at eoc the activity rapidly declined as the
composition of the 1 iQuid product rapidly approached that of the Co
feed At 200middotC however as shown in Figure 440 the 1 iQuid composition
was steady and contained about 40 wtY dimer after 8 h on stream
411 TGOTA
In Figure 441 the TO and OTA Curves for a fresh HOD type catalyst with
a nickel content of 117 wt~ are shown The catalyst was held under
flowin~ nitrogen throughout
Up to SOOC an exothermic peak probably indicating the removal of
chemisorbed water was recorded At approxlmately 530C the Curve
became endothermic probably due to the decomposition of the Ni-Urea
complex to form NiO
From the TO Curve It can be seen that the intermediate species formed
were not stable until the final endothermiC event at 530middotC Beyond this
temperature the TO Curve levelled out indicating that a stable species
was formed The overall mass loss from the catalyst was 14 wtY
To determine the quantity of water that the catalyst adsorbs a
oreviously calCined catalyst was exposed to air and the TG and OTA
curves were subsequently recorded The results of this run using the
same catalyst as before are shown in Figure 442 This figure shows a
broad exothermic peak up to 600degC and an overall mass loss of 367 wtX
To establ ish the quantity of hydrocarbons adsorbed on the catalyst the
TG and OTA curves were recorded for a catalyst after it had been used
for the 01 igomerisation of propene The catalyst ysed was an HO~ type
catalyst with a nickel content of 117 wtX The catalyst was exposed to
flowing air while recording the TG and OTA Curves The r~sults are shown
In Fi9ure 443
102
00 20 60 TIME H
FIG 437 LIQUID PRODUCTION RATE (GHGJ AND CONVERSION (MASS) FOR PROPENE VS TIME (H) LIQUID laquo69C FRACTION)AND GAS FEED HDD-19
600
bull 300
a
bull 0 200
bull J 1 00
000
CODE NI(Wn) TR(C) P(ATM) WHSV HDD-19 15 80 40 88
~=PRePENE ceNVERSlaN ~=LIQUIO PR60UCTIeN RATE
600
~ 600 (j)
(j)
IT 400
Z
300 ~
(j)
a 200 w
gt z ~ 100 u
00
1000
~ (j)
(j) 800 a
600bull
(j)
~ 0 400 8 U
bull Cl 200 -J
00
~OIMER ~TR IMER l =TETRRMER +=PENTRMER
00 20 40 60 TIME H
FIG 438 LIQUID CGMPOSITION (MASS) OF ENTIRE LIQUID EFFLUENT VS TIME (H) LIQUIDlaquo69C FRACTION) AND GAS FEED HDD-19
103
bull 200 -1
gt200 Z
o U
CODE NI(WTX) TR(C) P(ATMl WHSV 800800 HDD-20 15 200 40 77
m=PRBPENE CBNVERSIBN RATE~=LIQUIO PRBOUCTIBN
~ o (f)
(f)- 600 600 I IT - L o
Z 400 0bull 400
a (f)
bull a 0 w
000 00
00 20 40 60 80 100
TIME H FIG 439 LIQUID PRBDUCTIBN RATE (GHGl AND
CBNVERSIBN (MASS) FBR PRBPENE VS TIME (H) LIQUID laquo69C FRACTIBN)RND GAS FEED HDD-20
II=OIMER600 ~=TR I MER to =TETRAMER +=PENTANER X=HEXANER ltgt=HEPTAttER
bull
(f)
o 0 L o
400
U 200
-00
00 20 40 60 80 100
TIME H FIG 440 LIQUID CBMPBSITIBN (MASS) BF ENTIRE
LIQUIO EFFLUENT VS TIME (H) LIQUIDlaquo69C FRACTIBN) RND GRS FEED HDD-20
104
u
-w u z ~ W 0 -(j)W
(j)U U 0 I 0
(j) (j)w
0 4 =gt x IshyltC 0 w Q x W Ishy
200 400 600 800
TEMPERATURE C
FIG 441 MASS lOSS (~) AND TEMPERATURE DIFFERENCE (OC) VS
FURNACE TEMPERATURE (OC) FOR A FRESH CATALYST 20 m~ sample
10
5
0
-5
-10
-15
CODE NI(WTX) GAS HDD-O 11 3 N2
~
o
10 u
-w u z 5 w
~0 w u (j) shyu (j)
0 -0 0I W (j)0 (j)=gt 4Ishy J4 0 w Q J
-5 W Ishy
-10~ CODE
-15cNIltWn) GAS
113 Nz
I r I I
0 200 400 600 BOO TEMPERATURE C
FIG 442 MASS LOSS (X) AND TEMPERATURE DIFFERENCE (ac) Vs FURNACE TEMPERATURE (OC) FOR A CALCINED tATALYST
WHICH HAS BEEN EXPOSED TO AIR 19 m~ sample
105
The OTA curve was exothermic below 400middotC probably as a result or
combustion of the adsorbed hydrocarbons No other thermal events
occurred The TG curve showed that the overall mass loss was 96 wt~
To establish the eftect Ot synthesis techni~ue the TG and OTA curves Ot
a SG IMP and HOD type catalyst were recorded under tlowing air In each
case the catalyst had been used for the 01 Igomerlsation Ot propene
In Figure 444 the TG and OTA data for an IMP type catalyst with a
nickel content of 083 wt~ are shown There were an exothermic peak at
340degC and a shoulder at approximately 400C probably due to the
combustion of the adsorbed hydrocarbons The TG curve also shown in
Figure 444 shows that the overall mass loss was 173 wt~
In Figure 445 the TG and OTA curves for an HOD type catalyst with a
nickel content ot 15 wt are shown The OTA curve showed a broad
exothermiC peak between 300 and 400 o e The overall mass loss was 12 wt
In Figure 446 the TG and OTA data for an SG type catalyst with a nickel
content of 151 wt are shown The OTA curve showed that an exothermic
peak in the vicinity Ot 300degC The TG curve showed a continual mass
loss up to 600degC the overall mass loss being 244 wtY-
412 NMR
The 1H MNR spectra recorded were those of the bulk I i~uid collected
throughout a run For each type of catalyst the spectrum determined was
that of the I i~uid collected at the reaction conditions deemed optimum
viz bull aoc and 40 atm over a catalyst with a nickel content of 15 wt
The results obtained are shown In Table 42 and Table 43 while the
spectra are shown in Figures 447 448 and 449
106
10 u
UJ
I u 5 z UJ a
~
UJ (f)U (f)u 0
~
0 I
0 J
(f)UJ (f) gt~ middot1a 4 I~
l- x 4 a UJ 0-
-5 x UJ Ishy
-10
CODE NI(WT~) TR ( C) P(ATM) WHSV GAS HDD-13 113 80 40 54 AIR
-15 I
0 200 400 600 800
TEMPERATURE degC
FIG 443 MASS LOSS (~) AND TEMPERATURE DIFFERENCE (GC) VS
FURNACE TEMPERATURE (OC) FOR A USED CATALYST
HDD-13 185 mg sample
15
10
5 u
UJ 0 U Z UJ a
~
UJ -5-(f)U (f)U 0
0 J -10 (f)UJ (f)a
~ 4 l- x -15 4 a UJ 0- -20x UJ Ishy
CODE NI(Wn) TR ( C) P(ATM) WHSV GAS -25 IMP-1 08 80 40 42 AIR
-30 0 200 400 600 BOO
TEMPERATURE e
FIG 444 MASS LOSS (X) AND TEMPERATURE DIFFERENCE (OCl VS
FURNACE TEMPERATURE (OCl FOR A USED CATALYST
IMP-l 18 mg sample
107
15
10
5 u
~
UJ 0 U Z UJ ~ IX UJ -5R
U () U () 0- 0 a J -10 UJ () IX ()
gt lt l- I -15 lt IX UJ ~ I -20 UJ I shy
CODE NI (Wn) TR(C) P(ATM) WHSV GAS -25 HDD-l 15 80 40 42 AIR
-30 600 BOO0 200 400
TEMPERATURE c
FIG 445 MASS LOSS (X) AND TEMPERATURE DIFFERENCE (OC) VS
FURNACE TEMPERATURE (OC) FOR A USED CATALYST
HDD-l 17 mg sample
to)
~
UJ 0 to)
Z ~UJ
IX UJ -5R
()U ()U 0
a J -10 ()UJ ()IX
gt lt l- I -15 lt IX UJ ~ I -20 IJJ I shy
CODE NI(WTX TR(C) P(ATM) WHSV GAS SG-3 30 80 40 37 AIR
-30 I I I 0 200 400 600 BOO
TEMPERATURE C
FIG 446 MASS LOSS (X AND TEMPERATURE DIFFERENCE 1degC) VS
FURNACE TEMPERATURE (OC) FOR A USED CATALYST SG-3
17 mg sample
-25
108
c
-I 0 J gt-lt
Z ) 0
J 0 0 U
I shyU ) Cl 0 0 0
0 gt-lt ) 0 gt-lt J
U 0
ltt 0 I shyU W 0 ()
0 J Z
Cl J
co
M
I
I l--r
JiI I
I LLf)
t
r-shyq q
0 gt-lt u
T~
------H
G
F
E
o Q
o
FIG 448 IH NMR SPECTRA OF LIQUID PRODUCT FROM RUN SO-3
BA L
M
---L
1-shy
5 4 3 2 1 o 6
c
110
LL o o
-I C C x z )
cx I 0 cx LL
I-U ) C 0 a a c -) C -J
u 0
ltr cx I-U UJ a (J
a I Z
x
0-lt1
U1
lt1
lt) shyu
111
Table 42 Integrated areas
Run code Area code
A B C o E F G H L M N
IMP-l 00 10 120 320 205 145 250 195 10 125 00
SG-3 20 30 190 430 305 220 365 225 15 158 00
HDD-l 75 50 230 490 332 235 355 222 20 220 00
Table 43 Carbon areas and branching
Code CH CHJ CH
IMP-l 258 275 210 094 123 076
SG-3 350 253 295 079 123 067
HDD-l 372 517 309 072 120 060
112
5 DISCUSSION
The effect of the synthesis procedure on metal distribution and
dispersion in nickel silica catalysts was examined in detail by amongst
others Hermans and Geus (1979) Blackmond and Ko (1984) Montes et al
(1984) and in a more general sense by Maatman and Prater (1957)
The conclusions reached by these workers as to how the synthesis
procedure effects the metal distribytion and dispersion and hence
catalytic activity has been discussed in Section 13 and are briefly
summarised below Using their Conclysions an attempt was then made to
explain the activity of an HOD type n i eke 1 oxide s i 1 i ca alumina
catalyst
Impregnation as discussed in Section 132 and 362 involves the the
homogeneous increase in concentration of the nickel precursor by the
evaporation of the solvent In terms of preCipitation theory as
discussed in Section 13 the homogeneous increase in the concentration
of the metal salt results in the formation of a 1 imited number of large
nuclei which are evenly distributed over the support The reason for
this is that providing the concentration of the solution is kept
homogeneoys the rate of increase in concentration is equal to the rate
of Crystal growth Consequently the concentration of the solution Will
remain between that of the solubil ity and supersolubil ity curves where
no new nuclei can develop This has been disc~ssed in Section 1331
Th is was in fact foun d to be t he case by Montes et a 1 (1984) ljho in the
case of an inpregnated Ni silica catalyst recorded an average nickel
particle diameter of 52 nm They further suggested that only a weak
interaction exists between the metal preCursor and the support If this
were so then upon calcination the crystal size should increase (Section
1324) and the metal should be present in a form 31milar to that of
the bulk oxide They in fact found this to be so ie bull the average
nickel particle size inCreased to 45 nm after calcination for 16 h at
450degC in dry air The fact that the metal was present in a form similar
to that of the bulk oxide In calcined Impregnated nickel silica
catalysts had been established earlier by Houalla and Delmon (198ll
In the case of impregnated nickel sl1ic3 alumina catalysts no data was
available indicating the degree of interacton between the support and
the metal It is however assumed that in the case of this ta+almiddotst
the interaction between the support and the metal pr~Cursor are also
113
weak and that a similar redistribution and corresponding increase in
crystal size occurs during calcination It is also suggested that the
metal is present in a form similar to that of the bulk oxide
It is well known that for optimum catalyst activity a large specific
surface area and hence a finely divided sol id is required (Hermans and
Geus 1979) Small crystallites ensure high specific metal areas but
increasing nickel concentration results in agglomeration In the case of
impregnation the drying and calcination procedures result in the
formation of a heterogeneity of crystal sizes when the nickel content is
greater than about 5 wt~ Increaslng the nickel content beyond 5 wt~
results in broad and even binodal crystal size dispersion which not only
affects the activity due to loss of surface area but also the thermal
stability ie bullbull resistance to sintering (Richardson and Dubus 1978) It
is proposed that this fact accounts for the observed loss in propene
01 igomerisation activity recorded by Hogan et al (1955) and Holm et al
(1957) over impregnated nickel oxide sil ica alumina catalysts when the
nickel content was raised beyond 5 wt~ Thls proposal was further
supported by Dorl ing et al (1971) who predicted that when increasing the
nickel content below 5 wt~ the number of crystall ites would increase but
that the mean crystal size would remain approximately constant Beyond 5
wt~ nickel on the other hand they predicted that the number of
crystall ites would remain constant as the nickel content was increased
but that the crystall des woul d increase in size This has been
discussed in detail in Section 1323
From the above discussion it can thus be concluded that the activity of
impregnated catalysts is only a function of the the extent of metal
distribution and dispersion which in turn is a function of the metal
content
It would thus be desirable to produce a catalyst in which the crystals
generated during synthesis are held by the support and thus are
prevented from migrating and agglomerating during subsequent heat
treatments One such method is co-precipitation In the case of this
synthesis procedure as discussed in detail in Section 134 and 364
a reaction oCcurs between the support and the metal ie the meta] is
held by the support and the crystals are uniformly distibuted
throughout the matrix This type of catalyst was found to be much more
active for the 01 igomerisation of propene than impregnated cata list s
According to Holm et al (1957) th is is due to the hish extent of
distribution and dispersion of the nickel Ions present in thiS catalyst
However the same 1 imitations of nickel content on the activity were
114
observed ie the catalysts with a nickel content between 3 and 5 wt
were the most active (Holm et al 1957) In the case of SG type catalyst
this cannot be explained in terms of loss of dispersion with increasing
nickel content as it has been shown by Holm et al (1957) that the
crystal size remained unchanged as the nickel content was raised from 3
to 20 wt~ The reason that the activity did not increase as the nickel
content was raised beyond 5 wt may either be due to the inaccessibility
of the reactant molecules to the nickel or due to the nickel being in
an unsuitable form ie Nio as opposed to Ni+ 2 (NiO) after
calCination The latter was supported by the fact that the nickel was
diffiCult to reduce ie bullbull a reduction of only 50 was achieved after 2
h on stream at 500degC by Holm et a1 1957gt
It is thus proposed that although crystal dispersion remained unchanged
in co-precipitated nickel silica alumina catalysts up to a nickel
content of 20 wt the location and form of the crystals prevent total
utilisation of the available metal
Since most unsupported catalytically active materials sinter rapidly at
the conditions of calCination andor reaction (Hermans and Geus 1979)
the active compound has to be attached to a highly porous thermostable
support such as s11 ica or silica alumina This support which is often
not catalytically active itself increases the dispersion of the
catalytically active material Also the support is used most effectively
when the active material is distributed densely and uniformly over it
and is firmly held by the support A rapid transportation of the
reactants and products through the porous catalysts is also a
prerequisite for an active solid catalyst Sil ica alumina is such a
support but the available method of loading rlicke1 onto it viz bull
impregnation does not lead to an adequate degree of interaction between
the support and the metal An alternative method of loading ~lckel onto
sil ica alumina is thus required in which a uniform dispersion and
distribution could be ensured together with a strong interaction between
the support and the metal
In the case of nickel sir ica catalysts such a method was developed by
van Dillen (1976) and was termed homogeneous decompOSition deposition
(HOD) In this method as discussed In detail in SectIon 133 and
Section 363 the high degree of penetration or the solute into the
support during impregnation was combined with a controlled Ion exchanse
type preCipitation
115
In the case of nickel silica catalysts prepared by HOD measurements of
particle size distribution indicate a range of between 1 and 3 nm for
loadings of up to 30 wt~ nickel (Richardson and Dubus 1978) Furthermore
a strong interaction exists between the support and the metal and
conseQuently this type of catalyst was extremely resistant to sintering
Thus in the case of an HOD nickel sil ica catalyst with a nickel content
of 83 lilt Montes et al (1984) showed that after calcination in dry air
at 450degC for 16 h the averase diameter of the nickel particles decreased
from 51 to 46 nm In the case of an impregnated nickel sil ica
catalysts with the same nickel content the average nickel particle size
after calcination at the same conditions was 45 nm From this it may be
concluded that in the case of HOD nickel si 1ica catalysts the metal is
not present in the bulk oxide form This was in fact confirmed by Montes
et al (1984) usins X-ray diffraction The exact nature of the form of
the metal on the surface is not known Also the crystall ites in HOD
nickel si1 ica were readily accessible This was inferred from the
results of Blackmond and Ko (1984) who recorded 100~ reduction after 4 h
on stream at 500degC
From the discussion presented above it can be seen that the method of
homogeneous decomposition deposition produces a nickel sil ica catalyst
where the nickel is distributed densely and uniformly over the support
and that a strong interaction betweenthe support and the metal exists
In the case of nickel oxide si 1 ica alumina catalysts prepared by
homogeneous deComposition deposition no data was avai1ab1e in the
1 iterature either on the degree of dispersion or distribution or on the
support-catalyst interaction It is however thought that in view of the
results obtained from nickel si1 ica catalysts a high degree of
interaction occurs and that the crysta1l ites are uniformly and densely
distributed throughout the support
In this work the extent of metal distribution and dispersion on the
support phase and the nature of the support metal interact ion of nickel
oxide silica alumina catalysts prepared by homogeneous decomposition
depOSition were not investigated However the catalytic activity and
selectivity of this catalyst for the 01 igomerlsation of propene were
examined in detail and compared with the activity and selectivity of
nickel oxide si 1 ica alumina catalysts prepared by impregnation and coshy
preCipitation A discussion of each aspect of the work is now given
The reproduCibll ity study (Section 411 indicated that the experimental
results obtained in this study were reliable Once steady state
116
operation was reached both the selectivity and LPR showed 1ittle
variation between runs at similar reaction conditions
The reaction conditions used were unless otherwise stated (see iable
41) 80degC and 40 atm It can be seen from the phase diagram shown in
Appendix B that the reactants were in the 1 iQuid phase ConseQuently a
two phase system was studied When the temperature was raised above the
feed bybb1e point temperature of 86degC at 40 atm ie when the
reactants were in the vapour phase a three phase system was studied
The aim of this study was to compare the characteristics of a nickel
oxide si1 ica alumina catalyst synthesised via the HOD method adapted by
the author from the work done by van Dillen (1979) on nickel oxide
si1 ica catalysts with those of a catalyst prepared by the standard
impregnation techniQue (referred to as IMP) and co-precipitation
(referred to as SG) as discussed by Holm et al (1957gt
The effect of synthesis procedure on the propene ollgomerisation
properties of nickel oxide sil ica alumina was investigated by Holm et al
(1957) for an IMP type catalyst and a coprecipitated (SG) type catalyst
They found that the oligomerisation activity of SG type catalysts was
approximately 15 times that of IMP type catalysts HOD type catalysts
on the other hand had an activity similar to that of IMP type catalysts
but their performance was not as sensitive to the reaction conditions
and nickel content as IMP and SG type catalysts were With this in ~ind
a comprehensive study of the effect of reaction conditions using nickel
oxide sil ica alumina a catalysts prepared by homogeneous deComposition
deposiUon impregnaUon and to a 1 imited extent cODrecipltation were
carried out
Firstly the effect of the Quantity of nickel loaded onto the catalysts
was Investigated In the case of IMP type catahsts Hogan et al (1955)
had found that a nickel content between 3 and 5 wt gave the most
active catalyst Holm et al (1957j examinin9 the propene 01 igomerisaticn
actIvity of IMP as well as SG type catalysts found that irrespective of
syntheSis techniQue catalysts with a nickel content between 3 and 5 wt~
were the most active
In the case of IMP type catalysts examined in ~he present study no such
trend was observed IncreaSIng the nickel content from 22 wt to 63
wt~ at an average WHSV of 48 and 49 ghg respectiv~ly caused the LPR
to decrease by 42 Using on the other hand catal S With a nlck~l
content of 19 and 98 wtl at an avera~e WHSV of 53 and 52 9h~
117
respectively an increase of 5X In LPR was recorded In view of the
conf1 icting results obtained in this study and the differences In WHSV
from run to run no statement as to the effect of nickel content on the
activity of impregnated nickel oxide sil ica alumina catalysts could be
made
In the case of an HOD type catalyst increasing the nickel content did
not lead to a marked change in the LPR Differences in the WHSV and the
fact that the conversion was greater than 90 wtX in all the runs make a
comparison of the results diffiCult However comparing runs with
identical average WHSV viz bull 42 ghg showed that changing the nickel
content from 15 wtX to 72 wtX did not affect the LPR Similarly at a
WHSV of 49 and 50 ghg identical LPR were observed for catalysts with
nickel contents of 117 and 22 wtre
Thus although the study of the effect of the nickel content on the LPR
in the case of both IMP and HOD type catalysts is not unambiguously
conclusive the available data seems to indicate that the activity of an
HOD type catalyst was relatively independent of the nickel content and
that irrespective of nickel content HOD type catalysts were on average
20r more active than IMP type catalysts
It was observed while examining the effect of WHSV on the activity and
selectivity over HOD type catalysts that the selectivity was a function
of the Conversion ie bullbull a shift to 1 ighter products was recorded when
the conversion decreased Neither IMP type catalysts nor HDD type
catalysts exhibited a strong dependence of product composition on nickel
content In the case of IMP type catalysts the catalysts with 08 wt
nickel did show a greater selectivity towards trimers but the overall
trend observed was a gradual increase in dimer yield with increasing
nickel content at the expense of the trimer (Section 42) The small
Increase in dimer yield with increasing nickel content observed in this
work was in agreement with the data reported by Takahashi et al (1969)
who recorded the maximum dimer Yield for an impregnated nl~kel oXlde
sil ica alumina catalyst with a nickel content of 97 wt ~
The selectivity of HOD type catalyst was independent of the nickel
content when the nickel content was held between 1 3nd 7 wt~ At a
higher nickel content viz bull 11 wtX a decrease of 10 In dimer yield was
observed After careful examination of the data however it was found
that after 4 h on stream the WHSV for the catalysts with 22 and 17
wtY nickel were 53 and 49 respectively This 8 decrease in WHSV
between the runs may explain the observed decrease in Jimer yjel~
118
It may thus be concluded that the activity and selectivity of HDD type
catalysts were independent of the nickel content with in the range of
nickel loadings of 15 to 117 wtX In the case of IMP type catalysts
increasing the nickel content caused a shift to 1 ighter products with no
discernible effect on the activity
The effect of varying the pressure at a fixed temperature on the
activity and selectivity of an IMP type catalyst was investigated in
detail by Takahashi et al (1969) In the present work the effect of
varying the pressure at a fixed temperature of 80 c C for an IMP as well
as for HOD and SG type catalysts was investigated For an IMP type
catalyst the results obtained were similar to those of Takahashi et a1
(1969) Thus in the case of IMP type catalysts a drop in activity was
recorded when the pressure was lowered from 40 atm to 20 atm at a
constant temperature of 80 c C ie bullbull when the system moved into the
vapour phase In the case of an SG type catalyst it was found that the
catalyst was inert at 20 atm
In the case of a HOD type catalysts differences in WHSV and the fact
that the conversion was greater than 88 wtX in all runs make an
interpretation of the results difficult From the available data it can
however be seen that although the average WHSV increased from run to
run the LPR over HOD type catalysts remained constant as the pressure
was dropped from 50 atm to 20 atm From this it may be concluded that
the activity of HO~ type catalysts decreased as the pressure was
deCreased
In respect of the effect of pressure on product selectivity Takahashi
et al (1969) found that when the system moved into the vapour phase at a
constant temperature a shift to heavier products occurred Using an IMP
type catalyst this was also observed in this stJdy ie bull a dr0P or
in dimer yield mainly in favour of the trimer was observed when the
pressure was dropped from 40 atm to 20 atm In the case of HOD type
catalysts an opposite trend was observed viz bull decreasing the pressure
from 50 atm to 20 atm resulted in an almost 1 inear increase in dImer
i e 1 d
From the above discussion It can be seen that IMP type catalysts
contradict thermodynamics with regards to selectivity It was expected
from thermodynamics that as the pressure was decreased From 50 to 20 atm
the dimer yield should increase In the case of an HDD type eatalst
thiS was found to be the case Tn the case of IMP type catalysts
however an opposite trend was was observed Ie a ShiH to heavier
119
products as the pressure was decreased from 50 to 20 atm The observed
shift to heavier products with decreasing pressure may be explained if
it is assumed that at the lower pressures the heavier products are able
to evaporate off If this were so then in the case of HOD type catalysts
the yield of heavier products should also increase as the pressure was
decreased This was infact found to be the case although the increase in
trimer yield was very small In the case of both IMP and HOD type
catalysts the activity decreased as the pressure was decreased
To complete the study of the effect of reaction pressure and temperature
on the selectivity and activity the effect of varying the temperature
at a fixed pressure was investigated Since the above results for IMP
type catalysts were in agreement with those of Takahashi et al (1969)
and much information is available in the 1 iterature on IMP type
catalyst no further experimental work using IMP type catalysts was
done ConseQuently the results obtained from the 1 iterature were used to
compare IMP and HOD type catalysts
In the case of IMP type catalysts Takahashi et al (1969) foun d that
moving into the vapour phase ie when the temperature was raised
above approximately 90degC at a pressure of 50 atm a sl ight drop in
activity was observed Increasing the temperature beyond the bubble
point of the feed was accompanied by a shift to heavier products The
reason that the catalyst activity decl ined only sl ightly with increasing
temperature at 50 atm was that the sil ica alumina support becomes active
at the higher temperatures At 35 atm on the other hand crossing the
phase boundary results in a rapid decl ine in propene conversion with
increasing temperature The reason for this is that si 1 ica alumina is
only sl ightly active at 35 atm for the 01 igomerisation of propene
ltTakahashi et a11971gt The shiH in product spectrum ie a shiH
to heavier products can also be explained in terms of silica alumina
activity This is so because the preferential product of silica alumina
when the latter is used for the 01 igomerisation of propene is a propene
trimer (Feldblyum and Baranova 1971 Takahashi et a1 1971)
The nature of the products formed over si 1 ica alumina wheuron Jsed for the
01 igomerisation of propene and the effect of temperature on the activity
and selectivity were examined The results obtained were in agreement
with those of Takahashi et al (1972) liz silica alumina was actve
for the 01 igomerisatlon of propene as long as the system temperature
remained above 150degC Also the activity Jropped with decreasing reaction
temperature At 80degC Ie in the 1 iquid phase at 40 atm the catalyst
was inactive This was not in agreement with the results of Feldblyum
120
and Baranova (1971) who in a batch reactor recorded 6X conversion at
64degC and 50 atm The reason for the difference in the results was
properly due to the different pressures used ie bullbull 40 atm in this work
as opposed to their 50 atm and the di fferent process ie batch as
opposed to fixed bed reactor The product spectrum obtained agreed with
that foun d by other workers viz bull decreasing trimer yield With
increasing temperature and propene trimer being the main product
In the case of an HOD type catalyst increasing the temperature at a
fixed pressure resulted in the LPR dropping by approximately 50r when
the system moved into the vapour phase Increasing the temperature
further did not result in any marked changes in the LPR Thus although
the average WHSV increased from run to run the LPR remained
approximately constant as the temperature was increased From this fact
it may be concluded that the activity of the catalysts decreased as the
temperature was increased
The overall shift to heavier products when raising the temperature from
80degC to 150degC ie bullbull an increase in propene trimer at the expense of the
propene dlmer was expected in view of the catalytiC role of the sil ica
alumina support at the elevated temperatures The increase In dimer
yield as the temperature was raised further from 150degC to 210degC could be
explained in terms of the increasing WHSV and hence decreasing activity
of the catalyst (See Section 441)
From the different trends in product spectrum recorded when operating in
the vapour phase ie bullbull an increase in trimer yield with increasing
temperature when using nickel oxide sil ica alumina as opposed to a
decrease in trimer yield when uSing silica alumina observed in this work
it could be concluded that in supported nickel catalysts the ni~kel
still played a role at the elevated temperatures ThiS conclusion was
also supported by the results of Takahashi et al (1972) who found that a
physical mixture of sll iea alumina and nickel oxide had the same
activity as sil ica alumina alone thus indicatin9 the importance of
supporting the nickel Also the conversion over nickel oxide s11 ica
alumina was less senSitive to the reaction temperature then was the case
for silica alumina when the system was operated in the vapour phase at
40 atm Thus in the case of si 1 iea alumina a drQP in LR of 83~ was
recorded when the temperature was dropped by 50degC from ZODoC while in
the case of a HOD type catalyst3 an increase In LPR of 30 was recorded
when the temoerature was decreased over the same range
The 1 ifetimes of the catalysts were examined by the changes in the
activity over the first 10 h on stream In the case of an IMP type
catalyst data was avai lable in the 1 iterature on the 1 ifetime when this
type of catalyst was used for the 01 igomerisation of butene (Hogan et
al 1955 Allum 1974) The results obtained by these researchers was
that the activity of the catalyst did not change markedly after 100 h
and 21 days on stream respectively No data was however available on
the 1 ifetime of this catalyst when used for the 01 igomerisation of
propene
As using the changes in activity over the first 10 h on stream as an
indication of 1 ifetimes was very sensitive to WHSV fluctuations both
the changes in LPR and WHSV have to be recorded The average WHSV in
this run was 53 ghg In the case of an IMP type catalysts the LPR
dropped by 175X after 5 h on stream during which time the WHSV dropped
by 1X In view of the fairly constant WHSV and the large drop in LPR it
may be assumed that IMP type catalysts deactivate rapidly when used for
the oligomerisation of propene A slight shift to lighter products was
also observed during this run which was expected in view of the
decreasing activity
In the case of SG type catalysts the LPR dropped by 96~ while the WHSV
dropped by 21~ after approximately 6 h on stream The average WHSV
during this run was 52 ghg The change in the WHSV was considered
acceptable and so it may be concluded that this type of catalyst
deactivates less rapidly than IMP type catalysts do when used for the
01 Igomerisation of propene This conclusion was also reached by Holm et
al (1957) In the case of this catalyst a slight shift to lighter
products was also observed with time on stream
In the case of a sil ica alumina when operated at 200degC the LPR dropped
by 315~ while the WHSVover the same time period of 76 h dropped by
28X The average WHSV during this run was 35 gh9 From these results
it can be seen that this catalyst rapidly deactivates when used for the
01 igomerisation of propene at 200degC A very sl ight shift to 1 ighter
products was observed during this run
In the case of an HOD type catalyst no data as to the 1 ifetime ~as
available and hence a long run was performed The LPR fluctuated during
this run due to WHSV fluctuations The average WHSV during this run was
52 ghg USing data pOints 105 h apart with nearly Identical WHSV of
56 and 57 ghg respectively it was found that the Conversion
decreased by 126X over this period The selectivi~y also changed during
122
this run ie bullbull the Quantity of dimer formed increased by 25~ at the
expense of the tetramer and pentamer after 120 h on stream
The I ifetime of the catalysts as measured by the drop in activity over
the first 10 h on stream are in order of decreasing length HODgt sa gt
IMPgt SA It may thus be concluded that HOD type catalysts are superior
with respect to 1 ifetime when used for the 01 igomerisation of propene
than any of the other catalysts studied
The effect of varying the ~HSV on the activity and selectivity of IMP
type catalysts was examined by Takahashi et al (1969) and by Hogan et a1
(1955) who also examined the effect of feed composition They found as
discussed in detail in Section 1524 that the rate of polymer
production increased 1 inear1y with propene concentration ie bull a first
order relationship between propene concentration and rate of polymer
formation was obtained The optimum space velocity for maximum
conversion was less than 2 ~ of propene per ~ of catalyst per hour
(Takahashi et a1 bull 1969) At higher ~HSV Takahashi et al (1969) found
that the conversion dropped rapidly
In the case of HOD type catalysts the LPR increased with the ~HSV
However the catalysts deactivated rapidly at the higher WHSV ie bull a
WHSV greater than 11 ghg in this work resulted in a drop in the LPR of
28X after 7 h on stream As expected the overall conversion decreased
with increasing WHSV droPPing from 96~ at the lowest WHSV of 49 ghg
to 77~ at a WHSV of 116 ghg
The selectivity was also affected by the changing WHSV viz a shift to
1ighter products and an increase in dimer Yield was observed with
increasing WHSV This trend is OPPOSite to that observed by Takahashi et
a1 (1969) who found using IMP type catalysts that dimer selectivity
decreased for a WHSV greater than 32 ghg Why this shoyld be so is
not known The trends In conversion are however identical viz bull
Conversion decreased with increasing WHSV
The effect of operating the catalyst initially at ZOOdegC and then reusing
ii at SOdegC was examined The catalyst was calCined in the normal man~er
between the two runs The effect on LPR and selectivity of operating the
catalyst at 200degC has already been discussed
From the results obtained in this study It was found that the actiVity
of the catalyst at sooe was affected by operating it first a~ 200degC and
the steady state Conversion after 4 ~ on stream e11 by 28~ from that
123
of a catalyst used under normal conditions The selectivity ~as also
affected by this procedure a shift to 1 ighter products being recorded
The reason for the decrease in activity ~as probably the same as that
suggested by Hogan et al (1955) in the case of IMP type catalysts
~hereby the nickel oxide promoter under~ent changes such as sintering or
a change in oxidation state during the repeated calcination and high
reaction temperature ~hich caused the activity to decl ine The catalyst
~hen operated under normal conditions did not deactivate to any marked
extent and hence no data as to the effect of repeated calcination on
the activity and selectivity ~as available
The effect of feed contaminants ~as examined in detail by Hogan et al
(1955) using an IMP type catalyst This ~as discussed in detail in
Section 1525 In this ~ork only the effect of ~ater on the activity
and selectivity ~as examined In the case of an IMP type catalysts Hogan
et al (1955) found that if the catalyst ~as allo~ed to absorb as little
as 05 ~t~ moisture the catalyst deactivated They found that this type
of contamination ~as totally reversible
In the case of an HDD type catalyst using an undried feed containing 112
ppm (vv) ~ater the catalysts deactivated after J5 h on stream as
opposed to the more than 120 h recorded ~hen using a dry feed Using the
average WHSV of 51 ghg to calculate the quantity of ~ater fed to the
reactor and assuming that al 1 the ~ater entering the bed ~as absorbed by
the catalyst the mass of ~ater absorbed by the catalysts ~as 510- 3
9H20gcat or 05 ~t~ This result is consistent ~ith to that obtained
by Hogan et al (1955) for IMP type catalysts Furthermore the
contamination ~as totally reversible as the catalysts regained its
normal dry feed properties ~ith respect to activity and selectivity
after regeneration
To examine the catalytic properties of the HDD type catalysts when used
for the ollgomerisation Ot propene dimer (C6) the lt 69degC fractIon from
previous runs ~as fed to the reactor To quantify the activity of the
catalyst the equations as discussed in Section 49 ~ere used to
calculate the LPR and conversion At 80degC the catalyst was active for
the oligomerisation of C6 but deactivated rapidly This ~as probably due
to the hl9h molar ~ei9ht products formed viz a propene tetramer
(CI2) stallng on the catalysts and so blocklng the active sites Upon
raiSing the temperature to 200degC the catalysts raPldl~ re9ained activity
reaching a steady state conversion of 64 The only product formed
124
during this run to any significant extent was a propene tetramer
(Ct2)
Feeding Co and CJ simultaneously also caused the catalyst to deactivate
after approximately 3 h on stream at 80degC The maIn product formed
during this run was a propene trimer (C9) The reason for the rapId
deactivation was probably the same as above ie bullbull the accumulation of
the propene trimer (C9) in the system and consequent blocking of the
active sites After regeneration and reusing the catalyst at 200degC the
catalyst was again active for the 01 igomerisation of the CJCo mixture
In thIS case the main product was also a C9 01 igomer with Ct2 through
C2 t formed in reasonable quantities Co-feeding Co with CJ thus has the
effect of increasing the average molecular weight of the products over
that when pure CJ was fed although different temperatures are needed to
ensure reasonable activity when Co or a CoC] mixture was used
The oligomerisation activity of the si1 ica alumina support when feeding
Co or C]C6 at 2DDoC was not examined That the support does playa role
can not be disputed as si1lca alumina is catalytically active for the
01 igomerisation of propene at temperaturesgt 1SDoC The large Quantity
of C9 formed when co-feeding CJ and Co could be explained in two ways
Firstly it could be assumed that the co-o1 igomerisation of Co and CJ was
more rapid than the dimerisation of Co or secondly that the
trimerisation of propene was the main source of the trimer The second
option seems more 1 ikely as the preferential product of si 1 ica a11Jmina
when used for the 01 igomerisation of propene at 20DoC is a propene
trimer
In the case of Ni-lSM-5 Miller (1984) suggested the use of a two stage
system whereby a high Yield of propene tetramer was possible The system
suggested by Miller (1984) was that propene should first be dimerised in
the normal way over Ni-lSM-5 at 27 to 93degC and 27 to 109 atm followed by
a distillation to separate the dimer fr~m the other products The
second stage woul d then be the 01 igomer ig3t ion of the Co stream it 121
to 232degC and 14 to 54 atm to propene tetramers both reactions being
conducted in the liQuid phase The final liQuid product )btained
contained as much as 60 wtX propene tetramer ~rom the results obt31ned
in the present work it becomes apparent that HOD t~pe nickel oxide
Silica alumina also achieves this prodlct spectltJm The reactiCn
conditions used in thiS work were 80degC and 40 atm for stage one the
product containln3 65 wt dimer and 20DoC at 40 atm For stage two Yere
both reactions were also In the 1 iquld phase and the flnal product
obtained contained appr~ximately 45 wt propene tetramerlf on th~ ot~er
125
hand the feed to stage two is a mixture of C3 and C also at 20Doe and
40 atm the final 1 iQuid product contained 20 wt~ C9 with e12 to C21
also being formed in reasonable Quantities Thus depending on the feed
used the products obtained can range from predominantly dimer obtained
when pure e3 is fed to almost pure tetramer when a C feed is used to
a high molecular weight product C to e21 when C3 and C are fed No
information was however available as to the degree of branching of the
products formed
The effect of the activation procedure in the case of IMP type catalysts
was studied in detail by Takahashi et a1 (1969) with respect to aCidIty
structure and propene dimerisation activity They found that a
temperature between 500degC and 600degC was needed to activate the catalyst
and that the activity increased with increasing activation time up to 5
h above which the activity did not change A more detailed discussion on
the effect of activation procedure on the nature of the catalyst is
given in Section 1526
In the case of an HOD type catalyst using TOoTA the only thermal event
recorded was an endotherm between 500 0 e and 600degC This was probably due
to the decomposition of organic intermediate incorporated in the
catalysts during the synthesis to nickel oxide Below bOOoe the mass
loss was 122 wtra while 15 wt was lost between 600 and 800degC In view
of the work done by Takahashi et a1 (1969) as discussed above it was
assumed that in the case of HOD type catalysts the optimum calcinatl0n
temperature also lay in the region of 500 to 600 0 e
To determine the Quantity of water that the catalyst absorbed the
previously calcined catalysts was re-exposed to aIr and the mass loss
recorded In this run the rate of mass loss was fairly ynlform the
overall mass loss bein3 37wt From the results obtained it was
concluded that below 600degC ie bull below the endothermic event observed
In the case of the unused catalyst the onl) species removed frOM the
catalyst was water
To determine the Quantity of hydrocarbon held by the catalyst aft~r it
had been used for the 01 i90merisatlon of propene as a function of nl~~el
content the TOoTA Curves for 3n HOD type catalysts With a nlck-l
content of 113 and 15 wt~ were recorded In vIew of the abQv~
discussion the mass loss recorded below 6COo~ was probably due t) the
removal of water and in this case 1 i3ht hydrocarbons As +he catagtsts
uDon completion of a run were not stored In air ~i3ht c1ntainers ~hey
probably absorbed water from the atmosp~ere Consequent ~ ~~ mak~ t~~
126
comparison meaningful only the mass loss above 600degC was considered
Below 600 0 e the mass loss recorded were 81 and 105 wt~ for HOD type
catalysts with a nickel content of 113 and 15 wt~ respectively From
this result it can be seen that the higher the nickel content the lower
the amount of adsorbed hydrocarbon and hence the lower the degree of
active site contamination In view of this result it may be concluded
that a high nickel content is desirable to ensure a long catalyst
lifetime Above 600 0 e the mass loss was independent of the nickel
content and In both cases was approximately 15 wt~
To compare the effect of synthesis procedure and the Quantity of
hydrocarbon held by the catalyst after it had ~een used for the
01 Igomerisatlon of propene the TGDTA Curves for an IMP HOD and SG
type catalyst were recorded In this case the total mass loss was
considered and it was found that the sa type catalyst had the highest
mass loss (244 wtX) followed by the IMP type catalyst which had a mass
loss of 173 wt~ and an HOD type catalyst which showed a mass loss of
120 wtX From these results it can be seen that the HOD type catalysts
held the least amount of hydrocarbon which gave a further indication
that the extent of deactivation of this catalyst was not as great as
that of the other catalysts examined
The products obtained when propene ~as 01 igomerised over an IMP type
catalyst were found by Hogan et al (1955) to contain as much as 70 vol~
Co of which 35 vol~ were linear hexenes In the case of this work the
degree of branching ie the CH3 to CH2 and CH to CH ratio was
determined using 1H NMR From the results obtained the products formed
over the IMP type catalyst were the most branched followed by the
products formed over SG type catalysts The products formed over HDO
type catalysts were the least branched From the above results if it is
assumed that the degree of branching found in this work for the products
formed over IMP type catalysts correspond to the product spectrum Quoted
by Hogan et al (1955) then the products ormed over HOD and SG type
catalysts contain more 1 inear Cos than the products formed over IMP
type catalysts do
From the present work two Questions arise They are
(1) Why is nickel oxIde silica alJmlna active for the ol190merlsation
of Dropene at sooe and sil ica alumina only at temperatures great~r
than 150degC
127
(II) Why is the preferential product of nickel oXide silica alumina
when used for the oligomerisation ~f propene a propene dimer
while that of si1 ica alumina when used for the same reaction a
propene trimer
It is proposed that the differences observed are due to the nature of
the active site and hence the 01 igomerisation mechanism
In the case of silica alumina the nature of the active site is
controversial because of the lack of conclusive evidence The various
schemes that have been proposed (8 in total) are diSCussed in Section
1231 It can however be concluded from the structure of the products
formed as establ ished in detail by Feldblyum and Baranova (1971) and
discussed in detail in Section 1232 that sil ica alumina 01 igomerises
propene via a carbonium ion meChanism ThiS in turn would explain why a
high reaction temperature is needed for silica alumina to be active for
the 01 igomerisation of propene
In the case of nickel oxide silica alumina 5 schemes have been
formulated as to the nature of the active site and hence 01 i90merisation
mechanism The various schemes proposed have been discussed in Section
1241
An early indication of the nature of the active site was given by Clark
(1953) who sugsested that the nickel crystals in nickel oxide sil ica
alumina contained an excess of metal ions Hence the active center may
either be an anion vacancy or a nickel atom not directly linked to an
oxygen atom and situated at lattice or interstitial p~ints This
sU9sestion was used by Feldblyum et a1 (1974) who then continued to
draw a compar I son between the 01 I gomer i sat ion mecran ism over nom0geneous
catalysis based on nickel salt and organoaluminium compounds and
heterogeneous catalysts based on nickel OXide on acid carriers This has
been discussed in detail In Section 1242 and summarised In Table
11 The conclusion reached by Feldblyum et a1 (1984) was that the
01 igomerisatlon of propene over nickel oxide sll iea alumina proceeds via
a complex hydride This mechanism proposed by them accounts for t~e
observed activity and selectivity of nickel oxide sll i3 alumina
Thus although no eVidence eXists to support or discount the mech~~lsm
proposed by Feldblyum and Baranova (1971) to expain the activity and
selectivdyof Silica alumina and FeldblYJm et a1 (1974) to $ltplaln
the activity and selectivity of nickel oxide 811 ica alumina they s~r~e
128
as a 900d model It is however clear that more work is reQuired to
explain these observations
In conclusion
ltI) The incorporation of nickel into sil ica alumina enhances the
catalyst activity at low temperatures and affects the
selectivity ie bullbull causes a shift to I ishter products
(II) The method of incorporating the nickel affects the activity and
selectivity o~ this catalyst
(III) The activity and selectivity o~ nickel oxide sil ica alumina
catalysts prepared by the HOD method are independent o~ the
nickel content In the case of IMP and SG type catalysts this is
not the case
ltIV) The selectivity and activity of HOD SG and IMP type catalysts
are all sensitive to the reaction temperature and pressure
(V) The 1 i~etime of HOD type catalysts when used for the
01 igomerisation of propene was 3uperior to that of the other
catalysts studied
(VI) HOD type catalysts are more active than any of the other
catalysts examined
(VII) HOD IMP and SG type catalysts are all sensitive to the feed
moisture content The introduction of a wet feed results in hish
initial activity followed by rapid deactivation The rapid
deactivation may be due to the conversion of Lewis aCld sites
to Bronsted acid sites in the presence of water
(VIII) The product spectra of HOD and IMP type catalysts are similar 3G
type catalysts however exhibit a greater selectivity towards
heavier products
(IX) HOD type catalysts can be used for the 01 igomerisation 0 hl9h
molar welght 01 igomers
129
REFERENCES
Allum KG bullbull United States Patent Appl ication No 3816555 (1974)
Bartlett PO Condon FE bullbull and Schneider Abull J Am Chem Soc bullbull 66
1531 (1944)
Blackmond DG and Ko E Appl Catal 13 49 (1984)
Boreskov OK bull in Preparation of Catalysts (Delmon Bbullbull ed)
Elsevier Amsterdam 223 (1976)
Brookes CS bull and Christopher GLM J Catal 10 211 (1968)
Cartwright PFS bullbull Newman EJ and Idilson DId bullbull The Analyst 92
663 (1967)
Cervello J bullbull Hermana E Jimlnez J bull and Milo F bullbull in Preparation of
Catalysts ltDelmon Bbullbull eds) Elsevier Amsterdam 251 (1976)
Clark Abullbull Ind Eng Chem bullbull 45 1476 (1953)
Coulson JM bull and Richardson JF bullbull Chemical Engineering Vol II
Pergamon Press New York (1980)
Couper A and Eley D Dbull Discussions Faraday soc 8 172 (1950)
Dorling LA Lynch 13 IdJ and Moss LL bull JCatal 20190 (1971)
Dow IdM and Jakob Mbull Chem Eng Pro 47 637 (1951)
Dowden DA J Chem Soc bullbull 242 (1950)
Dutkuwicz RK bullbull Energy 1980 An Energy Pol ICy DiScussion Document The
Energy Research Institute- UCL 1980
Evans AG bullbull and Polantl ~L NatJre 152 733 (1947)
Feldblyum VSh bull and Baranova rT ZhlJrnal Orsanichesoi Kiml 7
2257 (1971)
130
FeldblyYm V Sh bullbull Petryshanskaya NV bullbull Lesheheva AI bullbull and Baranova
11 Zhyrnal Organischeskoi Khimii 10 2265 (1974)
Finch JN bullbull and Clark A JCatal bullbull 13 147 (1969)
Fontana CM bullbull and Kidder GA bullbull J Am Chem Soc bullbull 70 3745 (1948)
Forni L bullbull Catalysis Reviews Vol 8 (Heinemann Ht ed) Marcell
Dekker New York (1974)
Galya LG bullbull Occelli ML bullbull and Yoyng DC J Mol Cat 32 391
(1985)
Heertjiesl PM and Mc Kibbins SiAl Chem Eng SCi bullbull 5161 (1956)
Hermans LAM bullbull and Geys JN in Preparation of Catalysts II
(Delmont Bbullbull Grange P bullbull and Jacobs P eds) Elsevier The
Netherlands (1979)
Higley DP EYropean Patent Appl ication No 843052143 (1984)
Hill FN bullbull and Selwood PW J Am Chem Soc 71 2522 (1949)
Hirschler AE Am Chem Soc Meet Chica30 Sept 1970 Reprints
Div of Petrol Chem 15 A97 (1970)
Hogan JP Banks RL Lanning WC bullbull and Clark Abullbull Ind Ens Chem
47 LI (1955)
Holm VCF bullbull Bailey GC bullbull and Clark A Ind Eng Chem bullbull 49 250
(1957)
Holm VCF and Bailey GC bull and Clark A bullbull JPhys Chem 63 129
(1959)
Hoyalla M and Delmon B bullbull Surface and Interface Anal 3 103 (1981)
Hunter WH bullbull and Yohe RV bullbull J Am Chem Soc 55 1248 (1933)
Imal Hbullbull and Uchida Hbull Bull Chem Soc Japan 38 925 (1965)
Imai H Hasesawa L and Uchida H Bull Chem 30c Japan 41 45
( 1968)
131
Johnson 0 bullbull J Am Chem Soc bullbull 59 827 (1955)
Langlois GE bullbull Ind Eng Chem 45 1470 (1953)
Leva Mbullbull Fluidisation McGraw and Hill (1959)
LevensPlelO bullbull Chemical Reaction Engineering 2nd ed bullbull John Wiely and
Sons (1972)
Maatman RW bullbull and Prater CD Ind Eng Chern bullbull 49 2 (1957)
McNair HM bullbull and Bonell i EJ bullbull BasiC Gas Chromatography 5th ed
Varian Instrument Division (1969)
Mickley HS bullbull and Fairbanks DF bullbull AI Ch EJ 1 374 (1955)
Miller SJ bullbull US Patent 4608450 (1986)
Mizuno K bullbull Ikeda Mbullbull Imokawa T bull Take J bull and Yoneda Ybullbull Bull
Chem Soc bullbull Japan 49 1788 (1976)
Montes Mbullbull Penneman de Bosscheyde Cbullbull Hodett BK bullbull Delannay F bull
Grange P bullbull and Delmon B bullbull Appl Catsl 12 309 (1984)
Norrish RGIJ and Russell KE bullbull Trans Faraday Soc bull 43 91 (1952)
Ozaki Abullbull and Kimura K JCatal 3 395 (1964)
Ozaki Abullbull Ali H and Kimura K bullbull FOJrth Int Cong Catal Moscow 40
(1968)
Peri JB JCatal 41 227 (1976)
Ramser JH and Hill PB bullbull Ind Eng Chem bull 501 (1958)
Richardson JT and Dubus RJ bull J Catal 54 207 (1978)
Sato Mbullbull Aonuma T and Shiba T Poc Third Int Con-l Catal
Amsterdam 1964 1 396 (1965)
Schmerl ing L and Ipatieff )N bull Advances in catalysIs II New York
AcademiC Press Inc 21 (1950)
sc h u lt z R G S c h tJ C k J M and IJ i 1 d I B Cbullbull J Cat a1 6 385 (1 966
132
Shepard FE Roohes JJ bullbull and Kemball Cbullbull JCatal 1 379 (1962)
Smith JM bullbull and Van Noss HC bullbull Introduction to ChemIcal Engineering
ThermodynamiCs 3rd Edition McGraw and Hill International Book Company
New York (1981gt
Takahashi Kbullbull Sasaki 0 bullbull Aomura Kbullbull and Ohtsuka H Hokkaido Daisaku
Kogakubu Kenkyu Hokoku 53 201 (1969)
Takahashi K bullbull NishiH Yoneda Nbullbull and Ohtsuka Sekiyu Gakkai Shi 15
482 (1972)
Tamele MW bullbull Ind Eng Chem 8 270 (1950)
Thomas CL Ind Eng Chem bullbull 37 543 (1945)
Ublad AG bullbull Mills GA Heinemann Hbullbull Polymerization of Olefins
Emmet (ed) Catalysis 5 New York (1958)
Uchida H and Imai Hbullbull Bull Chem Soc Japan 35 995 (1962)
Van Dillen JA bullbull Geus JW bullbull Hermans LAM bullbull and Van Der Mejden Proc
Sixth Int Congo Cata] B7 (1976)
Walton AG bullbull in Dispersion of Powders in liquids (Parfitt GD bullbull ed)
Elsevier Amsterdam 122 (1969)
Ward JW bullbull and Hansford RC bullbull J Catal 13 154 (1969)
Weeks TJ bullbull Jr bullbull Angell CL Ladd IR bullbull and Bolton AP JCatal
33 256 (1974)
Whitmore FC Ind En2l Chern 26 94 (1934)
Yagi S bullbull and Kunii Dbullbull Fifth Int Symp on Combustion Reinhold (ed)
New Yor k 231 (1955)
133
APPENDIX A
1 Gas chromato~raph data
11 Gas samples
The settin~s used on the Gow-Mac 750p ~as chromato~raph tor all teed and
tail ~as analyses are 1 isted below
Chromatograph Go Mac 750p
Detector Flame ionisation
Attenuat ion 1
Range 10- t 0 ampsmV
Data system Varian 4270
Column length 55 m
Column diameter 4 mm
Column pressure 28 psi at 50C
Pack ing n-OctanePoracil C
N2 tlowrate 41 mlmin
H2 fl owrate 31 mlmin
Air flowrate 300 mlmin
Injector temp 150C
Detector temp 250C
Temp pro~ 10 min at 50C 10Clmln b 120C
5 min at 120C
Sample volume 10~1
111 Cal ibration
It IS well establlshed in the 1 iterature that the area percents of
components are not directly proportIonal to the mass percent ie
different components have different detector responses It IS therefore
necessary to determine correction factors Once determined these
correction factors can be ~sed to calculate the composition on a mass
basis Two gas standards were avaIlable the compOSition of which ere
shown in Table A-l
134
Tab1e A-l Gas standards composition
Stan dar d Species Mole ~ Mass
1 Methane
Ethane
Propane
Butane
228
292
298
182
101
243
363
293
2 Propane
Propene
520
480
532
46S
Each standard was injected M times (M L 3) into the GC and the area
Counts and retention times recorded The results were then normal ized to
el iminate any discrepancies while injectin9J usin9 the eQuations shown
below These eQuations were adopted from McNair and Bonell i (1969) To
normal ize area counts use
For i = 1 to M
where
M is the number of samp1es
N is the number of components
ACI J is the area count of component in sample as recorded by
theGC bullbull and
APi is the mean area percent or component i
and to normal ize retention times use
RIi = J1 (~IijACiJ For i = 1 to MI
t ~1 J ~1 AC i I
Ilhere
Ri ij IS the retention time of comoonent i In samp1e j and
RIi is the mean retention time of Component 1
135
Once the mean area percent of each component had been establ ished the
rat io (AR) of the area percent (APt) to mass percent (MPt) was
calculated using
The response factors (RF i ) are calculated using
These factors are relative to propane ie the response factor for
propane was arbitrarily set equal to unity A detailed sample
calculation using the above procedure is ~iven in Table A-2
Table A-2 Area percent and retention tIme normalisation
Standard 1
Spec i es Methane Ethane Propane Butane
(N=4) ( i =1) ( i=2) ( i =3) ( i =4)
AC i j t 94792 241206 346861 371930
RT i j t 35 43 62 111
AC i j 2 82857 213323 308409 332568
RT i j 2 35 43 62 111
ACijJ 86832 215668 314257 322218
RT i j bull J 35 43 61 111
APi 90 229 331 350
RTi 35 43 61 111
MPi 101 243 363 293
AR 089 094 Dl 12
RFi 102 097 100 076
136
Table A-2 Area percent and retention time normalisation (continued)
Standard 2
Species Propane Propene
(N=2) ( i =2)
ACij-t 521001 593387
RT i j bull t 61 74
AC i j 2 55278 64241
RT i j 2 62 74
AC i J J 45750 56275
RT i j J 61 74
APi 466 534
RTi 61 74
MPi 532 468
ARi 088 114
RFi 1000 077
Under the same detector conditions these factors can be used time and
time a9ain to calculate the mass percent of the components in the
standards relative to propane
To calculate the composItion on a mass basis of an unknown mixture the
equation used is
MPi
A sample calculation usin9 the above equation and the GG output from
an independent injection of Standard 1 is shown In Table A-3
137
Table A-3 Error determination
Species MPI MPcalc Error
Methane 109318 102 101 103 16
Ethane 273475 097 243 243 03
Propane 394953 100 363 364 01
Butane 414146 076 293 290 09
~ (E 2 ) = 34
A typical spectrum obtained (f~ed gas) is summarised in Table A-4 and
shown in Figure A-i Traces of species found in the feed but for which
no standards were available were assigned response factors of vnity As
the total contribution of these on an area basis was less than one
percent the error introduced should be negl i~lbly small
Table A-4 Feed composition
Species Retention time Response factor Mass r
Methane 35 102 00
Ethane 43 097 092
Propane 61 100 198
Propene 74 077 780
Iso-Butane 110 100 019
N-Butane 11 1 076 023
i-Butene 136 100 043
Iso-Butene 147 1 00 004
T2-Butene 153 100 009
C2-Butene 159 1 00 005
C5 + 193 100 017
138
I m ~ t gt z m
ImiddotIi Ii I
il I
I
I I i
l~~0 0 Z z -ln n 0 0 Vgt I I VgtNN deg OgtJJ COOIIdeg 0 0 ICC 1ClliX) gt m Cll -l -lCllCC Z Z Cgt mC-l-l m m -l Z Z-lmm
gt m m m Z Z z zmm m m
Fi~ A-I GC SPECTRA OF FEED
139
12 Liquid samples
The settin9s I isted below were used for all I iQuid samples
Chromatograph Varian 3400
Auto sampler Varian 8000
Data system Varian CDS 401
Detector Flame ionisation
Attenuat ion 1
Range 10- Of ampsmV
Column length 3 m
Column diameter 4 mm
Column press 18 psi at 40 C
Packing 31 Sil iconOV-10l on Chromosorb W-HP
100120 mesh
Nz flowrate 30 mlmin
Hz flowrate 30 mllmin
Air flowrate 300 mlmin
Injector temp 250C
Detector temp 300C
Temp Pro9 5 min at aoc lOCmin to l80C
30Cmin to 300C 5 min at 300C
Sample volume 1 ~I
121 Calibration using mass spectroscopy
Due to the complex nature of the I iQuid products the analysiS of the
I iQuid spectra was difficult To facil itate product analysis it ~as
decided that the liquid product analYSis be based on carbon number
groupings rather than on indiVidual components A direct comparison
between the spectra obtained by the GC and MS was not possible due
to hardware and software differences The trends in the spectrum
obtained were however the same and in this way carbon number~ could b~
allocated to the GC spectrum
A typical spectrum of the GC-MS is shown in Fi9ure A-2 The
molecular wei9hts of the components ~esponsible For the peaks as
determined by mass spectroscmiddotpy are shown In this FIJre As a
comparison a sas chromatogram uSln3 the Varian 3400 IS shown In
140
r------------y-~
+ cO -shy
U
LJ -shy
u Ishy
= c - 0
t-Clt 0 a~
t Cl-=gt ct- l shy J
C-~ IL ~ 0 r (t
ot- l shy
f u w Q ~ (j)
co t~ (j)r-J
Gl u [- u
t~ ~
J lt u shyCI gtshyl-
N I
W lt
(JshyU
U ~
IL
M U
Hlpoundl
---------
---- ---
141
~Lgt-------- --- -------_____
_____~L
ltlt
I
C1 U
---~~------- --~-----~------~~--
u___---s-----======~--=-----~~a
1 -------------- ----------shy
142
F i 3ure A-3 Us i ns the data from the M S carbon numbers cou 1 d be
assisned to the peaks on the sas chromatosram and so the start and end
times of the various sroups established The groupings used are shown in
Table A-5 as is a typical 1 iquid compositIon
Table A-5 Typical liquid composition and retention time windows
Group Mass r Retention times
start stop
Monomer 495 000 102
oimer 610 102 470
Trimer 243 470 112
Tetramer 813 112 157
Pentamer 162 157 185
Hexamer 000 185 205
Heptamer 000 205 280
The response factors of these groups were taken as unity which was
justified in VIew of work done by Dietz (1967) on the relative
sensitivity of hydrOCarbons The results reoorted in mass oercent are
therefore a reasonable representation of the actual composition
0 200 0
100 VAPeUR PHASE
Jgt
600+ m z 0 x
w 500+
fLUID PHASE
L 400I-a III
1I QU I D PHASE W 0 300 =gt III
(f) III(f)
t WW
00
-600 --300 -100 100 300 600 700 900 1100
TEMPERRTURE C
FIG B-1 DEW pe I NT TEMPERATURE ( C) AND BUBBLE pe I NT TEMPERATURE (C) VS PRESSURE (ATM)
20 MelEi PRePANE AND 80 MelEi PRePENE ~
I J
The copyright of this thesis vests in the author No quotation from it or information derived from it is to be published without full acknowledgement of the source The thesis is to be used for private study or non-commercial research purposes only
Published by the University of Cape Town (UCT) in terms of the non-exclusive license granted to UCT by the author
Univers
ity of
Cap
e Tow
n
II
SYNOPSIS
A synthesis techniQue was developed for the preparation of a nickel
oxide sil ica alumina catalyst The propene oligomerisation activity and
the selectivity of the catalysts prepared by homogeneous decomposition
deposition (HDD) were investigated and compared with nickel oxide silica
alumina catalysts prepared by the techniQues of impregnation (IMP) and
co-precipitation (SG) Amongst others the effect of the nickel content
reacti6n temperature and pressure and water content of the feed on the
activity and selectivity were investigated Also investigated were the
lifetime of the various catalysts and in the case of HDD type
catalysts the ability to 01 igomerise high molecular weight hydrocarbons
(Cb)
Nickel oxide silica alumina prepared by the HDD method is more active
for the propene 01 igomerisation than catalysts prepared by the IMP and
SG methods The product spectrum in the case of IMP and HDD type
catalysts are similar with a propene dimer (Cb) being the main product
In the case of SG type catalysts however a shift to heavier products
was observed ie propene dimer (Cb) and trimer (Cq) were formed in
eQual Quantities It is proposed that the increase in activity of HDD
type catalysts was due to a large extent of metal dispersion and
distribution and a stronger interaction between the metal and the
support It is also proposed that the metal is readily accessible to the
reactant molecules
The activity and selectivity of catalysts prepared by the HDD method
were independent of the nickel content This was not the case for IMP
and SG type catalysts both of which showed decreasing activity with
increasing nickel content when the nicke1 content was increased beyond 5
wtX
The lifetimes of the various catalysts were also examined From the
results obtained over the first 10 h the lifetime of HOD type
catalysts was superior to that of the other catalysts studied The
activity and selectivity of the various catalysts were sensitive to the
reaction conditions Thus moving into the vapour phase by either
increasing the temperature at a fixed pressure or decreasing the
pressure at a fixed temperature was in each case acCompanied by a shift
to heavier products and a decrease in activity
I
THE OLIGOMERISATION OF PROPENE OVER
NICKEL OXIDE SILICA ALUMINA
BY
STEFAN MATHIAS HARMS
BSc (Eng) (Cape Town)
Submitted to the University of Gape Town in
fulfilment of the requirements For the de3ree
Master of SCIence in Engneerlng
( 1987)
II
SYNOPSIS
A synthesis technique was developed tor the preparation Ot a nickel
oxide silica alumina catalyst The propene oligomerisation activity and
the selectivity Ot the catalysts prepared by homogeneous decomposition
deposition (HOD) were investigated and compared with nickel oxide sil ica
alumina catalysts prepared by the techniques ot impregnation (IMP) and
co-precipitation (SG) Amongst others the ettect Ot the nickel content
reaction temperature and pressure and water content ot the teed on the
activity and selectivity were investigated Also investigated were the
1 ifetime Ot the various catalysts and in the case ot HOD type
catalysts the ability to 01 igomerise high molecular weight hydrocarbons
(Cb ) bull
Nickel oxide silica alumina prepared by the HOD method is more active
for the propene 01 igomerisation than catalysts prepared by the IMP and
SG methods The product spectrum in the case ot IMP and HOD type
catalysts are similar with a propene dimer (C~) being the main product
In the case Ot SG type catalysts however a shift to heavier products
was observed i e propene dimer (C6) and trimer (C~) were formed in
equal Quantities It 19 proposed that the increase in activity Ot HOD
type catalysts was due to a large extent of metal dispersion and
distribution and a stronger interaction between the metal and the
support It is also proposed that the metal is readily accessible to the
reactant molecules
The activity and selectivity of catalysts prepared by the HOD method
were independent of the nickel content This was not the case tor IMP
and SG type catalysts both of which showed decreasing activity with
increasing nickel content when the nickel content was increased beyond 5
wt
The 1itetimes ot the various ctalysts were also examined From the
results obtained over the first 10 h the 1 itetime egtf HOD tlpe
catalysts was superior to that ot the other catalysts studied The
activity and selectvity of the varIous catalysts were senSlt ive to the
reaction Conditions Thus moving into the vapour phase by either
increasln9 the temperature at a fi_ed press~re 0r decreasing the
pressure at a fixed temperature was In each case accompanied by a shif~
to heavier products and a decrease in actvity
III
The catalysts studied were very sensitive to the feed moisture content
The introduction of an undried feed resulted in a hi9h initial activity
followed by rapid deactivation IMP and HOD type catalysts after bein9
exposed to a wet feed were shown to be able to resain their normal
activity and selectivity after calcination
IV
AC KNOWLEDGEtlErHS
I would 1 Ike to express my sincere appreciatIon to Dr H KOJima and
Prof CT OConnor for their assistance and gUidance throughout the
duration of my study
Many thanks to Messrs D McClean L Jacobs) PM DIckens K Moller and
SSchwarz) for their friendshiP and helpful advice over the years
The following people and institullons are also gratefully acknowledged
SASOL and the Council for SIfrtific arid Industrial Research for
financial assistance
All on the ChemIcal Engineering Department stafF
Dr K Herzog for his assistance with the TG-OTA anAlysis
Miss 8 Williams for lhe mass spe(trosCopiC analmiddotSIS
Dr M Rautenbach for the use of his compuier pro9ramn
A speCial thanks to Alexandra For her help and patience
I would also like tegt thank my frmiddotgtther In3-br3 tor het cord Inou
support and patience
TABLE OF CONTENT
PAGE
SYNOPSIS II
ACKNOIIILEDGEMENTS IV
TABLE OF CONTENTS v
LI ST OF FIGURES x
LIST OF TABLES XVI
1 INTRODUCTION
11 Heterogeneous catalysis 2
12 Polymerisation using heterogeneous catalysts 3
121 Kinetics of the overall process 3
122 Polymerisation 6
1221 True polymerisation 6
1222 Conjunct polymerisation 9
123 Polymerisation on si 1 ica alumina 10
1231 Nature of active sites on sil ica alumina 10
1232 Structure of the products and proposed mechanism
on sll ica alumina 10
124 Polymer1sation on nickel OXide sll ica alumIna 12
1241 Nature of active sItes on nickel OXide sil ica alumina 12
1242 Structure of the products on nickel oxide 511 iea
alumina 13
1 25 Thermodnamics 15
13 Catalyst characterisation
131 Introduction 13
132 Catalyst syntheSIS methods 19
1321 Preparation with adsorption 19
VI
1322
1323
1324
133
1331
1332
1 34
14
1 41
1411
1412
1413
142
1421
1422
1423
1424
15
1 51
1511
1512
1513
1514
1515
152
1521
1522
1523
1524
1525
1526
1527
1528
152Q
16
17
Dryin9 of adsorbent sol ids
Preparation without adsorption
Dryin9 of non-adsorbed sol ids
Hom0geneous decomposition deposition
Theory of hom0geneous decomposition deposition
Nickel oxide silica alumina preparation usin9 a
hom0geneous solution
Co-precipitation
Physical characterisatlcs of the catalyst
Properties of sil ica alumina
Sur face area
Pore structure
Surface aCidity
Properties of nickel oxide on si1 ica alumina
Total surface area
Metal surface area and crystal size
Pore volume and size distribution
Metal support interaction
Catalyst po1ymerisation properties
Si1 ica alumina properties
Effect of Silica to alumina ratio
Effect of reaction temperature
Effect of space velocity
Product spectrum
Effect of activation
Nickel oxide si1 iea alumina properties
Effect of synthesis procedure
Effect of metal content
Effect of reaction temperature anJ pressure
Effect of feed compOSition and space velOCity
Effect of feed impurities
Effect of activation procedure
Effect of regeneration
Product spectrum
Lifeiime
ConclUSIon
Objective 0f research
PAGE
21
21
22
23
23
24
25
26
26
26
26
28
28
28
29
30
31
32
32
32
33
33
33
34
34
34
35
35
35
36
37 7-
37
38
VI
2 DESIGN OF ISOTHERMAL REACTOR
21 Fluidisation theory
22 Heat transfer
Fluidising medium23
231 Sand data
24 Optimisation of the fluidised bed
241 Air flow optimisation
242 Temperature correction
3 EXPERIMENTAL METHODS
31 The reactor system
311 Layout
32 Reactor
321 Fluidised bed
322 Integra1 reactor
33 Operation
331 Loading
332 Calcination procedure
333 Start-up
334 Steady state operation
335 Shut-down
34 Data analysIs
341 Computation of results
35 Analytical procedure
351 Gas analysis
352 UqU i d analysis
353 Nuclear masnetic resonance
354 TGDTA
355 Water content determination
356 o i st ill at ion
PAGE
42
42
43
44
45
45
49
51
53
53
53
56
56
58
60
60
61
62
62
63
63
63
65
65
65
tS6
68
69
69
VIII
36 Catalyst synthesis
361 Support preparation
362 Impre9nation
3621 Nickel concentration
363 Hom0geneous decomposition depositlon
3631 Nickel concentration
364 Coprecipitation
365 Determination of nickel content
366 Extrudate manufacture
4 RESULTS
41 Reproducibility of data
42 Effect of nickel content
43 Effect of pressure
44 Bed temperature profile
441 Effect of temperature
45 Lifetime and selectivity
46 Effect of WHSV
47 Effect of temperature runaway
48 Effect of water contaminatlon
49 liquid feed (Cit )
410 liquid and gas feed (Cl + Cit)
411 TGDTA
412 NMR
PAGE
71
71
71
71
71
72
73
74
74
7S
75
78
7S
82
86
90
95
95
95
98
98
101
5 DISCUSSION
105
112
129
133
IX
PAGE
6 REFERENCES
7 APPENDICES
7A APPENDIX A 133
1 Gas chromatograph data 133
11 Gas samples 133
111 Calibration 133
12 li QU i d samp 1es 139
1 21 Cal ibration using mass spectroscopy 139
7B APPENDIX B 143
1 Phase diaghram 143
x
LIST OF FIGURES
PAGE
CHAPTER 1
Figure 11 Activity of sil ica alumina catalyst for various
reactions as a function of sil ica to alumina ratio 2
Figure 12 Ranges of conversion for polymerisation of propene
on metal oxide sil ica alumina catalysts 4 wt~
Fi3ure 1 7 Conditions of a pore adsorbin3 activating material
Intersectin3 pores of different sizes before
dryin3 (A) and after evaporation of some of the
metal oxide impregnated on support 4
Figure 13 Free energy chan3e during dimerisation 16
Figure 14 Free energy change during dimerisation 17
Figure 15 Conversion obtainable in dimerisation reactions 17
Fi3ure 16 Polymerisation of propene 18
in solution 20
pore volume 1 iQuid (B) 22
Fi3ure 19 Phase diagram 25
Fi3ure 110 Si1 ica alumina surface area (m 2 g) vs alumina
content (mass~O 27
Fi3ure 111 Propene conversion (mass~) vs pressure (atm) 36
CHAPTER 2
Pressure drop over fixed and fluidised beds
Fi3ure 22 Convection coeffecient (Wm 2 K) vs partical
size (pm) 25 Q C
43
46
XI
Figure 23
Figure 24
Figure 25
Figure 26
Figure 27
Figure 28
CHAPTER 3
Figure 31
Figure 32
Figure 33
Figure 34
Figure 35
Figure 36
Figure 37
CHAPTER 4
PAGE
Convection coeffecient (Wm 2 K) vs partical
size (lim) 190degC 46
Reactor modifications to measure pressure drop 47
Pressure drop vs supperficial velocity aCross
disk and bed 49
Pressure drop vs supperficial velocity Integral
reactor absent 50
Pressure drop vs supperfictal velocity Integral
reactor present 51
Bed temperature (OC) vs rotameter tube reading (TR) 52
Vb=12 lmin
Reactor system 54
Integral reactor and fluidised sand bed 57
Integral reactor 59
Reactor bed 61
Batch distillation unit 70
Nickel content (massYo) vs mass of nickel nitrate
hexahydrate (g) 72
Nickel content (mass~O vs time (min) 73
Liquid production rate (Shgl vs time (h) 77
XII
FiSure 42
FiSure 43
Fisure 44
Fisure 45
FiSure 46
Figure 47
Fisure 48
FiSure 49
Figure 410
Figure 411
Figure 412
Figure 413
Figure 414
Fi3ure 415
PAGE
Liquid composition (mass)) vs time ( h ) 77
EHec t of nickel content
product ion rate (9hS)
(mass))
HOD
on 1 iQuid
79
EHect of nickel content
composition (mass) HOD
(mass~) on 1 iQuid
79
Effect of nickel content
production rate (ghg)
(mass~)
IMP
on liquid
80
EHect of nickel content
composition (mass~) IMP
(mass~O on 1 iQuid
80
Effect of pressure
rate (ghg) HO~
Effect of pressure
(mass) HOD
Effect of pressure
rate (ghg) IMP
Effect of pressure
(mass) IMP
Effect of pressure
rate (Shg) SG
Liquid composition
at 40 atm SG
(atm) on
(atm) on
(atm) on
(atm) on
(atm) on
(mass~)
1 iquid production
81
1 iQuid composition
81
1 iQuid production
83
1 iQuid composition
83
liquid production
84
vs time (h) 84
Bed
set
temperature profile ( deg C )
point 80degC SG-1
vs position ( Z ) I
85
Bed
set
temperature +PO n _ 80degC
fluctuations
S(7-1
( lt) C ) vs time (h) I
85
Bed
set
temperature profi le
point 210degC HDD-9
( 0 C ) vs POSition (Z)
87
XIII
PAGE
Figure 416 Bed
set
temperature fluctuations
point 210degC HOO-9
(OC) vs time (hl
87
Figure 417 Effect of temperature (OCl on 1 iQuid production
rate (ghg) HOD
Figure 418 Effect of temperature
(mass~) HOD
(OC) on
Figure 419 Effect of temperature
rate (ghg) SA
(OC) on
Figure 420 Effect of temperature
(mass~) SA
(OC) on
Figure 421 Liquid production rate
space velocity (ghg)
(ghg)
vs time
Figure 422 Liquid composition (mass) vs
Figure 423 Liquid production rate
space velocity (ghg)
(ghg)
vs time
Figure 424 Liquid composition (mass) vs
Figure 425 Liquid production rate
space velocity (ghg)
(ghg)
vs time
Figure 426 Liquid composition (mass) vs
Figure 427 Liquid production rate
space velocity (ghgl
(ghg)
vs time
Figure 428 Liquid c~mpositlon (massl) vs
Figure 429 Effect of weight hourly space
88
liquid composition
S8
liquid production
89
liquid composition
89
and weight hourly
(h) for HDD-3 91
time (hl for HDD-3 91
and weight hourly
(hl for IMP-2 92
time (h) for IMP-2 92
and weight hourly
(h) for SG-1 93
time (h) for 3G-1 93
and weight hourly
(h) for SA-3 94
time (hI for SA-3 94
velocity (ghg)
on 1 iQUld production rate IShg HOD 96
Figure 430 Effect of weight hourly space velocity (ghg)
on 1 iQuid composition (ma9s~) HOD 96
XIV
PAGE
Fi~ure 431 Effect of temperature runaway
rate (~h~) HDO-6 and HDO-7
usin~ same catalyst
on 1 iQuid production
consecutive runs
97
Fi~ure 432 Effect of temperature
composition (mass~)
(OC) runaway on liQuid
97
Fi~ure 433 Effect of water on 1 iQuid production rate
(~h~) HDO-5 re~eneration after HOD-4 99
Fi~ure 434 Effect of water contamination
composition (~h~) HO~
on 1 iQuid
99
Fi~ure 435 LiQuid production rate (~hg) and
(mass~) vs time (h) 1 iQuid laquo69degC
feed HOD-IS
conversion
fraction)
100
Figure 436 LiQuid composition (massYo) vs
laquo69degC fraction) feed HDD-1S
time (h) 1 iQuid
100
Fi~ure 437 LiQuid production rate (~hg) and conversion
(mass~) for propene vs time (h) liQuid
laquo69degC fraction) and gas feed HDD-19 102
Figure 438 LiQuid composition (mass~) of entire 1 iQuid
effluent vs time (h) liQuid laquo69degC fraction)
gas feed HDD-19
and
102
Fi~ure 439 LiQuid production rate (ghg) and conversion
(mass~) for propene vs time (h) liquid laquo69degC
fraction) and gas feed HDD-20 103
Figure 440 Liquid composition (mass)
sample vs time (h) 1 iquid
gas feed HDD-20
of entire 1 iQuid
laquo69degC fraction) and
103
~i9ure 441 Mass loss
for fresh
(X) and temperature ~iffe~ences (O()
catalyst 20 mg sample 104
104
xv
PAGE
Fi~ure 442 Mass loss (~) and temperature difference (OC) for
a calcined catalyst which has been exposed to air
19 m~ sample
Fi~ure 443 Mass loss (~) and temperature difference (OC) for
a used catalyst HDD-13 185 mg sample 106
Figure 444 Mass loss (X) and temperature difference (OC) for
Figure 445 Mass loss (X) and temperature difference (OC) for
Figure 446 Mass loss (~) and temperature difference (OC) for
a used catalyst IMP-1 18 mg sample 106
a used catalyst HDD-l17 m9 sample 107
a used catalyst SG-3 17 m9 sample 107
Figure 447 NMR spectra of 1 iquid product from run IMP-l 108
Fi~ure 448 NMR spectra of liquid product from run SG-3 109
Figure 449 NMR spectra of liquid product from run HDD-l 110
CHAPTER 7
7A APPENDIX A
Figure A-I GC spectra of feed 138
Figure A-2 Typical GC- MS spectra of 1 iquid product 140
Figure A-3 Typical GC spectra of liquid product 141
APPENDIX B
Figure B-1 Dew point temperatYre (OCI and bubble point
temperature (OC) vs pressure (atm) 20 mole~
propane and 80 mole~ propene 143
XVI
LIST OF TABLES
PAGE
CHAPTER 1
Table 11 Analogy in the mechanism of the catalytic action
homogeneous and heterogeneous system for the
dimerisation of olefins
of
14
Table 12 Characterisation of supported metal catalysts 26
Table 13 Pore volume and
and adsorbents
size distribution of fresh catalyst
27
Table 14 ACid
heat
content
treated
(total and
at 550degC
Bronsted) for silica alumina
28
Table 15 Surface area of nickel oxide sil ica alumina prepared
by Impregnation and coprecipitation as a function of
nickel content The si1 ica to alumina weight ratio was
91 29
Table 16 Surface area of nickel oxide si1 ica alumina as a
function of the alumina content Nickel content held
constant at 61 wtr 30
Table 17 Surface area of nickel oxide si1 ica
function of nickel content Alumina
at 43 wtr
alumina
content
as a
was held
30
Table 18 Nickel metal area from H2 chemisorption at 250degC
and 100 mmHg vapour pressure and from X-ray
diffraction 1 ine-broadening 31
Table 19 Pore volume and radius of a nickel aiumina ratalyst
with varYing alumina content Nickel content held at
4 wtx 31
Table 110 Pore volume and radius of a nickel oxide si1 ica
alumina catalyst with varYlng nlckel content
Alumina content held at 43 wtX throu9hout 32
XVII
PAGE
Table 111 Propene 01i90merisation on silica alumina at a
constant pressure of 50 atm and varyin9 temperature
Sil ica to alumina ratio used was 94 to 3 throu9hout 33
Table 112 Product distribution of propene 01 i90merised over
sil ica alumina as a function of temperature
Reaction pressure is 50 atm 34
Table 113 Relationship between product distribution and
reaction conditions 39
Table 114 Propene conversion and product spectrum as a
function of space velocity silica ta alumina ratio
is 9 to 1 throu9hout 40
CHAPTER 2
Table 21 Sand size fractions 48
CHAPTER 3
Table 31 Feed composition 65
Table 32 Carbon number groupings used for 1 iQuid analysis 66
Table 33 Structure definitions of terms and NMR spectral
positions and area code 67
CHAPTER 4
Table 41 Reaction data 76
Table 42 Integrated areas 111
Table 43 Carbon areas and branching 111
XVIII
PAGE
CHAPTER 7
7A APPENDIX A
Table A-1
Table A-2
Table A-2
Table A-3
Table A-4
Table A-5
Gas standards composition
Area percentage and retention
Area percentage and retention
(continued)
Error determination
Feed composition
Typical 1 iQuid composition and
windows
134
time normal isation 135
time normal isation
136
137
137
retention time
142
1
1 INTRODUCTION
In South Africa the oil from coal industry has developed the first
commercial process whereby sYnthetic fuels are produced from coal via
gasification usin9 Fisher Tropsch catalysts It started In 1943 when the
AmerIcan rights to the Fischer Tropseh process were purchased by South
A f ric a I n 191 0 the Sou t h Af I i can 0 i 1 C0 a 1 and Gas C() r p 0 r a ti (gt n (S A S 0 Ll
was formed The first plant Sasol I with a capaCity of 4130 barrelsday
went into opel-atlon in 1954 (OUtkUW1CZ 1981ll It used two type of
reactors namelv the Arge fixed bed and synthol fluidlsed bed reactors
Two further plants Sasol II and Sasol III which are Improved and
enlarged versions of Sasol I wert later built eAch having i3 CClfacit (f
35900 barrelsday (Dutkuwicz) 1980) In both of these planl~ onl~ the
synthol reactors are used Due to th~ nature of ihe process Sasol
pr oduces 1ar3e Quant It i es of 1 i ght hvdr ocar bon gilSfS anoun t i n3 to
approximatelv 15-106 mZday These are partly r~tlculated to local
i n d us try and par tl y Con v e r ted I 1 a a cat a 1 yt I C (middot1 i 30 rr euro r I s d ion p r (J C esst (gt
1 i 9h t f IJ e1sth euro r eby inc r e a s Jr13 the 0 I er I 1 r) r (l dII ~t Ion I n t e r mS 0 f
barrels of I iquld fuel produced per ton of coal procESSE-d Currentll
Sasol I can more than satisfv he loal dernnd dnj therefol~ the light
hydrocarbons from Sasol II and Sas()l III represent elaquo~s Buppl
The catalvtic oli90merisation process referred to abrve ISPS the
conventional phosphoric Reid catalyst to oli30fllPrisE lhe light
hydrocarbons to 1 iquid fuels This process howltver ~Ir(gtdIJCeS poor qlal ity
pet r 0 I and dies e I and the (a tal s tis C (I r r lt) s i v
The present study investigated an alternative catalyst For the catalytic
oligomerisation of li3ht hydrocarbons to 11qllid fllel Ilsin3 a nickel
oxide sil iea alumina catalyst synlhesls~d via methorl adopt0d by the
aulhor from (gtlork done bi van Dillen el 031 ()976) Al1l()lgh rlikel (Idne
SilIca alumina catalysts have Geen Ideli stldied (Tahahashi et a1
1969 Hogan et al 195 Holm 1917 [tt) the- ltgtrthe=~ fII~~H)d
developed in this work will produced a moreuro HC t i ve
catalyst With greater resistance to deactivation and greater selectivity
to linear C6 than those recorded f()r nickel oxide silica alJroina
catalysts produced viB the standard impregnation technIQue In this way
it is hoped to produce a beUer qual ity diesel than p~ssjble over the
standard irnprelnated nickel oxi de i I ica alumln1
2
11 Heterogeneous catalysis
As the silica alumina support in a nickel oxide silica alumina catalyst
is a catalytically active solid oxide insulator its catalytic properties
as well as those of nickel oxide on silica alumina have to be examined
In what ollows a brief review 0 the catalytic properties 0 both is
given
The oxides and halides of the lower elements of sroups III IV and V of
the periodiC table tend to cata1yse pOSitive ion or acid type
reactions such as polymerisation alkylation cracking and
isomerisation One of the most active solid oxide insulators is siliCa
alumina In Fi9ure 11 (Clark 1953) the rate of reaction is plotted
against the weight percent sil ica in a silica alumina catalysts for
various reactions viz bullbull hydrogen transfer propene polymerisation
ethene hydrogenation and hydrogen deuterium exchange It Can be seen
from this figure that the reaction velOCity constants of the acid type
reactions such as hydrosen transfer and propene polymerisation roughly
parallel the changes in catalyst acidity
~=H-D EXCHANGE AT 300degC K-10- t
~=ETHENE HYDROGENATION AT 500degC
+=HYDROGEN TRANSFER AT 340degC K-l0 DECALIN-l-BUTENE
X=PROPENE POLYMERISATION AT 200degC K-l0 J
60
50 u UJ ()
shy I- 40 z ~ lshy()
Z o 30 u
UJ Ishy~ 0
200 UJ 0 0 0
I- 10 ()
0 U
00
00
~=ACIDITY MILLI EQUIVALENTS PER GRAM middot10~
I
700 800 900 1000100 200 300 400 500 600
WEIGHT ~ SILICA
FIGURE 11 ACTIVITY OF SILICA ALUMINA CATAL1STS FOR VARIOUS
REACTIONS AS A FUNCTION OF SILICA TO ALUMINA RATIO
100
xUJ- ~ 060 -UJ ltII
Ishy 0UJ UJ Qltre ()
I () ()z ~ Ishy60 0 Q z UJI- 0 - ~ UJ ~ Z Q gtUJ ltI 0 gt 0 Ishy UJ40 0 UJ 0 ~ Igt- Z -I UJ - ltI UJ 0 xZ 0 UJ 0 II gtshy20 I- gtshyI IshyUJ
0-u ~
o
3
The reactions which occur readily on the transition metal oxides such
as hydrogen-deuterium exchange which gives a reasonably good indication
of hydrogenation-dehydrogenation activity and ethene hydrogenation
proceed slowly even on pure alumina and the rate decrease to
insignificant values with increasing si1 ica content Conversely
transition metals are poor catalysts for aCid-type reactions
Transition metal oxides alone or supported on weakly acid oxides such
as alumina show only a small activity for acid type reactions such as
the polymerisation of the low boiling point olefins When however
these oxides are supported on strong acid oxides such as silica alumina
they are capable of giving an increased activity as indicated in Figure
12 (Clark 1953) which shows data on the po1ymerisation of propene
The details oT the mechanism by which these metal oxides supported on
silica alumina give an activity greater than that over sil ica alumina
alone are not clear Using Tame1es method of butylamine titration
there are some indications oT an inCrease in acid content of the active
metal oxide promoted catalyst over that of silica alumina alone (Clark
1953) A detailed discussion of the mechanisms proposed and nature of
the active sites is given elsewhere
The following conclusions may therefore be drawn from
Figure 12 with respect to propene polymerisation
- the oxides of metals in group V and higher of the periodiC table
loaded on silica alumina alone give increased activity over silica
alumina
- the oxides of metals in group IV and lower of the periodiC table give
activity below that of sil ica alumina
- redUCing the metal oxides causes the activity oT the catalyst to drop
below that of silica alumina
12 Polymerisation using heterogeneous catalysts
121 Kinetics of the overall process
The overall kinetics of the process can be summarised by five steps It
must however be noted that at times some of these steps are not present
The steps are
Step 1 Diffusion of reactants through the Nernst diffusion
layer a 1 iquld film surrounding the catalyst
particle to the outer surface of the catalyst
4
Catalyst preheated Catalyst oreheated
in H at 500degCin air at 500degC
100100
9090
so80
7070
Oxides Ot V Cr Mo ~ Mn Fe Co Ni 6060
50so
ao40
SiOmiddotdAlzO 3030 1 [
Oxides ot V Cr Mr Fe Co Ni 2020 [ 10
Group I-IV
1 Oxides Ot Na Cu Ag M3 Zn Ba ICe Ti Z r bull
Pb Th
10
[ 00
Fig 12 Ranges Ot conversion tor polymerisation Ot oropene on metal
oxide silica alumina catalysts 4 ~t~ metal oxide impregnated on
support
5
Step 2 Penetration and diffusion of the reactants through
the blanket of graphitic carbon andor hydrocarbon
deposits to the internal surface and into the
unreacted core
Step 3 Reaction of the reactants at an active site
Step 4 Diffusion of the products through the unreacted core
and the blanket of graphitic carbon andor
hydrocarbon deposits back to the outer surface of
the solid
Step 5 Diffusion of the products through the fluid film
back into the main body of the fluid
The resistances of the different steps usually vary greatly from one
another The step with the highest resistance is considered to be the
rate controll ing step This rate controll ing step can often be
identified via simple tests (see Levenspiel 1972)
For optimum catalyst util isation a high matrix diffusivity is
desirable At any given condition if the rate of chemical reaction is
higher than the rate of diffusion reactants cannot be supplied fast
enough to the active site to establish an eQuil ibrium concentration The
reaction therefore oCcurs only in the outer shell of the catalyst
particles and a significant number of active sites inside the particle
are unused Large matrix diffusion resistance therefore results in
molecules reacting before they penetrate into the interior of the
catalyst particle The rate is then controlled by either film diffusion
or the rate of chemical reaction on the active surface whichever is the
slower step
The overall reaction rate is also influenced by the reaction
temperature The rate of diffusion however increases at a slower rate
than that of the chemical reaction and so at high temperatures pore
diffusion or film diffusion becomes the rate controll in9 step
Insufficient agitation and a hi9h viscosity of the solution can result
in large film thickness and hence favour a film diffusion controll in9
mechanism
6
122 Polymerisation
To date the most widely accepted mechanism for the polymerisation of
olefins is that proposed by Whitmore (1934) and involves the carbonium
ion One of the most pronounced characteristics of acid catalysed
reactions involving the carbonium ion is the lack of specificity
(Langlois 1953l Almost never is only a single product formed and even
under the mildest conditions a large number of compounds are formed
Schmerling and Ipatieff (1950) have distinguished two classes of
polymerisation true polymerisation in which the reaction prodycts are
mono-olefins with molecular weights intergral multiples of the monomer
molecular weight and Conjunct polymerisation in which the reaction
products are a complex mixture of olefinSt diolefins paraffins
naphthenes cyclo-olefins and aromatics Both will now be discyssed in
deb i 1
1221 True polymerisation
The carboniYm ion is formed in the presence of a hydrogen acid by the
addition of a proton to the electron pair of the double bond ie bull
H H H H H H C C C H2 + HX+ - gt H C C C H + X- ( I )
H H H
It is not proposed that a free alkyl carbonium ion exists in the
hydrocarbon solytion but that it remains within a short distance from
the anion of the catalysts and that the two exist in the form of an ion
pair (Langlois 1953) As the degree of separation of the carboniym ion
from the Bronsted site is of no importance in the explanation of the
reaction mechanism it is sufficient to postulate the existence of an
alkene with a positive charge on a particular carbon atom The term
carbonium ions will be ysed in subseQuent discussions and represented as
shown in eQyation (I) above without showing the anion although its
presence somewhere near the pOSitive charge IS to be ynderstood
(Langlois 1953)
The halide catalysts are aCidic only in so far as they are electron
acceptors Hunter and Yohe (1933) postulated that the active complex in
the absence of hydrogen halide oromoters is formed by the addition of
the catalysts to the olefin In this way the metal hal ide functions in a
manner similar to that of a proton and may be considered to be an aCidiC
catalyst (Schmeling and IpatieH 1950gt
7
Cl H H Cl H H
Cl Al + CC -) Cl Al CC+ (II ) ~ ~
Cl H H Cl H H
It has however been found that the halide catalyst requires a coshy
catalyst such as water tert-buty1 alcohol or acetic acid all of which
contain an active proton to be active for polymerisation Fontana and
Kidder (1948) found that the polymerisation of propene on a halide
catalyst was approximately proportional to the concentration of the
promotor used which was confirmed by Norrish and Russel (1952) who found
that in the polymerisation of isobutene with stannic chloride a Coshy
catalyst such as water was necessary that the rate of reaction was
proportional to the concentration of the co-catalyst and that the
maximum rate was achieved when water and stannic chloride were present
in eQuimo1ar proportions
It is thus probable that the reactions proceed throu~h an intermediate
from the reaction of the olefin metal hydride and promotor with the
latter servin~ as the source of the proton necessary for the production
of the carbonium ion viz bull
R-CH=CH2 + BF3 + H20 (-) R-CH-CH3 + BF30Hshy (II I) +
It appears that reaction (II) does not oCCur to any appreciable extent
or if it did that the resu1tin~ complex would not have any appreciable
activity for the initiation of po1ymerisation It is probable
therefore that in all cases the effective catalyst for the acid
cata1ysed po1ymerisation of olefins are acids In the more restricted
sense that they must be able to supply a proton to initiate the reaction
(Lan~lois 1953)
Of the olefins of low molecular weisht isobutene is polymerised the
most readily with acid catalysts N-butene and propene are polymerised
less readily while ethene is polymerised only with difficulty From
this and information drawn from the composition of the reaction
products ~hitmore (1934) reached the conclusion that a tertiary
carbonium ion is the most stable a secondary ion less stable and a
primary ion least stable Evans and Polanyi (1947) calculated proton
affinities of the doubly bonded carbons in isobutene propene and
ethene Their calculations showed the proton affinity of the primary
carbon of the double bond to be in the order isobutene gt propenegt
ethene and furthermore that the proton affinity of the primary carbon of
the double bond is sreater than that of a secondary or tertiary carbon
8
of the double bond for the cases of propene and isobutene These
calculations confirm the early empirical observations In accordance
with this concept we should expect the followins carbonium ions fro~
isobutene and propene
(probable)
and
(probable)
The possibil ity of the formation of minor quantities of the two less
favoured isomers cannot be excluded particularly at hish temperatures
but the species indicated should be the predominant ones Whitmore
(1934) postulated that a carbonium ion once formed may underso a
variety of reactions
Addition of a nesative ion X with the net result beins the addition of
HX to the double bond
R-CH-CHJ + X- (-) R-CH-CHJ + X
Addition to the double bond of an olefin to form a new carbonium ion
this is the polymerisation step
R-CH-CHJ + CH2=CH-R (-) R-CH(CHJ)-CH2-CH-R + +
Elimination of a proton to form the oriSinal olefin or a different one
R-CH(CHJJ-CH2-CH-CHJ +
R-CH(CHJ )-CH=CH-CHJ + H+
Migration of a proton with its bonding electrons from another carbon to
the atom deficient in electrons leaVing a new carbonium ion
9
CHJ-CH(CHJ)-CH-CHJ (-) CHJ-C(CHJ)-CH-CHJ + +
Mi~ration of a methyl ~roup with its two electrons to the positive
carbon atom generating a new carbonium ion with a new skeletal
arran~ement
CHJ-C(CHJ)2-CH(CHJ)-CH-CHJ (-) CH3-CCH3 )-CH(CHJ)-CH(CH3)-CH3+ +
Extraction of hydro~en from another molecule to form a saturated
molecule and a new carbonium ion
RH + R (-) R + RH + +
All the above reactions are indicated to be reversible but the
reactions may not oCcur at similar rates Usually one will be favoured
over the other
1222 Conjunct polymerisation
Conjunct polymerisation that is polymerisation accompanied by the
formation of saturated hydrocarbons oCCurs only under specific
conditions such as at high temperatures and over highly acidic
catalysts Evidence in support of a carbonium ion mechanism to explain
the formation of conjunct polymers was obtained by Bartlett et a1
(1944) The mechanism involves the removal from the oligomer of a
hydrogen atom with its bonding electrons by the carbonium ion The
mechanism may be illustrated as follows
R-CH2-CH2-CH=CH-R + H+ (-) R-CH2-CH2-CH-CH2-R +
R-CH2-CH2-CH-CH2-R + R-CH2-CH2-CH=CH-R lt-)+
R-CH2-CH2-CH2-CH2-R + R-CH2-CH-CH=CH-R +
R-CH2-CH-CH=CH-R (-) R-CH=CH-CH=CH-R +
For conjunct polvmerisation the si~nificant reaction steos are
- initiation by proton addition
- propa~ation by olefin addition
10
- chain termination by proton expulsion
- chain termination by proton transfer
- chain termination by addition of hydride ion
- depolymerisation to same or chain length other than that of the
or i gin a 1 olefin t
- isomerisation
- hydrogen exchange
- cyclysation equivalent to self-alkylation or self shy
polymerisation and
loss of hydride ion
123 Polymerisation on silica alumina
1231 Nature of active sites on si1 ica alumina
Si1 ica a1uminas differ widely in properties and have been the subject of
much research (Mizuno et a1 bullbull 1976 Finch and Clark 1969 Peri 1976)
The nature of the active sites in the polymeric olefin formation is
controversial because of the lack of conclusive evidence
Ozaki and Kimura (1964) speculated that the olefin chemisorbed on Lewis
acid sites as a monomer Hirschler (1970) concluded that Bronsted acid
sites were the active sites over sil ica alumina on the basis of the
similarity in composition of polymeriC species formed over sil ica
alumina and those formed over deammoniated Y-zeol ite On the contrary
Weeks et a1 (1974) concluded that the active sites were Lewis sites
formed upon dehydroxylation Ot Y-zeolite because no signitlcant
difference was found between products over deammoniated and
dehydroxylated zeolites Peri (1976) regarded an alpha site a pair
consisting of a Lewis site and an oxide ion to be active Holm et al
(1959) and Sato et a1 (1965) reported that propene po1ymerisation at an
elevated temperature varied in proportion to the Bronsted acid content
However objections have been raised to their determination Ot the
Bronsted acid content (Forni 1974) Mizuno et a1 (1976) on the other
hand showed that the catalytic activity tor the polymeric oletin
tormation declined sharply as the extent ot selective poisoning Ot the
Lewis acid sites increased
1232 Structure Ot the products and proposed mechanism on SIlica
alumina
Silica-alumina has a low activity tor the oligomerisation of propene at
low reaction temperatures the main product being propene trimers
11
The mixture of propene dimers formed on sil ica-alumina was characterised
by Feldblyum and Baranova (1971) and found to contain a relatively high
content of 4-methyl-2 and 4-methyl-1-pentene According to the carbonium
ion mechanism as postulated by Whitmore (1934) these are the primary
dimerisation products which isomerise into the thermodynamically more
stable methylpentenes
(CHJgt2-CH + CH2=CH-CHs (-) (CHS)2-CH-CH2-CH-CH3 + +
(CHl)2-CH-CH2-CH-CHl +
(CHl)2-CH-CH-CH2-CHl +
(CHl)2-C-CH2-CH2-CHl +
The 23-dimethylbutenes may form on sil ica alumina either as a result of
the skeletal isomerisation of the 2-methyl-3-pentyl cation as suggested
by Shephard et al (1962) or by the irregular (anti-Mrkovnikov) addition
of the isopropyl cation to propene as suggested by Fe 1 db 1yu m an d
Baranova (1971) The second route is more 1 ikely since skeletal
isomerisation of the isohexene cation should lead with even greater ease
to the production of 3-methyl pentenes which are however practically
absent from the mixture of propene dimers
Fe1dblyum and Baranova (1971) further sugsested that hexenes are formed
over sil ica alumina catalyst via the anomalous addition of a proton to
propene That the main reaction product on si 11ca alumina is a propene
trimer was explained by Feldb1yum and Baranova (1971) by suggesting
that the initially formed 4-methyl-2-pentyl cation rapidly isomerises to
the more stable tert-2-methyl-2-pentyl cation and the rate of the
reaction of the latter with propene is higher than the rate of
12
desorption of the dimer from the active center of the catalyst At the
same time the reaction of the 2-methyl-2 pentyl cation with propene
should lead to the formation of the propene trimer with a 44 dimethyl
heptane carbon skeleton This was found to be the case by Fe1db1yum and
Baranova (1971)
It can thus be seen that the silica alumina carrier leads to the
oligomerisation of propene by a carbonium ion mechanism as proposed by
Whitmore (1948) with the product being a propene trimer
124 Po1ymerisation on nickel oxide sil ica alumina
1241 Nature of active sites on nickel oxide sil ica alumina
Hogen et a1 (1955) established that hexenes and methyl pentenes were the
main products formed during the oligomerisation of propene under the
influence of nickel oxide on si1 ica alumina While explaining this
observation from the standpoint of the carbonium ion mechanism Hogan et
a1 (1955) at the same time admitted that the reaction mechanisms
differed substantially from that found in the usual acid catalysts It
was proposed by Ushida and Imai (1962) that two types of protonic acid
centers existed and they ascribed the observed product selectivity to
the isomerisation of the olefin over the protonic acid site attached to
the aluminium Imai et a1 (1968) however proposed that 3-methy1-1- and
3-methyl-2-pentenes were formed via a cyc10 butene intermediate At the
conditions used by Imai et a1 (1968) ie a temperature of 200 C
skeletal isomerisation of the primary oligomers was entirely possible
At lower reaction temperatures eg 64C as used by Feldblyum and
Baranova (1971) 3-methyl-pentenes were hardly formed The dimerisation
reactivity of ethene propene and 1-butene under the influence of nickel
oxide on si1 ica alumina was established by Ozaki et a1 (1968) to vary In
the ratio of 100101 Le in an order opposite to that which occurs
on typical acidic catalysts This was explained by them via the
existence of hydrogen atoms on the catalyst surface The hydrogen atoms
were capable of adding to the olefin to form free radicals which are
then involved in the dimerisation According to Ozaki et al (1968) the
role of the acidic carrier is unimportant Schultz et al (1966) examined
the dimerisation of propene in the presence of Cobalt oxide on a nonshy
acidic carrier activated charcoal A positive result was obtained with
cobalt oxide while nickel oxide on the same support was inactive
In view of the foregoing the nature of the products from the
01 igomerisation of propene under the influence of nickel oxide on silica
13
alumina is discussed in greater detail below to deepen our understanding
of the reaction mechanism and the active sites
1242 Structure of the products on nickel oxide si1 ica alumina
The deposition of nickel oxide on silica alumina changes the selectivity
of the catalyst the preferential product now being a propene dimer The
high content of hexenes in the resultant dimer is not due to the
occurrence of isomerisation or to the greater tendency of the methyl
pentenes as opposed to that of the hexenes to react turther but was
ascribed by Feldblyum and Baranova (1971) to be a characteristic
feature of nickel oxide on silica alumina catalysts) when used tor the
dimerisation of propene
There exists a close analogy in the mechanism as shown in Table 11
(Feldblyum et al bull 1974) between homogeneous catalysis based on nickel
salts and organoaluminium compounds and heterogeneous catalysts based
on nickel oxide on an aCid carrier The similarity in the mechanisms is
based on the proposal that during the dimerisation of the olefins on the
oxides of group VIII metals) a complex hydride is formed In the case of
nickel oxide the source of the active site is assumed to be an
unusually low degree of oxidation at a defect site in the nickel oxide
crystal lattice The dimerisation of propene catalysed by the complex
hydrides of the transition metal (HM) should lead to the formation of 4
methyl-1shy and 4-methyl-2-pentenes as the primary products with
subsequent isomerisation as shown below
CHJ-CH=CH2 + HM -) (CHJ )2-CH-(M)
l CHJ-CH2-CH2-(M)
(CHJ h -C=CH-CH2 -CHJ + HM
+ HM
14
Tab 1e 1 1 Anal09Y in the mechanism of the catalytic action of
homogeneous and heterogeneous system for the dimerisation of
olefins
Catalyst Homogeneous Heterogeneous
mechanism (N i Ch -R A 1 C 13 - ) (NiO-Si02-AhOl)
Structure of
active site
Path of the
format ion of
active site
Initiation
sta3e of the
reaction
Propa3stion
sta3e of the
reaction
Cata 1yst
re3eneration
step
Reasons for
termination
of reacti on
HNiClmiddotRA1Cll-
Reaction of NiCl
wit h R A1C13 - bull
12-Cis-addition
of HNiCl to the
olefin
Entry of a
Co-oord inated
olefin at the
nickel-carbon
lt1 bond
Cis-el imination
of an ole fin
from HN i C 1
Thermal decomshy
posH ion and
reduction of
HNiCl
HNi(Q)n-t on silica
Alumina
Reduction of Ni(O)n
and reaction of
Ni(O)n-t with the
olefin
1 2-C is-add it ion
of HNi (0)-1 to
the olefin
Entry of a
co-ordinated
olefin at the
nickel-carbon
lt1 bon d
Cis-el imination
of olefin to
form HNi (0)n-1
Reducti on of
HNHOln-t to
metal
15
The formation Of hexenes is explained by an alternative route in the cis
12 addition Of HM to propene
1
With the addition Of a third propene molecule at the nickel carbon sigma
bond trimers (C9) with a carbon skeleton Of 24 dimethyl heptane and 4shy
methyl-octane were expected to form This was Confirmed by Feldblyum
and Baranova (1971)
The absence Of olefins with a 44-dimethyl-heptane carbon skeleton in
the propene trimer formed under the influence Of nickel oxide on si~ica
alumina rules out the possibil ity of the reaction Of tert-hexy1
derivatives of the transition metal with propene and this results from
their instability This accounts for the dimerising action of the
catalyst
From the structure of the products formed and the analogy between
homogeneous catalyst based on nickel salts and organoaluminium
compounds and heterogeneous catalysts based on nickel oxide on si1 ica
alumina it must be supposed that complex hydrides of the transition
metal are responsible for the catalytic actions of nickel oxide silica
alumina in the oligomerisatlon of propene
125 ThermodynamiCs
Figure 13 shows the free energy changes which occur during the
dimerisation Of C2 to Co mono-olefins as a function of temperature The
free energy change for the dimerisation of ethene to 1-butene is much
lower than the dimerisation of the other 1 ight olefins (Ublad et alJ
1958)
16
The dimerisation of terminal bonded olefins eg bullbull propene to isomers
of corresponding higher olefins at a given temperature is much more
favourable than that for the dimerisation to the hi9her terminal olefin
-200
-150
-J- 10 0a U c -60
Lshy 00
(I
Ishy 50 -J W 0 100
150
200
2000 4000 6000 6000 10000
TEMPERRTURE K FIG 13 FREE ENERGY CHRNGE DURING DIMERISRTIBN
as shown in Figure 14 Hence the equil ibrium conversion of an alpha
olefin to a higher alpha-olefin will always be less than the
corresponding conversion of an alpha-olefin to an iso-olefin
Dimerisation of beta-olefins or iso-olefins to corresponding higher
olefins will be similar to the alpha-olefin-alpha-dimer relationship
Dimerisation of beta olefins or iso-olefins to higher alpha olefins will
however always be the least ravourable reaction (Ublad et al bull 1958)
Figure 15 shows the effect of pressure on the dimerisation eQuil ibrium
The relationship shown is that or the product of the equil ibrium
constant and reaction pressure in atmospheres to the percentage
Conversion for any dimerisation reaction
Figure 16 shows the rree energy change ror the formation of higher
olerins as a function or temperature ror the monomers propene and 1
butene respectively These rigures show that above 550C ror both
propene and 1-butene the reverse reaction ie bull cracking oCCurs
Clearly at higher temperatures the lower 01 igomers will predominate
whereas at low temperatures the higher polymers will predominate at
equilibrium (Oblad et a1 1958)
17
-200
-160
-J- 10 0 CI U ~ -60
LL 00
CI I- 60 -J W
100o
150
200
FIG
2000
14
4000 6000 6000 10000
TEMPERRTURE K FREE ENERGY CHRNGE DURING DIMERISRTIBN
shyi J
i I 100
It
s
V0
s
DUCltUTIH iquarlO
(01 n-(HMl ~91
0
bull
I
YIt 10 00
~ C OtNERS I n~~
FIG 15 CONVERSION OBTAINABLE IN OIMERISATION REACTIONS
18
-500
-400
-300 J aU-20 0
~ -100
LL 00
a 100 r shyJ 200W 0
300
400
500
2000 4000 6000 8000 10000
TEMPERRTURE K FIG 16 PBLYMERISRTIBN BF PRBPENE
13 Catalyst characterisation
131 Introduction
There are a number of advantages in depositing catalytically active
metals on a support such as alumina charcoal sil ica and silica
alumina The metal can be highly dispersed as small crysta1l ites
throughout the pore System of the support and as a result a large active
metal surface is produced relative to the weight of the metal used In a
pelleted granular or other physiCal form a supported metal catalyst
provides for flow of gases through the reactor and rapid diffusion of
reactants and reaction products through the porous catalist to and from
the active site (Boreskov 1976 Cervello et alJ 1976) The support Can
also improve dissipation of reaction heat retard the sintering of metal
crystallites with resultant loss of active surface and increase poison
resistance For these reasons supported metal catalysts are widely used
in chemical processing It must be recognised however that the support
may also have a catalytic role to perform and the resultant bifunctional
catalyst may have properties different from those of the support or the
metal alone
19
To achieve greater ynderstanding or the way in which good catalysts can
be prepared more inrormation is needed aboyt the errect or the synthesis
method and the stryctYre or the catalysts Both will now be discyssed in
detai 1
132 Catalyst synthesis methods
When a pOrOYB solid comes into contact with a liquid capillary rorces
or several hyndred atmospheres draw the 1 iQuid into the pores The
active component may then be adsorbed on the walls or the pore in which
case the method of preparation is described as adsorption rrom solution
or ion exchange Here the volyme or solytion ysed will be larger than
the pore volume of the sypport In other preparation methods where
adsorption is small the catalyst is prodyced by drying Oyt of the
support wetted with a solution of the active component and the term
impregnation is used (Maatman and Prater 1957) At a high degree or
loading greater than 5 ~ the above methods do not lead to unirorm
distribution viz unirorm location of the metal crystallites within
the support or uniform dispersion viz uniform size of the metal
crystallites throughout the support This can however be overcome by
starting from a mixture in which the constituents of the active
component and the support are mixed on an atomic scale U~der certain
conditions a precipitate will be formed with the active phase
atomically spread throughout the support This method of production is
termed co-precipitation and discussed in detai 1 by Holm et al lt1957gt
The factors affecting dispersion and distribution in the various
synthesis routes will now be discussed
1321 Preparation with adsorption
Catalysts are often made by immersing a porous support in a solution of
an active material Catalytic properties can be influenced by the amount
and distribution of this material on the internal surface of the support
which in turn depends on whether the active material (solute) or the
solvent adsorbs on the support and the fraction of pore volume
accessible to the solute In Figure 17 the Quantity of active material
found in different parts of a system consisting of an external solution
and a single pore which adsorbs activating material is shown for four
conditions Figure 17a shows the distribution of the active material in
the system when the solution reaches the end of the pore The
assumption is made that the rate of penetration and rate of diffusion of
the solute into the pore are slow compared to the rate of adsorption
All act i ve materia 1 in the penetrati ng 1 i qu i d thus adsorbs on the lola 11
20
c I o e
q
External No external Poresolution Pore solution
A Immediateh after fi 11 in B After it was filled and allowed to eltluilibrate
Dec 1 eted externalExterna 1
Pore solution Poresolution
C After equilibration in the 0 After external solution presence of an excess of depleted of solute but external solution before eQ-Jilibration
Fig 17 Conditions of a pore adsorbing actIvatIng material in solution
21
of the first part of the pore The 1 iauid which passes further into the
pore contains no active material If at this time the solvent is removed
from the pore by dryin9 the active material is found only in the part
of the pore nearest to the external solution If instead of dryin9 the
catalyst at this time the pore is simply removed from the external
solution but left filled with 1 iQuid another phenomenon may be observed
If the active material can desorb at a reasonable rate redistribution
oCcurs by desorption and mi9ration by diffusion This ultimately results
in a uniform distribution of active material within the pore as shown in
Fi9ure 17b This process can be used in catalyst preparation if the
rate of desorption is rapid enou9h If the pore is however left in
contact with the external solution additional active material is
supplied by the external solution by diffusion to the adsorption sites
until either equilibrium with the external solution is reached brin9in9
about a uniform distribution as shown in Figure 17c or the external
solution is depleted of active material before the distribution is
uniform as shown in Figure 17d (Maatman and Prater 1957)
It can thus be seen that the amount of active material found in a porous
support can be much larger than that contained in the original pore
volume of liquid penetratin9 the support If on the other hand the pores
are accessible to the solvent but are too small for the solute to enter
or if the solvent is adsorbed in preference to the solute the Quantity
of active material may be extremely low
1322 Drying of adsorbent solids
In the case of an adsorbent solid the dryin9 process is not expected to
alter the distribution of the active material since it is adsorbed to
the sol id However if the adsorptive properties of the material were to
alter during heating and prior to evaporation of the solvent as by
thermal decomposition to a soluble species which does not adsorb on the
support the distribution of the solute would be markedly altered This
condition is discussed below
1323 Preparation without adsorption
In this case a porous support is submerged in a solution containing the
active material and the metal salt is drawn Into the pores by capillary
forces The solvent is then evaporated and the salt decomposed by
calcination or reduction The metal content can be calCulated from the
Concentration of the solution
22
For impregnated type catalysts Dor1ing et al (1971) predicted that up
to a certain metal content the number of crystallites would increase
the mean crystallite size would vary slowly and the metal area would be
approximately proportional to the metal content Beyond this metal
content the number of crystal1 ites would remain constant if only one
crystal formed in each pore during drying Hence the metal crystall ites
would increase in size and the metal area would be proportional to
(metal content)2J Dor1ing et a1 (1971) predicted that the crystallite
size distribution would reflect the pore size distribution of the
support
1324 Drying of non-adsorbed solids
As a result of evaporation of the solvent deposition of the solute
begins when the solution becomes saturated If all the liquid could be
evaporated instantaneously the active material would deposit locally and
uniformly throughout the support Evaporation however does not occur
instantaneously but starts at the outer periphery of the particles and
proceeds from regions of larger pore diameters to smaller pores This
uneven evaporation is the result of the higher vapour pressure of the
1 iquid in the larger pores while 1 iquid which evaporates from small
pores is replaced by liquid drawn by capillary action from the larger
pores as illustrated in Figure 18
A Before drying
B After some drying
Figure 18 Intersecting pores of diferent sizes before drying (A) and
after evaporation of some of the pore volume 1 iQUld (8)
23
Thus when drying proceeds slowly enough there is a tendency tor the
active material which is increasing in concentration as the liQuid
volume decreases to redistribute by diffusion into the remaining fluid
This results in an enrichment of the active material in the smaller
pores and towards the center of the particle (Maatman and Prater 1957)
133 Homogeneous decomposition deposition
It can be seen from the above discussion that producing a catalyst by
impregnation or ion exchange with high metal contents leads to the
formation of crystallites with non-uniform distribution and low
dispersion As an active supported catalyst system calls for a highly
dispersed particle with uniform distribution on a highly porous
thermally stable support such as silica alumina it would be desirable
to combine the high degree of penetration of the solute into the support
observed during impregnation with a controlled ion exchange-type
preCipitation The procedure studied by van Dillen (1976) for the
manufacture of highly dispersed nickel silica catalysts with uniform
distribution and a similar system used by Higley (1984) to produce
nickel oxide on silica alumina catalysts was investigated
In the case of this work a suspension of nickel nitrate hexahydrate and
silica alumina was prepared To preCipitate the nickel salt onto the
support the pH had to be lowered This was achieved by Hisley (1984) via
the injection of ammonium hydroxide and in the case ot this work by the
slow and homogeneous decomposition of urea The reason for using urea as
the source of hydroxyl ions as opposed to ammonium hydroxide is
discussed below A detailed disCussion of the synthesis procedure is
given in Section 363
1331 Theory Ot homogeneous decomposition deposition
When the concentration of a homogeneous solution is raised at a constant
temperature as shown by path A in Figure 19 the solubil ity Curve is
reached Crossing the solubil ity curve does not generally lead to the
formation of a preCipitate but to a metastable state When howeverthe
concentration on the solubil ity Curve is exceeded by a critical amount
nuclei of the preCipitate are spontaneously generated brinSins about
the transition to the eQuilibrium state The concentration where nuclei
start to develo~ s~ontaneously l~ homogeneous solutions IS indicated by
the supersolUbil tty Curve which is also shown in Figure 19 (Walton
1969) The fact that no preCipItate grows when the solubil ity Curve 13
crossed is due to the Considerable surface enerSY of very small
24
particles of the precipitate Thus raising the concentration of a
solution to the value on the supersolubil ity Curve leads to the
formation of a limited number of nuclei If the homogeneity of the
solution is maintained the concentration of the solution will remain
between that of the solubil ity and supersolubil ity curves where no new
nuclei can develop Therefore as a result of precipitation from a
homogeneous solution a small number of large particles of the
preCipitate are formed Pouring a precipitant into the suspension on the
other hand gives rise to an inhomogeneous solution as the concentration
will locally be increased far beyond that of the supersolubility curve
as shown by path B in Figure 19 This gives rise to the formation of a
large number of nuclei Before the concentration has decreased by
homogenizing the solution the nuclei have grown sufficiently to be
stable at the lower concentration Working with an inhomogeneous
solution therefore results in a relatively large number of small
particles (Cartwright et al 1967)
It was concluded by Hermans and Geus (1979) that pouring a preCipitant
into a suspension of a porous carrier leads to preCipitation of the
active material where the preCipitant enters the suspension and the
preCipitate will not develop uniformly over the surface of the support
PreCipitation from a homogeneous solution on the other hand proceeds
eQually in the pores of the support and in the bulk of the solution and
so el iminates the inhomogeneous addition of the preCipitate to the
support
In order to produce a catalyst with high dispersion and uniform
distribution a sufficiently stron9 Interaction of the preCipitating
compound with the support is neCessary This interaction must decrease
the nucleation barrier so that nucleation at the surface of the support
can proceed at a concentration between the solubil ity and
supersolubil ity Curves The preCipitate can then nucleate at the ~urface
of the support whereas nucleation in the bulk of the solution is
prevented In addition nucleation at the surface must be rapid to avoid
the growth of a small number of nuclei to large particles of the
preCipitate (Hermans and Geus 1979)
1332 Nickel oxide sil ica alumina preparation usinB homogeneous
decomposition deposition
Higley (1984) showed that incorporating nickel onto sll iea alumina by
the injeCtion of a hydroxide-containing solution (ammonium hydroxide)
25
CBMPBSITIBN FIG 19 PHRSE DIRGRRM
resulted in a catalyst active for the 01 igomerisation of olefins In
view of the above discussion however it seems likely that the
synthesis procedure developed by Higley (1984) resulted in a catalyst
with high dispersion but nonuniform distribution Using a homogeneous
system with the slow hydrolysis of urea as a source of hydroxyl ions as
developed by van Dillen et al (1976) for the preparation of nickel
sil ica catalysts the catalyst produced would have a high dispersion and
a uniform distribution of the metal crystal] ites throughout the support
134 Co-preCipitation
This method for preparing supported metal catalysts is usually
aSSOCiated with nickel 5i I ica catalysts The technique involves mixing
of the constituents on an atomic level under condition favouring
preCipitation The resulting catalyst is one where small crystals are
uniformly distributed throughout the catalyst matrix Subsequently this
type of catalysts can be made with nickel contents up to 20 wtX without
affecting Crystal size or distribution
w n )
fshya n w 0 L W f-
PATH A
26
14 PhysiCal characteristics or the catalyst
The properties which characterise a catalyst are shown in Table 12 and
discussed below
Tab 1 e 1 2 Characterisation or supported metal catalysts
Support Metal dispersion Nature or ac ti ve
properties and location component
Total area Total sur race Metal support
area interaction e9
Pore structure oxidation state
Meta 1 sur race
Surface chemical area
properties e9
surface aci dity Crystal size
distribution
Crystal size
an d 1 oC a t ion
141 Properties or silica alumina
1411 Surrace area
The surrace area or silica alumina is not only a runction or the alumina
content but also or the synthesis procedure used In the case or Coshy
precipitation used by Holm et a1 (1959) the surface areas ror the
entire ranse rrom pure alumina to pure si1 ica were consistently hisher
than that established by Ward and Hansrord (1969) tor an impregnated
catalyst The results obtained by both Ward and Hansrord (1969) and Holm
et al (1959) are shown in Figure 110 as are the results ror the
commercial catalyst used by Ward and Hansford (1969)
1412 Pore structure
Ramser and Hill (1958) studied the pore diameter dIstribution or a
commercial sil ica alumina catalyst usin9 nitrogen isotherms The results
obtained by them are shown in Table 13 No data was however available
as to the silica to alumina ratio of the catalyst used by them
27
800 shy
~ - 600 shyN ltl ~
bull a W
~=cePRECIPITATEO ()= IMPREGNATED eft =CeMMERC I AL
~
eft ~ () ~ ~
eft
400 -- ~a eft ~a efteft ~
~ ~
200 -r-I I I
I I200 300 400 600 600 700 800 900 1000 RLUMINR CBNTENT MRSS
FIG 110 SILICR RLUMINR SURFRCE RRER (Ma2GlVS ALUMINR CGNTENT (MRSS)
Table 13 Pore volume and size distribution of fresh catalyst and
adsorbents (Ramser and Hill 1958)
Catalyst Surface area Pore volume Average pore
code (m2 9 ) (cm3 19) radius (A)
Commercial
Silica
Alumina
Alumina
Silica
5421
5002
4620
1666
7712
0585
0608
0619
1142
0426
157 plusmn 96
177 plusmn 108
179plusmn 126
30 1 plusmn 568
105 plusmn 43
29
1413 Surface acidity
Holm et a1 (1959) using a butylamine titration techniQue as proposed by
Tame1e (1947) determined the total acid content of a co-precipitated
silica alumina catalyst They also determined the Bronsted acid content
of the catalyst using a base exchange reaction via ammonium acetate In
this way the Lewis acid content of the support could be estab1 ished The
results obtained for the entire range from pure ail ica to pure alumina
are shown in Table 14
Tab 1 e 1 4 Acid content (total and Bronsed) for sil ica alumina heat
treated at 550degC
Alumina Protonic acid Tota 1 ac i d Acid strength
content content content index
(wt~) (meQg) (meQg) (K)
100
925
92
85
60
45
30
18
10
5
2
0
000
006
004
007
019
034
045
080
077
061
038
013
014
043
041
039
042
046
040
040
040
031
003 approx
2310- 7
4710-amp
1110-)
3910-)
6110-)
1410- 4
2410- 4
2510- 4
1110-)
142 Properties of nickel oxide on sil ica alumina
1421 Total surface area
The total surface area of nickel oxide on silica alumina was examined by
Holm et al (1957) for an impregnated and a Co-precipitated catalyst The
sil ica to alum1na weight ratio was held constant at 9 to 1 throughout
The results obtained as a function of nickel loading are given in
Table 15 Ushida and Imai (1962) using a co-precipitated nickel oxide
si 1 ica alumina catalyst with the nickel content fixed at 4 wt but
varYing the alumina content from 0 to 46 wt also measureJ the surface
29
area of the catalyst Their results of surface area as a function of
alumina content are shown in Table 16 In an independent study Imai
and Ushida (1965) measured the surface area of a nlckel oxide on silica
alumina catalyst with a fixed alumina content of 43 wt~ varyins nickel
content These results are shown in Table 17
Table 15 Surface area of nickel oxide sil ica alumina prepared by
impregnation and coprecipitation as a function of nickel
content the si1 ica to alumina weisht ratio of 91
Sinthesis Nickel content Surface area
technique (wU) (m2 IS)
Impregnated
Coprecipitated
085
1 71
315
1080
073
254
448
830
1726
3782
6026
300
300
300
253
373
374
388
248
259
302
219
1422 Metal surface area and crystal size
The metal surface area of an impregnated nickel oxide on synthetlc
zeolite was examined by Brooks and Christopher (1968) using hydrogen
chemisoptlon and the average nickel crystallite size usin9 X-ray
diffraction line-broadenins They found that the nickel areas estimated
from H-z chemisorption and from averase nickel crystallite size
determined by X-ray diffraction line-broadening were In soad agreement
The results obtained by them for a series of supports and nickel loadins
are shown in Table 18
30
Table 16 Surface area of nickel oxide sii ica alumina as a function of
the alumina content Nickel content held constant at 61
wtX
Alumina content Surface area
(wtX) (m2 19)
00
28
51
96
292
490
275
338
360
281
138
181
Table 17 Surface area of nickel oxide silica alumina as a function of
nickel content Alumina content was held at 43 wtX
Nickel content Surface area
(wtX) (m2 19)
00
251
498
744
987
283
344
355
368
344
1423 Pore volume and size distribution
The pore volume and average pore radius was examined by Uchida and 1mai
(1962) for a catalyst with a fixed nickel content but varying alumina
content and by 1mai and Uchida (1965) for a catalyst with a fixed
alumina content of 43 wt~ but varYing nickel content The results
obtained by them are shown in Tables 19 and 110 respectively
31
Table 18 Nickel metal area from H2 chemisorption
mmH9 H2 vapour pressure and from X-Ray
broadenin9
at 250degC and 100
diffraction lineshy
Catalyst Nickel Total nickel area X-ray line broad
code content H2 chemisorption Diameter Area
(3Ni9cat) (m2 bull Nif 3 cat ) (A) (m2 bull Nilg cat)
G56-1 0145 48 155 60
G56-2 0131 42 175 48
G56-3 0071 19 715 06
NiDavZ14 0059 27 185 20
Nileolon 0032 07 680 03
Table 19 Pore volume and radius of a nickel alumina catalyst with
varyin9 alumina content Nickel content held at 4 wt~
Alumina Pore volume Avera3e pore
content (cm3 3) radius
(wU)
000
863
1752
2670
3617
4595
0518
0349
0349
0349
0387
0416
384
253
357
484
477
468
1424 Metal support interaction
The valence of nickel oxide on sil ica alumina was measured by Holm et al
(1957) using hydrogen reduction as proposed by Hill and Selwood (1949)
They found that no abnormalities existed with regard to the chemical
valence of nickel in either the co-preciPitated or impre3nated
catalysts These results were confirmed by Ushida and Imai (1962) who
32
however reported that for catalysts with an alumina content higher than
86 wt or lower than 26 wt the valence of nickel was slightly higher
than two The slight valence increase in the case of higher aluminum
content could be explained since the larger the aluminum content the
larger the amount of nickel oxide which could be combined with alumina
Table 110 Pore volume and radius of a nickel oxide sil ica alumina
catalyst with varying nickel content Alumina content held
at 43 wt throughout
Nickel Pore volume
content (cmJ 9)
(wU)
000
251
498
744
987
037
040
038
040
036
15 Catalyst polymerisation properties
151 Silica alumina properties
1511 Effect of sil ica to alumina ratio
The propene polymerisation activity was examined by Holm et al (1959)
for a coprecipitated silica alumina catalyst with varying silica
content The catalyst was activated by drying in air at a temperature of
550C for 16 h and the po1ymerisation activity determined by passing
propene over the catalyst while raising the temperature from 30 to
300middotC The maximum conversion obtained for each activation temperature
was considered to be indicative of the po1ymerisation activity The
results obtained by Holm et a1 (1959) showed that a catalyst With a
silica to alumina weight ratio of 7 to 1 was the most active for the
polymerisation of propene Johnson (1955) examined the polymerisation
activity Of propene at 200C for an impregnated ail ica alumina catalyst
with varying silica content and found that for a catalyst dried at
200C the optimum sll ica to alumIna weight ratio was 9 to 1 Tamele
(1950) also workIng at 200C and uSing a catalyst dried at 500middotC
reached the same conclusion as Johnson (1955)
33
1512 Eftect ot reaction temperatures
Silica alumina required temperatures higher than 200C to be active tor
the polymerisation of propene (Takahashi et a1 bullbull 1972) This was also
shown by Fe1db1yum and Baranova (1971) who working at 64C recorded
a conversion ot only 6~ The dependence Ot temperature tor propene
po1ymerisation over ail ica alumina was investigated by Takahashi et a1
(1972) in a t10w through system at a pressure Ot 50 atm The results
obtained by them are shown in Table 111
Tab 1 e 111 Propene 01 igomerisation on silica alumina at a constant
pressure of 50 atm and varying temperature Silica to
alumina ratio used was 94 to 3 throughout
Reaction Propene
temperature conversion
(OC)
200 126
250 407
300 641
350 679
1513 Ettect of space velocity
The relationship between the space velocity and po1ymerisation activity
expressed in terms of propene conversion was examined by Takahashi et
a1 (1972) tor a catalyst with a sil ica to alumina weight ratio Ot 9 to 1
at a temperature of 200degC and a pressure Ot 50 atm The results obtained
show that an inverse relationship exists between space velocity and
propene conversion
1514 Product spectrum
At the temperatures needed in the presence of silica alumina for propene
po1ymerisation dimerlsation is a minor reaction with the main product
being the propene trimer The effect Ot temperature on the product
spectrum at a pressure Ot 50 atm with a catalyst having a silica to
alUmlna ratio of 94 to 3 as established by Takahashi et al (1972) is
shown in Table 112 as are the results of Feldb1yum and Baranova
( 1971gt
34
Table 112 Product distribution of propene 01i90merised over silica
alumina as a function of temperature Reaction pressure is
50 atm
Researcher Feldblum and Takahashi et al (1972 )
Baranova ( 1971gt
Silica to 91 943
alumina ratio
Reaction
temperature 64 200 250 300 350
( degC )
Propene
conversion 6 126 407 641 679
(wtX)
Product
spectrum
Dimer (Co) 15 88 159 233 285
Trimer (C ) 756 438 362 307 231
Tetramer+ (Ct2+ ) 94 448 448 436 455
1515 Effect of activation
Holm et al (1959) examined the propene polmerisation activit of a
catalyst with a silica to alumina wei9ht ratio of 9 to 1 as a function
of the activation temperature Activation was achieved by holdin9 the
catalyst at each temperature for 16 h under dry air The found that the
optimum activation temperature with regards to propene 01 igomerisation
was 550middotC
152 Nickel oxide sil ica alumina properties
1521 Effect of synthesIs procedure
The two methods available for incorporating nickel onto silica alumina
are impre9nation and Coprecipitation The exact synthesis procedure and
nature of the catalyst has been discussed previously Holm et a1 (1957)
examined the polymerisation activity of catalysts prepared by these
35
methods and concluded that for coprecipitated catalysts the maximum
propene polymerisation activity was approximately 50X greater than that
for catalysts prepared by impregnation
1522 Effect of metal content
Hogan et al (1955) using a commercial catalyst with a sil ica to alumina
weight ratio of 9 to 1 concluded that when the metal was loaded onto
the support by impregnation the most active catalyst for the
po1ymerisation of propene contained between 3 and 5 wtX nickel Holm et
a1 (1957) using a co-precipitated and impregnated nickel oxide on
silica alumina catalyst establ ished that for both methods of loading
the maximum polymerisation activity per unit volume was also obtained
for a catalyst holding between 3 and 5 wtX nickel Takahashi et al
(1969) using a Commercial silica alumina with an alumina content of 13
wtX showed that for an impregnated catalyst a nickel content of 13 wtX
was optimum for the conversion of propene To maximize the yield of
propene dimer however the optimal nickel content was found to be 97
wtX When a co-precipitated as opposed to impregnated catalyst was
used Takahasi et al (1969) found that a nickel content between 3 and 5
wtX gave the optimum results for propene dimerisation
1523 Effect of reaction temperature and pressure
Hogan et a1 (1955) showed that when the reaction temperature was varied
from 35 to 130middotC the rate of reaction was highest in the ran~e of 70C
to 93middotC with a sharp dec1 ine in conversion when the pseudo-critical
temperature of 96C of the feed was exceeded and the system was
essentially in the vapour phase They concluded that the optimum
reaction conditions for the dimerisation of propene were a temperature
of 70C and a pressure of 40 atm Takahashi et a1 (1969) also examined
the effect of temperature and pressure with respect to propene
conversion and dimer yield and concluded that as long as the system
remained in the 1 iQuid phase the formation of dimers dominated with a
shift to heavier products as soon as the system moved into the vapour
phase The optimum conditions for the dimerisation of propene according
to Takahasi et a1 (1969) were a temperature of 70 to 80C with the
pressure ranging from 30 to 35 atm The above conclusions can easily be
represented graphiCally as shown in Figure 111
1524 Effect of feed composition and space velocity
Takahasi et al (1972) found that when pure propene was fed the surface
temperature of the catalysts rose far above the set reaction
temperature Consequently although the system was essentially in the
36
1000
~ (fJ 800 (fJ
II L
600 Z CJ t--I
(fJ 400 []
a w gt z CJ 200 U
00
[]
00 200 400 600 800 PRESSURE RTM
FIG 111 PRBPENE CBNVERSIBN (MRSS) VS PRESSURE (RTM)
1 iQuid phase a vapour phase reaction was taking place at the surface of
the catalyst with a corresponding shift to heavier products and rapid
deactivation of the catalyst It was therefore necessary to use a
mixture of propene and an inert diluent such as propane which served as
a heat sink and so controlled the catalyst surface temperature Hogan et
al(1955) varied the propene concentration in the feed from 7 to 37 vol~
at space velocities of 2 4 and 8 and concluded that the rate of polymer
production increased 1inearly with propene concentration A first order
relationship between propene concentration and rate of polymer formation
was obtained Hogan et a1 (1955) did not indicate how dimer selectivity
was affected as a function of feed composition Takahashi et al (1969)
using a 217 to 1 mixture of propene to propane wIth trace impurities
of ethane ethene and butenes concluded that the optimum space velocity
for the production of a propene dimer at the conditions of temperature
and pressure discussed earl ier was 750 g of propene per 1 iter of
catalyst per hour
1525 Effect of feed impurities
Hosan et a1 (1955) stated that the catalyst became deactivated if
allowed to absorb as 1ittle as 05 wt~ moisture This type of
contamination was however totally reversible Other impurities such
37
as acetelyne and carbon monoxide acted as severe poisons to nickel
oxide silica alumina while oxygen sulphur compounds and butadienes had
only a moderate poisoning effect The poisoning effect of these
materials was apparently not reversible as the catalyst did not
regenerate to any extent after removal of the contaminant from the feed
Takahashi (1969) on the other hand stated that the Scientific Design
Company had shown that by introduCing water or alcohol with the feed
the conversion of propene could be doubled without affecting
dimerisation activity
1526 Effect of activation procedure
The activation time temperature and gas flow rates were examined by
Takahashi et a1 (1969) with respect to acidity structure and propene
dimerisation activity of the catalyst They found when using 200 ml of
catalyst that a space velocity of 100 h- 1 of dry air at a temperature
between 500 and 600C was optimal and that the activity of the
catalysts increased with inCreasing activation time up to 5 h above
which the activity did not change Three distinct temperature regions
were identified by Takahashi et a1 (1969) between 300 and sOOmiddotC
physisorbed water was removed between 500 and 600middotC the concentration
of protoniC sites was highest and above 600 G C Lewis sites were formed
which could not be hydrated back to Bronsted sites
1527 Effect of regeneration
The po1ymerisation activity of the nickel oxide sil ica alumina catalysts
declined at a rate determined largely by the amount and type of
impurities in the feed and eventually regeneration was required (Hogan
et a1 bullbull 1955) The regeneration procedure was to strip the catalyst free
of hydrocarbon vapours and preheat it to a combustion temperature (about
400C) with dry inert gas The small amount of residual deposits were
then burnt off in dry air at 500C and the catalyst cooled under dry air
(Hogan et a1J 1955) After repeated regeneration the nickel oxide
promotor underwent changes which caused the activity to decline The
catalyst could however be restored to its initial activity by wetting
with a nitric acid solution followed by a normal activation
1528 Product spectrum
Takahasi et a1 (1969) together with Hogan et a1 (1955) fOlJnd that the
reaction conditions had a large influence on dimer compOSition The
reslJlts obtained by Takahashi et al (1969) at variolJs reaction
conditions are shown in Table 113 The products obtalned by Hogan et al
(1955) for once through propene conversion uSing a catalyst with 4 wt~
38
nickel at 75middotC and 40 atm and the results of Feldblyum and Baranova
(1971) using a temperature of 64C and a pressure of 50 atm and a
catalyst containing 45 wtX nickel are also shown in Table 113 Hogan
et 81 (1955) working with fixed feed composition and reaction conditions
studied the effect of varying the space velocity on the product
spectrum The results obtained by Hogan et al (1955) are shown in Table
114
1529 Lifetime
Hogan et al (1955) examined the lifetime of an impregnated nickel oxide
sil ica alumina catalyst using a cracked gas containing 25 molX ethene
10 mol~ propene and 12 mol~ butenes with butane as liquid diluent A 100
h run was done by Hogan et al (1955) and data was obtained on conversion
and on the properties of the products in butene-butane recycle
operation The reaction conditions used were a temperature of 65 to 75degC
and a pressure of 34 atm with feed rates of 600 standard volumes of
cracked gas and 4 1 iQuid volumes of butane-butenes per hour per volume
of catalyst The catalyst used contained 4 wtX nickel with a sil ica to
alumina weight ratio of 9 to 1 Hogan et al (1955) showed that the
activity of the catalyst with respect to total olefin conversion after
100 h on stream dropped from 99 to 96X The average rate of polymer
production was 350 ghlmiddotcat The polymer composition by volume was 13~
pentenes 26~ hexenes 20X heptenes and 41X octenes through decenes
In an indepndent study Allum (1974) prepared a nickel oXide silica
alumina catalyst by first impregnating silica gel with aluminium and
then with nickel The final catalyst contained 145 wtX aluminium 036
wtX sodium and 07 wt~ nickel The catalyst which was activated for 4 h
at 550degC under dry nitrogen was used to 01 igomerise 1-butene in daily
batches at aodegc and 54 atm in a 3 1 rocking autoclave for 24 consecutive
days The activity of the catalyst decreased from 020 grams of product
per gram of catalyst per hour (1st day) to 014 grams of product per
gram of catalyst per hour (24th day) Of the liquid 01 igomers 65 wt~
were octenes on the first day which rose to 85 wtX octenes on the 24th
day
16 Conclusion
As can be seen from the above discussion nickel oxide on Silica alumina
catalysts prepared by impregnation and coprecipitation have been studied
in great detail The technique of homogeneous decompositlon depOSition
for incorporating nickel into sil iea alumina is a much simpler technique
than coprecipitation and it is hoped that the catalytic properties with
39
respect to lifetime selectivity and activity are comparable to if not
better than the properties of coprecipitated or impregnated nickel
oxide silica alumIna catalysts
Table 113 Relationship between product distribution and reaction
conditions
a) Takahashi et al (1969) sil ica to alumina wei9ht ratio of 87 to 13
nickel content 13 wt~
b) H09sn et al (1955) silica to alumina wei9ht ratio of 9 to 1 nickel
content 4 wt~
c) Feldblyum and Baranova (1971) silica to alumina weight ratio of 9
to 1 nickel content 45 wtX
d) Distillation cut off temperature
Temperature Pressure
(degc ) (atm)
) 65
SO
90-95
120
75
75
75
75
75
80
75-80
75
35
35
35
35
15
20
25
30
32
35
50
70
47S
465
380
230
185
246
305
401
520
465
430
435
335
3S0
340
3S0
210
250
280
310
270
350
340
250
97
95
190
260
395
350
300
150
140
95
135
220
22
18
24
98
137
90
36
66
28
18
30
25
b ) 75 40 720 190 60 30
c ) 64 40 77 2 202 26
40
Table 114 Propene conversion and product spectrum as a function of
space velocity sil ica to alumina ratio is 9 to 1
throughout
Conversion Space Ct2 Ct 5 +
(wtX) ve 1oC ity
53 2 777 160 61 24
68 4 737 200 70 32
83 8 656 210 88 64
41
17 OBJECTIVE OF RESEARCH
The aim of this study was to investigate the propene oligomerisation
properties of NiOSi02-A1203 catalysts synthesi~ed using three
different techniques impregnation Co-precipitation and homogeneous
decomposition deposition The effect of the following factors on the
activIty selectivity and 1 ifetime of these catalysts for propene
01 igomerisation were investigated
(i) Nickel content of catalysts
(ii) Reaction pressure and temperature
(iii) Weight hourly space velocity
(iv) Reactor temperature stabil ity and
(V) Propene feed moisture content
42
2 DESIGN OF ISOTHERMAL REACTOR
21 Introduction
In order to facilitate interpretation of reactor data it was important
that the reactor used in this study was as isothermal as possible
Various attempts have been made to achieve this Hogan et al (1955)
surrounded the reactor with an electrically heated jacket containing a
liQuid which was boiled at a temperature fixed by the pressure of an
inert gas applied to the top of the reflux condenser Imai (1968) on
the other hand inserted the reactor into a heated bed of iron powder
In the case of the present work a similar system was used to achieve
isothermal conditions A detailed description of the design of this
reactor will now be given
22 F1uidisation theory
If a fluid passes upward through a bed of solids at a low velocity the
pressure drop aCross the bed is the same as that for a downward flow As
the fluid velocity increases the particles become rearranged so that
they offer less resistance to the flow and the bed starts to expand
This process continues as the velocity is increased with the total
frictional force remaining eQual to the weight of the particles until
the bed has assumed the lowest stable form of packing If the velocity
is then increased further the individual particles separate from one
another and become freely supported in the fluid At this stage the bed
is said to be fluidised Further increases in fluid velocity cause the
particles to separate still further from one another and pressure
differences remain approximately eQual to the weight per unit area of
the bed The above phenomenon can be represented graphically if the
pressure drop across the bed is plotted against fluid velocity through
the bed using logarithmic co-ordinates
Thus in Figure 21 (Coulson and Richardson 1980) a 1 inear relation is
obtained on a log log scale up to the point where bed expansion takes
place (A) The slope of the curve then gradually diminishes as the bed
expands As the velOCity is increased the pressure drop passes through
a maximum value (B) and finally falls slightly before attaining an
approximate constant value independent of fluid velocity (CO) The
section (CO) of the Curve is an indication of the Qual ity of
fluidisation for if the pressure drop is constant as the fluid velocity
43
increases channel in~ is absent Point (B) which 1 ies above (CO)
identifies the point where the frictional forces between the particles
is bein~ overcome prior to rearran~ement The point of minimum
fluidisation velocity ie bullbull the fluidising point is shown on this
Curve at (E) (Coulson and Richardson 1980)
FLUIDISED BEDFIXED BED
0shyltl I VELOCITY
INCREASING
FLUIDISING
POINT
VELOCITY DECREASING
(BED OF MAXIMUM I
POROSITY)
I
I I
LBG (Ve) FIG 21 PRESSURE DRep eVER FIXED AND FLUIDISED
BEDS
23 Heat transfer
Fluidised beds have good heat transfer properties and are ideal in a
system where close control of temperature is reQuired The intimate
mixing which takes place in the bed ensures that heat transfer
throughout the system is very rapid and that uniform temperatures are
Quickly attained
Three mechanisms have been suggested to explain this improvement in heat
transfer coefficient An increase of up to one-hundred fold as compared
with the value obtained with a gas alone at the same velOCity can be
attained by the presence of the sol id Coulson and Richardson (1980)
stated that the particles whose heat capacity per unit volume IS many
times greater than that of the gas act as heat transferring agents As
a result of their rapid movement within the bed they pass from the bulk
of the bed to the layers of gas in close contact with the heat transfer
44
surface exchanging heat at this point and returning to the body of the
bed This together with the extremely short physical contact time of
the particle with the surface ensures that the thermal conductivity of
the particle is not an important factor The second mechanism proposed
by Coulson and Richardson (1980) is the erosion of the 1amminar sub1ayer
by the particles and the subsequent reduction in its effective
thickness A third mechanism suggested by Mickley and Fairbanks (1955)
is that packets of particles move to the heat transfer surface and an
unsteady heat transfer process takes place
Many equations are available in the 1 iterature to calculate the
convection heat transfer coefficient of the gas solid system One
equation which seems to be the most re1 iab1e is that of Dow and Jakob
(1951) The Nusse1t number with respect to the tube diameter is
expressed as a function of four dimensionless groups the ratio of tube
diameter to length ratio of tube to particle diameter ratio of heat
capacity per unit volume of the sol id to that of the fluid and finally
the tube Reynolds number These relations are combined as shown below
where h is the heat transfer coefficient
k is the thermal conductivity of the gas
d is the particle diameter
dt is the tube diameter
is the 1ength of the bed
E is the bed voidage
P is the density of the sol i d
p is the density of the gas
c is the specific heat of the sol id
c is the specific heat of the gas
v is the viscosity of the gas and
Uc is the superficial velocity based on the empty tube
At the present stage of our knowledge the above equation seems the most
re1 iab1e and will thus be used to estimate heat transfer coefficients
and optimum particle diameter
24 F1uidising medium
Various materials were investigated It was assumed that each material
had a discreet size fraction As a high heat transfer coefficient was
important if the f1uidised bed was to perform its function effectively
45
the equation developed by Dow and Jakob (1951) as discussed abov~ was
used to compare the various sol ids Furthermore two bed temperatures
were used to identify any changes in heat transfer coefficients as a
function of bed temperature The results are shown in Figures 22 and
23 It can be seen from these figures that a maximum exists at a
particle size of approximately 150 ~m and that the convective heat
transfer coefficient drops slightly as the bed temperature is increased
Copper powder gave the best results a heat transfer coefficient in
excess of 1000 Wm2 K for a particle of 150 ~m The explosive and toxic
nature of meta1l ic dust at the temperatures reached during calCination
made this an undesirable solution Sand however was less dependant on
both the particle size and bed temperature is totally inert and readily
available It was thus decided that sand would be used as fluidising
medium
241 Sand data
Two sands were readily available These were coded by the manufacturer
as No1 and No 12 Their size distributions are shown in Table 21 As
the actual material had a size range rather than a discreet particle
size an effective particle diameter had to be establ ished Using the
relation suggested by Leva (1959)
where d is the effective particle size and Xi is the size fraction of
particles of size dt the effective particle size was calculated
The efficiency of f1uidisation (Leva 1959) of sands with wide (No 12)
as opposed to narrow (No2) size distributions effectively eliminated
sand No 12 from further consideration
25 Optimisation of the fluidised bed
As discussed In Section 21 a bed of sol ids becomes fluidised only when
the superficial velocity exceeds the minimum fluidisation veloCity As
it is important for the bed to be totally fluidised the minimum
fluidising velocity has to be found For this reason the system was
modified as shown in Figure 24 An attempt was made to measure the
pressure drop across the bed Itself but was Tound not to be pOSSible as
the fluidislng medium would block the tapPIng point at the bottom of the
bed
46
c 11 00
N ltl L 900 3
bull bull 700
LL LL W ~ U 500
bull IshyU 300 W gt z CSJU 100
(J=SAND ()=CepPER amp=lINC +=ALUNINIUN X =cepPER ax 1DE 0=ZINC aXIDE
~~---e------pound9-__
00 500 1000 1500 2000 2500 3000 3500
PRRTICRL DIRMETER UM FIG 22 CBNVECTIBN CBEFFICIENT (WMa2 K) VS
PRRTICRt SIZE (UM) 25C shy
c 900
N ltl L
3 700 bull
LL lLW 500
~ U
bull I- 300 U W gt z CSJ U 100
+=ALUNINIUN x =capPER ax I DE 0=lINC eXIDE
(J=SAND ()=cepPER amp=ll NC
00 500 1000 1500 2000 2500 3000 3500
PRRTICRL DIRMETER UM FIG 23 CBNVECTIBN CBEFFICIENT (WMa2 KJ VS
P R R T 1 CAt S I Z E (U M ) 190 bull C
47
11
FIG 24 REACTOR MODIFICATIONS TO MEASURE PRESSURE DROP
48
Key to Figure 24
1 Feed in 1et
2 Feed preheater
3 Product outlet
4 Integral reactor
5 Reactor support
6 Thermowe 11
7 Tubular embedded element (10 kW)
8 Mica band elements (05 kW)
9 Insulation
10 Fluidised sand bed
11 Gas distributor
12 Rotameter
13 Air supply
14 Oisengagement zone support
15 U-tube manometer
The procedure used to determine the data to prepare a plot of pressure
drop across the bed vs the superficial velocity through the bed is
discussed below
Table 21 Sand size fractions
Size No 12 No 2
(vm) (wU) (wU)
-420
420-350
350-297
297-250
250-210
210-177
177-149
149-125
125-105
105-74
74 shy
Mean size
06
190
336
289
155
22
02
(101m) 1668
01
04
21
86
202
153
242
125
117
49
1243
49
251 Airflow optimisation
The calibration chart of the rotameter could be approximated usin9
Vc = 1983 + 0S8SmiddotTR + 0005 TR2
where Vc is the volumetric flowrate in lmin at lSC (Tc) and 760 mmH9
(Pc) and TR is the rotameter tube readin9 Usin9 ideal 9as behavior
this can be corrected to the actual temperature (Tr) and pressure (Pr)
in the rotameter usin9
Vr = (Vc Pc Tr ) I (Tc P r )
where Vr is the volumetric flowrate at rotameter temperature
and pressure
The pressure in the rotameter was that measured at the inlet to the bed
and was use to calculate the actual flowrate at each tube readin9 If
the 109 of the pressure drop across the bed and 4Ha was plotted a96inst
the 109 of the superfiCial velocity a strai9ht line was obtained The
9raph is shown in Fi9ure 25 The shape of this curve does not
correspond to that of the curve as discussed in Section 21 This is due ( l _ -- i~ -()~
to the fact that the pressure drop across the d~sk was included in the
calculation
200
60 0
IT I-shy--J W 20 0
D ~
080--J
040
-27 -25 -23 -2 -9 - 7 - 5
LBG (Vel FIG 25 PRESSURE DRBP VS SUPPERFICIRL VELBCITY
RCRBSS DISK RND BED
50 - ~
Having previously determined the pressure drop across the d~ the
actual pressure in the bottom of the bed could be calculated at each
rotameter tube reading using
Pb = Pr - Pd
where Pb is the pressure in mmHg at the bOttOM of the bed above the
disk and Pd is the pressure in mmHg in the rotameter when no sand was
in the bed
This corrected pressure was then used to calculate the actual flowrate
through the bed The temperatures of the rotameter and bed were assumed
to be identical and so
where Vb is the air flowrate at the bottom of the bed in lmin Using
the above procedure and plotting the log of the pressure drop across the
bed (Pb) against the log of the superficial velocity (Vb) a Curve of the
classic shape is obtained as shown in Figure 26 without the integral
reactor and in Figure 27 with the integral reactor in the bed In both
cases the minimum fluidisation veloCity was round to be 121 llmin
(Point E on Figures 26 and 27) and channel ing was absent (Part CD in
Figures 26 and 27 is flatgt
a
IT Ishy--J W 0 --
0 ~
1 70
1 50
1 30
10
090
070
050
-26 -26 -24 -22 -20 -1 6 -1 6
LBG (VC) FIG 26 PRESSURE DRep VS SUPPERFICIAL VELeCITY
INTEGRAL REACTeR ABSENT
51
1 70
shy
I 50
CL 1 30
CI f shy~ W 1 10 0
0900 a ~
070
050
-28 -26 -24 -22 LBG (Ve)
-20 -1 8 -1 6
FIG 27 PRESSURE INTEGRRL
DRBP VS RERCTBR
SUPPERFICIRL PRESENT
VELBCITY
252 Temperature correction
As the temperature in the bed increased to reaction conditions the
superficial velocity increased at a fixed rotameter setting This
resulted in a change in the Quality of fluidisation It was thus
desirable to develop a relationship between the bed temperature and the
rotameter tube reading at the minimum fluidisation velocity As the
temperature of the gas was raised to 330degC within 25 mm above the
distributor as shown by Heertjie and McKibbins (1956) the only
assumptions that had to be made was that the pressure drop across the
bed and di-~k-~as independent of temperature and that the i deal gas 1aw
applied Thus
To find the tube reading which corresponds to the air flowrate
calculated above the value had to be corrected to the rotameter
cal ibration conditions using
Vc = (VrTcPr)(PcTr)
Combining the above eQuation with that used to approximate the rotameter
cal ibration chart and solving for TR we get
52
TR = -585 + laquo30234 + 200Vr )s)
Tne resultin~ ~rapn is snown in Fi~ure 28 Usin~ tnis ~raph it was
ensured that the superficial velocity in the bed was close to the
minimum fluidisation velocity at any bed temperature
0 Z 0 CI W 0
W CO J I shy
200
180
160
14 0
120
100
80
60
00 400 800 1200 1600 2000 2400 2800
TEMPERRTURE C FIG 28 BED TEMPERATURE ( C) VS RBTAMETER
SETTING VB=121 LIMIN
53
3 EXPERIMENTAL METHODS
31 The reactor system
311 Layout
All experimental work was done in an inte~ra1 hi~h pressure reactor
system A dia~ram of this system is shown in Fi~ure 31 The feed a 41
mixture of propenepropane obtained from SASOL was contained in a
number seven Cadac cy1 inder mounted bottom up to ensure that only 1i~uid
emanated from it Water and entrained impurities were removed from the
feed by passin~ it throu~h a bed of Union Carbide 3 A molecular sieves
and through a 1 ~m sintered metal filter
The vapour pressure of the feed had to be lowered before it could be
pumped by the Lewa hi~h pressure diaphragm pump To achieve this the
feed was piped throu~h a heat exchan~er held at -1SC The pump head was
also cooled to this temperature In this way cavitation was prevented
and efficient workin~ of the pump was ensured From the delivery side of
the pump the feed was piped throu~h a preheater where it was heated to
within 20C of the operatin~ temperature to the top of the integral
reactor
The products from the reactor were piped throu~h a heat exchanger held
at 6C and a 20 ~m sintered metal filter to the Grove Mity Mite back
pressure re~ulator Here the materials were released to atmospheric
pressure The back pressure re~u1ator had to be heated to 60C to
prevent freezin~ of the products due to a Joule Thomson expansion and
subse~uent failure of the unit To achieve this a water bath was used
the liquid bein~ pumped throu~h a pipe wrapped around the outside of the
unit
The products were then piped via a heat exchan~er to a double walled
catchpot where ~as-1 iQuid separation occurred To ensure total
separation the 1 iberated ~as was passed through a Davies double surface
condenser held at -1SC with the condensate fed back to the catchpot
The catchpot was periodically drained and the liquid stored for later
analysIs The flue gas was then piped through a 10 1 surge tank to the
wet ~as flow meter Finally the flue gas was passed through a sampl ing
loop which could be removed from the system and vented to the
atmosphere
54 regshy --
--8
regshyL-------r
middot x lJJ l shymiddotI ltI)
middot I
I gtshyltI)bull
I 0
I C I l shy
( ltr I lJJ
0 I -
rlt
e-uc1
reg-r-------- r-I-rx1---1________J
regt--==-==-=--=-=--=--_==-==-~=r111_~r--------
55
Key to Figure 31
1 Monomer feed cylinder
2 Dimer feed cyl inder
3 Gas tight Quick connector
4 3A molecular sieve holder
5 1~m sintered metal filter
6 20~m sintered metal filter
7 Glycolethanol cooler
8 Glycolwater cooler
9 Glycolwater cooled catchpot
10 Glycolethanol cooled condenser
11 Monomer pump
12 Dimer pump
13 Bursting disk (70 atm)
14 Thermowell
15 Reactor
16 Fluidised sand bed
17 Feed preheater
18 150vm sintered brass disk
19 10 mm rotameter
20 Oil condenser
21 Back pressure regulator
22 Condensation unit
23 Surge tank
24 Wet gas flow meter
25 Gas sampl ing loop
26 Nitrogen bottle (hish purity)
27 Nitrogen bottle
28 Air supply
29 Hydrogen bottle (high purity)
A separate line was used to purge the reactor with wet or dry hydrogen
nitrogen or air depending on the pretreatment required by the catalyst
Vent lines were installed to prevent air locks in the system during
start up
The safety of the line was ensured by a bursting disk set at 70 atm and
a pressure re1 ief valve in the pump which permitted internal circulation
if the del ivery side pressure exceeded the set point
Two cooling Circuits were employed An ethylene glycolwater mixture at
6C was used to cool the catchpot and all product heat exchangers while
56
an ethanolwater mixture at -10C was used to cool the feed heat
exchanger pump head and the flue gas condenser
32 Reactor
Before any statement could be made about the effects of temperature on a
reaction in an integral reactor the latter had to be as nearly
isothermal as possible Various attempts have been made to achieve
isothermal ity eg Hogan et a1 (1955) surrounded the reactor with an
electrically heated jacket containing a 1 iQuid which was boiled at a
temperature fixed by the pressure of inert gas applied to the top of the
reflux condenser 1mai (1968) on the other hand inserted the reactor
into a heated fluidised bed of iron powder In the present work the
system used by Imai (1968) was adopted Sand was however substituted for
iron powder as the explosive and toxic nature of metal1 ic dust at the
temperatures reached during calcination made the latter undesirable The
final result was a reactor where the temperature in the catalyst bed
could be held within 5C of the set point Each aspect of this design
was discussed in Chapter 2 while a description of the reactor is given
below The reactor consisted of two distinct parts the fluidised bed
and the integral reactor Both are shown in Figure 32
321 F1uidised Bed
The fluidised bed consisted of a rolled sheet metal chimney with a
removable disengagement zone An inverted tripod was suspended from the
top of the chimney into which the reactor was hung Air was injected
into a sealed chamber at the bottom of the bed in such a way as to
prevent impingement of the gas on the distributor (see Figure 32) The
distributor used was alSO vm sintered brass disk Great care had to be
taken to mount the gas distributor absolutely horizontally as severe
channeling and corresponding loss in heat transfer efficienCY would
result otherwise The air flow through the bed was controlled usin9 a 10
mm gas rotameter with a stainless steel float
Heat was suppl ied to the fluidised bed by five mica band elements
strapped around the outside of the chimney Each element was rated at
05 k~ The controlling thermocouple Cchromel-alumel) was situated on
the inside wall of the chimney half way up the bed To prevent heat loss
to the surrounding the entire unit was insulated using asbestos cloth
57
reg
FIG 32 INTEGRAL REACTOR AND FLUIDISED SAND BED
58
Key to Figure 32
1 Feed inlet
2 Feed preheater
3 Product outlet
4 Integral reactor
5 Reactor support
6 Thermowell
7 Tubular embedded element (10 kW)
8 Mica band element
9 Insulation
10 Fluidised sand bed
11 Gas distributor
12 Rotameter
13 Air supply
14 Disengagement zone support
322 Integral Reactor
The reactor was a multi-component single seal unit with a bed diameter
of 25 cm Two distinct sections could be identified cross-sections of
which are shown in an exploded form in Figure 33
The insert consisted of the top flange through which the thermowell and
feed were passed and the catalyst bed jacket which was screwed into the
bottom of this flange The catalyst bed jacket was stoppered at its
lower end by a perforated plug which prevented bed entrainment and
centered the bottom end of the thermowell Holes were drilled through
the top flange to allow passage of the securing bolts The sleeve
consisted of the bottom flange to which the reactor jacket was welded
which in turn was sealed at its lower end by a Concave plug through
which the products were taped off Securing bolts were anchored in the
top surface of the bottom flange Sealing was achieved by a groove in
the bottom flange and a ridge in the top flange These served as a seat
for a laminated graphite nickel seal
Separation of the units upon completion of a run was achieved with the
aid of two 6 mm bolts These bolts were screwed through holes in the top
flange onto the top surface of the bottom flange In this way the units
could be forced apart
Heat was supplied to the unit by a 1 kW tubular imbedded element wrapped
around the outside of the reactor jacket This element was used only
59
o
e- _ _--+-shy
FIG 33 INTEGRAL REACTOR
60
Key to Figure 33
1 Reactor sleve
2 Plug
3 Seal ing bolts
4 Sealing groove
5 Bottom flange
6 Top flange
7 Reactor insert
8 Feed inlet
9 Thermowell inlet
10 Sealing ridge
11 Thermowe 11
12 Bed seath
13 Purforated plug
14 Sealing bolt channel
15 Seperation bolt channel
during calcination The controll ing thermocouple (chromel-alume1) was
placed halfway up the thermowel1 running down the center of the catalyst
bed
Temperatures of the reactor fluidised bed and feed were monitored using
a Digitron temperature display connected to 11 iron-constantan
thermocouples Ten of these were situated at regular intervals in the
central thermowe11 to record the catalyst bed temperature profile and
feed temperature The fluidised bed thermocouple was mobile and could be
moved throughout the bed
33 Operation
331 Loading
For every run the reactor was packed in a similar way as shown in Figure
34 Four distinct regions were identified These were from the bottom
up
1 A region of void capped with a wire mesh which prevented the
catalyst and beads from blocking the reactor exit
2 A layer of glass beads which served as a disengagement zone and
prevented catalyst entrainment
3 The catalyst bed which Consisted of 11~ inch extrudates mixed with
2 mm glass beads in a ratio of 11 by volume The beads served as a
heat sink and catalyst diluent
4 A plug of glass beads capped by a wire mesh This ensured preheating
and prevented movement of the bed during sudden pressure drops
The depth of each layer was accurately measured to fix the number and
position of the thermocouples in each region
332 Calcination procedure
Prior to each run the catalyst was calcined The purpose of calcination
was to burn off organic intermediates incorporated in the catalyst
during synthesis and to convert all the nickel nitrate to nickel oxide
At the same time the catalyst was freed of all but a trace of moisture
(Hogan et a1 1955)
Calcination for all experimental work was carried out in-situ Dry air
was passed through the bed at a rate of 500 m1-gasm1-cat-h while the
temperature was stepped up in 50degC increments at intervals of 10 min
The activation was continued for an additional 4 h at 500degC
Upon completion of this step the activated catalyst was purged with dry
nitrogen until the temperature of the bed dropped to 250degC When this
temperature was reached the reactor was sealed at a pressure of 10 atm
under dry nitrogen before being allowed to cool to room temperature
35 ml of 2 mm 91ass beads
18 m1 of catalyst mixed
with 2 mm glass beads in
a ratio of 11 (vv)
Total volume 80 ml
50 ml of 2 mm glass beads
void
FIG 34 REACTOR BED
62
333 Start-up
Prior to introducing the reactants into the system the cooling circuits
and water bath were allowed to operate for a sufficiently long time to
ensure that the temperatures reached steady state The back pressure
regulator was set to the desired value and the fluidising air set to the
value determined previously
The feed cyl inder was then opened and the reactants allowed to flow to
the inlet of the sealed reactor All air was removed from the low
pressure side via a vent 1 ine and the pump started At this time the
reactants were allowed to flow through the reactor and into the rest of
the line When the pressure in the system reached its set point the
pump setting was altered to give the correct feed rate Once this had
been achieved the temperature of the bed was set to the desired value
When the first drops of liquid were collected the feed cyl inder was
changed and the catchpot emptied This was taken as time zero Although
a certain amount of data was lost during start-up this persisted over a
relatively small time fraction of the entire run Little significant
information was therefore lost Furthermore in this way the liquid left
in the line and reactor at the end of a run did not affect the mass
balance
334 Steady state operation
To monitor the performance of the isothermal reactor and the catalyst
the following readings were taken at selected time intervals
- bed temperature profile
- fluidised bed temperature
- fluidising air flow
- 1 iQuid mass and volume
- tail gas meter reading
- tail gas temperature
- GC analysis of tail gas
- GC analysis of 1 iquid
The feed cyl inder was changed when necessary The mass of the used and
fresh cylinder was noted
335 Shut-down
When shutting down the system the feed pump was switched off and the ~~
procedure as outlined above followed The feed cyl inder was however not
replaced Once the relevant data had been collected
- the temperature controllers were switched off
- the coolant and heating flows were stopped
- the system pressure was released to atmosphere
Temperature runaways did not oCcur during start up However it was
found that the degree of control that could be exercised was sensitive
to sand height and the pOSition of the contro11 ing thermocouple in the
fluidised bed which were consequently monitored by visual inspection
throughout the run
34 Data analysis
The data and collected during the run was analysed using a variety of
procedures These are discussed below
341 Computation of results
A computer program was util ised to analyse the data obtained during the
runs The following was computed
Mass balance The percentage mass loss was calculated using
(total liquid out + total gas OUU]X mass loss = 1 - - 100
[ (total weight of feed in)
where the (total liquid out) is measured directly by adding the weight
of all 1 iquid sampled The (total gas out) was calculated using
(P-V-M)total gas out =
(Z-R-rgt
where P = pressure in atm
V = total volume of fl ue gas in 1 i ters
M = molecular weight based on mean over entire run
Z = compressibility factor (0986)
R = universal gas constant (S21xlO- 2 atmlgmoleK) and
T = gas meter temperature In K
64
Two limiting cases of where mass loss could OCcur would be 1) all mass
was lost before the reactor in which case the mass out would be equal to
the effective mass in and 2) all mass was lost after the reactor in
which case the mass in would be equal to the mass out plus the mass
lost To account for the mass lost it was assumed that the rate of mass
loss was constant throughout the run and that the mass was lost in the
form of gas The calculated WHSV and conversion would depend upon where
the mass loss occured The equations used to calculate these are shown
below
Wei9ht Hourly Space Velocity This was the rate of feed in per hour per
gram of catalyst and was calculated usin9
(mass of propene and propane passing over the catalyst)WHSV =
(total time)(catalyst mass)
where n = 1 if it was assumed that all mass was lost before the reactor
n =2 if it was assumed that all mass was lost after the reactor
Liquid production rate This is an indication of the activity of the
catalyst and is expressed in terms of grams of liquid product obtained
per gram of catalyst per hour As it was assumed that all mass lost was
gas the mass of liquid out was that measured and the LPR was calculated
using
(mass of liquid out - mass of dissolved gas)LPR =
(total time)(mass of catalyst)
Liquid mass X conversion This is calculated using the formula
mass X conversion =[ (LPR) ] 100 WHSVn(w)
where n = 1 if it was assumed that all mass was lost before the reactor
n = 2 if it was assumed that all mass was lost after the reactor
w is the mass fraction of propene in the feed
Liquid sample composition The liquid product was grouped into 01 igomers
of propene as dimer trimer tetramer etc The liquid composition was
based on the mass percent output the response factors havin~ been set
equal to one It can be used to compare 01 i~omer production rate between
different runs and variations with time in a particular run
65
Gas sample composition This data is expressed in terms of mass X since
all GC response factors have been determined
Apart from the mass balance data all other results could be presented in
graphiCal form as functions of time on stream ~hen the data was plotted
in this wayan average time between two sampling pOints was used Data
was recorded only from the time that the first drop of product was
collected this time being defined as time zero
35 Analytical procedure
351 Gas analysis
Both the feed gas and flue gas were analysed on a Gow-Mac 750p gas
chromatograph whose responses from the detector were monitored by a
Varian 4270 intergrator The packing used for this work was n-Octane
Poracil C in a 55 m glass column with an inner diameter of 4 mm Table
31 shows the typiCal composition of the feed used The GC settings
used together with a typical chromatogram of the feed with its retention
times and response factors are shown in Appendix A as is a discussion
of the calibration procedure
Table 31 Feed Composition
Hydrocarbon MassX
Methane 00
Ethane 09
Propane 20
Propene 78
Iso-Butane 02
N-Butane 02
1-Butene 04
Iso-Butene 01
T2-Butene 01
C2-Butene 01 C5+ 02
352 LiQuid analysis
LiQuid samples were analysed by a Varian 3400 together with a Varian
8000 auto sampler The packing used for this work was 3 3i1 iconOV-lDl
66
on Chromosorb W-HP 100120 mesh in a 3 m long glass column with an inner
diameter of 4 mm The responses from the GC were monitored by the
Varian Vista 401 data system This system could be programmed to give an
integral analysis of the results The GC settings as well as a
discussion of the optimisation and cal ibration procedure used are given
in Appendix A
Due to the complex nature of the liquid products the analysis of the
liquid spectra was difficult To facilitate product analysis it was
decided that the 1 iquid product analysis be based on carbon number
groupings rather than on individual Components The groupings chosen are
shown in Table 32
Table 32 Carbon number groupings used for 1 iquid analysis
Group Range
Monomer (C3 ) C3 -c Dimer (C ) C~ -C7
Trimer (C ) Ca -Ct 0
Tetramer (C t 2 ) Ctt-Ct3
Pentamer (C t ~ ) Ct -Ct
Heptamer (Cta ) Cn -C
Hexamer (C2 t ) C20+
353 Nuclear magnetic resonance
The hydrocarbon functional group distribution of C to Cta propene
oligomerisation products was determined using lH NMR Conventional
methods of spectral analysis for propene 01 igomers were inadequate
because of the great variety of head to tail and tail to tail fragments
generated and because of the greater influence from end groups
As 13C NMR was not available at the time of this work only a partial
analysis of the 1 iQuid products was possible The information thus
obtained was that of the type of proton present primary secondary or
tertiary The characteristic proton chemical shift for the relevant
protons are shown in Table 33 (Galya et a1 bullbull 1985)
67
Table 33 Structure definitions of terms and NMR spectral
positions and area code (Galya et al bullbull 1985)
Species Structure Area
(ppm) Code
Protonated aromatic
Olefinic CH2
Olefinic CH
Aromatic CH
Aliphatic region
or to aromatic CH2
or to aromatic CH3
or to olefinic
CH CH2
or to olefinic
CH3
11 to olefinic
CH CH2
CH2 between
isopropyl end
groups and CHs
Term i na 1 CH3
Internal CH3
and olefinic region_
R-CH=CH2
R-CH=CH-R
ltO~CH2-CH2-R
ltO~CH3
R2-CH-CH=CH-CH2-R
R-CH=CH-CH3
CH3 -(CH2)2 -CH=CH-R
R-CH(CH3 )-(CH2 )2 -CH=CH-R
450-475 L
475-575 M
650-730 N
230-300 A
210-230 B
180-210 C
1 40-1 80 o
100-140 E
092-1 00 F
084-092 G
070-084 H
68
Using the equations developed by Galya et a1 (1985) for the C6 to Cta
oligomerisation products of propene each lH area was first converted to
a carbon area before the percentage of each was calculated
The carbon area of CH3 was calculated using
(Area G + Area 0 + Area B + Area H)CH3 carbon area =
3
and the carbon areas of CH2 and CH were calculated using
(Area E + Area A + Area C) (Area H)CH2 carbon area = --------------------------- + Area F
2 6
Area HCH carbon area = + Area F
3
The degree of branching ie the CH3 to CH2 CH3 to CH and CH to CH2
ratios could be approximated (Ga1ya et al bullbull 1985) using
2middot(AREA G + AREA 0 + AREA B + AREA H)= CH2 3middot(AREA E + A~EA A + AREA C) - AREA H + 6middotAREA F
(AREA G + AREA 0 +AREA B +AREA H)= (AREA H + 3-AREA F)
CH = CH2 3middot(Area E + Area A + Area C) - Area H + 6middotArea F
The above equations will be used to analyse the NMR spectra in this
work
354 TGOTA
Thermogravimetry (TG) involves measuring the changes in sample mass with
temperature using a thermobalance This is a combination of a suitable
electronic microbalance with a furnace and aSSOCiated temperature
programmer The balance is in an enclosed system so that the atmosphere
can be controlled Differential Thermal Analysis (OTA) involves
measuring the difference in the temperature between the sample and a
reference material while both are being subjected to the same
temperature program Both TG (mass loss In wtX) and OTA (temperature
difference between sample and reference material) are recorded as a
function of furnace temperature The furnace used in this work was a
STA-780 Series with a Stanton Redcroft Thermal Analyser The balance was
69
controlled by a Stanton Redcroft Balance Controller while the
temperature in the furnace was controlled by a Stanton Redcroft
Temperature Controller The si~nals were amplified by a Stanton Redcroft
DC amplifier and recorded by a Bondwe11 Personal Computer
In this work 20 m~ of sample was placed in the furnace and the
temperature raised from 40C to 850C at a rate of lOCmin in flowin~
air or nitro~en
355 Water content determination
The water content of the feed was determined by measurin~ the dew point
temperature of the water in the feed usin~ a Panametrics Hy~rometer
ltModel 7000) with an aluminium oxide sensor Approximately 48 h was
needed for the system to stabilise Once this temperature had been
measured the vapour pressure of the water in the feed was determined (at
1 atm) and the mole fraction of water in the feed determined Usin~ the
above procedure it was found that the feed contained approximately 112
ppm (vv) water
356 Distillation
The 1 iquid products obtained from the high pressure reactor runs were
distilled in a glass distillation column shown in Fi~ure 35 to
separate the C from the heavier fractions After the still was filled
up to 3 liters per batch it was placed into a heatin~ mantle and
connected to the column with a Gduick-fit connector Upon heating the
vapours from the still passed via a column packed with berl saddles to a
condenser Here the condensate was either directed back to the column as
reflux liquid (plun~er down) or to the catchpot (plun~er up) as
product This separation was controlled by a solenoid operatin~ a ma~net
fused to the plun~er The solenoid in turn was controlled by a timing
device with which the total cycle time and reflux time could be set The
reflux ratio was then calculated by the ratio of the time the plun~er
was up to the time that the p1un~er was down For all cases the reflux
ratio used was 29 The cut off temperature was set by a thermostat at
the top of the column When the desired temperature was reached power
to the solenoid was discontinued and subsequently the plunger remained
down (total reflux) The cut point temperature used was 6ZC The
coolant used in the condensers was water Dissolved gases did not
condense and were vented to the atmosphere
70
1-+-+----1 5
FIG 35 BATCH DISTILLATION UNIT
71
Key to Fi9ure 35
1 Still
2 Berle saddle column
3 Reflux condenser
4 Magnet at top of plunger
5 Plunger assembly
6 Gas tappin9 point
7 Distillate receptacle
36 Catalyst synthesis
361 Support preparation
The silica-alumina support was received from Kal i Chemie in the form of
4 mm spheres which were crushed in a ceramic ball mill to -500 ~m The
silica to alumina ratio was 91 on a wei9ht basis
362 Impregnation
A previously determined mass of metal salt was dissolved in 500 ml of
distilled water to which 50 9 of silica alumina was added The solution
was boiled under reflux for 1 h with vigorous agitation throughout The
vessel was then opened to the atmosphere and while being a9itated most
of the water boiled off The concentrated solution was transferred to a
ceramic pie dish and placed into an oven at 120C where the remaining
water was evaporated Once the material was completely dry it was
crushed sieved and stored The above was adopted from work by H09an et
a1 (1955) and Holm et a1 (1957)
3621 Nickel concentration
The Quantity of nickel needed to make a catalyst of known metal content
was determined in a separate experiment Using a constant mass of sil ica
alumina but varyin9 the amount of nickel nitrate hexahydrate a loadin9
curve was constructed The synthesis procedure used was that as
discussed above The nickel content of the material was determined usin9 b
atomic a_sorption spectrophotometry The loadin9 Curve is shown in
Figure 36
363 Hom0geneous decompOSition deposition
In this method 45 9 of nickel salt was dissolved in 500 ml ot distilled
water to which 50 9 of silica alumina was added The solution was then
heated under reflux to 100C at which point 25 9 ot urea crystals were
added This was taken to be time zero The solution was then ret1uxed
72
while continuously being agitated for a previously determined period of
time as discussed below Excess water was removed by filtration in a
Buchner funnel and the catalyst washed with 20 volumes of hot (90C)
distilled water per volume of catalyst The catalyst was then dried at
110C in a ceramic pie dish for 12 h before being crushed and stored
The above synthesis procedure was adopted from work done by Van Dillen
et a1 (1977) Richardson and Dubus (1978) and Hermans and Geus (1979)
120 IMP LOADING CURVE
SOG S i 02 I A h 03 ~
SOOml H2O(f) 100
(f)
a L
60 bull
IshyZ 60 CD U
40-1 W
-~ U 20
Z
00
00 100 200 300 400 500 MRSS G
FIG 36 NICKEL CONTENT (MASSJ VS MRSS OF NICKEL NITRRTE HEXRHYDRRTE (GJ
3631 Nickel concentration
The time required to load a desired Quantity of nickel was determined in
a separate experiment All quantities of materials used were as
discussed above but while the mixture was boil ing under reflux samples
of solution (5 m1) were taken at discrete intervals These samples were
than washed and dried in the usual manner and their nickel content
determined using atomic adsorption spectrophotometry In this way the
loading Curve was constructed from which the time required to produce a
catalyst of known metal content could be read Two sets of startins
conditions were used as shown in F1gure 37
73
200 1I=509 Ni(N03h6H20
309 Si02A1203~ (j) 259 (NH2CO (j) 160 600ml H20CI L
bull 120bull
() 45c1 Ni (N03 h 6H20
503 S i 02 A 12 03
253 (NH-z )CO
50Om 1 H-z 0IshyZ 8 U 80
--J W ~
40U - Z
00
00 1000 2000 3000 4000
TIME MIN FIG 37 NICKEL CBNTENT (MRSS) VS TIME (MIN)
364 Coprecipitation
Two solutions were prepared One contained 180 3 of sodium meta silicate
in 1200 ml of distilled water and the other contained 42 3 of aluminium
nitrate nonahydrate and 117 3 of nickel nitrate hexahydrate in 1000 ml
of ~istilled water It was important that the pH of the final solution
was kept in the ran3e of 8 ~ 05 To achieve this caustic soda could be
added to the sodium solution or nitric acid to the solution of the
nitrates In this work 82 ml of nitric acid (70 wtX HN031 was added to
the solutions ot the nitrates The two solutions were mixed in a ~ 1
CSTR while being vigorously agitated and the pH adjusted using 5 9 of
sodium hydroxide in 100 ml of water A 3e1 formed after about 30 sand
was allowed to stand for 1 h This material was then filtered using a
Buchner funnel broken up and dried for 12 h at 110middotC The dried sol id
was washed twice by decantation with water and then washed ~ith six or
seven successive portions of 5X ammonium chloride The ammonium ~ash
involved soaking the catalyst for 1 h at 70C In an excess of solution
which was then drained using a Buchner funnel In thiS way any sodium
held in the sol id was removed by base exchange The catalyst was then
washed with distIlled water and dried at 110C for 12 h before being
74
crushed sieved and stored (Holm 1957) The si1 ica to alumina ratio of
the final catalyst was 91 while the nickel content was 4 wt~
365 Determination of nickel content
To determine the nickel content of the catalyst an accurately weished
sample approximately 025 s was added to 5 ml of hydrof1uric acid in a
teflon beaker The solution was left for 12 h after which 5 m1 of
concentrated sulphuric acid and 5 m1 of distilled water were added This
was again allowed to stand before being made up to 250 m1 in a
volumetric flask In this way the catalyst was broken down into its
individual elements and the nickel contents determined usins the Varian
SpectrAA-30 Atomic Adsorption spectrophotometer
366 Extrudate manufacture
The powder form of nickel oxide silica alumina was found to be too fine
for effective use in the hiSh pressure intergral reactor as it caused an
excessive pressure drop and downstream plugging problems Breck (1980)
suggested the use of an inorganic binder such as kaolinite in the
formation of extrudates This approach was found to be effective if the
Quantity of binder was sreater than approximately 35 wt At lower
binder mass fractions the material could not be extruded
The binding process consisted of mixins the binder with the catalysts to
form a homogeneous paste the amount of water used carefully judged by
visual inspection When the paste had the desired consistency it was
loaded into a previously wetted stainless steel piston and plunger
assembly and extruded onto filter paper The catalyst was then dried at
80C for 12 h
Breck (1980) further suggested that the extrudates be baked at 370C for
12 h to convert the clay to an amorphous binder of considerable
mechanical strength It was however found that this was not necessary as
the extrudates had sufficient strength after drying at 80middotC
75
4 RESULTS
Various types Ot catalyst synthesis procedures were examined These were
homogeneous decomposition deposition (HOD) i mpregnati on (IMP) an d
brietly coprecipitation (SGb as well as the catalytic properties Ot
the silica alumina support (SA) The si1 ica to alumina weight ratio used
throughout was 9 to 1 The criterion whereby the activity Ot the
catalyst was measured was the 1 iQuid production rate (LPR) The
selectivity of the catalyst expressed in terms Ot massX 1 i~uld
composition gave an indication ot the relative amounts Ot the various
01 igomers formed
The reaction conditions used were a temperature of aoc and a pressure
of 40 atm unless otherwise stated The catalyst size fraction used was
-500 IJm which was made into 110 inch extrudates using 35 wt~ kaol inite
as binder
As mentioned previously the feed used was a 41 mixture ot
propenepropane with trace impurities of C4 and C2 hydrocarbons unless
otherwise stated The exact composition ot the feed is shown in Table
31
The reaction conditions used in all experiments are summarised in Table
41 The WHSVt and WHSV2 were calculated assuming the mass loss occurred
before the reactor and after the reactor respectively in the torm of
gas For the purpose of plotting the results it was assumed that all
mass was lost betore the reactor ie bull ldHSVt was used in all the
figures
41 Reproducibil ity of Data
Two runs were carried out under identical conditions Ot temperature
pressure and WHSV The catalyst used in both runs was an HOD type
catalyst with a nickel content of 15 wt~
Figure 41 shows the LPR for each run as a function of time It can
clearly be seen that the largest discrepancies occurred during start-up
76
Table 41 Reaction data
CommentCode Nickel Press WHSVt (wU) (atm) (ggh)
HDD-1 15 80 40 42 45 HDD-2 1S 80 40 53 56 Reproduc i b i 1 ity
HDD-3 15 80 40 52 56 Reproducibil ity
HDD-4 15 80 40 51 55 Wet feed
HDD-5 15 80 40 47 48 Regenerated HDD-4 HDD-6 15 200 40 49 55 Temp runaway
HDD-7 15 80 40 54 56 Regenerated HDD-6 HDD-8 15 150 40 43 47 HDD-9 15 210 40 66 73
HDD-10 22 80 40 50 55 HDD-ll 72 80 40 42 47 HDD-12 117 80 40 49 52 HDD-13 113 SO 40 54 57 HDD-14 113 80 40 108 117 HDD-15 113 80 40 116 132 HDD-16 117 80 20 67 74 HDD-17 117 80 50 50 52 HDD-1S 15 aO200 40 55 LiQuid feed (C )
HDD-19 15 80 40 SS li QU i d gas f~ed
HDD-20 15 200 40 77 liquid gas feed
IMP-1 OS SO 40 47 4S IMP-2 19 SO 40 53 56 IMP-3 22 SO 40 4S 49 IMP-4 46 80 40 33 39 IMP-5 63 SO 40 49 54 IMP-6 71 80 40 44 48
IMP-7 9S 80 40 52 55 IMP-S 98 SO 20 59 66 IMP-9 9S 80 50 50 53
SG-1 15 SO 40 52 55 SG-2 15 80 20 59 61 SG-3 30 80 40 37 41
SA-1 80 40 40 41 SA-2 150 40 62 63 SA-3 200 40 35 42
77
ceOE NIOll) TR( middotC) P(ATHI WHSV 600 J=HOO-2 1 5 80 40 53
()=HOO-3 I 6 80 40 62
600
300 bull
e 0- 200
bull
1 00
000
00 40 60 80 100 120
TIME H FIG 41 LIQUID PRSDUCTISN RRTE (GHGJ VS TIME (H)
J=O I MER )()=TR I HER HOO-2 =TETRAHER
lUOO
~ +=PENTAHER (j)
X=OI HER )(j) 800 ~=TRIHER HOO-3 IT +=TETRAHER L )( =PENTAHER
bull 600 Il )((j)
o 0- L 400 o U
bull o 200
e
IJ RI00
00 20 40 60 80 100 TIME H
FIG 42 LIOUID CSMPSSITIBN (MRSS) VS TIME (Hl
78
Once steady state had been obtained approximately after 4 h on stream
conversions were similar and the reproducibility acceptable
Figure 42 shows selectivity as a function of time on stream Here it
can be seen that the dimer trimer tetrameter and pentamer were
produced in similar Quantities throughout the two runs
It was thus concluded that at steady state adequate reproducibil ity was
attained with respect to both selectivity and LPR
42 Nickel content
In the case of HOD type catalysts the nickel content was varied from
15 wtX to 117 wt It can be seen from Figure 43 that while the LPR
differed from run to run this variation was due to WHSV differences
and no trend with increasing nickel content was observed The LPR
remained between 3 and 4 grams of product per gram of catalyst per hour
over the range of nickel loadings examined The selectivity of the
catalyst as shown in Figure 44 was also found to be essentially
independent both with respect to nickel content and time on stream
although a sl ight decrease in dimer Yield was observed ~ith increasing ltshy
n lkel content
In the case of IMP type catalysts the nickel content was varied from
10 wtX to 98 wtX An accurate statement about the effect of nickel
content on the activity of IMP type catalysts could not be made due to
differences in the WHSV The selectivity as a function of both time on
stream and nickel content is shown in Figure 46 The catalyst with 08
wtY nickel exibited the greatest selectiVity towards trimers and the
dimer Yield inCreased sl ightly with increasing nickel content No other
marked changes in the selectivity were observed as a function of nickel
content or time on stream
43 Effect of ressure
In Figure 47 the lPR vs time on stream is shown for an HOD type
catalyst with a nickel content of 113 wtX at three different pressures
It can be seen from this figure that as the pressure was decreased from
50 atm to 20 atm the lPR remained constant although the WHSV was higher
at lower pressures This suggests that the activity c~ the catal~sts
dropped with decreasin9 pressure The selectiVIty shown in FI9ure 43
as a function of time on stream and pressure was also dependent ~n the
pressure used It Can be seen from Figure 4S that at 20 atm propene
dimer accounted for approximately 70 wt of the 1 iQuid pr0Juct ~hile at
79
600
o 500
r 400o
bull 300
a
bull CL 200
-1 1 00
000
ceOE Il =HOO-J ()=HOO-I0 4 =HOO- I I +=HOO-12
NI(WTtJ 1 5 22 72 11 7
TR bullC) P(ATMI WHSV 80 40 42 80 40 50 80 40 42 80 40 49
00 20 40 60 80 100 TIME H
FIG 43 EFFECT OF NICKEL CONTENT (MASS) ON
1000
~ (f)
(f) 800 a L
bull 600 (f)
o CL L 400 o U
o 200
00
LIQUID PRODUCTION RATE (GHGl HOD
1l0 I MER l()=TRIMER 4 H eN STREAM 4TETRAMER +PENTAMER XOIMER l~TR[MER 8 H eN STRERM TETRAMER ~ PENTRMER
$lt ~ ~ ~
- - bull ~ J shy
00 20 40 60 80 100 120
NICKEL CONTENT MRSSi FIG 44 EFFECT OF NICKEL CBNTENT (MASS) ON
LIQUID COMPOSITIBN (MRSS) HOD
I
o
o
bull a
bull CL
bull
6middot00
500
400
300
200
ceOE ll=IMP-l ()=INP-2 = I MP-3 +=IMP-4 X=IMP-5 0= INP-6 P=IMP-7
NI(HTI) 08 t9 22 46 63 71 98
TR( middotC) 80 80 80 80 80 80 80
80
P(ATNI 40 40 40 40 40 40 40
HHSV 47 53 48 33 49 44 52
000
00 40 60 80 100 120 TIME H
FIG 45 EFFECT BF NICKEL CBNTENT (MASS) BN LI QU I D PRBDUCT IBN RATE (GHG l IMP
1000
~ (j)
(j) 800 a L
bull 600 (j) (2]
CL L 400 (2]
U
o 200
00
Il=DIMER ()=TR I MER =TETRRMER +=PENTAMER X=Dl MER0=TR IMER P=TETRRMER ~=PENTRMER
~- ~ ~ ~======~
~ ~ JlJl1 -l
) 4 H aN STRERM
1 8 H aN STREAM
00 20 40 60 80 100NICKEL CBNT MRSSi
FIG 46 EFFECT BF NICKEL CeNTENT (MRSS) BN LIQUIDCOMPOS I T I eN (MRSSi) IMP
81
o
600
500
ceDE Il=HDD-16 e)=HDD-13 AHDD-17
NI(WTZ) 117 113 117
TR( C) 80 80 80
P(RTMI 20 40 50
WHSV 67 54 50
r 400 o
bull bull 300
0
bull Q 200
000
00 20 40 60 80 100
TIME H FIG 47 EFFECT OF PRESSURE (RTM) ON LIQUID
PRODUCTION RRTE (GHG) HOD
1000
~ en en 800 a 2
bull bull 600
en ~ Q
2 400 ~ U
bull (3 200
00
Il =0 I MER )e)=TR 1 MER 4 H eN STRERM A=TETRRMER +=PENTRMER X=D I MER ~=TRIMER H 8N STREAMI 8 +=TETRRMER X =PENTRMER
~ e -0
-=+
=
Ii if
100 200 300 400 500 600
PRESSURE RTM FIG 48 EFFECT OF PRESSURE (RTM) ON LIQUID
COMPOSITION (MRSS) HOD
82
50 atm the liquid product Contained only 50 wt~ dimer The observed
shift to li~hter products with decreasin9 pressure is consistent with
thermodynamiC predictions althou9h increasin9 the WHSV and hence
decreasln9 the contact time would result in the same shift in product
spectrum
In the case of an IMP type catalyst containin9 98 wtX nickel the LPR
as well as the selectivity were very sensitive to the pressure used The
LPR at three distinct pressures is shown in Fi9ure 49 as a function of
time on stream It can be seen that at 20 atm the catalyst rapidly
deactivated and was practically inert after 7 h on stream At the other
pressures examined ie bullbull 40 and 50 atm no difference in the LPR was
observed The selectivity of the catalyst is shown in Fi9ure 410 as a
function of pressure At 20 atm the 1 iquid product contained
approximately 30 wt~ dimer which inCreased to 67 wtl at 40 atm dropping
to 62 wt~ at 50 atm This trend althou9h opposite to that observed for
HOD type catalysts is in ailreement with the data reported in the
literature (Takahash i et a 1 bullbull 1969)
The LPR of a SG type catalyst with a nickel content of 15 wtr is shown
in Fiilure 411 at two distinct pressures At 40 atm the LPR was
comparable to that of HO~ and IMP type catalysts while at 20 atm the
catalyst was totally inert The selectivity of the SG type catalyst at
40 atm differed markedly from that of an IMP and HOD type catalyst In
that the liquid not only contained a larile percentage Ot dimers (40 wt~)
but also an equally larile percentage of trimers
44 Bed temperature profile
Before any statement as to the effect of temperature could be made the
temperature throughout the bed had to be constant and not fluctuate
excessively durin9 a run
In Fiilure 413 the temperature profile through the entire reactor is
shown at 4 discrete times ~urin9 a run The catalyst bed started at
position 4 and extended for 172 em down the reactor to position 8 In
this re9ion of the reactor viz bullbull over the catalyst bed a temperature
deviation from the set point of not more than 4C was observed at th~
times shown In FI9ure 414 ~he temperature fluctuations with time were
plotted at positions 4 6 and 8 From this figure it can be seen that
the amplitude of the temperature fluctuations with time were 4C for
position 4 and 6 and 3C for POSition 8 It can thus be concluded that
at aoc the temperature throu~hout the bed and over the period of the
83
600 ceOE Il =I HP-8
N I ( WT ) 98
TRIC) 80
PIATHI 20
WHSV 59
() =I MP-7 98 80 40 52 =lHP-9 98 80 50 50
cJ 500
- I - 400 cJ
bull 300
0
bull 0 200
bull
000
0middot0 20 40 60 80 100
TIME H FIG 49 EFFECT BF PRESSURE (ATM) BN LIQUID
PRBDUCT IBN RATE (GHG) IMP
Il=OIMER 11000 ()=TR 1MER 4 H 6N STRERM 4I=TETRRMER
~ +=PENTRMER (j)
(j) 800 IT L
bull 600
(j) ()
0 L 400 ()
U
bull (3 200
00
100 600
FIG 410 EFFECT SF PRESSURE (ATM) BN LIQUIDCBMPBSITIBN (MRSS) IMP
~---l--_--1-+
200 300 400 500
PRESSURE RTM
84
600 ceDE Nt (WT J TR ( bull C) PlATM) WH5V [J =5G-1 1 5 80 40 52 ()=SG-2 I 5 80 20 59
CJ 500
- I - 400 CJ
bull 300
Ct
bull D- 200
-J 1 00
~-----elE9----egt000
00 20 40 60 80 100
TIME H FIG 411 EFFECT eF PRESSURE (RTM) eN LIQUID
PReDUCTIeN RRTE (GHG) SG
600 [J=O IMER ()=TR I MER ~=TETRAMER
~ +=PENTAMER(J)
(J)
IT L
(J)
~ CL L ~ U 200
~~------~A----~____A_____________6 o
400
00
00 20 40 60 80 100
TIME H FIG 412 LIQUID CBMPBSITIBN (MRSSJ VS TIME (HJ
RT 40 RTM SG
85
1000 Il=TEMPERATURE AFTER ~=TEMPERATURE AFTER A=TEMPERATURE AFTER +=TENPERATURE AFTER
11 H ~N STREAM 35 H ~N STREAM 60 H BN STREAM 93 H eN STREAM
U 900
W 0 800 =)
I shyCI 0 700 W (L
L W I- 600
500
PBSITIBN Z FIG 413 BED TEMPERATURE PRBFILE (tC) VS
PBSITIBN (Z) SET PBINT 80C SG-1
00 10 20 30 40 50 60 70 80 90 100
1000
U 900
Il=TEMPERATURE FLUCTUATleNS AT Z=4 ~=TEMPERATURE FLUCTUATUINS AT Z=6 A=TEMPERATURE FLUCTUATI~NS AT Z=8
W 0 800 =)
I shyCI 0 700 W (L
L W I shy 600
500
20 40 60 8000 100 TIME H
FIG 414 BED TEMPERATURE FLUCTURTIBNS (tC) VS TIME (H) SET PBINT 80C SG-l
86
run was controlled accurately enough to examine the effect of reaction
temperature
In Figure 415 the temperature profile through the bed is shown for 3
different times during a run at 210middotC During this run from positions 4
to 7 ie bullbull over 75 of the catalyst bed the temperature deviation
from the set point was less than SmiddotC at the times shown while the
temperature at position 8 was approximately 10degC below that of the rest
of the bed In Figure 416 the temperature variation with time at 3
different positions in the bed is shown Excluding the start-up period
the ampl itude of the temperature fluctuations with time at positions 4
and 6 was 3C while the amp] itude of the temperature fluctuations at
position 8 although approximately 10degC below the set point was 2middotC
Thus although a deviation from the set point existed at 2l0middotC the
profile did not change markedly with time on stream
441 Effect of temperature
The LPR for an HOD type catalyst with a nickel content of 15 wt~ is
shown In Figure 417 as a function of time on stream at 4 different
temperatures It Can be seen from this figure that at 80degC and 40 atm
ie bull when the system was In the I iquld phase the LPR was higher than
when the system moved into the vapour phase As the temperature was
raised from BOdegC to lSOdegC a 50~ decrease in LPR was observed while the
WHSV was lower by 18 Upon raising the temperature to 200degC a Further
drop In LPR of 10~ was recorded although the WHSV was higher by 14~ At
210degC the high WHSV used makes a meaningful4 comparis$on impossible
However from the recorded LPR it can be concluded that the activity of
the catalysts decreased further
Figure 418 shows I iquid composition as both a Function of time on
stream and temperature Increasing the temperature and moving into the
vapour phase caused a dramatic drop in the dimer yield and an Increase
in trimer yield IncreaSing the temperature still further resulte~ In
the dimer recovering until at 210middotC dimers and trimers were formed in
equal Quantities
As at higher temperatures ie bull above IS0degC at 40 atm Bil iea aluml~a
exhibits catalytiC properties the relationship between its activit and
temperature was also examined In Figure 419 the LPR as a function of
time on stream IS plotted For SA at 3 different temperatures R~ducln9
the temperature Fr~m 200C to lS0C resulted In the maximum activity
87
220
U 210 po
wa 200 =gt l-CC a 190 W a L W I- 180
170
~=TEMPERATURE AFTER 14 H aN STREAM ~=TEMPERATURE AFTER 37 H aN STREAM amp=TEMPERATURE AFTER 61 H aN STREAM
00 10 20 30 40 50 60 70 80 90 100 PBSITIBN Z
FIG 415 BED TEMPERATURE PROFILE (C) VS POSITION (ZJ SET POINT 210C HDD-9
230
U 220 po
wa 210 =gt l-CC 0 200 W a L w I- 190
~=TEMPERATURE FLUCTUATlaNS AT Z=4 ~=TEMPERATURE FLUCTUATUINS AT Z=6 amp=TEMPERATURE FLUCTUATlaNS AT Z=8
180
20 40 60 60
TIME H FIG 416 BED TEMPERATURE FLUCTUAT IONS ( C)
VS TIME (HJ SET POINT 210C HDD-9
00
88
600
CJ 500
400CJ
bull bull 300
0
bull 0- 200
--J 1 00
000
ceDE []=HDD-2 ()=HDD-8 amp=HDD-6 +=HDD-9
N (lH) 1 5 1 5 1 5 1 6
TR( middotC) P(ATM) I1HSV 80 40 53 150 40 43 200 40 49 210 40 66
00 20 40 60 80 100 120 TIME H
FIG 417 EFFECT BF TEMPERRTURE (Cl BN LIQUID PRBOUCTIBN RRTE (GHGl HOD
600
~ (f) (f)
a ~
400 bull
(f)
~ 0shy~ ~ U 200
bull
[]=D IMER 1()=TRIMER 4 H eN STREAM amp=TETRAMER +=PENTAMER X=DI MER 10=TRIMER 8 H eN STRERM i=TETRAMER j =PENTAMER
_----~=i
00
600 900 1200 1S00 1800 2100 2400 TEMPERRTURE C
FIG 418 EFFECT BF TEMPERRTURE (Cl BN LIQUID CBMPBSITIBN (MRSS) HOD
600
89
C) 500
- r - 400 C)
bull 300 ~
Q 2 )0
bull
---l 1 00
000
TR ( bull C) P(ATH) HHSV BO 40 40 150 40 62 200 40 35
ceOE fI =SA-l ()=SA-2 ~=SA-3
N[(HTZl 00 00 00
~e
tI eJ
e e e)
00 20 40 60 80 100 120 TIME H
FIG 4 bull 19 EFFECT BF TEMPERATURE ( bull C ) BN LIQUIDPRBOUCTIBN RATE ( GHG) SA
600
0 (f) (f)
a I
400 (f)
~ Q I ~ U 200
C2I 1--1
---l
00
fI=O IMER )()=TRIHER 4 H aN STREAM ~=TETRAMER +=PENTRMER
+ +
600 900 1200 1500 1800 2100 2400 TEMPERRTURE bull C
FIG 420 EFFECT I3F TEMPERATURE ( C) BN L I QU I 0 CI3MPI3SITII3N (MASS) SA
90
falling by approximately 72X while the WHSV increased by 5S~ At aoc the catalyst was inert At 200C the preferential product of sil ica
alumina was propene trimer which can be seen in Figure 420 where
1 iQuid composition is plotted against temperature Decreasing the
temperature to lSOC caused the trimer yield to increase at the expense
of the dimer Decreasing the temperature further resulted in the
catalyst becoming inert and so no 1 iQuid data was available
45 Lifetime and selectivity
The 1 ifetimes of HOD IMP SG and SA type catalyst were examined as well
as their selectivity in long runs In Figure 421 the LPR and WHSV as a
function of time are plotted for an HOD type catalyst with a nickel
content of 15 wt From this it can be seen that the LPR fluctuated
with time due to WHSV fluctuations Upon comparing points with eQual
WHSV it was found that the conversion had dropped by 12 after 100 h on
stream The selectivity with time on stream is shown in Figure 422
Selectivity chansed sl ightly during the run ie bull the Quantity of dimer
formed increased by 25~ after 120 h at the expense of the tetramer and
pentamer
In Figure 423 the LPR as a function of time is plotted for an IMP type
catalyst with a nickel content of 19 wt After a h on stream the
activity of the catalyst dropped by 24 of its initial value The
selectivity shown in Figure 424 remained approximately constant with
the dimer yield increasing sl ightly at the expense of the tetramer and
pentamer over the period of the run
In Figure 425 the LPR as a function of time is plotted for an SG type
catalyst with a nickel content of 15 wtx After 10 h on stream the
catalyst showed no signs of deactivation The sel~ctivlty shown as a
function of time in Figure 426 also showed no changes over this
period ConseQuentely from the available data no conclusive statement
with respect to the 1 ifetime of this catalyst could be made
The 1 ifetime of a SA type catalysts was examined at a temperature of
200C and the LPR as a function of time is shown in Figure 427 Upon
comparing points with eQual WHSV it was found that the ConverSion had
dropped by 24 over a period of 75 h As shown in Figure 428 10
significant change occurred in the selectivity over the perlo~ of this
run
91
700
6(10 o I 500
o 400
bull a 3 00
bull 0
200
1 00
000
CODE NI(WT~) TR(C) P(ATM) HDD-3 15 80 40
~=HEIGHT HeURLY SPACE VELeCITY ~=LIQUIO PReOUCTleN RATE
WHSV 52 700
600
600
400
0
I 0
300
200
gt (j)
I 3
100
000
00 200 400 600 800 1000 1200
TIME H FIG 421 LIQUID PReDUCTIeN RRTE (GHGJ RND WEIGHT
HeURLY SPRCE VELeCITY (GHGJ VS TIME (H)FeR HDD-3
800
~ (j) (j)
IT L
600
bull
(fJ
~
0 L
400
~ U
bull 200
o
~O IMER ~=TR IMER amp=TETRAMER +=PENTAMER
+
FIG 422 LIQUID ceMPeSITIeN (MRSS) VS TIME (H) FeR HDD-3
92
700
600 CJ
r 500
CJ 400
bull 0 300
bull 0
200
t 00
000
CODE NI(WT~) TR(JC) P(ATM) WHSV IMP-2 19 80 40 53
m=HEIGHT HeURLY SPACE VELeCITY ~=LIQUIO PReOUCTleN RATE
er----El---f9----et-_-poundJ
700
600
600 CJ
r 400 shy
CJ
300 gt
(J)
r 200 ~
t 00
000
00 20 40 60 60 100 120
TIME H FIG 423 LIQUID PRBDUCTIBN RRTE (GHG) RND WEIGHT
HBURLY SPRCE VELBCITY (GHGJ VS TIME (H)FBR IMP-2
CL
93
700
600 cJ shyc 500 shycJ
400 0 300
200
I 00
000
CODE SG-1
NI(Wn) 15
TR(C) eo
P(ATM) 40
WHSV 52 100
rn=WEIGHT HeURLY SPACE VELaCITY ~=LIQUID PReOUCTlaN RATE 600
-eJ 500
400
cJ shyc shycJ
300
200
gt U)
c 3
100
000
00 20 40 60 80 100
TIME H FIG 425 LIQUID PRSDUCTIBN RATE (GHGl AND WEIGHT
HBURLY SPACE VELSCITY (GHGJ VS TIME (HlFeR SG-1
600
~ U) U)
a L
400 bull
U)
~ CL L ~ U 200
bull
rn=D 1MER ~TRIMER
41 =TETRAMER +=PENTANER
amp~----------A------______A__________________~bull
+
Oor ~-~I~------~I--------~I-------+I-------+I-------+I~
00 20 40 60 80 100
TIME H FIG 426 LIQUID CBMPSSITIBN
FeR SG-1 (MASS) VS TIME (H)
94
600 CODE NIIWTX) TRIC) PIATN) WHSV SA-3 200 40 35
m=WEIGHT HeURLY SPACE VELeCITYo 600 ~=LIQUIO PReOUCT6N RATE shyI - 4 00o
bull 300
et
bull CL 200
~ 100
000
00 20 40 60 60 100 120 14 0
TIME H FIG 427 LIQUID PRBDUCTIBN RATE (GHGl AND WEIGHT
HBURLY SPACE VELBCITY (GHGJ VS TIME (HJFBR SA-3
600
500
0 400 shy
I shy0
300 gt (f)
200 I s
1 00
000
600
~ (j)
(j)
IT L
400 (j)
o CL L o U 200
o
m01MER ~TR IMER 6=TETRAMER +PENTAMER
___-tl----------~I-----------r--~V I I
E9 m(9 E9 u El
i I I00 20 40 60 80 100
TIME H FIG 428 LIQUID CBMPBSITIBN (MRSS) VS TIME (H)
FBR SR-3
00
95
46 Effect of WHSV
The effect of the WHSV on the LPR and selectivity was examined In
Fi~ure 429 the LPR of an HOD type catalyst with a nickel content
ranging from 113 to 117 wt~ is shown at four different WHSV Figure
429 shows that increasing the WHSV increased the LPR and the rate of
deactivation
In Fi~ure 430 the selectivity as a function of both time and WHSV is
shown This figure demonstrates how increasing the WHSV and consequently
decreasing the conversion resulted in a higher dimer content of the
liquid product at the expense of the tetramer and the pentamer The
quantity of trimer was not affected by changing WHSV in the range
examined
47 Effect of temperature runaway
The effect of operating the catalyst at 80C was examined after
operating it at 200middotC The aim of this experiment was to establ ish
whether the activity or selectivity of the catalyst when rerun at 80C
was affected in any way by operating it first at a temperature higher
than 80middotC Between the two runs the catalyst was calcined in the normal
manner
In Figure 431 the LPR of an HOD type catalyst with a nickel content of
15 wtX at 200C is shown as a function of time on stream After 11 h
the run was stopped and the catalyst calcined in the -normal manner and
rerun at SOmiddotC The LPR as a function of time at aodegc IS shown In Figure
431 together with the data obtained using a fresh catalyst at SOmiddotC It
can be seen from this figure that usin~ the catalyst first at ZOOC did
affect the activity and from Figure 432 the selectiVIty causing a drop
in LPR of 17X at steady state and a shift to 1 ighter products at the
expence of the tetramer when the catalyst was re-used at 80middotC
4S Effect of water contamination
The aim of thIS experiment was to establ ish the effect of water on the
activity and selectivity of an HOD type catalyst with a nickel content
of 15 wtX (HOD-4) and to determine whether the catalyst could be
regenerated to its normal activity and selectiVity For this ~urDose the
feed containing 112 ppm (vv) water was not dried bef0re ent~rln9 the
bed and the activity with time was recorded ~nder normal running
CL
96
caOE N I (1HZ J TR ( middotc I P(ATNI HHSV1000 (l =HOO-I 2 I I 7 80 40 49 ()=HOO-13 II 3 80 40 54 t =HDD-14 It3 80 40 108 +=HOO-tS 1t 3 80 40 I I 6
cJ 800
I
cJ 600
a 400
bull 200-J
000
00 20 40 60 80 100
TIME H FIG 429 EFFECT BF WHSV (GHG) BN LIQUID
PRBDUCTIBN RRTE (GHG) HOD
800
~ (j) (j)
a 600 L
(j)
~ 400 CL L ~ U
bull 200 C3
00
(l=D I MER )()=TRIMER 4 H eN STREAM t=TETRAMER +=PENTRNER
X=OINER Ie=TRIMER 8 H aN STRERM TETRRMER ===----shyX=PENTANER
~~e-------------------~i~~
20 40 60 80 100 120 t 40WHSV GHG
FIG 430 EFFECT BF WHSV (GHG) BN LIQUIDCBMPBSITIBN (MRSS) HOD
140
97
600
o 500
bull 300
0
bull CL 200
-1 1 00
000
ceDE N I ( loin) TR( C J PlATH) WHSV Il =HDD-6 15 200 40 49 ()=HDO-7 15 60 40 54 AHDD-2 15 60 40 53
00 20 40 60 60 100 120 14 0
TIME H FIG 431 EFFECT BF TEMPERATURE RUNAWAY BN LIQUID
PRBDUCTIBN RATE (GHGl HDD-6 AND HDD-7 CBNSECUTIVE RUNS USING SAME CATALYST
700
~ (f) 600 (f)
IT L 500
bull
(f) 400
cJ CL L 300
cJ U
200
bull CI 100 -1
00
Z=D 1HERIiOIMER 1 XOIMER 1 ()TRIMER HOO-6 ~=TRINER HDD-7 Y=TR I MER HDD-2 ATETRRNER +=TETRRHER )(TETRRHER
+=PENTRNER ~=PENTRNER If =PENTRHER 1 Z~
~ eEl egt
Gshy
E9 fl
)lt~~ V ~
t shy amp
)IE ~ )(
+~ of f -+ J~ R
20 40 60 80 100 12000
TIME H FIG 432 EFFECT BF TEMPERATURE RUNRWRY BN LIQUID
CBMPBSITIBN (MASS)
98
conditions It can be seen from Figure 433 how rapidly the catalyst
deactivated becoming totally inert In 4 h The selectivity as shown in
Figure 434 was also affected with the dimer rapidly becoming the main
product
Upon regenerating and operating the catalyst in the normal manner (HOOshy
5) the catalyst showed an initial LPR higher than in HDD-l due to a
high WHSV which rapidly dropped to that of a catalyst in a dry run For
comparison the LPR vs time relation for a dry run using a fresh catalyst
is also shown in Figure 433 (HOD-l) With regard to selectivity no
difference was observed for the regenerated or normal catalyst as shown
in Figure 434
In this experiment the -69C fraction (dimer) from previous runs was fed
through the reactor at 40 atm and 30C Once the catalyst had
deactivated the temperature was raised to 200C and the run continued
The catalyst used was a HOD type catalyst with a nickel content of 15
wt~ The feed composition was 994 wt~ Cb and 06 wt~ Cl
To monitor the activity of the catalyst throughout the run the LPR was
calculated using
LPR = (mass Cn-b in - mass of Cn-b out) ltI) (time)(mass of catalyst)
while the Conversion was calculated using
Mass~ Cn_b converted =[mass Cn- in - mass ou t ) 1bull 100 ltII)Cn
mass Cnab In
It can be seen from Figure 435 that at aoc the catalyst rapidly lost
its activity This also became apparent from the changes in the 1 iquid
composition with time on stream as shown in Figure 436 Upon raising
the temperature to 200C the catalyst regained activity the conversion
beIng 64~ after 27 h on stream The composition of the 1 iQuid product
also changed markedly the most abundant specIes in the product being a
Cb dimer (CI2) with trace Quantities of Cl and trimer (CIS)
410 Liquid and gas feed (C + C3)
In this case dimer (C ) and monomer (el) were fed simultaneously to the
reactor The ratio of Cb to C3 was held at 11 9 C9 Cl throughout Two
runs using the same catalyst were carried out one at 80C and one at
I
99
600 CeDE NJOHI) TR( middotC) PlATH) HHSV FEED Il=HDD-4 15 80 40 51 HET ~=HOO-5 15 80 40 47 DRY AHOD-I 15 80 40 42 DRY
CJ 500
shy
shy 4 00 CJ
bull 300
0
bull (L 200
1 00
000
00 20 40 60 80 10middot0
TIME H FIG 433 EFFECT BF WRTER BN LIQUID PRBDUCTIBN RRTE
(GHGJ HDD-5 REGENERRTIBN RFTER HDD-4
800
~ (J) (J)
(I 600
(J)
~ 400 (L
L ~ U
bull 200
o
[]=o 1MER 1 ~=TR I MER HOO-4 1 TETRAMER +=PENTAMER
X=OIMER ]~=TRIMER HOO-S +=TETRAMER X=PENTAMER
Zo I MER 1 Y=TRIMER HOO-l )( = TETRAMER =PENTAMER
~ eiICJ)
P=~ if --- I~
Igt(
~
~~ j
)(
00 20 40 60 80 100
TIME H FIG 434 EFFECT SF WRTER CBNTRMINRTIeN eN
LIQUID CBMPeSITIBN (GRHGR1 HOD
00
100
CODE NI (Wa) TR ( C ) P(ATM) WHSV 800600 HDD-18 15 801200 40 55
l =CaNVERS 1aN ~ ~LtQUtO PRaOucTtaN RATE (j)D
(j) r 600 600 a
200degC
L D
bull Z 400 a
bull 400
0 (j)
a CL
bull w gt200bull 200 Z
--J a
000shy
u
00
00 20 40 60 60 100
TIME H FIG 435 LIQUID PRBDUCTIBN RRTE (GHG) RND
CBNVERSIBN (MRSS) VS TIME (H) LIQUIDlaquo69C FRRCTIBNl FEED HDD-18
1000
~ (f)
(f) 600 IT L
bull 600
(f)
a CL L 400 a u
C3 200
l =0 t MER ~=TR t MER TETRAMER +=PENTAMER X=HEXRMER
20 40 60 6000 100
TIME H FIG 436 LIQUID CBMPBSITIBN (MRSS) VS TIME (H)
LIQUID laquo69C FRRCTIBNJ FEED HOD-IS
101
200middotC The catalyst a~ain an HOD type catalyst with a nickel content of
15 wt~ was activated in the normal manner between the runs
To monitor the monomer utilization throu~hout the run the equations
shown above for LPR and conversion with n=3 were used ie a propene
balance was done assumin~ no mass loss The results are shown in Fi~ure
437 for the run at BOdegC and in Fi~ure 439 for the run at 200degC
Figure 438 shows that at eoc the activity rapidly declined as the
composition of the 1 iQuid product rapidly approached that of the Co
feed At 200middotC however as shown in Figure 440 the 1 iQuid composition
was steady and contained about 40 wtY dimer after 8 h on stream
411 TGOTA
In Figure 441 the TO and OTA Curves for a fresh HOD type catalyst with
a nickel content of 117 wt~ are shown The catalyst was held under
flowin~ nitrogen throughout
Up to SOOC an exothermic peak probably indicating the removal of
chemisorbed water was recorded At approxlmately 530C the Curve
became endothermic probably due to the decomposition of the Ni-Urea
complex to form NiO
From the TO Curve It can be seen that the intermediate species formed
were not stable until the final endothermiC event at 530middotC Beyond this
temperature the TO Curve levelled out indicating that a stable species
was formed The overall mass loss from the catalyst was 14 wtY
To determine the quantity of water that the catalyst adsorbs a
oreviously calCined catalyst was exposed to air and the TG and OTA
curves were subsequently recorded The results of this run using the
same catalyst as before are shown in Figure 442 This figure shows a
broad exothermic peak up to 600degC and an overall mass loss of 367 wtX
To establ ish the quantity of hydrocarbons adsorbed on the catalyst the
TG and OTA curves were recorded for a catalyst after it had been used
for the 01 igomerisation of propene The catalyst ysed was an HO~ type
catalyst with a nickel content of 117 wtX The catalyst was exposed to
flowing air while recording the TG and OTA Curves The r~sults are shown
In Fi9ure 443
102
00 20 60 TIME H
FIG 437 LIQUID PRODUCTION RATE (GHGJ AND CONVERSION (MASS) FOR PROPENE VS TIME (H) LIQUID laquo69C FRACTION)AND GAS FEED HDD-19
600
bull 300
a
bull 0 200
bull J 1 00
000
CODE NI(Wn) TR(C) P(ATM) WHSV HDD-19 15 80 40 88
~=PRePENE ceNVERSlaN ~=LIQUIO PR60UCTIeN RATE
600
~ 600 (j)
(j)
IT 400
Z
300 ~
(j)
a 200 w
gt z ~ 100 u
00
1000
~ (j)
(j) 800 a
600bull
(j)
~ 0 400 8 U
bull Cl 200 -J
00
~OIMER ~TR IMER l =TETRRMER +=PENTRMER
00 20 40 60 TIME H
FIG 438 LIQUID CGMPOSITION (MASS) OF ENTIRE LIQUID EFFLUENT VS TIME (H) LIQUIDlaquo69C FRACTION) AND GAS FEED HDD-19
103
bull 200 -1
gt200 Z
o U
CODE NI(WTX) TR(C) P(ATMl WHSV 800800 HDD-20 15 200 40 77
m=PRBPENE CBNVERSIBN RATE~=LIQUIO PRBOUCTIBN
~ o (f)
(f)- 600 600 I IT - L o
Z 400 0bull 400
a (f)
bull a 0 w
000 00
00 20 40 60 80 100
TIME H FIG 439 LIQUID PRBDUCTIBN RATE (GHGl AND
CBNVERSIBN (MASS) FBR PRBPENE VS TIME (H) LIQUID laquo69C FRACTIBN)RND GAS FEED HDD-20
II=OIMER600 ~=TR I MER to =TETRAMER +=PENTANER X=HEXANER ltgt=HEPTAttER
bull
(f)
o 0 L o
400
U 200
-00
00 20 40 60 80 100
TIME H FIG 440 LIQUID CBMPBSITIBN (MASS) BF ENTIRE
LIQUIO EFFLUENT VS TIME (H) LIQUIDlaquo69C FRACTIBN) RND GRS FEED HDD-20
104
u
-w u z ~ W 0 -(j)W
(j)U U 0 I 0
(j) (j)w
0 4 =gt x IshyltC 0 w Q x W Ishy
200 400 600 800
TEMPERATURE C
FIG 441 MASS lOSS (~) AND TEMPERATURE DIFFERENCE (OC) VS
FURNACE TEMPERATURE (OC) FOR A FRESH CATALYST 20 m~ sample
10
5
0
-5
-10
-15
CODE NI(WTX) GAS HDD-O 11 3 N2
~
o
10 u
-w u z 5 w
~0 w u (j) shyu (j)
0 -0 0I W (j)0 (j)=gt 4Ishy J4 0 w Q J
-5 W Ishy
-10~ CODE
-15cNIltWn) GAS
113 Nz
I r I I
0 200 400 600 BOO TEMPERATURE C
FIG 442 MASS LOSS (X) AND TEMPERATURE DIFFERENCE (ac) Vs FURNACE TEMPERATURE (OC) FOR A CALCINED tATALYST
WHICH HAS BEEN EXPOSED TO AIR 19 m~ sample
105
The OTA curve was exothermic below 400middotC probably as a result or
combustion of the adsorbed hydrocarbons No other thermal events
occurred The TG curve showed that the overall mass loss was 96 wt~
To establish the eftect Ot synthesis techni~ue the TG and OTA curves Ot
a SG IMP and HOD type catalyst were recorded under tlowing air In each
case the catalyst had been used for the 01 Igomerlsation Ot propene
In Figure 444 the TG and OTA data for an IMP type catalyst with a
nickel content of 083 wt~ are shown There were an exothermic peak at
340degC and a shoulder at approximately 400C probably due to the
combustion of the adsorbed hydrocarbons The TG curve also shown in
Figure 444 shows that the overall mass loss was 173 wt~
In Figure 445 the TG and OTA curves for an HOD type catalyst with a
nickel content ot 15 wt are shown The OTA curve showed a broad
exothermiC peak between 300 and 400 o e The overall mass loss was 12 wt
In Figure 446 the TG and OTA data for an SG type catalyst with a nickel
content of 151 wt are shown The OTA curve showed that an exothermic
peak in the vicinity Ot 300degC The TG curve showed a continual mass
loss up to 600degC the overall mass loss being 244 wtY-
412 NMR
The 1H MNR spectra recorded were those of the bulk I i~uid collected
throughout a run For each type of catalyst the spectrum determined was
that of the I i~uid collected at the reaction conditions deemed optimum
viz bull aoc and 40 atm over a catalyst with a nickel content of 15 wt
The results obtained are shown In Table 42 and Table 43 while the
spectra are shown in Figures 447 448 and 449
106
10 u
UJ
I u 5 z UJ a
~
UJ (f)U (f)u 0
~
0 I
0 J
(f)UJ (f) gt~ middot1a 4 I~
l- x 4 a UJ 0-
-5 x UJ Ishy
-10
CODE NI(WT~) TR ( C) P(ATM) WHSV GAS HDD-13 113 80 40 54 AIR
-15 I
0 200 400 600 800
TEMPERATURE degC
FIG 443 MASS LOSS (~) AND TEMPERATURE DIFFERENCE (GC) VS
FURNACE TEMPERATURE (OC) FOR A USED CATALYST
HDD-13 185 mg sample
15
10
5 u
UJ 0 U Z UJ a
~
UJ -5-(f)U (f)U 0
0 J -10 (f)UJ (f)a
~ 4 l- x -15 4 a UJ 0- -20x UJ Ishy
CODE NI(Wn) TR ( C) P(ATM) WHSV GAS -25 IMP-1 08 80 40 42 AIR
-30 0 200 400 600 BOO
TEMPERATURE e
FIG 444 MASS LOSS (X) AND TEMPERATURE DIFFERENCE (OCl VS
FURNACE TEMPERATURE (OCl FOR A USED CATALYST
IMP-l 18 mg sample
107
15
10
5 u
~
UJ 0 U Z UJ ~ IX UJ -5R
U () U () 0- 0 a J -10 UJ () IX ()
gt lt l- I -15 lt IX UJ ~ I -20 UJ I shy
CODE NI (Wn) TR(C) P(ATM) WHSV GAS -25 HDD-l 15 80 40 42 AIR
-30 600 BOO0 200 400
TEMPERATURE c
FIG 445 MASS LOSS (X) AND TEMPERATURE DIFFERENCE (OC) VS
FURNACE TEMPERATURE (OC) FOR A USED CATALYST
HDD-l 17 mg sample
to)
~
UJ 0 to)
Z ~UJ
IX UJ -5R
()U ()U 0
a J -10 ()UJ ()IX
gt lt l- I -15 lt IX UJ ~ I -20 IJJ I shy
CODE NI(WTX TR(C) P(ATM) WHSV GAS SG-3 30 80 40 37 AIR
-30 I I I 0 200 400 600 BOO
TEMPERATURE C
FIG 446 MASS LOSS (X AND TEMPERATURE DIFFERENCE 1degC) VS
FURNACE TEMPERATURE (OC) FOR A USED CATALYST SG-3
17 mg sample
-25
108
c
-I 0 J gt-lt
Z ) 0
J 0 0 U
I shyU ) Cl 0 0 0
0 gt-lt ) 0 gt-lt J
U 0
ltt 0 I shyU W 0 ()
0 J Z
Cl J
co
M
I
I l--r
JiI I
I LLf)
t
r-shyq q
0 gt-lt u
T~
------H
G
F
E
o Q
o
FIG 448 IH NMR SPECTRA OF LIQUID PRODUCT FROM RUN SO-3
BA L
M
---L
1-shy
5 4 3 2 1 o 6
c
110
LL o o
-I C C x z )
cx I 0 cx LL
I-U ) C 0 a a c -) C -J
u 0
ltr cx I-U UJ a (J
a I Z
x
0-lt1
U1
lt1
lt) shyu
111
Table 42 Integrated areas
Run code Area code
A B C o E F G H L M N
IMP-l 00 10 120 320 205 145 250 195 10 125 00
SG-3 20 30 190 430 305 220 365 225 15 158 00
HDD-l 75 50 230 490 332 235 355 222 20 220 00
Table 43 Carbon areas and branching
Code CH CHJ CH
IMP-l 258 275 210 094 123 076
SG-3 350 253 295 079 123 067
HDD-l 372 517 309 072 120 060
112
5 DISCUSSION
The effect of the synthesis procedure on metal distribution and
dispersion in nickel silica catalysts was examined in detail by amongst
others Hermans and Geus (1979) Blackmond and Ko (1984) Montes et al
(1984) and in a more general sense by Maatman and Prater (1957)
The conclusions reached by these workers as to how the synthesis
procedure effects the metal distribytion and dispersion and hence
catalytic activity has been discussed in Section 13 and are briefly
summarised below Using their Conclysions an attempt was then made to
explain the activity of an HOD type n i eke 1 oxide s i 1 i ca alumina
catalyst
Impregnation as discussed in Section 132 and 362 involves the the
homogeneous increase in concentration of the nickel precursor by the
evaporation of the solvent In terms of preCipitation theory as
discussed in Section 13 the homogeneous increase in the concentration
of the metal salt results in the formation of a 1 imited number of large
nuclei which are evenly distributed over the support The reason for
this is that providing the concentration of the solution is kept
homogeneoys the rate of increase in concentration is equal to the rate
of Crystal growth Consequently the concentration of the solution Will
remain between that of the solubil ity and supersolubil ity curves where
no new nuclei can develop This has been disc~ssed in Section 1331
Th is was in fact foun d to be t he case by Montes et a 1 (1984) ljho in the
case of an inpregnated Ni silica catalyst recorded an average nickel
particle diameter of 52 nm They further suggested that only a weak
interaction exists between the metal preCursor and the support If this
were so then upon calcination the crystal size should increase (Section
1324) and the metal should be present in a form 31milar to that of
the bulk oxide They in fact found this to be so ie bull the average
nickel particle size inCreased to 45 nm after calcination for 16 h at
450degC in dry air The fact that the metal was present in a form similar
to that of the bulk oxide In calcined Impregnated nickel silica
catalysts had been established earlier by Houalla and Delmon (198ll
In the case of impregnated nickel sl1ic3 alumina catalysts no data was
available indicating the degree of interacton between the support and
the metal It is however assumed that in the case of this ta+almiddotst
the interaction between the support and the metal pr~Cursor are also
113
weak and that a similar redistribution and corresponding increase in
crystal size occurs during calcination It is also suggested that the
metal is present in a form similar to that of the bulk oxide
It is well known that for optimum catalyst activity a large specific
surface area and hence a finely divided sol id is required (Hermans and
Geus 1979) Small crystallites ensure high specific metal areas but
increasing nickel concentration results in agglomeration In the case of
impregnation the drying and calcination procedures result in the
formation of a heterogeneity of crystal sizes when the nickel content is
greater than about 5 wt~ Increaslng the nickel content beyond 5 wt~
results in broad and even binodal crystal size dispersion which not only
affects the activity due to loss of surface area but also the thermal
stability ie bullbull resistance to sintering (Richardson and Dubus 1978) It
is proposed that this fact accounts for the observed loss in propene
01 igomerisation activity recorded by Hogan et al (1955) and Holm et al
(1957) over impregnated nickel oxide sil ica alumina catalysts when the
nickel content was raised beyond 5 wt~ Thls proposal was further
supported by Dorl ing et al (1971) who predicted that when increasing the
nickel content below 5 wt~ the number of crystall ites would increase but
that the mean crystal size would remain approximately constant Beyond 5
wt~ nickel on the other hand they predicted that the number of
crystall ites would remain constant as the nickel content was increased
but that the crystall des woul d increase in size This has been
discussed in detail in Section 1323
From the above discussion it can thus be concluded that the activity of
impregnated catalysts is only a function of the the extent of metal
distribution and dispersion which in turn is a function of the metal
content
It would thus be desirable to produce a catalyst in which the crystals
generated during synthesis are held by the support and thus are
prevented from migrating and agglomerating during subsequent heat
treatments One such method is co-precipitation In the case of this
synthesis procedure as discussed in detail in Section 134 and 364
a reaction oCcurs between the support and the metal ie the meta] is
held by the support and the crystals are uniformly distibuted
throughout the matrix This type of catalyst was found to be much more
active for the 01 igomerisation of propene than impregnated cata list s
According to Holm et al (1957) th is is due to the hish extent of
distribution and dispersion of the nickel Ions present in thiS catalyst
However the same 1 imitations of nickel content on the activity were
114
observed ie the catalysts with a nickel content between 3 and 5 wt
were the most active (Holm et al 1957) In the case of SG type catalyst
this cannot be explained in terms of loss of dispersion with increasing
nickel content as it has been shown by Holm et al (1957) that the
crystal size remained unchanged as the nickel content was raised from 3
to 20 wt~ The reason that the activity did not increase as the nickel
content was raised beyond 5 wt may either be due to the inaccessibility
of the reactant molecules to the nickel or due to the nickel being in
an unsuitable form ie Nio as opposed to Ni+ 2 (NiO) after
calCination The latter was supported by the fact that the nickel was
diffiCult to reduce ie bullbull a reduction of only 50 was achieved after 2
h on stream at 500degC by Holm et a1 1957gt
It is thus proposed that although crystal dispersion remained unchanged
in co-precipitated nickel silica alumina catalysts up to a nickel
content of 20 wt the location and form of the crystals prevent total
utilisation of the available metal
Since most unsupported catalytically active materials sinter rapidly at
the conditions of calCination andor reaction (Hermans and Geus 1979)
the active compound has to be attached to a highly porous thermostable
support such as s11 ica or silica alumina This support which is often
not catalytically active itself increases the dispersion of the
catalytically active material Also the support is used most effectively
when the active material is distributed densely and uniformly over it
and is firmly held by the support A rapid transportation of the
reactants and products through the porous catalysts is also a
prerequisite for an active solid catalyst Sil ica alumina is such a
support but the available method of loading rlicke1 onto it viz bull
impregnation does not lead to an adequate degree of interaction between
the support and the metal An alternative method of loading ~lckel onto
sil ica alumina is thus required in which a uniform dispersion and
distribution could be ensured together with a strong interaction between
the support and the metal
In the case of nickel sir ica catalysts such a method was developed by
van Dillen (1976) and was termed homogeneous decompOSition deposition
(HOD) In this method as discussed In detail in SectIon 133 and
Section 363 the high degree of penetration or the solute into the
support during impregnation was combined with a controlled Ion exchanse
type preCipitation
115
In the case of nickel silica catalysts prepared by HOD measurements of
particle size distribution indicate a range of between 1 and 3 nm for
loadings of up to 30 wt~ nickel (Richardson and Dubus 1978) Furthermore
a strong interaction exists between the support and the metal and
conseQuently this type of catalyst was extremely resistant to sintering
Thus in the case of an HOD nickel sil ica catalyst with a nickel content
of 83 lilt Montes et al (1984) showed that after calcination in dry air
at 450degC for 16 h the averase diameter of the nickel particles decreased
from 51 to 46 nm In the case of an impregnated nickel sil ica
catalysts with the same nickel content the average nickel particle size
after calcination at the same conditions was 45 nm From this it may be
concluded that in the case of HOD nickel si 1ica catalysts the metal is
not present in the bulk oxide form This was in fact confirmed by Montes
et al (1984) usins X-ray diffraction The exact nature of the form of
the metal on the surface is not known Also the crystall ites in HOD
nickel si1 ica were readily accessible This was inferred from the
results of Blackmond and Ko (1984) who recorded 100~ reduction after 4 h
on stream at 500degC
From the discussion presented above it can be seen that the method of
homogeneous decomposition deposition produces a nickel sil ica catalyst
where the nickel is distributed densely and uniformly over the support
and that a strong interaction betweenthe support and the metal exists
In the case of nickel oxide si 1 ica alumina catalysts prepared by
homogeneous deComposition deposition no data was avai1ab1e in the
1 iterature either on the degree of dispersion or distribution or on the
support-catalyst interaction It is however thought that in view of the
results obtained from nickel si1 ica catalysts a high degree of
interaction occurs and that the crysta1l ites are uniformly and densely
distributed throughout the support
In this work the extent of metal distribution and dispersion on the
support phase and the nature of the support metal interact ion of nickel
oxide silica alumina catalysts prepared by homogeneous decomposition
depOSition were not investigated However the catalytic activity and
selectivity of this catalyst for the 01 igomerlsation of propene were
examined in detail and compared with the activity and selectivity of
nickel oxide si 1 ica alumina catalysts prepared by impregnation and coshy
preCipitation A discussion of each aspect of the work is now given
The reproduCibll ity study (Section 411 indicated that the experimental
results obtained in this study were reliable Once steady state
116
operation was reached both the selectivity and LPR showed 1ittle
variation between runs at similar reaction conditions
The reaction conditions used were unless otherwise stated (see iable
41) 80degC and 40 atm It can be seen from the phase diagram shown in
Appendix B that the reactants were in the 1 iQuid phase ConseQuently a
two phase system was studied When the temperature was raised above the
feed bybb1e point temperature of 86degC at 40 atm ie when the
reactants were in the vapour phase a three phase system was studied
The aim of this study was to compare the characteristics of a nickel
oxide si1 ica alumina catalyst synthesised via the HOD method adapted by
the author from the work done by van Dillen (1979) on nickel oxide
si1 ica catalysts with those of a catalyst prepared by the standard
impregnation techniQue (referred to as IMP) and co-precipitation
(referred to as SG) as discussed by Holm et al (1957gt
The effect of synthesis procedure on the propene ollgomerisation
properties of nickel oxide sil ica alumina was investigated by Holm et al
(1957) for an IMP type catalyst and a coprecipitated (SG) type catalyst
They found that the oligomerisation activity of SG type catalysts was
approximately 15 times that of IMP type catalysts HOD type catalysts
on the other hand had an activity similar to that of IMP type catalysts
but their performance was not as sensitive to the reaction conditions
and nickel content as IMP and SG type catalysts were With this in ~ind
a comprehensive study of the effect of reaction conditions using nickel
oxide sil ica alumina a catalysts prepared by homogeneous deComposition
deposiUon impregnaUon and to a 1 imited extent cODrecipltation were
carried out
Firstly the effect of the Quantity of nickel loaded onto the catalysts
was Investigated In the case of IMP type catahsts Hogan et al (1955)
had found that a nickel content between 3 and 5 wt gave the most
active catalyst Holm et al (1957j examinin9 the propene 01 igomerisaticn
actIvity of IMP as well as SG type catalysts found that irrespective of
syntheSis techniQue catalysts with a nickel content between 3 and 5 wt~
were the most active
In the case of IMP type catalysts examined in ~he present study no such
trend was observed IncreaSIng the nickel content from 22 wt to 63
wt~ at an average WHSV of 48 and 49 ghg respectiv~ly caused the LPR
to decrease by 42 Using on the other hand catal S With a nlck~l
content of 19 and 98 wtl at an avera~e WHSV of 53 and 52 9h~
117
respectively an increase of 5X In LPR was recorded In view of the
conf1 icting results obtained in this study and the differences In WHSV
from run to run no statement as to the effect of nickel content on the
activity of impregnated nickel oxide sil ica alumina catalysts could be
made
In the case of an HOD type catalyst increasing the nickel content did
not lead to a marked change in the LPR Differences in the WHSV and the
fact that the conversion was greater than 90 wtX in all the runs make a
comparison of the results diffiCult However comparing runs with
identical average WHSV viz bull 42 ghg showed that changing the nickel
content from 15 wtX to 72 wtX did not affect the LPR Similarly at a
WHSV of 49 and 50 ghg identical LPR were observed for catalysts with
nickel contents of 117 and 22 wtre
Thus although the study of the effect of the nickel content on the LPR
in the case of both IMP and HOD type catalysts is not unambiguously
conclusive the available data seems to indicate that the activity of an
HOD type catalyst was relatively independent of the nickel content and
that irrespective of nickel content HOD type catalysts were on average
20r more active than IMP type catalysts
It was observed while examining the effect of WHSV on the activity and
selectivity over HOD type catalysts that the selectivity was a function
of the Conversion ie bullbull a shift to 1 ighter products was recorded when
the conversion decreased Neither IMP type catalysts nor HDD type
catalysts exhibited a strong dependence of product composition on nickel
content In the case of IMP type catalysts the catalysts with 08 wt
nickel did show a greater selectivity towards trimers but the overall
trend observed was a gradual increase in dimer yield with increasing
nickel content at the expense of the trimer (Section 42) The small
Increase in dimer yield with increasing nickel content observed in this
work was in agreement with the data reported by Takahashi et al (1969)
who recorded the maximum dimer Yield for an impregnated nl~kel oXlde
sil ica alumina catalyst with a nickel content of 97 wt ~
The selectivity of HOD type catalyst was independent of the nickel
content when the nickel content was held between 1 3nd 7 wt~ At a
higher nickel content viz bull 11 wtX a decrease of 10 In dimer yield was
observed After careful examination of the data however it was found
that after 4 h on stream the WHSV for the catalysts with 22 and 17
wtY nickel were 53 and 49 respectively This 8 decrease in WHSV
between the runs may explain the observed decrease in Jimer yjel~
118
It may thus be concluded that the activity and selectivity of HDD type
catalysts were independent of the nickel content with in the range of
nickel loadings of 15 to 117 wtX In the case of IMP type catalysts
increasing the nickel content caused a shift to 1 ighter products with no
discernible effect on the activity
The effect of varying the pressure at a fixed temperature on the
activity and selectivity of an IMP type catalyst was investigated in
detail by Takahashi et al (1969) In the present work the effect of
varying the pressure at a fixed temperature of 80 c C for an IMP as well
as for HOD and SG type catalysts was investigated For an IMP type
catalyst the results obtained were similar to those of Takahashi et a1
(1969) Thus in the case of IMP type catalysts a drop in activity was
recorded when the pressure was lowered from 40 atm to 20 atm at a
constant temperature of 80 c C ie bullbull when the system moved into the
vapour phase In the case of an SG type catalyst it was found that the
catalyst was inert at 20 atm
In the case of a HOD type catalysts differences in WHSV and the fact
that the conversion was greater than 88 wtX in all runs make an
interpretation of the results difficult From the available data it can
however be seen that although the average WHSV increased from run to
run the LPR over HOD type catalysts remained constant as the pressure
was dropped from 50 atm to 20 atm From this it may be concluded that
the activity of HO~ type catalysts decreased as the pressure was
deCreased
In respect of the effect of pressure on product selectivity Takahashi
et al (1969) found that when the system moved into the vapour phase at a
constant temperature a shift to heavier products occurred Using an IMP
type catalyst this was also observed in this stJdy ie bull a dr0P or
in dimer yield mainly in favour of the trimer was observed when the
pressure was dropped from 40 atm to 20 atm In the case of HOD type
catalysts an opposite trend was observed viz bull decreasing the pressure
from 50 atm to 20 atm resulted in an almost 1 inear increase in dImer
i e 1 d
From the above discussion It can be seen that IMP type catalysts
contradict thermodynamics with regards to selectivity It was expected
from thermodynamics that as the pressure was decreased From 50 to 20 atm
the dimer yield should increase In the case of an HDD type eatalst
thiS was found to be the case Tn the case of IMP type catalysts
however an opposite trend was was observed Ie a ShiH to heavier
119
products as the pressure was decreased from 50 to 20 atm The observed
shift to heavier products with decreasing pressure may be explained if
it is assumed that at the lower pressures the heavier products are able
to evaporate off If this were so then in the case of HOD type catalysts
the yield of heavier products should also increase as the pressure was
decreased This was infact found to be the case although the increase in
trimer yield was very small In the case of both IMP and HOD type
catalysts the activity decreased as the pressure was decreased
To complete the study of the effect of reaction pressure and temperature
on the selectivity and activity the effect of varying the temperature
at a fixed pressure was investigated Since the above results for IMP
type catalysts were in agreement with those of Takahashi et al (1969)
and much information is available in the 1 iterature on IMP type
catalyst no further experimental work using IMP type catalysts was
done ConseQuently the results obtained from the 1 iterature were used to
compare IMP and HOD type catalysts
In the case of IMP type catalysts Takahashi et al (1969) foun d that
moving into the vapour phase ie when the temperature was raised
above approximately 90degC at a pressure of 50 atm a sl ight drop in
activity was observed Increasing the temperature beyond the bubble
point of the feed was accompanied by a shift to heavier products The
reason that the catalyst activity decl ined only sl ightly with increasing
temperature at 50 atm was that the sil ica alumina support becomes active
at the higher temperatures At 35 atm on the other hand crossing the
phase boundary results in a rapid decl ine in propene conversion with
increasing temperature The reason for this is that si 1 ica alumina is
only sl ightly active at 35 atm for the 01 igomerisation of propene
ltTakahashi et a11971gt The shiH in product spectrum ie a shiH
to heavier products can also be explained in terms of silica alumina
activity This is so because the preferential product of silica alumina
when the latter is used for the 01 igomerisation of propene is a propene
trimer (Feldblyum and Baranova 1971 Takahashi et a1 1971)
The nature of the products formed over si 1 ica alumina wheuron Jsed for the
01 igomerisation of propene and the effect of temperature on the activity
and selectivity were examined The results obtained were in agreement
with those of Takahashi et al (1972) liz silica alumina was actve
for the 01 igomerisatlon of propene as long as the system temperature
remained above 150degC Also the activity Jropped with decreasing reaction
temperature At 80degC Ie in the 1 iquid phase at 40 atm the catalyst
was inactive This was not in agreement with the results of Feldblyum
120
and Baranova (1971) who in a batch reactor recorded 6X conversion at
64degC and 50 atm The reason for the difference in the results was
properly due to the different pressures used ie bullbull 40 atm in this work
as opposed to their 50 atm and the di fferent process ie batch as
opposed to fixed bed reactor The product spectrum obtained agreed with
that foun d by other workers viz bull decreasing trimer yield With
increasing temperature and propene trimer being the main product
In the case of an HOD type catalyst increasing the temperature at a
fixed pressure resulted in the LPR dropping by approximately 50r when
the system moved into the vapour phase Increasing the temperature
further did not result in any marked changes in the LPR Thus although
the average WHSV increased from run to run the LPR remained
approximately constant as the temperature was increased From this fact
it may be concluded that the activity of the catalysts decreased as the
temperature was increased
The overall shift to heavier products when raising the temperature from
80degC to 150degC ie bullbull an increase in propene trimer at the expense of the
propene dlmer was expected in view of the catalytiC role of the sil ica
alumina support at the elevated temperatures The increase In dimer
yield as the temperature was raised further from 150degC to 210degC could be
explained in terms of the increasing WHSV and hence decreasing activity
of the catalyst (See Section 441)
From the different trends in product spectrum recorded when operating in
the vapour phase ie bullbull an increase in trimer yield with increasing
temperature when using nickel oxide sil ica alumina as opposed to a
decrease in trimer yield when uSing silica alumina observed in this work
it could be concluded that in supported nickel catalysts the ni~kel
still played a role at the elevated temperatures ThiS conclusion was
also supported by the results of Takahashi et al (1972) who found that a
physical mixture of sll iea alumina and nickel oxide had the same
activity as sil ica alumina alone thus indicatin9 the importance of
supporting the nickel Also the conversion over nickel oxide s11 ica
alumina was less senSitive to the reaction temperature then was the case
for silica alumina when the system was operated in the vapour phase at
40 atm Thus in the case of si 1 iea alumina a drQP in LR of 83~ was
recorded when the temperature was dropped by 50degC from ZODoC while in
the case of a HOD type catalyst3 an increase In LPR of 30 was recorded
when the temoerature was decreased over the same range
The 1 ifetimes of the catalysts were examined by the changes in the
activity over the first 10 h on stream In the case of an IMP type
catalyst data was avai lable in the 1 iterature on the 1 ifetime when this
type of catalyst was used for the 01 igomerisation of butene (Hogan et
al 1955 Allum 1974) The results obtained by these researchers was
that the activity of the catalyst did not change markedly after 100 h
and 21 days on stream respectively No data was however available on
the 1 ifetime of this catalyst when used for the 01 igomerisation of
propene
As using the changes in activity over the first 10 h on stream as an
indication of 1 ifetimes was very sensitive to WHSV fluctuations both
the changes in LPR and WHSV have to be recorded The average WHSV in
this run was 53 ghg In the case of an IMP type catalysts the LPR
dropped by 175X after 5 h on stream during which time the WHSV dropped
by 1X In view of the fairly constant WHSV and the large drop in LPR it
may be assumed that IMP type catalysts deactivate rapidly when used for
the oligomerisation of propene A slight shift to lighter products was
also observed during this run which was expected in view of the
decreasing activity
In the case of SG type catalysts the LPR dropped by 96~ while the WHSV
dropped by 21~ after approximately 6 h on stream The average WHSV
during this run was 52 ghg The change in the WHSV was considered
acceptable and so it may be concluded that this type of catalyst
deactivates less rapidly than IMP type catalysts do when used for the
01 Igomerisation of propene This conclusion was also reached by Holm et
al (1957) In the case of this catalyst a slight shift to lighter
products was also observed with time on stream
In the case of a sil ica alumina when operated at 200degC the LPR dropped
by 315~ while the WHSVover the same time period of 76 h dropped by
28X The average WHSV during this run was 35 gh9 From these results
it can be seen that this catalyst rapidly deactivates when used for the
01 igomerisation of propene at 200degC A very sl ight shift to 1 ighter
products was observed during this run
In the case of an HOD type catalyst no data as to the 1 ifetime ~as
available and hence a long run was performed The LPR fluctuated during
this run due to WHSV fluctuations The average WHSV during this run was
52 ghg USing data pOints 105 h apart with nearly Identical WHSV of
56 and 57 ghg respectively it was found that the Conversion
decreased by 126X over this period The selectivi~y also changed during
122
this run ie bullbull the Quantity of dimer formed increased by 25~ at the
expense of the tetramer and pentamer after 120 h on stream
The I ifetime of the catalysts as measured by the drop in activity over
the first 10 h on stream are in order of decreasing length HODgt sa gt
IMPgt SA It may thus be concluded that HOD type catalysts are superior
with respect to 1 ifetime when used for the 01 igomerisation of propene
than any of the other catalysts studied
The effect of varying the ~HSV on the activity and selectivity of IMP
type catalysts was examined by Takahashi et al (1969) and by Hogan et a1
(1955) who also examined the effect of feed composition They found as
discussed in detail in Section 1524 that the rate of polymer
production increased 1 inear1y with propene concentration ie bull a first
order relationship between propene concentration and rate of polymer
formation was obtained The optimum space velocity for maximum
conversion was less than 2 ~ of propene per ~ of catalyst per hour
(Takahashi et a1 bull 1969) At higher ~HSV Takahashi et al (1969) found
that the conversion dropped rapidly
In the case of HOD type catalysts the LPR increased with the ~HSV
However the catalysts deactivated rapidly at the higher WHSV ie bull a
WHSV greater than 11 ghg in this work resulted in a drop in the LPR of
28X after 7 h on stream As expected the overall conversion decreased
with increasing WHSV droPPing from 96~ at the lowest WHSV of 49 ghg
to 77~ at a WHSV of 116 ghg
The selectivity was also affected by the changing WHSV viz a shift to
1ighter products and an increase in dimer Yield was observed with
increasing WHSV This trend is OPPOSite to that observed by Takahashi et
a1 (1969) who found using IMP type catalysts that dimer selectivity
decreased for a WHSV greater than 32 ghg Why this shoyld be so is
not known The trends In conversion are however identical viz bull
Conversion decreased with increasing WHSV
The effect of operating the catalyst initially at ZOOdegC and then reusing
ii at SOdegC was examined The catalyst was calCined in the normal man~er
between the two runs The effect on LPR and selectivity of operating the
catalyst at 200degC has already been discussed
From the results obtained in this study It was found that the actiVity
of the catalyst at sooe was affected by operating it first a~ 200degC and
the steady state Conversion after 4 ~ on stream e11 by 28~ from that
123
of a catalyst used under normal conditions The selectivity ~as also
affected by this procedure a shift to 1 ighter products being recorded
The reason for the decrease in activity ~as probably the same as that
suggested by Hogan et al (1955) in the case of IMP type catalysts
~hereby the nickel oxide promoter under~ent changes such as sintering or
a change in oxidation state during the repeated calcination and high
reaction temperature ~hich caused the activity to decl ine The catalyst
~hen operated under normal conditions did not deactivate to any marked
extent and hence no data as to the effect of repeated calcination on
the activity and selectivity ~as available
The effect of feed contaminants ~as examined in detail by Hogan et al
(1955) using an IMP type catalyst This ~as discussed in detail in
Section 1525 In this ~ork only the effect of ~ater on the activity
and selectivity ~as examined In the case of an IMP type catalysts Hogan
et al (1955) found that if the catalyst ~as allo~ed to absorb as little
as 05 ~t~ moisture the catalyst deactivated They found that this type
of contamination ~as totally reversible
In the case of an HDD type catalyst using an undried feed containing 112
ppm (vv) ~ater the catalysts deactivated after J5 h on stream as
opposed to the more than 120 h recorded ~hen using a dry feed Using the
average WHSV of 51 ghg to calculate the quantity of ~ater fed to the
reactor and assuming that al 1 the ~ater entering the bed ~as absorbed by
the catalyst the mass of ~ater absorbed by the catalysts ~as 510- 3
9H20gcat or 05 ~t~ This result is consistent ~ith to that obtained
by Hogan et al (1955) for IMP type catalysts Furthermore the
contamination ~as totally reversible as the catalysts regained its
normal dry feed properties ~ith respect to activity and selectivity
after regeneration
To examine the catalytic properties of the HDD type catalysts when used
for the ollgomerisation Ot propene dimer (C6) the lt 69degC fractIon from
previous runs ~as fed to the reactor To quantify the activity of the
catalyst the equations as discussed in Section 49 ~ere used to
calculate the LPR and conversion At 80degC the catalyst was active for
the oligomerisation of C6 but deactivated rapidly This ~as probably due
to the hl9h molar ~ei9ht products formed viz a propene tetramer
(CI2) stallng on the catalysts and so blocklng the active sites Upon
raiSing the temperature to 200degC the catalysts raPldl~ re9ained activity
reaching a steady state conversion of 64 The only product formed
124
during this run to any significant extent was a propene tetramer
(Ct2)
Feeding Co and CJ simultaneously also caused the catalyst to deactivate
after approximately 3 h on stream at 80degC The maIn product formed
during this run was a propene trimer (C9) The reason for the rapId
deactivation was probably the same as above ie bullbull the accumulation of
the propene trimer (C9) in the system and consequent blocking of the
active sites After regeneration and reusing the catalyst at 200degC the
catalyst was again active for the 01 igomerisation of the CJCo mixture
In thIS case the main product was also a C9 01 igomer with Ct2 through
C2 t formed in reasonable quantities Co-feeding Co with CJ thus has the
effect of increasing the average molecular weight of the products over
that when pure CJ was fed although different temperatures are needed to
ensure reasonable activity when Co or a CoC] mixture was used
The oligomerisation activity of the si1 ica alumina support when feeding
Co or C]C6 at 2DDoC was not examined That the support does playa role
can not be disputed as si1lca alumina is catalytically active for the
01 igomerisation of propene at temperaturesgt 1SDoC The large Quantity
of C9 formed when co-feeding CJ and Co could be explained in two ways
Firstly it could be assumed that the co-o1 igomerisation of Co and CJ was
more rapid than the dimerisation of Co or secondly that the
trimerisation of propene was the main source of the trimer The second
option seems more 1 ikely as the preferential product of si 1 ica a11Jmina
when used for the 01 igomerisation of propene at 20DoC is a propene
trimer
In the case of Ni-lSM-5 Miller (1984) suggested the use of a two stage
system whereby a high Yield of propene tetramer was possible The system
suggested by Miller (1984) was that propene should first be dimerised in
the normal way over Ni-lSM-5 at 27 to 93degC and 27 to 109 atm followed by
a distillation to separate the dimer fr~m the other products The
second stage woul d then be the 01 igomer ig3t ion of the Co stream it 121
to 232degC and 14 to 54 atm to propene tetramers both reactions being
conducted in the liQuid phase The final liQuid product )btained
contained as much as 60 wtX propene tetramer ~rom the results obt31ned
in the present work it becomes apparent that HOD t~pe nickel oxide
Silica alumina also achieves this prodlct spectltJm The reactiCn
conditions used in thiS work were 80degC and 40 atm for stage one the
product containln3 65 wt dimer and 20DoC at 40 atm For stage two Yere
both reactions were also In the 1 iquld phase and the flnal product
obtained contained appr~ximately 45 wt propene tetramerlf on th~ ot~er
125
hand the feed to stage two is a mixture of C3 and C also at 20Doe and
40 atm the final 1 iQuid product contained 20 wt~ C9 with e12 to C21
also being formed in reasonable Quantities Thus depending on the feed
used the products obtained can range from predominantly dimer obtained
when pure e3 is fed to almost pure tetramer when a C feed is used to
a high molecular weight product C to e21 when C3 and C are fed No
information was however available as to the degree of branching of the
products formed
The effect of the activation procedure in the case of IMP type catalysts
was studied in detail by Takahashi et a1 (1969) with respect to aCidIty
structure and propene dimerisation activity They found that a
temperature between 500degC and 600degC was needed to activate the catalyst
and that the activity increased with increasing activation time up to 5
h above which the activity did not change A more detailed discussion on
the effect of activation procedure on the nature of the catalyst is
given in Section 1526
In the case of an HOD type catalyst using TOoTA the only thermal event
recorded was an endotherm between 500 0 e and 600degC This was probably due
to the decomposition of organic intermediate incorporated in the
catalysts during the synthesis to nickel oxide Below bOOoe the mass
loss was 122 wtra while 15 wt was lost between 600 and 800degC In view
of the work done by Takahashi et a1 (1969) as discussed above it was
assumed that in the case of HOD type catalysts the optimum calcinatl0n
temperature also lay in the region of 500 to 600 0 e
To determine the Quantity of water that the catalyst absorbed the
previously calcined catalysts was re-exposed to aIr and the mass loss
recorded In this run the rate of mass loss was fairly ynlform the
overall mass loss bein3 37wt From the results obtained it was
concluded that below 600degC ie bull below the endothermic event observed
In the case of the unused catalyst the onl) species removed frOM the
catalyst was water
To determine the Quantity of hydrocarbon held by the catalyst aft~r it
had been used for the 01 i90merisatlon of propene as a function of nl~~el
content the TOoTA Curves for 3n HOD type catalysts With a nlck-l
content of 113 and 15 wt~ were recorded In vIew of the abQv~
discussion the mass loss recorded below 6COo~ was probably due t) the
removal of water and in this case 1 i3ht hydrocarbons As +he catagtsts
uDon completion of a run were not stored In air ~i3ht c1ntainers ~hey
probably absorbed water from the atmosp~ere Consequent ~ ~~ mak~ t~~
126
comparison meaningful only the mass loss above 600degC was considered
Below 600 0 e the mass loss recorded were 81 and 105 wt~ for HOD type
catalysts with a nickel content of 113 and 15 wt~ respectively From
this result it can be seen that the higher the nickel content the lower
the amount of adsorbed hydrocarbon and hence the lower the degree of
active site contamination In view of this result it may be concluded
that a high nickel content is desirable to ensure a long catalyst
lifetime Above 600 0 e the mass loss was independent of the nickel
content and In both cases was approximately 15 wt~
To compare the effect of synthesis procedure and the Quantity of
hydrocarbon held by the catalyst after it had ~een used for the
01 Igomerisatlon of propene the TGDTA Curves for an IMP HOD and SG
type catalyst were recorded In this case the total mass loss was
considered and it was found that the sa type catalyst had the highest
mass loss (244 wtX) followed by the IMP type catalyst which had a mass
loss of 173 wt~ and an HOD type catalyst which showed a mass loss of
120 wtX From these results it can be seen that the HOD type catalysts
held the least amount of hydrocarbon which gave a further indication
that the extent of deactivation of this catalyst was not as great as
that of the other catalysts examined
The products obtained when propene ~as 01 igomerised over an IMP type
catalyst were found by Hogan et al (1955) to contain as much as 70 vol~
Co of which 35 vol~ were linear hexenes In the case of this work the
degree of branching ie the CH3 to CH2 and CH to CH ratio was
determined using 1H NMR From the results obtained the products formed
over the IMP type catalyst were the most branched followed by the
products formed over SG type catalysts The products formed over HDO
type catalysts were the least branched From the above results if it is
assumed that the degree of branching found in this work for the products
formed over IMP type catalysts correspond to the product spectrum Quoted
by Hogan et al (1955) then the products ormed over HOD and SG type
catalysts contain more 1 inear Cos than the products formed over IMP
type catalysts do
From the present work two Questions arise They are
(1) Why is nickel oxIde silica alJmlna active for the ol190merlsation
of Dropene at sooe and sil ica alumina only at temperatures great~r
than 150degC
127
(II) Why is the preferential product of nickel oXide silica alumina
when used for the oligomerisation ~f propene a propene dimer
while that of si1 ica alumina when used for the same reaction a
propene trimer
It is proposed that the differences observed are due to the nature of
the active site and hence the 01 igomerisation mechanism
In the case of silica alumina the nature of the active site is
controversial because of the lack of conclusive evidence The various
schemes that have been proposed (8 in total) are diSCussed in Section
1231 It can however be concluded from the structure of the products
formed as establ ished in detail by Feldblyum and Baranova (1971) and
discussed in detail in Section 1232 that sil ica alumina 01 igomerises
propene via a carbonium ion meChanism ThiS in turn would explain why a
high reaction temperature is needed for silica alumina to be active for
the 01 igomerisation of propene
In the case of nickel oxide silica alumina 5 schemes have been
formulated as to the nature of the active site and hence 01 i90merisation
mechanism The various schemes proposed have been discussed in Section
1241
An early indication of the nature of the active site was given by Clark
(1953) who sugsested that the nickel crystals in nickel oxide sil ica
alumina contained an excess of metal ions Hence the active center may
either be an anion vacancy or a nickel atom not directly linked to an
oxygen atom and situated at lattice or interstitial p~ints This
sU9sestion was used by Feldblyum et a1 (1974) who then continued to
draw a compar I son between the 01 I gomer i sat ion mecran ism over nom0geneous
catalysis based on nickel salt and organoaluminium compounds and
heterogeneous catalysts based on nickel OXide on acid carriers This has
been discussed in detail In Section 1242 and summarised In Table
11 The conclusion reached by Feldblyum et a1 (1984) was that the
01 igomerisatlon of propene over nickel oxide sll iea alumina proceeds via
a complex hydride This mechanism proposed by them accounts for t~e
observed activity and selectivity of nickel oxide sll i3 alumina
Thus although no eVidence eXists to support or discount the mech~~lsm
proposed by Feldblyum and Baranova (1971) to expain the activity and
selectivdyof Silica alumina and FeldblYJm et a1 (1974) to $ltplaln
the activity and selectivity of nickel oxide 811 ica alumina they s~r~e
128
as a 900d model It is however clear that more work is reQuired to
explain these observations
In conclusion
ltI) The incorporation of nickel into sil ica alumina enhances the
catalyst activity at low temperatures and affects the
selectivity ie bullbull causes a shift to I ishter products
(II) The method of incorporating the nickel affects the activity and
selectivity o~ this catalyst
(III) The activity and selectivity o~ nickel oxide sil ica alumina
catalysts prepared by the HOD method are independent o~ the
nickel content In the case of IMP and SG type catalysts this is
not the case
ltIV) The selectivity and activity of HOD SG and IMP type catalysts
are all sensitive to the reaction temperature and pressure
(V) The 1 i~etime of HOD type catalysts when used for the
01 igomerisation of propene was 3uperior to that of the other
catalysts studied
(VI) HOD type catalysts are more active than any of the other
catalysts examined
(VII) HOD IMP and SG type catalysts are all sensitive to the feed
moisture content The introduction of a wet feed results in hish
initial activity followed by rapid deactivation The rapid
deactivation may be due to the conversion of Lewis aCld sites
to Bronsted acid sites in the presence of water
(VIII) The product spectra of HOD and IMP type catalysts are similar 3G
type catalysts however exhibit a greater selectivity towards
heavier products
(IX) HOD type catalysts can be used for the 01 igomerisation 0 hl9h
molar welght 01 igomers
129
REFERENCES
Allum KG bullbull United States Patent Appl ication No 3816555 (1974)
Bartlett PO Condon FE bullbull and Schneider Abull J Am Chem Soc bullbull 66
1531 (1944)
Blackmond DG and Ko E Appl Catal 13 49 (1984)
Boreskov OK bull in Preparation of Catalysts (Delmon Bbullbull ed)
Elsevier Amsterdam 223 (1976)
Brookes CS bull and Christopher GLM J Catal 10 211 (1968)
Cartwright PFS bullbull Newman EJ and Idilson DId bullbull The Analyst 92
663 (1967)
Cervello J bullbull Hermana E Jimlnez J bull and Milo F bullbull in Preparation of
Catalysts ltDelmon Bbullbull eds) Elsevier Amsterdam 251 (1976)
Clark Abullbull Ind Eng Chem bullbull 45 1476 (1953)
Coulson JM bull and Richardson JF bullbull Chemical Engineering Vol II
Pergamon Press New York (1980)
Couper A and Eley D Dbull Discussions Faraday soc 8 172 (1950)
Dorling LA Lynch 13 IdJ and Moss LL bull JCatal 20190 (1971)
Dow IdM and Jakob Mbull Chem Eng Pro 47 637 (1951)
Dowden DA J Chem Soc bullbull 242 (1950)
Dutkuwicz RK bullbull Energy 1980 An Energy Pol ICy DiScussion Document The
Energy Research Institute- UCL 1980
Evans AG bullbull and Polantl ~L NatJre 152 733 (1947)
Feldblyum VSh bull and Baranova rT ZhlJrnal Orsanichesoi Kiml 7
2257 (1971)
130
FeldblyYm V Sh bullbull Petryshanskaya NV bullbull Lesheheva AI bullbull and Baranova
11 Zhyrnal Organischeskoi Khimii 10 2265 (1974)
Finch JN bullbull and Clark A JCatal bullbull 13 147 (1969)
Fontana CM bullbull and Kidder GA bullbull J Am Chem Soc bullbull 70 3745 (1948)
Forni L bullbull Catalysis Reviews Vol 8 (Heinemann Ht ed) Marcell
Dekker New York (1974)
Galya LG bullbull Occelli ML bullbull and Yoyng DC J Mol Cat 32 391
(1985)
Heertjiesl PM and Mc Kibbins SiAl Chem Eng SCi bullbull 5161 (1956)
Hermans LAM bullbull and Geys JN in Preparation of Catalysts II
(Delmont Bbullbull Grange P bullbull and Jacobs P eds) Elsevier The
Netherlands (1979)
Higley DP EYropean Patent Appl ication No 843052143 (1984)
Hill FN bullbull and Selwood PW J Am Chem Soc 71 2522 (1949)
Hirschler AE Am Chem Soc Meet Chica30 Sept 1970 Reprints
Div of Petrol Chem 15 A97 (1970)
Hogan JP Banks RL Lanning WC bullbull and Clark Abullbull Ind Ens Chem
47 LI (1955)
Holm VCF bullbull Bailey GC bullbull and Clark A Ind Eng Chem bullbull 49 250
(1957)
Holm VCF and Bailey GC bull and Clark A bullbull JPhys Chem 63 129
(1959)
Hoyalla M and Delmon B bullbull Surface and Interface Anal 3 103 (1981)
Hunter WH bullbull and Yohe RV bullbull J Am Chem Soc 55 1248 (1933)
Imal Hbullbull and Uchida Hbull Bull Chem Soc Japan 38 925 (1965)
Imai H Hasesawa L and Uchida H Bull Chem 30c Japan 41 45
( 1968)
131
Johnson 0 bullbull J Am Chem Soc bullbull 59 827 (1955)
Langlois GE bullbull Ind Eng Chem 45 1470 (1953)
Leva Mbullbull Fluidisation McGraw and Hill (1959)
LevensPlelO bullbull Chemical Reaction Engineering 2nd ed bullbull John Wiely and
Sons (1972)
Maatman RW bullbull and Prater CD Ind Eng Chern bullbull 49 2 (1957)
McNair HM bullbull and Bonell i EJ bullbull BasiC Gas Chromatography 5th ed
Varian Instrument Division (1969)
Mickley HS bullbull and Fairbanks DF bullbull AI Ch EJ 1 374 (1955)
Miller SJ bullbull US Patent 4608450 (1986)
Mizuno K bullbull Ikeda Mbullbull Imokawa T bull Take J bull and Yoneda Ybullbull Bull
Chem Soc bullbull Japan 49 1788 (1976)
Montes Mbullbull Penneman de Bosscheyde Cbullbull Hodett BK bullbull Delannay F bull
Grange P bullbull and Delmon B bullbull Appl Catsl 12 309 (1984)
Norrish RGIJ and Russell KE bullbull Trans Faraday Soc bull 43 91 (1952)
Ozaki Abullbull and Kimura K JCatal 3 395 (1964)
Ozaki Abullbull Ali H and Kimura K bullbull FOJrth Int Cong Catal Moscow 40
(1968)
Peri JB JCatal 41 227 (1976)
Ramser JH and Hill PB bullbull Ind Eng Chem bull 501 (1958)
Richardson JT and Dubus RJ bull J Catal 54 207 (1978)
Sato Mbullbull Aonuma T and Shiba T Poc Third Int Con-l Catal
Amsterdam 1964 1 396 (1965)
Schmerl ing L and Ipatieff )N bull Advances in catalysIs II New York
AcademiC Press Inc 21 (1950)
sc h u lt z R G S c h tJ C k J M and IJ i 1 d I B Cbullbull J Cat a1 6 385 (1 966
132
Shepard FE Roohes JJ bullbull and Kemball Cbullbull JCatal 1 379 (1962)
Smith JM bullbull and Van Noss HC bullbull Introduction to ChemIcal Engineering
ThermodynamiCs 3rd Edition McGraw and Hill International Book Company
New York (1981gt
Takahashi Kbullbull Sasaki 0 bullbull Aomura Kbullbull and Ohtsuka H Hokkaido Daisaku
Kogakubu Kenkyu Hokoku 53 201 (1969)
Takahashi K bullbull NishiH Yoneda Nbullbull and Ohtsuka Sekiyu Gakkai Shi 15
482 (1972)
Tamele MW bullbull Ind Eng Chem 8 270 (1950)
Thomas CL Ind Eng Chem bullbull 37 543 (1945)
Ublad AG bullbull Mills GA Heinemann Hbullbull Polymerization of Olefins
Emmet (ed) Catalysis 5 New York (1958)
Uchida H and Imai Hbullbull Bull Chem Soc Japan 35 995 (1962)
Van Dillen JA bullbull Geus JW bullbull Hermans LAM bullbull and Van Der Mejden Proc
Sixth Int Congo Cata] B7 (1976)
Walton AG bullbull in Dispersion of Powders in liquids (Parfitt GD bullbull ed)
Elsevier Amsterdam 122 (1969)
Ward JW bullbull and Hansford RC bullbull J Catal 13 154 (1969)
Weeks TJ bullbull Jr bullbull Angell CL Ladd IR bullbull and Bolton AP JCatal
33 256 (1974)
Whitmore FC Ind En2l Chern 26 94 (1934)
Yagi S bullbull and Kunii Dbullbull Fifth Int Symp on Combustion Reinhold (ed)
New Yor k 231 (1955)
133
APPENDIX A
1 Gas chromato~raph data
11 Gas samples
The settin~s used on the Gow-Mac 750p ~as chromato~raph tor all teed and
tail ~as analyses are 1 isted below
Chromatograph Go Mac 750p
Detector Flame ionisation
Attenuat ion 1
Range 10- t 0 ampsmV
Data system Varian 4270
Column length 55 m
Column diameter 4 mm
Column pressure 28 psi at 50C
Pack ing n-OctanePoracil C
N2 tlowrate 41 mlmin
H2 fl owrate 31 mlmin
Air flowrate 300 mlmin
Injector temp 150C
Detector temp 250C
Temp pro~ 10 min at 50C 10Clmln b 120C
5 min at 120C
Sample volume 10~1
111 Cal ibration
It IS well establlshed in the 1 iterature that the area percents of
components are not directly proportIonal to the mass percent ie
different components have different detector responses It IS therefore
necessary to determine correction factors Once determined these
correction factors can be ~sed to calculate the composition on a mass
basis Two gas standards were avaIlable the compOSition of which ere
shown in Table A-l
134
Tab1e A-l Gas standards composition
Stan dar d Species Mole ~ Mass
1 Methane
Ethane
Propane
Butane
228
292
298
182
101
243
363
293
2 Propane
Propene
520
480
532
46S
Each standard was injected M times (M L 3) into the GC and the area
Counts and retention times recorded The results were then normal ized to
el iminate any discrepancies while injectin9J usin9 the eQuations shown
below These eQuations were adopted from McNair and Bonell i (1969) To
normal ize area counts use
For i = 1 to M
where
M is the number of samp1es
N is the number of components
ACI J is the area count of component in sample as recorded by
theGC bullbull and
APi is the mean area percent or component i
and to normal ize retention times use
RIi = J1 (~IijACiJ For i = 1 to MI
t ~1 J ~1 AC i I
Ilhere
Ri ij IS the retention time of comoonent i In samp1e j and
RIi is the mean retention time of Component 1
135
Once the mean area percent of each component had been establ ished the
rat io (AR) of the area percent (APt) to mass percent (MPt) was
calculated using
The response factors (RF i ) are calculated using
These factors are relative to propane ie the response factor for
propane was arbitrarily set equal to unity A detailed sample
calculation using the above procedure is ~iven in Table A-2
Table A-2 Area percent and retention tIme normalisation
Standard 1
Spec i es Methane Ethane Propane Butane
(N=4) ( i =1) ( i=2) ( i =3) ( i =4)
AC i j t 94792 241206 346861 371930
RT i j t 35 43 62 111
AC i j 2 82857 213323 308409 332568
RT i j 2 35 43 62 111
ACijJ 86832 215668 314257 322218
RT i j bull J 35 43 61 111
APi 90 229 331 350
RTi 35 43 61 111
MPi 101 243 363 293
AR 089 094 Dl 12
RFi 102 097 100 076
136
Table A-2 Area percent and retention time normalisation (continued)
Standard 2
Species Propane Propene
(N=2) ( i =2)
ACij-t 521001 593387
RT i j bull t 61 74
AC i j 2 55278 64241
RT i j 2 62 74
AC i J J 45750 56275
RT i j J 61 74
APi 466 534
RTi 61 74
MPi 532 468
ARi 088 114
RFi 1000 077
Under the same detector conditions these factors can be used time and
time a9ain to calculate the mass percent of the components in the
standards relative to propane
To calculate the composItion on a mass basis of an unknown mixture the
equation used is
MPi
A sample calculation usin9 the above equation and the GG output from
an independent injection of Standard 1 is shown In Table A-3
137
Table A-3 Error determination
Species MPI MPcalc Error
Methane 109318 102 101 103 16
Ethane 273475 097 243 243 03
Propane 394953 100 363 364 01
Butane 414146 076 293 290 09
~ (E 2 ) = 34
A typical spectrum obtained (f~ed gas) is summarised in Table A-4 and
shown in Figure A-i Traces of species found in the feed but for which
no standards were available were assigned response factors of vnity As
the total contribution of these on an area basis was less than one
percent the error introduced should be negl i~lbly small
Table A-4 Feed composition
Species Retention time Response factor Mass r
Methane 35 102 00
Ethane 43 097 092
Propane 61 100 198
Propene 74 077 780
Iso-Butane 110 100 019
N-Butane 11 1 076 023
i-Butene 136 100 043
Iso-Butene 147 1 00 004
T2-Butene 153 100 009
C2-Butene 159 1 00 005
C5 + 193 100 017
138
I m ~ t gt z m
ImiddotIi Ii I
il I
I
I I i
l~~0 0 Z z -ln n 0 0 Vgt I I VgtNN deg OgtJJ COOIIdeg 0 0 ICC 1ClliX) gt m Cll -l -lCllCC Z Z Cgt mC-l-l m m -l Z Z-lmm
gt m m m Z Z z zmm m m
Fi~ A-I GC SPECTRA OF FEED
139
12 Liquid samples
The settin9s I isted below were used for all I iQuid samples
Chromatograph Varian 3400
Auto sampler Varian 8000
Data system Varian CDS 401
Detector Flame ionisation
Attenuat ion 1
Range 10- Of ampsmV
Column length 3 m
Column diameter 4 mm
Column press 18 psi at 40 C
Packing 31 Sil iconOV-10l on Chromosorb W-HP
100120 mesh
Nz flowrate 30 mlmin
Hz flowrate 30 mllmin
Air flowrate 300 mlmin
Injector temp 250C
Detector temp 300C
Temp Pro9 5 min at aoc lOCmin to l80C
30Cmin to 300C 5 min at 300C
Sample volume 1 ~I
121 Calibration using mass spectroscopy
Due to the complex nature of the I iQuid products the analysiS of the
I iQuid spectra was difficult To facil itate product analysis it ~as
decided that the liquid product analYSis be based on carbon number
groupings rather than on indiVidual components A direct comparison
between the spectra obtained by the GC and MS was not possible due
to hardware and software differences The trends in the spectrum
obtained were however the same and in this way carbon number~ could b~
allocated to the GC spectrum
A typical spectrum of the GC-MS is shown in Fi9ure A-2 The
molecular wei9hts of the components ~esponsible For the peaks as
determined by mass spectroscmiddotpy are shown In this FIJre As a
comparison a sas chromatogram uSln3 the Varian 3400 IS shown In
140
r------------y-~
+ cO -shy
U
LJ -shy
u Ishy
= c - 0
t-Clt 0 a~
t Cl-=gt ct- l shy J
C-~ IL ~ 0 r (t
ot- l shy
f u w Q ~ (j)
co t~ (j)r-J
Gl u [- u
t~ ~
J lt u shyCI gtshyl-
N I
W lt
(JshyU
U ~
IL
M U
Hlpoundl
---------
---- ---
141
~Lgt-------- --- -------_____
_____~L
ltlt
I
C1 U
---~~------- --~-----~------~~--
u___---s-----======~--=-----~~a
1 -------------- ----------shy
142
F i 3ure A-3 Us i ns the data from the M S carbon numbers cou 1 d be
assisned to the peaks on the sas chromatosram and so the start and end
times of the various sroups established The groupings used are shown in
Table A-5 as is a typical 1 iquid compositIon
Table A-5 Typical liquid composition and retention time windows
Group Mass r Retention times
start stop
Monomer 495 000 102
oimer 610 102 470
Trimer 243 470 112
Tetramer 813 112 157
Pentamer 162 157 185
Hexamer 000 185 205
Heptamer 000 205 280
The response factors of these groups were taken as unity which was
justified in VIew of work done by Dietz (1967) on the relative
sensitivity of hydrOCarbons The results reoorted in mass oercent are
therefore a reasonable representation of the actual composition
0 200 0
100 VAPeUR PHASE
Jgt
600+ m z 0 x
w 500+
fLUID PHASE
L 400I-a III
1I QU I D PHASE W 0 300 =gt III
(f) III(f)
t WW
00
-600 --300 -100 100 300 600 700 900 1100
TEMPERRTURE C
FIG B-1 DEW pe I NT TEMPERATURE ( C) AND BUBBLE pe I NT TEMPERATURE (C) VS PRESSURE (ATM)
20 MelEi PRePANE AND 80 MelEi PRePENE ~
I J
II
SYNOPSIS
A synthesis techniQue was developed for the preparation of a nickel
oxide sil ica alumina catalyst The propene oligomerisation activity and
the selectivity of the catalysts prepared by homogeneous decomposition
deposition (HDD) were investigated and compared with nickel oxide silica
alumina catalysts prepared by the techniQues of impregnation (IMP) and
co-precipitation (SG) Amongst others the effect of the nickel content
reacti6n temperature and pressure and water content of the feed on the
activity and selectivity were investigated Also investigated were the
lifetime of the various catalysts and in the case of HDD type
catalysts the ability to 01 igomerise high molecular weight hydrocarbons
(Cb)
Nickel oxide silica alumina prepared by the HDD method is more active
for the propene 01 igomerisation than catalysts prepared by the IMP and
SG methods The product spectrum in the case of IMP and HDD type
catalysts are similar with a propene dimer (Cb) being the main product
In the case of SG type catalysts however a shift to heavier products
was observed ie propene dimer (Cb) and trimer (Cq) were formed in
eQual Quantities It is proposed that the increase in activity of HDD
type catalysts was due to a large extent of metal dispersion and
distribution and a stronger interaction between the metal and the
support It is also proposed that the metal is readily accessible to the
reactant molecules
The activity and selectivity of catalysts prepared by the HDD method
were independent of the nickel content This was not the case for IMP
and SG type catalysts both of which showed decreasing activity with
increasing nickel content when the nicke1 content was increased beyond 5
wtX
The lifetimes of the various catalysts were also examined From the
results obtained over the first 10 h the lifetime of HOD type
catalysts was superior to that of the other catalysts studied The
activity and selectivity of the various catalysts were sensitive to the
reaction conditions Thus moving into the vapour phase by either
increasing the temperature at a fixed pressure or decreasing the
pressure at a fixed temperature was in each case acCompanied by a shift
to heavier products and a decrease in activity
I
THE OLIGOMERISATION OF PROPENE OVER
NICKEL OXIDE SILICA ALUMINA
BY
STEFAN MATHIAS HARMS
BSc (Eng) (Cape Town)
Submitted to the University of Gape Town in
fulfilment of the requirements For the de3ree
Master of SCIence in Engneerlng
( 1987)
II
SYNOPSIS
A synthesis technique was developed tor the preparation Ot a nickel
oxide silica alumina catalyst The propene oligomerisation activity and
the selectivity Ot the catalysts prepared by homogeneous decomposition
deposition (HOD) were investigated and compared with nickel oxide sil ica
alumina catalysts prepared by the techniques ot impregnation (IMP) and
co-precipitation (SG) Amongst others the ettect Ot the nickel content
reaction temperature and pressure and water content ot the teed on the
activity and selectivity were investigated Also investigated were the
1 ifetime Ot the various catalysts and in the case ot HOD type
catalysts the ability to 01 igomerise high molecular weight hydrocarbons
(Cb ) bull
Nickel oxide silica alumina prepared by the HOD method is more active
for the propene 01 igomerisation than catalysts prepared by the IMP and
SG methods The product spectrum in the case ot IMP and HOD type
catalysts are similar with a propene dimer (C~) being the main product
In the case Ot SG type catalysts however a shift to heavier products
was observed i e propene dimer (C6) and trimer (C~) were formed in
equal Quantities It 19 proposed that the increase in activity Ot HOD
type catalysts was due to a large extent of metal dispersion and
distribution and a stronger interaction between the metal and the
support It is also proposed that the metal is readily accessible to the
reactant molecules
The activity and selectivity of catalysts prepared by the HOD method
were independent of the nickel content This was not the case tor IMP
and SG type catalysts both of which showed decreasing activity with
increasing nickel content when the nickel content was increased beyond 5
wt
The 1itetimes ot the various ctalysts were also examined From the
results obtained over the first 10 h the 1 itetime egtf HOD tlpe
catalysts was superior to that ot the other catalysts studied The
activity and selectvity of the varIous catalysts were senSlt ive to the
reaction Conditions Thus moving into the vapour phase by either
increasln9 the temperature at a fi_ed press~re 0r decreasing the
pressure at a fixed temperature was In each case accompanied by a shif~
to heavier products and a decrease in actvity
III
The catalysts studied were very sensitive to the feed moisture content
The introduction of an undried feed resulted in a hi9h initial activity
followed by rapid deactivation IMP and HOD type catalysts after bein9
exposed to a wet feed were shown to be able to resain their normal
activity and selectivity after calcination
IV
AC KNOWLEDGEtlErHS
I would 1 Ike to express my sincere appreciatIon to Dr H KOJima and
Prof CT OConnor for their assistance and gUidance throughout the
duration of my study
Many thanks to Messrs D McClean L Jacobs) PM DIckens K Moller and
SSchwarz) for their friendshiP and helpful advice over the years
The following people and institullons are also gratefully acknowledged
SASOL and the Council for SIfrtific arid Industrial Research for
financial assistance
All on the ChemIcal Engineering Department stafF
Dr K Herzog for his assistance with the TG-OTA anAlysis
Miss 8 Williams for lhe mass spe(trosCopiC analmiddotSIS
Dr M Rautenbach for the use of his compuier pro9ramn
A speCial thanks to Alexandra For her help and patience
I would also like tegt thank my frmiddotgtther In3-br3 tor het cord Inou
support and patience
TABLE OF CONTENT
PAGE
SYNOPSIS II
ACKNOIIILEDGEMENTS IV
TABLE OF CONTENTS v
LI ST OF FIGURES x
LIST OF TABLES XVI
1 INTRODUCTION
11 Heterogeneous catalysis 2
12 Polymerisation using heterogeneous catalysts 3
121 Kinetics of the overall process 3
122 Polymerisation 6
1221 True polymerisation 6
1222 Conjunct polymerisation 9
123 Polymerisation on si 1 ica alumina 10
1231 Nature of active sites on sil ica alumina 10
1232 Structure of the products and proposed mechanism
on sll ica alumina 10
124 Polymer1sation on nickel OXide sll ica alumIna 12
1241 Nature of active sItes on nickel OXide sil ica alumina 12
1242 Structure of the products on nickel oxide 511 iea
alumina 13
1 25 Thermodnamics 15
13 Catalyst characterisation
131 Introduction 13
132 Catalyst syntheSIS methods 19
1321 Preparation with adsorption 19
VI
1322
1323
1324
133
1331
1332
1 34
14
1 41
1411
1412
1413
142
1421
1422
1423
1424
15
1 51
1511
1512
1513
1514
1515
152
1521
1522
1523
1524
1525
1526
1527
1528
152Q
16
17
Dryin9 of adsorbent sol ids
Preparation without adsorption
Dryin9 of non-adsorbed sol ids
Hom0geneous decomposition deposition
Theory of hom0geneous decomposition deposition
Nickel oxide silica alumina preparation usin9 a
hom0geneous solution
Co-precipitation
Physical characterisatlcs of the catalyst
Properties of sil ica alumina
Sur face area
Pore structure
Surface aCidity
Properties of nickel oxide on si1 ica alumina
Total surface area
Metal surface area and crystal size
Pore volume and size distribution
Metal support interaction
Catalyst po1ymerisation properties
Si1 ica alumina properties
Effect of Silica to alumina ratio
Effect of reaction temperature
Effect of space velocity
Product spectrum
Effect of activation
Nickel oxide si1 iea alumina properties
Effect of synthesis procedure
Effect of metal content
Effect of reaction temperature anJ pressure
Effect of feed compOSition and space velOCity
Effect of feed impurities
Effect of activation procedure
Effect of regeneration
Product spectrum
Lifeiime
ConclUSIon
Objective 0f research
PAGE
21
21
22
23
23
24
25
26
26
26
26
28
28
28
29
30
31
32
32
32
33
33
33
34
34
34
35
35
35
36
37 7-
37
38
VI
2 DESIGN OF ISOTHERMAL REACTOR
21 Fluidisation theory
22 Heat transfer
Fluidising medium23
231 Sand data
24 Optimisation of the fluidised bed
241 Air flow optimisation
242 Temperature correction
3 EXPERIMENTAL METHODS
31 The reactor system
311 Layout
32 Reactor
321 Fluidised bed
322 Integra1 reactor
33 Operation
331 Loading
332 Calcination procedure
333 Start-up
334 Steady state operation
335 Shut-down
34 Data analysIs
341 Computation of results
35 Analytical procedure
351 Gas analysis
352 UqU i d analysis
353 Nuclear masnetic resonance
354 TGDTA
355 Water content determination
356 o i st ill at ion
PAGE
42
42
43
44
45
45
49
51
53
53
53
56
56
58
60
60
61
62
62
63
63
63
65
65
65
tS6
68
69
69
VIII
36 Catalyst synthesis
361 Support preparation
362 Impre9nation
3621 Nickel concentration
363 Hom0geneous decomposition depositlon
3631 Nickel concentration
364 Coprecipitation
365 Determination of nickel content
366 Extrudate manufacture
4 RESULTS
41 Reproducibility of data
42 Effect of nickel content
43 Effect of pressure
44 Bed temperature profile
441 Effect of temperature
45 Lifetime and selectivity
46 Effect of WHSV
47 Effect of temperature runaway
48 Effect of water contaminatlon
49 liquid feed (Cit )
410 liquid and gas feed (Cl + Cit)
411 TGDTA
412 NMR
PAGE
71
71
71
71
71
72
73
74
74
7S
75
78
7S
82
86
90
95
95
95
98
98
101
5 DISCUSSION
105
112
129
133
IX
PAGE
6 REFERENCES
7 APPENDICES
7A APPENDIX A 133
1 Gas chromatograph data 133
11 Gas samples 133
111 Calibration 133
12 li QU i d samp 1es 139
1 21 Cal ibration using mass spectroscopy 139
7B APPENDIX B 143
1 Phase diaghram 143
x
LIST OF FIGURES
PAGE
CHAPTER 1
Figure 11 Activity of sil ica alumina catalyst for various
reactions as a function of sil ica to alumina ratio 2
Figure 12 Ranges of conversion for polymerisation of propene
on metal oxide sil ica alumina catalysts 4 wt~
Fi3ure 1 7 Conditions of a pore adsorbin3 activating material
Intersectin3 pores of different sizes before
dryin3 (A) and after evaporation of some of the
metal oxide impregnated on support 4
Figure 13 Free energy chan3e during dimerisation 16
Figure 14 Free energy change during dimerisation 17
Figure 15 Conversion obtainable in dimerisation reactions 17
Fi3ure 16 Polymerisation of propene 18
in solution 20
pore volume 1 iQuid (B) 22
Fi3ure 19 Phase diagram 25
Fi3ure 110 Si1 ica alumina surface area (m 2 g) vs alumina
content (mass~O 27
Fi3ure 111 Propene conversion (mass~) vs pressure (atm) 36
CHAPTER 2
Pressure drop over fixed and fluidised beds
Fi3ure 22 Convection coeffecient (Wm 2 K) vs partical
size (pm) 25 Q C
43
46
XI
Figure 23
Figure 24
Figure 25
Figure 26
Figure 27
Figure 28
CHAPTER 3
Figure 31
Figure 32
Figure 33
Figure 34
Figure 35
Figure 36
Figure 37
CHAPTER 4
PAGE
Convection coeffecient (Wm 2 K) vs partical
size (lim) 190degC 46
Reactor modifications to measure pressure drop 47
Pressure drop vs supperficial velocity aCross
disk and bed 49
Pressure drop vs supperficial velocity Integral
reactor absent 50
Pressure drop vs supperfictal velocity Integral
reactor present 51
Bed temperature (OC) vs rotameter tube reading (TR) 52
Vb=12 lmin
Reactor system 54
Integral reactor and fluidised sand bed 57
Integral reactor 59
Reactor bed 61
Batch distillation unit 70
Nickel content (massYo) vs mass of nickel nitrate
hexahydrate (g) 72
Nickel content (mass~O vs time (min) 73
Liquid production rate (Shgl vs time (h) 77
XII
FiSure 42
FiSure 43
Fisure 44
Fisure 45
FiSure 46
Figure 47
Fisure 48
FiSure 49
Figure 410
Figure 411
Figure 412
Figure 413
Figure 414
Fi3ure 415
PAGE
Liquid composition (mass)) vs time ( h ) 77
EHec t of nickel content
product ion rate (9hS)
(mass))
HOD
on 1 iQuid
79
EHect of nickel content
composition (mass) HOD
(mass~) on 1 iQuid
79
Effect of nickel content
production rate (ghg)
(mass~)
IMP
on liquid
80
EHect of nickel content
composition (mass~) IMP
(mass~O on 1 iQuid
80
Effect of pressure
rate (ghg) HO~
Effect of pressure
(mass) HOD
Effect of pressure
rate (ghg) IMP
Effect of pressure
(mass) IMP
Effect of pressure
rate (Shg) SG
Liquid composition
at 40 atm SG
(atm) on
(atm) on
(atm) on
(atm) on
(atm) on
(mass~)
1 iquid production
81
1 iQuid composition
81
1 iQuid production
83
1 iQuid composition
83
liquid production
84
vs time (h) 84
Bed
set
temperature profile ( deg C )
point 80degC SG-1
vs position ( Z ) I
85
Bed
set
temperature +PO n _ 80degC
fluctuations
S(7-1
( lt) C ) vs time (h) I
85
Bed
set
temperature profi le
point 210degC HDD-9
( 0 C ) vs POSition (Z)
87
XIII
PAGE
Figure 416 Bed
set
temperature fluctuations
point 210degC HOO-9
(OC) vs time (hl
87
Figure 417 Effect of temperature (OCl on 1 iQuid production
rate (ghg) HOD
Figure 418 Effect of temperature
(mass~) HOD
(OC) on
Figure 419 Effect of temperature
rate (ghg) SA
(OC) on
Figure 420 Effect of temperature
(mass~) SA
(OC) on
Figure 421 Liquid production rate
space velocity (ghg)
(ghg)
vs time
Figure 422 Liquid composition (mass) vs
Figure 423 Liquid production rate
space velocity (ghg)
(ghg)
vs time
Figure 424 Liquid composition (mass) vs
Figure 425 Liquid production rate
space velocity (ghg)
(ghg)
vs time
Figure 426 Liquid composition (mass) vs
Figure 427 Liquid production rate
space velocity (ghgl
(ghg)
vs time
Figure 428 Liquid c~mpositlon (massl) vs
Figure 429 Effect of weight hourly space
88
liquid composition
S8
liquid production
89
liquid composition
89
and weight hourly
(h) for HDD-3 91
time (hl for HDD-3 91
and weight hourly
(hl for IMP-2 92
time (h) for IMP-2 92
and weight hourly
(h) for SG-1 93
time (h) for 3G-1 93
and weight hourly
(h) for SA-3 94
time (hI for SA-3 94
velocity (ghg)
on 1 iQUld production rate IShg HOD 96
Figure 430 Effect of weight hourly space velocity (ghg)
on 1 iQuid composition (ma9s~) HOD 96
XIV
PAGE
Fi~ure 431 Effect of temperature runaway
rate (~h~) HDO-6 and HDO-7
usin~ same catalyst
on 1 iQuid production
consecutive runs
97
Fi~ure 432 Effect of temperature
composition (mass~)
(OC) runaway on liQuid
97
Fi~ure 433 Effect of water on 1 iQuid production rate
(~h~) HDO-5 re~eneration after HOD-4 99
Fi~ure 434 Effect of water contamination
composition (~h~) HO~
on 1 iQuid
99
Fi~ure 435 LiQuid production rate (~hg) and
(mass~) vs time (h) 1 iQuid laquo69degC
feed HOD-IS
conversion
fraction)
100
Figure 436 LiQuid composition (massYo) vs
laquo69degC fraction) feed HDD-1S
time (h) 1 iQuid
100
Fi~ure 437 LiQuid production rate (~hg) and conversion
(mass~) for propene vs time (h) liQuid
laquo69degC fraction) and gas feed HDD-19 102
Figure 438 LiQuid composition (mass~) of entire 1 iQuid
effluent vs time (h) liQuid laquo69degC fraction)
gas feed HDD-19
and
102
Fi~ure 439 LiQuid production rate (ghg) and conversion
(mass~) for propene vs time (h) liquid laquo69degC
fraction) and gas feed HDD-20 103
Figure 440 Liquid composition (mass)
sample vs time (h) 1 iquid
gas feed HDD-20
of entire 1 iQuid
laquo69degC fraction) and
103
~i9ure 441 Mass loss
for fresh
(X) and temperature ~iffe~ences (O()
catalyst 20 mg sample 104
104
xv
PAGE
Fi~ure 442 Mass loss (~) and temperature difference (OC) for
a calcined catalyst which has been exposed to air
19 m~ sample
Fi~ure 443 Mass loss (~) and temperature difference (OC) for
a used catalyst HDD-13 185 mg sample 106
Figure 444 Mass loss (X) and temperature difference (OC) for
Figure 445 Mass loss (X) and temperature difference (OC) for
Figure 446 Mass loss (~) and temperature difference (OC) for
a used catalyst IMP-1 18 mg sample 106
a used catalyst HDD-l17 m9 sample 107
a used catalyst SG-3 17 m9 sample 107
Figure 447 NMR spectra of 1 iquid product from run IMP-l 108
Fi~ure 448 NMR spectra of liquid product from run SG-3 109
Figure 449 NMR spectra of liquid product from run HDD-l 110
CHAPTER 7
7A APPENDIX A
Figure A-I GC spectra of feed 138
Figure A-2 Typical GC- MS spectra of 1 iquid product 140
Figure A-3 Typical GC spectra of liquid product 141
APPENDIX B
Figure B-1 Dew point temperatYre (OCI and bubble point
temperature (OC) vs pressure (atm) 20 mole~
propane and 80 mole~ propene 143
XVI
LIST OF TABLES
PAGE
CHAPTER 1
Table 11 Analogy in the mechanism of the catalytic action
homogeneous and heterogeneous system for the
dimerisation of olefins
of
14
Table 12 Characterisation of supported metal catalysts 26
Table 13 Pore volume and
and adsorbents
size distribution of fresh catalyst
27
Table 14 ACid
heat
content
treated
(total and
at 550degC
Bronsted) for silica alumina
28
Table 15 Surface area of nickel oxide sil ica alumina prepared
by Impregnation and coprecipitation as a function of
nickel content The si1 ica to alumina weight ratio was
91 29
Table 16 Surface area of nickel oxide si1 ica alumina as a
function of the alumina content Nickel content held
constant at 61 wtr 30
Table 17 Surface area of nickel oxide si1 ica
function of nickel content Alumina
at 43 wtr
alumina
content
as a
was held
30
Table 18 Nickel metal area from H2 chemisorption at 250degC
and 100 mmHg vapour pressure and from X-ray
diffraction 1 ine-broadening 31
Table 19 Pore volume and radius of a nickel aiumina ratalyst
with varYing alumina content Nickel content held at
4 wtx 31
Table 110 Pore volume and radius of a nickel oxide si1 ica
alumina catalyst with varYlng nlckel content
Alumina content held at 43 wtX throu9hout 32
XVII
PAGE
Table 111 Propene 01i90merisation on silica alumina at a
constant pressure of 50 atm and varyin9 temperature
Sil ica to alumina ratio used was 94 to 3 throu9hout 33
Table 112 Product distribution of propene 01 i90merised over
sil ica alumina as a function of temperature
Reaction pressure is 50 atm 34
Table 113 Relationship between product distribution and
reaction conditions 39
Table 114 Propene conversion and product spectrum as a
function of space velocity silica ta alumina ratio
is 9 to 1 throu9hout 40
CHAPTER 2
Table 21 Sand size fractions 48
CHAPTER 3
Table 31 Feed composition 65
Table 32 Carbon number groupings used for 1 iQuid analysis 66
Table 33 Structure definitions of terms and NMR spectral
positions and area code 67
CHAPTER 4
Table 41 Reaction data 76
Table 42 Integrated areas 111
Table 43 Carbon areas and branching 111
XVIII
PAGE
CHAPTER 7
7A APPENDIX A
Table A-1
Table A-2
Table A-2
Table A-3
Table A-4
Table A-5
Gas standards composition
Area percentage and retention
Area percentage and retention
(continued)
Error determination
Feed composition
Typical 1 iQuid composition and
windows
134
time normal isation 135
time normal isation
136
137
137
retention time
142
1
1 INTRODUCTION
In South Africa the oil from coal industry has developed the first
commercial process whereby sYnthetic fuels are produced from coal via
gasification usin9 Fisher Tropsch catalysts It started In 1943 when the
AmerIcan rights to the Fischer Tropseh process were purchased by South
A f ric a I n 191 0 the Sou t h Af I i can 0 i 1 C0 a 1 and Gas C() r p 0 r a ti (gt n (S A S 0 Ll
was formed The first plant Sasol I with a capaCity of 4130 barrelsday
went into opel-atlon in 1954 (OUtkUW1CZ 1981ll It used two type of
reactors namelv the Arge fixed bed and synthol fluidlsed bed reactors
Two further plants Sasol II and Sasol III which are Improved and
enlarged versions of Sasol I wert later built eAch having i3 CClfacit (f
35900 barrelsday (Dutkuwicz) 1980) In both of these planl~ onl~ the
synthol reactors are used Due to th~ nature of ihe process Sasol
pr oduces 1ar3e Quant It i es of 1 i ght hvdr ocar bon gilSfS anoun t i n3 to
approximatelv 15-106 mZday These are partly r~tlculated to local
i n d us try and par tl y Con v e r ted I 1 a a cat a 1 yt I C (middot1 i 30 rr euro r I s d ion p r (J C esst (gt
1 i 9h t f IJ e1sth euro r eby inc r e a s Jr13 the 0 I er I 1 r) r (l dII ~t Ion I n t e r mS 0 f
barrels of I iquld fuel produced per ton of coal procESSE-d Currentll
Sasol I can more than satisfv he loal dernnd dnj therefol~ the light
hydrocarbons from Sasol II and Sas()l III represent elaquo~s Buppl
The catalvtic oli90merisation process referred to abrve ISPS the
conventional phosphoric Reid catalyst to oli30fllPrisE lhe light
hydrocarbons to 1 iquid fuels This process howltver ~Ir(gtdIJCeS poor qlal ity
pet r 0 I and dies e I and the (a tal s tis C (I r r lt) s i v
The present study investigated an alternative catalyst For the catalytic
oligomerisation of li3ht hydrocarbons to 11qllid fllel Ilsin3 a nickel
oxide sil iea alumina catalyst synlhesls~d via methorl adopt0d by the
aulhor from (gtlork done bi van Dillen el 031 ()976) Al1l()lgh rlikel (Idne
SilIca alumina catalysts have Geen Ideli stldied (Tahahashi et a1
1969 Hogan et al 195 Holm 1917 [tt) the- ltgtrthe=~ fII~~H)d
developed in this work will produced a moreuro HC t i ve
catalyst With greater resistance to deactivation and greater selectivity
to linear C6 than those recorded f()r nickel oxide silica alJroina
catalysts produced viB the standard impregnation technIQue In this way
it is hoped to produce a beUer qual ity diesel than p~ssjble over the
standard irnprelnated nickel oxi de i I ica alumln1
2
11 Heterogeneous catalysis
As the silica alumina support in a nickel oxide silica alumina catalyst
is a catalytically active solid oxide insulator its catalytic properties
as well as those of nickel oxide on silica alumina have to be examined
In what ollows a brief review 0 the catalytic properties 0 both is
given
The oxides and halides of the lower elements of sroups III IV and V of
the periodiC table tend to cata1yse pOSitive ion or acid type
reactions such as polymerisation alkylation cracking and
isomerisation One of the most active solid oxide insulators is siliCa
alumina In Fi9ure 11 (Clark 1953) the rate of reaction is plotted
against the weight percent sil ica in a silica alumina catalysts for
various reactions viz bullbull hydrogen transfer propene polymerisation
ethene hydrogenation and hydrogen deuterium exchange It Can be seen
from this figure that the reaction velOCity constants of the acid type
reactions such as hydrosen transfer and propene polymerisation roughly
parallel the changes in catalyst acidity
~=H-D EXCHANGE AT 300degC K-10- t
~=ETHENE HYDROGENATION AT 500degC
+=HYDROGEN TRANSFER AT 340degC K-l0 DECALIN-l-BUTENE
X=PROPENE POLYMERISATION AT 200degC K-l0 J
60
50 u UJ ()
shy I- 40 z ~ lshy()
Z o 30 u
UJ Ishy~ 0
200 UJ 0 0 0
I- 10 ()
0 U
00
00
~=ACIDITY MILLI EQUIVALENTS PER GRAM middot10~
I
700 800 900 1000100 200 300 400 500 600
WEIGHT ~ SILICA
FIGURE 11 ACTIVITY OF SILICA ALUMINA CATAL1STS FOR VARIOUS
REACTIONS AS A FUNCTION OF SILICA TO ALUMINA RATIO
100
xUJ- ~ 060 -UJ ltII
Ishy 0UJ UJ Qltre ()
I () ()z ~ Ishy60 0 Q z UJI- 0 - ~ UJ ~ Z Q gtUJ ltI 0 gt 0 Ishy UJ40 0 UJ 0 ~ Igt- Z -I UJ - ltI UJ 0 xZ 0 UJ 0 II gtshy20 I- gtshyI IshyUJ
0-u ~
o
3
The reactions which occur readily on the transition metal oxides such
as hydrogen-deuterium exchange which gives a reasonably good indication
of hydrogenation-dehydrogenation activity and ethene hydrogenation
proceed slowly even on pure alumina and the rate decrease to
insignificant values with increasing si1 ica content Conversely
transition metals are poor catalysts for aCid-type reactions
Transition metal oxides alone or supported on weakly acid oxides such
as alumina show only a small activity for acid type reactions such as
the polymerisation of the low boiling point olefins When however
these oxides are supported on strong acid oxides such as silica alumina
they are capable of giving an increased activity as indicated in Figure
12 (Clark 1953) which shows data on the po1ymerisation of propene
The details oT the mechanism by which these metal oxides supported on
silica alumina give an activity greater than that over sil ica alumina
alone are not clear Using Tame1es method of butylamine titration
there are some indications oT an inCrease in acid content of the active
metal oxide promoted catalyst over that of silica alumina alone (Clark
1953) A detailed discussion of the mechanisms proposed and nature of
the active sites is given elsewhere
The following conclusions may therefore be drawn from
Figure 12 with respect to propene polymerisation
- the oxides of metals in group V and higher of the periodiC table
loaded on silica alumina alone give increased activity over silica
alumina
- the oxides of metals in group IV and lower of the periodiC table give
activity below that of sil ica alumina
- redUCing the metal oxides causes the activity oT the catalyst to drop
below that of silica alumina
12 Polymerisation using heterogeneous catalysts
121 Kinetics of the overall process
The overall kinetics of the process can be summarised by five steps It
must however be noted that at times some of these steps are not present
The steps are
Step 1 Diffusion of reactants through the Nernst diffusion
layer a 1 iquld film surrounding the catalyst
particle to the outer surface of the catalyst
4
Catalyst preheated Catalyst oreheated
in H at 500degCin air at 500degC
100100
9090
so80
7070
Oxides Ot V Cr Mo ~ Mn Fe Co Ni 6060
50so
ao40
SiOmiddotdAlzO 3030 1 [
Oxides ot V Cr Mr Fe Co Ni 2020 [ 10
Group I-IV
1 Oxides Ot Na Cu Ag M3 Zn Ba ICe Ti Z r bull
Pb Th
10
[ 00
Fig 12 Ranges Ot conversion tor polymerisation Ot oropene on metal
oxide silica alumina catalysts 4 ~t~ metal oxide impregnated on
support
5
Step 2 Penetration and diffusion of the reactants through
the blanket of graphitic carbon andor hydrocarbon
deposits to the internal surface and into the
unreacted core
Step 3 Reaction of the reactants at an active site
Step 4 Diffusion of the products through the unreacted core
and the blanket of graphitic carbon andor
hydrocarbon deposits back to the outer surface of
the solid
Step 5 Diffusion of the products through the fluid film
back into the main body of the fluid
The resistances of the different steps usually vary greatly from one
another The step with the highest resistance is considered to be the
rate controll ing step This rate controll ing step can often be
identified via simple tests (see Levenspiel 1972)
For optimum catalyst util isation a high matrix diffusivity is
desirable At any given condition if the rate of chemical reaction is
higher than the rate of diffusion reactants cannot be supplied fast
enough to the active site to establish an eQuil ibrium concentration The
reaction therefore oCcurs only in the outer shell of the catalyst
particles and a significant number of active sites inside the particle
are unused Large matrix diffusion resistance therefore results in
molecules reacting before they penetrate into the interior of the
catalyst particle The rate is then controlled by either film diffusion
or the rate of chemical reaction on the active surface whichever is the
slower step
The overall reaction rate is also influenced by the reaction
temperature The rate of diffusion however increases at a slower rate
than that of the chemical reaction and so at high temperatures pore
diffusion or film diffusion becomes the rate controll in9 step
Insufficient agitation and a hi9h viscosity of the solution can result
in large film thickness and hence favour a film diffusion controll in9
mechanism
6
122 Polymerisation
To date the most widely accepted mechanism for the polymerisation of
olefins is that proposed by Whitmore (1934) and involves the carbonium
ion One of the most pronounced characteristics of acid catalysed
reactions involving the carbonium ion is the lack of specificity
(Langlois 1953l Almost never is only a single product formed and even
under the mildest conditions a large number of compounds are formed
Schmerling and Ipatieff (1950) have distinguished two classes of
polymerisation true polymerisation in which the reaction prodycts are
mono-olefins with molecular weights intergral multiples of the monomer
molecular weight and Conjunct polymerisation in which the reaction
products are a complex mixture of olefinSt diolefins paraffins
naphthenes cyclo-olefins and aromatics Both will now be discyssed in
deb i 1
1221 True polymerisation
The carboniYm ion is formed in the presence of a hydrogen acid by the
addition of a proton to the electron pair of the double bond ie bull
H H H H H H C C C H2 + HX+ - gt H C C C H + X- ( I )
H H H
It is not proposed that a free alkyl carbonium ion exists in the
hydrocarbon solytion but that it remains within a short distance from
the anion of the catalysts and that the two exist in the form of an ion
pair (Langlois 1953) As the degree of separation of the carboniym ion
from the Bronsted site is of no importance in the explanation of the
reaction mechanism it is sufficient to postulate the existence of an
alkene with a positive charge on a particular carbon atom The term
carbonium ions will be ysed in subseQuent discussions and represented as
shown in eQyation (I) above without showing the anion although its
presence somewhere near the pOSitive charge IS to be ynderstood
(Langlois 1953)
The halide catalysts are aCidic only in so far as they are electron
acceptors Hunter and Yohe (1933) postulated that the active complex in
the absence of hydrogen halide oromoters is formed by the addition of
the catalysts to the olefin In this way the metal hal ide functions in a
manner similar to that of a proton and may be considered to be an aCidiC
catalyst (Schmeling and IpatieH 1950gt
7
Cl H H Cl H H
Cl Al + CC -) Cl Al CC+ (II ) ~ ~
Cl H H Cl H H
It has however been found that the halide catalyst requires a coshy
catalyst such as water tert-buty1 alcohol or acetic acid all of which
contain an active proton to be active for polymerisation Fontana and
Kidder (1948) found that the polymerisation of propene on a halide
catalyst was approximately proportional to the concentration of the
promotor used which was confirmed by Norrish and Russel (1952) who found
that in the polymerisation of isobutene with stannic chloride a Coshy
catalyst such as water was necessary that the rate of reaction was
proportional to the concentration of the co-catalyst and that the
maximum rate was achieved when water and stannic chloride were present
in eQuimo1ar proportions
It is thus probable that the reactions proceed throu~h an intermediate
from the reaction of the olefin metal hydride and promotor with the
latter servin~ as the source of the proton necessary for the production
of the carbonium ion viz bull
R-CH=CH2 + BF3 + H20 (-) R-CH-CH3 + BF30Hshy (II I) +
It appears that reaction (II) does not oCCur to any appreciable extent
or if it did that the resu1tin~ complex would not have any appreciable
activity for the initiation of po1ymerisation It is probable
therefore that in all cases the effective catalyst for the acid
cata1ysed po1ymerisation of olefins are acids In the more restricted
sense that they must be able to supply a proton to initiate the reaction
(Lan~lois 1953)
Of the olefins of low molecular weisht isobutene is polymerised the
most readily with acid catalysts N-butene and propene are polymerised
less readily while ethene is polymerised only with difficulty From
this and information drawn from the composition of the reaction
products ~hitmore (1934) reached the conclusion that a tertiary
carbonium ion is the most stable a secondary ion less stable and a
primary ion least stable Evans and Polanyi (1947) calculated proton
affinities of the doubly bonded carbons in isobutene propene and
ethene Their calculations showed the proton affinity of the primary
carbon of the double bond to be in the order isobutene gt propenegt
ethene and furthermore that the proton affinity of the primary carbon of
the double bond is sreater than that of a secondary or tertiary carbon
8
of the double bond for the cases of propene and isobutene These
calculations confirm the early empirical observations In accordance
with this concept we should expect the followins carbonium ions fro~
isobutene and propene
(probable)
and
(probable)
The possibil ity of the formation of minor quantities of the two less
favoured isomers cannot be excluded particularly at hish temperatures
but the species indicated should be the predominant ones Whitmore
(1934) postulated that a carbonium ion once formed may underso a
variety of reactions
Addition of a nesative ion X with the net result beins the addition of
HX to the double bond
R-CH-CHJ + X- (-) R-CH-CHJ + X
Addition to the double bond of an olefin to form a new carbonium ion
this is the polymerisation step
R-CH-CHJ + CH2=CH-R (-) R-CH(CHJ)-CH2-CH-R + +
Elimination of a proton to form the oriSinal olefin or a different one
R-CH(CHJJ-CH2-CH-CHJ +
R-CH(CHJ )-CH=CH-CHJ + H+
Migration of a proton with its bonding electrons from another carbon to
the atom deficient in electrons leaVing a new carbonium ion
9
CHJ-CH(CHJ)-CH-CHJ (-) CHJ-C(CHJ)-CH-CHJ + +
Mi~ration of a methyl ~roup with its two electrons to the positive
carbon atom generating a new carbonium ion with a new skeletal
arran~ement
CHJ-C(CHJ)2-CH(CHJ)-CH-CHJ (-) CH3-CCH3 )-CH(CHJ)-CH(CH3)-CH3+ +
Extraction of hydro~en from another molecule to form a saturated
molecule and a new carbonium ion
RH + R (-) R + RH + +
All the above reactions are indicated to be reversible but the
reactions may not oCcur at similar rates Usually one will be favoured
over the other
1222 Conjunct polymerisation
Conjunct polymerisation that is polymerisation accompanied by the
formation of saturated hydrocarbons oCCurs only under specific
conditions such as at high temperatures and over highly acidic
catalysts Evidence in support of a carbonium ion mechanism to explain
the formation of conjunct polymers was obtained by Bartlett et a1
(1944) The mechanism involves the removal from the oligomer of a
hydrogen atom with its bonding electrons by the carbonium ion The
mechanism may be illustrated as follows
R-CH2-CH2-CH=CH-R + H+ (-) R-CH2-CH2-CH-CH2-R +
R-CH2-CH2-CH-CH2-R + R-CH2-CH2-CH=CH-R lt-)+
R-CH2-CH2-CH2-CH2-R + R-CH2-CH-CH=CH-R +
R-CH2-CH-CH=CH-R (-) R-CH=CH-CH=CH-R +
For conjunct polvmerisation the si~nificant reaction steos are
- initiation by proton addition
- propa~ation by olefin addition
10
- chain termination by proton expulsion
- chain termination by proton transfer
- chain termination by addition of hydride ion
- depolymerisation to same or chain length other than that of the
or i gin a 1 olefin t
- isomerisation
- hydrogen exchange
- cyclysation equivalent to self-alkylation or self shy
polymerisation and
loss of hydride ion
123 Polymerisation on silica alumina
1231 Nature of active sites on si1 ica alumina
Si1 ica a1uminas differ widely in properties and have been the subject of
much research (Mizuno et a1 bullbull 1976 Finch and Clark 1969 Peri 1976)
The nature of the active sites in the polymeric olefin formation is
controversial because of the lack of conclusive evidence
Ozaki and Kimura (1964) speculated that the olefin chemisorbed on Lewis
acid sites as a monomer Hirschler (1970) concluded that Bronsted acid
sites were the active sites over sil ica alumina on the basis of the
similarity in composition of polymeriC species formed over sil ica
alumina and those formed over deammoniated Y-zeol ite On the contrary
Weeks et a1 (1974) concluded that the active sites were Lewis sites
formed upon dehydroxylation Ot Y-zeolite because no signitlcant
difference was found between products over deammoniated and
dehydroxylated zeolites Peri (1976) regarded an alpha site a pair
consisting of a Lewis site and an oxide ion to be active Holm et al
(1959) and Sato et a1 (1965) reported that propene po1ymerisation at an
elevated temperature varied in proportion to the Bronsted acid content
However objections have been raised to their determination Ot the
Bronsted acid content (Forni 1974) Mizuno et a1 (1976) on the other
hand showed that the catalytic activity tor the polymeric oletin
tormation declined sharply as the extent ot selective poisoning Ot the
Lewis acid sites increased
1232 Structure Ot the products and proposed mechanism on SIlica
alumina
Silica-alumina has a low activity tor the oligomerisation of propene at
low reaction temperatures the main product being propene trimers
11
The mixture of propene dimers formed on sil ica-alumina was characterised
by Feldblyum and Baranova (1971) and found to contain a relatively high
content of 4-methyl-2 and 4-methyl-1-pentene According to the carbonium
ion mechanism as postulated by Whitmore (1934) these are the primary
dimerisation products which isomerise into the thermodynamically more
stable methylpentenes
(CHJgt2-CH + CH2=CH-CHs (-) (CHS)2-CH-CH2-CH-CH3 + +
(CHl)2-CH-CH2-CH-CHl +
(CHl)2-CH-CH-CH2-CHl +
(CHl)2-C-CH2-CH2-CHl +
The 23-dimethylbutenes may form on sil ica alumina either as a result of
the skeletal isomerisation of the 2-methyl-3-pentyl cation as suggested
by Shephard et al (1962) or by the irregular (anti-Mrkovnikov) addition
of the isopropyl cation to propene as suggested by Fe 1 db 1yu m an d
Baranova (1971) The second route is more 1 ikely since skeletal
isomerisation of the isohexene cation should lead with even greater ease
to the production of 3-methyl pentenes which are however practically
absent from the mixture of propene dimers
Fe1dblyum and Baranova (1971) further sugsested that hexenes are formed
over sil ica alumina catalyst via the anomalous addition of a proton to
propene That the main reaction product on si 11ca alumina is a propene
trimer was explained by Feldb1yum and Baranova (1971) by suggesting
that the initially formed 4-methyl-2-pentyl cation rapidly isomerises to
the more stable tert-2-methyl-2-pentyl cation and the rate of the
reaction of the latter with propene is higher than the rate of
12
desorption of the dimer from the active center of the catalyst At the
same time the reaction of the 2-methyl-2 pentyl cation with propene
should lead to the formation of the propene trimer with a 44 dimethyl
heptane carbon skeleton This was found to be the case by Fe1db1yum and
Baranova (1971)
It can thus be seen that the silica alumina carrier leads to the
oligomerisation of propene by a carbonium ion mechanism as proposed by
Whitmore (1948) with the product being a propene trimer
124 Po1ymerisation on nickel oxide sil ica alumina
1241 Nature of active sites on nickel oxide sil ica alumina
Hogen et a1 (1955) established that hexenes and methyl pentenes were the
main products formed during the oligomerisation of propene under the
influence of nickel oxide on si1 ica alumina While explaining this
observation from the standpoint of the carbonium ion mechanism Hogan et
a1 (1955) at the same time admitted that the reaction mechanisms
differed substantially from that found in the usual acid catalysts It
was proposed by Ushida and Imai (1962) that two types of protonic acid
centers existed and they ascribed the observed product selectivity to
the isomerisation of the olefin over the protonic acid site attached to
the aluminium Imai et a1 (1968) however proposed that 3-methy1-1- and
3-methyl-2-pentenes were formed via a cyc10 butene intermediate At the
conditions used by Imai et a1 (1968) ie a temperature of 200 C
skeletal isomerisation of the primary oligomers was entirely possible
At lower reaction temperatures eg 64C as used by Feldblyum and
Baranova (1971) 3-methyl-pentenes were hardly formed The dimerisation
reactivity of ethene propene and 1-butene under the influence of nickel
oxide on si1 ica alumina was established by Ozaki et a1 (1968) to vary In
the ratio of 100101 Le in an order opposite to that which occurs
on typical acidic catalysts This was explained by them via the
existence of hydrogen atoms on the catalyst surface The hydrogen atoms
were capable of adding to the olefin to form free radicals which are
then involved in the dimerisation According to Ozaki et al (1968) the
role of the acidic carrier is unimportant Schultz et al (1966) examined
the dimerisation of propene in the presence of Cobalt oxide on a nonshy
acidic carrier activated charcoal A positive result was obtained with
cobalt oxide while nickel oxide on the same support was inactive
In view of the foregoing the nature of the products from the
01 igomerisation of propene under the influence of nickel oxide on silica
13
alumina is discussed in greater detail below to deepen our understanding
of the reaction mechanism and the active sites
1242 Structure of the products on nickel oxide si1 ica alumina
The deposition of nickel oxide on silica alumina changes the selectivity
of the catalyst the preferential product now being a propene dimer The
high content of hexenes in the resultant dimer is not due to the
occurrence of isomerisation or to the greater tendency of the methyl
pentenes as opposed to that of the hexenes to react turther but was
ascribed by Feldblyum and Baranova (1971) to be a characteristic
feature of nickel oxide on silica alumina catalysts) when used tor the
dimerisation of propene
There exists a close analogy in the mechanism as shown in Table 11
(Feldblyum et al bull 1974) between homogeneous catalysis based on nickel
salts and organoaluminium compounds and heterogeneous catalysts based
on nickel oxide on an aCid carrier The similarity in the mechanisms is
based on the proposal that during the dimerisation of the olefins on the
oxides of group VIII metals) a complex hydride is formed In the case of
nickel oxide the source of the active site is assumed to be an
unusually low degree of oxidation at a defect site in the nickel oxide
crystal lattice The dimerisation of propene catalysed by the complex
hydrides of the transition metal (HM) should lead to the formation of 4
methyl-1shy and 4-methyl-2-pentenes as the primary products with
subsequent isomerisation as shown below
CHJ-CH=CH2 + HM -) (CHJ )2-CH-(M)
l CHJ-CH2-CH2-(M)
(CHJ h -C=CH-CH2 -CHJ + HM
+ HM
14
Tab 1e 1 1 Anal09Y in the mechanism of the catalytic action of
homogeneous and heterogeneous system for the dimerisation of
olefins
Catalyst Homogeneous Heterogeneous
mechanism (N i Ch -R A 1 C 13 - ) (NiO-Si02-AhOl)
Structure of
active site
Path of the
format ion of
active site
Initiation
sta3e of the
reaction
Propa3stion
sta3e of the
reaction
Cata 1yst
re3eneration
step
Reasons for
termination
of reacti on
HNiClmiddotRA1Cll-
Reaction of NiCl
wit h R A1C13 - bull
12-Cis-addition
of HNiCl to the
olefin
Entry of a
Co-oord inated
olefin at the
nickel-carbon
lt1 bond
Cis-el imination
of an ole fin
from HN i C 1
Thermal decomshy
posH ion and
reduction of
HNiCl
HNi(Q)n-t on silica
Alumina
Reduction of Ni(O)n
and reaction of
Ni(O)n-t with the
olefin
1 2-C is-add it ion
of HNi (0)-1 to
the olefin
Entry of a
co-ordinated
olefin at the
nickel-carbon
lt1 bon d
Cis-el imination
of olefin to
form HNi (0)n-1
Reducti on of
HNHOln-t to
metal
15
The formation Of hexenes is explained by an alternative route in the cis
12 addition Of HM to propene
1
With the addition Of a third propene molecule at the nickel carbon sigma
bond trimers (C9) with a carbon skeleton Of 24 dimethyl heptane and 4shy
methyl-octane were expected to form This was Confirmed by Feldblyum
and Baranova (1971)
The absence Of olefins with a 44-dimethyl-heptane carbon skeleton in
the propene trimer formed under the influence Of nickel oxide on si~ica
alumina rules out the possibil ity of the reaction Of tert-hexy1
derivatives of the transition metal with propene and this results from
their instability This accounts for the dimerising action of the
catalyst
From the structure of the products formed and the analogy between
homogeneous catalyst based on nickel salts and organoaluminium
compounds and heterogeneous catalysts based on nickel oxide on si1 ica
alumina it must be supposed that complex hydrides of the transition
metal are responsible for the catalytic actions of nickel oxide silica
alumina in the oligomerisatlon of propene
125 ThermodynamiCs
Figure 13 shows the free energy changes which occur during the
dimerisation Of C2 to Co mono-olefins as a function of temperature The
free energy change for the dimerisation of ethene to 1-butene is much
lower than the dimerisation of the other 1 ight olefins (Ublad et alJ
1958)
16
The dimerisation of terminal bonded olefins eg bullbull propene to isomers
of corresponding higher olefins at a given temperature is much more
favourable than that for the dimerisation to the hi9her terminal olefin
-200
-150
-J- 10 0a U c -60
Lshy 00
(I
Ishy 50 -J W 0 100
150
200
2000 4000 6000 6000 10000
TEMPERRTURE K FIG 13 FREE ENERGY CHRNGE DURING DIMERISRTIBN
as shown in Figure 14 Hence the equil ibrium conversion of an alpha
olefin to a higher alpha-olefin will always be less than the
corresponding conversion of an alpha-olefin to an iso-olefin
Dimerisation of beta-olefins or iso-olefins to corresponding higher
olefins will be similar to the alpha-olefin-alpha-dimer relationship
Dimerisation of beta olefins or iso-olefins to higher alpha olefins will
however always be the least ravourable reaction (Ublad et al bull 1958)
Figure 15 shows the effect of pressure on the dimerisation eQuil ibrium
The relationship shown is that or the product of the equil ibrium
constant and reaction pressure in atmospheres to the percentage
Conversion for any dimerisation reaction
Figure 16 shows the rree energy change ror the formation of higher
olerins as a function or temperature ror the monomers propene and 1
butene respectively These rigures show that above 550C ror both
propene and 1-butene the reverse reaction ie bull cracking oCCurs
Clearly at higher temperatures the lower 01 igomers will predominate
whereas at low temperatures the higher polymers will predominate at
equilibrium (Oblad et a1 1958)
17
-200
-160
-J- 10 0 CI U ~ -60
LL 00
CI I- 60 -J W
100o
150
200
FIG
2000
14
4000 6000 6000 10000
TEMPERRTURE K FREE ENERGY CHRNGE DURING DIMERISRTIBN
shyi J
i I 100
It
s
V0
s
DUCltUTIH iquarlO
(01 n-(HMl ~91
0
bull
I
YIt 10 00
~ C OtNERS I n~~
FIG 15 CONVERSION OBTAINABLE IN OIMERISATION REACTIONS
18
-500
-400
-300 J aU-20 0
~ -100
LL 00
a 100 r shyJ 200W 0
300
400
500
2000 4000 6000 8000 10000
TEMPERRTURE K FIG 16 PBLYMERISRTIBN BF PRBPENE
13 Catalyst characterisation
131 Introduction
There are a number of advantages in depositing catalytically active
metals on a support such as alumina charcoal sil ica and silica
alumina The metal can be highly dispersed as small crysta1l ites
throughout the pore System of the support and as a result a large active
metal surface is produced relative to the weight of the metal used In a
pelleted granular or other physiCal form a supported metal catalyst
provides for flow of gases through the reactor and rapid diffusion of
reactants and reaction products through the porous catalist to and from
the active site (Boreskov 1976 Cervello et alJ 1976) The support Can
also improve dissipation of reaction heat retard the sintering of metal
crystallites with resultant loss of active surface and increase poison
resistance For these reasons supported metal catalysts are widely used
in chemical processing It must be recognised however that the support
may also have a catalytic role to perform and the resultant bifunctional
catalyst may have properties different from those of the support or the
metal alone
19
To achieve greater ynderstanding or the way in which good catalysts can
be prepared more inrormation is needed aboyt the errect or the synthesis
method and the stryctYre or the catalysts Both will now be discyssed in
detai 1
132 Catalyst synthesis methods
When a pOrOYB solid comes into contact with a liquid capillary rorces
or several hyndred atmospheres draw the 1 iQuid into the pores The
active component may then be adsorbed on the walls or the pore in which
case the method of preparation is described as adsorption rrom solution
or ion exchange Here the volyme or solytion ysed will be larger than
the pore volume of the sypport In other preparation methods where
adsorption is small the catalyst is prodyced by drying Oyt of the
support wetted with a solution of the active component and the term
impregnation is used (Maatman and Prater 1957) At a high degree or
loading greater than 5 ~ the above methods do not lead to unirorm
distribution viz unirorm location of the metal crystallites within
the support or uniform dispersion viz uniform size of the metal
crystallites throughout the support This can however be overcome by
starting from a mixture in which the constituents of the active
component and the support are mixed on an atomic scale U~der certain
conditions a precipitate will be formed with the active phase
atomically spread throughout the support This method of production is
termed co-precipitation and discussed in detai 1 by Holm et al lt1957gt
The factors affecting dispersion and distribution in the various
synthesis routes will now be discussed
1321 Preparation with adsorption
Catalysts are often made by immersing a porous support in a solution of
an active material Catalytic properties can be influenced by the amount
and distribution of this material on the internal surface of the support
which in turn depends on whether the active material (solute) or the
solvent adsorbs on the support and the fraction of pore volume
accessible to the solute In Figure 17 the Quantity of active material
found in different parts of a system consisting of an external solution
and a single pore which adsorbs activating material is shown for four
conditions Figure 17a shows the distribution of the active material in
the system when the solution reaches the end of the pore The
assumption is made that the rate of penetration and rate of diffusion of
the solute into the pore are slow compared to the rate of adsorption
All act i ve materia 1 in the penetrati ng 1 i qu i d thus adsorbs on the lola 11
20
c I o e
q
External No external Poresolution Pore solution
A Immediateh after fi 11 in B After it was filled and allowed to eltluilibrate
Dec 1 eted externalExterna 1
Pore solution Poresolution
C After equilibration in the 0 After external solution presence of an excess of depleted of solute but external solution before eQ-Jilibration
Fig 17 Conditions of a pore adsorbing actIvatIng material in solution
21
of the first part of the pore The 1 iauid which passes further into the
pore contains no active material If at this time the solvent is removed
from the pore by dryin9 the active material is found only in the part
of the pore nearest to the external solution If instead of dryin9 the
catalyst at this time the pore is simply removed from the external
solution but left filled with 1 iQuid another phenomenon may be observed
If the active material can desorb at a reasonable rate redistribution
oCcurs by desorption and mi9ration by diffusion This ultimately results
in a uniform distribution of active material within the pore as shown in
Fi9ure 17b This process can be used in catalyst preparation if the
rate of desorption is rapid enou9h If the pore is however left in
contact with the external solution additional active material is
supplied by the external solution by diffusion to the adsorption sites
until either equilibrium with the external solution is reached brin9in9
about a uniform distribution as shown in Figure 17c or the external
solution is depleted of active material before the distribution is
uniform as shown in Figure 17d (Maatman and Prater 1957)
It can thus be seen that the amount of active material found in a porous
support can be much larger than that contained in the original pore
volume of liquid penetratin9 the support If on the other hand the pores
are accessible to the solvent but are too small for the solute to enter
or if the solvent is adsorbed in preference to the solute the Quantity
of active material may be extremely low
1322 Drying of adsorbent solids
In the case of an adsorbent solid the dryin9 process is not expected to
alter the distribution of the active material since it is adsorbed to
the sol id However if the adsorptive properties of the material were to
alter during heating and prior to evaporation of the solvent as by
thermal decomposition to a soluble species which does not adsorb on the
support the distribution of the solute would be markedly altered This
condition is discussed below
1323 Preparation without adsorption
In this case a porous support is submerged in a solution containing the
active material and the metal salt is drawn Into the pores by capillary
forces The solvent is then evaporated and the salt decomposed by
calcination or reduction The metal content can be calCulated from the
Concentration of the solution
22
For impregnated type catalysts Dor1ing et al (1971) predicted that up
to a certain metal content the number of crystallites would increase
the mean crystallite size would vary slowly and the metal area would be
approximately proportional to the metal content Beyond this metal
content the number of crystal1 ites would remain constant if only one
crystal formed in each pore during drying Hence the metal crystall ites
would increase in size and the metal area would be proportional to
(metal content)2J Dor1ing et a1 (1971) predicted that the crystallite
size distribution would reflect the pore size distribution of the
support
1324 Drying of non-adsorbed solids
As a result of evaporation of the solvent deposition of the solute
begins when the solution becomes saturated If all the liquid could be
evaporated instantaneously the active material would deposit locally and
uniformly throughout the support Evaporation however does not occur
instantaneously but starts at the outer periphery of the particles and
proceeds from regions of larger pore diameters to smaller pores This
uneven evaporation is the result of the higher vapour pressure of the
1 iquid in the larger pores while 1 iquid which evaporates from small
pores is replaced by liquid drawn by capillary action from the larger
pores as illustrated in Figure 18
A Before drying
B After some drying
Figure 18 Intersecting pores of diferent sizes before drying (A) and
after evaporation of some of the pore volume 1 iQUld (8)
23
Thus when drying proceeds slowly enough there is a tendency tor the
active material which is increasing in concentration as the liQuid
volume decreases to redistribute by diffusion into the remaining fluid
This results in an enrichment of the active material in the smaller
pores and towards the center of the particle (Maatman and Prater 1957)
133 Homogeneous decomposition deposition
It can be seen from the above discussion that producing a catalyst by
impregnation or ion exchange with high metal contents leads to the
formation of crystallites with non-uniform distribution and low
dispersion As an active supported catalyst system calls for a highly
dispersed particle with uniform distribution on a highly porous
thermally stable support such as silica alumina it would be desirable
to combine the high degree of penetration of the solute into the support
observed during impregnation with a controlled ion exchange-type
preCipitation The procedure studied by van Dillen (1976) for the
manufacture of highly dispersed nickel silica catalysts with uniform
distribution and a similar system used by Higley (1984) to produce
nickel oxide on silica alumina catalysts was investigated
In the case of this work a suspension of nickel nitrate hexahydrate and
silica alumina was prepared To preCipitate the nickel salt onto the
support the pH had to be lowered This was achieved by Hisley (1984) via
the injection of ammonium hydroxide and in the case ot this work by the
slow and homogeneous decomposition of urea The reason for using urea as
the source of hydroxyl ions as opposed to ammonium hydroxide is
discussed below A detailed disCussion of the synthesis procedure is
given in Section 363
1331 Theory Ot homogeneous decomposition deposition
When the concentration of a homogeneous solution is raised at a constant
temperature as shown by path A in Figure 19 the solubil ity Curve is
reached Crossing the solubil ity curve does not generally lead to the
formation of a preCipitate but to a metastable state When howeverthe
concentration on the solubil ity Curve is exceeded by a critical amount
nuclei of the preCipitate are spontaneously generated brinSins about
the transition to the eQuilibrium state The concentration where nuclei
start to develo~ s~ontaneously l~ homogeneous solutions IS indicated by
the supersolUbil tty Curve which is also shown in Figure 19 (Walton
1969) The fact that no preCipItate grows when the solubil ity Curve 13
crossed is due to the Considerable surface enerSY of very small
24
particles of the precipitate Thus raising the concentration of a
solution to the value on the supersolubil ity Curve leads to the
formation of a limited number of nuclei If the homogeneity of the
solution is maintained the concentration of the solution will remain
between that of the solubil ity and supersolubil ity curves where no new
nuclei can develop Therefore as a result of precipitation from a
homogeneous solution a small number of large particles of the
preCipitate are formed Pouring a precipitant into the suspension on the
other hand gives rise to an inhomogeneous solution as the concentration
will locally be increased far beyond that of the supersolubility curve
as shown by path B in Figure 19 This gives rise to the formation of a
large number of nuclei Before the concentration has decreased by
homogenizing the solution the nuclei have grown sufficiently to be
stable at the lower concentration Working with an inhomogeneous
solution therefore results in a relatively large number of small
particles (Cartwright et al 1967)
It was concluded by Hermans and Geus (1979) that pouring a preCipitant
into a suspension of a porous carrier leads to preCipitation of the
active material where the preCipitant enters the suspension and the
preCipitate will not develop uniformly over the surface of the support
PreCipitation from a homogeneous solution on the other hand proceeds
eQually in the pores of the support and in the bulk of the solution and
so el iminates the inhomogeneous addition of the preCipitate to the
support
In order to produce a catalyst with high dispersion and uniform
distribution a sufficiently stron9 Interaction of the preCipitating
compound with the support is neCessary This interaction must decrease
the nucleation barrier so that nucleation at the surface of the support
can proceed at a concentration between the solubil ity and
supersolubil ity Curves The preCipitate can then nucleate at the ~urface
of the support whereas nucleation in the bulk of the solution is
prevented In addition nucleation at the surface must be rapid to avoid
the growth of a small number of nuclei to large particles of the
preCipitate (Hermans and Geus 1979)
1332 Nickel oxide sil ica alumina preparation usinB homogeneous
decomposition deposition
Higley (1984) showed that incorporating nickel onto sll iea alumina by
the injeCtion of a hydroxide-containing solution (ammonium hydroxide)
25
CBMPBSITIBN FIG 19 PHRSE DIRGRRM
resulted in a catalyst active for the 01 igomerisation of olefins In
view of the above discussion however it seems likely that the
synthesis procedure developed by Higley (1984) resulted in a catalyst
with high dispersion but nonuniform distribution Using a homogeneous
system with the slow hydrolysis of urea as a source of hydroxyl ions as
developed by van Dillen et al (1976) for the preparation of nickel
sil ica catalysts the catalyst produced would have a high dispersion and
a uniform distribution of the metal crystal] ites throughout the support
134 Co-preCipitation
This method for preparing supported metal catalysts is usually
aSSOCiated with nickel 5i I ica catalysts The technique involves mixing
of the constituents on an atomic level under condition favouring
preCipitation The resulting catalyst is one where small crystals are
uniformly distributed throughout the catalyst matrix Subsequently this
type of catalysts can be made with nickel contents up to 20 wtX without
affecting Crystal size or distribution
w n )
fshya n w 0 L W f-
PATH A
26
14 PhysiCal characteristics or the catalyst
The properties which characterise a catalyst are shown in Table 12 and
discussed below
Tab 1 e 1 2 Characterisation or supported metal catalysts
Support Metal dispersion Nature or ac ti ve
properties and location component
Total area Total sur race Metal support
area interaction e9
Pore structure oxidation state
Meta 1 sur race
Surface chemical area
properties e9
surface aci dity Crystal size
distribution
Crystal size
an d 1 oC a t ion
141 Properties or silica alumina
1411 Surrace area
The surrace area or silica alumina is not only a runction or the alumina
content but also or the synthesis procedure used In the case or Coshy
precipitation used by Holm et a1 (1959) the surface areas ror the
entire ranse rrom pure alumina to pure si1 ica were consistently hisher
than that established by Ward and Hansrord (1969) tor an impregnated
catalyst The results obtained by both Ward and Hansrord (1969) and Holm
et al (1959) are shown in Figure 110 as are the results ror the
commercial catalyst used by Ward and Hansford (1969)
1412 Pore structure
Ramser and Hill (1958) studied the pore diameter dIstribution or a
commercial sil ica alumina catalyst usin9 nitrogen isotherms The results
obtained by them are shown in Table 13 No data was however available
as to the silica to alumina ratio of the catalyst used by them
27
800 shy
~ - 600 shyN ltl ~
bull a W
~=cePRECIPITATEO ()= IMPREGNATED eft =CeMMERC I AL
~
eft ~ () ~ ~
eft
400 -- ~a eft ~a efteft ~
~ ~
200 -r-I I I
I I200 300 400 600 600 700 800 900 1000 RLUMINR CBNTENT MRSS
FIG 110 SILICR RLUMINR SURFRCE RRER (Ma2GlVS ALUMINR CGNTENT (MRSS)
Table 13 Pore volume and size distribution of fresh catalyst and
adsorbents (Ramser and Hill 1958)
Catalyst Surface area Pore volume Average pore
code (m2 9 ) (cm3 19) radius (A)
Commercial
Silica
Alumina
Alumina
Silica
5421
5002
4620
1666
7712
0585
0608
0619
1142
0426
157 plusmn 96
177 plusmn 108
179plusmn 126
30 1 plusmn 568
105 plusmn 43
29
1413 Surface acidity
Holm et a1 (1959) using a butylamine titration techniQue as proposed by
Tame1e (1947) determined the total acid content of a co-precipitated
silica alumina catalyst They also determined the Bronsted acid content
of the catalyst using a base exchange reaction via ammonium acetate In
this way the Lewis acid content of the support could be estab1 ished The
results obtained for the entire range from pure ail ica to pure alumina
are shown in Table 14
Tab 1 e 1 4 Acid content (total and Bronsed) for sil ica alumina heat
treated at 550degC
Alumina Protonic acid Tota 1 ac i d Acid strength
content content content index
(wt~) (meQg) (meQg) (K)
100
925
92
85
60
45
30
18
10
5
2
0
000
006
004
007
019
034
045
080
077
061
038
013
014
043
041
039
042
046
040
040
040
031
003 approx
2310- 7
4710-amp
1110-)
3910-)
6110-)
1410- 4
2410- 4
2510- 4
1110-)
142 Properties of nickel oxide on sil ica alumina
1421 Total surface area
The total surface area of nickel oxide on silica alumina was examined by
Holm et al (1957) for an impregnated and a Co-precipitated catalyst The
sil ica to alum1na weight ratio was held constant at 9 to 1 throughout
The results obtained as a function of nickel loading are given in
Table 15 Ushida and Imai (1962) using a co-precipitated nickel oxide
si 1 ica alumina catalyst with the nickel content fixed at 4 wt but
varYing the alumina content from 0 to 46 wt also measureJ the surface
29
area of the catalyst Their results of surface area as a function of
alumina content are shown in Table 16 In an independent study Imai
and Ushida (1965) measured the surface area of a nlckel oxide on silica
alumina catalyst with a fixed alumina content of 43 wt~ varyins nickel
content These results are shown in Table 17
Table 15 Surface area of nickel oxide sil ica alumina prepared by
impregnation and coprecipitation as a function of nickel
content the si1 ica to alumina weisht ratio of 91
Sinthesis Nickel content Surface area
technique (wU) (m2 IS)
Impregnated
Coprecipitated
085
1 71
315
1080
073
254
448
830
1726
3782
6026
300
300
300
253
373
374
388
248
259
302
219
1422 Metal surface area and crystal size
The metal surface area of an impregnated nickel oxide on synthetlc
zeolite was examined by Brooks and Christopher (1968) using hydrogen
chemisoptlon and the average nickel crystallite size usin9 X-ray
diffraction line-broadenins They found that the nickel areas estimated
from H-z chemisorption and from averase nickel crystallite size
determined by X-ray diffraction line-broadening were In soad agreement
The results obtained by them for a series of supports and nickel loadins
are shown in Table 18
30
Table 16 Surface area of nickel oxide sii ica alumina as a function of
the alumina content Nickel content held constant at 61
wtX
Alumina content Surface area
(wtX) (m2 19)
00
28
51
96
292
490
275
338
360
281
138
181
Table 17 Surface area of nickel oxide silica alumina as a function of
nickel content Alumina content was held at 43 wtX
Nickel content Surface area
(wtX) (m2 19)
00
251
498
744
987
283
344
355
368
344
1423 Pore volume and size distribution
The pore volume and average pore radius was examined by Uchida and 1mai
(1962) for a catalyst with a fixed nickel content but varying alumina
content and by 1mai and Uchida (1965) for a catalyst with a fixed
alumina content of 43 wt~ but varYing nickel content The results
obtained by them are shown in Tables 19 and 110 respectively
31
Table 18 Nickel metal area from H2 chemisorption
mmH9 H2 vapour pressure and from X-Ray
broadenin9
at 250degC and 100
diffraction lineshy
Catalyst Nickel Total nickel area X-ray line broad
code content H2 chemisorption Diameter Area
(3Ni9cat) (m2 bull Nif 3 cat ) (A) (m2 bull Nilg cat)
G56-1 0145 48 155 60
G56-2 0131 42 175 48
G56-3 0071 19 715 06
NiDavZ14 0059 27 185 20
Nileolon 0032 07 680 03
Table 19 Pore volume and radius of a nickel alumina catalyst with
varyin9 alumina content Nickel content held at 4 wt~
Alumina Pore volume Avera3e pore
content (cm3 3) radius
(wU)
000
863
1752
2670
3617
4595
0518
0349
0349
0349
0387
0416
384
253
357
484
477
468
1424 Metal support interaction
The valence of nickel oxide on sil ica alumina was measured by Holm et al
(1957) using hydrogen reduction as proposed by Hill and Selwood (1949)
They found that no abnormalities existed with regard to the chemical
valence of nickel in either the co-preciPitated or impre3nated
catalysts These results were confirmed by Ushida and Imai (1962) who
32
however reported that for catalysts with an alumina content higher than
86 wt or lower than 26 wt the valence of nickel was slightly higher
than two The slight valence increase in the case of higher aluminum
content could be explained since the larger the aluminum content the
larger the amount of nickel oxide which could be combined with alumina
Table 110 Pore volume and radius of a nickel oxide sil ica alumina
catalyst with varying nickel content Alumina content held
at 43 wt throughout
Nickel Pore volume
content (cmJ 9)
(wU)
000
251
498
744
987
037
040
038
040
036
15 Catalyst polymerisation properties
151 Silica alumina properties
1511 Effect of sil ica to alumina ratio
The propene polymerisation activity was examined by Holm et al (1959)
for a coprecipitated silica alumina catalyst with varying silica
content The catalyst was activated by drying in air at a temperature of
550C for 16 h and the po1ymerisation activity determined by passing
propene over the catalyst while raising the temperature from 30 to
300middotC The maximum conversion obtained for each activation temperature
was considered to be indicative of the po1ymerisation activity The
results obtained by Holm et a1 (1959) showed that a catalyst With a
silica to alumina weight ratio of 7 to 1 was the most active for the
polymerisation of propene Johnson (1955) examined the polymerisation
activity Of propene at 200C for an impregnated ail ica alumina catalyst
with varying silica content and found that for a catalyst dried at
200C the optimum sll ica to alumIna weight ratio was 9 to 1 Tamele
(1950) also workIng at 200C and uSing a catalyst dried at 500middotC
reached the same conclusion as Johnson (1955)
33
1512 Eftect ot reaction temperatures
Silica alumina required temperatures higher than 200C to be active tor
the polymerisation of propene (Takahashi et a1 bullbull 1972) This was also
shown by Fe1db1yum and Baranova (1971) who working at 64C recorded
a conversion ot only 6~ The dependence Ot temperature tor propene
po1ymerisation over ail ica alumina was investigated by Takahashi et a1
(1972) in a t10w through system at a pressure Ot 50 atm The results
obtained by them are shown in Table 111
Tab 1 e 111 Propene 01 igomerisation on silica alumina at a constant
pressure of 50 atm and varying temperature Silica to
alumina ratio used was 94 to 3 throughout
Reaction Propene
temperature conversion
(OC)
200 126
250 407
300 641
350 679
1513 Ettect of space velocity
The relationship between the space velocity and po1ymerisation activity
expressed in terms of propene conversion was examined by Takahashi et
a1 (1972) tor a catalyst with a sil ica to alumina weight ratio Ot 9 to 1
at a temperature of 200degC and a pressure Ot 50 atm The results obtained
show that an inverse relationship exists between space velocity and
propene conversion
1514 Product spectrum
At the temperatures needed in the presence of silica alumina for propene
po1ymerisation dimerlsation is a minor reaction with the main product
being the propene trimer The effect Ot temperature on the product
spectrum at a pressure Ot 50 atm with a catalyst having a silica to
alUmlna ratio of 94 to 3 as established by Takahashi et al (1972) is
shown in Table 112 as are the results of Feldb1yum and Baranova
( 1971gt
34
Table 112 Product distribution of propene 01i90merised over silica
alumina as a function of temperature Reaction pressure is
50 atm
Researcher Feldblum and Takahashi et al (1972 )
Baranova ( 1971gt
Silica to 91 943
alumina ratio
Reaction
temperature 64 200 250 300 350
( degC )
Propene
conversion 6 126 407 641 679
(wtX)
Product
spectrum
Dimer (Co) 15 88 159 233 285
Trimer (C ) 756 438 362 307 231
Tetramer+ (Ct2+ ) 94 448 448 436 455
1515 Effect of activation
Holm et al (1959) examined the propene polmerisation activit of a
catalyst with a silica to alumina wei9ht ratio of 9 to 1 as a function
of the activation temperature Activation was achieved by holdin9 the
catalyst at each temperature for 16 h under dry air The found that the
optimum activation temperature with regards to propene 01 igomerisation
was 550middotC
152 Nickel oxide sil ica alumina properties
1521 Effect of synthesIs procedure
The two methods available for incorporating nickel onto silica alumina
are impre9nation and Coprecipitation The exact synthesis procedure and
nature of the catalyst has been discussed previously Holm et a1 (1957)
examined the polymerisation activity of catalysts prepared by these
35
methods and concluded that for coprecipitated catalysts the maximum
propene polymerisation activity was approximately 50X greater than that
for catalysts prepared by impregnation
1522 Effect of metal content
Hogan et al (1955) using a commercial catalyst with a sil ica to alumina
weight ratio of 9 to 1 concluded that when the metal was loaded onto
the support by impregnation the most active catalyst for the
po1ymerisation of propene contained between 3 and 5 wtX nickel Holm et
a1 (1957) using a co-precipitated and impregnated nickel oxide on
silica alumina catalyst establ ished that for both methods of loading
the maximum polymerisation activity per unit volume was also obtained
for a catalyst holding between 3 and 5 wtX nickel Takahashi et al
(1969) using a Commercial silica alumina with an alumina content of 13
wtX showed that for an impregnated catalyst a nickel content of 13 wtX
was optimum for the conversion of propene To maximize the yield of
propene dimer however the optimal nickel content was found to be 97
wtX When a co-precipitated as opposed to impregnated catalyst was
used Takahasi et al (1969) found that a nickel content between 3 and 5
wtX gave the optimum results for propene dimerisation
1523 Effect of reaction temperature and pressure
Hogan et a1 (1955) showed that when the reaction temperature was varied
from 35 to 130middotC the rate of reaction was highest in the ran~e of 70C
to 93middotC with a sharp dec1 ine in conversion when the pseudo-critical
temperature of 96C of the feed was exceeded and the system was
essentially in the vapour phase They concluded that the optimum
reaction conditions for the dimerisation of propene were a temperature
of 70C and a pressure of 40 atm Takahashi et a1 (1969) also examined
the effect of temperature and pressure with respect to propene
conversion and dimer yield and concluded that as long as the system
remained in the 1 iQuid phase the formation of dimers dominated with a
shift to heavier products as soon as the system moved into the vapour
phase The optimum conditions for the dimerisation of propene according
to Takahasi et a1 (1969) were a temperature of 70 to 80C with the
pressure ranging from 30 to 35 atm The above conclusions can easily be
represented graphiCally as shown in Figure 111
1524 Effect of feed composition and space velocity
Takahasi et al (1972) found that when pure propene was fed the surface
temperature of the catalysts rose far above the set reaction
temperature Consequently although the system was essentially in the
36
1000
~ (fJ 800 (fJ
II L
600 Z CJ t--I
(fJ 400 []
a w gt z CJ 200 U
00
[]
00 200 400 600 800 PRESSURE RTM
FIG 111 PRBPENE CBNVERSIBN (MRSS) VS PRESSURE (RTM)
1 iQuid phase a vapour phase reaction was taking place at the surface of
the catalyst with a corresponding shift to heavier products and rapid
deactivation of the catalyst It was therefore necessary to use a
mixture of propene and an inert diluent such as propane which served as
a heat sink and so controlled the catalyst surface temperature Hogan et
al(1955) varied the propene concentration in the feed from 7 to 37 vol~
at space velocities of 2 4 and 8 and concluded that the rate of polymer
production increased 1inearly with propene concentration A first order
relationship between propene concentration and rate of polymer formation
was obtained Hogan et a1 (1955) did not indicate how dimer selectivity
was affected as a function of feed composition Takahashi et al (1969)
using a 217 to 1 mixture of propene to propane wIth trace impurities
of ethane ethene and butenes concluded that the optimum space velocity
for the production of a propene dimer at the conditions of temperature
and pressure discussed earl ier was 750 g of propene per 1 iter of
catalyst per hour
1525 Effect of feed impurities
Hosan et a1 (1955) stated that the catalyst became deactivated if
allowed to absorb as 1ittle as 05 wt~ moisture This type of
contamination was however totally reversible Other impurities such
37
as acetelyne and carbon monoxide acted as severe poisons to nickel
oxide silica alumina while oxygen sulphur compounds and butadienes had
only a moderate poisoning effect The poisoning effect of these
materials was apparently not reversible as the catalyst did not
regenerate to any extent after removal of the contaminant from the feed
Takahashi (1969) on the other hand stated that the Scientific Design
Company had shown that by introduCing water or alcohol with the feed
the conversion of propene could be doubled without affecting
dimerisation activity
1526 Effect of activation procedure
The activation time temperature and gas flow rates were examined by
Takahashi et a1 (1969) with respect to acidity structure and propene
dimerisation activity of the catalyst They found when using 200 ml of
catalyst that a space velocity of 100 h- 1 of dry air at a temperature
between 500 and 600C was optimal and that the activity of the
catalysts increased with inCreasing activation time up to 5 h above
which the activity did not change Three distinct temperature regions
were identified by Takahashi et a1 (1969) between 300 and sOOmiddotC
physisorbed water was removed between 500 and 600middotC the concentration
of protoniC sites was highest and above 600 G C Lewis sites were formed
which could not be hydrated back to Bronsted sites
1527 Effect of regeneration
The po1ymerisation activity of the nickel oxide sil ica alumina catalysts
declined at a rate determined largely by the amount and type of
impurities in the feed and eventually regeneration was required (Hogan
et a1 bullbull 1955) The regeneration procedure was to strip the catalyst free
of hydrocarbon vapours and preheat it to a combustion temperature (about
400C) with dry inert gas The small amount of residual deposits were
then burnt off in dry air at 500C and the catalyst cooled under dry air
(Hogan et a1J 1955) After repeated regeneration the nickel oxide
promotor underwent changes which caused the activity to decline The
catalyst could however be restored to its initial activity by wetting
with a nitric acid solution followed by a normal activation
1528 Product spectrum
Takahasi et a1 (1969) together with Hogan et a1 (1955) fOlJnd that the
reaction conditions had a large influence on dimer compOSition The
reslJlts obtained by Takahashi et al (1969) at variolJs reaction
conditions are shown in Table 113 The products obtalned by Hogan et al
(1955) for once through propene conversion uSing a catalyst with 4 wt~
38
nickel at 75middotC and 40 atm and the results of Feldblyum and Baranova
(1971) using a temperature of 64C and a pressure of 50 atm and a
catalyst containing 45 wtX nickel are also shown in Table 113 Hogan
et 81 (1955) working with fixed feed composition and reaction conditions
studied the effect of varying the space velocity on the product
spectrum The results obtained by Hogan et al (1955) are shown in Table
114
1529 Lifetime
Hogan et al (1955) examined the lifetime of an impregnated nickel oxide
sil ica alumina catalyst using a cracked gas containing 25 molX ethene
10 mol~ propene and 12 mol~ butenes with butane as liquid diluent A 100
h run was done by Hogan et al (1955) and data was obtained on conversion
and on the properties of the products in butene-butane recycle
operation The reaction conditions used were a temperature of 65 to 75degC
and a pressure of 34 atm with feed rates of 600 standard volumes of
cracked gas and 4 1 iQuid volumes of butane-butenes per hour per volume
of catalyst The catalyst used contained 4 wtX nickel with a sil ica to
alumina weight ratio of 9 to 1 Hogan et al (1955) showed that the
activity of the catalyst with respect to total olefin conversion after
100 h on stream dropped from 99 to 96X The average rate of polymer
production was 350 ghlmiddotcat The polymer composition by volume was 13~
pentenes 26~ hexenes 20X heptenes and 41X octenes through decenes
In an indepndent study Allum (1974) prepared a nickel oXide silica
alumina catalyst by first impregnating silica gel with aluminium and
then with nickel The final catalyst contained 145 wtX aluminium 036
wtX sodium and 07 wt~ nickel The catalyst which was activated for 4 h
at 550degC under dry nitrogen was used to 01 igomerise 1-butene in daily
batches at aodegc and 54 atm in a 3 1 rocking autoclave for 24 consecutive
days The activity of the catalyst decreased from 020 grams of product
per gram of catalyst per hour (1st day) to 014 grams of product per
gram of catalyst per hour (24th day) Of the liquid 01 igomers 65 wt~
were octenes on the first day which rose to 85 wtX octenes on the 24th
day
16 Conclusion
As can be seen from the above discussion nickel oxide on Silica alumina
catalysts prepared by impregnation and coprecipitation have been studied
in great detail The technique of homogeneous decompositlon depOSition
for incorporating nickel into sil iea alumina is a much simpler technique
than coprecipitation and it is hoped that the catalytic properties with
39
respect to lifetime selectivity and activity are comparable to if not
better than the properties of coprecipitated or impregnated nickel
oxide silica alumIna catalysts
Table 113 Relationship between product distribution and reaction
conditions
a) Takahashi et al (1969) sil ica to alumina wei9ht ratio of 87 to 13
nickel content 13 wt~
b) H09sn et al (1955) silica to alumina wei9ht ratio of 9 to 1 nickel
content 4 wt~
c) Feldblyum and Baranova (1971) silica to alumina weight ratio of 9
to 1 nickel content 45 wtX
d) Distillation cut off temperature
Temperature Pressure
(degc ) (atm)
) 65
SO
90-95
120
75
75
75
75
75
80
75-80
75
35
35
35
35
15
20
25
30
32
35
50
70
47S
465
380
230
185
246
305
401
520
465
430
435
335
3S0
340
3S0
210
250
280
310
270
350
340
250
97
95
190
260
395
350
300
150
140
95
135
220
22
18
24
98
137
90
36
66
28
18
30
25
b ) 75 40 720 190 60 30
c ) 64 40 77 2 202 26
40
Table 114 Propene conversion and product spectrum as a function of
space velocity sil ica to alumina ratio is 9 to 1
throughout
Conversion Space Ct2 Ct 5 +
(wtX) ve 1oC ity
53 2 777 160 61 24
68 4 737 200 70 32
83 8 656 210 88 64
41
17 OBJECTIVE OF RESEARCH
The aim of this study was to investigate the propene oligomerisation
properties of NiOSi02-A1203 catalysts synthesi~ed using three
different techniques impregnation Co-precipitation and homogeneous
decomposition deposition The effect of the following factors on the
activIty selectivity and 1 ifetime of these catalysts for propene
01 igomerisation were investigated
(i) Nickel content of catalysts
(ii) Reaction pressure and temperature
(iii) Weight hourly space velocity
(iv) Reactor temperature stabil ity and
(V) Propene feed moisture content
42
2 DESIGN OF ISOTHERMAL REACTOR
21 Introduction
In order to facilitate interpretation of reactor data it was important
that the reactor used in this study was as isothermal as possible
Various attempts have been made to achieve this Hogan et al (1955)
surrounded the reactor with an electrically heated jacket containing a
liQuid which was boiled at a temperature fixed by the pressure of an
inert gas applied to the top of the reflux condenser Imai (1968) on
the other hand inserted the reactor into a heated bed of iron powder
In the case of the present work a similar system was used to achieve
isothermal conditions A detailed description of the design of this
reactor will now be given
22 F1uidisation theory
If a fluid passes upward through a bed of solids at a low velocity the
pressure drop aCross the bed is the same as that for a downward flow As
the fluid velocity increases the particles become rearranged so that
they offer less resistance to the flow and the bed starts to expand
This process continues as the velocity is increased with the total
frictional force remaining eQual to the weight of the particles until
the bed has assumed the lowest stable form of packing If the velocity
is then increased further the individual particles separate from one
another and become freely supported in the fluid At this stage the bed
is said to be fluidised Further increases in fluid velocity cause the
particles to separate still further from one another and pressure
differences remain approximately eQual to the weight per unit area of
the bed The above phenomenon can be represented graphically if the
pressure drop across the bed is plotted against fluid velocity through
the bed using logarithmic co-ordinates
Thus in Figure 21 (Coulson and Richardson 1980) a 1 inear relation is
obtained on a log log scale up to the point where bed expansion takes
place (A) The slope of the curve then gradually diminishes as the bed
expands As the velOCity is increased the pressure drop passes through
a maximum value (B) and finally falls slightly before attaining an
approximate constant value independent of fluid velocity (CO) The
section (CO) of the Curve is an indication of the Qual ity of
fluidisation for if the pressure drop is constant as the fluid velocity
43
increases channel in~ is absent Point (B) which 1 ies above (CO)
identifies the point where the frictional forces between the particles
is bein~ overcome prior to rearran~ement The point of minimum
fluidisation velocity ie bullbull the fluidising point is shown on this
Curve at (E) (Coulson and Richardson 1980)
FLUIDISED BEDFIXED BED
0shyltl I VELOCITY
INCREASING
FLUIDISING
POINT
VELOCITY DECREASING
(BED OF MAXIMUM I
POROSITY)
I
I I
LBG (Ve) FIG 21 PRESSURE DRep eVER FIXED AND FLUIDISED
BEDS
23 Heat transfer
Fluidised beds have good heat transfer properties and are ideal in a
system where close control of temperature is reQuired The intimate
mixing which takes place in the bed ensures that heat transfer
throughout the system is very rapid and that uniform temperatures are
Quickly attained
Three mechanisms have been suggested to explain this improvement in heat
transfer coefficient An increase of up to one-hundred fold as compared
with the value obtained with a gas alone at the same velOCity can be
attained by the presence of the sol id Coulson and Richardson (1980)
stated that the particles whose heat capacity per unit volume IS many
times greater than that of the gas act as heat transferring agents As
a result of their rapid movement within the bed they pass from the bulk
of the bed to the layers of gas in close contact with the heat transfer
44
surface exchanging heat at this point and returning to the body of the
bed This together with the extremely short physical contact time of
the particle with the surface ensures that the thermal conductivity of
the particle is not an important factor The second mechanism proposed
by Coulson and Richardson (1980) is the erosion of the 1amminar sub1ayer
by the particles and the subsequent reduction in its effective
thickness A third mechanism suggested by Mickley and Fairbanks (1955)
is that packets of particles move to the heat transfer surface and an
unsteady heat transfer process takes place
Many equations are available in the 1 iterature to calculate the
convection heat transfer coefficient of the gas solid system One
equation which seems to be the most re1 iab1e is that of Dow and Jakob
(1951) The Nusse1t number with respect to the tube diameter is
expressed as a function of four dimensionless groups the ratio of tube
diameter to length ratio of tube to particle diameter ratio of heat
capacity per unit volume of the sol id to that of the fluid and finally
the tube Reynolds number These relations are combined as shown below
where h is the heat transfer coefficient
k is the thermal conductivity of the gas
d is the particle diameter
dt is the tube diameter
is the 1ength of the bed
E is the bed voidage
P is the density of the sol i d
p is the density of the gas
c is the specific heat of the sol id
c is the specific heat of the gas
v is the viscosity of the gas and
Uc is the superficial velocity based on the empty tube
At the present stage of our knowledge the above equation seems the most
re1 iab1e and will thus be used to estimate heat transfer coefficients
and optimum particle diameter
24 F1uidising medium
Various materials were investigated It was assumed that each material
had a discreet size fraction As a high heat transfer coefficient was
important if the f1uidised bed was to perform its function effectively
45
the equation developed by Dow and Jakob (1951) as discussed abov~ was
used to compare the various sol ids Furthermore two bed temperatures
were used to identify any changes in heat transfer coefficients as a
function of bed temperature The results are shown in Figures 22 and
23 It can be seen from these figures that a maximum exists at a
particle size of approximately 150 ~m and that the convective heat
transfer coefficient drops slightly as the bed temperature is increased
Copper powder gave the best results a heat transfer coefficient in
excess of 1000 Wm2 K for a particle of 150 ~m The explosive and toxic
nature of meta1l ic dust at the temperatures reached during calCination
made this an undesirable solution Sand however was less dependant on
both the particle size and bed temperature is totally inert and readily
available It was thus decided that sand would be used as fluidising
medium
241 Sand data
Two sands were readily available These were coded by the manufacturer
as No1 and No 12 Their size distributions are shown in Table 21 As
the actual material had a size range rather than a discreet particle
size an effective particle diameter had to be establ ished Using the
relation suggested by Leva (1959)
where d is the effective particle size and Xi is the size fraction of
particles of size dt the effective particle size was calculated
The efficiency of f1uidisation (Leva 1959) of sands with wide (No 12)
as opposed to narrow (No2) size distributions effectively eliminated
sand No 12 from further consideration
25 Optimisation of the fluidised bed
As discussed In Section 21 a bed of sol ids becomes fluidised only when
the superficial velocity exceeds the minimum fluidisation veloCity As
it is important for the bed to be totally fluidised the minimum
fluidising velocity has to be found For this reason the system was
modified as shown in Figure 24 An attempt was made to measure the
pressure drop across the bed Itself but was Tound not to be pOSSible as
the fluidislng medium would block the tapPIng point at the bottom of the
bed
46
c 11 00
N ltl L 900 3
bull bull 700
LL LL W ~ U 500
bull IshyU 300 W gt z CSJU 100
(J=SAND ()=CepPER amp=lINC +=ALUNINIUN X =cepPER ax 1DE 0=ZINC aXIDE
~~---e------pound9-__
00 500 1000 1500 2000 2500 3000 3500
PRRTICRL DIRMETER UM FIG 22 CBNVECTIBN CBEFFICIENT (WMa2 K) VS
PRRTICRt SIZE (UM) 25C shy
c 900
N ltl L
3 700 bull
LL lLW 500
~ U
bull I- 300 U W gt z CSJ U 100
+=ALUNINIUN x =capPER ax I DE 0=lINC eXIDE
(J=SAND ()=cepPER amp=ll NC
00 500 1000 1500 2000 2500 3000 3500
PRRTICRL DIRMETER UM FIG 23 CBNVECTIBN CBEFFICIENT (WMa2 KJ VS
P R R T 1 CAt S I Z E (U M ) 190 bull C
47
11
FIG 24 REACTOR MODIFICATIONS TO MEASURE PRESSURE DROP
48
Key to Figure 24
1 Feed in 1et
2 Feed preheater
3 Product outlet
4 Integral reactor
5 Reactor support
6 Thermowe 11
7 Tubular embedded element (10 kW)
8 Mica band elements (05 kW)
9 Insulation
10 Fluidised sand bed
11 Gas distributor
12 Rotameter
13 Air supply
14 Oisengagement zone support
15 U-tube manometer
The procedure used to determine the data to prepare a plot of pressure
drop across the bed vs the superficial velocity through the bed is
discussed below
Table 21 Sand size fractions
Size No 12 No 2
(vm) (wU) (wU)
-420
420-350
350-297
297-250
250-210
210-177
177-149
149-125
125-105
105-74
74 shy
Mean size
06
190
336
289
155
22
02
(101m) 1668
01
04
21
86
202
153
242
125
117
49
1243
49
251 Airflow optimisation
The calibration chart of the rotameter could be approximated usin9
Vc = 1983 + 0S8SmiddotTR + 0005 TR2
where Vc is the volumetric flowrate in lmin at lSC (Tc) and 760 mmH9
(Pc) and TR is the rotameter tube readin9 Usin9 ideal 9as behavior
this can be corrected to the actual temperature (Tr) and pressure (Pr)
in the rotameter usin9
Vr = (Vc Pc Tr ) I (Tc P r )
where Vr is the volumetric flowrate at rotameter temperature
and pressure
The pressure in the rotameter was that measured at the inlet to the bed
and was use to calculate the actual flowrate at each tube readin9 If
the 109 of the pressure drop across the bed and 4Ha was plotted a96inst
the 109 of the superfiCial velocity a strai9ht line was obtained The
9raph is shown in Fi9ure 25 The shape of this curve does not
correspond to that of the curve as discussed in Section 21 This is due ( l _ -- i~ -()~
to the fact that the pressure drop across the d~sk was included in the
calculation
200
60 0
IT I-shy--J W 20 0
D ~
080--J
040
-27 -25 -23 -2 -9 - 7 - 5
LBG (Vel FIG 25 PRESSURE DRBP VS SUPPERFICIRL VELBCITY
RCRBSS DISK RND BED
50 - ~
Having previously determined the pressure drop across the d~ the
actual pressure in the bottom of the bed could be calculated at each
rotameter tube reading using
Pb = Pr - Pd
where Pb is the pressure in mmHg at the bOttOM of the bed above the
disk and Pd is the pressure in mmHg in the rotameter when no sand was
in the bed
This corrected pressure was then used to calculate the actual flowrate
through the bed The temperatures of the rotameter and bed were assumed
to be identical and so
where Vb is the air flowrate at the bottom of the bed in lmin Using
the above procedure and plotting the log of the pressure drop across the
bed (Pb) against the log of the superficial velocity (Vb) a Curve of the
classic shape is obtained as shown in Figure 26 without the integral
reactor and in Figure 27 with the integral reactor in the bed In both
cases the minimum fluidisation veloCity was round to be 121 llmin
(Point E on Figures 26 and 27) and channel ing was absent (Part CD in
Figures 26 and 27 is flatgt
a
IT Ishy--J W 0 --
0 ~
1 70
1 50
1 30
10
090
070
050
-26 -26 -24 -22 -20 -1 6 -1 6
LBG (VC) FIG 26 PRESSURE DRep VS SUPPERFICIAL VELeCITY
INTEGRAL REACTeR ABSENT
51
1 70
shy
I 50
CL 1 30
CI f shy~ W 1 10 0
0900 a ~
070
050
-28 -26 -24 -22 LBG (Ve)
-20 -1 8 -1 6
FIG 27 PRESSURE INTEGRRL
DRBP VS RERCTBR
SUPPERFICIRL PRESENT
VELBCITY
252 Temperature correction
As the temperature in the bed increased to reaction conditions the
superficial velocity increased at a fixed rotameter setting This
resulted in a change in the Quality of fluidisation It was thus
desirable to develop a relationship between the bed temperature and the
rotameter tube reading at the minimum fluidisation velocity As the
temperature of the gas was raised to 330degC within 25 mm above the
distributor as shown by Heertjie and McKibbins (1956) the only
assumptions that had to be made was that the pressure drop across the
bed and di-~k-~as independent of temperature and that the i deal gas 1aw
applied Thus
To find the tube reading which corresponds to the air flowrate
calculated above the value had to be corrected to the rotameter
cal ibration conditions using
Vc = (VrTcPr)(PcTr)
Combining the above eQuation with that used to approximate the rotameter
cal ibration chart and solving for TR we get
52
TR = -585 + laquo30234 + 200Vr )s)
Tne resultin~ ~rapn is snown in Fi~ure 28 Usin~ tnis ~raph it was
ensured that the superficial velocity in the bed was close to the
minimum fluidisation velocity at any bed temperature
0 Z 0 CI W 0
W CO J I shy
200
180
160
14 0
120
100
80
60
00 400 800 1200 1600 2000 2400 2800
TEMPERRTURE C FIG 28 BED TEMPERATURE ( C) VS RBTAMETER
SETTING VB=121 LIMIN
53
3 EXPERIMENTAL METHODS
31 The reactor system
311 Layout
All experimental work was done in an inte~ra1 hi~h pressure reactor
system A dia~ram of this system is shown in Fi~ure 31 The feed a 41
mixture of propenepropane obtained from SASOL was contained in a
number seven Cadac cy1 inder mounted bottom up to ensure that only 1i~uid
emanated from it Water and entrained impurities were removed from the
feed by passin~ it throu~h a bed of Union Carbide 3 A molecular sieves
and through a 1 ~m sintered metal filter
The vapour pressure of the feed had to be lowered before it could be
pumped by the Lewa hi~h pressure diaphragm pump To achieve this the
feed was piped throu~h a heat exchan~er held at -1SC The pump head was
also cooled to this temperature In this way cavitation was prevented
and efficient workin~ of the pump was ensured From the delivery side of
the pump the feed was piped throu~h a preheater where it was heated to
within 20C of the operatin~ temperature to the top of the integral
reactor
The products from the reactor were piped throu~h a heat exchanger held
at 6C and a 20 ~m sintered metal filter to the Grove Mity Mite back
pressure re~ulator Here the materials were released to atmospheric
pressure The back pressure re~u1ator had to be heated to 60C to
prevent freezin~ of the products due to a Joule Thomson expansion and
subse~uent failure of the unit To achieve this a water bath was used
the liquid bein~ pumped throu~h a pipe wrapped around the outside of the
unit
The products were then piped via a heat exchan~er to a double walled
catchpot where ~as-1 iQuid separation occurred To ensure total
separation the 1 iberated ~as was passed through a Davies double surface
condenser held at -1SC with the condensate fed back to the catchpot
The catchpot was periodically drained and the liquid stored for later
analysIs The flue gas was then piped through a 10 1 surge tank to the
wet ~as flow meter Finally the flue gas was passed through a sampl ing
loop which could be removed from the system and vented to the
atmosphere
54 regshy --
--8
regshyL-------r
middot x lJJ l shymiddotI ltI)
middot I
I gtshyltI)bull
I 0
I C I l shy
( ltr I lJJ
0 I -
rlt
e-uc1
reg-r-------- r-I-rx1---1________J
regt--==-==-=--=-=--=--_==-==-~=r111_~r--------
55
Key to Figure 31
1 Monomer feed cylinder
2 Dimer feed cyl inder
3 Gas tight Quick connector
4 3A molecular sieve holder
5 1~m sintered metal filter
6 20~m sintered metal filter
7 Glycolethanol cooler
8 Glycolwater cooler
9 Glycolwater cooled catchpot
10 Glycolethanol cooled condenser
11 Monomer pump
12 Dimer pump
13 Bursting disk (70 atm)
14 Thermowell
15 Reactor
16 Fluidised sand bed
17 Feed preheater
18 150vm sintered brass disk
19 10 mm rotameter
20 Oil condenser
21 Back pressure regulator
22 Condensation unit
23 Surge tank
24 Wet gas flow meter
25 Gas sampl ing loop
26 Nitrogen bottle (hish purity)
27 Nitrogen bottle
28 Air supply
29 Hydrogen bottle (high purity)
A separate line was used to purge the reactor with wet or dry hydrogen
nitrogen or air depending on the pretreatment required by the catalyst
Vent lines were installed to prevent air locks in the system during
start up
The safety of the line was ensured by a bursting disk set at 70 atm and
a pressure re1 ief valve in the pump which permitted internal circulation
if the del ivery side pressure exceeded the set point
Two cooling Circuits were employed An ethylene glycolwater mixture at
6C was used to cool the catchpot and all product heat exchangers while
56
an ethanolwater mixture at -10C was used to cool the feed heat
exchanger pump head and the flue gas condenser
32 Reactor
Before any statement could be made about the effects of temperature on a
reaction in an integral reactor the latter had to be as nearly
isothermal as possible Various attempts have been made to achieve
isothermal ity eg Hogan et a1 (1955) surrounded the reactor with an
electrically heated jacket containing a 1 iQuid which was boiled at a
temperature fixed by the pressure of inert gas applied to the top of the
reflux condenser 1mai (1968) on the other hand inserted the reactor
into a heated fluidised bed of iron powder In the present work the
system used by Imai (1968) was adopted Sand was however substituted for
iron powder as the explosive and toxic nature of metal1 ic dust at the
temperatures reached during calcination made the latter undesirable The
final result was a reactor where the temperature in the catalyst bed
could be held within 5C of the set point Each aspect of this design
was discussed in Chapter 2 while a description of the reactor is given
below The reactor consisted of two distinct parts the fluidised bed
and the integral reactor Both are shown in Figure 32
321 F1uidised Bed
The fluidised bed consisted of a rolled sheet metal chimney with a
removable disengagement zone An inverted tripod was suspended from the
top of the chimney into which the reactor was hung Air was injected
into a sealed chamber at the bottom of the bed in such a way as to
prevent impingement of the gas on the distributor (see Figure 32) The
distributor used was alSO vm sintered brass disk Great care had to be
taken to mount the gas distributor absolutely horizontally as severe
channeling and corresponding loss in heat transfer efficienCY would
result otherwise The air flow through the bed was controlled usin9 a 10
mm gas rotameter with a stainless steel float
Heat was suppl ied to the fluidised bed by five mica band elements
strapped around the outside of the chimney Each element was rated at
05 k~ The controlling thermocouple Cchromel-alumel) was situated on
the inside wall of the chimney half way up the bed To prevent heat loss
to the surrounding the entire unit was insulated using asbestos cloth
57
reg
FIG 32 INTEGRAL REACTOR AND FLUIDISED SAND BED
58
Key to Figure 32
1 Feed inlet
2 Feed preheater
3 Product outlet
4 Integral reactor
5 Reactor support
6 Thermowell
7 Tubular embedded element (10 kW)
8 Mica band element
9 Insulation
10 Fluidised sand bed
11 Gas distributor
12 Rotameter
13 Air supply
14 Disengagement zone support
322 Integral Reactor
The reactor was a multi-component single seal unit with a bed diameter
of 25 cm Two distinct sections could be identified cross-sections of
which are shown in an exploded form in Figure 33
The insert consisted of the top flange through which the thermowell and
feed were passed and the catalyst bed jacket which was screwed into the
bottom of this flange The catalyst bed jacket was stoppered at its
lower end by a perforated plug which prevented bed entrainment and
centered the bottom end of the thermowell Holes were drilled through
the top flange to allow passage of the securing bolts The sleeve
consisted of the bottom flange to which the reactor jacket was welded
which in turn was sealed at its lower end by a Concave plug through
which the products were taped off Securing bolts were anchored in the
top surface of the bottom flange Sealing was achieved by a groove in
the bottom flange and a ridge in the top flange These served as a seat
for a laminated graphite nickel seal
Separation of the units upon completion of a run was achieved with the
aid of two 6 mm bolts These bolts were screwed through holes in the top
flange onto the top surface of the bottom flange In this way the units
could be forced apart
Heat was supplied to the unit by a 1 kW tubular imbedded element wrapped
around the outside of the reactor jacket This element was used only
59
o
e- _ _--+-shy
FIG 33 INTEGRAL REACTOR
60
Key to Figure 33
1 Reactor sleve
2 Plug
3 Seal ing bolts
4 Sealing groove
5 Bottom flange
6 Top flange
7 Reactor insert
8 Feed inlet
9 Thermowell inlet
10 Sealing ridge
11 Thermowe 11
12 Bed seath
13 Purforated plug
14 Sealing bolt channel
15 Seperation bolt channel
during calcination The controll ing thermocouple (chromel-alume1) was
placed halfway up the thermowel1 running down the center of the catalyst
bed
Temperatures of the reactor fluidised bed and feed were monitored using
a Digitron temperature display connected to 11 iron-constantan
thermocouples Ten of these were situated at regular intervals in the
central thermowe11 to record the catalyst bed temperature profile and
feed temperature The fluidised bed thermocouple was mobile and could be
moved throughout the bed
33 Operation
331 Loading
For every run the reactor was packed in a similar way as shown in Figure
34 Four distinct regions were identified These were from the bottom
up
1 A region of void capped with a wire mesh which prevented the
catalyst and beads from blocking the reactor exit
2 A layer of glass beads which served as a disengagement zone and
prevented catalyst entrainment
3 The catalyst bed which Consisted of 11~ inch extrudates mixed with
2 mm glass beads in a ratio of 11 by volume The beads served as a
heat sink and catalyst diluent
4 A plug of glass beads capped by a wire mesh This ensured preheating
and prevented movement of the bed during sudden pressure drops
The depth of each layer was accurately measured to fix the number and
position of the thermocouples in each region
332 Calcination procedure
Prior to each run the catalyst was calcined The purpose of calcination
was to burn off organic intermediates incorporated in the catalyst
during synthesis and to convert all the nickel nitrate to nickel oxide
At the same time the catalyst was freed of all but a trace of moisture
(Hogan et a1 1955)
Calcination for all experimental work was carried out in-situ Dry air
was passed through the bed at a rate of 500 m1-gasm1-cat-h while the
temperature was stepped up in 50degC increments at intervals of 10 min
The activation was continued for an additional 4 h at 500degC
Upon completion of this step the activated catalyst was purged with dry
nitrogen until the temperature of the bed dropped to 250degC When this
temperature was reached the reactor was sealed at a pressure of 10 atm
under dry nitrogen before being allowed to cool to room temperature
35 ml of 2 mm 91ass beads
18 m1 of catalyst mixed
with 2 mm glass beads in
a ratio of 11 (vv)
Total volume 80 ml
50 ml of 2 mm glass beads
void
FIG 34 REACTOR BED
62
333 Start-up
Prior to introducing the reactants into the system the cooling circuits
and water bath were allowed to operate for a sufficiently long time to
ensure that the temperatures reached steady state The back pressure
regulator was set to the desired value and the fluidising air set to the
value determined previously
The feed cyl inder was then opened and the reactants allowed to flow to
the inlet of the sealed reactor All air was removed from the low
pressure side via a vent 1 ine and the pump started At this time the
reactants were allowed to flow through the reactor and into the rest of
the line When the pressure in the system reached its set point the
pump setting was altered to give the correct feed rate Once this had
been achieved the temperature of the bed was set to the desired value
When the first drops of liquid were collected the feed cyl inder was
changed and the catchpot emptied This was taken as time zero Although
a certain amount of data was lost during start-up this persisted over a
relatively small time fraction of the entire run Little significant
information was therefore lost Furthermore in this way the liquid left
in the line and reactor at the end of a run did not affect the mass
balance
334 Steady state operation
To monitor the performance of the isothermal reactor and the catalyst
the following readings were taken at selected time intervals
- bed temperature profile
- fluidised bed temperature
- fluidising air flow
- 1 iQuid mass and volume
- tail gas meter reading
- tail gas temperature
- GC analysis of tail gas
- GC analysis of 1 iquid
The feed cyl inder was changed when necessary The mass of the used and
fresh cylinder was noted
335 Shut-down
When shutting down the system the feed pump was switched off and the ~~
procedure as outlined above followed The feed cyl inder was however not
replaced Once the relevant data had been collected
- the temperature controllers were switched off
- the coolant and heating flows were stopped
- the system pressure was released to atmosphere
Temperature runaways did not oCcur during start up However it was
found that the degree of control that could be exercised was sensitive
to sand height and the pOSition of the contro11 ing thermocouple in the
fluidised bed which were consequently monitored by visual inspection
throughout the run
34 Data analysis
The data and collected during the run was analysed using a variety of
procedures These are discussed below
341 Computation of results
A computer program was util ised to analyse the data obtained during the
runs The following was computed
Mass balance The percentage mass loss was calculated using
(total liquid out + total gas OUU]X mass loss = 1 - - 100
[ (total weight of feed in)
where the (total liquid out) is measured directly by adding the weight
of all 1 iquid sampled The (total gas out) was calculated using
(P-V-M)total gas out =
(Z-R-rgt
where P = pressure in atm
V = total volume of fl ue gas in 1 i ters
M = molecular weight based on mean over entire run
Z = compressibility factor (0986)
R = universal gas constant (S21xlO- 2 atmlgmoleK) and
T = gas meter temperature In K
64
Two limiting cases of where mass loss could OCcur would be 1) all mass
was lost before the reactor in which case the mass out would be equal to
the effective mass in and 2) all mass was lost after the reactor in
which case the mass in would be equal to the mass out plus the mass
lost To account for the mass lost it was assumed that the rate of mass
loss was constant throughout the run and that the mass was lost in the
form of gas The calculated WHSV and conversion would depend upon where
the mass loss occured The equations used to calculate these are shown
below
Wei9ht Hourly Space Velocity This was the rate of feed in per hour per
gram of catalyst and was calculated usin9
(mass of propene and propane passing over the catalyst)WHSV =
(total time)(catalyst mass)
where n = 1 if it was assumed that all mass was lost before the reactor
n =2 if it was assumed that all mass was lost after the reactor
Liquid production rate This is an indication of the activity of the
catalyst and is expressed in terms of grams of liquid product obtained
per gram of catalyst per hour As it was assumed that all mass lost was
gas the mass of liquid out was that measured and the LPR was calculated
using
(mass of liquid out - mass of dissolved gas)LPR =
(total time)(mass of catalyst)
Liquid mass X conversion This is calculated using the formula
mass X conversion =[ (LPR) ] 100 WHSVn(w)
where n = 1 if it was assumed that all mass was lost before the reactor
n = 2 if it was assumed that all mass was lost after the reactor
w is the mass fraction of propene in the feed
Liquid sample composition The liquid product was grouped into 01 igomers
of propene as dimer trimer tetramer etc The liquid composition was
based on the mass percent output the response factors havin~ been set
equal to one It can be used to compare 01 i~omer production rate between
different runs and variations with time in a particular run
65
Gas sample composition This data is expressed in terms of mass X since
all GC response factors have been determined
Apart from the mass balance data all other results could be presented in
graphiCal form as functions of time on stream ~hen the data was plotted
in this wayan average time between two sampling pOints was used Data
was recorded only from the time that the first drop of product was
collected this time being defined as time zero
35 Analytical procedure
351 Gas analysis
Both the feed gas and flue gas were analysed on a Gow-Mac 750p gas
chromatograph whose responses from the detector were monitored by a
Varian 4270 intergrator The packing used for this work was n-Octane
Poracil C in a 55 m glass column with an inner diameter of 4 mm Table
31 shows the typiCal composition of the feed used The GC settings
used together with a typical chromatogram of the feed with its retention
times and response factors are shown in Appendix A as is a discussion
of the calibration procedure
Table 31 Feed Composition
Hydrocarbon MassX
Methane 00
Ethane 09
Propane 20
Propene 78
Iso-Butane 02
N-Butane 02
1-Butene 04
Iso-Butene 01
T2-Butene 01
C2-Butene 01 C5+ 02
352 LiQuid analysis
LiQuid samples were analysed by a Varian 3400 together with a Varian
8000 auto sampler The packing used for this work was 3 3i1 iconOV-lDl
66
on Chromosorb W-HP 100120 mesh in a 3 m long glass column with an inner
diameter of 4 mm The responses from the GC were monitored by the
Varian Vista 401 data system This system could be programmed to give an
integral analysis of the results The GC settings as well as a
discussion of the optimisation and cal ibration procedure used are given
in Appendix A
Due to the complex nature of the liquid products the analysis of the
liquid spectra was difficult To facilitate product analysis it was
decided that the 1 iquid product analysis be based on carbon number
groupings rather than on individual Components The groupings chosen are
shown in Table 32
Table 32 Carbon number groupings used for 1 iquid analysis
Group Range
Monomer (C3 ) C3 -c Dimer (C ) C~ -C7
Trimer (C ) Ca -Ct 0
Tetramer (C t 2 ) Ctt-Ct3
Pentamer (C t ~ ) Ct -Ct
Heptamer (Cta ) Cn -C
Hexamer (C2 t ) C20+
353 Nuclear magnetic resonance
The hydrocarbon functional group distribution of C to Cta propene
oligomerisation products was determined using lH NMR Conventional
methods of spectral analysis for propene 01 igomers were inadequate
because of the great variety of head to tail and tail to tail fragments
generated and because of the greater influence from end groups
As 13C NMR was not available at the time of this work only a partial
analysis of the 1 iQuid products was possible The information thus
obtained was that of the type of proton present primary secondary or
tertiary The characteristic proton chemical shift for the relevant
protons are shown in Table 33 (Galya et a1 bullbull 1985)
67
Table 33 Structure definitions of terms and NMR spectral
positions and area code (Galya et al bullbull 1985)
Species Structure Area
(ppm) Code
Protonated aromatic
Olefinic CH2
Olefinic CH
Aromatic CH
Aliphatic region
or to aromatic CH2
or to aromatic CH3
or to olefinic
CH CH2
or to olefinic
CH3
11 to olefinic
CH CH2
CH2 between
isopropyl end
groups and CHs
Term i na 1 CH3
Internal CH3
and olefinic region_
R-CH=CH2
R-CH=CH-R
ltO~CH2-CH2-R
ltO~CH3
R2-CH-CH=CH-CH2-R
R-CH=CH-CH3
CH3 -(CH2)2 -CH=CH-R
R-CH(CH3 )-(CH2 )2 -CH=CH-R
450-475 L
475-575 M
650-730 N
230-300 A
210-230 B
180-210 C
1 40-1 80 o
100-140 E
092-1 00 F
084-092 G
070-084 H
68
Using the equations developed by Galya et a1 (1985) for the C6 to Cta
oligomerisation products of propene each lH area was first converted to
a carbon area before the percentage of each was calculated
The carbon area of CH3 was calculated using
(Area G + Area 0 + Area B + Area H)CH3 carbon area =
3
and the carbon areas of CH2 and CH were calculated using
(Area E + Area A + Area C) (Area H)CH2 carbon area = --------------------------- + Area F
2 6
Area HCH carbon area = + Area F
3
The degree of branching ie the CH3 to CH2 CH3 to CH and CH to CH2
ratios could be approximated (Ga1ya et al bullbull 1985) using
2middot(AREA G + AREA 0 + AREA B + AREA H)= CH2 3middot(AREA E + A~EA A + AREA C) - AREA H + 6middotAREA F
(AREA G + AREA 0 +AREA B +AREA H)= (AREA H + 3-AREA F)
CH = CH2 3middot(Area E + Area A + Area C) - Area H + 6middotArea F
The above equations will be used to analyse the NMR spectra in this
work
354 TGOTA
Thermogravimetry (TG) involves measuring the changes in sample mass with
temperature using a thermobalance This is a combination of a suitable
electronic microbalance with a furnace and aSSOCiated temperature
programmer The balance is in an enclosed system so that the atmosphere
can be controlled Differential Thermal Analysis (OTA) involves
measuring the difference in the temperature between the sample and a
reference material while both are being subjected to the same
temperature program Both TG (mass loss In wtX) and OTA (temperature
difference between sample and reference material) are recorded as a
function of furnace temperature The furnace used in this work was a
STA-780 Series with a Stanton Redcroft Thermal Analyser The balance was
69
controlled by a Stanton Redcroft Balance Controller while the
temperature in the furnace was controlled by a Stanton Redcroft
Temperature Controller The si~nals were amplified by a Stanton Redcroft
DC amplifier and recorded by a Bondwe11 Personal Computer
In this work 20 m~ of sample was placed in the furnace and the
temperature raised from 40C to 850C at a rate of lOCmin in flowin~
air or nitro~en
355 Water content determination
The water content of the feed was determined by measurin~ the dew point
temperature of the water in the feed usin~ a Panametrics Hy~rometer
ltModel 7000) with an aluminium oxide sensor Approximately 48 h was
needed for the system to stabilise Once this temperature had been
measured the vapour pressure of the water in the feed was determined (at
1 atm) and the mole fraction of water in the feed determined Usin~ the
above procedure it was found that the feed contained approximately 112
ppm (vv) water
356 Distillation
The 1 iquid products obtained from the high pressure reactor runs were
distilled in a glass distillation column shown in Fi~ure 35 to
separate the C from the heavier fractions After the still was filled
up to 3 liters per batch it was placed into a heatin~ mantle and
connected to the column with a Gduick-fit connector Upon heating the
vapours from the still passed via a column packed with berl saddles to a
condenser Here the condensate was either directed back to the column as
reflux liquid (plun~er down) or to the catchpot (plun~er up) as
product This separation was controlled by a solenoid operatin~ a ma~net
fused to the plun~er The solenoid in turn was controlled by a timing
device with which the total cycle time and reflux time could be set The
reflux ratio was then calculated by the ratio of the time the plun~er
was up to the time that the p1un~er was down For all cases the reflux
ratio used was 29 The cut off temperature was set by a thermostat at
the top of the column When the desired temperature was reached power
to the solenoid was discontinued and subsequently the plunger remained
down (total reflux) The cut point temperature used was 6ZC The
coolant used in the condensers was water Dissolved gases did not
condense and were vented to the atmosphere
70
1-+-+----1 5
FIG 35 BATCH DISTILLATION UNIT
71
Key to Fi9ure 35
1 Still
2 Berle saddle column
3 Reflux condenser
4 Magnet at top of plunger
5 Plunger assembly
6 Gas tappin9 point
7 Distillate receptacle
36 Catalyst synthesis
361 Support preparation
The silica-alumina support was received from Kal i Chemie in the form of
4 mm spheres which were crushed in a ceramic ball mill to -500 ~m The
silica to alumina ratio was 91 on a wei9ht basis
362 Impregnation
A previously determined mass of metal salt was dissolved in 500 ml of
distilled water to which 50 9 of silica alumina was added The solution
was boiled under reflux for 1 h with vigorous agitation throughout The
vessel was then opened to the atmosphere and while being a9itated most
of the water boiled off The concentrated solution was transferred to a
ceramic pie dish and placed into an oven at 120C where the remaining
water was evaporated Once the material was completely dry it was
crushed sieved and stored The above was adopted from work by H09an et
a1 (1955) and Holm et a1 (1957)
3621 Nickel concentration
The Quantity of nickel needed to make a catalyst of known metal content
was determined in a separate experiment Using a constant mass of sil ica
alumina but varyin9 the amount of nickel nitrate hexahydrate a loadin9
curve was constructed The synthesis procedure used was that as
discussed above The nickel content of the material was determined usin9 b
atomic a_sorption spectrophotometry The loadin9 Curve is shown in
Figure 36
363 Hom0geneous decompOSition deposition
In this method 45 9 of nickel salt was dissolved in 500 ml ot distilled
water to which 50 9 of silica alumina was added The solution was then
heated under reflux to 100C at which point 25 9 ot urea crystals were
added This was taken to be time zero The solution was then ret1uxed
72
while continuously being agitated for a previously determined period of
time as discussed below Excess water was removed by filtration in a
Buchner funnel and the catalyst washed with 20 volumes of hot (90C)
distilled water per volume of catalyst The catalyst was then dried at
110C in a ceramic pie dish for 12 h before being crushed and stored
The above synthesis procedure was adopted from work done by Van Dillen
et a1 (1977) Richardson and Dubus (1978) and Hermans and Geus (1979)
120 IMP LOADING CURVE
SOG S i 02 I A h 03 ~
SOOml H2O(f) 100
(f)
a L
60 bull
IshyZ 60 CD U
40-1 W
-~ U 20
Z
00
00 100 200 300 400 500 MRSS G
FIG 36 NICKEL CONTENT (MASSJ VS MRSS OF NICKEL NITRRTE HEXRHYDRRTE (GJ
3631 Nickel concentration
The time required to load a desired Quantity of nickel was determined in
a separate experiment All quantities of materials used were as
discussed above but while the mixture was boil ing under reflux samples
of solution (5 m1) were taken at discrete intervals These samples were
than washed and dried in the usual manner and their nickel content
determined using atomic adsorption spectrophotometry In this way the
loading Curve was constructed from which the time required to produce a
catalyst of known metal content could be read Two sets of startins
conditions were used as shown in F1gure 37
73
200 1I=509 Ni(N03h6H20
309 Si02A1203~ (j) 259 (NH2CO (j) 160 600ml H20CI L
bull 120bull
() 45c1 Ni (N03 h 6H20
503 S i 02 A 12 03
253 (NH-z )CO
50Om 1 H-z 0IshyZ 8 U 80
--J W ~
40U - Z
00
00 1000 2000 3000 4000
TIME MIN FIG 37 NICKEL CBNTENT (MRSS) VS TIME (MIN)
364 Coprecipitation
Two solutions were prepared One contained 180 3 of sodium meta silicate
in 1200 ml of distilled water and the other contained 42 3 of aluminium
nitrate nonahydrate and 117 3 of nickel nitrate hexahydrate in 1000 ml
of ~istilled water It was important that the pH of the final solution
was kept in the ran3e of 8 ~ 05 To achieve this caustic soda could be
added to the sodium solution or nitric acid to the solution of the
nitrates In this work 82 ml of nitric acid (70 wtX HN031 was added to
the solutions ot the nitrates The two solutions were mixed in a ~ 1
CSTR while being vigorously agitated and the pH adjusted using 5 9 of
sodium hydroxide in 100 ml of water A 3e1 formed after about 30 sand
was allowed to stand for 1 h This material was then filtered using a
Buchner funnel broken up and dried for 12 h at 110middotC The dried sol id
was washed twice by decantation with water and then washed ~ith six or
seven successive portions of 5X ammonium chloride The ammonium ~ash
involved soaking the catalyst for 1 h at 70C In an excess of solution
which was then drained using a Buchner funnel In thiS way any sodium
held in the sol id was removed by base exchange The catalyst was then
washed with distIlled water and dried at 110C for 12 h before being
74
crushed sieved and stored (Holm 1957) The si1 ica to alumina ratio of
the final catalyst was 91 while the nickel content was 4 wt~
365 Determination of nickel content
To determine the nickel content of the catalyst an accurately weished
sample approximately 025 s was added to 5 ml of hydrof1uric acid in a
teflon beaker The solution was left for 12 h after which 5 m1 of
concentrated sulphuric acid and 5 m1 of distilled water were added This
was again allowed to stand before being made up to 250 m1 in a
volumetric flask In this way the catalyst was broken down into its
individual elements and the nickel contents determined usins the Varian
SpectrAA-30 Atomic Adsorption spectrophotometer
366 Extrudate manufacture
The powder form of nickel oxide silica alumina was found to be too fine
for effective use in the hiSh pressure intergral reactor as it caused an
excessive pressure drop and downstream plugging problems Breck (1980)
suggested the use of an inorganic binder such as kaolinite in the
formation of extrudates This approach was found to be effective if the
Quantity of binder was sreater than approximately 35 wt At lower
binder mass fractions the material could not be extruded
The binding process consisted of mixins the binder with the catalysts to
form a homogeneous paste the amount of water used carefully judged by
visual inspection When the paste had the desired consistency it was
loaded into a previously wetted stainless steel piston and plunger
assembly and extruded onto filter paper The catalyst was then dried at
80C for 12 h
Breck (1980) further suggested that the extrudates be baked at 370C for
12 h to convert the clay to an amorphous binder of considerable
mechanical strength It was however found that this was not necessary as
the extrudates had sufficient strength after drying at 80middotC
75
4 RESULTS
Various types Ot catalyst synthesis procedures were examined These were
homogeneous decomposition deposition (HOD) i mpregnati on (IMP) an d
brietly coprecipitation (SGb as well as the catalytic properties Ot
the silica alumina support (SA) The si1 ica to alumina weight ratio used
throughout was 9 to 1 The criterion whereby the activity Ot the
catalyst was measured was the 1 iQuid production rate (LPR) The
selectivity of the catalyst expressed in terms Ot massX 1 i~uld
composition gave an indication ot the relative amounts Ot the various
01 igomers formed
The reaction conditions used were a temperature of aoc and a pressure
of 40 atm unless otherwise stated The catalyst size fraction used was
-500 IJm which was made into 110 inch extrudates using 35 wt~ kaol inite
as binder
As mentioned previously the feed used was a 41 mixture ot
propenepropane with trace impurities of C4 and C2 hydrocarbons unless
otherwise stated The exact composition ot the feed is shown in Table
31
The reaction conditions used in all experiments are summarised in Table
41 The WHSVt and WHSV2 were calculated assuming the mass loss occurred
before the reactor and after the reactor respectively in the torm of
gas For the purpose of plotting the results it was assumed that all
mass was lost betore the reactor ie bull ldHSVt was used in all the
figures
41 Reproducibil ity of Data
Two runs were carried out under identical conditions Ot temperature
pressure and WHSV The catalyst used in both runs was an HOD type
catalyst with a nickel content of 15 wt~
Figure 41 shows the LPR for each run as a function of time It can
clearly be seen that the largest discrepancies occurred during start-up
76
Table 41 Reaction data
CommentCode Nickel Press WHSVt (wU) (atm) (ggh)
HDD-1 15 80 40 42 45 HDD-2 1S 80 40 53 56 Reproduc i b i 1 ity
HDD-3 15 80 40 52 56 Reproducibil ity
HDD-4 15 80 40 51 55 Wet feed
HDD-5 15 80 40 47 48 Regenerated HDD-4 HDD-6 15 200 40 49 55 Temp runaway
HDD-7 15 80 40 54 56 Regenerated HDD-6 HDD-8 15 150 40 43 47 HDD-9 15 210 40 66 73
HDD-10 22 80 40 50 55 HDD-ll 72 80 40 42 47 HDD-12 117 80 40 49 52 HDD-13 113 SO 40 54 57 HDD-14 113 80 40 108 117 HDD-15 113 80 40 116 132 HDD-16 117 80 20 67 74 HDD-17 117 80 50 50 52 HDD-1S 15 aO200 40 55 LiQuid feed (C )
HDD-19 15 80 40 SS li QU i d gas f~ed
HDD-20 15 200 40 77 liquid gas feed
IMP-1 OS SO 40 47 4S IMP-2 19 SO 40 53 56 IMP-3 22 SO 40 4S 49 IMP-4 46 80 40 33 39 IMP-5 63 SO 40 49 54 IMP-6 71 80 40 44 48
IMP-7 9S 80 40 52 55 IMP-S 98 SO 20 59 66 IMP-9 9S 80 50 50 53
SG-1 15 SO 40 52 55 SG-2 15 80 20 59 61 SG-3 30 80 40 37 41
SA-1 80 40 40 41 SA-2 150 40 62 63 SA-3 200 40 35 42
77
ceOE NIOll) TR( middotC) P(ATHI WHSV 600 J=HOO-2 1 5 80 40 53
()=HOO-3 I 6 80 40 62
600
300 bull
e 0- 200
bull
1 00
000
00 40 60 80 100 120
TIME H FIG 41 LIQUID PRSDUCTISN RRTE (GHGJ VS TIME (H)
J=O I MER )()=TR I HER HOO-2 =TETRAHER
lUOO
~ +=PENTAHER (j)
X=OI HER )(j) 800 ~=TRIHER HOO-3 IT +=TETRAHER L )( =PENTAHER
bull 600 Il )((j)
o 0- L 400 o U
bull o 200
e
IJ RI00
00 20 40 60 80 100 TIME H
FIG 42 LIOUID CSMPSSITIBN (MRSS) VS TIME (Hl
78
Once steady state had been obtained approximately after 4 h on stream
conversions were similar and the reproducibility acceptable
Figure 42 shows selectivity as a function of time on stream Here it
can be seen that the dimer trimer tetrameter and pentamer were
produced in similar Quantities throughout the two runs
It was thus concluded that at steady state adequate reproducibil ity was
attained with respect to both selectivity and LPR
42 Nickel content
In the case of HOD type catalysts the nickel content was varied from
15 wtX to 117 wt It can be seen from Figure 43 that while the LPR
differed from run to run this variation was due to WHSV differences
and no trend with increasing nickel content was observed The LPR
remained between 3 and 4 grams of product per gram of catalyst per hour
over the range of nickel loadings examined The selectivity of the
catalyst as shown in Figure 44 was also found to be essentially
independent both with respect to nickel content and time on stream
although a sl ight decrease in dimer Yield was observed ~ith increasing ltshy
n lkel content
In the case of IMP type catalysts the nickel content was varied from
10 wtX to 98 wtX An accurate statement about the effect of nickel
content on the activity of IMP type catalysts could not be made due to
differences in the WHSV The selectivity as a function of both time on
stream and nickel content is shown in Figure 46 The catalyst with 08
wtY nickel exibited the greatest selectiVity towards trimers and the
dimer Yield inCreased sl ightly with increasing nickel content No other
marked changes in the selectivity were observed as a function of nickel
content or time on stream
43 Effect of ressure
In Figure 47 the lPR vs time on stream is shown for an HOD type
catalyst with a nickel content of 113 wtX at three different pressures
It can be seen from this figure that as the pressure was decreased from
50 atm to 20 atm the lPR remained constant although the WHSV was higher
at lower pressures This suggests that the activity c~ the catal~sts
dropped with decreasin9 pressure The selectiVIty shown in FI9ure 43
as a function of time on stream and pressure was also dependent ~n the
pressure used It Can be seen from Figure 4S that at 20 atm propene
dimer accounted for approximately 70 wt of the 1 iQuid pr0Juct ~hile at
79
600
o 500
r 400o
bull 300
a
bull CL 200
-1 1 00
000
ceOE Il =HOO-J ()=HOO-I0 4 =HOO- I I +=HOO-12
NI(WTtJ 1 5 22 72 11 7
TR bullC) P(ATMI WHSV 80 40 42 80 40 50 80 40 42 80 40 49
00 20 40 60 80 100 TIME H
FIG 43 EFFECT OF NICKEL CONTENT (MASS) ON
1000
~ (f)
(f) 800 a L
bull 600 (f)
o CL L 400 o U
o 200
00
LIQUID PRODUCTION RATE (GHGl HOD
1l0 I MER l()=TRIMER 4 H eN STREAM 4TETRAMER +PENTAMER XOIMER l~TR[MER 8 H eN STRERM TETRAMER ~ PENTRMER
$lt ~ ~ ~
- - bull ~ J shy
00 20 40 60 80 100 120
NICKEL CONTENT MRSSi FIG 44 EFFECT OF NICKEL CBNTENT (MASS) ON
LIQUID COMPOSITIBN (MRSS) HOD
I
o
o
bull a
bull CL
bull
6middot00
500
400
300
200
ceOE ll=IMP-l ()=INP-2 = I MP-3 +=IMP-4 X=IMP-5 0= INP-6 P=IMP-7
NI(HTI) 08 t9 22 46 63 71 98
TR( middotC) 80 80 80 80 80 80 80
80
P(ATNI 40 40 40 40 40 40 40
HHSV 47 53 48 33 49 44 52
000
00 40 60 80 100 120 TIME H
FIG 45 EFFECT BF NICKEL CBNTENT (MASS) BN LI QU I D PRBDUCT IBN RATE (GHG l IMP
1000
~ (j)
(j) 800 a L
bull 600 (j) (2]
CL L 400 (2]
U
o 200
00
Il=DIMER ()=TR I MER =TETRRMER +=PENTAMER X=Dl MER0=TR IMER P=TETRRMER ~=PENTRMER
~- ~ ~ ~======~
~ ~ JlJl1 -l
) 4 H aN STRERM
1 8 H aN STREAM
00 20 40 60 80 100NICKEL CBNT MRSSi
FIG 46 EFFECT BF NICKEL CeNTENT (MRSS) BN LIQUIDCOMPOS I T I eN (MRSSi) IMP
81
o
600
500
ceDE Il=HDD-16 e)=HDD-13 AHDD-17
NI(WTZ) 117 113 117
TR( C) 80 80 80
P(RTMI 20 40 50
WHSV 67 54 50
r 400 o
bull bull 300
0
bull Q 200
000
00 20 40 60 80 100
TIME H FIG 47 EFFECT OF PRESSURE (RTM) ON LIQUID
PRODUCTION RRTE (GHG) HOD
1000
~ en en 800 a 2
bull bull 600
en ~ Q
2 400 ~ U
bull (3 200
00
Il =0 I MER )e)=TR 1 MER 4 H eN STRERM A=TETRRMER +=PENTRMER X=D I MER ~=TRIMER H 8N STREAMI 8 +=TETRRMER X =PENTRMER
~ e -0
-=+
=
Ii if
100 200 300 400 500 600
PRESSURE RTM FIG 48 EFFECT OF PRESSURE (RTM) ON LIQUID
COMPOSITION (MRSS) HOD
82
50 atm the liquid product Contained only 50 wt~ dimer The observed
shift to li~hter products with decreasin9 pressure is consistent with
thermodynamiC predictions althou9h increasin9 the WHSV and hence
decreasln9 the contact time would result in the same shift in product
spectrum
In the case of an IMP type catalyst containin9 98 wtX nickel the LPR
as well as the selectivity were very sensitive to the pressure used The
LPR at three distinct pressures is shown in Fi9ure 49 as a function of
time on stream It can be seen that at 20 atm the catalyst rapidly
deactivated and was practically inert after 7 h on stream At the other
pressures examined ie bullbull 40 and 50 atm no difference in the LPR was
observed The selectivity of the catalyst is shown in Fi9ure 410 as a
function of pressure At 20 atm the 1 iquid product contained
approximately 30 wt~ dimer which inCreased to 67 wtl at 40 atm dropping
to 62 wt~ at 50 atm This trend althou9h opposite to that observed for
HOD type catalysts is in ailreement with the data reported in the
literature (Takahash i et a 1 bullbull 1969)
The LPR of a SG type catalyst with a nickel content of 15 wtr is shown
in Fiilure 411 at two distinct pressures At 40 atm the LPR was
comparable to that of HO~ and IMP type catalysts while at 20 atm the
catalyst was totally inert The selectivity of the SG type catalyst at
40 atm differed markedly from that of an IMP and HOD type catalyst In
that the liquid not only contained a larile percentage Ot dimers (40 wt~)
but also an equally larile percentage of trimers
44 Bed temperature profile
Before any statement as to the effect of temperature could be made the
temperature throughout the bed had to be constant and not fluctuate
excessively durin9 a run
In Fiilure 413 the temperature profile through the entire reactor is
shown at 4 discrete times ~urin9 a run The catalyst bed started at
position 4 and extended for 172 em down the reactor to position 8 In
this re9ion of the reactor viz bullbull over the catalyst bed a temperature
deviation from the set point of not more than 4C was observed at th~
times shown In FI9ure 414 ~he temperature fluctuations with time were
plotted at positions 4 6 and 8 From this figure it can be seen that
the amplitude of the temperature fluctuations with time were 4C for
position 4 and 6 and 3C for POSition 8 It can thus be concluded that
at aoc the temperature throu~hout the bed and over the period of the
83
600 ceOE Il =I HP-8
N I ( WT ) 98
TRIC) 80
PIATHI 20
WHSV 59
() =I MP-7 98 80 40 52 =lHP-9 98 80 50 50
cJ 500
- I - 400 cJ
bull 300
0
bull 0 200
bull
000
0middot0 20 40 60 80 100
TIME H FIG 49 EFFECT BF PRESSURE (ATM) BN LIQUID
PRBDUCT IBN RATE (GHG) IMP
Il=OIMER 11000 ()=TR 1MER 4 H 6N STRERM 4I=TETRRMER
~ +=PENTRMER (j)
(j) 800 IT L
bull 600
(j) ()
0 L 400 ()
U
bull (3 200
00
100 600
FIG 410 EFFECT SF PRESSURE (ATM) BN LIQUIDCBMPBSITIBN (MRSS) IMP
~---l--_--1-+
200 300 400 500
PRESSURE RTM
84
600 ceDE Nt (WT J TR ( bull C) PlATM) WH5V [J =5G-1 1 5 80 40 52 ()=SG-2 I 5 80 20 59
CJ 500
- I - 400 CJ
bull 300
Ct
bull D- 200
-J 1 00
~-----elE9----egt000
00 20 40 60 80 100
TIME H FIG 411 EFFECT eF PRESSURE (RTM) eN LIQUID
PReDUCTIeN RRTE (GHG) SG
600 [J=O IMER ()=TR I MER ~=TETRAMER
~ +=PENTAMER(J)
(J)
IT L
(J)
~ CL L ~ U 200
~~------~A----~____A_____________6 o
400
00
00 20 40 60 80 100
TIME H FIG 412 LIQUID CBMPBSITIBN (MRSSJ VS TIME (HJ
RT 40 RTM SG
85
1000 Il=TEMPERATURE AFTER ~=TEMPERATURE AFTER A=TEMPERATURE AFTER +=TENPERATURE AFTER
11 H ~N STREAM 35 H ~N STREAM 60 H BN STREAM 93 H eN STREAM
U 900
W 0 800 =)
I shyCI 0 700 W (L
L W I- 600
500
PBSITIBN Z FIG 413 BED TEMPERATURE PRBFILE (tC) VS
PBSITIBN (Z) SET PBINT 80C SG-1
00 10 20 30 40 50 60 70 80 90 100
1000
U 900
Il=TEMPERATURE FLUCTUATleNS AT Z=4 ~=TEMPERATURE FLUCTUATUINS AT Z=6 A=TEMPERATURE FLUCTUATI~NS AT Z=8
W 0 800 =)
I shyCI 0 700 W (L
L W I shy 600
500
20 40 60 8000 100 TIME H
FIG 414 BED TEMPERATURE FLUCTURTIBNS (tC) VS TIME (H) SET PBINT 80C SG-l
86
run was controlled accurately enough to examine the effect of reaction
temperature
In Figure 415 the temperature profile through the bed is shown for 3
different times during a run at 210middotC During this run from positions 4
to 7 ie bullbull over 75 of the catalyst bed the temperature deviation
from the set point was less than SmiddotC at the times shown while the
temperature at position 8 was approximately 10degC below that of the rest
of the bed In Figure 416 the temperature variation with time at 3
different positions in the bed is shown Excluding the start-up period
the ampl itude of the temperature fluctuations with time at positions 4
and 6 was 3C while the amp] itude of the temperature fluctuations at
position 8 although approximately 10degC below the set point was 2middotC
Thus although a deviation from the set point existed at 2l0middotC the
profile did not change markedly with time on stream
441 Effect of temperature
The LPR for an HOD type catalyst with a nickel content of 15 wt~ is
shown In Figure 417 as a function of time on stream at 4 different
temperatures It Can be seen from this figure that at 80degC and 40 atm
ie bull when the system was In the I iquld phase the LPR was higher than
when the system moved into the vapour phase As the temperature was
raised from BOdegC to lSOdegC a 50~ decrease in LPR was observed while the
WHSV was lower by 18 Upon raising the temperature to 200degC a Further
drop In LPR of 10~ was recorded although the WHSV was higher by 14~ At
210degC the high WHSV used makes a meaningful4 comparis$on impossible
However from the recorded LPR it can be concluded that the activity of
the catalysts decreased further
Figure 418 shows I iquid composition as both a Function of time on
stream and temperature Increasing the temperature and moving into the
vapour phase caused a dramatic drop in the dimer yield and an Increase
in trimer yield IncreaSing the temperature still further resulte~ In
the dimer recovering until at 210middotC dimers and trimers were formed in
equal Quantities
As at higher temperatures ie bull above IS0degC at 40 atm Bil iea aluml~a
exhibits catalytiC properties the relationship between its activit and
temperature was also examined In Figure 419 the LPR as a function of
time on stream IS plotted For SA at 3 different temperatures R~ducln9
the temperature Fr~m 200C to lS0C resulted In the maximum activity
87
220
U 210 po
wa 200 =gt l-CC a 190 W a L W I- 180
170
~=TEMPERATURE AFTER 14 H aN STREAM ~=TEMPERATURE AFTER 37 H aN STREAM amp=TEMPERATURE AFTER 61 H aN STREAM
00 10 20 30 40 50 60 70 80 90 100 PBSITIBN Z
FIG 415 BED TEMPERATURE PROFILE (C) VS POSITION (ZJ SET POINT 210C HDD-9
230
U 220 po
wa 210 =gt l-CC 0 200 W a L w I- 190
~=TEMPERATURE FLUCTUATlaNS AT Z=4 ~=TEMPERATURE FLUCTUATUINS AT Z=6 amp=TEMPERATURE FLUCTUATlaNS AT Z=8
180
20 40 60 60
TIME H FIG 416 BED TEMPERATURE FLUCTUAT IONS ( C)
VS TIME (HJ SET POINT 210C HDD-9
00
88
600
CJ 500
400CJ
bull bull 300
0
bull 0- 200
--J 1 00
000
ceDE []=HDD-2 ()=HDD-8 amp=HDD-6 +=HDD-9
N (lH) 1 5 1 5 1 5 1 6
TR( middotC) P(ATM) I1HSV 80 40 53 150 40 43 200 40 49 210 40 66
00 20 40 60 80 100 120 TIME H
FIG 417 EFFECT BF TEMPERRTURE (Cl BN LIQUID PRBOUCTIBN RRTE (GHGl HOD
600
~ (f) (f)
a ~
400 bull
(f)
~ 0shy~ ~ U 200
bull
[]=D IMER 1()=TRIMER 4 H eN STREAM amp=TETRAMER +=PENTAMER X=DI MER 10=TRIMER 8 H eN STRERM i=TETRAMER j =PENTAMER
_----~=i
00
600 900 1200 1S00 1800 2100 2400 TEMPERRTURE C
FIG 418 EFFECT BF TEMPERRTURE (Cl BN LIQUID CBMPBSITIBN (MRSS) HOD
600
89
C) 500
- r - 400 C)
bull 300 ~
Q 2 )0
bull
---l 1 00
000
TR ( bull C) P(ATH) HHSV BO 40 40 150 40 62 200 40 35
ceOE fI =SA-l ()=SA-2 ~=SA-3
N[(HTZl 00 00 00
~e
tI eJ
e e e)
00 20 40 60 80 100 120 TIME H
FIG 4 bull 19 EFFECT BF TEMPERATURE ( bull C ) BN LIQUIDPRBOUCTIBN RATE ( GHG) SA
600
0 (f) (f)
a I
400 (f)
~ Q I ~ U 200
C2I 1--1
---l
00
fI=O IMER )()=TRIHER 4 H aN STREAM ~=TETRAMER +=PENTRMER
+ +
600 900 1200 1500 1800 2100 2400 TEMPERRTURE bull C
FIG 420 EFFECT I3F TEMPERATURE ( C) BN L I QU I 0 CI3MPI3SITII3N (MASS) SA
90
falling by approximately 72X while the WHSV increased by 5S~ At aoc the catalyst was inert At 200C the preferential product of sil ica
alumina was propene trimer which can be seen in Figure 420 where
1 iQuid composition is plotted against temperature Decreasing the
temperature to lSOC caused the trimer yield to increase at the expense
of the dimer Decreasing the temperature further resulted in the
catalyst becoming inert and so no 1 iQuid data was available
45 Lifetime and selectivity
The 1 ifetimes of HOD IMP SG and SA type catalyst were examined as well
as their selectivity in long runs In Figure 421 the LPR and WHSV as a
function of time are plotted for an HOD type catalyst with a nickel
content of 15 wt From this it can be seen that the LPR fluctuated
with time due to WHSV fluctuations Upon comparing points with eQual
WHSV it was found that the conversion had dropped by 12 after 100 h on
stream The selectivity with time on stream is shown in Figure 422
Selectivity chansed sl ightly during the run ie bull the Quantity of dimer
formed increased by 25~ after 120 h at the expense of the tetramer and
pentamer
In Figure 423 the LPR as a function of time is plotted for an IMP type
catalyst with a nickel content of 19 wt After a h on stream the
activity of the catalyst dropped by 24 of its initial value The
selectivity shown in Figure 424 remained approximately constant with
the dimer yield increasing sl ightly at the expense of the tetramer and
pentamer over the period of the run
In Figure 425 the LPR as a function of time is plotted for an SG type
catalyst with a nickel content of 15 wtx After 10 h on stream the
catalyst showed no signs of deactivation The sel~ctivlty shown as a
function of time in Figure 426 also showed no changes over this
period ConseQuentely from the available data no conclusive statement
with respect to the 1 ifetime of this catalyst could be made
The 1 ifetime of a SA type catalysts was examined at a temperature of
200C and the LPR as a function of time is shown in Figure 427 Upon
comparing points with eQual WHSV it was found that the ConverSion had
dropped by 24 over a period of 75 h As shown in Figure 428 10
significant change occurred in the selectivity over the perlo~ of this
run
91
700
6(10 o I 500
o 400
bull a 3 00
bull 0
200
1 00
000
CODE NI(WT~) TR(C) P(ATM) HDD-3 15 80 40
~=HEIGHT HeURLY SPACE VELeCITY ~=LIQUIO PReOUCTleN RATE
WHSV 52 700
600
600
400
0
I 0
300
200
gt (j)
I 3
100
000
00 200 400 600 800 1000 1200
TIME H FIG 421 LIQUID PReDUCTIeN RRTE (GHGJ RND WEIGHT
HeURLY SPRCE VELeCITY (GHGJ VS TIME (H)FeR HDD-3
800
~ (j) (j)
IT L
600
bull
(fJ
~
0 L
400
~ U
bull 200
o
~O IMER ~=TR IMER amp=TETRAMER +=PENTAMER
+
FIG 422 LIQUID ceMPeSITIeN (MRSS) VS TIME (H) FeR HDD-3
92
700
600 CJ
r 500
CJ 400
bull 0 300
bull 0
200
t 00
000
CODE NI(WT~) TR(JC) P(ATM) WHSV IMP-2 19 80 40 53
m=HEIGHT HeURLY SPACE VELeCITY ~=LIQUIO PReOUCTleN RATE
er----El---f9----et-_-poundJ
700
600
600 CJ
r 400 shy
CJ
300 gt
(J)
r 200 ~
t 00
000
00 20 40 60 60 100 120
TIME H FIG 423 LIQUID PRBDUCTIBN RRTE (GHG) RND WEIGHT
HBURLY SPRCE VELBCITY (GHGJ VS TIME (H)FBR IMP-2
CL
93
700
600 cJ shyc 500 shycJ
400 0 300
200
I 00
000
CODE SG-1
NI(Wn) 15
TR(C) eo
P(ATM) 40
WHSV 52 100
rn=WEIGHT HeURLY SPACE VELaCITY ~=LIQUID PReOUCTlaN RATE 600
-eJ 500
400
cJ shyc shycJ
300
200
gt U)
c 3
100
000
00 20 40 60 80 100
TIME H FIG 425 LIQUID PRSDUCTIBN RATE (GHGl AND WEIGHT
HBURLY SPACE VELSCITY (GHGJ VS TIME (HlFeR SG-1
600
~ U) U)
a L
400 bull
U)
~ CL L ~ U 200
bull
rn=D 1MER ~TRIMER
41 =TETRAMER +=PENTANER
amp~----------A------______A__________________~bull
+
Oor ~-~I~------~I--------~I-------+I-------+I-------+I~
00 20 40 60 80 100
TIME H FIG 426 LIQUID CBMPSSITIBN
FeR SG-1 (MASS) VS TIME (H)
94
600 CODE NIIWTX) TRIC) PIATN) WHSV SA-3 200 40 35
m=WEIGHT HeURLY SPACE VELeCITYo 600 ~=LIQUIO PReOUCT6N RATE shyI - 4 00o
bull 300
et
bull CL 200
~ 100
000
00 20 40 60 60 100 120 14 0
TIME H FIG 427 LIQUID PRBDUCTIBN RATE (GHGl AND WEIGHT
HBURLY SPACE VELBCITY (GHGJ VS TIME (HJFBR SA-3
600
500
0 400 shy
I shy0
300 gt (f)
200 I s
1 00
000
600
~ (j)
(j)
IT L
400 (j)
o CL L o U 200
o
m01MER ~TR IMER 6=TETRAMER +PENTAMER
___-tl----------~I-----------r--~V I I
E9 m(9 E9 u El
i I I00 20 40 60 80 100
TIME H FIG 428 LIQUID CBMPBSITIBN (MRSS) VS TIME (H)
FBR SR-3
00
95
46 Effect of WHSV
The effect of the WHSV on the LPR and selectivity was examined In
Fi~ure 429 the LPR of an HOD type catalyst with a nickel content
ranging from 113 to 117 wt~ is shown at four different WHSV Figure
429 shows that increasing the WHSV increased the LPR and the rate of
deactivation
In Fi~ure 430 the selectivity as a function of both time and WHSV is
shown This figure demonstrates how increasing the WHSV and consequently
decreasing the conversion resulted in a higher dimer content of the
liquid product at the expense of the tetramer and the pentamer The
quantity of trimer was not affected by changing WHSV in the range
examined
47 Effect of temperature runaway
The effect of operating the catalyst at 80C was examined after
operating it at 200middotC The aim of this experiment was to establ ish
whether the activity or selectivity of the catalyst when rerun at 80C
was affected in any way by operating it first at a temperature higher
than 80middotC Between the two runs the catalyst was calcined in the normal
manner
In Figure 431 the LPR of an HOD type catalyst with a nickel content of
15 wtX at 200C is shown as a function of time on stream After 11 h
the run was stopped and the catalyst calcined in the -normal manner and
rerun at SOmiddotC The LPR as a function of time at aodegc IS shown In Figure
431 together with the data obtained using a fresh catalyst at SOmiddotC It
can be seen from this figure that usin~ the catalyst first at ZOOC did
affect the activity and from Figure 432 the selectiVIty causing a drop
in LPR of 17X at steady state and a shift to 1 ighter products at the
expence of the tetramer when the catalyst was re-used at 80middotC
4S Effect of water contamination
The aim of thIS experiment was to establ ish the effect of water on the
activity and selectivity of an HOD type catalyst with a nickel content
of 15 wtX (HOD-4) and to determine whether the catalyst could be
regenerated to its normal activity and selectiVity For this ~urDose the
feed containing 112 ppm (vv) water was not dried bef0re ent~rln9 the
bed and the activity with time was recorded ~nder normal running
CL
96
caOE N I (1HZ J TR ( middotc I P(ATNI HHSV1000 (l =HOO-I 2 I I 7 80 40 49 ()=HOO-13 II 3 80 40 54 t =HDD-14 It3 80 40 108 +=HOO-tS 1t 3 80 40 I I 6
cJ 800
I
cJ 600
a 400
bull 200-J
000
00 20 40 60 80 100
TIME H FIG 429 EFFECT BF WHSV (GHG) BN LIQUID
PRBDUCTIBN RRTE (GHG) HOD
800
~ (j) (j)
a 600 L
(j)
~ 400 CL L ~ U
bull 200 C3
00
(l=D I MER )()=TRIMER 4 H eN STREAM t=TETRAMER +=PENTRNER
X=OINER Ie=TRIMER 8 H aN STRERM TETRRMER ===----shyX=PENTANER
~~e-------------------~i~~
20 40 60 80 100 120 t 40WHSV GHG
FIG 430 EFFECT BF WHSV (GHG) BN LIQUIDCBMPBSITIBN (MRSS) HOD
140
97
600
o 500
bull 300
0
bull CL 200
-1 1 00
000
ceDE N I ( loin) TR( C J PlATH) WHSV Il =HDD-6 15 200 40 49 ()=HDO-7 15 60 40 54 AHDD-2 15 60 40 53
00 20 40 60 60 100 120 14 0
TIME H FIG 431 EFFECT BF TEMPERATURE RUNAWAY BN LIQUID
PRBDUCTIBN RATE (GHGl HDD-6 AND HDD-7 CBNSECUTIVE RUNS USING SAME CATALYST
700
~ (f) 600 (f)
IT L 500
bull
(f) 400
cJ CL L 300
cJ U
200
bull CI 100 -1
00
Z=D 1HERIiOIMER 1 XOIMER 1 ()TRIMER HOO-6 ~=TRINER HDD-7 Y=TR I MER HDD-2 ATETRRNER +=TETRRHER )(TETRRHER
+=PENTRNER ~=PENTRNER If =PENTRHER 1 Z~
~ eEl egt
Gshy
E9 fl
)lt~~ V ~
t shy amp
)IE ~ )(
+~ of f -+ J~ R
20 40 60 80 100 12000
TIME H FIG 432 EFFECT BF TEMPERATURE RUNRWRY BN LIQUID
CBMPBSITIBN (MASS)
98
conditions It can be seen from Figure 433 how rapidly the catalyst
deactivated becoming totally inert In 4 h The selectivity as shown in
Figure 434 was also affected with the dimer rapidly becoming the main
product
Upon regenerating and operating the catalyst in the normal manner (HOOshy
5) the catalyst showed an initial LPR higher than in HDD-l due to a
high WHSV which rapidly dropped to that of a catalyst in a dry run For
comparison the LPR vs time relation for a dry run using a fresh catalyst
is also shown in Figure 433 (HOD-l) With regard to selectivity no
difference was observed for the regenerated or normal catalyst as shown
in Figure 434
In this experiment the -69C fraction (dimer) from previous runs was fed
through the reactor at 40 atm and 30C Once the catalyst had
deactivated the temperature was raised to 200C and the run continued
The catalyst used was a HOD type catalyst with a nickel content of 15
wt~ The feed composition was 994 wt~ Cb and 06 wt~ Cl
To monitor the activity of the catalyst throughout the run the LPR was
calculated using
LPR = (mass Cn-b in - mass of Cn-b out) ltI) (time)(mass of catalyst)
while the Conversion was calculated using
Mass~ Cn_b converted =[mass Cn- in - mass ou t ) 1bull 100 ltII)Cn
mass Cnab In
It can be seen from Figure 435 that at aoc the catalyst rapidly lost
its activity This also became apparent from the changes in the 1 iquid
composition with time on stream as shown in Figure 436 Upon raising
the temperature to 200C the catalyst regained activity the conversion
beIng 64~ after 27 h on stream The composition of the 1 iQuid product
also changed markedly the most abundant specIes in the product being a
Cb dimer (CI2) with trace Quantities of Cl and trimer (CIS)
410 Liquid and gas feed (C + C3)
In this case dimer (C ) and monomer (el) were fed simultaneously to the
reactor The ratio of Cb to C3 was held at 11 9 C9 Cl throughout Two
runs using the same catalyst were carried out one at 80C and one at
I
99
600 CeDE NJOHI) TR( middotC) PlATH) HHSV FEED Il=HDD-4 15 80 40 51 HET ~=HOO-5 15 80 40 47 DRY AHOD-I 15 80 40 42 DRY
CJ 500
shy
shy 4 00 CJ
bull 300
0
bull (L 200
1 00
000
00 20 40 60 80 10middot0
TIME H FIG 433 EFFECT BF WRTER BN LIQUID PRBDUCTIBN RRTE
(GHGJ HDD-5 REGENERRTIBN RFTER HDD-4
800
~ (J) (J)
(I 600
(J)
~ 400 (L
L ~ U
bull 200
o
[]=o 1MER 1 ~=TR I MER HOO-4 1 TETRAMER +=PENTAMER
X=OIMER ]~=TRIMER HOO-S +=TETRAMER X=PENTAMER
Zo I MER 1 Y=TRIMER HOO-l )( = TETRAMER =PENTAMER
~ eiICJ)
P=~ if --- I~
Igt(
~
~~ j
)(
00 20 40 60 80 100
TIME H FIG 434 EFFECT SF WRTER CBNTRMINRTIeN eN
LIQUID CBMPeSITIBN (GRHGR1 HOD
00
100
CODE NI (Wa) TR ( C ) P(ATM) WHSV 800600 HDD-18 15 801200 40 55
l =CaNVERS 1aN ~ ~LtQUtO PRaOucTtaN RATE (j)D
(j) r 600 600 a
200degC
L D
bull Z 400 a
bull 400
0 (j)
a CL
bull w gt200bull 200 Z
--J a
000shy
u
00
00 20 40 60 60 100
TIME H FIG 435 LIQUID PRBDUCTIBN RRTE (GHG) RND
CBNVERSIBN (MRSS) VS TIME (H) LIQUIDlaquo69C FRRCTIBNl FEED HDD-18
1000
~ (f)
(f) 600 IT L
bull 600
(f)
a CL L 400 a u
C3 200
l =0 t MER ~=TR t MER TETRAMER +=PENTAMER X=HEXRMER
20 40 60 6000 100
TIME H FIG 436 LIQUID CBMPBSITIBN (MRSS) VS TIME (H)
LIQUID laquo69C FRRCTIBNJ FEED HOD-IS
101
200middotC The catalyst a~ain an HOD type catalyst with a nickel content of
15 wt~ was activated in the normal manner between the runs
To monitor the monomer utilization throu~hout the run the equations
shown above for LPR and conversion with n=3 were used ie a propene
balance was done assumin~ no mass loss The results are shown in Fi~ure
437 for the run at BOdegC and in Fi~ure 439 for the run at 200degC
Figure 438 shows that at eoc the activity rapidly declined as the
composition of the 1 iQuid product rapidly approached that of the Co
feed At 200middotC however as shown in Figure 440 the 1 iQuid composition
was steady and contained about 40 wtY dimer after 8 h on stream
411 TGOTA
In Figure 441 the TO and OTA Curves for a fresh HOD type catalyst with
a nickel content of 117 wt~ are shown The catalyst was held under
flowin~ nitrogen throughout
Up to SOOC an exothermic peak probably indicating the removal of
chemisorbed water was recorded At approxlmately 530C the Curve
became endothermic probably due to the decomposition of the Ni-Urea
complex to form NiO
From the TO Curve It can be seen that the intermediate species formed
were not stable until the final endothermiC event at 530middotC Beyond this
temperature the TO Curve levelled out indicating that a stable species
was formed The overall mass loss from the catalyst was 14 wtY
To determine the quantity of water that the catalyst adsorbs a
oreviously calCined catalyst was exposed to air and the TG and OTA
curves were subsequently recorded The results of this run using the
same catalyst as before are shown in Figure 442 This figure shows a
broad exothermic peak up to 600degC and an overall mass loss of 367 wtX
To establ ish the quantity of hydrocarbons adsorbed on the catalyst the
TG and OTA curves were recorded for a catalyst after it had been used
for the 01 igomerisation of propene The catalyst ysed was an HO~ type
catalyst with a nickel content of 117 wtX The catalyst was exposed to
flowing air while recording the TG and OTA Curves The r~sults are shown
In Fi9ure 443
102
00 20 60 TIME H
FIG 437 LIQUID PRODUCTION RATE (GHGJ AND CONVERSION (MASS) FOR PROPENE VS TIME (H) LIQUID laquo69C FRACTION)AND GAS FEED HDD-19
600
bull 300
a
bull 0 200
bull J 1 00
000
CODE NI(Wn) TR(C) P(ATM) WHSV HDD-19 15 80 40 88
~=PRePENE ceNVERSlaN ~=LIQUIO PR60UCTIeN RATE
600
~ 600 (j)
(j)
IT 400
Z
300 ~
(j)
a 200 w
gt z ~ 100 u
00
1000
~ (j)
(j) 800 a
600bull
(j)
~ 0 400 8 U
bull Cl 200 -J
00
~OIMER ~TR IMER l =TETRRMER +=PENTRMER
00 20 40 60 TIME H
FIG 438 LIQUID CGMPOSITION (MASS) OF ENTIRE LIQUID EFFLUENT VS TIME (H) LIQUIDlaquo69C FRACTION) AND GAS FEED HDD-19
103
bull 200 -1
gt200 Z
o U
CODE NI(WTX) TR(C) P(ATMl WHSV 800800 HDD-20 15 200 40 77
m=PRBPENE CBNVERSIBN RATE~=LIQUIO PRBOUCTIBN
~ o (f)
(f)- 600 600 I IT - L o
Z 400 0bull 400
a (f)
bull a 0 w
000 00
00 20 40 60 80 100
TIME H FIG 439 LIQUID PRBDUCTIBN RATE (GHGl AND
CBNVERSIBN (MASS) FBR PRBPENE VS TIME (H) LIQUID laquo69C FRACTIBN)RND GAS FEED HDD-20
II=OIMER600 ~=TR I MER to =TETRAMER +=PENTANER X=HEXANER ltgt=HEPTAttER
bull
(f)
o 0 L o
400
U 200
-00
00 20 40 60 80 100
TIME H FIG 440 LIQUID CBMPBSITIBN (MASS) BF ENTIRE
LIQUIO EFFLUENT VS TIME (H) LIQUIDlaquo69C FRACTIBN) RND GRS FEED HDD-20
104
u
-w u z ~ W 0 -(j)W
(j)U U 0 I 0
(j) (j)w
0 4 =gt x IshyltC 0 w Q x W Ishy
200 400 600 800
TEMPERATURE C
FIG 441 MASS lOSS (~) AND TEMPERATURE DIFFERENCE (OC) VS
FURNACE TEMPERATURE (OC) FOR A FRESH CATALYST 20 m~ sample
10
5
0
-5
-10
-15
CODE NI(WTX) GAS HDD-O 11 3 N2
~
o
10 u
-w u z 5 w
~0 w u (j) shyu (j)
0 -0 0I W (j)0 (j)=gt 4Ishy J4 0 w Q J
-5 W Ishy
-10~ CODE
-15cNIltWn) GAS
113 Nz
I r I I
0 200 400 600 BOO TEMPERATURE C
FIG 442 MASS LOSS (X) AND TEMPERATURE DIFFERENCE (ac) Vs FURNACE TEMPERATURE (OC) FOR A CALCINED tATALYST
WHICH HAS BEEN EXPOSED TO AIR 19 m~ sample
105
The OTA curve was exothermic below 400middotC probably as a result or
combustion of the adsorbed hydrocarbons No other thermal events
occurred The TG curve showed that the overall mass loss was 96 wt~
To establish the eftect Ot synthesis techni~ue the TG and OTA curves Ot
a SG IMP and HOD type catalyst were recorded under tlowing air In each
case the catalyst had been used for the 01 Igomerlsation Ot propene
In Figure 444 the TG and OTA data for an IMP type catalyst with a
nickel content of 083 wt~ are shown There were an exothermic peak at
340degC and a shoulder at approximately 400C probably due to the
combustion of the adsorbed hydrocarbons The TG curve also shown in
Figure 444 shows that the overall mass loss was 173 wt~
In Figure 445 the TG and OTA curves for an HOD type catalyst with a
nickel content ot 15 wt are shown The OTA curve showed a broad
exothermiC peak between 300 and 400 o e The overall mass loss was 12 wt
In Figure 446 the TG and OTA data for an SG type catalyst with a nickel
content of 151 wt are shown The OTA curve showed that an exothermic
peak in the vicinity Ot 300degC The TG curve showed a continual mass
loss up to 600degC the overall mass loss being 244 wtY-
412 NMR
The 1H MNR spectra recorded were those of the bulk I i~uid collected
throughout a run For each type of catalyst the spectrum determined was
that of the I i~uid collected at the reaction conditions deemed optimum
viz bull aoc and 40 atm over a catalyst with a nickel content of 15 wt
The results obtained are shown In Table 42 and Table 43 while the
spectra are shown in Figures 447 448 and 449
106
10 u
UJ
I u 5 z UJ a
~
UJ (f)U (f)u 0
~
0 I
0 J
(f)UJ (f) gt~ middot1a 4 I~
l- x 4 a UJ 0-
-5 x UJ Ishy
-10
CODE NI(WT~) TR ( C) P(ATM) WHSV GAS HDD-13 113 80 40 54 AIR
-15 I
0 200 400 600 800
TEMPERATURE degC
FIG 443 MASS LOSS (~) AND TEMPERATURE DIFFERENCE (GC) VS
FURNACE TEMPERATURE (OC) FOR A USED CATALYST
HDD-13 185 mg sample
15
10
5 u
UJ 0 U Z UJ a
~
UJ -5-(f)U (f)U 0
0 J -10 (f)UJ (f)a
~ 4 l- x -15 4 a UJ 0- -20x UJ Ishy
CODE NI(Wn) TR ( C) P(ATM) WHSV GAS -25 IMP-1 08 80 40 42 AIR
-30 0 200 400 600 BOO
TEMPERATURE e
FIG 444 MASS LOSS (X) AND TEMPERATURE DIFFERENCE (OCl VS
FURNACE TEMPERATURE (OCl FOR A USED CATALYST
IMP-l 18 mg sample
107
15
10
5 u
~
UJ 0 U Z UJ ~ IX UJ -5R
U () U () 0- 0 a J -10 UJ () IX ()
gt lt l- I -15 lt IX UJ ~ I -20 UJ I shy
CODE NI (Wn) TR(C) P(ATM) WHSV GAS -25 HDD-l 15 80 40 42 AIR
-30 600 BOO0 200 400
TEMPERATURE c
FIG 445 MASS LOSS (X) AND TEMPERATURE DIFFERENCE (OC) VS
FURNACE TEMPERATURE (OC) FOR A USED CATALYST
HDD-l 17 mg sample
to)
~
UJ 0 to)
Z ~UJ
IX UJ -5R
()U ()U 0
a J -10 ()UJ ()IX
gt lt l- I -15 lt IX UJ ~ I -20 IJJ I shy
CODE NI(WTX TR(C) P(ATM) WHSV GAS SG-3 30 80 40 37 AIR
-30 I I I 0 200 400 600 BOO
TEMPERATURE C
FIG 446 MASS LOSS (X AND TEMPERATURE DIFFERENCE 1degC) VS
FURNACE TEMPERATURE (OC) FOR A USED CATALYST SG-3
17 mg sample
-25
108
c
-I 0 J gt-lt
Z ) 0
J 0 0 U
I shyU ) Cl 0 0 0
0 gt-lt ) 0 gt-lt J
U 0
ltt 0 I shyU W 0 ()
0 J Z
Cl J
co
M
I
I l--r
JiI I
I LLf)
t
r-shyq q
0 gt-lt u
T~
------H
G
F
E
o Q
o
FIG 448 IH NMR SPECTRA OF LIQUID PRODUCT FROM RUN SO-3
BA L
M
---L
1-shy
5 4 3 2 1 o 6
c
110
LL o o
-I C C x z )
cx I 0 cx LL
I-U ) C 0 a a c -) C -J
u 0
ltr cx I-U UJ a (J
a I Z
x
0-lt1
U1
lt1
lt) shyu
111
Table 42 Integrated areas
Run code Area code
A B C o E F G H L M N
IMP-l 00 10 120 320 205 145 250 195 10 125 00
SG-3 20 30 190 430 305 220 365 225 15 158 00
HDD-l 75 50 230 490 332 235 355 222 20 220 00
Table 43 Carbon areas and branching
Code CH CHJ CH
IMP-l 258 275 210 094 123 076
SG-3 350 253 295 079 123 067
HDD-l 372 517 309 072 120 060
112
5 DISCUSSION
The effect of the synthesis procedure on metal distribution and
dispersion in nickel silica catalysts was examined in detail by amongst
others Hermans and Geus (1979) Blackmond and Ko (1984) Montes et al
(1984) and in a more general sense by Maatman and Prater (1957)
The conclusions reached by these workers as to how the synthesis
procedure effects the metal distribytion and dispersion and hence
catalytic activity has been discussed in Section 13 and are briefly
summarised below Using their Conclysions an attempt was then made to
explain the activity of an HOD type n i eke 1 oxide s i 1 i ca alumina
catalyst
Impregnation as discussed in Section 132 and 362 involves the the
homogeneous increase in concentration of the nickel precursor by the
evaporation of the solvent In terms of preCipitation theory as
discussed in Section 13 the homogeneous increase in the concentration
of the metal salt results in the formation of a 1 imited number of large
nuclei which are evenly distributed over the support The reason for
this is that providing the concentration of the solution is kept
homogeneoys the rate of increase in concentration is equal to the rate
of Crystal growth Consequently the concentration of the solution Will
remain between that of the solubil ity and supersolubil ity curves where
no new nuclei can develop This has been disc~ssed in Section 1331
Th is was in fact foun d to be t he case by Montes et a 1 (1984) ljho in the
case of an inpregnated Ni silica catalyst recorded an average nickel
particle diameter of 52 nm They further suggested that only a weak
interaction exists between the metal preCursor and the support If this
were so then upon calcination the crystal size should increase (Section
1324) and the metal should be present in a form 31milar to that of
the bulk oxide They in fact found this to be so ie bull the average
nickel particle size inCreased to 45 nm after calcination for 16 h at
450degC in dry air The fact that the metal was present in a form similar
to that of the bulk oxide In calcined Impregnated nickel silica
catalysts had been established earlier by Houalla and Delmon (198ll
In the case of impregnated nickel sl1ic3 alumina catalysts no data was
available indicating the degree of interacton between the support and
the metal It is however assumed that in the case of this ta+almiddotst
the interaction between the support and the metal pr~Cursor are also
113
weak and that a similar redistribution and corresponding increase in
crystal size occurs during calcination It is also suggested that the
metal is present in a form similar to that of the bulk oxide
It is well known that for optimum catalyst activity a large specific
surface area and hence a finely divided sol id is required (Hermans and
Geus 1979) Small crystallites ensure high specific metal areas but
increasing nickel concentration results in agglomeration In the case of
impregnation the drying and calcination procedures result in the
formation of a heterogeneity of crystal sizes when the nickel content is
greater than about 5 wt~ Increaslng the nickel content beyond 5 wt~
results in broad and even binodal crystal size dispersion which not only
affects the activity due to loss of surface area but also the thermal
stability ie bullbull resistance to sintering (Richardson and Dubus 1978) It
is proposed that this fact accounts for the observed loss in propene
01 igomerisation activity recorded by Hogan et al (1955) and Holm et al
(1957) over impregnated nickel oxide sil ica alumina catalysts when the
nickel content was raised beyond 5 wt~ Thls proposal was further
supported by Dorl ing et al (1971) who predicted that when increasing the
nickel content below 5 wt~ the number of crystall ites would increase but
that the mean crystal size would remain approximately constant Beyond 5
wt~ nickel on the other hand they predicted that the number of
crystall ites would remain constant as the nickel content was increased
but that the crystall des woul d increase in size This has been
discussed in detail in Section 1323
From the above discussion it can thus be concluded that the activity of
impregnated catalysts is only a function of the the extent of metal
distribution and dispersion which in turn is a function of the metal
content
It would thus be desirable to produce a catalyst in which the crystals
generated during synthesis are held by the support and thus are
prevented from migrating and agglomerating during subsequent heat
treatments One such method is co-precipitation In the case of this
synthesis procedure as discussed in detail in Section 134 and 364
a reaction oCcurs between the support and the metal ie the meta] is
held by the support and the crystals are uniformly distibuted
throughout the matrix This type of catalyst was found to be much more
active for the 01 igomerisation of propene than impregnated cata list s
According to Holm et al (1957) th is is due to the hish extent of
distribution and dispersion of the nickel Ions present in thiS catalyst
However the same 1 imitations of nickel content on the activity were
114
observed ie the catalysts with a nickel content between 3 and 5 wt
were the most active (Holm et al 1957) In the case of SG type catalyst
this cannot be explained in terms of loss of dispersion with increasing
nickel content as it has been shown by Holm et al (1957) that the
crystal size remained unchanged as the nickel content was raised from 3
to 20 wt~ The reason that the activity did not increase as the nickel
content was raised beyond 5 wt may either be due to the inaccessibility
of the reactant molecules to the nickel or due to the nickel being in
an unsuitable form ie Nio as opposed to Ni+ 2 (NiO) after
calCination The latter was supported by the fact that the nickel was
diffiCult to reduce ie bullbull a reduction of only 50 was achieved after 2
h on stream at 500degC by Holm et a1 1957gt
It is thus proposed that although crystal dispersion remained unchanged
in co-precipitated nickel silica alumina catalysts up to a nickel
content of 20 wt the location and form of the crystals prevent total
utilisation of the available metal
Since most unsupported catalytically active materials sinter rapidly at
the conditions of calCination andor reaction (Hermans and Geus 1979)
the active compound has to be attached to a highly porous thermostable
support such as s11 ica or silica alumina This support which is often
not catalytically active itself increases the dispersion of the
catalytically active material Also the support is used most effectively
when the active material is distributed densely and uniformly over it
and is firmly held by the support A rapid transportation of the
reactants and products through the porous catalysts is also a
prerequisite for an active solid catalyst Sil ica alumina is such a
support but the available method of loading rlicke1 onto it viz bull
impregnation does not lead to an adequate degree of interaction between
the support and the metal An alternative method of loading ~lckel onto
sil ica alumina is thus required in which a uniform dispersion and
distribution could be ensured together with a strong interaction between
the support and the metal
In the case of nickel sir ica catalysts such a method was developed by
van Dillen (1976) and was termed homogeneous decompOSition deposition
(HOD) In this method as discussed In detail in SectIon 133 and
Section 363 the high degree of penetration or the solute into the
support during impregnation was combined with a controlled Ion exchanse
type preCipitation
115
In the case of nickel silica catalysts prepared by HOD measurements of
particle size distribution indicate a range of between 1 and 3 nm for
loadings of up to 30 wt~ nickel (Richardson and Dubus 1978) Furthermore
a strong interaction exists between the support and the metal and
conseQuently this type of catalyst was extremely resistant to sintering
Thus in the case of an HOD nickel sil ica catalyst with a nickel content
of 83 lilt Montes et al (1984) showed that after calcination in dry air
at 450degC for 16 h the averase diameter of the nickel particles decreased
from 51 to 46 nm In the case of an impregnated nickel sil ica
catalysts with the same nickel content the average nickel particle size
after calcination at the same conditions was 45 nm From this it may be
concluded that in the case of HOD nickel si 1ica catalysts the metal is
not present in the bulk oxide form This was in fact confirmed by Montes
et al (1984) usins X-ray diffraction The exact nature of the form of
the metal on the surface is not known Also the crystall ites in HOD
nickel si1 ica were readily accessible This was inferred from the
results of Blackmond and Ko (1984) who recorded 100~ reduction after 4 h
on stream at 500degC
From the discussion presented above it can be seen that the method of
homogeneous decomposition deposition produces a nickel sil ica catalyst
where the nickel is distributed densely and uniformly over the support
and that a strong interaction betweenthe support and the metal exists
In the case of nickel oxide si 1 ica alumina catalysts prepared by
homogeneous deComposition deposition no data was avai1ab1e in the
1 iterature either on the degree of dispersion or distribution or on the
support-catalyst interaction It is however thought that in view of the
results obtained from nickel si1 ica catalysts a high degree of
interaction occurs and that the crysta1l ites are uniformly and densely
distributed throughout the support
In this work the extent of metal distribution and dispersion on the
support phase and the nature of the support metal interact ion of nickel
oxide silica alumina catalysts prepared by homogeneous decomposition
depOSition were not investigated However the catalytic activity and
selectivity of this catalyst for the 01 igomerlsation of propene were
examined in detail and compared with the activity and selectivity of
nickel oxide si 1 ica alumina catalysts prepared by impregnation and coshy
preCipitation A discussion of each aspect of the work is now given
The reproduCibll ity study (Section 411 indicated that the experimental
results obtained in this study were reliable Once steady state
116
operation was reached both the selectivity and LPR showed 1ittle
variation between runs at similar reaction conditions
The reaction conditions used were unless otherwise stated (see iable
41) 80degC and 40 atm It can be seen from the phase diagram shown in
Appendix B that the reactants were in the 1 iQuid phase ConseQuently a
two phase system was studied When the temperature was raised above the
feed bybb1e point temperature of 86degC at 40 atm ie when the
reactants were in the vapour phase a three phase system was studied
The aim of this study was to compare the characteristics of a nickel
oxide si1 ica alumina catalyst synthesised via the HOD method adapted by
the author from the work done by van Dillen (1979) on nickel oxide
si1 ica catalysts with those of a catalyst prepared by the standard
impregnation techniQue (referred to as IMP) and co-precipitation
(referred to as SG) as discussed by Holm et al (1957gt
The effect of synthesis procedure on the propene ollgomerisation
properties of nickel oxide sil ica alumina was investigated by Holm et al
(1957) for an IMP type catalyst and a coprecipitated (SG) type catalyst
They found that the oligomerisation activity of SG type catalysts was
approximately 15 times that of IMP type catalysts HOD type catalysts
on the other hand had an activity similar to that of IMP type catalysts
but their performance was not as sensitive to the reaction conditions
and nickel content as IMP and SG type catalysts were With this in ~ind
a comprehensive study of the effect of reaction conditions using nickel
oxide sil ica alumina a catalysts prepared by homogeneous deComposition
deposiUon impregnaUon and to a 1 imited extent cODrecipltation were
carried out
Firstly the effect of the Quantity of nickel loaded onto the catalysts
was Investigated In the case of IMP type catahsts Hogan et al (1955)
had found that a nickel content between 3 and 5 wt gave the most
active catalyst Holm et al (1957j examinin9 the propene 01 igomerisaticn
actIvity of IMP as well as SG type catalysts found that irrespective of
syntheSis techniQue catalysts with a nickel content between 3 and 5 wt~
were the most active
In the case of IMP type catalysts examined in ~he present study no such
trend was observed IncreaSIng the nickel content from 22 wt to 63
wt~ at an average WHSV of 48 and 49 ghg respectiv~ly caused the LPR
to decrease by 42 Using on the other hand catal S With a nlck~l
content of 19 and 98 wtl at an avera~e WHSV of 53 and 52 9h~
117
respectively an increase of 5X In LPR was recorded In view of the
conf1 icting results obtained in this study and the differences In WHSV
from run to run no statement as to the effect of nickel content on the
activity of impregnated nickel oxide sil ica alumina catalysts could be
made
In the case of an HOD type catalyst increasing the nickel content did
not lead to a marked change in the LPR Differences in the WHSV and the
fact that the conversion was greater than 90 wtX in all the runs make a
comparison of the results diffiCult However comparing runs with
identical average WHSV viz bull 42 ghg showed that changing the nickel
content from 15 wtX to 72 wtX did not affect the LPR Similarly at a
WHSV of 49 and 50 ghg identical LPR were observed for catalysts with
nickel contents of 117 and 22 wtre
Thus although the study of the effect of the nickel content on the LPR
in the case of both IMP and HOD type catalysts is not unambiguously
conclusive the available data seems to indicate that the activity of an
HOD type catalyst was relatively independent of the nickel content and
that irrespective of nickel content HOD type catalysts were on average
20r more active than IMP type catalysts
It was observed while examining the effect of WHSV on the activity and
selectivity over HOD type catalysts that the selectivity was a function
of the Conversion ie bullbull a shift to 1 ighter products was recorded when
the conversion decreased Neither IMP type catalysts nor HDD type
catalysts exhibited a strong dependence of product composition on nickel
content In the case of IMP type catalysts the catalysts with 08 wt
nickel did show a greater selectivity towards trimers but the overall
trend observed was a gradual increase in dimer yield with increasing
nickel content at the expense of the trimer (Section 42) The small
Increase in dimer yield with increasing nickel content observed in this
work was in agreement with the data reported by Takahashi et al (1969)
who recorded the maximum dimer Yield for an impregnated nl~kel oXlde
sil ica alumina catalyst with a nickel content of 97 wt ~
The selectivity of HOD type catalyst was independent of the nickel
content when the nickel content was held between 1 3nd 7 wt~ At a
higher nickel content viz bull 11 wtX a decrease of 10 In dimer yield was
observed After careful examination of the data however it was found
that after 4 h on stream the WHSV for the catalysts with 22 and 17
wtY nickel were 53 and 49 respectively This 8 decrease in WHSV
between the runs may explain the observed decrease in Jimer yjel~
118
It may thus be concluded that the activity and selectivity of HDD type
catalysts were independent of the nickel content with in the range of
nickel loadings of 15 to 117 wtX In the case of IMP type catalysts
increasing the nickel content caused a shift to 1 ighter products with no
discernible effect on the activity
The effect of varying the pressure at a fixed temperature on the
activity and selectivity of an IMP type catalyst was investigated in
detail by Takahashi et al (1969) In the present work the effect of
varying the pressure at a fixed temperature of 80 c C for an IMP as well
as for HOD and SG type catalysts was investigated For an IMP type
catalyst the results obtained were similar to those of Takahashi et a1
(1969) Thus in the case of IMP type catalysts a drop in activity was
recorded when the pressure was lowered from 40 atm to 20 atm at a
constant temperature of 80 c C ie bullbull when the system moved into the
vapour phase In the case of an SG type catalyst it was found that the
catalyst was inert at 20 atm
In the case of a HOD type catalysts differences in WHSV and the fact
that the conversion was greater than 88 wtX in all runs make an
interpretation of the results difficult From the available data it can
however be seen that although the average WHSV increased from run to
run the LPR over HOD type catalysts remained constant as the pressure
was dropped from 50 atm to 20 atm From this it may be concluded that
the activity of HO~ type catalysts decreased as the pressure was
deCreased
In respect of the effect of pressure on product selectivity Takahashi
et al (1969) found that when the system moved into the vapour phase at a
constant temperature a shift to heavier products occurred Using an IMP
type catalyst this was also observed in this stJdy ie bull a dr0P or
in dimer yield mainly in favour of the trimer was observed when the
pressure was dropped from 40 atm to 20 atm In the case of HOD type
catalysts an opposite trend was observed viz bull decreasing the pressure
from 50 atm to 20 atm resulted in an almost 1 inear increase in dImer
i e 1 d
From the above discussion It can be seen that IMP type catalysts
contradict thermodynamics with regards to selectivity It was expected
from thermodynamics that as the pressure was decreased From 50 to 20 atm
the dimer yield should increase In the case of an HDD type eatalst
thiS was found to be the case Tn the case of IMP type catalysts
however an opposite trend was was observed Ie a ShiH to heavier
119
products as the pressure was decreased from 50 to 20 atm The observed
shift to heavier products with decreasing pressure may be explained if
it is assumed that at the lower pressures the heavier products are able
to evaporate off If this were so then in the case of HOD type catalysts
the yield of heavier products should also increase as the pressure was
decreased This was infact found to be the case although the increase in
trimer yield was very small In the case of both IMP and HOD type
catalysts the activity decreased as the pressure was decreased
To complete the study of the effect of reaction pressure and temperature
on the selectivity and activity the effect of varying the temperature
at a fixed pressure was investigated Since the above results for IMP
type catalysts were in agreement with those of Takahashi et al (1969)
and much information is available in the 1 iterature on IMP type
catalyst no further experimental work using IMP type catalysts was
done ConseQuently the results obtained from the 1 iterature were used to
compare IMP and HOD type catalysts
In the case of IMP type catalysts Takahashi et al (1969) foun d that
moving into the vapour phase ie when the temperature was raised
above approximately 90degC at a pressure of 50 atm a sl ight drop in
activity was observed Increasing the temperature beyond the bubble
point of the feed was accompanied by a shift to heavier products The
reason that the catalyst activity decl ined only sl ightly with increasing
temperature at 50 atm was that the sil ica alumina support becomes active
at the higher temperatures At 35 atm on the other hand crossing the
phase boundary results in a rapid decl ine in propene conversion with
increasing temperature The reason for this is that si 1 ica alumina is
only sl ightly active at 35 atm for the 01 igomerisation of propene
ltTakahashi et a11971gt The shiH in product spectrum ie a shiH
to heavier products can also be explained in terms of silica alumina
activity This is so because the preferential product of silica alumina
when the latter is used for the 01 igomerisation of propene is a propene
trimer (Feldblyum and Baranova 1971 Takahashi et a1 1971)
The nature of the products formed over si 1 ica alumina wheuron Jsed for the
01 igomerisation of propene and the effect of temperature on the activity
and selectivity were examined The results obtained were in agreement
with those of Takahashi et al (1972) liz silica alumina was actve
for the 01 igomerisatlon of propene as long as the system temperature
remained above 150degC Also the activity Jropped with decreasing reaction
temperature At 80degC Ie in the 1 iquid phase at 40 atm the catalyst
was inactive This was not in agreement with the results of Feldblyum
120
and Baranova (1971) who in a batch reactor recorded 6X conversion at
64degC and 50 atm The reason for the difference in the results was
properly due to the different pressures used ie bullbull 40 atm in this work
as opposed to their 50 atm and the di fferent process ie batch as
opposed to fixed bed reactor The product spectrum obtained agreed with
that foun d by other workers viz bull decreasing trimer yield With
increasing temperature and propene trimer being the main product
In the case of an HOD type catalyst increasing the temperature at a
fixed pressure resulted in the LPR dropping by approximately 50r when
the system moved into the vapour phase Increasing the temperature
further did not result in any marked changes in the LPR Thus although
the average WHSV increased from run to run the LPR remained
approximately constant as the temperature was increased From this fact
it may be concluded that the activity of the catalysts decreased as the
temperature was increased
The overall shift to heavier products when raising the temperature from
80degC to 150degC ie bullbull an increase in propene trimer at the expense of the
propene dlmer was expected in view of the catalytiC role of the sil ica
alumina support at the elevated temperatures The increase In dimer
yield as the temperature was raised further from 150degC to 210degC could be
explained in terms of the increasing WHSV and hence decreasing activity
of the catalyst (See Section 441)
From the different trends in product spectrum recorded when operating in
the vapour phase ie bullbull an increase in trimer yield with increasing
temperature when using nickel oxide sil ica alumina as opposed to a
decrease in trimer yield when uSing silica alumina observed in this work
it could be concluded that in supported nickel catalysts the ni~kel
still played a role at the elevated temperatures ThiS conclusion was
also supported by the results of Takahashi et al (1972) who found that a
physical mixture of sll iea alumina and nickel oxide had the same
activity as sil ica alumina alone thus indicatin9 the importance of
supporting the nickel Also the conversion over nickel oxide s11 ica
alumina was less senSitive to the reaction temperature then was the case
for silica alumina when the system was operated in the vapour phase at
40 atm Thus in the case of si 1 iea alumina a drQP in LR of 83~ was
recorded when the temperature was dropped by 50degC from ZODoC while in
the case of a HOD type catalyst3 an increase In LPR of 30 was recorded
when the temoerature was decreased over the same range
The 1 ifetimes of the catalysts were examined by the changes in the
activity over the first 10 h on stream In the case of an IMP type
catalyst data was avai lable in the 1 iterature on the 1 ifetime when this
type of catalyst was used for the 01 igomerisation of butene (Hogan et
al 1955 Allum 1974) The results obtained by these researchers was
that the activity of the catalyst did not change markedly after 100 h
and 21 days on stream respectively No data was however available on
the 1 ifetime of this catalyst when used for the 01 igomerisation of
propene
As using the changes in activity over the first 10 h on stream as an
indication of 1 ifetimes was very sensitive to WHSV fluctuations both
the changes in LPR and WHSV have to be recorded The average WHSV in
this run was 53 ghg In the case of an IMP type catalysts the LPR
dropped by 175X after 5 h on stream during which time the WHSV dropped
by 1X In view of the fairly constant WHSV and the large drop in LPR it
may be assumed that IMP type catalysts deactivate rapidly when used for
the oligomerisation of propene A slight shift to lighter products was
also observed during this run which was expected in view of the
decreasing activity
In the case of SG type catalysts the LPR dropped by 96~ while the WHSV
dropped by 21~ after approximately 6 h on stream The average WHSV
during this run was 52 ghg The change in the WHSV was considered
acceptable and so it may be concluded that this type of catalyst
deactivates less rapidly than IMP type catalysts do when used for the
01 Igomerisation of propene This conclusion was also reached by Holm et
al (1957) In the case of this catalyst a slight shift to lighter
products was also observed with time on stream
In the case of a sil ica alumina when operated at 200degC the LPR dropped
by 315~ while the WHSVover the same time period of 76 h dropped by
28X The average WHSV during this run was 35 gh9 From these results
it can be seen that this catalyst rapidly deactivates when used for the
01 igomerisation of propene at 200degC A very sl ight shift to 1 ighter
products was observed during this run
In the case of an HOD type catalyst no data as to the 1 ifetime ~as
available and hence a long run was performed The LPR fluctuated during
this run due to WHSV fluctuations The average WHSV during this run was
52 ghg USing data pOints 105 h apart with nearly Identical WHSV of
56 and 57 ghg respectively it was found that the Conversion
decreased by 126X over this period The selectivi~y also changed during
122
this run ie bullbull the Quantity of dimer formed increased by 25~ at the
expense of the tetramer and pentamer after 120 h on stream
The I ifetime of the catalysts as measured by the drop in activity over
the first 10 h on stream are in order of decreasing length HODgt sa gt
IMPgt SA It may thus be concluded that HOD type catalysts are superior
with respect to 1 ifetime when used for the 01 igomerisation of propene
than any of the other catalysts studied
The effect of varying the ~HSV on the activity and selectivity of IMP
type catalysts was examined by Takahashi et al (1969) and by Hogan et a1
(1955) who also examined the effect of feed composition They found as
discussed in detail in Section 1524 that the rate of polymer
production increased 1 inear1y with propene concentration ie bull a first
order relationship between propene concentration and rate of polymer
formation was obtained The optimum space velocity for maximum
conversion was less than 2 ~ of propene per ~ of catalyst per hour
(Takahashi et a1 bull 1969) At higher ~HSV Takahashi et al (1969) found
that the conversion dropped rapidly
In the case of HOD type catalysts the LPR increased with the ~HSV
However the catalysts deactivated rapidly at the higher WHSV ie bull a
WHSV greater than 11 ghg in this work resulted in a drop in the LPR of
28X after 7 h on stream As expected the overall conversion decreased
with increasing WHSV droPPing from 96~ at the lowest WHSV of 49 ghg
to 77~ at a WHSV of 116 ghg
The selectivity was also affected by the changing WHSV viz a shift to
1ighter products and an increase in dimer Yield was observed with
increasing WHSV This trend is OPPOSite to that observed by Takahashi et
a1 (1969) who found using IMP type catalysts that dimer selectivity
decreased for a WHSV greater than 32 ghg Why this shoyld be so is
not known The trends In conversion are however identical viz bull
Conversion decreased with increasing WHSV
The effect of operating the catalyst initially at ZOOdegC and then reusing
ii at SOdegC was examined The catalyst was calCined in the normal man~er
between the two runs The effect on LPR and selectivity of operating the
catalyst at 200degC has already been discussed
From the results obtained in this study It was found that the actiVity
of the catalyst at sooe was affected by operating it first a~ 200degC and
the steady state Conversion after 4 ~ on stream e11 by 28~ from that
123
of a catalyst used under normal conditions The selectivity ~as also
affected by this procedure a shift to 1 ighter products being recorded
The reason for the decrease in activity ~as probably the same as that
suggested by Hogan et al (1955) in the case of IMP type catalysts
~hereby the nickel oxide promoter under~ent changes such as sintering or
a change in oxidation state during the repeated calcination and high
reaction temperature ~hich caused the activity to decl ine The catalyst
~hen operated under normal conditions did not deactivate to any marked
extent and hence no data as to the effect of repeated calcination on
the activity and selectivity ~as available
The effect of feed contaminants ~as examined in detail by Hogan et al
(1955) using an IMP type catalyst This ~as discussed in detail in
Section 1525 In this ~ork only the effect of ~ater on the activity
and selectivity ~as examined In the case of an IMP type catalysts Hogan
et al (1955) found that if the catalyst ~as allo~ed to absorb as little
as 05 ~t~ moisture the catalyst deactivated They found that this type
of contamination ~as totally reversible
In the case of an HDD type catalyst using an undried feed containing 112
ppm (vv) ~ater the catalysts deactivated after J5 h on stream as
opposed to the more than 120 h recorded ~hen using a dry feed Using the
average WHSV of 51 ghg to calculate the quantity of ~ater fed to the
reactor and assuming that al 1 the ~ater entering the bed ~as absorbed by
the catalyst the mass of ~ater absorbed by the catalysts ~as 510- 3
9H20gcat or 05 ~t~ This result is consistent ~ith to that obtained
by Hogan et al (1955) for IMP type catalysts Furthermore the
contamination ~as totally reversible as the catalysts regained its
normal dry feed properties ~ith respect to activity and selectivity
after regeneration
To examine the catalytic properties of the HDD type catalysts when used
for the ollgomerisation Ot propene dimer (C6) the lt 69degC fractIon from
previous runs ~as fed to the reactor To quantify the activity of the
catalyst the equations as discussed in Section 49 ~ere used to
calculate the LPR and conversion At 80degC the catalyst was active for
the oligomerisation of C6 but deactivated rapidly This ~as probably due
to the hl9h molar ~ei9ht products formed viz a propene tetramer
(CI2) stallng on the catalysts and so blocklng the active sites Upon
raiSing the temperature to 200degC the catalysts raPldl~ re9ained activity
reaching a steady state conversion of 64 The only product formed
124
during this run to any significant extent was a propene tetramer
(Ct2)
Feeding Co and CJ simultaneously also caused the catalyst to deactivate
after approximately 3 h on stream at 80degC The maIn product formed
during this run was a propene trimer (C9) The reason for the rapId
deactivation was probably the same as above ie bullbull the accumulation of
the propene trimer (C9) in the system and consequent blocking of the
active sites After regeneration and reusing the catalyst at 200degC the
catalyst was again active for the 01 igomerisation of the CJCo mixture
In thIS case the main product was also a C9 01 igomer with Ct2 through
C2 t formed in reasonable quantities Co-feeding Co with CJ thus has the
effect of increasing the average molecular weight of the products over
that when pure CJ was fed although different temperatures are needed to
ensure reasonable activity when Co or a CoC] mixture was used
The oligomerisation activity of the si1 ica alumina support when feeding
Co or C]C6 at 2DDoC was not examined That the support does playa role
can not be disputed as si1lca alumina is catalytically active for the
01 igomerisation of propene at temperaturesgt 1SDoC The large Quantity
of C9 formed when co-feeding CJ and Co could be explained in two ways
Firstly it could be assumed that the co-o1 igomerisation of Co and CJ was
more rapid than the dimerisation of Co or secondly that the
trimerisation of propene was the main source of the trimer The second
option seems more 1 ikely as the preferential product of si 1 ica a11Jmina
when used for the 01 igomerisation of propene at 20DoC is a propene
trimer
In the case of Ni-lSM-5 Miller (1984) suggested the use of a two stage
system whereby a high Yield of propene tetramer was possible The system
suggested by Miller (1984) was that propene should first be dimerised in
the normal way over Ni-lSM-5 at 27 to 93degC and 27 to 109 atm followed by
a distillation to separate the dimer fr~m the other products The
second stage woul d then be the 01 igomer ig3t ion of the Co stream it 121
to 232degC and 14 to 54 atm to propene tetramers both reactions being
conducted in the liQuid phase The final liQuid product )btained
contained as much as 60 wtX propene tetramer ~rom the results obt31ned
in the present work it becomes apparent that HOD t~pe nickel oxide
Silica alumina also achieves this prodlct spectltJm The reactiCn
conditions used in thiS work were 80degC and 40 atm for stage one the
product containln3 65 wt dimer and 20DoC at 40 atm For stage two Yere
both reactions were also In the 1 iquld phase and the flnal product
obtained contained appr~ximately 45 wt propene tetramerlf on th~ ot~er
125
hand the feed to stage two is a mixture of C3 and C also at 20Doe and
40 atm the final 1 iQuid product contained 20 wt~ C9 with e12 to C21
also being formed in reasonable Quantities Thus depending on the feed
used the products obtained can range from predominantly dimer obtained
when pure e3 is fed to almost pure tetramer when a C feed is used to
a high molecular weight product C to e21 when C3 and C are fed No
information was however available as to the degree of branching of the
products formed
The effect of the activation procedure in the case of IMP type catalysts
was studied in detail by Takahashi et a1 (1969) with respect to aCidIty
structure and propene dimerisation activity They found that a
temperature between 500degC and 600degC was needed to activate the catalyst
and that the activity increased with increasing activation time up to 5
h above which the activity did not change A more detailed discussion on
the effect of activation procedure on the nature of the catalyst is
given in Section 1526
In the case of an HOD type catalyst using TOoTA the only thermal event
recorded was an endotherm between 500 0 e and 600degC This was probably due
to the decomposition of organic intermediate incorporated in the
catalysts during the synthesis to nickel oxide Below bOOoe the mass
loss was 122 wtra while 15 wt was lost between 600 and 800degC In view
of the work done by Takahashi et a1 (1969) as discussed above it was
assumed that in the case of HOD type catalysts the optimum calcinatl0n
temperature also lay in the region of 500 to 600 0 e
To determine the Quantity of water that the catalyst absorbed the
previously calcined catalysts was re-exposed to aIr and the mass loss
recorded In this run the rate of mass loss was fairly ynlform the
overall mass loss bein3 37wt From the results obtained it was
concluded that below 600degC ie bull below the endothermic event observed
In the case of the unused catalyst the onl) species removed frOM the
catalyst was water
To determine the Quantity of hydrocarbon held by the catalyst aft~r it
had been used for the 01 i90merisatlon of propene as a function of nl~~el
content the TOoTA Curves for 3n HOD type catalysts With a nlck-l
content of 113 and 15 wt~ were recorded In vIew of the abQv~
discussion the mass loss recorded below 6COo~ was probably due t) the
removal of water and in this case 1 i3ht hydrocarbons As +he catagtsts
uDon completion of a run were not stored In air ~i3ht c1ntainers ~hey
probably absorbed water from the atmosp~ere Consequent ~ ~~ mak~ t~~
126
comparison meaningful only the mass loss above 600degC was considered
Below 600 0 e the mass loss recorded were 81 and 105 wt~ for HOD type
catalysts with a nickel content of 113 and 15 wt~ respectively From
this result it can be seen that the higher the nickel content the lower
the amount of adsorbed hydrocarbon and hence the lower the degree of
active site contamination In view of this result it may be concluded
that a high nickel content is desirable to ensure a long catalyst
lifetime Above 600 0 e the mass loss was independent of the nickel
content and In both cases was approximately 15 wt~
To compare the effect of synthesis procedure and the Quantity of
hydrocarbon held by the catalyst after it had ~een used for the
01 Igomerisatlon of propene the TGDTA Curves for an IMP HOD and SG
type catalyst were recorded In this case the total mass loss was
considered and it was found that the sa type catalyst had the highest
mass loss (244 wtX) followed by the IMP type catalyst which had a mass
loss of 173 wt~ and an HOD type catalyst which showed a mass loss of
120 wtX From these results it can be seen that the HOD type catalysts
held the least amount of hydrocarbon which gave a further indication
that the extent of deactivation of this catalyst was not as great as
that of the other catalysts examined
The products obtained when propene ~as 01 igomerised over an IMP type
catalyst were found by Hogan et al (1955) to contain as much as 70 vol~
Co of which 35 vol~ were linear hexenes In the case of this work the
degree of branching ie the CH3 to CH2 and CH to CH ratio was
determined using 1H NMR From the results obtained the products formed
over the IMP type catalyst were the most branched followed by the
products formed over SG type catalysts The products formed over HDO
type catalysts were the least branched From the above results if it is
assumed that the degree of branching found in this work for the products
formed over IMP type catalysts correspond to the product spectrum Quoted
by Hogan et al (1955) then the products ormed over HOD and SG type
catalysts contain more 1 inear Cos than the products formed over IMP
type catalysts do
From the present work two Questions arise They are
(1) Why is nickel oxIde silica alJmlna active for the ol190merlsation
of Dropene at sooe and sil ica alumina only at temperatures great~r
than 150degC
127
(II) Why is the preferential product of nickel oXide silica alumina
when used for the oligomerisation ~f propene a propene dimer
while that of si1 ica alumina when used for the same reaction a
propene trimer
It is proposed that the differences observed are due to the nature of
the active site and hence the 01 igomerisation mechanism
In the case of silica alumina the nature of the active site is
controversial because of the lack of conclusive evidence The various
schemes that have been proposed (8 in total) are diSCussed in Section
1231 It can however be concluded from the structure of the products
formed as establ ished in detail by Feldblyum and Baranova (1971) and
discussed in detail in Section 1232 that sil ica alumina 01 igomerises
propene via a carbonium ion meChanism ThiS in turn would explain why a
high reaction temperature is needed for silica alumina to be active for
the 01 igomerisation of propene
In the case of nickel oxide silica alumina 5 schemes have been
formulated as to the nature of the active site and hence 01 i90merisation
mechanism The various schemes proposed have been discussed in Section
1241
An early indication of the nature of the active site was given by Clark
(1953) who sugsested that the nickel crystals in nickel oxide sil ica
alumina contained an excess of metal ions Hence the active center may
either be an anion vacancy or a nickel atom not directly linked to an
oxygen atom and situated at lattice or interstitial p~ints This
sU9sestion was used by Feldblyum et a1 (1974) who then continued to
draw a compar I son between the 01 I gomer i sat ion mecran ism over nom0geneous
catalysis based on nickel salt and organoaluminium compounds and
heterogeneous catalysts based on nickel OXide on acid carriers This has
been discussed in detail In Section 1242 and summarised In Table
11 The conclusion reached by Feldblyum et a1 (1984) was that the
01 igomerisatlon of propene over nickel oxide sll iea alumina proceeds via
a complex hydride This mechanism proposed by them accounts for t~e
observed activity and selectivity of nickel oxide sll i3 alumina
Thus although no eVidence eXists to support or discount the mech~~lsm
proposed by Feldblyum and Baranova (1971) to expain the activity and
selectivdyof Silica alumina and FeldblYJm et a1 (1974) to $ltplaln
the activity and selectivity of nickel oxide 811 ica alumina they s~r~e
128
as a 900d model It is however clear that more work is reQuired to
explain these observations
In conclusion
ltI) The incorporation of nickel into sil ica alumina enhances the
catalyst activity at low temperatures and affects the
selectivity ie bullbull causes a shift to I ishter products
(II) The method of incorporating the nickel affects the activity and
selectivity o~ this catalyst
(III) The activity and selectivity o~ nickel oxide sil ica alumina
catalysts prepared by the HOD method are independent o~ the
nickel content In the case of IMP and SG type catalysts this is
not the case
ltIV) The selectivity and activity of HOD SG and IMP type catalysts
are all sensitive to the reaction temperature and pressure
(V) The 1 i~etime of HOD type catalysts when used for the
01 igomerisation of propene was 3uperior to that of the other
catalysts studied
(VI) HOD type catalysts are more active than any of the other
catalysts examined
(VII) HOD IMP and SG type catalysts are all sensitive to the feed
moisture content The introduction of a wet feed results in hish
initial activity followed by rapid deactivation The rapid
deactivation may be due to the conversion of Lewis aCld sites
to Bronsted acid sites in the presence of water
(VIII) The product spectra of HOD and IMP type catalysts are similar 3G
type catalysts however exhibit a greater selectivity towards
heavier products
(IX) HOD type catalysts can be used for the 01 igomerisation 0 hl9h
molar welght 01 igomers
129
REFERENCES
Allum KG bullbull United States Patent Appl ication No 3816555 (1974)
Bartlett PO Condon FE bullbull and Schneider Abull J Am Chem Soc bullbull 66
1531 (1944)
Blackmond DG and Ko E Appl Catal 13 49 (1984)
Boreskov OK bull in Preparation of Catalysts (Delmon Bbullbull ed)
Elsevier Amsterdam 223 (1976)
Brookes CS bull and Christopher GLM J Catal 10 211 (1968)
Cartwright PFS bullbull Newman EJ and Idilson DId bullbull The Analyst 92
663 (1967)
Cervello J bullbull Hermana E Jimlnez J bull and Milo F bullbull in Preparation of
Catalysts ltDelmon Bbullbull eds) Elsevier Amsterdam 251 (1976)
Clark Abullbull Ind Eng Chem bullbull 45 1476 (1953)
Coulson JM bull and Richardson JF bullbull Chemical Engineering Vol II
Pergamon Press New York (1980)
Couper A and Eley D Dbull Discussions Faraday soc 8 172 (1950)
Dorling LA Lynch 13 IdJ and Moss LL bull JCatal 20190 (1971)
Dow IdM and Jakob Mbull Chem Eng Pro 47 637 (1951)
Dowden DA J Chem Soc bullbull 242 (1950)
Dutkuwicz RK bullbull Energy 1980 An Energy Pol ICy DiScussion Document The
Energy Research Institute- UCL 1980
Evans AG bullbull and Polantl ~L NatJre 152 733 (1947)
Feldblyum VSh bull and Baranova rT ZhlJrnal Orsanichesoi Kiml 7
2257 (1971)
130
FeldblyYm V Sh bullbull Petryshanskaya NV bullbull Lesheheva AI bullbull and Baranova
11 Zhyrnal Organischeskoi Khimii 10 2265 (1974)
Finch JN bullbull and Clark A JCatal bullbull 13 147 (1969)
Fontana CM bullbull and Kidder GA bullbull J Am Chem Soc bullbull 70 3745 (1948)
Forni L bullbull Catalysis Reviews Vol 8 (Heinemann Ht ed) Marcell
Dekker New York (1974)
Galya LG bullbull Occelli ML bullbull and Yoyng DC J Mol Cat 32 391
(1985)
Heertjiesl PM and Mc Kibbins SiAl Chem Eng SCi bullbull 5161 (1956)
Hermans LAM bullbull and Geys JN in Preparation of Catalysts II
(Delmont Bbullbull Grange P bullbull and Jacobs P eds) Elsevier The
Netherlands (1979)
Higley DP EYropean Patent Appl ication No 843052143 (1984)
Hill FN bullbull and Selwood PW J Am Chem Soc 71 2522 (1949)
Hirschler AE Am Chem Soc Meet Chica30 Sept 1970 Reprints
Div of Petrol Chem 15 A97 (1970)
Hogan JP Banks RL Lanning WC bullbull and Clark Abullbull Ind Ens Chem
47 LI (1955)
Holm VCF bullbull Bailey GC bullbull and Clark A Ind Eng Chem bullbull 49 250
(1957)
Holm VCF and Bailey GC bull and Clark A bullbull JPhys Chem 63 129
(1959)
Hoyalla M and Delmon B bullbull Surface and Interface Anal 3 103 (1981)
Hunter WH bullbull and Yohe RV bullbull J Am Chem Soc 55 1248 (1933)
Imal Hbullbull and Uchida Hbull Bull Chem Soc Japan 38 925 (1965)
Imai H Hasesawa L and Uchida H Bull Chem 30c Japan 41 45
( 1968)
131
Johnson 0 bullbull J Am Chem Soc bullbull 59 827 (1955)
Langlois GE bullbull Ind Eng Chem 45 1470 (1953)
Leva Mbullbull Fluidisation McGraw and Hill (1959)
LevensPlelO bullbull Chemical Reaction Engineering 2nd ed bullbull John Wiely and
Sons (1972)
Maatman RW bullbull and Prater CD Ind Eng Chern bullbull 49 2 (1957)
McNair HM bullbull and Bonell i EJ bullbull BasiC Gas Chromatography 5th ed
Varian Instrument Division (1969)
Mickley HS bullbull and Fairbanks DF bullbull AI Ch EJ 1 374 (1955)
Miller SJ bullbull US Patent 4608450 (1986)
Mizuno K bullbull Ikeda Mbullbull Imokawa T bull Take J bull and Yoneda Ybullbull Bull
Chem Soc bullbull Japan 49 1788 (1976)
Montes Mbullbull Penneman de Bosscheyde Cbullbull Hodett BK bullbull Delannay F bull
Grange P bullbull and Delmon B bullbull Appl Catsl 12 309 (1984)
Norrish RGIJ and Russell KE bullbull Trans Faraday Soc bull 43 91 (1952)
Ozaki Abullbull and Kimura K JCatal 3 395 (1964)
Ozaki Abullbull Ali H and Kimura K bullbull FOJrth Int Cong Catal Moscow 40
(1968)
Peri JB JCatal 41 227 (1976)
Ramser JH and Hill PB bullbull Ind Eng Chem bull 501 (1958)
Richardson JT and Dubus RJ bull J Catal 54 207 (1978)
Sato Mbullbull Aonuma T and Shiba T Poc Third Int Con-l Catal
Amsterdam 1964 1 396 (1965)
Schmerl ing L and Ipatieff )N bull Advances in catalysIs II New York
AcademiC Press Inc 21 (1950)
sc h u lt z R G S c h tJ C k J M and IJ i 1 d I B Cbullbull J Cat a1 6 385 (1 966
132
Shepard FE Roohes JJ bullbull and Kemball Cbullbull JCatal 1 379 (1962)
Smith JM bullbull and Van Noss HC bullbull Introduction to ChemIcal Engineering
ThermodynamiCs 3rd Edition McGraw and Hill International Book Company
New York (1981gt
Takahashi Kbullbull Sasaki 0 bullbull Aomura Kbullbull and Ohtsuka H Hokkaido Daisaku
Kogakubu Kenkyu Hokoku 53 201 (1969)
Takahashi K bullbull NishiH Yoneda Nbullbull and Ohtsuka Sekiyu Gakkai Shi 15
482 (1972)
Tamele MW bullbull Ind Eng Chem 8 270 (1950)
Thomas CL Ind Eng Chem bullbull 37 543 (1945)
Ublad AG bullbull Mills GA Heinemann Hbullbull Polymerization of Olefins
Emmet (ed) Catalysis 5 New York (1958)
Uchida H and Imai Hbullbull Bull Chem Soc Japan 35 995 (1962)
Van Dillen JA bullbull Geus JW bullbull Hermans LAM bullbull and Van Der Mejden Proc
Sixth Int Congo Cata] B7 (1976)
Walton AG bullbull in Dispersion of Powders in liquids (Parfitt GD bullbull ed)
Elsevier Amsterdam 122 (1969)
Ward JW bullbull and Hansford RC bullbull J Catal 13 154 (1969)
Weeks TJ bullbull Jr bullbull Angell CL Ladd IR bullbull and Bolton AP JCatal
33 256 (1974)
Whitmore FC Ind En2l Chern 26 94 (1934)
Yagi S bullbull and Kunii Dbullbull Fifth Int Symp on Combustion Reinhold (ed)
New Yor k 231 (1955)
133
APPENDIX A
1 Gas chromato~raph data
11 Gas samples
The settin~s used on the Gow-Mac 750p ~as chromato~raph tor all teed and
tail ~as analyses are 1 isted below
Chromatograph Go Mac 750p
Detector Flame ionisation
Attenuat ion 1
Range 10- t 0 ampsmV
Data system Varian 4270
Column length 55 m
Column diameter 4 mm
Column pressure 28 psi at 50C
Pack ing n-OctanePoracil C
N2 tlowrate 41 mlmin
H2 fl owrate 31 mlmin
Air flowrate 300 mlmin
Injector temp 150C
Detector temp 250C
Temp pro~ 10 min at 50C 10Clmln b 120C
5 min at 120C
Sample volume 10~1
111 Cal ibration
It IS well establlshed in the 1 iterature that the area percents of
components are not directly proportIonal to the mass percent ie
different components have different detector responses It IS therefore
necessary to determine correction factors Once determined these
correction factors can be ~sed to calculate the composition on a mass
basis Two gas standards were avaIlable the compOSition of which ere
shown in Table A-l
134
Tab1e A-l Gas standards composition
Stan dar d Species Mole ~ Mass
1 Methane
Ethane
Propane
Butane
228
292
298
182
101
243
363
293
2 Propane
Propene
520
480
532
46S
Each standard was injected M times (M L 3) into the GC and the area
Counts and retention times recorded The results were then normal ized to
el iminate any discrepancies while injectin9J usin9 the eQuations shown
below These eQuations were adopted from McNair and Bonell i (1969) To
normal ize area counts use
For i = 1 to M
where
M is the number of samp1es
N is the number of components
ACI J is the area count of component in sample as recorded by
theGC bullbull and
APi is the mean area percent or component i
and to normal ize retention times use
RIi = J1 (~IijACiJ For i = 1 to MI
t ~1 J ~1 AC i I
Ilhere
Ri ij IS the retention time of comoonent i In samp1e j and
RIi is the mean retention time of Component 1
135
Once the mean area percent of each component had been establ ished the
rat io (AR) of the area percent (APt) to mass percent (MPt) was
calculated using
The response factors (RF i ) are calculated using
These factors are relative to propane ie the response factor for
propane was arbitrarily set equal to unity A detailed sample
calculation using the above procedure is ~iven in Table A-2
Table A-2 Area percent and retention tIme normalisation
Standard 1
Spec i es Methane Ethane Propane Butane
(N=4) ( i =1) ( i=2) ( i =3) ( i =4)
AC i j t 94792 241206 346861 371930
RT i j t 35 43 62 111
AC i j 2 82857 213323 308409 332568
RT i j 2 35 43 62 111
ACijJ 86832 215668 314257 322218
RT i j bull J 35 43 61 111
APi 90 229 331 350
RTi 35 43 61 111
MPi 101 243 363 293
AR 089 094 Dl 12
RFi 102 097 100 076
136
Table A-2 Area percent and retention time normalisation (continued)
Standard 2
Species Propane Propene
(N=2) ( i =2)
ACij-t 521001 593387
RT i j bull t 61 74
AC i j 2 55278 64241
RT i j 2 62 74
AC i J J 45750 56275
RT i j J 61 74
APi 466 534
RTi 61 74
MPi 532 468
ARi 088 114
RFi 1000 077
Under the same detector conditions these factors can be used time and
time a9ain to calculate the mass percent of the components in the
standards relative to propane
To calculate the composItion on a mass basis of an unknown mixture the
equation used is
MPi
A sample calculation usin9 the above equation and the GG output from
an independent injection of Standard 1 is shown In Table A-3
137
Table A-3 Error determination
Species MPI MPcalc Error
Methane 109318 102 101 103 16
Ethane 273475 097 243 243 03
Propane 394953 100 363 364 01
Butane 414146 076 293 290 09
~ (E 2 ) = 34
A typical spectrum obtained (f~ed gas) is summarised in Table A-4 and
shown in Figure A-i Traces of species found in the feed but for which
no standards were available were assigned response factors of vnity As
the total contribution of these on an area basis was less than one
percent the error introduced should be negl i~lbly small
Table A-4 Feed composition
Species Retention time Response factor Mass r
Methane 35 102 00
Ethane 43 097 092
Propane 61 100 198
Propene 74 077 780
Iso-Butane 110 100 019
N-Butane 11 1 076 023
i-Butene 136 100 043
Iso-Butene 147 1 00 004
T2-Butene 153 100 009
C2-Butene 159 1 00 005
C5 + 193 100 017
138
I m ~ t gt z m
ImiddotIi Ii I
il I
I
I I i
l~~0 0 Z z -ln n 0 0 Vgt I I VgtNN deg OgtJJ COOIIdeg 0 0 ICC 1ClliX) gt m Cll -l -lCllCC Z Z Cgt mC-l-l m m -l Z Z-lmm
gt m m m Z Z z zmm m m
Fi~ A-I GC SPECTRA OF FEED
139
12 Liquid samples
The settin9s I isted below were used for all I iQuid samples
Chromatograph Varian 3400
Auto sampler Varian 8000
Data system Varian CDS 401
Detector Flame ionisation
Attenuat ion 1
Range 10- Of ampsmV
Column length 3 m
Column diameter 4 mm
Column press 18 psi at 40 C
Packing 31 Sil iconOV-10l on Chromosorb W-HP
100120 mesh
Nz flowrate 30 mlmin
Hz flowrate 30 mllmin
Air flowrate 300 mlmin
Injector temp 250C
Detector temp 300C
Temp Pro9 5 min at aoc lOCmin to l80C
30Cmin to 300C 5 min at 300C
Sample volume 1 ~I
121 Calibration using mass spectroscopy
Due to the complex nature of the I iQuid products the analysiS of the
I iQuid spectra was difficult To facil itate product analysis it ~as
decided that the liquid product analYSis be based on carbon number
groupings rather than on indiVidual components A direct comparison
between the spectra obtained by the GC and MS was not possible due
to hardware and software differences The trends in the spectrum
obtained were however the same and in this way carbon number~ could b~
allocated to the GC spectrum
A typical spectrum of the GC-MS is shown in Fi9ure A-2 The
molecular wei9hts of the components ~esponsible For the peaks as
determined by mass spectroscmiddotpy are shown In this FIJre As a
comparison a sas chromatogram uSln3 the Varian 3400 IS shown In
140
r------------y-~
+ cO -shy
U
LJ -shy
u Ishy
= c - 0
t-Clt 0 a~
t Cl-=gt ct- l shy J
C-~ IL ~ 0 r (t
ot- l shy
f u w Q ~ (j)
co t~ (j)r-J
Gl u [- u
t~ ~
J lt u shyCI gtshyl-
N I
W lt
(JshyU
U ~
IL
M U
Hlpoundl
---------
---- ---
141
~Lgt-------- --- -------_____
_____~L
ltlt
I
C1 U
---~~------- --~-----~------~~--
u___---s-----======~--=-----~~a
1 -------------- ----------shy
142
F i 3ure A-3 Us i ns the data from the M S carbon numbers cou 1 d be
assisned to the peaks on the sas chromatosram and so the start and end
times of the various sroups established The groupings used are shown in
Table A-5 as is a typical 1 iquid compositIon
Table A-5 Typical liquid composition and retention time windows
Group Mass r Retention times
start stop
Monomer 495 000 102
oimer 610 102 470
Trimer 243 470 112
Tetramer 813 112 157
Pentamer 162 157 185
Hexamer 000 185 205
Heptamer 000 205 280
The response factors of these groups were taken as unity which was
justified in VIew of work done by Dietz (1967) on the relative
sensitivity of hydrOCarbons The results reoorted in mass oercent are
therefore a reasonable representation of the actual composition
0 200 0
100 VAPeUR PHASE
Jgt
600+ m z 0 x
w 500+
fLUID PHASE
L 400I-a III
1I QU I D PHASE W 0 300 =gt III
(f) III(f)
t WW
00
-600 --300 -100 100 300 600 700 900 1100
TEMPERRTURE C
FIG B-1 DEW pe I NT TEMPERATURE ( C) AND BUBBLE pe I NT TEMPERATURE (C) VS PRESSURE (ATM)
20 MelEi PRePANE AND 80 MelEi PRePENE ~
I J
I
THE OLIGOMERISATION OF PROPENE OVER
NICKEL OXIDE SILICA ALUMINA
BY
STEFAN MATHIAS HARMS
BSc (Eng) (Cape Town)
Submitted to the University of Gape Town in
fulfilment of the requirements For the de3ree
Master of SCIence in Engneerlng
( 1987)
II
SYNOPSIS
A synthesis technique was developed tor the preparation Ot a nickel
oxide silica alumina catalyst The propene oligomerisation activity and
the selectivity Ot the catalysts prepared by homogeneous decomposition
deposition (HOD) were investigated and compared with nickel oxide sil ica
alumina catalysts prepared by the techniques ot impregnation (IMP) and
co-precipitation (SG) Amongst others the ettect Ot the nickel content
reaction temperature and pressure and water content ot the teed on the
activity and selectivity were investigated Also investigated were the
1 ifetime Ot the various catalysts and in the case ot HOD type
catalysts the ability to 01 igomerise high molecular weight hydrocarbons
(Cb ) bull
Nickel oxide silica alumina prepared by the HOD method is more active
for the propene 01 igomerisation than catalysts prepared by the IMP and
SG methods The product spectrum in the case ot IMP and HOD type
catalysts are similar with a propene dimer (C~) being the main product
In the case Ot SG type catalysts however a shift to heavier products
was observed i e propene dimer (C6) and trimer (C~) were formed in
equal Quantities It 19 proposed that the increase in activity Ot HOD
type catalysts was due to a large extent of metal dispersion and
distribution and a stronger interaction between the metal and the
support It is also proposed that the metal is readily accessible to the
reactant molecules
The activity and selectivity of catalysts prepared by the HOD method
were independent of the nickel content This was not the case tor IMP
and SG type catalysts both of which showed decreasing activity with
increasing nickel content when the nickel content was increased beyond 5
wt
The 1itetimes ot the various ctalysts were also examined From the
results obtained over the first 10 h the 1 itetime egtf HOD tlpe
catalysts was superior to that ot the other catalysts studied The
activity and selectvity of the varIous catalysts were senSlt ive to the
reaction Conditions Thus moving into the vapour phase by either
increasln9 the temperature at a fi_ed press~re 0r decreasing the
pressure at a fixed temperature was In each case accompanied by a shif~
to heavier products and a decrease in actvity
III
The catalysts studied were very sensitive to the feed moisture content
The introduction of an undried feed resulted in a hi9h initial activity
followed by rapid deactivation IMP and HOD type catalysts after bein9
exposed to a wet feed were shown to be able to resain their normal
activity and selectivity after calcination
IV
AC KNOWLEDGEtlErHS
I would 1 Ike to express my sincere appreciatIon to Dr H KOJima and
Prof CT OConnor for their assistance and gUidance throughout the
duration of my study
Many thanks to Messrs D McClean L Jacobs) PM DIckens K Moller and
SSchwarz) for their friendshiP and helpful advice over the years
The following people and institullons are also gratefully acknowledged
SASOL and the Council for SIfrtific arid Industrial Research for
financial assistance
All on the ChemIcal Engineering Department stafF
Dr K Herzog for his assistance with the TG-OTA anAlysis
Miss 8 Williams for lhe mass spe(trosCopiC analmiddotSIS
Dr M Rautenbach for the use of his compuier pro9ramn
A speCial thanks to Alexandra For her help and patience
I would also like tegt thank my frmiddotgtther In3-br3 tor het cord Inou
support and patience
TABLE OF CONTENT
PAGE
SYNOPSIS II
ACKNOIIILEDGEMENTS IV
TABLE OF CONTENTS v
LI ST OF FIGURES x
LIST OF TABLES XVI
1 INTRODUCTION
11 Heterogeneous catalysis 2
12 Polymerisation using heterogeneous catalysts 3
121 Kinetics of the overall process 3
122 Polymerisation 6
1221 True polymerisation 6
1222 Conjunct polymerisation 9
123 Polymerisation on si 1 ica alumina 10
1231 Nature of active sites on sil ica alumina 10
1232 Structure of the products and proposed mechanism
on sll ica alumina 10
124 Polymer1sation on nickel OXide sll ica alumIna 12
1241 Nature of active sItes on nickel OXide sil ica alumina 12
1242 Structure of the products on nickel oxide 511 iea
alumina 13
1 25 Thermodnamics 15
13 Catalyst characterisation
131 Introduction 13
132 Catalyst syntheSIS methods 19
1321 Preparation with adsorption 19
VI
1322
1323
1324
133
1331
1332
1 34
14
1 41
1411
1412
1413
142
1421
1422
1423
1424
15
1 51
1511
1512
1513
1514
1515
152
1521
1522
1523
1524
1525
1526
1527
1528
152Q
16
17
Dryin9 of adsorbent sol ids
Preparation without adsorption
Dryin9 of non-adsorbed sol ids
Hom0geneous decomposition deposition
Theory of hom0geneous decomposition deposition
Nickel oxide silica alumina preparation usin9 a
hom0geneous solution
Co-precipitation
Physical characterisatlcs of the catalyst
Properties of sil ica alumina
Sur face area
Pore structure
Surface aCidity
Properties of nickel oxide on si1 ica alumina
Total surface area
Metal surface area and crystal size
Pore volume and size distribution
Metal support interaction
Catalyst po1ymerisation properties
Si1 ica alumina properties
Effect of Silica to alumina ratio
Effect of reaction temperature
Effect of space velocity
Product spectrum
Effect of activation
Nickel oxide si1 iea alumina properties
Effect of synthesis procedure
Effect of metal content
Effect of reaction temperature anJ pressure
Effect of feed compOSition and space velOCity
Effect of feed impurities
Effect of activation procedure
Effect of regeneration
Product spectrum
Lifeiime
ConclUSIon
Objective 0f research
PAGE
21
21
22
23
23
24
25
26
26
26
26
28
28
28
29
30
31
32
32
32
33
33
33
34
34
34
35
35
35
36
37 7-
37
38
VI
2 DESIGN OF ISOTHERMAL REACTOR
21 Fluidisation theory
22 Heat transfer
Fluidising medium23
231 Sand data
24 Optimisation of the fluidised bed
241 Air flow optimisation
242 Temperature correction
3 EXPERIMENTAL METHODS
31 The reactor system
311 Layout
32 Reactor
321 Fluidised bed
322 Integra1 reactor
33 Operation
331 Loading
332 Calcination procedure
333 Start-up
334 Steady state operation
335 Shut-down
34 Data analysIs
341 Computation of results
35 Analytical procedure
351 Gas analysis
352 UqU i d analysis
353 Nuclear masnetic resonance
354 TGDTA
355 Water content determination
356 o i st ill at ion
PAGE
42
42
43
44
45
45
49
51
53
53
53
56
56
58
60
60
61
62
62
63
63
63
65
65
65
tS6
68
69
69
VIII
36 Catalyst synthesis
361 Support preparation
362 Impre9nation
3621 Nickel concentration
363 Hom0geneous decomposition depositlon
3631 Nickel concentration
364 Coprecipitation
365 Determination of nickel content
366 Extrudate manufacture
4 RESULTS
41 Reproducibility of data
42 Effect of nickel content
43 Effect of pressure
44 Bed temperature profile
441 Effect of temperature
45 Lifetime and selectivity
46 Effect of WHSV
47 Effect of temperature runaway
48 Effect of water contaminatlon
49 liquid feed (Cit )
410 liquid and gas feed (Cl + Cit)
411 TGDTA
412 NMR
PAGE
71
71
71
71
71
72
73
74
74
7S
75
78
7S
82
86
90
95
95
95
98
98
101
5 DISCUSSION
105
112
129
133
IX
PAGE
6 REFERENCES
7 APPENDICES
7A APPENDIX A 133
1 Gas chromatograph data 133
11 Gas samples 133
111 Calibration 133
12 li QU i d samp 1es 139
1 21 Cal ibration using mass spectroscopy 139
7B APPENDIX B 143
1 Phase diaghram 143
x
LIST OF FIGURES
PAGE
CHAPTER 1
Figure 11 Activity of sil ica alumina catalyst for various
reactions as a function of sil ica to alumina ratio 2
Figure 12 Ranges of conversion for polymerisation of propene
on metal oxide sil ica alumina catalysts 4 wt~
Fi3ure 1 7 Conditions of a pore adsorbin3 activating material
Intersectin3 pores of different sizes before
dryin3 (A) and after evaporation of some of the
metal oxide impregnated on support 4
Figure 13 Free energy chan3e during dimerisation 16
Figure 14 Free energy change during dimerisation 17
Figure 15 Conversion obtainable in dimerisation reactions 17
Fi3ure 16 Polymerisation of propene 18
in solution 20
pore volume 1 iQuid (B) 22
Fi3ure 19 Phase diagram 25
Fi3ure 110 Si1 ica alumina surface area (m 2 g) vs alumina
content (mass~O 27
Fi3ure 111 Propene conversion (mass~) vs pressure (atm) 36
CHAPTER 2
Pressure drop over fixed and fluidised beds
Fi3ure 22 Convection coeffecient (Wm 2 K) vs partical
size (pm) 25 Q C
43
46
XI
Figure 23
Figure 24
Figure 25
Figure 26
Figure 27
Figure 28
CHAPTER 3
Figure 31
Figure 32
Figure 33
Figure 34
Figure 35
Figure 36
Figure 37
CHAPTER 4
PAGE
Convection coeffecient (Wm 2 K) vs partical
size (lim) 190degC 46
Reactor modifications to measure pressure drop 47
Pressure drop vs supperficial velocity aCross
disk and bed 49
Pressure drop vs supperficial velocity Integral
reactor absent 50
Pressure drop vs supperfictal velocity Integral
reactor present 51
Bed temperature (OC) vs rotameter tube reading (TR) 52
Vb=12 lmin
Reactor system 54
Integral reactor and fluidised sand bed 57
Integral reactor 59
Reactor bed 61
Batch distillation unit 70
Nickel content (massYo) vs mass of nickel nitrate
hexahydrate (g) 72
Nickel content (mass~O vs time (min) 73
Liquid production rate (Shgl vs time (h) 77
XII
FiSure 42
FiSure 43
Fisure 44
Fisure 45
FiSure 46
Figure 47
Fisure 48
FiSure 49
Figure 410
Figure 411
Figure 412
Figure 413
Figure 414
Fi3ure 415
PAGE
Liquid composition (mass)) vs time ( h ) 77
EHec t of nickel content
product ion rate (9hS)
(mass))
HOD
on 1 iQuid
79
EHect of nickel content
composition (mass) HOD
(mass~) on 1 iQuid
79
Effect of nickel content
production rate (ghg)
(mass~)
IMP
on liquid
80
EHect of nickel content
composition (mass~) IMP
(mass~O on 1 iQuid
80
Effect of pressure
rate (ghg) HO~
Effect of pressure
(mass) HOD
Effect of pressure
rate (ghg) IMP
Effect of pressure
(mass) IMP
Effect of pressure
rate (Shg) SG
Liquid composition
at 40 atm SG
(atm) on
(atm) on
(atm) on
(atm) on
(atm) on
(mass~)
1 iquid production
81
1 iQuid composition
81
1 iQuid production
83
1 iQuid composition
83
liquid production
84
vs time (h) 84
Bed
set
temperature profile ( deg C )
point 80degC SG-1
vs position ( Z ) I
85
Bed
set
temperature +PO n _ 80degC
fluctuations
S(7-1
( lt) C ) vs time (h) I
85
Bed
set
temperature profi le
point 210degC HDD-9
( 0 C ) vs POSition (Z)
87
XIII
PAGE
Figure 416 Bed
set
temperature fluctuations
point 210degC HOO-9
(OC) vs time (hl
87
Figure 417 Effect of temperature (OCl on 1 iQuid production
rate (ghg) HOD
Figure 418 Effect of temperature
(mass~) HOD
(OC) on
Figure 419 Effect of temperature
rate (ghg) SA
(OC) on
Figure 420 Effect of temperature
(mass~) SA
(OC) on
Figure 421 Liquid production rate
space velocity (ghg)
(ghg)
vs time
Figure 422 Liquid composition (mass) vs
Figure 423 Liquid production rate
space velocity (ghg)
(ghg)
vs time
Figure 424 Liquid composition (mass) vs
Figure 425 Liquid production rate
space velocity (ghg)
(ghg)
vs time
Figure 426 Liquid composition (mass) vs
Figure 427 Liquid production rate
space velocity (ghgl
(ghg)
vs time
Figure 428 Liquid c~mpositlon (massl) vs
Figure 429 Effect of weight hourly space
88
liquid composition
S8
liquid production
89
liquid composition
89
and weight hourly
(h) for HDD-3 91
time (hl for HDD-3 91
and weight hourly
(hl for IMP-2 92
time (h) for IMP-2 92
and weight hourly
(h) for SG-1 93
time (h) for 3G-1 93
and weight hourly
(h) for SA-3 94
time (hI for SA-3 94
velocity (ghg)
on 1 iQUld production rate IShg HOD 96
Figure 430 Effect of weight hourly space velocity (ghg)
on 1 iQuid composition (ma9s~) HOD 96
XIV
PAGE
Fi~ure 431 Effect of temperature runaway
rate (~h~) HDO-6 and HDO-7
usin~ same catalyst
on 1 iQuid production
consecutive runs
97
Fi~ure 432 Effect of temperature
composition (mass~)
(OC) runaway on liQuid
97
Fi~ure 433 Effect of water on 1 iQuid production rate
(~h~) HDO-5 re~eneration after HOD-4 99
Fi~ure 434 Effect of water contamination
composition (~h~) HO~
on 1 iQuid
99
Fi~ure 435 LiQuid production rate (~hg) and
(mass~) vs time (h) 1 iQuid laquo69degC
feed HOD-IS
conversion
fraction)
100
Figure 436 LiQuid composition (massYo) vs
laquo69degC fraction) feed HDD-1S
time (h) 1 iQuid
100
Fi~ure 437 LiQuid production rate (~hg) and conversion
(mass~) for propene vs time (h) liQuid
laquo69degC fraction) and gas feed HDD-19 102
Figure 438 LiQuid composition (mass~) of entire 1 iQuid
effluent vs time (h) liQuid laquo69degC fraction)
gas feed HDD-19
and
102
Fi~ure 439 LiQuid production rate (ghg) and conversion
(mass~) for propene vs time (h) liquid laquo69degC
fraction) and gas feed HDD-20 103
Figure 440 Liquid composition (mass)
sample vs time (h) 1 iquid
gas feed HDD-20
of entire 1 iQuid
laquo69degC fraction) and
103
~i9ure 441 Mass loss
for fresh
(X) and temperature ~iffe~ences (O()
catalyst 20 mg sample 104
104
xv
PAGE
Fi~ure 442 Mass loss (~) and temperature difference (OC) for
a calcined catalyst which has been exposed to air
19 m~ sample
Fi~ure 443 Mass loss (~) and temperature difference (OC) for
a used catalyst HDD-13 185 mg sample 106
Figure 444 Mass loss (X) and temperature difference (OC) for
Figure 445 Mass loss (X) and temperature difference (OC) for
Figure 446 Mass loss (~) and temperature difference (OC) for
a used catalyst IMP-1 18 mg sample 106
a used catalyst HDD-l17 m9 sample 107
a used catalyst SG-3 17 m9 sample 107
Figure 447 NMR spectra of 1 iquid product from run IMP-l 108
Fi~ure 448 NMR spectra of liquid product from run SG-3 109
Figure 449 NMR spectra of liquid product from run HDD-l 110
CHAPTER 7
7A APPENDIX A
Figure A-I GC spectra of feed 138
Figure A-2 Typical GC- MS spectra of 1 iquid product 140
Figure A-3 Typical GC spectra of liquid product 141
APPENDIX B
Figure B-1 Dew point temperatYre (OCI and bubble point
temperature (OC) vs pressure (atm) 20 mole~
propane and 80 mole~ propene 143
XVI
LIST OF TABLES
PAGE
CHAPTER 1
Table 11 Analogy in the mechanism of the catalytic action
homogeneous and heterogeneous system for the
dimerisation of olefins
of
14
Table 12 Characterisation of supported metal catalysts 26
Table 13 Pore volume and
and adsorbents
size distribution of fresh catalyst
27
Table 14 ACid
heat
content
treated
(total and
at 550degC
Bronsted) for silica alumina
28
Table 15 Surface area of nickel oxide sil ica alumina prepared
by Impregnation and coprecipitation as a function of
nickel content The si1 ica to alumina weight ratio was
91 29
Table 16 Surface area of nickel oxide si1 ica alumina as a
function of the alumina content Nickel content held
constant at 61 wtr 30
Table 17 Surface area of nickel oxide si1 ica
function of nickel content Alumina
at 43 wtr
alumina
content
as a
was held
30
Table 18 Nickel metal area from H2 chemisorption at 250degC
and 100 mmHg vapour pressure and from X-ray
diffraction 1 ine-broadening 31
Table 19 Pore volume and radius of a nickel aiumina ratalyst
with varYing alumina content Nickel content held at
4 wtx 31
Table 110 Pore volume and radius of a nickel oxide si1 ica
alumina catalyst with varYlng nlckel content
Alumina content held at 43 wtX throu9hout 32
XVII
PAGE
Table 111 Propene 01i90merisation on silica alumina at a
constant pressure of 50 atm and varyin9 temperature
Sil ica to alumina ratio used was 94 to 3 throu9hout 33
Table 112 Product distribution of propene 01 i90merised over
sil ica alumina as a function of temperature
Reaction pressure is 50 atm 34
Table 113 Relationship between product distribution and
reaction conditions 39
Table 114 Propene conversion and product spectrum as a
function of space velocity silica ta alumina ratio
is 9 to 1 throu9hout 40
CHAPTER 2
Table 21 Sand size fractions 48
CHAPTER 3
Table 31 Feed composition 65
Table 32 Carbon number groupings used for 1 iQuid analysis 66
Table 33 Structure definitions of terms and NMR spectral
positions and area code 67
CHAPTER 4
Table 41 Reaction data 76
Table 42 Integrated areas 111
Table 43 Carbon areas and branching 111
XVIII
PAGE
CHAPTER 7
7A APPENDIX A
Table A-1
Table A-2
Table A-2
Table A-3
Table A-4
Table A-5
Gas standards composition
Area percentage and retention
Area percentage and retention
(continued)
Error determination
Feed composition
Typical 1 iQuid composition and
windows
134
time normal isation 135
time normal isation
136
137
137
retention time
142
1
1 INTRODUCTION
In South Africa the oil from coal industry has developed the first
commercial process whereby sYnthetic fuels are produced from coal via
gasification usin9 Fisher Tropsch catalysts It started In 1943 when the
AmerIcan rights to the Fischer Tropseh process were purchased by South
A f ric a I n 191 0 the Sou t h Af I i can 0 i 1 C0 a 1 and Gas C() r p 0 r a ti (gt n (S A S 0 Ll
was formed The first plant Sasol I with a capaCity of 4130 barrelsday
went into opel-atlon in 1954 (OUtkUW1CZ 1981ll It used two type of
reactors namelv the Arge fixed bed and synthol fluidlsed bed reactors
Two further plants Sasol II and Sasol III which are Improved and
enlarged versions of Sasol I wert later built eAch having i3 CClfacit (f
35900 barrelsday (Dutkuwicz) 1980) In both of these planl~ onl~ the
synthol reactors are used Due to th~ nature of ihe process Sasol
pr oduces 1ar3e Quant It i es of 1 i ght hvdr ocar bon gilSfS anoun t i n3 to
approximatelv 15-106 mZday These are partly r~tlculated to local
i n d us try and par tl y Con v e r ted I 1 a a cat a 1 yt I C (middot1 i 30 rr euro r I s d ion p r (J C esst (gt
1 i 9h t f IJ e1sth euro r eby inc r e a s Jr13 the 0 I er I 1 r) r (l dII ~t Ion I n t e r mS 0 f
barrels of I iquld fuel produced per ton of coal procESSE-d Currentll
Sasol I can more than satisfv he loal dernnd dnj therefol~ the light
hydrocarbons from Sasol II and Sas()l III represent elaquo~s Buppl
The catalvtic oli90merisation process referred to abrve ISPS the
conventional phosphoric Reid catalyst to oli30fllPrisE lhe light
hydrocarbons to 1 iquid fuels This process howltver ~Ir(gtdIJCeS poor qlal ity
pet r 0 I and dies e I and the (a tal s tis C (I r r lt) s i v
The present study investigated an alternative catalyst For the catalytic
oligomerisation of li3ht hydrocarbons to 11qllid fllel Ilsin3 a nickel
oxide sil iea alumina catalyst synlhesls~d via methorl adopt0d by the
aulhor from (gtlork done bi van Dillen el 031 ()976) Al1l()lgh rlikel (Idne
SilIca alumina catalysts have Geen Ideli stldied (Tahahashi et a1
1969 Hogan et al 195 Holm 1917 [tt) the- ltgtrthe=~ fII~~H)d
developed in this work will produced a moreuro HC t i ve
catalyst With greater resistance to deactivation and greater selectivity
to linear C6 than those recorded f()r nickel oxide silica alJroina
catalysts produced viB the standard impregnation technIQue In this way
it is hoped to produce a beUer qual ity diesel than p~ssjble over the
standard irnprelnated nickel oxi de i I ica alumln1
2
11 Heterogeneous catalysis
As the silica alumina support in a nickel oxide silica alumina catalyst
is a catalytically active solid oxide insulator its catalytic properties
as well as those of nickel oxide on silica alumina have to be examined
In what ollows a brief review 0 the catalytic properties 0 both is
given
The oxides and halides of the lower elements of sroups III IV and V of
the periodiC table tend to cata1yse pOSitive ion or acid type
reactions such as polymerisation alkylation cracking and
isomerisation One of the most active solid oxide insulators is siliCa
alumina In Fi9ure 11 (Clark 1953) the rate of reaction is plotted
against the weight percent sil ica in a silica alumina catalysts for
various reactions viz bullbull hydrogen transfer propene polymerisation
ethene hydrogenation and hydrogen deuterium exchange It Can be seen
from this figure that the reaction velOCity constants of the acid type
reactions such as hydrosen transfer and propene polymerisation roughly
parallel the changes in catalyst acidity
~=H-D EXCHANGE AT 300degC K-10- t
~=ETHENE HYDROGENATION AT 500degC
+=HYDROGEN TRANSFER AT 340degC K-l0 DECALIN-l-BUTENE
X=PROPENE POLYMERISATION AT 200degC K-l0 J
60
50 u UJ ()
shy I- 40 z ~ lshy()
Z o 30 u
UJ Ishy~ 0
200 UJ 0 0 0
I- 10 ()
0 U
00
00
~=ACIDITY MILLI EQUIVALENTS PER GRAM middot10~
I
700 800 900 1000100 200 300 400 500 600
WEIGHT ~ SILICA
FIGURE 11 ACTIVITY OF SILICA ALUMINA CATAL1STS FOR VARIOUS
REACTIONS AS A FUNCTION OF SILICA TO ALUMINA RATIO
100
xUJ- ~ 060 -UJ ltII
Ishy 0UJ UJ Qltre ()
I () ()z ~ Ishy60 0 Q z UJI- 0 - ~ UJ ~ Z Q gtUJ ltI 0 gt 0 Ishy UJ40 0 UJ 0 ~ Igt- Z -I UJ - ltI UJ 0 xZ 0 UJ 0 II gtshy20 I- gtshyI IshyUJ
0-u ~
o
3
The reactions which occur readily on the transition metal oxides such
as hydrogen-deuterium exchange which gives a reasonably good indication
of hydrogenation-dehydrogenation activity and ethene hydrogenation
proceed slowly even on pure alumina and the rate decrease to
insignificant values with increasing si1 ica content Conversely
transition metals are poor catalysts for aCid-type reactions
Transition metal oxides alone or supported on weakly acid oxides such
as alumina show only a small activity for acid type reactions such as
the polymerisation of the low boiling point olefins When however
these oxides are supported on strong acid oxides such as silica alumina
they are capable of giving an increased activity as indicated in Figure
12 (Clark 1953) which shows data on the po1ymerisation of propene
The details oT the mechanism by which these metal oxides supported on
silica alumina give an activity greater than that over sil ica alumina
alone are not clear Using Tame1es method of butylamine titration
there are some indications oT an inCrease in acid content of the active
metal oxide promoted catalyst over that of silica alumina alone (Clark
1953) A detailed discussion of the mechanisms proposed and nature of
the active sites is given elsewhere
The following conclusions may therefore be drawn from
Figure 12 with respect to propene polymerisation
- the oxides of metals in group V and higher of the periodiC table
loaded on silica alumina alone give increased activity over silica
alumina
- the oxides of metals in group IV and lower of the periodiC table give
activity below that of sil ica alumina
- redUCing the metal oxides causes the activity oT the catalyst to drop
below that of silica alumina
12 Polymerisation using heterogeneous catalysts
121 Kinetics of the overall process
The overall kinetics of the process can be summarised by five steps It
must however be noted that at times some of these steps are not present
The steps are
Step 1 Diffusion of reactants through the Nernst diffusion
layer a 1 iquld film surrounding the catalyst
particle to the outer surface of the catalyst
4
Catalyst preheated Catalyst oreheated
in H at 500degCin air at 500degC
100100
9090
so80
7070
Oxides Ot V Cr Mo ~ Mn Fe Co Ni 6060
50so
ao40
SiOmiddotdAlzO 3030 1 [
Oxides ot V Cr Mr Fe Co Ni 2020 [ 10
Group I-IV
1 Oxides Ot Na Cu Ag M3 Zn Ba ICe Ti Z r bull
Pb Th
10
[ 00
Fig 12 Ranges Ot conversion tor polymerisation Ot oropene on metal
oxide silica alumina catalysts 4 ~t~ metal oxide impregnated on
support
5
Step 2 Penetration and diffusion of the reactants through
the blanket of graphitic carbon andor hydrocarbon
deposits to the internal surface and into the
unreacted core
Step 3 Reaction of the reactants at an active site
Step 4 Diffusion of the products through the unreacted core
and the blanket of graphitic carbon andor
hydrocarbon deposits back to the outer surface of
the solid
Step 5 Diffusion of the products through the fluid film
back into the main body of the fluid
The resistances of the different steps usually vary greatly from one
another The step with the highest resistance is considered to be the
rate controll ing step This rate controll ing step can often be
identified via simple tests (see Levenspiel 1972)
For optimum catalyst util isation a high matrix diffusivity is
desirable At any given condition if the rate of chemical reaction is
higher than the rate of diffusion reactants cannot be supplied fast
enough to the active site to establish an eQuil ibrium concentration The
reaction therefore oCcurs only in the outer shell of the catalyst
particles and a significant number of active sites inside the particle
are unused Large matrix diffusion resistance therefore results in
molecules reacting before they penetrate into the interior of the
catalyst particle The rate is then controlled by either film diffusion
or the rate of chemical reaction on the active surface whichever is the
slower step
The overall reaction rate is also influenced by the reaction
temperature The rate of diffusion however increases at a slower rate
than that of the chemical reaction and so at high temperatures pore
diffusion or film diffusion becomes the rate controll in9 step
Insufficient agitation and a hi9h viscosity of the solution can result
in large film thickness and hence favour a film diffusion controll in9
mechanism
6
122 Polymerisation
To date the most widely accepted mechanism for the polymerisation of
olefins is that proposed by Whitmore (1934) and involves the carbonium
ion One of the most pronounced characteristics of acid catalysed
reactions involving the carbonium ion is the lack of specificity
(Langlois 1953l Almost never is only a single product formed and even
under the mildest conditions a large number of compounds are formed
Schmerling and Ipatieff (1950) have distinguished two classes of
polymerisation true polymerisation in which the reaction prodycts are
mono-olefins with molecular weights intergral multiples of the monomer
molecular weight and Conjunct polymerisation in which the reaction
products are a complex mixture of olefinSt diolefins paraffins
naphthenes cyclo-olefins and aromatics Both will now be discyssed in
deb i 1
1221 True polymerisation
The carboniYm ion is formed in the presence of a hydrogen acid by the
addition of a proton to the electron pair of the double bond ie bull
H H H H H H C C C H2 + HX+ - gt H C C C H + X- ( I )
H H H
It is not proposed that a free alkyl carbonium ion exists in the
hydrocarbon solytion but that it remains within a short distance from
the anion of the catalysts and that the two exist in the form of an ion
pair (Langlois 1953) As the degree of separation of the carboniym ion
from the Bronsted site is of no importance in the explanation of the
reaction mechanism it is sufficient to postulate the existence of an
alkene with a positive charge on a particular carbon atom The term
carbonium ions will be ysed in subseQuent discussions and represented as
shown in eQyation (I) above without showing the anion although its
presence somewhere near the pOSitive charge IS to be ynderstood
(Langlois 1953)
The halide catalysts are aCidic only in so far as they are electron
acceptors Hunter and Yohe (1933) postulated that the active complex in
the absence of hydrogen halide oromoters is formed by the addition of
the catalysts to the olefin In this way the metal hal ide functions in a
manner similar to that of a proton and may be considered to be an aCidiC
catalyst (Schmeling and IpatieH 1950gt
7
Cl H H Cl H H
Cl Al + CC -) Cl Al CC+ (II ) ~ ~
Cl H H Cl H H
It has however been found that the halide catalyst requires a coshy
catalyst such as water tert-buty1 alcohol or acetic acid all of which
contain an active proton to be active for polymerisation Fontana and
Kidder (1948) found that the polymerisation of propene on a halide
catalyst was approximately proportional to the concentration of the
promotor used which was confirmed by Norrish and Russel (1952) who found
that in the polymerisation of isobutene with stannic chloride a Coshy
catalyst such as water was necessary that the rate of reaction was
proportional to the concentration of the co-catalyst and that the
maximum rate was achieved when water and stannic chloride were present
in eQuimo1ar proportions
It is thus probable that the reactions proceed throu~h an intermediate
from the reaction of the olefin metal hydride and promotor with the
latter servin~ as the source of the proton necessary for the production
of the carbonium ion viz bull
R-CH=CH2 + BF3 + H20 (-) R-CH-CH3 + BF30Hshy (II I) +
It appears that reaction (II) does not oCCur to any appreciable extent
or if it did that the resu1tin~ complex would not have any appreciable
activity for the initiation of po1ymerisation It is probable
therefore that in all cases the effective catalyst for the acid
cata1ysed po1ymerisation of olefins are acids In the more restricted
sense that they must be able to supply a proton to initiate the reaction
(Lan~lois 1953)
Of the olefins of low molecular weisht isobutene is polymerised the
most readily with acid catalysts N-butene and propene are polymerised
less readily while ethene is polymerised only with difficulty From
this and information drawn from the composition of the reaction
products ~hitmore (1934) reached the conclusion that a tertiary
carbonium ion is the most stable a secondary ion less stable and a
primary ion least stable Evans and Polanyi (1947) calculated proton
affinities of the doubly bonded carbons in isobutene propene and
ethene Their calculations showed the proton affinity of the primary
carbon of the double bond to be in the order isobutene gt propenegt
ethene and furthermore that the proton affinity of the primary carbon of
the double bond is sreater than that of a secondary or tertiary carbon
8
of the double bond for the cases of propene and isobutene These
calculations confirm the early empirical observations In accordance
with this concept we should expect the followins carbonium ions fro~
isobutene and propene
(probable)
and
(probable)
The possibil ity of the formation of minor quantities of the two less
favoured isomers cannot be excluded particularly at hish temperatures
but the species indicated should be the predominant ones Whitmore
(1934) postulated that a carbonium ion once formed may underso a
variety of reactions
Addition of a nesative ion X with the net result beins the addition of
HX to the double bond
R-CH-CHJ + X- (-) R-CH-CHJ + X
Addition to the double bond of an olefin to form a new carbonium ion
this is the polymerisation step
R-CH-CHJ + CH2=CH-R (-) R-CH(CHJ)-CH2-CH-R + +
Elimination of a proton to form the oriSinal olefin or a different one
R-CH(CHJJ-CH2-CH-CHJ +
R-CH(CHJ )-CH=CH-CHJ + H+
Migration of a proton with its bonding electrons from another carbon to
the atom deficient in electrons leaVing a new carbonium ion
9
CHJ-CH(CHJ)-CH-CHJ (-) CHJ-C(CHJ)-CH-CHJ + +
Mi~ration of a methyl ~roup with its two electrons to the positive
carbon atom generating a new carbonium ion with a new skeletal
arran~ement
CHJ-C(CHJ)2-CH(CHJ)-CH-CHJ (-) CH3-CCH3 )-CH(CHJ)-CH(CH3)-CH3+ +
Extraction of hydro~en from another molecule to form a saturated
molecule and a new carbonium ion
RH + R (-) R + RH + +
All the above reactions are indicated to be reversible but the
reactions may not oCcur at similar rates Usually one will be favoured
over the other
1222 Conjunct polymerisation
Conjunct polymerisation that is polymerisation accompanied by the
formation of saturated hydrocarbons oCCurs only under specific
conditions such as at high temperatures and over highly acidic
catalysts Evidence in support of a carbonium ion mechanism to explain
the formation of conjunct polymers was obtained by Bartlett et a1
(1944) The mechanism involves the removal from the oligomer of a
hydrogen atom with its bonding electrons by the carbonium ion The
mechanism may be illustrated as follows
R-CH2-CH2-CH=CH-R + H+ (-) R-CH2-CH2-CH-CH2-R +
R-CH2-CH2-CH-CH2-R + R-CH2-CH2-CH=CH-R lt-)+
R-CH2-CH2-CH2-CH2-R + R-CH2-CH-CH=CH-R +
R-CH2-CH-CH=CH-R (-) R-CH=CH-CH=CH-R +
For conjunct polvmerisation the si~nificant reaction steos are
- initiation by proton addition
- propa~ation by olefin addition
10
- chain termination by proton expulsion
- chain termination by proton transfer
- chain termination by addition of hydride ion
- depolymerisation to same or chain length other than that of the
or i gin a 1 olefin t
- isomerisation
- hydrogen exchange
- cyclysation equivalent to self-alkylation or self shy
polymerisation and
loss of hydride ion
123 Polymerisation on silica alumina
1231 Nature of active sites on si1 ica alumina
Si1 ica a1uminas differ widely in properties and have been the subject of
much research (Mizuno et a1 bullbull 1976 Finch and Clark 1969 Peri 1976)
The nature of the active sites in the polymeric olefin formation is
controversial because of the lack of conclusive evidence
Ozaki and Kimura (1964) speculated that the olefin chemisorbed on Lewis
acid sites as a monomer Hirschler (1970) concluded that Bronsted acid
sites were the active sites over sil ica alumina on the basis of the
similarity in composition of polymeriC species formed over sil ica
alumina and those formed over deammoniated Y-zeol ite On the contrary
Weeks et a1 (1974) concluded that the active sites were Lewis sites
formed upon dehydroxylation Ot Y-zeolite because no signitlcant
difference was found between products over deammoniated and
dehydroxylated zeolites Peri (1976) regarded an alpha site a pair
consisting of a Lewis site and an oxide ion to be active Holm et al
(1959) and Sato et a1 (1965) reported that propene po1ymerisation at an
elevated temperature varied in proportion to the Bronsted acid content
However objections have been raised to their determination Ot the
Bronsted acid content (Forni 1974) Mizuno et a1 (1976) on the other
hand showed that the catalytic activity tor the polymeric oletin
tormation declined sharply as the extent ot selective poisoning Ot the
Lewis acid sites increased
1232 Structure Ot the products and proposed mechanism on SIlica
alumina
Silica-alumina has a low activity tor the oligomerisation of propene at
low reaction temperatures the main product being propene trimers
11
The mixture of propene dimers formed on sil ica-alumina was characterised
by Feldblyum and Baranova (1971) and found to contain a relatively high
content of 4-methyl-2 and 4-methyl-1-pentene According to the carbonium
ion mechanism as postulated by Whitmore (1934) these are the primary
dimerisation products which isomerise into the thermodynamically more
stable methylpentenes
(CHJgt2-CH + CH2=CH-CHs (-) (CHS)2-CH-CH2-CH-CH3 + +
(CHl)2-CH-CH2-CH-CHl +
(CHl)2-CH-CH-CH2-CHl +
(CHl)2-C-CH2-CH2-CHl +
The 23-dimethylbutenes may form on sil ica alumina either as a result of
the skeletal isomerisation of the 2-methyl-3-pentyl cation as suggested
by Shephard et al (1962) or by the irregular (anti-Mrkovnikov) addition
of the isopropyl cation to propene as suggested by Fe 1 db 1yu m an d
Baranova (1971) The second route is more 1 ikely since skeletal
isomerisation of the isohexene cation should lead with even greater ease
to the production of 3-methyl pentenes which are however practically
absent from the mixture of propene dimers
Fe1dblyum and Baranova (1971) further sugsested that hexenes are formed
over sil ica alumina catalyst via the anomalous addition of a proton to
propene That the main reaction product on si 11ca alumina is a propene
trimer was explained by Feldb1yum and Baranova (1971) by suggesting
that the initially formed 4-methyl-2-pentyl cation rapidly isomerises to
the more stable tert-2-methyl-2-pentyl cation and the rate of the
reaction of the latter with propene is higher than the rate of
12
desorption of the dimer from the active center of the catalyst At the
same time the reaction of the 2-methyl-2 pentyl cation with propene
should lead to the formation of the propene trimer with a 44 dimethyl
heptane carbon skeleton This was found to be the case by Fe1db1yum and
Baranova (1971)
It can thus be seen that the silica alumina carrier leads to the
oligomerisation of propene by a carbonium ion mechanism as proposed by
Whitmore (1948) with the product being a propene trimer
124 Po1ymerisation on nickel oxide sil ica alumina
1241 Nature of active sites on nickel oxide sil ica alumina
Hogen et a1 (1955) established that hexenes and methyl pentenes were the
main products formed during the oligomerisation of propene under the
influence of nickel oxide on si1 ica alumina While explaining this
observation from the standpoint of the carbonium ion mechanism Hogan et
a1 (1955) at the same time admitted that the reaction mechanisms
differed substantially from that found in the usual acid catalysts It
was proposed by Ushida and Imai (1962) that two types of protonic acid
centers existed and they ascribed the observed product selectivity to
the isomerisation of the olefin over the protonic acid site attached to
the aluminium Imai et a1 (1968) however proposed that 3-methy1-1- and
3-methyl-2-pentenes were formed via a cyc10 butene intermediate At the
conditions used by Imai et a1 (1968) ie a temperature of 200 C
skeletal isomerisation of the primary oligomers was entirely possible
At lower reaction temperatures eg 64C as used by Feldblyum and
Baranova (1971) 3-methyl-pentenes were hardly formed The dimerisation
reactivity of ethene propene and 1-butene under the influence of nickel
oxide on si1 ica alumina was established by Ozaki et a1 (1968) to vary In
the ratio of 100101 Le in an order opposite to that which occurs
on typical acidic catalysts This was explained by them via the
existence of hydrogen atoms on the catalyst surface The hydrogen atoms
were capable of adding to the olefin to form free radicals which are
then involved in the dimerisation According to Ozaki et al (1968) the
role of the acidic carrier is unimportant Schultz et al (1966) examined
the dimerisation of propene in the presence of Cobalt oxide on a nonshy
acidic carrier activated charcoal A positive result was obtained with
cobalt oxide while nickel oxide on the same support was inactive
In view of the foregoing the nature of the products from the
01 igomerisation of propene under the influence of nickel oxide on silica
13
alumina is discussed in greater detail below to deepen our understanding
of the reaction mechanism and the active sites
1242 Structure of the products on nickel oxide si1 ica alumina
The deposition of nickel oxide on silica alumina changes the selectivity
of the catalyst the preferential product now being a propene dimer The
high content of hexenes in the resultant dimer is not due to the
occurrence of isomerisation or to the greater tendency of the methyl
pentenes as opposed to that of the hexenes to react turther but was
ascribed by Feldblyum and Baranova (1971) to be a characteristic
feature of nickel oxide on silica alumina catalysts) when used tor the
dimerisation of propene
There exists a close analogy in the mechanism as shown in Table 11
(Feldblyum et al bull 1974) between homogeneous catalysis based on nickel
salts and organoaluminium compounds and heterogeneous catalysts based
on nickel oxide on an aCid carrier The similarity in the mechanisms is
based on the proposal that during the dimerisation of the olefins on the
oxides of group VIII metals) a complex hydride is formed In the case of
nickel oxide the source of the active site is assumed to be an
unusually low degree of oxidation at a defect site in the nickel oxide
crystal lattice The dimerisation of propene catalysed by the complex
hydrides of the transition metal (HM) should lead to the formation of 4
methyl-1shy and 4-methyl-2-pentenes as the primary products with
subsequent isomerisation as shown below
CHJ-CH=CH2 + HM -) (CHJ )2-CH-(M)
l CHJ-CH2-CH2-(M)
(CHJ h -C=CH-CH2 -CHJ + HM
+ HM
14
Tab 1e 1 1 Anal09Y in the mechanism of the catalytic action of
homogeneous and heterogeneous system for the dimerisation of
olefins
Catalyst Homogeneous Heterogeneous
mechanism (N i Ch -R A 1 C 13 - ) (NiO-Si02-AhOl)
Structure of
active site
Path of the
format ion of
active site
Initiation
sta3e of the
reaction
Propa3stion
sta3e of the
reaction
Cata 1yst
re3eneration
step
Reasons for
termination
of reacti on
HNiClmiddotRA1Cll-
Reaction of NiCl
wit h R A1C13 - bull
12-Cis-addition
of HNiCl to the
olefin
Entry of a
Co-oord inated
olefin at the
nickel-carbon
lt1 bond
Cis-el imination
of an ole fin
from HN i C 1
Thermal decomshy
posH ion and
reduction of
HNiCl
HNi(Q)n-t on silica
Alumina
Reduction of Ni(O)n
and reaction of
Ni(O)n-t with the
olefin
1 2-C is-add it ion
of HNi (0)-1 to
the olefin
Entry of a
co-ordinated
olefin at the
nickel-carbon
lt1 bon d
Cis-el imination
of olefin to
form HNi (0)n-1
Reducti on of
HNHOln-t to
metal
15
The formation Of hexenes is explained by an alternative route in the cis
12 addition Of HM to propene
1
With the addition Of a third propene molecule at the nickel carbon sigma
bond trimers (C9) with a carbon skeleton Of 24 dimethyl heptane and 4shy
methyl-octane were expected to form This was Confirmed by Feldblyum
and Baranova (1971)
The absence Of olefins with a 44-dimethyl-heptane carbon skeleton in
the propene trimer formed under the influence Of nickel oxide on si~ica
alumina rules out the possibil ity of the reaction Of tert-hexy1
derivatives of the transition metal with propene and this results from
their instability This accounts for the dimerising action of the
catalyst
From the structure of the products formed and the analogy between
homogeneous catalyst based on nickel salts and organoaluminium
compounds and heterogeneous catalysts based on nickel oxide on si1 ica
alumina it must be supposed that complex hydrides of the transition
metal are responsible for the catalytic actions of nickel oxide silica
alumina in the oligomerisatlon of propene
125 ThermodynamiCs
Figure 13 shows the free energy changes which occur during the
dimerisation Of C2 to Co mono-olefins as a function of temperature The
free energy change for the dimerisation of ethene to 1-butene is much
lower than the dimerisation of the other 1 ight olefins (Ublad et alJ
1958)
16
The dimerisation of terminal bonded olefins eg bullbull propene to isomers
of corresponding higher olefins at a given temperature is much more
favourable than that for the dimerisation to the hi9her terminal olefin
-200
-150
-J- 10 0a U c -60
Lshy 00
(I
Ishy 50 -J W 0 100
150
200
2000 4000 6000 6000 10000
TEMPERRTURE K FIG 13 FREE ENERGY CHRNGE DURING DIMERISRTIBN
as shown in Figure 14 Hence the equil ibrium conversion of an alpha
olefin to a higher alpha-olefin will always be less than the
corresponding conversion of an alpha-olefin to an iso-olefin
Dimerisation of beta-olefins or iso-olefins to corresponding higher
olefins will be similar to the alpha-olefin-alpha-dimer relationship
Dimerisation of beta olefins or iso-olefins to higher alpha olefins will
however always be the least ravourable reaction (Ublad et al bull 1958)
Figure 15 shows the effect of pressure on the dimerisation eQuil ibrium
The relationship shown is that or the product of the equil ibrium
constant and reaction pressure in atmospheres to the percentage
Conversion for any dimerisation reaction
Figure 16 shows the rree energy change ror the formation of higher
olerins as a function or temperature ror the monomers propene and 1
butene respectively These rigures show that above 550C ror both
propene and 1-butene the reverse reaction ie bull cracking oCCurs
Clearly at higher temperatures the lower 01 igomers will predominate
whereas at low temperatures the higher polymers will predominate at
equilibrium (Oblad et a1 1958)
17
-200
-160
-J- 10 0 CI U ~ -60
LL 00
CI I- 60 -J W
100o
150
200
FIG
2000
14
4000 6000 6000 10000
TEMPERRTURE K FREE ENERGY CHRNGE DURING DIMERISRTIBN
shyi J
i I 100
It
s
V0
s
DUCltUTIH iquarlO
(01 n-(HMl ~91
0
bull
I
YIt 10 00
~ C OtNERS I n~~
FIG 15 CONVERSION OBTAINABLE IN OIMERISATION REACTIONS
18
-500
-400
-300 J aU-20 0
~ -100
LL 00
a 100 r shyJ 200W 0
300
400
500
2000 4000 6000 8000 10000
TEMPERRTURE K FIG 16 PBLYMERISRTIBN BF PRBPENE
13 Catalyst characterisation
131 Introduction
There are a number of advantages in depositing catalytically active
metals on a support such as alumina charcoal sil ica and silica
alumina The metal can be highly dispersed as small crysta1l ites
throughout the pore System of the support and as a result a large active
metal surface is produced relative to the weight of the metal used In a
pelleted granular or other physiCal form a supported metal catalyst
provides for flow of gases through the reactor and rapid diffusion of
reactants and reaction products through the porous catalist to and from
the active site (Boreskov 1976 Cervello et alJ 1976) The support Can
also improve dissipation of reaction heat retard the sintering of metal
crystallites with resultant loss of active surface and increase poison
resistance For these reasons supported metal catalysts are widely used
in chemical processing It must be recognised however that the support
may also have a catalytic role to perform and the resultant bifunctional
catalyst may have properties different from those of the support or the
metal alone
19
To achieve greater ynderstanding or the way in which good catalysts can
be prepared more inrormation is needed aboyt the errect or the synthesis
method and the stryctYre or the catalysts Both will now be discyssed in
detai 1
132 Catalyst synthesis methods
When a pOrOYB solid comes into contact with a liquid capillary rorces
or several hyndred atmospheres draw the 1 iQuid into the pores The
active component may then be adsorbed on the walls or the pore in which
case the method of preparation is described as adsorption rrom solution
or ion exchange Here the volyme or solytion ysed will be larger than
the pore volume of the sypport In other preparation methods where
adsorption is small the catalyst is prodyced by drying Oyt of the
support wetted with a solution of the active component and the term
impregnation is used (Maatman and Prater 1957) At a high degree or
loading greater than 5 ~ the above methods do not lead to unirorm
distribution viz unirorm location of the metal crystallites within
the support or uniform dispersion viz uniform size of the metal
crystallites throughout the support This can however be overcome by
starting from a mixture in which the constituents of the active
component and the support are mixed on an atomic scale U~der certain
conditions a precipitate will be formed with the active phase
atomically spread throughout the support This method of production is
termed co-precipitation and discussed in detai 1 by Holm et al lt1957gt
The factors affecting dispersion and distribution in the various
synthesis routes will now be discussed
1321 Preparation with adsorption
Catalysts are often made by immersing a porous support in a solution of
an active material Catalytic properties can be influenced by the amount
and distribution of this material on the internal surface of the support
which in turn depends on whether the active material (solute) or the
solvent adsorbs on the support and the fraction of pore volume
accessible to the solute In Figure 17 the Quantity of active material
found in different parts of a system consisting of an external solution
and a single pore which adsorbs activating material is shown for four
conditions Figure 17a shows the distribution of the active material in
the system when the solution reaches the end of the pore The
assumption is made that the rate of penetration and rate of diffusion of
the solute into the pore are slow compared to the rate of adsorption
All act i ve materia 1 in the penetrati ng 1 i qu i d thus adsorbs on the lola 11
20
c I o e
q
External No external Poresolution Pore solution
A Immediateh after fi 11 in B After it was filled and allowed to eltluilibrate
Dec 1 eted externalExterna 1
Pore solution Poresolution
C After equilibration in the 0 After external solution presence of an excess of depleted of solute but external solution before eQ-Jilibration
Fig 17 Conditions of a pore adsorbing actIvatIng material in solution
21
of the first part of the pore The 1 iauid which passes further into the
pore contains no active material If at this time the solvent is removed
from the pore by dryin9 the active material is found only in the part
of the pore nearest to the external solution If instead of dryin9 the
catalyst at this time the pore is simply removed from the external
solution but left filled with 1 iQuid another phenomenon may be observed
If the active material can desorb at a reasonable rate redistribution
oCcurs by desorption and mi9ration by diffusion This ultimately results
in a uniform distribution of active material within the pore as shown in
Fi9ure 17b This process can be used in catalyst preparation if the
rate of desorption is rapid enou9h If the pore is however left in
contact with the external solution additional active material is
supplied by the external solution by diffusion to the adsorption sites
until either equilibrium with the external solution is reached brin9in9
about a uniform distribution as shown in Figure 17c or the external
solution is depleted of active material before the distribution is
uniform as shown in Figure 17d (Maatman and Prater 1957)
It can thus be seen that the amount of active material found in a porous
support can be much larger than that contained in the original pore
volume of liquid penetratin9 the support If on the other hand the pores
are accessible to the solvent but are too small for the solute to enter
or if the solvent is adsorbed in preference to the solute the Quantity
of active material may be extremely low
1322 Drying of adsorbent solids
In the case of an adsorbent solid the dryin9 process is not expected to
alter the distribution of the active material since it is adsorbed to
the sol id However if the adsorptive properties of the material were to
alter during heating and prior to evaporation of the solvent as by
thermal decomposition to a soluble species which does not adsorb on the
support the distribution of the solute would be markedly altered This
condition is discussed below
1323 Preparation without adsorption
In this case a porous support is submerged in a solution containing the
active material and the metal salt is drawn Into the pores by capillary
forces The solvent is then evaporated and the salt decomposed by
calcination or reduction The metal content can be calCulated from the
Concentration of the solution
22
For impregnated type catalysts Dor1ing et al (1971) predicted that up
to a certain metal content the number of crystallites would increase
the mean crystallite size would vary slowly and the metal area would be
approximately proportional to the metal content Beyond this metal
content the number of crystal1 ites would remain constant if only one
crystal formed in each pore during drying Hence the metal crystall ites
would increase in size and the metal area would be proportional to
(metal content)2J Dor1ing et a1 (1971) predicted that the crystallite
size distribution would reflect the pore size distribution of the
support
1324 Drying of non-adsorbed solids
As a result of evaporation of the solvent deposition of the solute
begins when the solution becomes saturated If all the liquid could be
evaporated instantaneously the active material would deposit locally and
uniformly throughout the support Evaporation however does not occur
instantaneously but starts at the outer periphery of the particles and
proceeds from regions of larger pore diameters to smaller pores This
uneven evaporation is the result of the higher vapour pressure of the
1 iquid in the larger pores while 1 iquid which evaporates from small
pores is replaced by liquid drawn by capillary action from the larger
pores as illustrated in Figure 18
A Before drying
B After some drying
Figure 18 Intersecting pores of diferent sizes before drying (A) and
after evaporation of some of the pore volume 1 iQUld (8)
23
Thus when drying proceeds slowly enough there is a tendency tor the
active material which is increasing in concentration as the liQuid
volume decreases to redistribute by diffusion into the remaining fluid
This results in an enrichment of the active material in the smaller
pores and towards the center of the particle (Maatman and Prater 1957)
133 Homogeneous decomposition deposition
It can be seen from the above discussion that producing a catalyst by
impregnation or ion exchange with high metal contents leads to the
formation of crystallites with non-uniform distribution and low
dispersion As an active supported catalyst system calls for a highly
dispersed particle with uniform distribution on a highly porous
thermally stable support such as silica alumina it would be desirable
to combine the high degree of penetration of the solute into the support
observed during impregnation with a controlled ion exchange-type
preCipitation The procedure studied by van Dillen (1976) for the
manufacture of highly dispersed nickel silica catalysts with uniform
distribution and a similar system used by Higley (1984) to produce
nickel oxide on silica alumina catalysts was investigated
In the case of this work a suspension of nickel nitrate hexahydrate and
silica alumina was prepared To preCipitate the nickel salt onto the
support the pH had to be lowered This was achieved by Hisley (1984) via
the injection of ammonium hydroxide and in the case ot this work by the
slow and homogeneous decomposition of urea The reason for using urea as
the source of hydroxyl ions as opposed to ammonium hydroxide is
discussed below A detailed disCussion of the synthesis procedure is
given in Section 363
1331 Theory Ot homogeneous decomposition deposition
When the concentration of a homogeneous solution is raised at a constant
temperature as shown by path A in Figure 19 the solubil ity Curve is
reached Crossing the solubil ity curve does not generally lead to the
formation of a preCipitate but to a metastable state When howeverthe
concentration on the solubil ity Curve is exceeded by a critical amount
nuclei of the preCipitate are spontaneously generated brinSins about
the transition to the eQuilibrium state The concentration where nuclei
start to develo~ s~ontaneously l~ homogeneous solutions IS indicated by
the supersolUbil tty Curve which is also shown in Figure 19 (Walton
1969) The fact that no preCipItate grows when the solubil ity Curve 13
crossed is due to the Considerable surface enerSY of very small
24
particles of the precipitate Thus raising the concentration of a
solution to the value on the supersolubil ity Curve leads to the
formation of a limited number of nuclei If the homogeneity of the
solution is maintained the concentration of the solution will remain
between that of the solubil ity and supersolubil ity curves where no new
nuclei can develop Therefore as a result of precipitation from a
homogeneous solution a small number of large particles of the
preCipitate are formed Pouring a precipitant into the suspension on the
other hand gives rise to an inhomogeneous solution as the concentration
will locally be increased far beyond that of the supersolubility curve
as shown by path B in Figure 19 This gives rise to the formation of a
large number of nuclei Before the concentration has decreased by
homogenizing the solution the nuclei have grown sufficiently to be
stable at the lower concentration Working with an inhomogeneous
solution therefore results in a relatively large number of small
particles (Cartwright et al 1967)
It was concluded by Hermans and Geus (1979) that pouring a preCipitant
into a suspension of a porous carrier leads to preCipitation of the
active material where the preCipitant enters the suspension and the
preCipitate will not develop uniformly over the surface of the support
PreCipitation from a homogeneous solution on the other hand proceeds
eQually in the pores of the support and in the bulk of the solution and
so el iminates the inhomogeneous addition of the preCipitate to the
support
In order to produce a catalyst with high dispersion and uniform
distribution a sufficiently stron9 Interaction of the preCipitating
compound with the support is neCessary This interaction must decrease
the nucleation barrier so that nucleation at the surface of the support
can proceed at a concentration between the solubil ity and
supersolubil ity Curves The preCipitate can then nucleate at the ~urface
of the support whereas nucleation in the bulk of the solution is
prevented In addition nucleation at the surface must be rapid to avoid
the growth of a small number of nuclei to large particles of the
preCipitate (Hermans and Geus 1979)
1332 Nickel oxide sil ica alumina preparation usinB homogeneous
decomposition deposition
Higley (1984) showed that incorporating nickel onto sll iea alumina by
the injeCtion of a hydroxide-containing solution (ammonium hydroxide)
25
CBMPBSITIBN FIG 19 PHRSE DIRGRRM
resulted in a catalyst active for the 01 igomerisation of olefins In
view of the above discussion however it seems likely that the
synthesis procedure developed by Higley (1984) resulted in a catalyst
with high dispersion but nonuniform distribution Using a homogeneous
system with the slow hydrolysis of urea as a source of hydroxyl ions as
developed by van Dillen et al (1976) for the preparation of nickel
sil ica catalysts the catalyst produced would have a high dispersion and
a uniform distribution of the metal crystal] ites throughout the support
134 Co-preCipitation
This method for preparing supported metal catalysts is usually
aSSOCiated with nickel 5i I ica catalysts The technique involves mixing
of the constituents on an atomic level under condition favouring
preCipitation The resulting catalyst is one where small crystals are
uniformly distributed throughout the catalyst matrix Subsequently this
type of catalysts can be made with nickel contents up to 20 wtX without
affecting Crystal size or distribution
w n )
fshya n w 0 L W f-
PATH A
26
14 PhysiCal characteristics or the catalyst
The properties which characterise a catalyst are shown in Table 12 and
discussed below
Tab 1 e 1 2 Characterisation or supported metal catalysts
Support Metal dispersion Nature or ac ti ve
properties and location component
Total area Total sur race Metal support
area interaction e9
Pore structure oxidation state
Meta 1 sur race
Surface chemical area
properties e9
surface aci dity Crystal size
distribution
Crystal size
an d 1 oC a t ion
141 Properties or silica alumina
1411 Surrace area
The surrace area or silica alumina is not only a runction or the alumina
content but also or the synthesis procedure used In the case or Coshy
precipitation used by Holm et a1 (1959) the surface areas ror the
entire ranse rrom pure alumina to pure si1 ica were consistently hisher
than that established by Ward and Hansrord (1969) tor an impregnated
catalyst The results obtained by both Ward and Hansrord (1969) and Holm
et al (1959) are shown in Figure 110 as are the results ror the
commercial catalyst used by Ward and Hansford (1969)
1412 Pore structure
Ramser and Hill (1958) studied the pore diameter dIstribution or a
commercial sil ica alumina catalyst usin9 nitrogen isotherms The results
obtained by them are shown in Table 13 No data was however available
as to the silica to alumina ratio of the catalyst used by them
27
800 shy
~ - 600 shyN ltl ~
bull a W
~=cePRECIPITATEO ()= IMPREGNATED eft =CeMMERC I AL
~
eft ~ () ~ ~
eft
400 -- ~a eft ~a efteft ~
~ ~
200 -r-I I I
I I200 300 400 600 600 700 800 900 1000 RLUMINR CBNTENT MRSS
FIG 110 SILICR RLUMINR SURFRCE RRER (Ma2GlVS ALUMINR CGNTENT (MRSS)
Table 13 Pore volume and size distribution of fresh catalyst and
adsorbents (Ramser and Hill 1958)
Catalyst Surface area Pore volume Average pore
code (m2 9 ) (cm3 19) radius (A)
Commercial
Silica
Alumina
Alumina
Silica
5421
5002
4620
1666
7712
0585
0608
0619
1142
0426
157 plusmn 96
177 plusmn 108
179plusmn 126
30 1 plusmn 568
105 plusmn 43
29
1413 Surface acidity
Holm et a1 (1959) using a butylamine titration techniQue as proposed by
Tame1e (1947) determined the total acid content of a co-precipitated
silica alumina catalyst They also determined the Bronsted acid content
of the catalyst using a base exchange reaction via ammonium acetate In
this way the Lewis acid content of the support could be estab1 ished The
results obtained for the entire range from pure ail ica to pure alumina
are shown in Table 14
Tab 1 e 1 4 Acid content (total and Bronsed) for sil ica alumina heat
treated at 550degC
Alumina Protonic acid Tota 1 ac i d Acid strength
content content content index
(wt~) (meQg) (meQg) (K)
100
925
92
85
60
45
30
18
10
5
2
0
000
006
004
007
019
034
045
080
077
061
038
013
014
043
041
039
042
046
040
040
040
031
003 approx
2310- 7
4710-amp
1110-)
3910-)
6110-)
1410- 4
2410- 4
2510- 4
1110-)
142 Properties of nickel oxide on sil ica alumina
1421 Total surface area
The total surface area of nickel oxide on silica alumina was examined by
Holm et al (1957) for an impregnated and a Co-precipitated catalyst The
sil ica to alum1na weight ratio was held constant at 9 to 1 throughout
The results obtained as a function of nickel loading are given in
Table 15 Ushida and Imai (1962) using a co-precipitated nickel oxide
si 1 ica alumina catalyst with the nickel content fixed at 4 wt but
varYing the alumina content from 0 to 46 wt also measureJ the surface
29
area of the catalyst Their results of surface area as a function of
alumina content are shown in Table 16 In an independent study Imai
and Ushida (1965) measured the surface area of a nlckel oxide on silica
alumina catalyst with a fixed alumina content of 43 wt~ varyins nickel
content These results are shown in Table 17
Table 15 Surface area of nickel oxide sil ica alumina prepared by
impregnation and coprecipitation as a function of nickel
content the si1 ica to alumina weisht ratio of 91
Sinthesis Nickel content Surface area
technique (wU) (m2 IS)
Impregnated
Coprecipitated
085
1 71
315
1080
073
254
448
830
1726
3782
6026
300
300
300
253
373
374
388
248
259
302
219
1422 Metal surface area and crystal size
The metal surface area of an impregnated nickel oxide on synthetlc
zeolite was examined by Brooks and Christopher (1968) using hydrogen
chemisoptlon and the average nickel crystallite size usin9 X-ray
diffraction line-broadenins They found that the nickel areas estimated
from H-z chemisorption and from averase nickel crystallite size
determined by X-ray diffraction line-broadening were In soad agreement
The results obtained by them for a series of supports and nickel loadins
are shown in Table 18
30
Table 16 Surface area of nickel oxide sii ica alumina as a function of
the alumina content Nickel content held constant at 61
wtX
Alumina content Surface area
(wtX) (m2 19)
00
28
51
96
292
490
275
338
360
281
138
181
Table 17 Surface area of nickel oxide silica alumina as a function of
nickel content Alumina content was held at 43 wtX
Nickel content Surface area
(wtX) (m2 19)
00
251
498
744
987
283
344
355
368
344
1423 Pore volume and size distribution
The pore volume and average pore radius was examined by Uchida and 1mai
(1962) for a catalyst with a fixed nickel content but varying alumina
content and by 1mai and Uchida (1965) for a catalyst with a fixed
alumina content of 43 wt~ but varYing nickel content The results
obtained by them are shown in Tables 19 and 110 respectively
31
Table 18 Nickel metal area from H2 chemisorption
mmH9 H2 vapour pressure and from X-Ray
broadenin9
at 250degC and 100
diffraction lineshy
Catalyst Nickel Total nickel area X-ray line broad
code content H2 chemisorption Diameter Area
(3Ni9cat) (m2 bull Nif 3 cat ) (A) (m2 bull Nilg cat)
G56-1 0145 48 155 60
G56-2 0131 42 175 48
G56-3 0071 19 715 06
NiDavZ14 0059 27 185 20
Nileolon 0032 07 680 03
Table 19 Pore volume and radius of a nickel alumina catalyst with
varyin9 alumina content Nickel content held at 4 wt~
Alumina Pore volume Avera3e pore
content (cm3 3) radius
(wU)
000
863
1752
2670
3617
4595
0518
0349
0349
0349
0387
0416
384
253
357
484
477
468
1424 Metal support interaction
The valence of nickel oxide on sil ica alumina was measured by Holm et al
(1957) using hydrogen reduction as proposed by Hill and Selwood (1949)
They found that no abnormalities existed with regard to the chemical
valence of nickel in either the co-preciPitated or impre3nated
catalysts These results were confirmed by Ushida and Imai (1962) who
32
however reported that for catalysts with an alumina content higher than
86 wt or lower than 26 wt the valence of nickel was slightly higher
than two The slight valence increase in the case of higher aluminum
content could be explained since the larger the aluminum content the
larger the amount of nickel oxide which could be combined with alumina
Table 110 Pore volume and radius of a nickel oxide sil ica alumina
catalyst with varying nickel content Alumina content held
at 43 wt throughout
Nickel Pore volume
content (cmJ 9)
(wU)
000
251
498
744
987
037
040
038
040
036
15 Catalyst polymerisation properties
151 Silica alumina properties
1511 Effect of sil ica to alumina ratio
The propene polymerisation activity was examined by Holm et al (1959)
for a coprecipitated silica alumina catalyst with varying silica
content The catalyst was activated by drying in air at a temperature of
550C for 16 h and the po1ymerisation activity determined by passing
propene over the catalyst while raising the temperature from 30 to
300middotC The maximum conversion obtained for each activation temperature
was considered to be indicative of the po1ymerisation activity The
results obtained by Holm et a1 (1959) showed that a catalyst With a
silica to alumina weight ratio of 7 to 1 was the most active for the
polymerisation of propene Johnson (1955) examined the polymerisation
activity Of propene at 200C for an impregnated ail ica alumina catalyst
with varying silica content and found that for a catalyst dried at
200C the optimum sll ica to alumIna weight ratio was 9 to 1 Tamele
(1950) also workIng at 200C and uSing a catalyst dried at 500middotC
reached the same conclusion as Johnson (1955)
33
1512 Eftect ot reaction temperatures
Silica alumina required temperatures higher than 200C to be active tor
the polymerisation of propene (Takahashi et a1 bullbull 1972) This was also
shown by Fe1db1yum and Baranova (1971) who working at 64C recorded
a conversion ot only 6~ The dependence Ot temperature tor propene
po1ymerisation over ail ica alumina was investigated by Takahashi et a1
(1972) in a t10w through system at a pressure Ot 50 atm The results
obtained by them are shown in Table 111
Tab 1 e 111 Propene 01 igomerisation on silica alumina at a constant
pressure of 50 atm and varying temperature Silica to
alumina ratio used was 94 to 3 throughout
Reaction Propene
temperature conversion
(OC)
200 126
250 407
300 641
350 679
1513 Ettect of space velocity
The relationship between the space velocity and po1ymerisation activity
expressed in terms of propene conversion was examined by Takahashi et
a1 (1972) tor a catalyst with a sil ica to alumina weight ratio Ot 9 to 1
at a temperature of 200degC and a pressure Ot 50 atm The results obtained
show that an inverse relationship exists between space velocity and
propene conversion
1514 Product spectrum
At the temperatures needed in the presence of silica alumina for propene
po1ymerisation dimerlsation is a minor reaction with the main product
being the propene trimer The effect Ot temperature on the product
spectrum at a pressure Ot 50 atm with a catalyst having a silica to
alUmlna ratio of 94 to 3 as established by Takahashi et al (1972) is
shown in Table 112 as are the results of Feldb1yum and Baranova
( 1971gt
34
Table 112 Product distribution of propene 01i90merised over silica
alumina as a function of temperature Reaction pressure is
50 atm
Researcher Feldblum and Takahashi et al (1972 )
Baranova ( 1971gt
Silica to 91 943
alumina ratio
Reaction
temperature 64 200 250 300 350
( degC )
Propene
conversion 6 126 407 641 679
(wtX)
Product
spectrum
Dimer (Co) 15 88 159 233 285
Trimer (C ) 756 438 362 307 231
Tetramer+ (Ct2+ ) 94 448 448 436 455
1515 Effect of activation
Holm et al (1959) examined the propene polmerisation activit of a
catalyst with a silica to alumina wei9ht ratio of 9 to 1 as a function
of the activation temperature Activation was achieved by holdin9 the
catalyst at each temperature for 16 h under dry air The found that the
optimum activation temperature with regards to propene 01 igomerisation
was 550middotC
152 Nickel oxide sil ica alumina properties
1521 Effect of synthesIs procedure
The two methods available for incorporating nickel onto silica alumina
are impre9nation and Coprecipitation The exact synthesis procedure and
nature of the catalyst has been discussed previously Holm et a1 (1957)
examined the polymerisation activity of catalysts prepared by these
35
methods and concluded that for coprecipitated catalysts the maximum
propene polymerisation activity was approximately 50X greater than that
for catalysts prepared by impregnation
1522 Effect of metal content
Hogan et al (1955) using a commercial catalyst with a sil ica to alumina
weight ratio of 9 to 1 concluded that when the metal was loaded onto
the support by impregnation the most active catalyst for the
po1ymerisation of propene contained between 3 and 5 wtX nickel Holm et
a1 (1957) using a co-precipitated and impregnated nickel oxide on
silica alumina catalyst establ ished that for both methods of loading
the maximum polymerisation activity per unit volume was also obtained
for a catalyst holding between 3 and 5 wtX nickel Takahashi et al
(1969) using a Commercial silica alumina with an alumina content of 13
wtX showed that for an impregnated catalyst a nickel content of 13 wtX
was optimum for the conversion of propene To maximize the yield of
propene dimer however the optimal nickel content was found to be 97
wtX When a co-precipitated as opposed to impregnated catalyst was
used Takahasi et al (1969) found that a nickel content between 3 and 5
wtX gave the optimum results for propene dimerisation
1523 Effect of reaction temperature and pressure
Hogan et a1 (1955) showed that when the reaction temperature was varied
from 35 to 130middotC the rate of reaction was highest in the ran~e of 70C
to 93middotC with a sharp dec1 ine in conversion when the pseudo-critical
temperature of 96C of the feed was exceeded and the system was
essentially in the vapour phase They concluded that the optimum
reaction conditions for the dimerisation of propene were a temperature
of 70C and a pressure of 40 atm Takahashi et a1 (1969) also examined
the effect of temperature and pressure with respect to propene
conversion and dimer yield and concluded that as long as the system
remained in the 1 iQuid phase the formation of dimers dominated with a
shift to heavier products as soon as the system moved into the vapour
phase The optimum conditions for the dimerisation of propene according
to Takahasi et a1 (1969) were a temperature of 70 to 80C with the
pressure ranging from 30 to 35 atm The above conclusions can easily be
represented graphiCally as shown in Figure 111
1524 Effect of feed composition and space velocity
Takahasi et al (1972) found that when pure propene was fed the surface
temperature of the catalysts rose far above the set reaction
temperature Consequently although the system was essentially in the
36
1000
~ (fJ 800 (fJ
II L
600 Z CJ t--I
(fJ 400 []
a w gt z CJ 200 U
00
[]
00 200 400 600 800 PRESSURE RTM
FIG 111 PRBPENE CBNVERSIBN (MRSS) VS PRESSURE (RTM)
1 iQuid phase a vapour phase reaction was taking place at the surface of
the catalyst with a corresponding shift to heavier products and rapid
deactivation of the catalyst It was therefore necessary to use a
mixture of propene and an inert diluent such as propane which served as
a heat sink and so controlled the catalyst surface temperature Hogan et
al(1955) varied the propene concentration in the feed from 7 to 37 vol~
at space velocities of 2 4 and 8 and concluded that the rate of polymer
production increased 1inearly with propene concentration A first order
relationship between propene concentration and rate of polymer formation
was obtained Hogan et a1 (1955) did not indicate how dimer selectivity
was affected as a function of feed composition Takahashi et al (1969)
using a 217 to 1 mixture of propene to propane wIth trace impurities
of ethane ethene and butenes concluded that the optimum space velocity
for the production of a propene dimer at the conditions of temperature
and pressure discussed earl ier was 750 g of propene per 1 iter of
catalyst per hour
1525 Effect of feed impurities
Hosan et a1 (1955) stated that the catalyst became deactivated if
allowed to absorb as 1ittle as 05 wt~ moisture This type of
contamination was however totally reversible Other impurities such
37
as acetelyne and carbon monoxide acted as severe poisons to nickel
oxide silica alumina while oxygen sulphur compounds and butadienes had
only a moderate poisoning effect The poisoning effect of these
materials was apparently not reversible as the catalyst did not
regenerate to any extent after removal of the contaminant from the feed
Takahashi (1969) on the other hand stated that the Scientific Design
Company had shown that by introduCing water or alcohol with the feed
the conversion of propene could be doubled without affecting
dimerisation activity
1526 Effect of activation procedure
The activation time temperature and gas flow rates were examined by
Takahashi et a1 (1969) with respect to acidity structure and propene
dimerisation activity of the catalyst They found when using 200 ml of
catalyst that a space velocity of 100 h- 1 of dry air at a temperature
between 500 and 600C was optimal and that the activity of the
catalysts increased with inCreasing activation time up to 5 h above
which the activity did not change Three distinct temperature regions
were identified by Takahashi et a1 (1969) between 300 and sOOmiddotC
physisorbed water was removed between 500 and 600middotC the concentration
of protoniC sites was highest and above 600 G C Lewis sites were formed
which could not be hydrated back to Bronsted sites
1527 Effect of regeneration
The po1ymerisation activity of the nickel oxide sil ica alumina catalysts
declined at a rate determined largely by the amount and type of
impurities in the feed and eventually regeneration was required (Hogan
et a1 bullbull 1955) The regeneration procedure was to strip the catalyst free
of hydrocarbon vapours and preheat it to a combustion temperature (about
400C) with dry inert gas The small amount of residual deposits were
then burnt off in dry air at 500C and the catalyst cooled under dry air
(Hogan et a1J 1955) After repeated regeneration the nickel oxide
promotor underwent changes which caused the activity to decline The
catalyst could however be restored to its initial activity by wetting
with a nitric acid solution followed by a normal activation
1528 Product spectrum
Takahasi et a1 (1969) together with Hogan et a1 (1955) fOlJnd that the
reaction conditions had a large influence on dimer compOSition The
reslJlts obtained by Takahashi et al (1969) at variolJs reaction
conditions are shown in Table 113 The products obtalned by Hogan et al
(1955) for once through propene conversion uSing a catalyst with 4 wt~
38
nickel at 75middotC and 40 atm and the results of Feldblyum and Baranova
(1971) using a temperature of 64C and a pressure of 50 atm and a
catalyst containing 45 wtX nickel are also shown in Table 113 Hogan
et 81 (1955) working with fixed feed composition and reaction conditions
studied the effect of varying the space velocity on the product
spectrum The results obtained by Hogan et al (1955) are shown in Table
114
1529 Lifetime
Hogan et al (1955) examined the lifetime of an impregnated nickel oxide
sil ica alumina catalyst using a cracked gas containing 25 molX ethene
10 mol~ propene and 12 mol~ butenes with butane as liquid diluent A 100
h run was done by Hogan et al (1955) and data was obtained on conversion
and on the properties of the products in butene-butane recycle
operation The reaction conditions used were a temperature of 65 to 75degC
and a pressure of 34 atm with feed rates of 600 standard volumes of
cracked gas and 4 1 iQuid volumes of butane-butenes per hour per volume
of catalyst The catalyst used contained 4 wtX nickel with a sil ica to
alumina weight ratio of 9 to 1 Hogan et al (1955) showed that the
activity of the catalyst with respect to total olefin conversion after
100 h on stream dropped from 99 to 96X The average rate of polymer
production was 350 ghlmiddotcat The polymer composition by volume was 13~
pentenes 26~ hexenes 20X heptenes and 41X octenes through decenes
In an indepndent study Allum (1974) prepared a nickel oXide silica
alumina catalyst by first impregnating silica gel with aluminium and
then with nickel The final catalyst contained 145 wtX aluminium 036
wtX sodium and 07 wt~ nickel The catalyst which was activated for 4 h
at 550degC under dry nitrogen was used to 01 igomerise 1-butene in daily
batches at aodegc and 54 atm in a 3 1 rocking autoclave for 24 consecutive
days The activity of the catalyst decreased from 020 grams of product
per gram of catalyst per hour (1st day) to 014 grams of product per
gram of catalyst per hour (24th day) Of the liquid 01 igomers 65 wt~
were octenes on the first day which rose to 85 wtX octenes on the 24th
day
16 Conclusion
As can be seen from the above discussion nickel oxide on Silica alumina
catalysts prepared by impregnation and coprecipitation have been studied
in great detail The technique of homogeneous decompositlon depOSition
for incorporating nickel into sil iea alumina is a much simpler technique
than coprecipitation and it is hoped that the catalytic properties with
39
respect to lifetime selectivity and activity are comparable to if not
better than the properties of coprecipitated or impregnated nickel
oxide silica alumIna catalysts
Table 113 Relationship between product distribution and reaction
conditions
a) Takahashi et al (1969) sil ica to alumina wei9ht ratio of 87 to 13
nickel content 13 wt~
b) H09sn et al (1955) silica to alumina wei9ht ratio of 9 to 1 nickel
content 4 wt~
c) Feldblyum and Baranova (1971) silica to alumina weight ratio of 9
to 1 nickel content 45 wtX
d) Distillation cut off temperature
Temperature Pressure
(degc ) (atm)
) 65
SO
90-95
120
75
75
75
75
75
80
75-80
75
35
35
35
35
15
20
25
30
32
35
50
70
47S
465
380
230
185
246
305
401
520
465
430
435
335
3S0
340
3S0
210
250
280
310
270
350
340
250
97
95
190
260
395
350
300
150
140
95
135
220
22
18
24
98
137
90
36
66
28
18
30
25
b ) 75 40 720 190 60 30
c ) 64 40 77 2 202 26
40
Table 114 Propene conversion and product spectrum as a function of
space velocity sil ica to alumina ratio is 9 to 1
throughout
Conversion Space Ct2 Ct 5 +
(wtX) ve 1oC ity
53 2 777 160 61 24
68 4 737 200 70 32
83 8 656 210 88 64
41
17 OBJECTIVE OF RESEARCH
The aim of this study was to investigate the propene oligomerisation
properties of NiOSi02-A1203 catalysts synthesi~ed using three
different techniques impregnation Co-precipitation and homogeneous
decomposition deposition The effect of the following factors on the
activIty selectivity and 1 ifetime of these catalysts for propene
01 igomerisation were investigated
(i) Nickel content of catalysts
(ii) Reaction pressure and temperature
(iii) Weight hourly space velocity
(iv) Reactor temperature stabil ity and
(V) Propene feed moisture content
42
2 DESIGN OF ISOTHERMAL REACTOR
21 Introduction
In order to facilitate interpretation of reactor data it was important
that the reactor used in this study was as isothermal as possible
Various attempts have been made to achieve this Hogan et al (1955)
surrounded the reactor with an electrically heated jacket containing a
liQuid which was boiled at a temperature fixed by the pressure of an
inert gas applied to the top of the reflux condenser Imai (1968) on
the other hand inserted the reactor into a heated bed of iron powder
In the case of the present work a similar system was used to achieve
isothermal conditions A detailed description of the design of this
reactor will now be given
22 F1uidisation theory
If a fluid passes upward through a bed of solids at a low velocity the
pressure drop aCross the bed is the same as that for a downward flow As
the fluid velocity increases the particles become rearranged so that
they offer less resistance to the flow and the bed starts to expand
This process continues as the velocity is increased with the total
frictional force remaining eQual to the weight of the particles until
the bed has assumed the lowest stable form of packing If the velocity
is then increased further the individual particles separate from one
another and become freely supported in the fluid At this stage the bed
is said to be fluidised Further increases in fluid velocity cause the
particles to separate still further from one another and pressure
differences remain approximately eQual to the weight per unit area of
the bed The above phenomenon can be represented graphically if the
pressure drop across the bed is plotted against fluid velocity through
the bed using logarithmic co-ordinates
Thus in Figure 21 (Coulson and Richardson 1980) a 1 inear relation is
obtained on a log log scale up to the point where bed expansion takes
place (A) The slope of the curve then gradually diminishes as the bed
expands As the velOCity is increased the pressure drop passes through
a maximum value (B) and finally falls slightly before attaining an
approximate constant value independent of fluid velocity (CO) The
section (CO) of the Curve is an indication of the Qual ity of
fluidisation for if the pressure drop is constant as the fluid velocity
43
increases channel in~ is absent Point (B) which 1 ies above (CO)
identifies the point where the frictional forces between the particles
is bein~ overcome prior to rearran~ement The point of minimum
fluidisation velocity ie bullbull the fluidising point is shown on this
Curve at (E) (Coulson and Richardson 1980)
FLUIDISED BEDFIXED BED
0shyltl I VELOCITY
INCREASING
FLUIDISING
POINT
VELOCITY DECREASING
(BED OF MAXIMUM I
POROSITY)
I
I I
LBG (Ve) FIG 21 PRESSURE DRep eVER FIXED AND FLUIDISED
BEDS
23 Heat transfer
Fluidised beds have good heat transfer properties and are ideal in a
system where close control of temperature is reQuired The intimate
mixing which takes place in the bed ensures that heat transfer
throughout the system is very rapid and that uniform temperatures are
Quickly attained
Three mechanisms have been suggested to explain this improvement in heat
transfer coefficient An increase of up to one-hundred fold as compared
with the value obtained with a gas alone at the same velOCity can be
attained by the presence of the sol id Coulson and Richardson (1980)
stated that the particles whose heat capacity per unit volume IS many
times greater than that of the gas act as heat transferring agents As
a result of their rapid movement within the bed they pass from the bulk
of the bed to the layers of gas in close contact with the heat transfer
44
surface exchanging heat at this point and returning to the body of the
bed This together with the extremely short physical contact time of
the particle with the surface ensures that the thermal conductivity of
the particle is not an important factor The second mechanism proposed
by Coulson and Richardson (1980) is the erosion of the 1amminar sub1ayer
by the particles and the subsequent reduction in its effective
thickness A third mechanism suggested by Mickley and Fairbanks (1955)
is that packets of particles move to the heat transfer surface and an
unsteady heat transfer process takes place
Many equations are available in the 1 iterature to calculate the
convection heat transfer coefficient of the gas solid system One
equation which seems to be the most re1 iab1e is that of Dow and Jakob
(1951) The Nusse1t number with respect to the tube diameter is
expressed as a function of four dimensionless groups the ratio of tube
diameter to length ratio of tube to particle diameter ratio of heat
capacity per unit volume of the sol id to that of the fluid and finally
the tube Reynolds number These relations are combined as shown below
where h is the heat transfer coefficient
k is the thermal conductivity of the gas
d is the particle diameter
dt is the tube diameter
is the 1ength of the bed
E is the bed voidage
P is the density of the sol i d
p is the density of the gas
c is the specific heat of the sol id
c is the specific heat of the gas
v is the viscosity of the gas and
Uc is the superficial velocity based on the empty tube
At the present stage of our knowledge the above equation seems the most
re1 iab1e and will thus be used to estimate heat transfer coefficients
and optimum particle diameter
24 F1uidising medium
Various materials were investigated It was assumed that each material
had a discreet size fraction As a high heat transfer coefficient was
important if the f1uidised bed was to perform its function effectively
45
the equation developed by Dow and Jakob (1951) as discussed abov~ was
used to compare the various sol ids Furthermore two bed temperatures
were used to identify any changes in heat transfer coefficients as a
function of bed temperature The results are shown in Figures 22 and
23 It can be seen from these figures that a maximum exists at a
particle size of approximately 150 ~m and that the convective heat
transfer coefficient drops slightly as the bed temperature is increased
Copper powder gave the best results a heat transfer coefficient in
excess of 1000 Wm2 K for a particle of 150 ~m The explosive and toxic
nature of meta1l ic dust at the temperatures reached during calCination
made this an undesirable solution Sand however was less dependant on
both the particle size and bed temperature is totally inert and readily
available It was thus decided that sand would be used as fluidising
medium
241 Sand data
Two sands were readily available These were coded by the manufacturer
as No1 and No 12 Their size distributions are shown in Table 21 As
the actual material had a size range rather than a discreet particle
size an effective particle diameter had to be establ ished Using the
relation suggested by Leva (1959)
where d is the effective particle size and Xi is the size fraction of
particles of size dt the effective particle size was calculated
The efficiency of f1uidisation (Leva 1959) of sands with wide (No 12)
as opposed to narrow (No2) size distributions effectively eliminated
sand No 12 from further consideration
25 Optimisation of the fluidised bed
As discussed In Section 21 a bed of sol ids becomes fluidised only when
the superficial velocity exceeds the minimum fluidisation veloCity As
it is important for the bed to be totally fluidised the minimum
fluidising velocity has to be found For this reason the system was
modified as shown in Figure 24 An attempt was made to measure the
pressure drop across the bed Itself but was Tound not to be pOSSible as
the fluidislng medium would block the tapPIng point at the bottom of the
bed
46
c 11 00
N ltl L 900 3
bull bull 700
LL LL W ~ U 500
bull IshyU 300 W gt z CSJU 100
(J=SAND ()=CepPER amp=lINC +=ALUNINIUN X =cepPER ax 1DE 0=ZINC aXIDE
~~---e------pound9-__
00 500 1000 1500 2000 2500 3000 3500
PRRTICRL DIRMETER UM FIG 22 CBNVECTIBN CBEFFICIENT (WMa2 K) VS
PRRTICRt SIZE (UM) 25C shy
c 900
N ltl L
3 700 bull
LL lLW 500
~ U
bull I- 300 U W gt z CSJ U 100
+=ALUNINIUN x =capPER ax I DE 0=lINC eXIDE
(J=SAND ()=cepPER amp=ll NC
00 500 1000 1500 2000 2500 3000 3500
PRRTICRL DIRMETER UM FIG 23 CBNVECTIBN CBEFFICIENT (WMa2 KJ VS
P R R T 1 CAt S I Z E (U M ) 190 bull C
47
11
FIG 24 REACTOR MODIFICATIONS TO MEASURE PRESSURE DROP
48
Key to Figure 24
1 Feed in 1et
2 Feed preheater
3 Product outlet
4 Integral reactor
5 Reactor support
6 Thermowe 11
7 Tubular embedded element (10 kW)
8 Mica band elements (05 kW)
9 Insulation
10 Fluidised sand bed
11 Gas distributor
12 Rotameter
13 Air supply
14 Oisengagement zone support
15 U-tube manometer
The procedure used to determine the data to prepare a plot of pressure
drop across the bed vs the superficial velocity through the bed is
discussed below
Table 21 Sand size fractions
Size No 12 No 2
(vm) (wU) (wU)
-420
420-350
350-297
297-250
250-210
210-177
177-149
149-125
125-105
105-74
74 shy
Mean size
06
190
336
289
155
22
02
(101m) 1668
01
04
21
86
202
153
242
125
117
49
1243
49
251 Airflow optimisation
The calibration chart of the rotameter could be approximated usin9
Vc = 1983 + 0S8SmiddotTR + 0005 TR2
where Vc is the volumetric flowrate in lmin at lSC (Tc) and 760 mmH9
(Pc) and TR is the rotameter tube readin9 Usin9 ideal 9as behavior
this can be corrected to the actual temperature (Tr) and pressure (Pr)
in the rotameter usin9
Vr = (Vc Pc Tr ) I (Tc P r )
where Vr is the volumetric flowrate at rotameter temperature
and pressure
The pressure in the rotameter was that measured at the inlet to the bed
and was use to calculate the actual flowrate at each tube readin9 If
the 109 of the pressure drop across the bed and 4Ha was plotted a96inst
the 109 of the superfiCial velocity a strai9ht line was obtained The
9raph is shown in Fi9ure 25 The shape of this curve does not
correspond to that of the curve as discussed in Section 21 This is due ( l _ -- i~ -()~
to the fact that the pressure drop across the d~sk was included in the
calculation
200
60 0
IT I-shy--J W 20 0
D ~
080--J
040
-27 -25 -23 -2 -9 - 7 - 5
LBG (Vel FIG 25 PRESSURE DRBP VS SUPPERFICIRL VELBCITY
RCRBSS DISK RND BED
50 - ~
Having previously determined the pressure drop across the d~ the
actual pressure in the bottom of the bed could be calculated at each
rotameter tube reading using
Pb = Pr - Pd
where Pb is the pressure in mmHg at the bOttOM of the bed above the
disk and Pd is the pressure in mmHg in the rotameter when no sand was
in the bed
This corrected pressure was then used to calculate the actual flowrate
through the bed The temperatures of the rotameter and bed were assumed
to be identical and so
where Vb is the air flowrate at the bottom of the bed in lmin Using
the above procedure and plotting the log of the pressure drop across the
bed (Pb) against the log of the superficial velocity (Vb) a Curve of the
classic shape is obtained as shown in Figure 26 without the integral
reactor and in Figure 27 with the integral reactor in the bed In both
cases the minimum fluidisation veloCity was round to be 121 llmin
(Point E on Figures 26 and 27) and channel ing was absent (Part CD in
Figures 26 and 27 is flatgt
a
IT Ishy--J W 0 --
0 ~
1 70
1 50
1 30
10
090
070
050
-26 -26 -24 -22 -20 -1 6 -1 6
LBG (VC) FIG 26 PRESSURE DRep VS SUPPERFICIAL VELeCITY
INTEGRAL REACTeR ABSENT
51
1 70
shy
I 50
CL 1 30
CI f shy~ W 1 10 0
0900 a ~
070
050
-28 -26 -24 -22 LBG (Ve)
-20 -1 8 -1 6
FIG 27 PRESSURE INTEGRRL
DRBP VS RERCTBR
SUPPERFICIRL PRESENT
VELBCITY
252 Temperature correction
As the temperature in the bed increased to reaction conditions the
superficial velocity increased at a fixed rotameter setting This
resulted in a change in the Quality of fluidisation It was thus
desirable to develop a relationship between the bed temperature and the
rotameter tube reading at the minimum fluidisation velocity As the
temperature of the gas was raised to 330degC within 25 mm above the
distributor as shown by Heertjie and McKibbins (1956) the only
assumptions that had to be made was that the pressure drop across the
bed and di-~k-~as independent of temperature and that the i deal gas 1aw
applied Thus
To find the tube reading which corresponds to the air flowrate
calculated above the value had to be corrected to the rotameter
cal ibration conditions using
Vc = (VrTcPr)(PcTr)
Combining the above eQuation with that used to approximate the rotameter
cal ibration chart and solving for TR we get
52
TR = -585 + laquo30234 + 200Vr )s)
Tne resultin~ ~rapn is snown in Fi~ure 28 Usin~ tnis ~raph it was
ensured that the superficial velocity in the bed was close to the
minimum fluidisation velocity at any bed temperature
0 Z 0 CI W 0
W CO J I shy
200
180
160
14 0
120
100
80
60
00 400 800 1200 1600 2000 2400 2800
TEMPERRTURE C FIG 28 BED TEMPERATURE ( C) VS RBTAMETER
SETTING VB=121 LIMIN
53
3 EXPERIMENTAL METHODS
31 The reactor system
311 Layout
All experimental work was done in an inte~ra1 hi~h pressure reactor
system A dia~ram of this system is shown in Fi~ure 31 The feed a 41
mixture of propenepropane obtained from SASOL was contained in a
number seven Cadac cy1 inder mounted bottom up to ensure that only 1i~uid
emanated from it Water and entrained impurities were removed from the
feed by passin~ it throu~h a bed of Union Carbide 3 A molecular sieves
and through a 1 ~m sintered metal filter
The vapour pressure of the feed had to be lowered before it could be
pumped by the Lewa hi~h pressure diaphragm pump To achieve this the
feed was piped throu~h a heat exchan~er held at -1SC The pump head was
also cooled to this temperature In this way cavitation was prevented
and efficient workin~ of the pump was ensured From the delivery side of
the pump the feed was piped throu~h a preheater where it was heated to
within 20C of the operatin~ temperature to the top of the integral
reactor
The products from the reactor were piped throu~h a heat exchanger held
at 6C and a 20 ~m sintered metal filter to the Grove Mity Mite back
pressure re~ulator Here the materials were released to atmospheric
pressure The back pressure re~u1ator had to be heated to 60C to
prevent freezin~ of the products due to a Joule Thomson expansion and
subse~uent failure of the unit To achieve this a water bath was used
the liquid bein~ pumped throu~h a pipe wrapped around the outside of the
unit
The products were then piped via a heat exchan~er to a double walled
catchpot where ~as-1 iQuid separation occurred To ensure total
separation the 1 iberated ~as was passed through a Davies double surface
condenser held at -1SC with the condensate fed back to the catchpot
The catchpot was periodically drained and the liquid stored for later
analysIs The flue gas was then piped through a 10 1 surge tank to the
wet ~as flow meter Finally the flue gas was passed through a sampl ing
loop which could be removed from the system and vented to the
atmosphere
54 regshy --
--8
regshyL-------r
middot x lJJ l shymiddotI ltI)
middot I
I gtshyltI)bull
I 0
I C I l shy
( ltr I lJJ
0 I -
rlt
e-uc1
reg-r-------- r-I-rx1---1________J
regt--==-==-=--=-=--=--_==-==-~=r111_~r--------
55
Key to Figure 31
1 Monomer feed cylinder
2 Dimer feed cyl inder
3 Gas tight Quick connector
4 3A molecular sieve holder
5 1~m sintered metal filter
6 20~m sintered metal filter
7 Glycolethanol cooler
8 Glycolwater cooler
9 Glycolwater cooled catchpot
10 Glycolethanol cooled condenser
11 Monomer pump
12 Dimer pump
13 Bursting disk (70 atm)
14 Thermowell
15 Reactor
16 Fluidised sand bed
17 Feed preheater
18 150vm sintered brass disk
19 10 mm rotameter
20 Oil condenser
21 Back pressure regulator
22 Condensation unit
23 Surge tank
24 Wet gas flow meter
25 Gas sampl ing loop
26 Nitrogen bottle (hish purity)
27 Nitrogen bottle
28 Air supply
29 Hydrogen bottle (high purity)
A separate line was used to purge the reactor with wet or dry hydrogen
nitrogen or air depending on the pretreatment required by the catalyst
Vent lines were installed to prevent air locks in the system during
start up
The safety of the line was ensured by a bursting disk set at 70 atm and
a pressure re1 ief valve in the pump which permitted internal circulation
if the del ivery side pressure exceeded the set point
Two cooling Circuits were employed An ethylene glycolwater mixture at
6C was used to cool the catchpot and all product heat exchangers while
56
an ethanolwater mixture at -10C was used to cool the feed heat
exchanger pump head and the flue gas condenser
32 Reactor
Before any statement could be made about the effects of temperature on a
reaction in an integral reactor the latter had to be as nearly
isothermal as possible Various attempts have been made to achieve
isothermal ity eg Hogan et a1 (1955) surrounded the reactor with an
electrically heated jacket containing a 1 iQuid which was boiled at a
temperature fixed by the pressure of inert gas applied to the top of the
reflux condenser 1mai (1968) on the other hand inserted the reactor
into a heated fluidised bed of iron powder In the present work the
system used by Imai (1968) was adopted Sand was however substituted for
iron powder as the explosive and toxic nature of metal1 ic dust at the
temperatures reached during calcination made the latter undesirable The
final result was a reactor where the temperature in the catalyst bed
could be held within 5C of the set point Each aspect of this design
was discussed in Chapter 2 while a description of the reactor is given
below The reactor consisted of two distinct parts the fluidised bed
and the integral reactor Both are shown in Figure 32
321 F1uidised Bed
The fluidised bed consisted of a rolled sheet metal chimney with a
removable disengagement zone An inverted tripod was suspended from the
top of the chimney into which the reactor was hung Air was injected
into a sealed chamber at the bottom of the bed in such a way as to
prevent impingement of the gas on the distributor (see Figure 32) The
distributor used was alSO vm sintered brass disk Great care had to be
taken to mount the gas distributor absolutely horizontally as severe
channeling and corresponding loss in heat transfer efficienCY would
result otherwise The air flow through the bed was controlled usin9 a 10
mm gas rotameter with a stainless steel float
Heat was suppl ied to the fluidised bed by five mica band elements
strapped around the outside of the chimney Each element was rated at
05 k~ The controlling thermocouple Cchromel-alumel) was situated on
the inside wall of the chimney half way up the bed To prevent heat loss
to the surrounding the entire unit was insulated using asbestos cloth
57
reg
FIG 32 INTEGRAL REACTOR AND FLUIDISED SAND BED
58
Key to Figure 32
1 Feed inlet
2 Feed preheater
3 Product outlet
4 Integral reactor
5 Reactor support
6 Thermowell
7 Tubular embedded element (10 kW)
8 Mica band element
9 Insulation
10 Fluidised sand bed
11 Gas distributor
12 Rotameter
13 Air supply
14 Disengagement zone support
322 Integral Reactor
The reactor was a multi-component single seal unit with a bed diameter
of 25 cm Two distinct sections could be identified cross-sections of
which are shown in an exploded form in Figure 33
The insert consisted of the top flange through which the thermowell and
feed were passed and the catalyst bed jacket which was screwed into the
bottom of this flange The catalyst bed jacket was stoppered at its
lower end by a perforated plug which prevented bed entrainment and
centered the bottom end of the thermowell Holes were drilled through
the top flange to allow passage of the securing bolts The sleeve
consisted of the bottom flange to which the reactor jacket was welded
which in turn was sealed at its lower end by a Concave plug through
which the products were taped off Securing bolts were anchored in the
top surface of the bottom flange Sealing was achieved by a groove in
the bottom flange and a ridge in the top flange These served as a seat
for a laminated graphite nickel seal
Separation of the units upon completion of a run was achieved with the
aid of two 6 mm bolts These bolts were screwed through holes in the top
flange onto the top surface of the bottom flange In this way the units
could be forced apart
Heat was supplied to the unit by a 1 kW tubular imbedded element wrapped
around the outside of the reactor jacket This element was used only
59
o
e- _ _--+-shy
FIG 33 INTEGRAL REACTOR
60
Key to Figure 33
1 Reactor sleve
2 Plug
3 Seal ing bolts
4 Sealing groove
5 Bottom flange
6 Top flange
7 Reactor insert
8 Feed inlet
9 Thermowell inlet
10 Sealing ridge
11 Thermowe 11
12 Bed seath
13 Purforated plug
14 Sealing bolt channel
15 Seperation bolt channel
during calcination The controll ing thermocouple (chromel-alume1) was
placed halfway up the thermowel1 running down the center of the catalyst
bed
Temperatures of the reactor fluidised bed and feed were monitored using
a Digitron temperature display connected to 11 iron-constantan
thermocouples Ten of these were situated at regular intervals in the
central thermowe11 to record the catalyst bed temperature profile and
feed temperature The fluidised bed thermocouple was mobile and could be
moved throughout the bed
33 Operation
331 Loading
For every run the reactor was packed in a similar way as shown in Figure
34 Four distinct regions were identified These were from the bottom
up
1 A region of void capped with a wire mesh which prevented the
catalyst and beads from blocking the reactor exit
2 A layer of glass beads which served as a disengagement zone and
prevented catalyst entrainment
3 The catalyst bed which Consisted of 11~ inch extrudates mixed with
2 mm glass beads in a ratio of 11 by volume The beads served as a
heat sink and catalyst diluent
4 A plug of glass beads capped by a wire mesh This ensured preheating
and prevented movement of the bed during sudden pressure drops
The depth of each layer was accurately measured to fix the number and
position of the thermocouples in each region
332 Calcination procedure
Prior to each run the catalyst was calcined The purpose of calcination
was to burn off organic intermediates incorporated in the catalyst
during synthesis and to convert all the nickel nitrate to nickel oxide
At the same time the catalyst was freed of all but a trace of moisture
(Hogan et a1 1955)
Calcination for all experimental work was carried out in-situ Dry air
was passed through the bed at a rate of 500 m1-gasm1-cat-h while the
temperature was stepped up in 50degC increments at intervals of 10 min
The activation was continued for an additional 4 h at 500degC
Upon completion of this step the activated catalyst was purged with dry
nitrogen until the temperature of the bed dropped to 250degC When this
temperature was reached the reactor was sealed at a pressure of 10 atm
under dry nitrogen before being allowed to cool to room temperature
35 ml of 2 mm 91ass beads
18 m1 of catalyst mixed
with 2 mm glass beads in
a ratio of 11 (vv)
Total volume 80 ml
50 ml of 2 mm glass beads
void
FIG 34 REACTOR BED
62
333 Start-up
Prior to introducing the reactants into the system the cooling circuits
and water bath were allowed to operate for a sufficiently long time to
ensure that the temperatures reached steady state The back pressure
regulator was set to the desired value and the fluidising air set to the
value determined previously
The feed cyl inder was then opened and the reactants allowed to flow to
the inlet of the sealed reactor All air was removed from the low
pressure side via a vent 1 ine and the pump started At this time the
reactants were allowed to flow through the reactor and into the rest of
the line When the pressure in the system reached its set point the
pump setting was altered to give the correct feed rate Once this had
been achieved the temperature of the bed was set to the desired value
When the first drops of liquid were collected the feed cyl inder was
changed and the catchpot emptied This was taken as time zero Although
a certain amount of data was lost during start-up this persisted over a
relatively small time fraction of the entire run Little significant
information was therefore lost Furthermore in this way the liquid left
in the line and reactor at the end of a run did not affect the mass
balance
334 Steady state operation
To monitor the performance of the isothermal reactor and the catalyst
the following readings were taken at selected time intervals
- bed temperature profile
- fluidised bed temperature
- fluidising air flow
- 1 iQuid mass and volume
- tail gas meter reading
- tail gas temperature
- GC analysis of tail gas
- GC analysis of 1 iquid
The feed cyl inder was changed when necessary The mass of the used and
fresh cylinder was noted
335 Shut-down
When shutting down the system the feed pump was switched off and the ~~
procedure as outlined above followed The feed cyl inder was however not
replaced Once the relevant data had been collected
- the temperature controllers were switched off
- the coolant and heating flows were stopped
- the system pressure was released to atmosphere
Temperature runaways did not oCcur during start up However it was
found that the degree of control that could be exercised was sensitive
to sand height and the pOSition of the contro11 ing thermocouple in the
fluidised bed which were consequently monitored by visual inspection
throughout the run
34 Data analysis
The data and collected during the run was analysed using a variety of
procedures These are discussed below
341 Computation of results
A computer program was util ised to analyse the data obtained during the
runs The following was computed
Mass balance The percentage mass loss was calculated using
(total liquid out + total gas OUU]X mass loss = 1 - - 100
[ (total weight of feed in)
where the (total liquid out) is measured directly by adding the weight
of all 1 iquid sampled The (total gas out) was calculated using
(P-V-M)total gas out =
(Z-R-rgt
where P = pressure in atm
V = total volume of fl ue gas in 1 i ters
M = molecular weight based on mean over entire run
Z = compressibility factor (0986)
R = universal gas constant (S21xlO- 2 atmlgmoleK) and
T = gas meter temperature In K
64
Two limiting cases of where mass loss could OCcur would be 1) all mass
was lost before the reactor in which case the mass out would be equal to
the effective mass in and 2) all mass was lost after the reactor in
which case the mass in would be equal to the mass out plus the mass
lost To account for the mass lost it was assumed that the rate of mass
loss was constant throughout the run and that the mass was lost in the
form of gas The calculated WHSV and conversion would depend upon where
the mass loss occured The equations used to calculate these are shown
below
Wei9ht Hourly Space Velocity This was the rate of feed in per hour per
gram of catalyst and was calculated usin9
(mass of propene and propane passing over the catalyst)WHSV =
(total time)(catalyst mass)
where n = 1 if it was assumed that all mass was lost before the reactor
n =2 if it was assumed that all mass was lost after the reactor
Liquid production rate This is an indication of the activity of the
catalyst and is expressed in terms of grams of liquid product obtained
per gram of catalyst per hour As it was assumed that all mass lost was
gas the mass of liquid out was that measured and the LPR was calculated
using
(mass of liquid out - mass of dissolved gas)LPR =
(total time)(mass of catalyst)
Liquid mass X conversion This is calculated using the formula
mass X conversion =[ (LPR) ] 100 WHSVn(w)
where n = 1 if it was assumed that all mass was lost before the reactor
n = 2 if it was assumed that all mass was lost after the reactor
w is the mass fraction of propene in the feed
Liquid sample composition The liquid product was grouped into 01 igomers
of propene as dimer trimer tetramer etc The liquid composition was
based on the mass percent output the response factors havin~ been set
equal to one It can be used to compare 01 i~omer production rate between
different runs and variations with time in a particular run
65
Gas sample composition This data is expressed in terms of mass X since
all GC response factors have been determined
Apart from the mass balance data all other results could be presented in
graphiCal form as functions of time on stream ~hen the data was plotted
in this wayan average time between two sampling pOints was used Data
was recorded only from the time that the first drop of product was
collected this time being defined as time zero
35 Analytical procedure
351 Gas analysis
Both the feed gas and flue gas were analysed on a Gow-Mac 750p gas
chromatograph whose responses from the detector were monitored by a
Varian 4270 intergrator The packing used for this work was n-Octane
Poracil C in a 55 m glass column with an inner diameter of 4 mm Table
31 shows the typiCal composition of the feed used The GC settings
used together with a typical chromatogram of the feed with its retention
times and response factors are shown in Appendix A as is a discussion
of the calibration procedure
Table 31 Feed Composition
Hydrocarbon MassX
Methane 00
Ethane 09
Propane 20
Propene 78
Iso-Butane 02
N-Butane 02
1-Butene 04
Iso-Butene 01
T2-Butene 01
C2-Butene 01 C5+ 02
352 LiQuid analysis
LiQuid samples were analysed by a Varian 3400 together with a Varian
8000 auto sampler The packing used for this work was 3 3i1 iconOV-lDl
66
on Chromosorb W-HP 100120 mesh in a 3 m long glass column with an inner
diameter of 4 mm The responses from the GC were monitored by the
Varian Vista 401 data system This system could be programmed to give an
integral analysis of the results The GC settings as well as a
discussion of the optimisation and cal ibration procedure used are given
in Appendix A
Due to the complex nature of the liquid products the analysis of the
liquid spectra was difficult To facilitate product analysis it was
decided that the 1 iquid product analysis be based on carbon number
groupings rather than on individual Components The groupings chosen are
shown in Table 32
Table 32 Carbon number groupings used for 1 iquid analysis
Group Range
Monomer (C3 ) C3 -c Dimer (C ) C~ -C7
Trimer (C ) Ca -Ct 0
Tetramer (C t 2 ) Ctt-Ct3
Pentamer (C t ~ ) Ct -Ct
Heptamer (Cta ) Cn -C
Hexamer (C2 t ) C20+
353 Nuclear magnetic resonance
The hydrocarbon functional group distribution of C to Cta propene
oligomerisation products was determined using lH NMR Conventional
methods of spectral analysis for propene 01 igomers were inadequate
because of the great variety of head to tail and tail to tail fragments
generated and because of the greater influence from end groups
As 13C NMR was not available at the time of this work only a partial
analysis of the 1 iQuid products was possible The information thus
obtained was that of the type of proton present primary secondary or
tertiary The characteristic proton chemical shift for the relevant
protons are shown in Table 33 (Galya et a1 bullbull 1985)
67
Table 33 Structure definitions of terms and NMR spectral
positions and area code (Galya et al bullbull 1985)
Species Structure Area
(ppm) Code
Protonated aromatic
Olefinic CH2
Olefinic CH
Aromatic CH
Aliphatic region
or to aromatic CH2
or to aromatic CH3
or to olefinic
CH CH2
or to olefinic
CH3
11 to olefinic
CH CH2
CH2 between
isopropyl end
groups and CHs
Term i na 1 CH3
Internal CH3
and olefinic region_
R-CH=CH2
R-CH=CH-R
ltO~CH2-CH2-R
ltO~CH3
R2-CH-CH=CH-CH2-R
R-CH=CH-CH3
CH3 -(CH2)2 -CH=CH-R
R-CH(CH3 )-(CH2 )2 -CH=CH-R
450-475 L
475-575 M
650-730 N
230-300 A
210-230 B
180-210 C
1 40-1 80 o
100-140 E
092-1 00 F
084-092 G
070-084 H
68
Using the equations developed by Galya et a1 (1985) for the C6 to Cta
oligomerisation products of propene each lH area was first converted to
a carbon area before the percentage of each was calculated
The carbon area of CH3 was calculated using
(Area G + Area 0 + Area B + Area H)CH3 carbon area =
3
and the carbon areas of CH2 and CH were calculated using
(Area E + Area A + Area C) (Area H)CH2 carbon area = --------------------------- + Area F
2 6
Area HCH carbon area = + Area F
3
The degree of branching ie the CH3 to CH2 CH3 to CH and CH to CH2
ratios could be approximated (Ga1ya et al bullbull 1985) using
2middot(AREA G + AREA 0 + AREA B + AREA H)= CH2 3middot(AREA E + A~EA A + AREA C) - AREA H + 6middotAREA F
(AREA G + AREA 0 +AREA B +AREA H)= (AREA H + 3-AREA F)
CH = CH2 3middot(Area E + Area A + Area C) - Area H + 6middotArea F
The above equations will be used to analyse the NMR spectra in this
work
354 TGOTA
Thermogravimetry (TG) involves measuring the changes in sample mass with
temperature using a thermobalance This is a combination of a suitable
electronic microbalance with a furnace and aSSOCiated temperature
programmer The balance is in an enclosed system so that the atmosphere
can be controlled Differential Thermal Analysis (OTA) involves
measuring the difference in the temperature between the sample and a
reference material while both are being subjected to the same
temperature program Both TG (mass loss In wtX) and OTA (temperature
difference between sample and reference material) are recorded as a
function of furnace temperature The furnace used in this work was a
STA-780 Series with a Stanton Redcroft Thermal Analyser The balance was
69
controlled by a Stanton Redcroft Balance Controller while the
temperature in the furnace was controlled by a Stanton Redcroft
Temperature Controller The si~nals were amplified by a Stanton Redcroft
DC amplifier and recorded by a Bondwe11 Personal Computer
In this work 20 m~ of sample was placed in the furnace and the
temperature raised from 40C to 850C at a rate of lOCmin in flowin~
air or nitro~en
355 Water content determination
The water content of the feed was determined by measurin~ the dew point
temperature of the water in the feed usin~ a Panametrics Hy~rometer
ltModel 7000) with an aluminium oxide sensor Approximately 48 h was
needed for the system to stabilise Once this temperature had been
measured the vapour pressure of the water in the feed was determined (at
1 atm) and the mole fraction of water in the feed determined Usin~ the
above procedure it was found that the feed contained approximately 112
ppm (vv) water
356 Distillation
The 1 iquid products obtained from the high pressure reactor runs were
distilled in a glass distillation column shown in Fi~ure 35 to
separate the C from the heavier fractions After the still was filled
up to 3 liters per batch it was placed into a heatin~ mantle and
connected to the column with a Gduick-fit connector Upon heating the
vapours from the still passed via a column packed with berl saddles to a
condenser Here the condensate was either directed back to the column as
reflux liquid (plun~er down) or to the catchpot (plun~er up) as
product This separation was controlled by a solenoid operatin~ a ma~net
fused to the plun~er The solenoid in turn was controlled by a timing
device with which the total cycle time and reflux time could be set The
reflux ratio was then calculated by the ratio of the time the plun~er
was up to the time that the p1un~er was down For all cases the reflux
ratio used was 29 The cut off temperature was set by a thermostat at
the top of the column When the desired temperature was reached power
to the solenoid was discontinued and subsequently the plunger remained
down (total reflux) The cut point temperature used was 6ZC The
coolant used in the condensers was water Dissolved gases did not
condense and were vented to the atmosphere
70
1-+-+----1 5
FIG 35 BATCH DISTILLATION UNIT
71
Key to Fi9ure 35
1 Still
2 Berle saddle column
3 Reflux condenser
4 Magnet at top of plunger
5 Plunger assembly
6 Gas tappin9 point
7 Distillate receptacle
36 Catalyst synthesis
361 Support preparation
The silica-alumina support was received from Kal i Chemie in the form of
4 mm spheres which were crushed in a ceramic ball mill to -500 ~m The
silica to alumina ratio was 91 on a wei9ht basis
362 Impregnation
A previously determined mass of metal salt was dissolved in 500 ml of
distilled water to which 50 9 of silica alumina was added The solution
was boiled under reflux for 1 h with vigorous agitation throughout The
vessel was then opened to the atmosphere and while being a9itated most
of the water boiled off The concentrated solution was transferred to a
ceramic pie dish and placed into an oven at 120C where the remaining
water was evaporated Once the material was completely dry it was
crushed sieved and stored The above was adopted from work by H09an et
a1 (1955) and Holm et a1 (1957)
3621 Nickel concentration
The Quantity of nickel needed to make a catalyst of known metal content
was determined in a separate experiment Using a constant mass of sil ica
alumina but varyin9 the amount of nickel nitrate hexahydrate a loadin9
curve was constructed The synthesis procedure used was that as
discussed above The nickel content of the material was determined usin9 b
atomic a_sorption spectrophotometry The loadin9 Curve is shown in
Figure 36
363 Hom0geneous decompOSition deposition
In this method 45 9 of nickel salt was dissolved in 500 ml ot distilled
water to which 50 9 of silica alumina was added The solution was then
heated under reflux to 100C at which point 25 9 ot urea crystals were
added This was taken to be time zero The solution was then ret1uxed
72
while continuously being agitated for a previously determined period of
time as discussed below Excess water was removed by filtration in a
Buchner funnel and the catalyst washed with 20 volumes of hot (90C)
distilled water per volume of catalyst The catalyst was then dried at
110C in a ceramic pie dish for 12 h before being crushed and stored
The above synthesis procedure was adopted from work done by Van Dillen
et a1 (1977) Richardson and Dubus (1978) and Hermans and Geus (1979)
120 IMP LOADING CURVE
SOG S i 02 I A h 03 ~
SOOml H2O(f) 100
(f)
a L
60 bull
IshyZ 60 CD U
40-1 W
-~ U 20
Z
00
00 100 200 300 400 500 MRSS G
FIG 36 NICKEL CONTENT (MASSJ VS MRSS OF NICKEL NITRRTE HEXRHYDRRTE (GJ
3631 Nickel concentration
The time required to load a desired Quantity of nickel was determined in
a separate experiment All quantities of materials used were as
discussed above but while the mixture was boil ing under reflux samples
of solution (5 m1) were taken at discrete intervals These samples were
than washed and dried in the usual manner and their nickel content
determined using atomic adsorption spectrophotometry In this way the
loading Curve was constructed from which the time required to produce a
catalyst of known metal content could be read Two sets of startins
conditions were used as shown in F1gure 37
73
200 1I=509 Ni(N03h6H20
309 Si02A1203~ (j) 259 (NH2CO (j) 160 600ml H20CI L
bull 120bull
() 45c1 Ni (N03 h 6H20
503 S i 02 A 12 03
253 (NH-z )CO
50Om 1 H-z 0IshyZ 8 U 80
--J W ~
40U - Z
00
00 1000 2000 3000 4000
TIME MIN FIG 37 NICKEL CBNTENT (MRSS) VS TIME (MIN)
364 Coprecipitation
Two solutions were prepared One contained 180 3 of sodium meta silicate
in 1200 ml of distilled water and the other contained 42 3 of aluminium
nitrate nonahydrate and 117 3 of nickel nitrate hexahydrate in 1000 ml
of ~istilled water It was important that the pH of the final solution
was kept in the ran3e of 8 ~ 05 To achieve this caustic soda could be
added to the sodium solution or nitric acid to the solution of the
nitrates In this work 82 ml of nitric acid (70 wtX HN031 was added to
the solutions ot the nitrates The two solutions were mixed in a ~ 1
CSTR while being vigorously agitated and the pH adjusted using 5 9 of
sodium hydroxide in 100 ml of water A 3e1 formed after about 30 sand
was allowed to stand for 1 h This material was then filtered using a
Buchner funnel broken up and dried for 12 h at 110middotC The dried sol id
was washed twice by decantation with water and then washed ~ith six or
seven successive portions of 5X ammonium chloride The ammonium ~ash
involved soaking the catalyst for 1 h at 70C In an excess of solution
which was then drained using a Buchner funnel In thiS way any sodium
held in the sol id was removed by base exchange The catalyst was then
washed with distIlled water and dried at 110C for 12 h before being
74
crushed sieved and stored (Holm 1957) The si1 ica to alumina ratio of
the final catalyst was 91 while the nickel content was 4 wt~
365 Determination of nickel content
To determine the nickel content of the catalyst an accurately weished
sample approximately 025 s was added to 5 ml of hydrof1uric acid in a
teflon beaker The solution was left for 12 h after which 5 m1 of
concentrated sulphuric acid and 5 m1 of distilled water were added This
was again allowed to stand before being made up to 250 m1 in a
volumetric flask In this way the catalyst was broken down into its
individual elements and the nickel contents determined usins the Varian
SpectrAA-30 Atomic Adsorption spectrophotometer
366 Extrudate manufacture
The powder form of nickel oxide silica alumina was found to be too fine
for effective use in the hiSh pressure intergral reactor as it caused an
excessive pressure drop and downstream plugging problems Breck (1980)
suggested the use of an inorganic binder such as kaolinite in the
formation of extrudates This approach was found to be effective if the
Quantity of binder was sreater than approximately 35 wt At lower
binder mass fractions the material could not be extruded
The binding process consisted of mixins the binder with the catalysts to
form a homogeneous paste the amount of water used carefully judged by
visual inspection When the paste had the desired consistency it was
loaded into a previously wetted stainless steel piston and plunger
assembly and extruded onto filter paper The catalyst was then dried at
80C for 12 h
Breck (1980) further suggested that the extrudates be baked at 370C for
12 h to convert the clay to an amorphous binder of considerable
mechanical strength It was however found that this was not necessary as
the extrudates had sufficient strength after drying at 80middotC
75
4 RESULTS
Various types Ot catalyst synthesis procedures were examined These were
homogeneous decomposition deposition (HOD) i mpregnati on (IMP) an d
brietly coprecipitation (SGb as well as the catalytic properties Ot
the silica alumina support (SA) The si1 ica to alumina weight ratio used
throughout was 9 to 1 The criterion whereby the activity Ot the
catalyst was measured was the 1 iQuid production rate (LPR) The
selectivity of the catalyst expressed in terms Ot massX 1 i~uld
composition gave an indication ot the relative amounts Ot the various
01 igomers formed
The reaction conditions used were a temperature of aoc and a pressure
of 40 atm unless otherwise stated The catalyst size fraction used was
-500 IJm which was made into 110 inch extrudates using 35 wt~ kaol inite
as binder
As mentioned previously the feed used was a 41 mixture ot
propenepropane with trace impurities of C4 and C2 hydrocarbons unless
otherwise stated The exact composition ot the feed is shown in Table
31
The reaction conditions used in all experiments are summarised in Table
41 The WHSVt and WHSV2 were calculated assuming the mass loss occurred
before the reactor and after the reactor respectively in the torm of
gas For the purpose of plotting the results it was assumed that all
mass was lost betore the reactor ie bull ldHSVt was used in all the
figures
41 Reproducibil ity of Data
Two runs were carried out under identical conditions Ot temperature
pressure and WHSV The catalyst used in both runs was an HOD type
catalyst with a nickel content of 15 wt~
Figure 41 shows the LPR for each run as a function of time It can
clearly be seen that the largest discrepancies occurred during start-up
76
Table 41 Reaction data
CommentCode Nickel Press WHSVt (wU) (atm) (ggh)
HDD-1 15 80 40 42 45 HDD-2 1S 80 40 53 56 Reproduc i b i 1 ity
HDD-3 15 80 40 52 56 Reproducibil ity
HDD-4 15 80 40 51 55 Wet feed
HDD-5 15 80 40 47 48 Regenerated HDD-4 HDD-6 15 200 40 49 55 Temp runaway
HDD-7 15 80 40 54 56 Regenerated HDD-6 HDD-8 15 150 40 43 47 HDD-9 15 210 40 66 73
HDD-10 22 80 40 50 55 HDD-ll 72 80 40 42 47 HDD-12 117 80 40 49 52 HDD-13 113 SO 40 54 57 HDD-14 113 80 40 108 117 HDD-15 113 80 40 116 132 HDD-16 117 80 20 67 74 HDD-17 117 80 50 50 52 HDD-1S 15 aO200 40 55 LiQuid feed (C )
HDD-19 15 80 40 SS li QU i d gas f~ed
HDD-20 15 200 40 77 liquid gas feed
IMP-1 OS SO 40 47 4S IMP-2 19 SO 40 53 56 IMP-3 22 SO 40 4S 49 IMP-4 46 80 40 33 39 IMP-5 63 SO 40 49 54 IMP-6 71 80 40 44 48
IMP-7 9S 80 40 52 55 IMP-S 98 SO 20 59 66 IMP-9 9S 80 50 50 53
SG-1 15 SO 40 52 55 SG-2 15 80 20 59 61 SG-3 30 80 40 37 41
SA-1 80 40 40 41 SA-2 150 40 62 63 SA-3 200 40 35 42
77
ceOE NIOll) TR( middotC) P(ATHI WHSV 600 J=HOO-2 1 5 80 40 53
()=HOO-3 I 6 80 40 62
600
300 bull
e 0- 200
bull
1 00
000
00 40 60 80 100 120
TIME H FIG 41 LIQUID PRSDUCTISN RRTE (GHGJ VS TIME (H)
J=O I MER )()=TR I HER HOO-2 =TETRAHER
lUOO
~ +=PENTAHER (j)
X=OI HER )(j) 800 ~=TRIHER HOO-3 IT +=TETRAHER L )( =PENTAHER
bull 600 Il )((j)
o 0- L 400 o U
bull o 200
e
IJ RI00
00 20 40 60 80 100 TIME H
FIG 42 LIOUID CSMPSSITIBN (MRSS) VS TIME (Hl
78
Once steady state had been obtained approximately after 4 h on stream
conversions were similar and the reproducibility acceptable
Figure 42 shows selectivity as a function of time on stream Here it
can be seen that the dimer trimer tetrameter and pentamer were
produced in similar Quantities throughout the two runs
It was thus concluded that at steady state adequate reproducibil ity was
attained with respect to both selectivity and LPR
42 Nickel content
In the case of HOD type catalysts the nickel content was varied from
15 wtX to 117 wt It can be seen from Figure 43 that while the LPR
differed from run to run this variation was due to WHSV differences
and no trend with increasing nickel content was observed The LPR
remained between 3 and 4 grams of product per gram of catalyst per hour
over the range of nickel loadings examined The selectivity of the
catalyst as shown in Figure 44 was also found to be essentially
independent both with respect to nickel content and time on stream
although a sl ight decrease in dimer Yield was observed ~ith increasing ltshy
n lkel content
In the case of IMP type catalysts the nickel content was varied from
10 wtX to 98 wtX An accurate statement about the effect of nickel
content on the activity of IMP type catalysts could not be made due to
differences in the WHSV The selectivity as a function of both time on
stream and nickel content is shown in Figure 46 The catalyst with 08
wtY nickel exibited the greatest selectiVity towards trimers and the
dimer Yield inCreased sl ightly with increasing nickel content No other
marked changes in the selectivity were observed as a function of nickel
content or time on stream
43 Effect of ressure
In Figure 47 the lPR vs time on stream is shown for an HOD type
catalyst with a nickel content of 113 wtX at three different pressures
It can be seen from this figure that as the pressure was decreased from
50 atm to 20 atm the lPR remained constant although the WHSV was higher
at lower pressures This suggests that the activity c~ the catal~sts
dropped with decreasin9 pressure The selectiVIty shown in FI9ure 43
as a function of time on stream and pressure was also dependent ~n the
pressure used It Can be seen from Figure 4S that at 20 atm propene
dimer accounted for approximately 70 wt of the 1 iQuid pr0Juct ~hile at
79
600
o 500
r 400o
bull 300
a
bull CL 200
-1 1 00
000
ceOE Il =HOO-J ()=HOO-I0 4 =HOO- I I +=HOO-12
NI(WTtJ 1 5 22 72 11 7
TR bullC) P(ATMI WHSV 80 40 42 80 40 50 80 40 42 80 40 49
00 20 40 60 80 100 TIME H
FIG 43 EFFECT OF NICKEL CONTENT (MASS) ON
1000
~ (f)
(f) 800 a L
bull 600 (f)
o CL L 400 o U
o 200
00
LIQUID PRODUCTION RATE (GHGl HOD
1l0 I MER l()=TRIMER 4 H eN STREAM 4TETRAMER +PENTAMER XOIMER l~TR[MER 8 H eN STRERM TETRAMER ~ PENTRMER
$lt ~ ~ ~
- - bull ~ J shy
00 20 40 60 80 100 120
NICKEL CONTENT MRSSi FIG 44 EFFECT OF NICKEL CBNTENT (MASS) ON
LIQUID COMPOSITIBN (MRSS) HOD
I
o
o
bull a
bull CL
bull
6middot00
500
400
300
200
ceOE ll=IMP-l ()=INP-2 = I MP-3 +=IMP-4 X=IMP-5 0= INP-6 P=IMP-7
NI(HTI) 08 t9 22 46 63 71 98
TR( middotC) 80 80 80 80 80 80 80
80
P(ATNI 40 40 40 40 40 40 40
HHSV 47 53 48 33 49 44 52
000
00 40 60 80 100 120 TIME H
FIG 45 EFFECT BF NICKEL CBNTENT (MASS) BN LI QU I D PRBDUCT IBN RATE (GHG l IMP
1000
~ (j)
(j) 800 a L
bull 600 (j) (2]
CL L 400 (2]
U
o 200
00
Il=DIMER ()=TR I MER =TETRRMER +=PENTAMER X=Dl MER0=TR IMER P=TETRRMER ~=PENTRMER
~- ~ ~ ~======~
~ ~ JlJl1 -l
) 4 H aN STRERM
1 8 H aN STREAM
00 20 40 60 80 100NICKEL CBNT MRSSi
FIG 46 EFFECT BF NICKEL CeNTENT (MRSS) BN LIQUIDCOMPOS I T I eN (MRSSi) IMP
81
o
600
500
ceDE Il=HDD-16 e)=HDD-13 AHDD-17
NI(WTZ) 117 113 117
TR( C) 80 80 80
P(RTMI 20 40 50
WHSV 67 54 50
r 400 o
bull bull 300
0
bull Q 200
000
00 20 40 60 80 100
TIME H FIG 47 EFFECT OF PRESSURE (RTM) ON LIQUID
PRODUCTION RRTE (GHG) HOD
1000
~ en en 800 a 2
bull bull 600
en ~ Q
2 400 ~ U
bull (3 200
00
Il =0 I MER )e)=TR 1 MER 4 H eN STRERM A=TETRRMER +=PENTRMER X=D I MER ~=TRIMER H 8N STREAMI 8 +=TETRRMER X =PENTRMER
~ e -0
-=+
=
Ii if
100 200 300 400 500 600
PRESSURE RTM FIG 48 EFFECT OF PRESSURE (RTM) ON LIQUID
COMPOSITION (MRSS) HOD
82
50 atm the liquid product Contained only 50 wt~ dimer The observed
shift to li~hter products with decreasin9 pressure is consistent with
thermodynamiC predictions althou9h increasin9 the WHSV and hence
decreasln9 the contact time would result in the same shift in product
spectrum
In the case of an IMP type catalyst containin9 98 wtX nickel the LPR
as well as the selectivity were very sensitive to the pressure used The
LPR at three distinct pressures is shown in Fi9ure 49 as a function of
time on stream It can be seen that at 20 atm the catalyst rapidly
deactivated and was practically inert after 7 h on stream At the other
pressures examined ie bullbull 40 and 50 atm no difference in the LPR was
observed The selectivity of the catalyst is shown in Fi9ure 410 as a
function of pressure At 20 atm the 1 iquid product contained
approximately 30 wt~ dimer which inCreased to 67 wtl at 40 atm dropping
to 62 wt~ at 50 atm This trend althou9h opposite to that observed for
HOD type catalysts is in ailreement with the data reported in the
literature (Takahash i et a 1 bullbull 1969)
The LPR of a SG type catalyst with a nickel content of 15 wtr is shown
in Fiilure 411 at two distinct pressures At 40 atm the LPR was
comparable to that of HO~ and IMP type catalysts while at 20 atm the
catalyst was totally inert The selectivity of the SG type catalyst at
40 atm differed markedly from that of an IMP and HOD type catalyst In
that the liquid not only contained a larile percentage Ot dimers (40 wt~)
but also an equally larile percentage of trimers
44 Bed temperature profile
Before any statement as to the effect of temperature could be made the
temperature throughout the bed had to be constant and not fluctuate
excessively durin9 a run
In Fiilure 413 the temperature profile through the entire reactor is
shown at 4 discrete times ~urin9 a run The catalyst bed started at
position 4 and extended for 172 em down the reactor to position 8 In
this re9ion of the reactor viz bullbull over the catalyst bed a temperature
deviation from the set point of not more than 4C was observed at th~
times shown In FI9ure 414 ~he temperature fluctuations with time were
plotted at positions 4 6 and 8 From this figure it can be seen that
the amplitude of the temperature fluctuations with time were 4C for
position 4 and 6 and 3C for POSition 8 It can thus be concluded that
at aoc the temperature throu~hout the bed and over the period of the
83
600 ceOE Il =I HP-8
N I ( WT ) 98
TRIC) 80
PIATHI 20
WHSV 59
() =I MP-7 98 80 40 52 =lHP-9 98 80 50 50
cJ 500
- I - 400 cJ
bull 300
0
bull 0 200
bull
000
0middot0 20 40 60 80 100
TIME H FIG 49 EFFECT BF PRESSURE (ATM) BN LIQUID
PRBDUCT IBN RATE (GHG) IMP
Il=OIMER 11000 ()=TR 1MER 4 H 6N STRERM 4I=TETRRMER
~ +=PENTRMER (j)
(j) 800 IT L
bull 600
(j) ()
0 L 400 ()
U
bull (3 200
00
100 600
FIG 410 EFFECT SF PRESSURE (ATM) BN LIQUIDCBMPBSITIBN (MRSS) IMP
~---l--_--1-+
200 300 400 500
PRESSURE RTM
84
600 ceDE Nt (WT J TR ( bull C) PlATM) WH5V [J =5G-1 1 5 80 40 52 ()=SG-2 I 5 80 20 59
CJ 500
- I - 400 CJ
bull 300
Ct
bull D- 200
-J 1 00
~-----elE9----egt000
00 20 40 60 80 100
TIME H FIG 411 EFFECT eF PRESSURE (RTM) eN LIQUID
PReDUCTIeN RRTE (GHG) SG
600 [J=O IMER ()=TR I MER ~=TETRAMER
~ +=PENTAMER(J)
(J)
IT L
(J)
~ CL L ~ U 200
~~------~A----~____A_____________6 o
400
00
00 20 40 60 80 100
TIME H FIG 412 LIQUID CBMPBSITIBN (MRSSJ VS TIME (HJ
RT 40 RTM SG
85
1000 Il=TEMPERATURE AFTER ~=TEMPERATURE AFTER A=TEMPERATURE AFTER +=TENPERATURE AFTER
11 H ~N STREAM 35 H ~N STREAM 60 H BN STREAM 93 H eN STREAM
U 900
W 0 800 =)
I shyCI 0 700 W (L
L W I- 600
500
PBSITIBN Z FIG 413 BED TEMPERATURE PRBFILE (tC) VS
PBSITIBN (Z) SET PBINT 80C SG-1
00 10 20 30 40 50 60 70 80 90 100
1000
U 900
Il=TEMPERATURE FLUCTUATleNS AT Z=4 ~=TEMPERATURE FLUCTUATUINS AT Z=6 A=TEMPERATURE FLUCTUATI~NS AT Z=8
W 0 800 =)
I shyCI 0 700 W (L
L W I shy 600
500
20 40 60 8000 100 TIME H
FIG 414 BED TEMPERATURE FLUCTURTIBNS (tC) VS TIME (H) SET PBINT 80C SG-l
86
run was controlled accurately enough to examine the effect of reaction
temperature
In Figure 415 the temperature profile through the bed is shown for 3
different times during a run at 210middotC During this run from positions 4
to 7 ie bullbull over 75 of the catalyst bed the temperature deviation
from the set point was less than SmiddotC at the times shown while the
temperature at position 8 was approximately 10degC below that of the rest
of the bed In Figure 416 the temperature variation with time at 3
different positions in the bed is shown Excluding the start-up period
the ampl itude of the temperature fluctuations with time at positions 4
and 6 was 3C while the amp] itude of the temperature fluctuations at
position 8 although approximately 10degC below the set point was 2middotC
Thus although a deviation from the set point existed at 2l0middotC the
profile did not change markedly with time on stream
441 Effect of temperature
The LPR for an HOD type catalyst with a nickel content of 15 wt~ is
shown In Figure 417 as a function of time on stream at 4 different
temperatures It Can be seen from this figure that at 80degC and 40 atm
ie bull when the system was In the I iquld phase the LPR was higher than
when the system moved into the vapour phase As the temperature was
raised from BOdegC to lSOdegC a 50~ decrease in LPR was observed while the
WHSV was lower by 18 Upon raising the temperature to 200degC a Further
drop In LPR of 10~ was recorded although the WHSV was higher by 14~ At
210degC the high WHSV used makes a meaningful4 comparis$on impossible
However from the recorded LPR it can be concluded that the activity of
the catalysts decreased further
Figure 418 shows I iquid composition as both a Function of time on
stream and temperature Increasing the temperature and moving into the
vapour phase caused a dramatic drop in the dimer yield and an Increase
in trimer yield IncreaSing the temperature still further resulte~ In
the dimer recovering until at 210middotC dimers and trimers were formed in
equal Quantities
As at higher temperatures ie bull above IS0degC at 40 atm Bil iea aluml~a
exhibits catalytiC properties the relationship between its activit and
temperature was also examined In Figure 419 the LPR as a function of
time on stream IS plotted For SA at 3 different temperatures R~ducln9
the temperature Fr~m 200C to lS0C resulted In the maximum activity
87
220
U 210 po
wa 200 =gt l-CC a 190 W a L W I- 180
170
~=TEMPERATURE AFTER 14 H aN STREAM ~=TEMPERATURE AFTER 37 H aN STREAM amp=TEMPERATURE AFTER 61 H aN STREAM
00 10 20 30 40 50 60 70 80 90 100 PBSITIBN Z
FIG 415 BED TEMPERATURE PROFILE (C) VS POSITION (ZJ SET POINT 210C HDD-9
230
U 220 po
wa 210 =gt l-CC 0 200 W a L w I- 190
~=TEMPERATURE FLUCTUATlaNS AT Z=4 ~=TEMPERATURE FLUCTUATUINS AT Z=6 amp=TEMPERATURE FLUCTUATlaNS AT Z=8
180
20 40 60 60
TIME H FIG 416 BED TEMPERATURE FLUCTUAT IONS ( C)
VS TIME (HJ SET POINT 210C HDD-9
00
88
600
CJ 500
400CJ
bull bull 300
0
bull 0- 200
--J 1 00
000
ceDE []=HDD-2 ()=HDD-8 amp=HDD-6 +=HDD-9
N (lH) 1 5 1 5 1 5 1 6
TR( middotC) P(ATM) I1HSV 80 40 53 150 40 43 200 40 49 210 40 66
00 20 40 60 80 100 120 TIME H
FIG 417 EFFECT BF TEMPERRTURE (Cl BN LIQUID PRBOUCTIBN RRTE (GHGl HOD
600
~ (f) (f)
a ~
400 bull
(f)
~ 0shy~ ~ U 200
bull
[]=D IMER 1()=TRIMER 4 H eN STREAM amp=TETRAMER +=PENTAMER X=DI MER 10=TRIMER 8 H eN STRERM i=TETRAMER j =PENTAMER
_----~=i
00
600 900 1200 1S00 1800 2100 2400 TEMPERRTURE C
FIG 418 EFFECT BF TEMPERRTURE (Cl BN LIQUID CBMPBSITIBN (MRSS) HOD
600
89
C) 500
- r - 400 C)
bull 300 ~
Q 2 )0
bull
---l 1 00
000
TR ( bull C) P(ATH) HHSV BO 40 40 150 40 62 200 40 35
ceOE fI =SA-l ()=SA-2 ~=SA-3
N[(HTZl 00 00 00
~e
tI eJ
e e e)
00 20 40 60 80 100 120 TIME H
FIG 4 bull 19 EFFECT BF TEMPERATURE ( bull C ) BN LIQUIDPRBOUCTIBN RATE ( GHG) SA
600
0 (f) (f)
a I
400 (f)
~ Q I ~ U 200
C2I 1--1
---l
00
fI=O IMER )()=TRIHER 4 H aN STREAM ~=TETRAMER +=PENTRMER
+ +
600 900 1200 1500 1800 2100 2400 TEMPERRTURE bull C
FIG 420 EFFECT I3F TEMPERATURE ( C) BN L I QU I 0 CI3MPI3SITII3N (MASS) SA
90
falling by approximately 72X while the WHSV increased by 5S~ At aoc the catalyst was inert At 200C the preferential product of sil ica
alumina was propene trimer which can be seen in Figure 420 where
1 iQuid composition is plotted against temperature Decreasing the
temperature to lSOC caused the trimer yield to increase at the expense
of the dimer Decreasing the temperature further resulted in the
catalyst becoming inert and so no 1 iQuid data was available
45 Lifetime and selectivity
The 1 ifetimes of HOD IMP SG and SA type catalyst were examined as well
as their selectivity in long runs In Figure 421 the LPR and WHSV as a
function of time are plotted for an HOD type catalyst with a nickel
content of 15 wt From this it can be seen that the LPR fluctuated
with time due to WHSV fluctuations Upon comparing points with eQual
WHSV it was found that the conversion had dropped by 12 after 100 h on
stream The selectivity with time on stream is shown in Figure 422
Selectivity chansed sl ightly during the run ie bull the Quantity of dimer
formed increased by 25~ after 120 h at the expense of the tetramer and
pentamer
In Figure 423 the LPR as a function of time is plotted for an IMP type
catalyst with a nickel content of 19 wt After a h on stream the
activity of the catalyst dropped by 24 of its initial value The
selectivity shown in Figure 424 remained approximately constant with
the dimer yield increasing sl ightly at the expense of the tetramer and
pentamer over the period of the run
In Figure 425 the LPR as a function of time is plotted for an SG type
catalyst with a nickel content of 15 wtx After 10 h on stream the
catalyst showed no signs of deactivation The sel~ctivlty shown as a
function of time in Figure 426 also showed no changes over this
period ConseQuentely from the available data no conclusive statement
with respect to the 1 ifetime of this catalyst could be made
The 1 ifetime of a SA type catalysts was examined at a temperature of
200C and the LPR as a function of time is shown in Figure 427 Upon
comparing points with eQual WHSV it was found that the ConverSion had
dropped by 24 over a period of 75 h As shown in Figure 428 10
significant change occurred in the selectivity over the perlo~ of this
run
91
700
6(10 o I 500
o 400
bull a 3 00
bull 0
200
1 00
000
CODE NI(WT~) TR(C) P(ATM) HDD-3 15 80 40
~=HEIGHT HeURLY SPACE VELeCITY ~=LIQUIO PReOUCTleN RATE
WHSV 52 700
600
600
400
0
I 0
300
200
gt (j)
I 3
100
000
00 200 400 600 800 1000 1200
TIME H FIG 421 LIQUID PReDUCTIeN RRTE (GHGJ RND WEIGHT
HeURLY SPRCE VELeCITY (GHGJ VS TIME (H)FeR HDD-3
800
~ (j) (j)
IT L
600
bull
(fJ
~
0 L
400
~ U
bull 200
o
~O IMER ~=TR IMER amp=TETRAMER +=PENTAMER
+
FIG 422 LIQUID ceMPeSITIeN (MRSS) VS TIME (H) FeR HDD-3
92
700
600 CJ
r 500
CJ 400
bull 0 300
bull 0
200
t 00
000
CODE NI(WT~) TR(JC) P(ATM) WHSV IMP-2 19 80 40 53
m=HEIGHT HeURLY SPACE VELeCITY ~=LIQUIO PReOUCTleN RATE
er----El---f9----et-_-poundJ
700
600
600 CJ
r 400 shy
CJ
300 gt
(J)
r 200 ~
t 00
000
00 20 40 60 60 100 120
TIME H FIG 423 LIQUID PRBDUCTIBN RRTE (GHG) RND WEIGHT
HBURLY SPRCE VELBCITY (GHGJ VS TIME (H)FBR IMP-2
CL
93
700
600 cJ shyc 500 shycJ
400 0 300
200
I 00
000
CODE SG-1
NI(Wn) 15
TR(C) eo
P(ATM) 40
WHSV 52 100
rn=WEIGHT HeURLY SPACE VELaCITY ~=LIQUID PReOUCTlaN RATE 600
-eJ 500
400
cJ shyc shycJ
300
200
gt U)
c 3
100
000
00 20 40 60 80 100
TIME H FIG 425 LIQUID PRSDUCTIBN RATE (GHGl AND WEIGHT
HBURLY SPACE VELSCITY (GHGJ VS TIME (HlFeR SG-1
600
~ U) U)
a L
400 bull
U)
~ CL L ~ U 200
bull
rn=D 1MER ~TRIMER
41 =TETRAMER +=PENTANER
amp~----------A------______A__________________~bull
+
Oor ~-~I~------~I--------~I-------+I-------+I-------+I~
00 20 40 60 80 100
TIME H FIG 426 LIQUID CBMPSSITIBN
FeR SG-1 (MASS) VS TIME (H)
94
600 CODE NIIWTX) TRIC) PIATN) WHSV SA-3 200 40 35
m=WEIGHT HeURLY SPACE VELeCITYo 600 ~=LIQUIO PReOUCT6N RATE shyI - 4 00o
bull 300
et
bull CL 200
~ 100
000
00 20 40 60 60 100 120 14 0
TIME H FIG 427 LIQUID PRBDUCTIBN RATE (GHGl AND WEIGHT
HBURLY SPACE VELBCITY (GHGJ VS TIME (HJFBR SA-3
600
500
0 400 shy
I shy0
300 gt (f)
200 I s
1 00
000
600
~ (j)
(j)
IT L
400 (j)
o CL L o U 200
o
m01MER ~TR IMER 6=TETRAMER +PENTAMER
___-tl----------~I-----------r--~V I I
E9 m(9 E9 u El
i I I00 20 40 60 80 100
TIME H FIG 428 LIQUID CBMPBSITIBN (MRSS) VS TIME (H)
FBR SR-3
00
95
46 Effect of WHSV
The effect of the WHSV on the LPR and selectivity was examined In
Fi~ure 429 the LPR of an HOD type catalyst with a nickel content
ranging from 113 to 117 wt~ is shown at four different WHSV Figure
429 shows that increasing the WHSV increased the LPR and the rate of
deactivation
In Fi~ure 430 the selectivity as a function of both time and WHSV is
shown This figure demonstrates how increasing the WHSV and consequently
decreasing the conversion resulted in a higher dimer content of the
liquid product at the expense of the tetramer and the pentamer The
quantity of trimer was not affected by changing WHSV in the range
examined
47 Effect of temperature runaway
The effect of operating the catalyst at 80C was examined after
operating it at 200middotC The aim of this experiment was to establ ish
whether the activity or selectivity of the catalyst when rerun at 80C
was affected in any way by operating it first at a temperature higher
than 80middotC Between the two runs the catalyst was calcined in the normal
manner
In Figure 431 the LPR of an HOD type catalyst with a nickel content of
15 wtX at 200C is shown as a function of time on stream After 11 h
the run was stopped and the catalyst calcined in the -normal manner and
rerun at SOmiddotC The LPR as a function of time at aodegc IS shown In Figure
431 together with the data obtained using a fresh catalyst at SOmiddotC It
can be seen from this figure that usin~ the catalyst first at ZOOC did
affect the activity and from Figure 432 the selectiVIty causing a drop
in LPR of 17X at steady state and a shift to 1 ighter products at the
expence of the tetramer when the catalyst was re-used at 80middotC
4S Effect of water contamination
The aim of thIS experiment was to establ ish the effect of water on the
activity and selectivity of an HOD type catalyst with a nickel content
of 15 wtX (HOD-4) and to determine whether the catalyst could be
regenerated to its normal activity and selectiVity For this ~urDose the
feed containing 112 ppm (vv) water was not dried bef0re ent~rln9 the
bed and the activity with time was recorded ~nder normal running
CL
96
caOE N I (1HZ J TR ( middotc I P(ATNI HHSV1000 (l =HOO-I 2 I I 7 80 40 49 ()=HOO-13 II 3 80 40 54 t =HDD-14 It3 80 40 108 +=HOO-tS 1t 3 80 40 I I 6
cJ 800
I
cJ 600
a 400
bull 200-J
000
00 20 40 60 80 100
TIME H FIG 429 EFFECT BF WHSV (GHG) BN LIQUID
PRBDUCTIBN RRTE (GHG) HOD
800
~ (j) (j)
a 600 L
(j)
~ 400 CL L ~ U
bull 200 C3
00
(l=D I MER )()=TRIMER 4 H eN STREAM t=TETRAMER +=PENTRNER
X=OINER Ie=TRIMER 8 H aN STRERM TETRRMER ===----shyX=PENTANER
~~e-------------------~i~~
20 40 60 80 100 120 t 40WHSV GHG
FIG 430 EFFECT BF WHSV (GHG) BN LIQUIDCBMPBSITIBN (MRSS) HOD
140
97
600
o 500
bull 300
0
bull CL 200
-1 1 00
000
ceDE N I ( loin) TR( C J PlATH) WHSV Il =HDD-6 15 200 40 49 ()=HDO-7 15 60 40 54 AHDD-2 15 60 40 53
00 20 40 60 60 100 120 14 0
TIME H FIG 431 EFFECT BF TEMPERATURE RUNAWAY BN LIQUID
PRBDUCTIBN RATE (GHGl HDD-6 AND HDD-7 CBNSECUTIVE RUNS USING SAME CATALYST
700
~ (f) 600 (f)
IT L 500
bull
(f) 400
cJ CL L 300
cJ U
200
bull CI 100 -1
00
Z=D 1HERIiOIMER 1 XOIMER 1 ()TRIMER HOO-6 ~=TRINER HDD-7 Y=TR I MER HDD-2 ATETRRNER +=TETRRHER )(TETRRHER
+=PENTRNER ~=PENTRNER If =PENTRHER 1 Z~
~ eEl egt
Gshy
E9 fl
)lt~~ V ~
t shy amp
)IE ~ )(
+~ of f -+ J~ R
20 40 60 80 100 12000
TIME H FIG 432 EFFECT BF TEMPERATURE RUNRWRY BN LIQUID
CBMPBSITIBN (MASS)
98
conditions It can be seen from Figure 433 how rapidly the catalyst
deactivated becoming totally inert In 4 h The selectivity as shown in
Figure 434 was also affected with the dimer rapidly becoming the main
product
Upon regenerating and operating the catalyst in the normal manner (HOOshy
5) the catalyst showed an initial LPR higher than in HDD-l due to a
high WHSV which rapidly dropped to that of a catalyst in a dry run For
comparison the LPR vs time relation for a dry run using a fresh catalyst
is also shown in Figure 433 (HOD-l) With regard to selectivity no
difference was observed for the regenerated or normal catalyst as shown
in Figure 434
In this experiment the -69C fraction (dimer) from previous runs was fed
through the reactor at 40 atm and 30C Once the catalyst had
deactivated the temperature was raised to 200C and the run continued
The catalyst used was a HOD type catalyst with a nickel content of 15
wt~ The feed composition was 994 wt~ Cb and 06 wt~ Cl
To monitor the activity of the catalyst throughout the run the LPR was
calculated using
LPR = (mass Cn-b in - mass of Cn-b out) ltI) (time)(mass of catalyst)
while the Conversion was calculated using
Mass~ Cn_b converted =[mass Cn- in - mass ou t ) 1bull 100 ltII)Cn
mass Cnab In
It can be seen from Figure 435 that at aoc the catalyst rapidly lost
its activity This also became apparent from the changes in the 1 iquid
composition with time on stream as shown in Figure 436 Upon raising
the temperature to 200C the catalyst regained activity the conversion
beIng 64~ after 27 h on stream The composition of the 1 iQuid product
also changed markedly the most abundant specIes in the product being a
Cb dimer (CI2) with trace Quantities of Cl and trimer (CIS)
410 Liquid and gas feed (C + C3)
In this case dimer (C ) and monomer (el) were fed simultaneously to the
reactor The ratio of Cb to C3 was held at 11 9 C9 Cl throughout Two
runs using the same catalyst were carried out one at 80C and one at
I
99
600 CeDE NJOHI) TR( middotC) PlATH) HHSV FEED Il=HDD-4 15 80 40 51 HET ~=HOO-5 15 80 40 47 DRY AHOD-I 15 80 40 42 DRY
CJ 500
shy
shy 4 00 CJ
bull 300
0
bull (L 200
1 00
000
00 20 40 60 80 10middot0
TIME H FIG 433 EFFECT BF WRTER BN LIQUID PRBDUCTIBN RRTE
(GHGJ HDD-5 REGENERRTIBN RFTER HDD-4
800
~ (J) (J)
(I 600
(J)
~ 400 (L
L ~ U
bull 200
o
[]=o 1MER 1 ~=TR I MER HOO-4 1 TETRAMER +=PENTAMER
X=OIMER ]~=TRIMER HOO-S +=TETRAMER X=PENTAMER
Zo I MER 1 Y=TRIMER HOO-l )( = TETRAMER =PENTAMER
~ eiICJ)
P=~ if --- I~
Igt(
~
~~ j
)(
00 20 40 60 80 100
TIME H FIG 434 EFFECT SF WRTER CBNTRMINRTIeN eN
LIQUID CBMPeSITIBN (GRHGR1 HOD
00
100
CODE NI (Wa) TR ( C ) P(ATM) WHSV 800600 HDD-18 15 801200 40 55
l =CaNVERS 1aN ~ ~LtQUtO PRaOucTtaN RATE (j)D
(j) r 600 600 a
200degC
L D
bull Z 400 a
bull 400
0 (j)
a CL
bull w gt200bull 200 Z
--J a
000shy
u
00
00 20 40 60 60 100
TIME H FIG 435 LIQUID PRBDUCTIBN RRTE (GHG) RND
CBNVERSIBN (MRSS) VS TIME (H) LIQUIDlaquo69C FRRCTIBNl FEED HDD-18
1000
~ (f)
(f) 600 IT L
bull 600
(f)
a CL L 400 a u
C3 200
l =0 t MER ~=TR t MER TETRAMER +=PENTAMER X=HEXRMER
20 40 60 6000 100
TIME H FIG 436 LIQUID CBMPBSITIBN (MRSS) VS TIME (H)
LIQUID laquo69C FRRCTIBNJ FEED HOD-IS
101
200middotC The catalyst a~ain an HOD type catalyst with a nickel content of
15 wt~ was activated in the normal manner between the runs
To monitor the monomer utilization throu~hout the run the equations
shown above for LPR and conversion with n=3 were used ie a propene
balance was done assumin~ no mass loss The results are shown in Fi~ure
437 for the run at BOdegC and in Fi~ure 439 for the run at 200degC
Figure 438 shows that at eoc the activity rapidly declined as the
composition of the 1 iQuid product rapidly approached that of the Co
feed At 200middotC however as shown in Figure 440 the 1 iQuid composition
was steady and contained about 40 wtY dimer after 8 h on stream
411 TGOTA
In Figure 441 the TO and OTA Curves for a fresh HOD type catalyst with
a nickel content of 117 wt~ are shown The catalyst was held under
flowin~ nitrogen throughout
Up to SOOC an exothermic peak probably indicating the removal of
chemisorbed water was recorded At approxlmately 530C the Curve
became endothermic probably due to the decomposition of the Ni-Urea
complex to form NiO
From the TO Curve It can be seen that the intermediate species formed
were not stable until the final endothermiC event at 530middotC Beyond this
temperature the TO Curve levelled out indicating that a stable species
was formed The overall mass loss from the catalyst was 14 wtY
To determine the quantity of water that the catalyst adsorbs a
oreviously calCined catalyst was exposed to air and the TG and OTA
curves were subsequently recorded The results of this run using the
same catalyst as before are shown in Figure 442 This figure shows a
broad exothermic peak up to 600degC and an overall mass loss of 367 wtX
To establ ish the quantity of hydrocarbons adsorbed on the catalyst the
TG and OTA curves were recorded for a catalyst after it had been used
for the 01 igomerisation of propene The catalyst ysed was an HO~ type
catalyst with a nickel content of 117 wtX The catalyst was exposed to
flowing air while recording the TG and OTA Curves The r~sults are shown
In Fi9ure 443
102
00 20 60 TIME H
FIG 437 LIQUID PRODUCTION RATE (GHGJ AND CONVERSION (MASS) FOR PROPENE VS TIME (H) LIQUID laquo69C FRACTION)AND GAS FEED HDD-19
600
bull 300
a
bull 0 200
bull J 1 00
000
CODE NI(Wn) TR(C) P(ATM) WHSV HDD-19 15 80 40 88
~=PRePENE ceNVERSlaN ~=LIQUIO PR60UCTIeN RATE
600
~ 600 (j)
(j)
IT 400
Z
300 ~
(j)
a 200 w
gt z ~ 100 u
00
1000
~ (j)
(j) 800 a
600bull
(j)
~ 0 400 8 U
bull Cl 200 -J
00
~OIMER ~TR IMER l =TETRRMER +=PENTRMER
00 20 40 60 TIME H
FIG 438 LIQUID CGMPOSITION (MASS) OF ENTIRE LIQUID EFFLUENT VS TIME (H) LIQUIDlaquo69C FRACTION) AND GAS FEED HDD-19
103
bull 200 -1
gt200 Z
o U
CODE NI(WTX) TR(C) P(ATMl WHSV 800800 HDD-20 15 200 40 77
m=PRBPENE CBNVERSIBN RATE~=LIQUIO PRBOUCTIBN
~ o (f)
(f)- 600 600 I IT - L o
Z 400 0bull 400
a (f)
bull a 0 w
000 00
00 20 40 60 80 100
TIME H FIG 439 LIQUID PRBDUCTIBN RATE (GHGl AND
CBNVERSIBN (MASS) FBR PRBPENE VS TIME (H) LIQUID laquo69C FRACTIBN)RND GAS FEED HDD-20
II=OIMER600 ~=TR I MER to =TETRAMER +=PENTANER X=HEXANER ltgt=HEPTAttER
bull
(f)
o 0 L o
400
U 200
-00
00 20 40 60 80 100
TIME H FIG 440 LIQUID CBMPBSITIBN (MASS) BF ENTIRE
LIQUIO EFFLUENT VS TIME (H) LIQUIDlaquo69C FRACTIBN) RND GRS FEED HDD-20
104
u
-w u z ~ W 0 -(j)W
(j)U U 0 I 0
(j) (j)w
0 4 =gt x IshyltC 0 w Q x W Ishy
200 400 600 800
TEMPERATURE C
FIG 441 MASS lOSS (~) AND TEMPERATURE DIFFERENCE (OC) VS
FURNACE TEMPERATURE (OC) FOR A FRESH CATALYST 20 m~ sample
10
5
0
-5
-10
-15
CODE NI(WTX) GAS HDD-O 11 3 N2
~
o
10 u
-w u z 5 w
~0 w u (j) shyu (j)
0 -0 0I W (j)0 (j)=gt 4Ishy J4 0 w Q J
-5 W Ishy
-10~ CODE
-15cNIltWn) GAS
113 Nz
I r I I
0 200 400 600 BOO TEMPERATURE C
FIG 442 MASS LOSS (X) AND TEMPERATURE DIFFERENCE (ac) Vs FURNACE TEMPERATURE (OC) FOR A CALCINED tATALYST
WHICH HAS BEEN EXPOSED TO AIR 19 m~ sample
105
The OTA curve was exothermic below 400middotC probably as a result or
combustion of the adsorbed hydrocarbons No other thermal events
occurred The TG curve showed that the overall mass loss was 96 wt~
To establish the eftect Ot synthesis techni~ue the TG and OTA curves Ot
a SG IMP and HOD type catalyst were recorded under tlowing air In each
case the catalyst had been used for the 01 Igomerlsation Ot propene
In Figure 444 the TG and OTA data for an IMP type catalyst with a
nickel content of 083 wt~ are shown There were an exothermic peak at
340degC and a shoulder at approximately 400C probably due to the
combustion of the adsorbed hydrocarbons The TG curve also shown in
Figure 444 shows that the overall mass loss was 173 wt~
In Figure 445 the TG and OTA curves for an HOD type catalyst with a
nickel content ot 15 wt are shown The OTA curve showed a broad
exothermiC peak between 300 and 400 o e The overall mass loss was 12 wt
In Figure 446 the TG and OTA data for an SG type catalyst with a nickel
content of 151 wt are shown The OTA curve showed that an exothermic
peak in the vicinity Ot 300degC The TG curve showed a continual mass
loss up to 600degC the overall mass loss being 244 wtY-
412 NMR
The 1H MNR spectra recorded were those of the bulk I i~uid collected
throughout a run For each type of catalyst the spectrum determined was
that of the I i~uid collected at the reaction conditions deemed optimum
viz bull aoc and 40 atm over a catalyst with a nickel content of 15 wt
The results obtained are shown In Table 42 and Table 43 while the
spectra are shown in Figures 447 448 and 449
106
10 u
UJ
I u 5 z UJ a
~
UJ (f)U (f)u 0
~
0 I
0 J
(f)UJ (f) gt~ middot1a 4 I~
l- x 4 a UJ 0-
-5 x UJ Ishy
-10
CODE NI(WT~) TR ( C) P(ATM) WHSV GAS HDD-13 113 80 40 54 AIR
-15 I
0 200 400 600 800
TEMPERATURE degC
FIG 443 MASS LOSS (~) AND TEMPERATURE DIFFERENCE (GC) VS
FURNACE TEMPERATURE (OC) FOR A USED CATALYST
HDD-13 185 mg sample
15
10
5 u
UJ 0 U Z UJ a
~
UJ -5-(f)U (f)U 0
0 J -10 (f)UJ (f)a
~ 4 l- x -15 4 a UJ 0- -20x UJ Ishy
CODE NI(Wn) TR ( C) P(ATM) WHSV GAS -25 IMP-1 08 80 40 42 AIR
-30 0 200 400 600 BOO
TEMPERATURE e
FIG 444 MASS LOSS (X) AND TEMPERATURE DIFFERENCE (OCl VS
FURNACE TEMPERATURE (OCl FOR A USED CATALYST
IMP-l 18 mg sample
107
15
10
5 u
~
UJ 0 U Z UJ ~ IX UJ -5R
U () U () 0- 0 a J -10 UJ () IX ()
gt lt l- I -15 lt IX UJ ~ I -20 UJ I shy
CODE NI (Wn) TR(C) P(ATM) WHSV GAS -25 HDD-l 15 80 40 42 AIR
-30 600 BOO0 200 400
TEMPERATURE c
FIG 445 MASS LOSS (X) AND TEMPERATURE DIFFERENCE (OC) VS
FURNACE TEMPERATURE (OC) FOR A USED CATALYST
HDD-l 17 mg sample
to)
~
UJ 0 to)
Z ~UJ
IX UJ -5R
()U ()U 0
a J -10 ()UJ ()IX
gt lt l- I -15 lt IX UJ ~ I -20 IJJ I shy
CODE NI(WTX TR(C) P(ATM) WHSV GAS SG-3 30 80 40 37 AIR
-30 I I I 0 200 400 600 BOO
TEMPERATURE C
FIG 446 MASS LOSS (X AND TEMPERATURE DIFFERENCE 1degC) VS
FURNACE TEMPERATURE (OC) FOR A USED CATALYST SG-3
17 mg sample
-25
108
c
-I 0 J gt-lt
Z ) 0
J 0 0 U
I shyU ) Cl 0 0 0
0 gt-lt ) 0 gt-lt J
U 0
ltt 0 I shyU W 0 ()
0 J Z
Cl J
co
M
I
I l--r
JiI I
I LLf)
t
r-shyq q
0 gt-lt u
T~
------H
G
F
E
o Q
o
FIG 448 IH NMR SPECTRA OF LIQUID PRODUCT FROM RUN SO-3
BA L
M
---L
1-shy
5 4 3 2 1 o 6
c
110
LL o o
-I C C x z )
cx I 0 cx LL
I-U ) C 0 a a c -) C -J
u 0
ltr cx I-U UJ a (J
a I Z
x
0-lt1
U1
lt1
lt) shyu
111
Table 42 Integrated areas
Run code Area code
A B C o E F G H L M N
IMP-l 00 10 120 320 205 145 250 195 10 125 00
SG-3 20 30 190 430 305 220 365 225 15 158 00
HDD-l 75 50 230 490 332 235 355 222 20 220 00
Table 43 Carbon areas and branching
Code CH CHJ CH
IMP-l 258 275 210 094 123 076
SG-3 350 253 295 079 123 067
HDD-l 372 517 309 072 120 060
112
5 DISCUSSION
The effect of the synthesis procedure on metal distribution and
dispersion in nickel silica catalysts was examined in detail by amongst
others Hermans and Geus (1979) Blackmond and Ko (1984) Montes et al
(1984) and in a more general sense by Maatman and Prater (1957)
The conclusions reached by these workers as to how the synthesis
procedure effects the metal distribytion and dispersion and hence
catalytic activity has been discussed in Section 13 and are briefly
summarised below Using their Conclysions an attempt was then made to
explain the activity of an HOD type n i eke 1 oxide s i 1 i ca alumina
catalyst
Impregnation as discussed in Section 132 and 362 involves the the
homogeneous increase in concentration of the nickel precursor by the
evaporation of the solvent In terms of preCipitation theory as
discussed in Section 13 the homogeneous increase in the concentration
of the metal salt results in the formation of a 1 imited number of large
nuclei which are evenly distributed over the support The reason for
this is that providing the concentration of the solution is kept
homogeneoys the rate of increase in concentration is equal to the rate
of Crystal growth Consequently the concentration of the solution Will
remain between that of the solubil ity and supersolubil ity curves where
no new nuclei can develop This has been disc~ssed in Section 1331
Th is was in fact foun d to be t he case by Montes et a 1 (1984) ljho in the
case of an inpregnated Ni silica catalyst recorded an average nickel
particle diameter of 52 nm They further suggested that only a weak
interaction exists between the metal preCursor and the support If this
were so then upon calcination the crystal size should increase (Section
1324) and the metal should be present in a form 31milar to that of
the bulk oxide They in fact found this to be so ie bull the average
nickel particle size inCreased to 45 nm after calcination for 16 h at
450degC in dry air The fact that the metal was present in a form similar
to that of the bulk oxide In calcined Impregnated nickel silica
catalysts had been established earlier by Houalla and Delmon (198ll
In the case of impregnated nickel sl1ic3 alumina catalysts no data was
available indicating the degree of interacton between the support and
the metal It is however assumed that in the case of this ta+almiddotst
the interaction between the support and the metal pr~Cursor are also
113
weak and that a similar redistribution and corresponding increase in
crystal size occurs during calcination It is also suggested that the
metal is present in a form similar to that of the bulk oxide
It is well known that for optimum catalyst activity a large specific
surface area and hence a finely divided sol id is required (Hermans and
Geus 1979) Small crystallites ensure high specific metal areas but
increasing nickel concentration results in agglomeration In the case of
impregnation the drying and calcination procedures result in the
formation of a heterogeneity of crystal sizes when the nickel content is
greater than about 5 wt~ Increaslng the nickel content beyond 5 wt~
results in broad and even binodal crystal size dispersion which not only
affects the activity due to loss of surface area but also the thermal
stability ie bullbull resistance to sintering (Richardson and Dubus 1978) It
is proposed that this fact accounts for the observed loss in propene
01 igomerisation activity recorded by Hogan et al (1955) and Holm et al
(1957) over impregnated nickel oxide sil ica alumina catalysts when the
nickel content was raised beyond 5 wt~ Thls proposal was further
supported by Dorl ing et al (1971) who predicted that when increasing the
nickel content below 5 wt~ the number of crystall ites would increase but
that the mean crystal size would remain approximately constant Beyond 5
wt~ nickel on the other hand they predicted that the number of
crystall ites would remain constant as the nickel content was increased
but that the crystall des woul d increase in size This has been
discussed in detail in Section 1323
From the above discussion it can thus be concluded that the activity of
impregnated catalysts is only a function of the the extent of metal
distribution and dispersion which in turn is a function of the metal
content
It would thus be desirable to produce a catalyst in which the crystals
generated during synthesis are held by the support and thus are
prevented from migrating and agglomerating during subsequent heat
treatments One such method is co-precipitation In the case of this
synthesis procedure as discussed in detail in Section 134 and 364
a reaction oCcurs between the support and the metal ie the meta] is
held by the support and the crystals are uniformly distibuted
throughout the matrix This type of catalyst was found to be much more
active for the 01 igomerisation of propene than impregnated cata list s
According to Holm et al (1957) th is is due to the hish extent of
distribution and dispersion of the nickel Ions present in thiS catalyst
However the same 1 imitations of nickel content on the activity were
114
observed ie the catalysts with a nickel content between 3 and 5 wt
were the most active (Holm et al 1957) In the case of SG type catalyst
this cannot be explained in terms of loss of dispersion with increasing
nickel content as it has been shown by Holm et al (1957) that the
crystal size remained unchanged as the nickel content was raised from 3
to 20 wt~ The reason that the activity did not increase as the nickel
content was raised beyond 5 wt may either be due to the inaccessibility
of the reactant molecules to the nickel or due to the nickel being in
an unsuitable form ie Nio as opposed to Ni+ 2 (NiO) after
calCination The latter was supported by the fact that the nickel was
diffiCult to reduce ie bullbull a reduction of only 50 was achieved after 2
h on stream at 500degC by Holm et a1 1957gt
It is thus proposed that although crystal dispersion remained unchanged
in co-precipitated nickel silica alumina catalysts up to a nickel
content of 20 wt the location and form of the crystals prevent total
utilisation of the available metal
Since most unsupported catalytically active materials sinter rapidly at
the conditions of calCination andor reaction (Hermans and Geus 1979)
the active compound has to be attached to a highly porous thermostable
support such as s11 ica or silica alumina This support which is often
not catalytically active itself increases the dispersion of the
catalytically active material Also the support is used most effectively
when the active material is distributed densely and uniformly over it
and is firmly held by the support A rapid transportation of the
reactants and products through the porous catalysts is also a
prerequisite for an active solid catalyst Sil ica alumina is such a
support but the available method of loading rlicke1 onto it viz bull
impregnation does not lead to an adequate degree of interaction between
the support and the metal An alternative method of loading ~lckel onto
sil ica alumina is thus required in which a uniform dispersion and
distribution could be ensured together with a strong interaction between
the support and the metal
In the case of nickel sir ica catalysts such a method was developed by
van Dillen (1976) and was termed homogeneous decompOSition deposition
(HOD) In this method as discussed In detail in SectIon 133 and
Section 363 the high degree of penetration or the solute into the
support during impregnation was combined with a controlled Ion exchanse
type preCipitation
115
In the case of nickel silica catalysts prepared by HOD measurements of
particle size distribution indicate a range of between 1 and 3 nm for
loadings of up to 30 wt~ nickel (Richardson and Dubus 1978) Furthermore
a strong interaction exists between the support and the metal and
conseQuently this type of catalyst was extremely resistant to sintering
Thus in the case of an HOD nickel sil ica catalyst with a nickel content
of 83 lilt Montes et al (1984) showed that after calcination in dry air
at 450degC for 16 h the averase diameter of the nickel particles decreased
from 51 to 46 nm In the case of an impregnated nickel sil ica
catalysts with the same nickel content the average nickel particle size
after calcination at the same conditions was 45 nm From this it may be
concluded that in the case of HOD nickel si 1ica catalysts the metal is
not present in the bulk oxide form This was in fact confirmed by Montes
et al (1984) usins X-ray diffraction The exact nature of the form of
the metal on the surface is not known Also the crystall ites in HOD
nickel si1 ica were readily accessible This was inferred from the
results of Blackmond and Ko (1984) who recorded 100~ reduction after 4 h
on stream at 500degC
From the discussion presented above it can be seen that the method of
homogeneous decomposition deposition produces a nickel sil ica catalyst
where the nickel is distributed densely and uniformly over the support
and that a strong interaction betweenthe support and the metal exists
In the case of nickel oxide si 1 ica alumina catalysts prepared by
homogeneous deComposition deposition no data was avai1ab1e in the
1 iterature either on the degree of dispersion or distribution or on the
support-catalyst interaction It is however thought that in view of the
results obtained from nickel si1 ica catalysts a high degree of
interaction occurs and that the crysta1l ites are uniformly and densely
distributed throughout the support
In this work the extent of metal distribution and dispersion on the
support phase and the nature of the support metal interact ion of nickel
oxide silica alumina catalysts prepared by homogeneous decomposition
depOSition were not investigated However the catalytic activity and
selectivity of this catalyst for the 01 igomerlsation of propene were
examined in detail and compared with the activity and selectivity of
nickel oxide si 1 ica alumina catalysts prepared by impregnation and coshy
preCipitation A discussion of each aspect of the work is now given
The reproduCibll ity study (Section 411 indicated that the experimental
results obtained in this study were reliable Once steady state
116
operation was reached both the selectivity and LPR showed 1ittle
variation between runs at similar reaction conditions
The reaction conditions used were unless otherwise stated (see iable
41) 80degC and 40 atm It can be seen from the phase diagram shown in
Appendix B that the reactants were in the 1 iQuid phase ConseQuently a
two phase system was studied When the temperature was raised above the
feed bybb1e point temperature of 86degC at 40 atm ie when the
reactants were in the vapour phase a three phase system was studied
The aim of this study was to compare the characteristics of a nickel
oxide si1 ica alumina catalyst synthesised via the HOD method adapted by
the author from the work done by van Dillen (1979) on nickel oxide
si1 ica catalysts with those of a catalyst prepared by the standard
impregnation techniQue (referred to as IMP) and co-precipitation
(referred to as SG) as discussed by Holm et al (1957gt
The effect of synthesis procedure on the propene ollgomerisation
properties of nickel oxide sil ica alumina was investigated by Holm et al
(1957) for an IMP type catalyst and a coprecipitated (SG) type catalyst
They found that the oligomerisation activity of SG type catalysts was
approximately 15 times that of IMP type catalysts HOD type catalysts
on the other hand had an activity similar to that of IMP type catalysts
but their performance was not as sensitive to the reaction conditions
and nickel content as IMP and SG type catalysts were With this in ~ind
a comprehensive study of the effect of reaction conditions using nickel
oxide sil ica alumina a catalysts prepared by homogeneous deComposition
deposiUon impregnaUon and to a 1 imited extent cODrecipltation were
carried out
Firstly the effect of the Quantity of nickel loaded onto the catalysts
was Investigated In the case of IMP type catahsts Hogan et al (1955)
had found that a nickel content between 3 and 5 wt gave the most
active catalyst Holm et al (1957j examinin9 the propene 01 igomerisaticn
actIvity of IMP as well as SG type catalysts found that irrespective of
syntheSis techniQue catalysts with a nickel content between 3 and 5 wt~
were the most active
In the case of IMP type catalysts examined in ~he present study no such
trend was observed IncreaSIng the nickel content from 22 wt to 63
wt~ at an average WHSV of 48 and 49 ghg respectiv~ly caused the LPR
to decrease by 42 Using on the other hand catal S With a nlck~l
content of 19 and 98 wtl at an avera~e WHSV of 53 and 52 9h~
117
respectively an increase of 5X In LPR was recorded In view of the
conf1 icting results obtained in this study and the differences In WHSV
from run to run no statement as to the effect of nickel content on the
activity of impregnated nickel oxide sil ica alumina catalysts could be
made
In the case of an HOD type catalyst increasing the nickel content did
not lead to a marked change in the LPR Differences in the WHSV and the
fact that the conversion was greater than 90 wtX in all the runs make a
comparison of the results diffiCult However comparing runs with
identical average WHSV viz bull 42 ghg showed that changing the nickel
content from 15 wtX to 72 wtX did not affect the LPR Similarly at a
WHSV of 49 and 50 ghg identical LPR were observed for catalysts with
nickel contents of 117 and 22 wtre
Thus although the study of the effect of the nickel content on the LPR
in the case of both IMP and HOD type catalysts is not unambiguously
conclusive the available data seems to indicate that the activity of an
HOD type catalyst was relatively independent of the nickel content and
that irrespective of nickel content HOD type catalysts were on average
20r more active than IMP type catalysts
It was observed while examining the effect of WHSV on the activity and
selectivity over HOD type catalysts that the selectivity was a function
of the Conversion ie bullbull a shift to 1 ighter products was recorded when
the conversion decreased Neither IMP type catalysts nor HDD type
catalysts exhibited a strong dependence of product composition on nickel
content In the case of IMP type catalysts the catalysts with 08 wt
nickel did show a greater selectivity towards trimers but the overall
trend observed was a gradual increase in dimer yield with increasing
nickel content at the expense of the trimer (Section 42) The small
Increase in dimer yield with increasing nickel content observed in this
work was in agreement with the data reported by Takahashi et al (1969)
who recorded the maximum dimer Yield for an impregnated nl~kel oXlde
sil ica alumina catalyst with a nickel content of 97 wt ~
The selectivity of HOD type catalyst was independent of the nickel
content when the nickel content was held between 1 3nd 7 wt~ At a
higher nickel content viz bull 11 wtX a decrease of 10 In dimer yield was
observed After careful examination of the data however it was found
that after 4 h on stream the WHSV for the catalysts with 22 and 17
wtY nickel were 53 and 49 respectively This 8 decrease in WHSV
between the runs may explain the observed decrease in Jimer yjel~
118
It may thus be concluded that the activity and selectivity of HDD type
catalysts were independent of the nickel content with in the range of
nickel loadings of 15 to 117 wtX In the case of IMP type catalysts
increasing the nickel content caused a shift to 1 ighter products with no
discernible effect on the activity
The effect of varying the pressure at a fixed temperature on the
activity and selectivity of an IMP type catalyst was investigated in
detail by Takahashi et al (1969) In the present work the effect of
varying the pressure at a fixed temperature of 80 c C for an IMP as well
as for HOD and SG type catalysts was investigated For an IMP type
catalyst the results obtained were similar to those of Takahashi et a1
(1969) Thus in the case of IMP type catalysts a drop in activity was
recorded when the pressure was lowered from 40 atm to 20 atm at a
constant temperature of 80 c C ie bullbull when the system moved into the
vapour phase In the case of an SG type catalyst it was found that the
catalyst was inert at 20 atm
In the case of a HOD type catalysts differences in WHSV and the fact
that the conversion was greater than 88 wtX in all runs make an
interpretation of the results difficult From the available data it can
however be seen that although the average WHSV increased from run to
run the LPR over HOD type catalysts remained constant as the pressure
was dropped from 50 atm to 20 atm From this it may be concluded that
the activity of HO~ type catalysts decreased as the pressure was
deCreased
In respect of the effect of pressure on product selectivity Takahashi
et al (1969) found that when the system moved into the vapour phase at a
constant temperature a shift to heavier products occurred Using an IMP
type catalyst this was also observed in this stJdy ie bull a dr0P or
in dimer yield mainly in favour of the trimer was observed when the
pressure was dropped from 40 atm to 20 atm In the case of HOD type
catalysts an opposite trend was observed viz bull decreasing the pressure
from 50 atm to 20 atm resulted in an almost 1 inear increase in dImer
i e 1 d
From the above discussion It can be seen that IMP type catalysts
contradict thermodynamics with regards to selectivity It was expected
from thermodynamics that as the pressure was decreased From 50 to 20 atm
the dimer yield should increase In the case of an HDD type eatalst
thiS was found to be the case Tn the case of IMP type catalysts
however an opposite trend was was observed Ie a ShiH to heavier
119
products as the pressure was decreased from 50 to 20 atm The observed
shift to heavier products with decreasing pressure may be explained if
it is assumed that at the lower pressures the heavier products are able
to evaporate off If this were so then in the case of HOD type catalysts
the yield of heavier products should also increase as the pressure was
decreased This was infact found to be the case although the increase in
trimer yield was very small In the case of both IMP and HOD type
catalysts the activity decreased as the pressure was decreased
To complete the study of the effect of reaction pressure and temperature
on the selectivity and activity the effect of varying the temperature
at a fixed pressure was investigated Since the above results for IMP
type catalysts were in agreement with those of Takahashi et al (1969)
and much information is available in the 1 iterature on IMP type
catalyst no further experimental work using IMP type catalysts was
done ConseQuently the results obtained from the 1 iterature were used to
compare IMP and HOD type catalysts
In the case of IMP type catalysts Takahashi et al (1969) foun d that
moving into the vapour phase ie when the temperature was raised
above approximately 90degC at a pressure of 50 atm a sl ight drop in
activity was observed Increasing the temperature beyond the bubble
point of the feed was accompanied by a shift to heavier products The
reason that the catalyst activity decl ined only sl ightly with increasing
temperature at 50 atm was that the sil ica alumina support becomes active
at the higher temperatures At 35 atm on the other hand crossing the
phase boundary results in a rapid decl ine in propene conversion with
increasing temperature The reason for this is that si 1 ica alumina is
only sl ightly active at 35 atm for the 01 igomerisation of propene
ltTakahashi et a11971gt The shiH in product spectrum ie a shiH
to heavier products can also be explained in terms of silica alumina
activity This is so because the preferential product of silica alumina
when the latter is used for the 01 igomerisation of propene is a propene
trimer (Feldblyum and Baranova 1971 Takahashi et a1 1971)
The nature of the products formed over si 1 ica alumina wheuron Jsed for the
01 igomerisation of propene and the effect of temperature on the activity
and selectivity were examined The results obtained were in agreement
with those of Takahashi et al (1972) liz silica alumina was actve
for the 01 igomerisatlon of propene as long as the system temperature
remained above 150degC Also the activity Jropped with decreasing reaction
temperature At 80degC Ie in the 1 iquid phase at 40 atm the catalyst
was inactive This was not in agreement with the results of Feldblyum
120
and Baranova (1971) who in a batch reactor recorded 6X conversion at
64degC and 50 atm The reason for the difference in the results was
properly due to the different pressures used ie bullbull 40 atm in this work
as opposed to their 50 atm and the di fferent process ie batch as
opposed to fixed bed reactor The product spectrum obtained agreed with
that foun d by other workers viz bull decreasing trimer yield With
increasing temperature and propene trimer being the main product
In the case of an HOD type catalyst increasing the temperature at a
fixed pressure resulted in the LPR dropping by approximately 50r when
the system moved into the vapour phase Increasing the temperature
further did not result in any marked changes in the LPR Thus although
the average WHSV increased from run to run the LPR remained
approximately constant as the temperature was increased From this fact
it may be concluded that the activity of the catalysts decreased as the
temperature was increased
The overall shift to heavier products when raising the temperature from
80degC to 150degC ie bullbull an increase in propene trimer at the expense of the
propene dlmer was expected in view of the catalytiC role of the sil ica
alumina support at the elevated temperatures The increase In dimer
yield as the temperature was raised further from 150degC to 210degC could be
explained in terms of the increasing WHSV and hence decreasing activity
of the catalyst (See Section 441)
From the different trends in product spectrum recorded when operating in
the vapour phase ie bullbull an increase in trimer yield with increasing
temperature when using nickel oxide sil ica alumina as opposed to a
decrease in trimer yield when uSing silica alumina observed in this work
it could be concluded that in supported nickel catalysts the ni~kel
still played a role at the elevated temperatures ThiS conclusion was
also supported by the results of Takahashi et al (1972) who found that a
physical mixture of sll iea alumina and nickel oxide had the same
activity as sil ica alumina alone thus indicatin9 the importance of
supporting the nickel Also the conversion over nickel oxide s11 ica
alumina was less senSitive to the reaction temperature then was the case
for silica alumina when the system was operated in the vapour phase at
40 atm Thus in the case of si 1 iea alumina a drQP in LR of 83~ was
recorded when the temperature was dropped by 50degC from ZODoC while in
the case of a HOD type catalyst3 an increase In LPR of 30 was recorded
when the temoerature was decreased over the same range
The 1 ifetimes of the catalysts were examined by the changes in the
activity over the first 10 h on stream In the case of an IMP type
catalyst data was avai lable in the 1 iterature on the 1 ifetime when this
type of catalyst was used for the 01 igomerisation of butene (Hogan et
al 1955 Allum 1974) The results obtained by these researchers was
that the activity of the catalyst did not change markedly after 100 h
and 21 days on stream respectively No data was however available on
the 1 ifetime of this catalyst when used for the 01 igomerisation of
propene
As using the changes in activity over the first 10 h on stream as an
indication of 1 ifetimes was very sensitive to WHSV fluctuations both
the changes in LPR and WHSV have to be recorded The average WHSV in
this run was 53 ghg In the case of an IMP type catalysts the LPR
dropped by 175X after 5 h on stream during which time the WHSV dropped
by 1X In view of the fairly constant WHSV and the large drop in LPR it
may be assumed that IMP type catalysts deactivate rapidly when used for
the oligomerisation of propene A slight shift to lighter products was
also observed during this run which was expected in view of the
decreasing activity
In the case of SG type catalysts the LPR dropped by 96~ while the WHSV
dropped by 21~ after approximately 6 h on stream The average WHSV
during this run was 52 ghg The change in the WHSV was considered
acceptable and so it may be concluded that this type of catalyst
deactivates less rapidly than IMP type catalysts do when used for the
01 Igomerisation of propene This conclusion was also reached by Holm et
al (1957) In the case of this catalyst a slight shift to lighter
products was also observed with time on stream
In the case of a sil ica alumina when operated at 200degC the LPR dropped
by 315~ while the WHSVover the same time period of 76 h dropped by
28X The average WHSV during this run was 35 gh9 From these results
it can be seen that this catalyst rapidly deactivates when used for the
01 igomerisation of propene at 200degC A very sl ight shift to 1 ighter
products was observed during this run
In the case of an HOD type catalyst no data as to the 1 ifetime ~as
available and hence a long run was performed The LPR fluctuated during
this run due to WHSV fluctuations The average WHSV during this run was
52 ghg USing data pOints 105 h apart with nearly Identical WHSV of
56 and 57 ghg respectively it was found that the Conversion
decreased by 126X over this period The selectivi~y also changed during
122
this run ie bullbull the Quantity of dimer formed increased by 25~ at the
expense of the tetramer and pentamer after 120 h on stream
The I ifetime of the catalysts as measured by the drop in activity over
the first 10 h on stream are in order of decreasing length HODgt sa gt
IMPgt SA It may thus be concluded that HOD type catalysts are superior
with respect to 1 ifetime when used for the 01 igomerisation of propene
than any of the other catalysts studied
The effect of varying the ~HSV on the activity and selectivity of IMP
type catalysts was examined by Takahashi et al (1969) and by Hogan et a1
(1955) who also examined the effect of feed composition They found as
discussed in detail in Section 1524 that the rate of polymer
production increased 1 inear1y with propene concentration ie bull a first
order relationship between propene concentration and rate of polymer
formation was obtained The optimum space velocity for maximum
conversion was less than 2 ~ of propene per ~ of catalyst per hour
(Takahashi et a1 bull 1969) At higher ~HSV Takahashi et al (1969) found
that the conversion dropped rapidly
In the case of HOD type catalysts the LPR increased with the ~HSV
However the catalysts deactivated rapidly at the higher WHSV ie bull a
WHSV greater than 11 ghg in this work resulted in a drop in the LPR of
28X after 7 h on stream As expected the overall conversion decreased
with increasing WHSV droPPing from 96~ at the lowest WHSV of 49 ghg
to 77~ at a WHSV of 116 ghg
The selectivity was also affected by the changing WHSV viz a shift to
1ighter products and an increase in dimer Yield was observed with
increasing WHSV This trend is OPPOSite to that observed by Takahashi et
a1 (1969) who found using IMP type catalysts that dimer selectivity
decreased for a WHSV greater than 32 ghg Why this shoyld be so is
not known The trends In conversion are however identical viz bull
Conversion decreased with increasing WHSV
The effect of operating the catalyst initially at ZOOdegC and then reusing
ii at SOdegC was examined The catalyst was calCined in the normal man~er
between the two runs The effect on LPR and selectivity of operating the
catalyst at 200degC has already been discussed
From the results obtained in this study It was found that the actiVity
of the catalyst at sooe was affected by operating it first a~ 200degC and
the steady state Conversion after 4 ~ on stream e11 by 28~ from that
123
of a catalyst used under normal conditions The selectivity ~as also
affected by this procedure a shift to 1 ighter products being recorded
The reason for the decrease in activity ~as probably the same as that
suggested by Hogan et al (1955) in the case of IMP type catalysts
~hereby the nickel oxide promoter under~ent changes such as sintering or
a change in oxidation state during the repeated calcination and high
reaction temperature ~hich caused the activity to decl ine The catalyst
~hen operated under normal conditions did not deactivate to any marked
extent and hence no data as to the effect of repeated calcination on
the activity and selectivity ~as available
The effect of feed contaminants ~as examined in detail by Hogan et al
(1955) using an IMP type catalyst This ~as discussed in detail in
Section 1525 In this ~ork only the effect of ~ater on the activity
and selectivity ~as examined In the case of an IMP type catalysts Hogan
et al (1955) found that if the catalyst ~as allo~ed to absorb as little
as 05 ~t~ moisture the catalyst deactivated They found that this type
of contamination ~as totally reversible
In the case of an HDD type catalyst using an undried feed containing 112
ppm (vv) ~ater the catalysts deactivated after J5 h on stream as
opposed to the more than 120 h recorded ~hen using a dry feed Using the
average WHSV of 51 ghg to calculate the quantity of ~ater fed to the
reactor and assuming that al 1 the ~ater entering the bed ~as absorbed by
the catalyst the mass of ~ater absorbed by the catalysts ~as 510- 3
9H20gcat or 05 ~t~ This result is consistent ~ith to that obtained
by Hogan et al (1955) for IMP type catalysts Furthermore the
contamination ~as totally reversible as the catalysts regained its
normal dry feed properties ~ith respect to activity and selectivity
after regeneration
To examine the catalytic properties of the HDD type catalysts when used
for the ollgomerisation Ot propene dimer (C6) the lt 69degC fractIon from
previous runs ~as fed to the reactor To quantify the activity of the
catalyst the equations as discussed in Section 49 ~ere used to
calculate the LPR and conversion At 80degC the catalyst was active for
the oligomerisation of C6 but deactivated rapidly This ~as probably due
to the hl9h molar ~ei9ht products formed viz a propene tetramer
(CI2) stallng on the catalysts and so blocklng the active sites Upon
raiSing the temperature to 200degC the catalysts raPldl~ re9ained activity
reaching a steady state conversion of 64 The only product formed
124
during this run to any significant extent was a propene tetramer
(Ct2)
Feeding Co and CJ simultaneously also caused the catalyst to deactivate
after approximately 3 h on stream at 80degC The maIn product formed
during this run was a propene trimer (C9) The reason for the rapId
deactivation was probably the same as above ie bullbull the accumulation of
the propene trimer (C9) in the system and consequent blocking of the
active sites After regeneration and reusing the catalyst at 200degC the
catalyst was again active for the 01 igomerisation of the CJCo mixture
In thIS case the main product was also a C9 01 igomer with Ct2 through
C2 t formed in reasonable quantities Co-feeding Co with CJ thus has the
effect of increasing the average molecular weight of the products over
that when pure CJ was fed although different temperatures are needed to
ensure reasonable activity when Co or a CoC] mixture was used
The oligomerisation activity of the si1 ica alumina support when feeding
Co or C]C6 at 2DDoC was not examined That the support does playa role
can not be disputed as si1lca alumina is catalytically active for the
01 igomerisation of propene at temperaturesgt 1SDoC The large Quantity
of C9 formed when co-feeding CJ and Co could be explained in two ways
Firstly it could be assumed that the co-o1 igomerisation of Co and CJ was
more rapid than the dimerisation of Co or secondly that the
trimerisation of propene was the main source of the trimer The second
option seems more 1 ikely as the preferential product of si 1 ica a11Jmina
when used for the 01 igomerisation of propene at 20DoC is a propene
trimer
In the case of Ni-lSM-5 Miller (1984) suggested the use of a two stage
system whereby a high Yield of propene tetramer was possible The system
suggested by Miller (1984) was that propene should first be dimerised in
the normal way over Ni-lSM-5 at 27 to 93degC and 27 to 109 atm followed by
a distillation to separate the dimer fr~m the other products The
second stage woul d then be the 01 igomer ig3t ion of the Co stream it 121
to 232degC and 14 to 54 atm to propene tetramers both reactions being
conducted in the liQuid phase The final liQuid product )btained
contained as much as 60 wtX propene tetramer ~rom the results obt31ned
in the present work it becomes apparent that HOD t~pe nickel oxide
Silica alumina also achieves this prodlct spectltJm The reactiCn
conditions used in thiS work were 80degC and 40 atm for stage one the
product containln3 65 wt dimer and 20DoC at 40 atm For stage two Yere
both reactions were also In the 1 iquld phase and the flnal product
obtained contained appr~ximately 45 wt propene tetramerlf on th~ ot~er
125
hand the feed to stage two is a mixture of C3 and C also at 20Doe and
40 atm the final 1 iQuid product contained 20 wt~ C9 with e12 to C21
also being formed in reasonable Quantities Thus depending on the feed
used the products obtained can range from predominantly dimer obtained
when pure e3 is fed to almost pure tetramer when a C feed is used to
a high molecular weight product C to e21 when C3 and C are fed No
information was however available as to the degree of branching of the
products formed
The effect of the activation procedure in the case of IMP type catalysts
was studied in detail by Takahashi et a1 (1969) with respect to aCidIty
structure and propene dimerisation activity They found that a
temperature between 500degC and 600degC was needed to activate the catalyst
and that the activity increased with increasing activation time up to 5
h above which the activity did not change A more detailed discussion on
the effect of activation procedure on the nature of the catalyst is
given in Section 1526
In the case of an HOD type catalyst using TOoTA the only thermal event
recorded was an endotherm between 500 0 e and 600degC This was probably due
to the decomposition of organic intermediate incorporated in the
catalysts during the synthesis to nickel oxide Below bOOoe the mass
loss was 122 wtra while 15 wt was lost between 600 and 800degC In view
of the work done by Takahashi et a1 (1969) as discussed above it was
assumed that in the case of HOD type catalysts the optimum calcinatl0n
temperature also lay in the region of 500 to 600 0 e
To determine the Quantity of water that the catalyst absorbed the
previously calcined catalysts was re-exposed to aIr and the mass loss
recorded In this run the rate of mass loss was fairly ynlform the
overall mass loss bein3 37wt From the results obtained it was
concluded that below 600degC ie bull below the endothermic event observed
In the case of the unused catalyst the onl) species removed frOM the
catalyst was water
To determine the Quantity of hydrocarbon held by the catalyst aft~r it
had been used for the 01 i90merisatlon of propene as a function of nl~~el
content the TOoTA Curves for 3n HOD type catalysts With a nlck-l
content of 113 and 15 wt~ were recorded In vIew of the abQv~
discussion the mass loss recorded below 6COo~ was probably due t) the
removal of water and in this case 1 i3ht hydrocarbons As +he catagtsts
uDon completion of a run were not stored In air ~i3ht c1ntainers ~hey
probably absorbed water from the atmosp~ere Consequent ~ ~~ mak~ t~~
126
comparison meaningful only the mass loss above 600degC was considered
Below 600 0 e the mass loss recorded were 81 and 105 wt~ for HOD type
catalysts with a nickel content of 113 and 15 wt~ respectively From
this result it can be seen that the higher the nickel content the lower
the amount of adsorbed hydrocarbon and hence the lower the degree of
active site contamination In view of this result it may be concluded
that a high nickel content is desirable to ensure a long catalyst
lifetime Above 600 0 e the mass loss was independent of the nickel
content and In both cases was approximately 15 wt~
To compare the effect of synthesis procedure and the Quantity of
hydrocarbon held by the catalyst after it had ~een used for the
01 Igomerisatlon of propene the TGDTA Curves for an IMP HOD and SG
type catalyst were recorded In this case the total mass loss was
considered and it was found that the sa type catalyst had the highest
mass loss (244 wtX) followed by the IMP type catalyst which had a mass
loss of 173 wt~ and an HOD type catalyst which showed a mass loss of
120 wtX From these results it can be seen that the HOD type catalysts
held the least amount of hydrocarbon which gave a further indication
that the extent of deactivation of this catalyst was not as great as
that of the other catalysts examined
The products obtained when propene ~as 01 igomerised over an IMP type
catalyst were found by Hogan et al (1955) to contain as much as 70 vol~
Co of which 35 vol~ were linear hexenes In the case of this work the
degree of branching ie the CH3 to CH2 and CH to CH ratio was
determined using 1H NMR From the results obtained the products formed
over the IMP type catalyst were the most branched followed by the
products formed over SG type catalysts The products formed over HDO
type catalysts were the least branched From the above results if it is
assumed that the degree of branching found in this work for the products
formed over IMP type catalysts correspond to the product spectrum Quoted
by Hogan et al (1955) then the products ormed over HOD and SG type
catalysts contain more 1 inear Cos than the products formed over IMP
type catalysts do
From the present work two Questions arise They are
(1) Why is nickel oxIde silica alJmlna active for the ol190merlsation
of Dropene at sooe and sil ica alumina only at temperatures great~r
than 150degC
127
(II) Why is the preferential product of nickel oXide silica alumina
when used for the oligomerisation ~f propene a propene dimer
while that of si1 ica alumina when used for the same reaction a
propene trimer
It is proposed that the differences observed are due to the nature of
the active site and hence the 01 igomerisation mechanism
In the case of silica alumina the nature of the active site is
controversial because of the lack of conclusive evidence The various
schemes that have been proposed (8 in total) are diSCussed in Section
1231 It can however be concluded from the structure of the products
formed as establ ished in detail by Feldblyum and Baranova (1971) and
discussed in detail in Section 1232 that sil ica alumina 01 igomerises
propene via a carbonium ion meChanism ThiS in turn would explain why a
high reaction temperature is needed for silica alumina to be active for
the 01 igomerisation of propene
In the case of nickel oxide silica alumina 5 schemes have been
formulated as to the nature of the active site and hence 01 i90merisation
mechanism The various schemes proposed have been discussed in Section
1241
An early indication of the nature of the active site was given by Clark
(1953) who sugsested that the nickel crystals in nickel oxide sil ica
alumina contained an excess of metal ions Hence the active center may
either be an anion vacancy or a nickel atom not directly linked to an
oxygen atom and situated at lattice or interstitial p~ints This
sU9sestion was used by Feldblyum et a1 (1974) who then continued to
draw a compar I son between the 01 I gomer i sat ion mecran ism over nom0geneous
catalysis based on nickel salt and organoaluminium compounds and
heterogeneous catalysts based on nickel OXide on acid carriers This has
been discussed in detail In Section 1242 and summarised In Table
11 The conclusion reached by Feldblyum et a1 (1984) was that the
01 igomerisatlon of propene over nickel oxide sll iea alumina proceeds via
a complex hydride This mechanism proposed by them accounts for t~e
observed activity and selectivity of nickel oxide sll i3 alumina
Thus although no eVidence eXists to support or discount the mech~~lsm
proposed by Feldblyum and Baranova (1971) to expain the activity and
selectivdyof Silica alumina and FeldblYJm et a1 (1974) to $ltplaln
the activity and selectivity of nickel oxide 811 ica alumina they s~r~e
128
as a 900d model It is however clear that more work is reQuired to
explain these observations
In conclusion
ltI) The incorporation of nickel into sil ica alumina enhances the
catalyst activity at low temperatures and affects the
selectivity ie bullbull causes a shift to I ishter products
(II) The method of incorporating the nickel affects the activity and
selectivity o~ this catalyst
(III) The activity and selectivity o~ nickel oxide sil ica alumina
catalysts prepared by the HOD method are independent o~ the
nickel content In the case of IMP and SG type catalysts this is
not the case
ltIV) The selectivity and activity of HOD SG and IMP type catalysts
are all sensitive to the reaction temperature and pressure
(V) The 1 i~etime of HOD type catalysts when used for the
01 igomerisation of propene was 3uperior to that of the other
catalysts studied
(VI) HOD type catalysts are more active than any of the other
catalysts examined
(VII) HOD IMP and SG type catalysts are all sensitive to the feed
moisture content The introduction of a wet feed results in hish
initial activity followed by rapid deactivation The rapid
deactivation may be due to the conversion of Lewis aCld sites
to Bronsted acid sites in the presence of water
(VIII) The product spectra of HOD and IMP type catalysts are similar 3G
type catalysts however exhibit a greater selectivity towards
heavier products
(IX) HOD type catalysts can be used for the 01 igomerisation 0 hl9h
molar welght 01 igomers
129
REFERENCES
Allum KG bullbull United States Patent Appl ication No 3816555 (1974)
Bartlett PO Condon FE bullbull and Schneider Abull J Am Chem Soc bullbull 66
1531 (1944)
Blackmond DG and Ko E Appl Catal 13 49 (1984)
Boreskov OK bull in Preparation of Catalysts (Delmon Bbullbull ed)
Elsevier Amsterdam 223 (1976)
Brookes CS bull and Christopher GLM J Catal 10 211 (1968)
Cartwright PFS bullbull Newman EJ and Idilson DId bullbull The Analyst 92
663 (1967)
Cervello J bullbull Hermana E Jimlnez J bull and Milo F bullbull in Preparation of
Catalysts ltDelmon Bbullbull eds) Elsevier Amsterdam 251 (1976)
Clark Abullbull Ind Eng Chem bullbull 45 1476 (1953)
Coulson JM bull and Richardson JF bullbull Chemical Engineering Vol II
Pergamon Press New York (1980)
Couper A and Eley D Dbull Discussions Faraday soc 8 172 (1950)
Dorling LA Lynch 13 IdJ and Moss LL bull JCatal 20190 (1971)
Dow IdM and Jakob Mbull Chem Eng Pro 47 637 (1951)
Dowden DA J Chem Soc bullbull 242 (1950)
Dutkuwicz RK bullbull Energy 1980 An Energy Pol ICy DiScussion Document The
Energy Research Institute- UCL 1980
Evans AG bullbull and Polantl ~L NatJre 152 733 (1947)
Feldblyum VSh bull and Baranova rT ZhlJrnal Orsanichesoi Kiml 7
2257 (1971)
130
FeldblyYm V Sh bullbull Petryshanskaya NV bullbull Lesheheva AI bullbull and Baranova
11 Zhyrnal Organischeskoi Khimii 10 2265 (1974)
Finch JN bullbull and Clark A JCatal bullbull 13 147 (1969)
Fontana CM bullbull and Kidder GA bullbull J Am Chem Soc bullbull 70 3745 (1948)
Forni L bullbull Catalysis Reviews Vol 8 (Heinemann Ht ed) Marcell
Dekker New York (1974)
Galya LG bullbull Occelli ML bullbull and Yoyng DC J Mol Cat 32 391
(1985)
Heertjiesl PM and Mc Kibbins SiAl Chem Eng SCi bullbull 5161 (1956)
Hermans LAM bullbull and Geys JN in Preparation of Catalysts II
(Delmont Bbullbull Grange P bullbull and Jacobs P eds) Elsevier The
Netherlands (1979)
Higley DP EYropean Patent Appl ication No 843052143 (1984)
Hill FN bullbull and Selwood PW J Am Chem Soc 71 2522 (1949)
Hirschler AE Am Chem Soc Meet Chica30 Sept 1970 Reprints
Div of Petrol Chem 15 A97 (1970)
Hogan JP Banks RL Lanning WC bullbull and Clark Abullbull Ind Ens Chem
47 LI (1955)
Holm VCF bullbull Bailey GC bullbull and Clark A Ind Eng Chem bullbull 49 250
(1957)
Holm VCF and Bailey GC bull and Clark A bullbull JPhys Chem 63 129
(1959)
Hoyalla M and Delmon B bullbull Surface and Interface Anal 3 103 (1981)
Hunter WH bullbull and Yohe RV bullbull J Am Chem Soc 55 1248 (1933)
Imal Hbullbull and Uchida Hbull Bull Chem Soc Japan 38 925 (1965)
Imai H Hasesawa L and Uchida H Bull Chem 30c Japan 41 45
( 1968)
131
Johnson 0 bullbull J Am Chem Soc bullbull 59 827 (1955)
Langlois GE bullbull Ind Eng Chem 45 1470 (1953)
Leva Mbullbull Fluidisation McGraw and Hill (1959)
LevensPlelO bullbull Chemical Reaction Engineering 2nd ed bullbull John Wiely and
Sons (1972)
Maatman RW bullbull and Prater CD Ind Eng Chern bullbull 49 2 (1957)
McNair HM bullbull and Bonell i EJ bullbull BasiC Gas Chromatography 5th ed
Varian Instrument Division (1969)
Mickley HS bullbull and Fairbanks DF bullbull AI Ch EJ 1 374 (1955)
Miller SJ bullbull US Patent 4608450 (1986)
Mizuno K bullbull Ikeda Mbullbull Imokawa T bull Take J bull and Yoneda Ybullbull Bull
Chem Soc bullbull Japan 49 1788 (1976)
Montes Mbullbull Penneman de Bosscheyde Cbullbull Hodett BK bullbull Delannay F bull
Grange P bullbull and Delmon B bullbull Appl Catsl 12 309 (1984)
Norrish RGIJ and Russell KE bullbull Trans Faraday Soc bull 43 91 (1952)
Ozaki Abullbull and Kimura K JCatal 3 395 (1964)
Ozaki Abullbull Ali H and Kimura K bullbull FOJrth Int Cong Catal Moscow 40
(1968)
Peri JB JCatal 41 227 (1976)
Ramser JH and Hill PB bullbull Ind Eng Chem bull 501 (1958)
Richardson JT and Dubus RJ bull J Catal 54 207 (1978)
Sato Mbullbull Aonuma T and Shiba T Poc Third Int Con-l Catal
Amsterdam 1964 1 396 (1965)
Schmerl ing L and Ipatieff )N bull Advances in catalysIs II New York
AcademiC Press Inc 21 (1950)
sc h u lt z R G S c h tJ C k J M and IJ i 1 d I B Cbullbull J Cat a1 6 385 (1 966
132
Shepard FE Roohes JJ bullbull and Kemball Cbullbull JCatal 1 379 (1962)
Smith JM bullbull and Van Noss HC bullbull Introduction to ChemIcal Engineering
ThermodynamiCs 3rd Edition McGraw and Hill International Book Company
New York (1981gt
Takahashi Kbullbull Sasaki 0 bullbull Aomura Kbullbull and Ohtsuka H Hokkaido Daisaku
Kogakubu Kenkyu Hokoku 53 201 (1969)
Takahashi K bullbull NishiH Yoneda Nbullbull and Ohtsuka Sekiyu Gakkai Shi 15
482 (1972)
Tamele MW bullbull Ind Eng Chem 8 270 (1950)
Thomas CL Ind Eng Chem bullbull 37 543 (1945)
Ublad AG bullbull Mills GA Heinemann Hbullbull Polymerization of Olefins
Emmet (ed) Catalysis 5 New York (1958)
Uchida H and Imai Hbullbull Bull Chem Soc Japan 35 995 (1962)
Van Dillen JA bullbull Geus JW bullbull Hermans LAM bullbull and Van Der Mejden Proc
Sixth Int Congo Cata] B7 (1976)
Walton AG bullbull in Dispersion of Powders in liquids (Parfitt GD bullbull ed)
Elsevier Amsterdam 122 (1969)
Ward JW bullbull and Hansford RC bullbull J Catal 13 154 (1969)
Weeks TJ bullbull Jr bullbull Angell CL Ladd IR bullbull and Bolton AP JCatal
33 256 (1974)
Whitmore FC Ind En2l Chern 26 94 (1934)
Yagi S bullbull and Kunii Dbullbull Fifth Int Symp on Combustion Reinhold (ed)
New Yor k 231 (1955)
133
APPENDIX A
1 Gas chromato~raph data
11 Gas samples
The settin~s used on the Gow-Mac 750p ~as chromato~raph tor all teed and
tail ~as analyses are 1 isted below
Chromatograph Go Mac 750p
Detector Flame ionisation
Attenuat ion 1
Range 10- t 0 ampsmV
Data system Varian 4270
Column length 55 m
Column diameter 4 mm
Column pressure 28 psi at 50C
Pack ing n-OctanePoracil C
N2 tlowrate 41 mlmin
H2 fl owrate 31 mlmin
Air flowrate 300 mlmin
Injector temp 150C
Detector temp 250C
Temp pro~ 10 min at 50C 10Clmln b 120C
5 min at 120C
Sample volume 10~1
111 Cal ibration
It IS well establlshed in the 1 iterature that the area percents of
components are not directly proportIonal to the mass percent ie
different components have different detector responses It IS therefore
necessary to determine correction factors Once determined these
correction factors can be ~sed to calculate the composition on a mass
basis Two gas standards were avaIlable the compOSition of which ere
shown in Table A-l
134
Tab1e A-l Gas standards composition
Stan dar d Species Mole ~ Mass
1 Methane
Ethane
Propane
Butane
228
292
298
182
101
243
363
293
2 Propane
Propene
520
480
532
46S
Each standard was injected M times (M L 3) into the GC and the area
Counts and retention times recorded The results were then normal ized to
el iminate any discrepancies while injectin9J usin9 the eQuations shown
below These eQuations were adopted from McNair and Bonell i (1969) To
normal ize area counts use
For i = 1 to M
where
M is the number of samp1es
N is the number of components
ACI J is the area count of component in sample as recorded by
theGC bullbull and
APi is the mean area percent or component i
and to normal ize retention times use
RIi = J1 (~IijACiJ For i = 1 to MI
t ~1 J ~1 AC i I
Ilhere
Ri ij IS the retention time of comoonent i In samp1e j and
RIi is the mean retention time of Component 1
135
Once the mean area percent of each component had been establ ished the
rat io (AR) of the area percent (APt) to mass percent (MPt) was
calculated using
The response factors (RF i ) are calculated using
These factors are relative to propane ie the response factor for
propane was arbitrarily set equal to unity A detailed sample
calculation using the above procedure is ~iven in Table A-2
Table A-2 Area percent and retention tIme normalisation
Standard 1
Spec i es Methane Ethane Propane Butane
(N=4) ( i =1) ( i=2) ( i =3) ( i =4)
AC i j t 94792 241206 346861 371930
RT i j t 35 43 62 111
AC i j 2 82857 213323 308409 332568
RT i j 2 35 43 62 111
ACijJ 86832 215668 314257 322218
RT i j bull J 35 43 61 111
APi 90 229 331 350
RTi 35 43 61 111
MPi 101 243 363 293
AR 089 094 Dl 12
RFi 102 097 100 076
136
Table A-2 Area percent and retention time normalisation (continued)
Standard 2
Species Propane Propene
(N=2) ( i =2)
ACij-t 521001 593387
RT i j bull t 61 74
AC i j 2 55278 64241
RT i j 2 62 74
AC i J J 45750 56275
RT i j J 61 74
APi 466 534
RTi 61 74
MPi 532 468
ARi 088 114
RFi 1000 077
Under the same detector conditions these factors can be used time and
time a9ain to calculate the mass percent of the components in the
standards relative to propane
To calculate the composItion on a mass basis of an unknown mixture the
equation used is
MPi
A sample calculation usin9 the above equation and the GG output from
an independent injection of Standard 1 is shown In Table A-3
137
Table A-3 Error determination
Species MPI MPcalc Error
Methane 109318 102 101 103 16
Ethane 273475 097 243 243 03
Propane 394953 100 363 364 01
Butane 414146 076 293 290 09
~ (E 2 ) = 34
A typical spectrum obtained (f~ed gas) is summarised in Table A-4 and
shown in Figure A-i Traces of species found in the feed but for which
no standards were available were assigned response factors of vnity As
the total contribution of these on an area basis was less than one
percent the error introduced should be negl i~lbly small
Table A-4 Feed composition
Species Retention time Response factor Mass r
Methane 35 102 00
Ethane 43 097 092
Propane 61 100 198
Propene 74 077 780
Iso-Butane 110 100 019
N-Butane 11 1 076 023
i-Butene 136 100 043
Iso-Butene 147 1 00 004
T2-Butene 153 100 009
C2-Butene 159 1 00 005
C5 + 193 100 017
138
I m ~ t gt z m
ImiddotIi Ii I
il I
I
I I i
l~~0 0 Z z -ln n 0 0 Vgt I I VgtNN deg OgtJJ COOIIdeg 0 0 ICC 1ClliX) gt m Cll -l -lCllCC Z Z Cgt mC-l-l m m -l Z Z-lmm
gt m m m Z Z z zmm m m
Fi~ A-I GC SPECTRA OF FEED
139
12 Liquid samples
The settin9s I isted below were used for all I iQuid samples
Chromatograph Varian 3400
Auto sampler Varian 8000
Data system Varian CDS 401
Detector Flame ionisation
Attenuat ion 1
Range 10- Of ampsmV
Column length 3 m
Column diameter 4 mm
Column press 18 psi at 40 C
Packing 31 Sil iconOV-10l on Chromosorb W-HP
100120 mesh
Nz flowrate 30 mlmin
Hz flowrate 30 mllmin
Air flowrate 300 mlmin
Injector temp 250C
Detector temp 300C
Temp Pro9 5 min at aoc lOCmin to l80C
30Cmin to 300C 5 min at 300C
Sample volume 1 ~I
121 Calibration using mass spectroscopy
Due to the complex nature of the I iQuid products the analysiS of the
I iQuid spectra was difficult To facil itate product analysis it ~as
decided that the liquid product analYSis be based on carbon number
groupings rather than on indiVidual components A direct comparison
between the spectra obtained by the GC and MS was not possible due
to hardware and software differences The trends in the spectrum
obtained were however the same and in this way carbon number~ could b~
allocated to the GC spectrum
A typical spectrum of the GC-MS is shown in Fi9ure A-2 The
molecular wei9hts of the components ~esponsible For the peaks as
determined by mass spectroscmiddotpy are shown In this FIJre As a
comparison a sas chromatogram uSln3 the Varian 3400 IS shown In
140
r------------y-~
+ cO -shy
U
LJ -shy
u Ishy
= c - 0
t-Clt 0 a~
t Cl-=gt ct- l shy J
C-~ IL ~ 0 r (t
ot- l shy
f u w Q ~ (j)
co t~ (j)r-J
Gl u [- u
t~ ~
J lt u shyCI gtshyl-
N I
W lt
(JshyU
U ~
IL
M U
Hlpoundl
---------
---- ---
141
~Lgt-------- --- -------_____
_____~L
ltlt
I
C1 U
---~~------- --~-----~------~~--
u___---s-----======~--=-----~~a
1 -------------- ----------shy
142
F i 3ure A-3 Us i ns the data from the M S carbon numbers cou 1 d be
assisned to the peaks on the sas chromatosram and so the start and end
times of the various sroups established The groupings used are shown in
Table A-5 as is a typical 1 iquid compositIon
Table A-5 Typical liquid composition and retention time windows
Group Mass r Retention times
start stop
Monomer 495 000 102
oimer 610 102 470
Trimer 243 470 112
Tetramer 813 112 157
Pentamer 162 157 185
Hexamer 000 185 205
Heptamer 000 205 280
The response factors of these groups were taken as unity which was
justified in VIew of work done by Dietz (1967) on the relative
sensitivity of hydrOCarbons The results reoorted in mass oercent are
therefore a reasonable representation of the actual composition
0 200 0
100 VAPeUR PHASE
Jgt
600+ m z 0 x
w 500+
fLUID PHASE
L 400I-a III
1I QU I D PHASE W 0 300 =gt III
(f) III(f)
t WW
00
-600 --300 -100 100 300 600 700 900 1100
TEMPERRTURE C
FIG B-1 DEW pe I NT TEMPERATURE ( C) AND BUBBLE pe I NT TEMPERATURE (C) VS PRESSURE (ATM)
20 MelEi PRePANE AND 80 MelEi PRePENE ~
I J
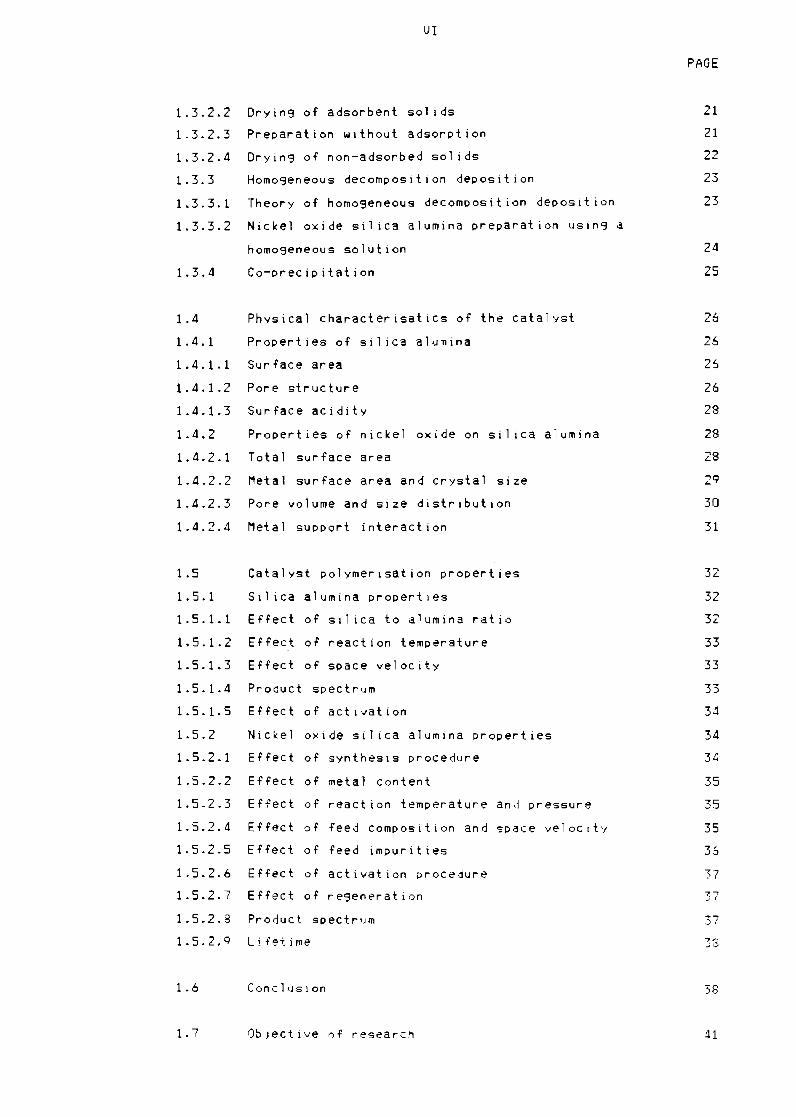
VI
1322
1323
1324
133
1331
1332
1 34
14
1 41
1411
1412
1413
142
1421
1422
1423
1424
15
1 51
1511
1512
1513
1514
1515
152
1521
1522
1523
1524
1525
1526
1527
1528
152Q
16
17
Dryin9 of adsorbent sol ids
Preparation without adsorption
Dryin9 of non-adsorbed sol ids
Hom0geneous decomposition deposition
Theory of hom0geneous decomposition deposition
Nickel oxide silica alumina preparation usin9 a
hom0geneous solution
Co-precipitation
Physical characterisatlcs of the catalyst
Properties of sil ica alumina
Sur face area
Pore structure
Surface aCidity
Properties of nickel oxide on si1 ica alumina
Total surface area
Metal surface area and crystal size
Pore volume and size distribution
Metal support interaction
Catalyst po1ymerisation properties
Si1 ica alumina properties
Effect of Silica to alumina ratio
Effect of reaction temperature
Effect of space velocity
Product spectrum
Effect of activation
Nickel oxide si1 iea alumina properties
Effect of synthesis procedure
Effect of metal content
Effect of reaction temperature anJ pressure
Effect of feed compOSition and space velOCity
Effect of feed impurities
Effect of activation procedure
Effect of regeneration
Product spectrum
Lifeiime
ConclUSIon
Objective 0f research
PAGE
21
21
22
23
23
24
25
26
26
26
26
28
28
28
29
30
31
32
32
32
33
33
33
34
34
34
35
35
35
36
37 7-
37
38
VI
2 DESIGN OF ISOTHERMAL REACTOR
21 Fluidisation theory
22 Heat transfer
Fluidising medium23
231 Sand data
24 Optimisation of the fluidised bed
241 Air flow optimisation
242 Temperature correction
3 EXPERIMENTAL METHODS
31 The reactor system
311 Layout
32 Reactor
321 Fluidised bed
322 Integra1 reactor
33 Operation
331 Loading
332 Calcination procedure
333 Start-up
334 Steady state operation
335 Shut-down
34 Data analysIs
341 Computation of results
35 Analytical procedure
351 Gas analysis
352 UqU i d analysis
353 Nuclear masnetic resonance
354 TGDTA
355 Water content determination
356 o i st ill at ion
PAGE
42
42
43
44
45
45
49
51
53
53
53
56
56
58
60
60
61
62
62
63
63
63
65
65
65
tS6
68
69
69
VIII
36 Catalyst synthesis
361 Support preparation
362 Impre9nation
3621 Nickel concentration
363 Hom0geneous decomposition depositlon
3631 Nickel concentration
364 Coprecipitation
365 Determination of nickel content
366 Extrudate manufacture
4 RESULTS
41 Reproducibility of data
42 Effect of nickel content
43 Effect of pressure
44 Bed temperature profile
441 Effect of temperature
45 Lifetime and selectivity
46 Effect of WHSV
47 Effect of temperature runaway
48 Effect of water contaminatlon
49 liquid feed (Cit )
410 liquid and gas feed (Cl + Cit)
411 TGDTA
412 NMR
PAGE
71
71
71
71
71
72
73
74
74
7S
75
78
7S
82
86
90
95
95
95
98
98
101
5 DISCUSSION
105
112
129
133
IX
PAGE
6 REFERENCES
7 APPENDICES
7A APPENDIX A 133
1 Gas chromatograph data 133
11 Gas samples 133
111 Calibration 133
12 li QU i d samp 1es 139
1 21 Cal ibration using mass spectroscopy 139
7B APPENDIX B 143
1 Phase diaghram 143
x
LIST OF FIGURES
PAGE
CHAPTER 1
Figure 11 Activity of sil ica alumina catalyst for various
reactions as a function of sil ica to alumina ratio 2
Figure 12 Ranges of conversion for polymerisation of propene
on metal oxide sil ica alumina catalysts 4 wt~
Fi3ure 1 7 Conditions of a pore adsorbin3 activating material
Intersectin3 pores of different sizes before
dryin3 (A) and after evaporation of some of the
metal oxide impregnated on support 4
Figure 13 Free energy chan3e during dimerisation 16
Figure 14 Free energy change during dimerisation 17
Figure 15 Conversion obtainable in dimerisation reactions 17
Fi3ure 16 Polymerisation of propene 18
in solution 20
pore volume 1 iQuid (B) 22
Fi3ure 19 Phase diagram 25
Fi3ure 110 Si1 ica alumina surface area (m 2 g) vs alumina
content (mass~O 27
Fi3ure 111 Propene conversion (mass~) vs pressure (atm) 36
CHAPTER 2
Pressure drop over fixed and fluidised beds
Fi3ure 22 Convection coeffecient (Wm 2 K) vs partical
size (pm) 25 Q C
43
46
XI
Figure 23
Figure 24
Figure 25
Figure 26
Figure 27
Figure 28
CHAPTER 3
Figure 31
Figure 32
Figure 33
Figure 34
Figure 35
Figure 36
Figure 37
CHAPTER 4
PAGE
Convection coeffecient (Wm 2 K) vs partical
size (lim) 190degC 46
Reactor modifications to measure pressure drop 47
Pressure drop vs supperficial velocity aCross
disk and bed 49
Pressure drop vs supperficial velocity Integral
reactor absent 50
Pressure drop vs supperfictal velocity Integral
reactor present 51
Bed temperature (OC) vs rotameter tube reading (TR) 52
Vb=12 lmin
Reactor system 54
Integral reactor and fluidised sand bed 57
Integral reactor 59
Reactor bed 61
Batch distillation unit 70
Nickel content (massYo) vs mass of nickel nitrate
hexahydrate (g) 72
Nickel content (mass~O vs time (min) 73
Liquid production rate (Shgl vs time (h) 77
XII
FiSure 42
FiSure 43
Fisure 44
Fisure 45
FiSure 46
Figure 47
Fisure 48
FiSure 49
Figure 410
Figure 411
Figure 412
Figure 413
Figure 414
Fi3ure 415
PAGE
Liquid composition (mass)) vs time ( h ) 77
EHec t of nickel content
product ion rate (9hS)
(mass))
HOD
on 1 iQuid
79
EHect of nickel content
composition (mass) HOD
(mass~) on 1 iQuid
79
Effect of nickel content
production rate (ghg)
(mass~)
IMP
on liquid
80
EHect of nickel content
composition (mass~) IMP
(mass~O on 1 iQuid
80
Effect of pressure
rate (ghg) HO~
Effect of pressure
(mass) HOD
Effect of pressure
rate (ghg) IMP
Effect of pressure
(mass) IMP
Effect of pressure
rate (Shg) SG
Liquid composition
at 40 atm SG
(atm) on
(atm) on
(atm) on
(atm) on
(atm) on
(mass~)
1 iquid production
81
1 iQuid composition
81
1 iQuid production
83
1 iQuid composition
83
liquid production
84
vs time (h) 84
Bed
set
temperature profile ( deg C )
point 80degC SG-1
vs position ( Z ) I
85
Bed
set
temperature +PO n _ 80degC
fluctuations
S(7-1
( lt) C ) vs time (h) I
85
Bed
set
temperature profi le
point 210degC HDD-9
( 0 C ) vs POSition (Z)
87
XIII
PAGE
Figure 416 Bed
set
temperature fluctuations
point 210degC HOO-9
(OC) vs time (hl
87
Figure 417 Effect of temperature (OCl on 1 iQuid production
rate (ghg) HOD
Figure 418 Effect of temperature
(mass~) HOD
(OC) on
Figure 419 Effect of temperature
rate (ghg) SA
(OC) on
Figure 420 Effect of temperature
(mass~) SA
(OC) on
Figure 421 Liquid production rate
space velocity (ghg)
(ghg)
vs time
Figure 422 Liquid composition (mass) vs
Figure 423 Liquid production rate
space velocity (ghg)
(ghg)
vs time
Figure 424 Liquid composition (mass) vs
Figure 425 Liquid production rate
space velocity (ghg)
(ghg)
vs time
Figure 426 Liquid composition (mass) vs
Figure 427 Liquid production rate
space velocity (ghgl
(ghg)
vs time
Figure 428 Liquid c~mpositlon (massl) vs
Figure 429 Effect of weight hourly space
88
liquid composition
S8
liquid production
89
liquid composition
89
and weight hourly
(h) for HDD-3 91
time (hl for HDD-3 91
and weight hourly
(hl for IMP-2 92
time (h) for IMP-2 92
and weight hourly
(h) for SG-1 93
time (h) for 3G-1 93
and weight hourly
(h) for SA-3 94
time (hI for SA-3 94
velocity (ghg)
on 1 iQUld production rate IShg HOD 96
Figure 430 Effect of weight hourly space velocity (ghg)
on 1 iQuid composition (ma9s~) HOD 96
XIV
PAGE
Fi~ure 431 Effect of temperature runaway
rate (~h~) HDO-6 and HDO-7
usin~ same catalyst
on 1 iQuid production
consecutive runs
97
Fi~ure 432 Effect of temperature
composition (mass~)
(OC) runaway on liQuid
97
Fi~ure 433 Effect of water on 1 iQuid production rate
(~h~) HDO-5 re~eneration after HOD-4 99
Fi~ure 434 Effect of water contamination
composition (~h~) HO~
on 1 iQuid
99
Fi~ure 435 LiQuid production rate (~hg) and
(mass~) vs time (h) 1 iQuid laquo69degC
feed HOD-IS
conversion
fraction)
100
Figure 436 LiQuid composition (massYo) vs
laquo69degC fraction) feed HDD-1S
time (h) 1 iQuid
100
Fi~ure 437 LiQuid production rate (~hg) and conversion
(mass~) for propene vs time (h) liQuid
laquo69degC fraction) and gas feed HDD-19 102
Figure 438 LiQuid composition (mass~) of entire 1 iQuid
effluent vs time (h) liQuid laquo69degC fraction)
gas feed HDD-19
and
102
Fi~ure 439 LiQuid production rate (ghg) and conversion
(mass~) for propene vs time (h) liquid laquo69degC
fraction) and gas feed HDD-20 103
Figure 440 Liquid composition (mass)
sample vs time (h) 1 iquid
gas feed HDD-20
of entire 1 iQuid
laquo69degC fraction) and
103
~i9ure 441 Mass loss
for fresh
(X) and temperature ~iffe~ences (O()
catalyst 20 mg sample 104
104
xv
PAGE
Fi~ure 442 Mass loss (~) and temperature difference (OC) for
a calcined catalyst which has been exposed to air
19 m~ sample
Fi~ure 443 Mass loss (~) and temperature difference (OC) for
a used catalyst HDD-13 185 mg sample 106
Figure 444 Mass loss (X) and temperature difference (OC) for
Figure 445 Mass loss (X) and temperature difference (OC) for
Figure 446 Mass loss (~) and temperature difference (OC) for
a used catalyst IMP-1 18 mg sample 106
a used catalyst HDD-l17 m9 sample 107
a used catalyst SG-3 17 m9 sample 107
Figure 447 NMR spectra of 1 iquid product from run IMP-l 108
Fi~ure 448 NMR spectra of liquid product from run SG-3 109
Figure 449 NMR spectra of liquid product from run HDD-l 110
CHAPTER 7
7A APPENDIX A
Figure A-I GC spectra of feed 138
Figure A-2 Typical GC- MS spectra of 1 iquid product 140
Figure A-3 Typical GC spectra of liquid product 141
APPENDIX B
Figure B-1 Dew point temperatYre (OCI and bubble point
temperature (OC) vs pressure (atm) 20 mole~
propane and 80 mole~ propene 143
XVI
LIST OF TABLES
PAGE
CHAPTER 1
Table 11 Analogy in the mechanism of the catalytic action
homogeneous and heterogeneous system for the
dimerisation of olefins
of
14
Table 12 Characterisation of supported metal catalysts 26
Table 13 Pore volume and
and adsorbents
size distribution of fresh catalyst
27
Table 14 ACid
heat
content
treated
(total and
at 550degC
Bronsted) for silica alumina
28
Table 15 Surface area of nickel oxide sil ica alumina prepared
by Impregnation and coprecipitation as a function of
nickel content The si1 ica to alumina weight ratio was
91 29
Table 16 Surface area of nickel oxide si1 ica alumina as a
function of the alumina content Nickel content held
constant at 61 wtr 30
Table 17 Surface area of nickel oxide si1 ica
function of nickel content Alumina
at 43 wtr
alumina
content
as a
was held
30
Table 18 Nickel metal area from H2 chemisorption at 250degC
and 100 mmHg vapour pressure and from X-ray
diffraction 1 ine-broadening 31
Table 19 Pore volume and radius of a nickel aiumina ratalyst
with varYing alumina content Nickel content held at
4 wtx 31
Table 110 Pore volume and radius of a nickel oxide si1 ica
alumina catalyst with varYlng nlckel content
Alumina content held at 43 wtX throu9hout 32
XVII
PAGE
Table 111 Propene 01i90merisation on silica alumina at a
constant pressure of 50 atm and varyin9 temperature
Sil ica to alumina ratio used was 94 to 3 throu9hout 33
Table 112 Product distribution of propene 01 i90merised over
sil ica alumina as a function of temperature
Reaction pressure is 50 atm 34
Table 113 Relationship between product distribution and
reaction conditions 39
Table 114 Propene conversion and product spectrum as a
function of space velocity silica ta alumina ratio
is 9 to 1 throu9hout 40
CHAPTER 2
Table 21 Sand size fractions 48
CHAPTER 3
Table 31 Feed composition 65
Table 32 Carbon number groupings used for 1 iQuid analysis 66
Table 33 Structure definitions of terms and NMR spectral
positions and area code 67
CHAPTER 4
Table 41 Reaction data 76
Table 42 Integrated areas 111
Table 43 Carbon areas and branching 111
XVIII
PAGE
CHAPTER 7
7A APPENDIX A
Table A-1
Table A-2
Table A-2
Table A-3
Table A-4
Table A-5
Gas standards composition
Area percentage and retention
Area percentage and retention
(continued)
Error determination
Feed composition
Typical 1 iQuid composition and
windows
134
time normal isation 135
time normal isation
136
137
137
retention time
142
1
1 INTRODUCTION
In South Africa the oil from coal industry has developed the first
commercial process whereby sYnthetic fuels are produced from coal via
gasification usin9 Fisher Tropsch catalysts It started In 1943 when the
AmerIcan rights to the Fischer Tropseh process were purchased by South
A f ric a I n 191 0 the Sou t h Af I i can 0 i 1 C0 a 1 and Gas C() r p 0 r a ti (gt n (S A S 0 Ll
was formed The first plant Sasol I with a capaCity of 4130 barrelsday
went into opel-atlon in 1954 (OUtkUW1CZ 1981ll It used two type of
reactors namelv the Arge fixed bed and synthol fluidlsed bed reactors
Two further plants Sasol II and Sasol III which are Improved and
enlarged versions of Sasol I wert later built eAch having i3 CClfacit (f
35900 barrelsday (Dutkuwicz) 1980) In both of these planl~ onl~ the
synthol reactors are used Due to th~ nature of ihe process Sasol
pr oduces 1ar3e Quant It i es of 1 i ght hvdr ocar bon gilSfS anoun t i n3 to
approximatelv 15-106 mZday These are partly r~tlculated to local
i n d us try and par tl y Con v e r ted I 1 a a cat a 1 yt I C (middot1 i 30 rr euro r I s d ion p r (J C esst (gt
1 i 9h t f IJ e1sth euro r eby inc r e a s Jr13 the 0 I er I 1 r) r (l dII ~t Ion I n t e r mS 0 f
barrels of I iquld fuel produced per ton of coal procESSE-d Currentll
Sasol I can more than satisfv he loal dernnd dnj therefol~ the light
hydrocarbons from Sasol II and Sas()l III represent elaquo~s Buppl
The catalvtic oli90merisation process referred to abrve ISPS the
conventional phosphoric Reid catalyst to oli30fllPrisE lhe light
hydrocarbons to 1 iquid fuels This process howltver ~Ir(gtdIJCeS poor qlal ity
pet r 0 I and dies e I and the (a tal s tis C (I r r lt) s i v
The present study investigated an alternative catalyst For the catalytic
oligomerisation of li3ht hydrocarbons to 11qllid fllel Ilsin3 a nickel
oxide sil iea alumina catalyst synlhesls~d via methorl adopt0d by the
aulhor from (gtlork done bi van Dillen el 031 ()976) Al1l()lgh rlikel (Idne
SilIca alumina catalysts have Geen Ideli stldied (Tahahashi et a1
1969 Hogan et al 195 Holm 1917 [tt) the- ltgtrthe=~ fII~~H)d
developed in this work will produced a moreuro HC t i ve
catalyst With greater resistance to deactivation and greater selectivity
to linear C6 than those recorded f()r nickel oxide silica alJroina
catalysts produced viB the standard impregnation technIQue In this way
it is hoped to produce a beUer qual ity diesel than p~ssjble over the
standard irnprelnated nickel oxi de i I ica alumln1
2
11 Heterogeneous catalysis
As the silica alumina support in a nickel oxide silica alumina catalyst
is a catalytically active solid oxide insulator its catalytic properties
as well as those of nickel oxide on silica alumina have to be examined
In what ollows a brief review 0 the catalytic properties 0 both is
given
The oxides and halides of the lower elements of sroups III IV and V of
the periodiC table tend to cata1yse pOSitive ion or acid type
reactions such as polymerisation alkylation cracking and
isomerisation One of the most active solid oxide insulators is siliCa
alumina In Fi9ure 11 (Clark 1953) the rate of reaction is plotted
against the weight percent sil ica in a silica alumina catalysts for
various reactions viz bullbull hydrogen transfer propene polymerisation
ethene hydrogenation and hydrogen deuterium exchange It Can be seen
from this figure that the reaction velOCity constants of the acid type
reactions such as hydrosen transfer and propene polymerisation roughly
parallel the changes in catalyst acidity
~=H-D EXCHANGE AT 300degC K-10- t
~=ETHENE HYDROGENATION AT 500degC
+=HYDROGEN TRANSFER AT 340degC K-l0 DECALIN-l-BUTENE
X=PROPENE POLYMERISATION AT 200degC K-l0 J
60
50 u UJ ()
shy I- 40 z ~ lshy()
Z o 30 u
UJ Ishy~ 0
200 UJ 0 0 0
I- 10 ()
0 U
00
00
~=ACIDITY MILLI EQUIVALENTS PER GRAM middot10~
I
700 800 900 1000100 200 300 400 500 600
WEIGHT ~ SILICA
FIGURE 11 ACTIVITY OF SILICA ALUMINA CATAL1STS FOR VARIOUS
REACTIONS AS A FUNCTION OF SILICA TO ALUMINA RATIO
100
xUJ- ~ 060 -UJ ltII
Ishy 0UJ UJ Qltre ()
I () ()z ~ Ishy60 0 Q z UJI- 0 - ~ UJ ~ Z Q gtUJ ltI 0 gt 0 Ishy UJ40 0 UJ 0 ~ Igt- Z -I UJ - ltI UJ 0 xZ 0 UJ 0 II gtshy20 I- gtshyI IshyUJ
0-u ~
o
3
The reactions which occur readily on the transition metal oxides such
as hydrogen-deuterium exchange which gives a reasonably good indication
of hydrogenation-dehydrogenation activity and ethene hydrogenation
proceed slowly even on pure alumina and the rate decrease to
insignificant values with increasing si1 ica content Conversely
transition metals are poor catalysts for aCid-type reactions
Transition metal oxides alone or supported on weakly acid oxides such
as alumina show only a small activity for acid type reactions such as
the polymerisation of the low boiling point olefins When however
these oxides are supported on strong acid oxides such as silica alumina
they are capable of giving an increased activity as indicated in Figure
12 (Clark 1953) which shows data on the po1ymerisation of propene
The details oT the mechanism by which these metal oxides supported on
silica alumina give an activity greater than that over sil ica alumina
alone are not clear Using Tame1es method of butylamine titration
there are some indications oT an inCrease in acid content of the active
metal oxide promoted catalyst over that of silica alumina alone (Clark
1953) A detailed discussion of the mechanisms proposed and nature of
the active sites is given elsewhere
The following conclusions may therefore be drawn from
Figure 12 with respect to propene polymerisation
- the oxides of metals in group V and higher of the periodiC table
loaded on silica alumina alone give increased activity over silica
alumina
- the oxides of metals in group IV and lower of the periodiC table give
activity below that of sil ica alumina
- redUCing the metal oxides causes the activity oT the catalyst to drop
below that of silica alumina
12 Polymerisation using heterogeneous catalysts
121 Kinetics of the overall process
The overall kinetics of the process can be summarised by five steps It
must however be noted that at times some of these steps are not present
The steps are
Step 1 Diffusion of reactants through the Nernst diffusion
layer a 1 iquld film surrounding the catalyst
particle to the outer surface of the catalyst
4
Catalyst preheated Catalyst oreheated
in H at 500degCin air at 500degC
100100
9090
so80
7070
Oxides Ot V Cr Mo ~ Mn Fe Co Ni 6060
50so
ao40
SiOmiddotdAlzO 3030 1 [
Oxides ot V Cr Mr Fe Co Ni 2020 [ 10
Group I-IV
1 Oxides Ot Na Cu Ag M3 Zn Ba ICe Ti Z r bull
Pb Th
10
[ 00
Fig 12 Ranges Ot conversion tor polymerisation Ot oropene on metal
oxide silica alumina catalysts 4 ~t~ metal oxide impregnated on
support
5
Step 2 Penetration and diffusion of the reactants through
the blanket of graphitic carbon andor hydrocarbon
deposits to the internal surface and into the
unreacted core
Step 3 Reaction of the reactants at an active site
Step 4 Diffusion of the products through the unreacted core
and the blanket of graphitic carbon andor
hydrocarbon deposits back to the outer surface of
the solid
Step 5 Diffusion of the products through the fluid film
back into the main body of the fluid
The resistances of the different steps usually vary greatly from one
another The step with the highest resistance is considered to be the
rate controll ing step This rate controll ing step can often be
identified via simple tests (see Levenspiel 1972)
For optimum catalyst util isation a high matrix diffusivity is
desirable At any given condition if the rate of chemical reaction is
higher than the rate of diffusion reactants cannot be supplied fast
enough to the active site to establish an eQuil ibrium concentration The
reaction therefore oCcurs only in the outer shell of the catalyst
particles and a significant number of active sites inside the particle
are unused Large matrix diffusion resistance therefore results in
molecules reacting before they penetrate into the interior of the
catalyst particle The rate is then controlled by either film diffusion
or the rate of chemical reaction on the active surface whichever is the
slower step
The overall reaction rate is also influenced by the reaction
temperature The rate of diffusion however increases at a slower rate
than that of the chemical reaction and so at high temperatures pore
diffusion or film diffusion becomes the rate controll in9 step
Insufficient agitation and a hi9h viscosity of the solution can result
in large film thickness and hence favour a film diffusion controll in9
mechanism
6
122 Polymerisation
To date the most widely accepted mechanism for the polymerisation of
olefins is that proposed by Whitmore (1934) and involves the carbonium
ion One of the most pronounced characteristics of acid catalysed
reactions involving the carbonium ion is the lack of specificity
(Langlois 1953l Almost never is only a single product formed and even
under the mildest conditions a large number of compounds are formed
Schmerling and Ipatieff (1950) have distinguished two classes of
polymerisation true polymerisation in which the reaction prodycts are
mono-olefins with molecular weights intergral multiples of the monomer
molecular weight and Conjunct polymerisation in which the reaction
products are a complex mixture of olefinSt diolefins paraffins
naphthenes cyclo-olefins and aromatics Both will now be discyssed in
deb i 1
1221 True polymerisation
The carboniYm ion is formed in the presence of a hydrogen acid by the
addition of a proton to the electron pair of the double bond ie bull
H H H H H H C C C H2 + HX+ - gt H C C C H + X- ( I )
H H H
It is not proposed that a free alkyl carbonium ion exists in the
hydrocarbon solytion but that it remains within a short distance from
the anion of the catalysts and that the two exist in the form of an ion
pair (Langlois 1953) As the degree of separation of the carboniym ion
from the Bronsted site is of no importance in the explanation of the
reaction mechanism it is sufficient to postulate the existence of an
alkene with a positive charge on a particular carbon atom The term
carbonium ions will be ysed in subseQuent discussions and represented as
shown in eQyation (I) above without showing the anion although its
presence somewhere near the pOSitive charge IS to be ynderstood
(Langlois 1953)
The halide catalysts are aCidic only in so far as they are electron
acceptors Hunter and Yohe (1933) postulated that the active complex in
the absence of hydrogen halide oromoters is formed by the addition of
the catalysts to the olefin In this way the metal hal ide functions in a
manner similar to that of a proton and may be considered to be an aCidiC
catalyst (Schmeling and IpatieH 1950gt
7
Cl H H Cl H H
Cl Al + CC -) Cl Al CC+ (II ) ~ ~
Cl H H Cl H H
It has however been found that the halide catalyst requires a coshy
catalyst such as water tert-buty1 alcohol or acetic acid all of which
contain an active proton to be active for polymerisation Fontana and
Kidder (1948) found that the polymerisation of propene on a halide
catalyst was approximately proportional to the concentration of the
promotor used which was confirmed by Norrish and Russel (1952) who found
that in the polymerisation of isobutene with stannic chloride a Coshy
catalyst such as water was necessary that the rate of reaction was
proportional to the concentration of the co-catalyst and that the
maximum rate was achieved when water and stannic chloride were present
in eQuimo1ar proportions
It is thus probable that the reactions proceed throu~h an intermediate
from the reaction of the olefin metal hydride and promotor with the
latter servin~ as the source of the proton necessary for the production
of the carbonium ion viz bull
R-CH=CH2 + BF3 + H20 (-) R-CH-CH3 + BF30Hshy (II I) +
It appears that reaction (II) does not oCCur to any appreciable extent
or if it did that the resu1tin~ complex would not have any appreciable
activity for the initiation of po1ymerisation It is probable
therefore that in all cases the effective catalyst for the acid
cata1ysed po1ymerisation of olefins are acids In the more restricted
sense that they must be able to supply a proton to initiate the reaction
(Lan~lois 1953)
Of the olefins of low molecular weisht isobutene is polymerised the
most readily with acid catalysts N-butene and propene are polymerised
less readily while ethene is polymerised only with difficulty From
this and information drawn from the composition of the reaction
products ~hitmore (1934) reached the conclusion that a tertiary
carbonium ion is the most stable a secondary ion less stable and a
primary ion least stable Evans and Polanyi (1947) calculated proton
affinities of the doubly bonded carbons in isobutene propene and
ethene Their calculations showed the proton affinity of the primary
carbon of the double bond to be in the order isobutene gt propenegt
ethene and furthermore that the proton affinity of the primary carbon of
the double bond is sreater than that of a secondary or tertiary carbon
8
of the double bond for the cases of propene and isobutene These
calculations confirm the early empirical observations In accordance
with this concept we should expect the followins carbonium ions fro~
isobutene and propene
(probable)
and
(probable)
The possibil ity of the formation of minor quantities of the two less
favoured isomers cannot be excluded particularly at hish temperatures
but the species indicated should be the predominant ones Whitmore
(1934) postulated that a carbonium ion once formed may underso a
variety of reactions
Addition of a nesative ion X with the net result beins the addition of
HX to the double bond
R-CH-CHJ + X- (-) R-CH-CHJ + X
Addition to the double bond of an olefin to form a new carbonium ion
this is the polymerisation step
R-CH-CHJ + CH2=CH-R (-) R-CH(CHJ)-CH2-CH-R + +
Elimination of a proton to form the oriSinal olefin or a different one
R-CH(CHJJ-CH2-CH-CHJ +
R-CH(CHJ )-CH=CH-CHJ + H+
Migration of a proton with its bonding electrons from another carbon to
the atom deficient in electrons leaVing a new carbonium ion
9
CHJ-CH(CHJ)-CH-CHJ (-) CHJ-C(CHJ)-CH-CHJ + +
Mi~ration of a methyl ~roup with its two electrons to the positive
carbon atom generating a new carbonium ion with a new skeletal
arran~ement
CHJ-C(CHJ)2-CH(CHJ)-CH-CHJ (-) CH3-CCH3 )-CH(CHJ)-CH(CH3)-CH3+ +
Extraction of hydro~en from another molecule to form a saturated
molecule and a new carbonium ion
RH + R (-) R + RH + +
All the above reactions are indicated to be reversible but the
reactions may not oCcur at similar rates Usually one will be favoured
over the other
1222 Conjunct polymerisation
Conjunct polymerisation that is polymerisation accompanied by the
formation of saturated hydrocarbons oCCurs only under specific
conditions such as at high temperatures and over highly acidic
catalysts Evidence in support of a carbonium ion mechanism to explain
the formation of conjunct polymers was obtained by Bartlett et a1
(1944) The mechanism involves the removal from the oligomer of a
hydrogen atom with its bonding electrons by the carbonium ion The
mechanism may be illustrated as follows
R-CH2-CH2-CH=CH-R + H+ (-) R-CH2-CH2-CH-CH2-R +
R-CH2-CH2-CH-CH2-R + R-CH2-CH2-CH=CH-R lt-)+
R-CH2-CH2-CH2-CH2-R + R-CH2-CH-CH=CH-R +
R-CH2-CH-CH=CH-R (-) R-CH=CH-CH=CH-R +
For conjunct polvmerisation the si~nificant reaction steos are
- initiation by proton addition
- propa~ation by olefin addition
10
- chain termination by proton expulsion
- chain termination by proton transfer
- chain termination by addition of hydride ion
- depolymerisation to same or chain length other than that of the
or i gin a 1 olefin t
- isomerisation
- hydrogen exchange
- cyclysation equivalent to self-alkylation or self shy
polymerisation and
loss of hydride ion
123 Polymerisation on silica alumina
1231 Nature of active sites on si1 ica alumina
Si1 ica a1uminas differ widely in properties and have been the subject of
much research (Mizuno et a1 bullbull 1976 Finch and Clark 1969 Peri 1976)
The nature of the active sites in the polymeric olefin formation is
controversial because of the lack of conclusive evidence
Ozaki and Kimura (1964) speculated that the olefin chemisorbed on Lewis
acid sites as a monomer Hirschler (1970) concluded that Bronsted acid
sites were the active sites over sil ica alumina on the basis of the
similarity in composition of polymeriC species formed over sil ica
alumina and those formed over deammoniated Y-zeol ite On the contrary
Weeks et a1 (1974) concluded that the active sites were Lewis sites
formed upon dehydroxylation Ot Y-zeolite because no signitlcant
difference was found between products over deammoniated and
dehydroxylated zeolites Peri (1976) regarded an alpha site a pair
consisting of a Lewis site and an oxide ion to be active Holm et al
(1959) and Sato et a1 (1965) reported that propene po1ymerisation at an
elevated temperature varied in proportion to the Bronsted acid content
However objections have been raised to their determination Ot the
Bronsted acid content (Forni 1974) Mizuno et a1 (1976) on the other
hand showed that the catalytic activity tor the polymeric oletin
tormation declined sharply as the extent ot selective poisoning Ot the
Lewis acid sites increased
1232 Structure Ot the products and proposed mechanism on SIlica
alumina
Silica-alumina has a low activity tor the oligomerisation of propene at
low reaction temperatures the main product being propene trimers
11
The mixture of propene dimers formed on sil ica-alumina was characterised
by Feldblyum and Baranova (1971) and found to contain a relatively high
content of 4-methyl-2 and 4-methyl-1-pentene According to the carbonium
ion mechanism as postulated by Whitmore (1934) these are the primary
dimerisation products which isomerise into the thermodynamically more
stable methylpentenes
(CHJgt2-CH + CH2=CH-CHs (-) (CHS)2-CH-CH2-CH-CH3 + +
(CHl)2-CH-CH2-CH-CHl +
(CHl)2-CH-CH-CH2-CHl +
(CHl)2-C-CH2-CH2-CHl +
The 23-dimethylbutenes may form on sil ica alumina either as a result of
the skeletal isomerisation of the 2-methyl-3-pentyl cation as suggested
by Shephard et al (1962) or by the irregular (anti-Mrkovnikov) addition
of the isopropyl cation to propene as suggested by Fe 1 db 1yu m an d
Baranova (1971) The second route is more 1 ikely since skeletal
isomerisation of the isohexene cation should lead with even greater ease
to the production of 3-methyl pentenes which are however practically
absent from the mixture of propene dimers
Fe1dblyum and Baranova (1971) further sugsested that hexenes are formed
over sil ica alumina catalyst via the anomalous addition of a proton to
propene That the main reaction product on si 11ca alumina is a propene
trimer was explained by Feldb1yum and Baranova (1971) by suggesting
that the initially formed 4-methyl-2-pentyl cation rapidly isomerises to
the more stable tert-2-methyl-2-pentyl cation and the rate of the
reaction of the latter with propene is higher than the rate of
12
desorption of the dimer from the active center of the catalyst At the
same time the reaction of the 2-methyl-2 pentyl cation with propene
should lead to the formation of the propene trimer with a 44 dimethyl
heptane carbon skeleton This was found to be the case by Fe1db1yum and
Baranova (1971)
It can thus be seen that the silica alumina carrier leads to the
oligomerisation of propene by a carbonium ion mechanism as proposed by
Whitmore (1948) with the product being a propene trimer
124 Po1ymerisation on nickel oxide sil ica alumina
1241 Nature of active sites on nickel oxide sil ica alumina
Hogen et a1 (1955) established that hexenes and methyl pentenes were the
main products formed during the oligomerisation of propene under the
influence of nickel oxide on si1 ica alumina While explaining this
observation from the standpoint of the carbonium ion mechanism Hogan et
a1 (1955) at the same time admitted that the reaction mechanisms
differed substantially from that found in the usual acid catalysts It
was proposed by Ushida and Imai (1962) that two types of protonic acid
centers existed and they ascribed the observed product selectivity to
the isomerisation of the olefin over the protonic acid site attached to
the aluminium Imai et a1 (1968) however proposed that 3-methy1-1- and
3-methyl-2-pentenes were formed via a cyc10 butene intermediate At the
conditions used by Imai et a1 (1968) ie a temperature of 200 C
skeletal isomerisation of the primary oligomers was entirely possible
At lower reaction temperatures eg 64C as used by Feldblyum and
Baranova (1971) 3-methyl-pentenes were hardly formed The dimerisation
reactivity of ethene propene and 1-butene under the influence of nickel
oxide on si1 ica alumina was established by Ozaki et a1 (1968) to vary In
the ratio of 100101 Le in an order opposite to that which occurs
on typical acidic catalysts This was explained by them via the
existence of hydrogen atoms on the catalyst surface The hydrogen atoms
were capable of adding to the olefin to form free radicals which are
then involved in the dimerisation According to Ozaki et al (1968) the
role of the acidic carrier is unimportant Schultz et al (1966) examined
the dimerisation of propene in the presence of Cobalt oxide on a nonshy
acidic carrier activated charcoal A positive result was obtained with
cobalt oxide while nickel oxide on the same support was inactive
In view of the foregoing the nature of the products from the
01 igomerisation of propene under the influence of nickel oxide on silica
13
alumina is discussed in greater detail below to deepen our understanding
of the reaction mechanism and the active sites
1242 Structure of the products on nickel oxide si1 ica alumina
The deposition of nickel oxide on silica alumina changes the selectivity
of the catalyst the preferential product now being a propene dimer The
high content of hexenes in the resultant dimer is not due to the
occurrence of isomerisation or to the greater tendency of the methyl
pentenes as opposed to that of the hexenes to react turther but was
ascribed by Feldblyum and Baranova (1971) to be a characteristic
feature of nickel oxide on silica alumina catalysts) when used tor the
dimerisation of propene
There exists a close analogy in the mechanism as shown in Table 11
(Feldblyum et al bull 1974) between homogeneous catalysis based on nickel
salts and organoaluminium compounds and heterogeneous catalysts based
on nickel oxide on an aCid carrier The similarity in the mechanisms is
based on the proposal that during the dimerisation of the olefins on the
oxides of group VIII metals) a complex hydride is formed In the case of
nickel oxide the source of the active site is assumed to be an
unusually low degree of oxidation at a defect site in the nickel oxide
crystal lattice The dimerisation of propene catalysed by the complex
hydrides of the transition metal (HM) should lead to the formation of 4
methyl-1shy and 4-methyl-2-pentenes as the primary products with
subsequent isomerisation as shown below
CHJ-CH=CH2 + HM -) (CHJ )2-CH-(M)
l CHJ-CH2-CH2-(M)
(CHJ h -C=CH-CH2 -CHJ + HM
+ HM
14
Tab 1e 1 1 Anal09Y in the mechanism of the catalytic action of
homogeneous and heterogeneous system for the dimerisation of
olefins
Catalyst Homogeneous Heterogeneous
mechanism (N i Ch -R A 1 C 13 - ) (NiO-Si02-AhOl)
Structure of
active site
Path of the
format ion of
active site
Initiation
sta3e of the
reaction
Propa3stion
sta3e of the
reaction
Cata 1yst
re3eneration
step
Reasons for
termination
of reacti on
HNiClmiddotRA1Cll-
Reaction of NiCl
wit h R A1C13 - bull
12-Cis-addition
of HNiCl to the
olefin
Entry of a
Co-oord inated
olefin at the
nickel-carbon
lt1 bond
Cis-el imination
of an ole fin
from HN i C 1
Thermal decomshy
posH ion and
reduction of
HNiCl
HNi(Q)n-t on silica
Alumina
Reduction of Ni(O)n
and reaction of
Ni(O)n-t with the
olefin
1 2-C is-add it ion
of HNi (0)-1 to
the olefin
Entry of a
co-ordinated
olefin at the
nickel-carbon
lt1 bon d
Cis-el imination
of olefin to
form HNi (0)n-1
Reducti on of
HNHOln-t to
metal
15
The formation Of hexenes is explained by an alternative route in the cis
12 addition Of HM to propene
1
With the addition Of a third propene molecule at the nickel carbon sigma
bond trimers (C9) with a carbon skeleton Of 24 dimethyl heptane and 4shy
methyl-octane were expected to form This was Confirmed by Feldblyum
and Baranova (1971)
The absence Of olefins with a 44-dimethyl-heptane carbon skeleton in
the propene trimer formed under the influence Of nickel oxide on si~ica
alumina rules out the possibil ity of the reaction Of tert-hexy1
derivatives of the transition metal with propene and this results from
their instability This accounts for the dimerising action of the
catalyst
From the structure of the products formed and the analogy between
homogeneous catalyst based on nickel salts and organoaluminium
compounds and heterogeneous catalysts based on nickel oxide on si1 ica
alumina it must be supposed that complex hydrides of the transition
metal are responsible for the catalytic actions of nickel oxide silica
alumina in the oligomerisatlon of propene
125 ThermodynamiCs
Figure 13 shows the free energy changes which occur during the
dimerisation Of C2 to Co mono-olefins as a function of temperature The
free energy change for the dimerisation of ethene to 1-butene is much
lower than the dimerisation of the other 1 ight olefins (Ublad et alJ
1958)
16
The dimerisation of terminal bonded olefins eg bullbull propene to isomers
of corresponding higher olefins at a given temperature is much more
favourable than that for the dimerisation to the hi9her terminal olefin
-200
-150
-J- 10 0a U c -60
Lshy 00
(I
Ishy 50 -J W 0 100
150
200
2000 4000 6000 6000 10000
TEMPERRTURE K FIG 13 FREE ENERGY CHRNGE DURING DIMERISRTIBN
as shown in Figure 14 Hence the equil ibrium conversion of an alpha
olefin to a higher alpha-olefin will always be less than the
corresponding conversion of an alpha-olefin to an iso-olefin
Dimerisation of beta-olefins or iso-olefins to corresponding higher
olefins will be similar to the alpha-olefin-alpha-dimer relationship
Dimerisation of beta olefins or iso-olefins to higher alpha olefins will
however always be the least ravourable reaction (Ublad et al bull 1958)
Figure 15 shows the effect of pressure on the dimerisation eQuil ibrium
The relationship shown is that or the product of the equil ibrium
constant and reaction pressure in atmospheres to the percentage
Conversion for any dimerisation reaction
Figure 16 shows the rree energy change ror the formation of higher
olerins as a function or temperature ror the monomers propene and 1
butene respectively These rigures show that above 550C ror both
propene and 1-butene the reverse reaction ie bull cracking oCCurs
Clearly at higher temperatures the lower 01 igomers will predominate
whereas at low temperatures the higher polymers will predominate at
equilibrium (Oblad et a1 1958)
17
-200
-160
-J- 10 0 CI U ~ -60
LL 00
CI I- 60 -J W
100o
150
200
FIG
2000
14
4000 6000 6000 10000
TEMPERRTURE K FREE ENERGY CHRNGE DURING DIMERISRTIBN
shyi J
i I 100
It
s
V0
s
DUCltUTIH iquarlO
(01 n-(HMl ~91
0
bull
I
YIt 10 00
~ C OtNERS I n~~
FIG 15 CONVERSION OBTAINABLE IN OIMERISATION REACTIONS
18
-500
-400
-300 J aU-20 0
~ -100
LL 00
a 100 r shyJ 200W 0
300
400
500
2000 4000 6000 8000 10000
TEMPERRTURE K FIG 16 PBLYMERISRTIBN BF PRBPENE
13 Catalyst characterisation
131 Introduction
There are a number of advantages in depositing catalytically active
metals on a support such as alumina charcoal sil ica and silica
alumina The metal can be highly dispersed as small crysta1l ites
throughout the pore System of the support and as a result a large active
metal surface is produced relative to the weight of the metal used In a
pelleted granular or other physiCal form a supported metal catalyst
provides for flow of gases through the reactor and rapid diffusion of
reactants and reaction products through the porous catalist to and from
the active site (Boreskov 1976 Cervello et alJ 1976) The support Can
also improve dissipation of reaction heat retard the sintering of metal
crystallites with resultant loss of active surface and increase poison
resistance For these reasons supported metal catalysts are widely used
in chemical processing It must be recognised however that the support
may also have a catalytic role to perform and the resultant bifunctional
catalyst may have properties different from those of the support or the
metal alone
19
To achieve greater ynderstanding or the way in which good catalysts can
be prepared more inrormation is needed aboyt the errect or the synthesis
method and the stryctYre or the catalysts Both will now be discyssed in
detai 1
132 Catalyst synthesis methods
When a pOrOYB solid comes into contact with a liquid capillary rorces
or several hyndred atmospheres draw the 1 iQuid into the pores The
active component may then be adsorbed on the walls or the pore in which
case the method of preparation is described as adsorption rrom solution
or ion exchange Here the volyme or solytion ysed will be larger than
the pore volume of the sypport In other preparation methods where
adsorption is small the catalyst is prodyced by drying Oyt of the
support wetted with a solution of the active component and the term
impregnation is used (Maatman and Prater 1957) At a high degree or
loading greater than 5 ~ the above methods do not lead to unirorm
distribution viz unirorm location of the metal crystallites within
the support or uniform dispersion viz uniform size of the metal
crystallites throughout the support This can however be overcome by
starting from a mixture in which the constituents of the active
component and the support are mixed on an atomic scale U~der certain
conditions a precipitate will be formed with the active phase
atomically spread throughout the support This method of production is
termed co-precipitation and discussed in detai 1 by Holm et al lt1957gt
The factors affecting dispersion and distribution in the various
synthesis routes will now be discussed
1321 Preparation with adsorption
Catalysts are often made by immersing a porous support in a solution of
an active material Catalytic properties can be influenced by the amount
and distribution of this material on the internal surface of the support
which in turn depends on whether the active material (solute) or the
solvent adsorbs on the support and the fraction of pore volume
accessible to the solute In Figure 17 the Quantity of active material
found in different parts of a system consisting of an external solution
and a single pore which adsorbs activating material is shown for four
conditions Figure 17a shows the distribution of the active material in
the system when the solution reaches the end of the pore The
assumption is made that the rate of penetration and rate of diffusion of
the solute into the pore are slow compared to the rate of adsorption
All act i ve materia 1 in the penetrati ng 1 i qu i d thus adsorbs on the lola 11
20
c I o e
q
External No external Poresolution Pore solution
A Immediateh after fi 11 in B After it was filled and allowed to eltluilibrate
Dec 1 eted externalExterna 1
Pore solution Poresolution
C After equilibration in the 0 After external solution presence of an excess of depleted of solute but external solution before eQ-Jilibration
Fig 17 Conditions of a pore adsorbing actIvatIng material in solution
21
of the first part of the pore The 1 iauid which passes further into the
pore contains no active material If at this time the solvent is removed
from the pore by dryin9 the active material is found only in the part
of the pore nearest to the external solution If instead of dryin9 the
catalyst at this time the pore is simply removed from the external
solution but left filled with 1 iQuid another phenomenon may be observed
If the active material can desorb at a reasonable rate redistribution
oCcurs by desorption and mi9ration by diffusion This ultimately results
in a uniform distribution of active material within the pore as shown in
Fi9ure 17b This process can be used in catalyst preparation if the
rate of desorption is rapid enou9h If the pore is however left in
contact with the external solution additional active material is
supplied by the external solution by diffusion to the adsorption sites
until either equilibrium with the external solution is reached brin9in9
about a uniform distribution as shown in Figure 17c or the external
solution is depleted of active material before the distribution is
uniform as shown in Figure 17d (Maatman and Prater 1957)
It can thus be seen that the amount of active material found in a porous
support can be much larger than that contained in the original pore
volume of liquid penetratin9 the support If on the other hand the pores
are accessible to the solvent but are too small for the solute to enter
or if the solvent is adsorbed in preference to the solute the Quantity
of active material may be extremely low
1322 Drying of adsorbent solids
In the case of an adsorbent solid the dryin9 process is not expected to
alter the distribution of the active material since it is adsorbed to
the sol id However if the adsorptive properties of the material were to
alter during heating and prior to evaporation of the solvent as by
thermal decomposition to a soluble species which does not adsorb on the
support the distribution of the solute would be markedly altered This
condition is discussed below
1323 Preparation without adsorption
In this case a porous support is submerged in a solution containing the
active material and the metal salt is drawn Into the pores by capillary
forces The solvent is then evaporated and the salt decomposed by
calcination or reduction The metal content can be calCulated from the
Concentration of the solution
22
For impregnated type catalysts Dor1ing et al (1971) predicted that up
to a certain metal content the number of crystallites would increase
the mean crystallite size would vary slowly and the metal area would be
approximately proportional to the metal content Beyond this metal
content the number of crystal1 ites would remain constant if only one
crystal formed in each pore during drying Hence the metal crystall ites
would increase in size and the metal area would be proportional to
(metal content)2J Dor1ing et a1 (1971) predicted that the crystallite
size distribution would reflect the pore size distribution of the
support
1324 Drying of non-adsorbed solids
As a result of evaporation of the solvent deposition of the solute
begins when the solution becomes saturated If all the liquid could be
evaporated instantaneously the active material would deposit locally and
uniformly throughout the support Evaporation however does not occur
instantaneously but starts at the outer periphery of the particles and
proceeds from regions of larger pore diameters to smaller pores This
uneven evaporation is the result of the higher vapour pressure of the
1 iquid in the larger pores while 1 iquid which evaporates from small
pores is replaced by liquid drawn by capillary action from the larger
pores as illustrated in Figure 18
A Before drying
B After some drying
Figure 18 Intersecting pores of diferent sizes before drying (A) and
after evaporation of some of the pore volume 1 iQUld (8)
23
Thus when drying proceeds slowly enough there is a tendency tor the
active material which is increasing in concentration as the liQuid
volume decreases to redistribute by diffusion into the remaining fluid
This results in an enrichment of the active material in the smaller
pores and towards the center of the particle (Maatman and Prater 1957)
133 Homogeneous decomposition deposition
It can be seen from the above discussion that producing a catalyst by
impregnation or ion exchange with high metal contents leads to the
formation of crystallites with non-uniform distribution and low
dispersion As an active supported catalyst system calls for a highly
dispersed particle with uniform distribution on a highly porous
thermally stable support such as silica alumina it would be desirable
to combine the high degree of penetration of the solute into the support
observed during impregnation with a controlled ion exchange-type
preCipitation The procedure studied by van Dillen (1976) for the
manufacture of highly dispersed nickel silica catalysts with uniform
distribution and a similar system used by Higley (1984) to produce
nickel oxide on silica alumina catalysts was investigated
In the case of this work a suspension of nickel nitrate hexahydrate and
silica alumina was prepared To preCipitate the nickel salt onto the
support the pH had to be lowered This was achieved by Hisley (1984) via
the injection of ammonium hydroxide and in the case ot this work by the
slow and homogeneous decomposition of urea The reason for using urea as
the source of hydroxyl ions as opposed to ammonium hydroxide is
discussed below A detailed disCussion of the synthesis procedure is
given in Section 363
1331 Theory Ot homogeneous decomposition deposition
When the concentration of a homogeneous solution is raised at a constant
temperature as shown by path A in Figure 19 the solubil ity Curve is
reached Crossing the solubil ity curve does not generally lead to the
formation of a preCipitate but to a metastable state When howeverthe
concentration on the solubil ity Curve is exceeded by a critical amount
nuclei of the preCipitate are spontaneously generated brinSins about
the transition to the eQuilibrium state The concentration where nuclei
start to develo~ s~ontaneously l~ homogeneous solutions IS indicated by
the supersolUbil tty Curve which is also shown in Figure 19 (Walton
1969) The fact that no preCipItate grows when the solubil ity Curve 13
crossed is due to the Considerable surface enerSY of very small
24
particles of the precipitate Thus raising the concentration of a
solution to the value on the supersolubil ity Curve leads to the
formation of a limited number of nuclei If the homogeneity of the
solution is maintained the concentration of the solution will remain
between that of the solubil ity and supersolubil ity curves where no new
nuclei can develop Therefore as a result of precipitation from a
homogeneous solution a small number of large particles of the
preCipitate are formed Pouring a precipitant into the suspension on the
other hand gives rise to an inhomogeneous solution as the concentration
will locally be increased far beyond that of the supersolubility curve
as shown by path B in Figure 19 This gives rise to the formation of a
large number of nuclei Before the concentration has decreased by
homogenizing the solution the nuclei have grown sufficiently to be
stable at the lower concentration Working with an inhomogeneous
solution therefore results in a relatively large number of small
particles (Cartwright et al 1967)
It was concluded by Hermans and Geus (1979) that pouring a preCipitant
into a suspension of a porous carrier leads to preCipitation of the
active material where the preCipitant enters the suspension and the
preCipitate will not develop uniformly over the surface of the support
PreCipitation from a homogeneous solution on the other hand proceeds
eQually in the pores of the support and in the bulk of the solution and
so el iminates the inhomogeneous addition of the preCipitate to the
support
In order to produce a catalyst with high dispersion and uniform
distribution a sufficiently stron9 Interaction of the preCipitating
compound with the support is neCessary This interaction must decrease
the nucleation barrier so that nucleation at the surface of the support
can proceed at a concentration between the solubil ity and
supersolubil ity Curves The preCipitate can then nucleate at the ~urface
of the support whereas nucleation in the bulk of the solution is
prevented In addition nucleation at the surface must be rapid to avoid
the growth of a small number of nuclei to large particles of the
preCipitate (Hermans and Geus 1979)
1332 Nickel oxide sil ica alumina preparation usinB homogeneous
decomposition deposition
Higley (1984) showed that incorporating nickel onto sll iea alumina by
the injeCtion of a hydroxide-containing solution (ammonium hydroxide)
25
CBMPBSITIBN FIG 19 PHRSE DIRGRRM
resulted in a catalyst active for the 01 igomerisation of olefins In
view of the above discussion however it seems likely that the
synthesis procedure developed by Higley (1984) resulted in a catalyst
with high dispersion but nonuniform distribution Using a homogeneous
system with the slow hydrolysis of urea as a source of hydroxyl ions as
developed by van Dillen et al (1976) for the preparation of nickel
sil ica catalysts the catalyst produced would have a high dispersion and
a uniform distribution of the metal crystal] ites throughout the support
134 Co-preCipitation
This method for preparing supported metal catalysts is usually
aSSOCiated with nickel 5i I ica catalysts The technique involves mixing
of the constituents on an atomic level under condition favouring
preCipitation The resulting catalyst is one where small crystals are
uniformly distributed throughout the catalyst matrix Subsequently this
type of catalysts can be made with nickel contents up to 20 wtX without
affecting Crystal size or distribution
w n )
fshya n w 0 L W f-
PATH A
26
14 PhysiCal characteristics or the catalyst
The properties which characterise a catalyst are shown in Table 12 and
discussed below
Tab 1 e 1 2 Characterisation or supported metal catalysts
Support Metal dispersion Nature or ac ti ve
properties and location component
Total area Total sur race Metal support
area interaction e9
Pore structure oxidation state
Meta 1 sur race
Surface chemical area
properties e9
surface aci dity Crystal size
distribution
Crystal size
an d 1 oC a t ion
141 Properties or silica alumina
1411 Surrace area
The surrace area or silica alumina is not only a runction or the alumina
content but also or the synthesis procedure used In the case or Coshy
precipitation used by Holm et a1 (1959) the surface areas ror the
entire ranse rrom pure alumina to pure si1 ica were consistently hisher
than that established by Ward and Hansrord (1969) tor an impregnated
catalyst The results obtained by both Ward and Hansrord (1969) and Holm
et al (1959) are shown in Figure 110 as are the results ror the
commercial catalyst used by Ward and Hansford (1969)
1412 Pore structure
Ramser and Hill (1958) studied the pore diameter dIstribution or a
commercial sil ica alumina catalyst usin9 nitrogen isotherms The results
obtained by them are shown in Table 13 No data was however available
as to the silica to alumina ratio of the catalyst used by them
27
800 shy
~ - 600 shyN ltl ~
bull a W
~=cePRECIPITATEO ()= IMPREGNATED eft =CeMMERC I AL
~
eft ~ () ~ ~
eft
400 -- ~a eft ~a efteft ~
~ ~
200 -r-I I I
I I200 300 400 600 600 700 800 900 1000 RLUMINR CBNTENT MRSS
FIG 110 SILICR RLUMINR SURFRCE RRER (Ma2GlVS ALUMINR CGNTENT (MRSS)
Table 13 Pore volume and size distribution of fresh catalyst and
adsorbents (Ramser and Hill 1958)
Catalyst Surface area Pore volume Average pore
code (m2 9 ) (cm3 19) radius (A)
Commercial
Silica
Alumina
Alumina
Silica
5421
5002
4620
1666
7712
0585
0608
0619
1142
0426
157 plusmn 96
177 plusmn 108
179plusmn 126
30 1 plusmn 568
105 plusmn 43
29
1413 Surface acidity
Holm et a1 (1959) using a butylamine titration techniQue as proposed by
Tame1e (1947) determined the total acid content of a co-precipitated
silica alumina catalyst They also determined the Bronsted acid content
of the catalyst using a base exchange reaction via ammonium acetate In
this way the Lewis acid content of the support could be estab1 ished The
results obtained for the entire range from pure ail ica to pure alumina
are shown in Table 14
Tab 1 e 1 4 Acid content (total and Bronsed) for sil ica alumina heat
treated at 550degC
Alumina Protonic acid Tota 1 ac i d Acid strength
content content content index
(wt~) (meQg) (meQg) (K)
100
925
92
85
60
45
30
18
10
5
2
0
000
006
004
007
019
034
045
080
077
061
038
013
014
043
041
039
042
046
040
040
040
031
003 approx
2310- 7
4710-amp
1110-)
3910-)
6110-)
1410- 4
2410- 4
2510- 4
1110-)
142 Properties of nickel oxide on sil ica alumina
1421 Total surface area
The total surface area of nickel oxide on silica alumina was examined by
Holm et al (1957) for an impregnated and a Co-precipitated catalyst The
sil ica to alum1na weight ratio was held constant at 9 to 1 throughout
The results obtained as a function of nickel loading are given in
Table 15 Ushida and Imai (1962) using a co-precipitated nickel oxide
si 1 ica alumina catalyst with the nickel content fixed at 4 wt but
varYing the alumina content from 0 to 46 wt also measureJ the surface
29
area of the catalyst Their results of surface area as a function of
alumina content are shown in Table 16 In an independent study Imai
and Ushida (1965) measured the surface area of a nlckel oxide on silica
alumina catalyst with a fixed alumina content of 43 wt~ varyins nickel
content These results are shown in Table 17
Table 15 Surface area of nickel oxide sil ica alumina prepared by
impregnation and coprecipitation as a function of nickel
content the si1 ica to alumina weisht ratio of 91
Sinthesis Nickel content Surface area
technique (wU) (m2 IS)
Impregnated
Coprecipitated
085
1 71
315
1080
073
254
448
830
1726
3782
6026
300
300
300
253
373
374
388
248
259
302
219
1422 Metal surface area and crystal size
The metal surface area of an impregnated nickel oxide on synthetlc
zeolite was examined by Brooks and Christopher (1968) using hydrogen
chemisoptlon and the average nickel crystallite size usin9 X-ray
diffraction line-broadenins They found that the nickel areas estimated
from H-z chemisorption and from averase nickel crystallite size
determined by X-ray diffraction line-broadening were In soad agreement
The results obtained by them for a series of supports and nickel loadins
are shown in Table 18
30
Table 16 Surface area of nickel oxide sii ica alumina as a function of
the alumina content Nickel content held constant at 61
wtX
Alumina content Surface area
(wtX) (m2 19)
00
28
51
96
292
490
275
338
360
281
138
181
Table 17 Surface area of nickel oxide silica alumina as a function of
nickel content Alumina content was held at 43 wtX
Nickel content Surface area
(wtX) (m2 19)
00
251
498
744
987
283
344
355
368
344
1423 Pore volume and size distribution
The pore volume and average pore radius was examined by Uchida and 1mai
(1962) for a catalyst with a fixed nickel content but varying alumina
content and by 1mai and Uchida (1965) for a catalyst with a fixed
alumina content of 43 wt~ but varYing nickel content The results
obtained by them are shown in Tables 19 and 110 respectively
31
Table 18 Nickel metal area from H2 chemisorption
mmH9 H2 vapour pressure and from X-Ray
broadenin9
at 250degC and 100
diffraction lineshy
Catalyst Nickel Total nickel area X-ray line broad
code content H2 chemisorption Diameter Area
(3Ni9cat) (m2 bull Nif 3 cat ) (A) (m2 bull Nilg cat)
G56-1 0145 48 155 60
G56-2 0131 42 175 48
G56-3 0071 19 715 06
NiDavZ14 0059 27 185 20
Nileolon 0032 07 680 03
Table 19 Pore volume and radius of a nickel alumina catalyst with
varyin9 alumina content Nickel content held at 4 wt~
Alumina Pore volume Avera3e pore
content (cm3 3) radius
(wU)
000
863
1752
2670
3617
4595
0518
0349
0349
0349
0387
0416
384
253
357
484
477
468
1424 Metal support interaction
The valence of nickel oxide on sil ica alumina was measured by Holm et al
(1957) using hydrogen reduction as proposed by Hill and Selwood (1949)
They found that no abnormalities existed with regard to the chemical
valence of nickel in either the co-preciPitated or impre3nated
catalysts These results were confirmed by Ushida and Imai (1962) who
32
however reported that for catalysts with an alumina content higher than
86 wt or lower than 26 wt the valence of nickel was slightly higher
than two The slight valence increase in the case of higher aluminum
content could be explained since the larger the aluminum content the
larger the amount of nickel oxide which could be combined with alumina
Table 110 Pore volume and radius of a nickel oxide sil ica alumina
catalyst with varying nickel content Alumina content held
at 43 wt throughout
Nickel Pore volume
content (cmJ 9)
(wU)
000
251
498
744
987
037
040
038
040
036
15 Catalyst polymerisation properties
151 Silica alumina properties
1511 Effect of sil ica to alumina ratio
The propene polymerisation activity was examined by Holm et al (1959)
for a coprecipitated silica alumina catalyst with varying silica
content The catalyst was activated by drying in air at a temperature of
550C for 16 h and the po1ymerisation activity determined by passing
propene over the catalyst while raising the temperature from 30 to
300middotC The maximum conversion obtained for each activation temperature
was considered to be indicative of the po1ymerisation activity The
results obtained by Holm et a1 (1959) showed that a catalyst With a
silica to alumina weight ratio of 7 to 1 was the most active for the
polymerisation of propene Johnson (1955) examined the polymerisation
activity Of propene at 200C for an impregnated ail ica alumina catalyst
with varying silica content and found that for a catalyst dried at
200C the optimum sll ica to alumIna weight ratio was 9 to 1 Tamele
(1950) also workIng at 200C and uSing a catalyst dried at 500middotC
reached the same conclusion as Johnson (1955)
33
1512 Eftect ot reaction temperatures
Silica alumina required temperatures higher than 200C to be active tor
the polymerisation of propene (Takahashi et a1 bullbull 1972) This was also
shown by Fe1db1yum and Baranova (1971) who working at 64C recorded
a conversion ot only 6~ The dependence Ot temperature tor propene
po1ymerisation over ail ica alumina was investigated by Takahashi et a1
(1972) in a t10w through system at a pressure Ot 50 atm The results
obtained by them are shown in Table 111
Tab 1 e 111 Propene 01 igomerisation on silica alumina at a constant
pressure of 50 atm and varying temperature Silica to
alumina ratio used was 94 to 3 throughout
Reaction Propene
temperature conversion
(OC)
200 126
250 407
300 641
350 679
1513 Ettect of space velocity
The relationship between the space velocity and po1ymerisation activity
expressed in terms of propene conversion was examined by Takahashi et
a1 (1972) tor a catalyst with a sil ica to alumina weight ratio Ot 9 to 1
at a temperature of 200degC and a pressure Ot 50 atm The results obtained
show that an inverse relationship exists between space velocity and
propene conversion
1514 Product spectrum
At the temperatures needed in the presence of silica alumina for propene
po1ymerisation dimerlsation is a minor reaction with the main product
being the propene trimer The effect Ot temperature on the product
spectrum at a pressure Ot 50 atm with a catalyst having a silica to
alUmlna ratio of 94 to 3 as established by Takahashi et al (1972) is
shown in Table 112 as are the results of Feldb1yum and Baranova
( 1971gt
34
Table 112 Product distribution of propene 01i90merised over silica
alumina as a function of temperature Reaction pressure is
50 atm
Researcher Feldblum and Takahashi et al (1972 )
Baranova ( 1971gt
Silica to 91 943
alumina ratio
Reaction
temperature 64 200 250 300 350
( degC )
Propene
conversion 6 126 407 641 679
(wtX)
Product
spectrum
Dimer (Co) 15 88 159 233 285
Trimer (C ) 756 438 362 307 231
Tetramer+ (Ct2+ ) 94 448 448 436 455
1515 Effect of activation
Holm et al (1959) examined the propene polmerisation activit of a
catalyst with a silica to alumina wei9ht ratio of 9 to 1 as a function
of the activation temperature Activation was achieved by holdin9 the
catalyst at each temperature for 16 h under dry air The found that the
optimum activation temperature with regards to propene 01 igomerisation
was 550middotC
152 Nickel oxide sil ica alumina properties
1521 Effect of synthesIs procedure
The two methods available for incorporating nickel onto silica alumina
are impre9nation and Coprecipitation The exact synthesis procedure and
nature of the catalyst has been discussed previously Holm et a1 (1957)
examined the polymerisation activity of catalysts prepared by these
35
methods and concluded that for coprecipitated catalysts the maximum
propene polymerisation activity was approximately 50X greater than that
for catalysts prepared by impregnation
1522 Effect of metal content
Hogan et al (1955) using a commercial catalyst with a sil ica to alumina
weight ratio of 9 to 1 concluded that when the metal was loaded onto
the support by impregnation the most active catalyst for the
po1ymerisation of propene contained between 3 and 5 wtX nickel Holm et
a1 (1957) using a co-precipitated and impregnated nickel oxide on
silica alumina catalyst establ ished that for both methods of loading
the maximum polymerisation activity per unit volume was also obtained
for a catalyst holding between 3 and 5 wtX nickel Takahashi et al
(1969) using a Commercial silica alumina with an alumina content of 13
wtX showed that for an impregnated catalyst a nickel content of 13 wtX
was optimum for the conversion of propene To maximize the yield of
propene dimer however the optimal nickel content was found to be 97
wtX When a co-precipitated as opposed to impregnated catalyst was
used Takahasi et al (1969) found that a nickel content between 3 and 5
wtX gave the optimum results for propene dimerisation
1523 Effect of reaction temperature and pressure
Hogan et a1 (1955) showed that when the reaction temperature was varied
from 35 to 130middotC the rate of reaction was highest in the ran~e of 70C
to 93middotC with a sharp dec1 ine in conversion when the pseudo-critical
temperature of 96C of the feed was exceeded and the system was
essentially in the vapour phase They concluded that the optimum
reaction conditions for the dimerisation of propene were a temperature
of 70C and a pressure of 40 atm Takahashi et a1 (1969) also examined
the effect of temperature and pressure with respect to propene
conversion and dimer yield and concluded that as long as the system
remained in the 1 iQuid phase the formation of dimers dominated with a
shift to heavier products as soon as the system moved into the vapour
phase The optimum conditions for the dimerisation of propene according
to Takahasi et a1 (1969) were a temperature of 70 to 80C with the
pressure ranging from 30 to 35 atm The above conclusions can easily be
represented graphiCally as shown in Figure 111
1524 Effect of feed composition and space velocity
Takahasi et al (1972) found that when pure propene was fed the surface
temperature of the catalysts rose far above the set reaction
temperature Consequently although the system was essentially in the
36
1000
~ (fJ 800 (fJ
II L
600 Z CJ t--I
(fJ 400 []
a w gt z CJ 200 U
00
[]
00 200 400 600 800 PRESSURE RTM
FIG 111 PRBPENE CBNVERSIBN (MRSS) VS PRESSURE (RTM)
1 iQuid phase a vapour phase reaction was taking place at the surface of
the catalyst with a corresponding shift to heavier products and rapid
deactivation of the catalyst It was therefore necessary to use a
mixture of propene and an inert diluent such as propane which served as
a heat sink and so controlled the catalyst surface temperature Hogan et
al(1955) varied the propene concentration in the feed from 7 to 37 vol~
at space velocities of 2 4 and 8 and concluded that the rate of polymer
production increased 1inearly with propene concentration A first order
relationship between propene concentration and rate of polymer formation
was obtained Hogan et a1 (1955) did not indicate how dimer selectivity
was affected as a function of feed composition Takahashi et al (1969)
using a 217 to 1 mixture of propene to propane wIth trace impurities
of ethane ethene and butenes concluded that the optimum space velocity
for the production of a propene dimer at the conditions of temperature
and pressure discussed earl ier was 750 g of propene per 1 iter of
catalyst per hour
1525 Effect of feed impurities
Hosan et a1 (1955) stated that the catalyst became deactivated if
allowed to absorb as 1ittle as 05 wt~ moisture This type of
contamination was however totally reversible Other impurities such
37
as acetelyne and carbon monoxide acted as severe poisons to nickel
oxide silica alumina while oxygen sulphur compounds and butadienes had
only a moderate poisoning effect The poisoning effect of these
materials was apparently not reversible as the catalyst did not
regenerate to any extent after removal of the contaminant from the feed
Takahashi (1969) on the other hand stated that the Scientific Design
Company had shown that by introduCing water or alcohol with the feed
the conversion of propene could be doubled without affecting
dimerisation activity
1526 Effect of activation procedure
The activation time temperature and gas flow rates were examined by
Takahashi et a1 (1969) with respect to acidity structure and propene
dimerisation activity of the catalyst They found when using 200 ml of
catalyst that a space velocity of 100 h- 1 of dry air at a temperature
between 500 and 600C was optimal and that the activity of the
catalysts increased with inCreasing activation time up to 5 h above
which the activity did not change Three distinct temperature regions
were identified by Takahashi et a1 (1969) between 300 and sOOmiddotC
physisorbed water was removed between 500 and 600middotC the concentration
of protoniC sites was highest and above 600 G C Lewis sites were formed
which could not be hydrated back to Bronsted sites
1527 Effect of regeneration
The po1ymerisation activity of the nickel oxide sil ica alumina catalysts
declined at a rate determined largely by the amount and type of
impurities in the feed and eventually regeneration was required (Hogan
et a1 bullbull 1955) The regeneration procedure was to strip the catalyst free
of hydrocarbon vapours and preheat it to a combustion temperature (about
400C) with dry inert gas The small amount of residual deposits were
then burnt off in dry air at 500C and the catalyst cooled under dry air
(Hogan et a1J 1955) After repeated regeneration the nickel oxide
promotor underwent changes which caused the activity to decline The
catalyst could however be restored to its initial activity by wetting
with a nitric acid solution followed by a normal activation
1528 Product spectrum
Takahasi et a1 (1969) together with Hogan et a1 (1955) fOlJnd that the
reaction conditions had a large influence on dimer compOSition The
reslJlts obtained by Takahashi et al (1969) at variolJs reaction
conditions are shown in Table 113 The products obtalned by Hogan et al
(1955) for once through propene conversion uSing a catalyst with 4 wt~
38
nickel at 75middotC and 40 atm and the results of Feldblyum and Baranova
(1971) using a temperature of 64C and a pressure of 50 atm and a
catalyst containing 45 wtX nickel are also shown in Table 113 Hogan
et 81 (1955) working with fixed feed composition and reaction conditions
studied the effect of varying the space velocity on the product
spectrum The results obtained by Hogan et al (1955) are shown in Table
114
1529 Lifetime
Hogan et al (1955) examined the lifetime of an impregnated nickel oxide
sil ica alumina catalyst using a cracked gas containing 25 molX ethene
10 mol~ propene and 12 mol~ butenes with butane as liquid diluent A 100
h run was done by Hogan et al (1955) and data was obtained on conversion
and on the properties of the products in butene-butane recycle
operation The reaction conditions used were a temperature of 65 to 75degC
and a pressure of 34 atm with feed rates of 600 standard volumes of
cracked gas and 4 1 iQuid volumes of butane-butenes per hour per volume
of catalyst The catalyst used contained 4 wtX nickel with a sil ica to
alumina weight ratio of 9 to 1 Hogan et al (1955) showed that the
activity of the catalyst with respect to total olefin conversion after
100 h on stream dropped from 99 to 96X The average rate of polymer
production was 350 ghlmiddotcat The polymer composition by volume was 13~
pentenes 26~ hexenes 20X heptenes and 41X octenes through decenes
In an indepndent study Allum (1974) prepared a nickel oXide silica
alumina catalyst by first impregnating silica gel with aluminium and
then with nickel The final catalyst contained 145 wtX aluminium 036
wtX sodium and 07 wt~ nickel The catalyst which was activated for 4 h
at 550degC under dry nitrogen was used to 01 igomerise 1-butene in daily
batches at aodegc and 54 atm in a 3 1 rocking autoclave for 24 consecutive
days The activity of the catalyst decreased from 020 grams of product
per gram of catalyst per hour (1st day) to 014 grams of product per
gram of catalyst per hour (24th day) Of the liquid 01 igomers 65 wt~
were octenes on the first day which rose to 85 wtX octenes on the 24th
day
16 Conclusion
As can be seen from the above discussion nickel oxide on Silica alumina
catalysts prepared by impregnation and coprecipitation have been studied
in great detail The technique of homogeneous decompositlon depOSition
for incorporating nickel into sil iea alumina is a much simpler technique
than coprecipitation and it is hoped that the catalytic properties with
39
respect to lifetime selectivity and activity are comparable to if not
better than the properties of coprecipitated or impregnated nickel
oxide silica alumIna catalysts
Table 113 Relationship between product distribution and reaction
conditions
a) Takahashi et al (1969) sil ica to alumina wei9ht ratio of 87 to 13
nickel content 13 wt~
b) H09sn et al (1955) silica to alumina wei9ht ratio of 9 to 1 nickel
content 4 wt~
c) Feldblyum and Baranova (1971) silica to alumina weight ratio of 9
to 1 nickel content 45 wtX
d) Distillation cut off temperature
Temperature Pressure
(degc ) (atm)
) 65
SO
90-95
120
75
75
75
75
75
80
75-80
75
35
35
35
35
15
20
25
30
32
35
50
70
47S
465
380
230
185
246
305
401
520
465
430
435
335
3S0
340
3S0
210
250
280
310
270
350
340
250
97
95
190
260
395
350
300
150
140
95
135
220
22
18
24
98
137
90
36
66
28
18
30
25
b ) 75 40 720 190 60 30
c ) 64 40 77 2 202 26
40
Table 114 Propene conversion and product spectrum as a function of
space velocity sil ica to alumina ratio is 9 to 1
throughout
Conversion Space Ct2 Ct 5 +
(wtX) ve 1oC ity
53 2 777 160 61 24
68 4 737 200 70 32
83 8 656 210 88 64
41
17 OBJECTIVE OF RESEARCH
The aim of this study was to investigate the propene oligomerisation
properties of NiOSi02-A1203 catalysts synthesi~ed using three
different techniques impregnation Co-precipitation and homogeneous
decomposition deposition The effect of the following factors on the
activIty selectivity and 1 ifetime of these catalysts for propene
01 igomerisation were investigated
(i) Nickel content of catalysts
(ii) Reaction pressure and temperature
(iii) Weight hourly space velocity
(iv) Reactor temperature stabil ity and
(V) Propene feed moisture content
42
2 DESIGN OF ISOTHERMAL REACTOR
21 Introduction
In order to facilitate interpretation of reactor data it was important
that the reactor used in this study was as isothermal as possible
Various attempts have been made to achieve this Hogan et al (1955)
surrounded the reactor with an electrically heated jacket containing a
liQuid which was boiled at a temperature fixed by the pressure of an
inert gas applied to the top of the reflux condenser Imai (1968) on
the other hand inserted the reactor into a heated bed of iron powder
In the case of the present work a similar system was used to achieve
isothermal conditions A detailed description of the design of this
reactor will now be given
22 F1uidisation theory
If a fluid passes upward through a bed of solids at a low velocity the
pressure drop aCross the bed is the same as that for a downward flow As
the fluid velocity increases the particles become rearranged so that
they offer less resistance to the flow and the bed starts to expand
This process continues as the velocity is increased with the total
frictional force remaining eQual to the weight of the particles until
the bed has assumed the lowest stable form of packing If the velocity
is then increased further the individual particles separate from one
another and become freely supported in the fluid At this stage the bed
is said to be fluidised Further increases in fluid velocity cause the
particles to separate still further from one another and pressure
differences remain approximately eQual to the weight per unit area of
the bed The above phenomenon can be represented graphically if the
pressure drop across the bed is plotted against fluid velocity through
the bed using logarithmic co-ordinates
Thus in Figure 21 (Coulson and Richardson 1980) a 1 inear relation is
obtained on a log log scale up to the point where bed expansion takes
place (A) The slope of the curve then gradually diminishes as the bed
expands As the velOCity is increased the pressure drop passes through
a maximum value (B) and finally falls slightly before attaining an
approximate constant value independent of fluid velocity (CO) The
section (CO) of the Curve is an indication of the Qual ity of
fluidisation for if the pressure drop is constant as the fluid velocity
43
increases channel in~ is absent Point (B) which 1 ies above (CO)
identifies the point where the frictional forces between the particles
is bein~ overcome prior to rearran~ement The point of minimum
fluidisation velocity ie bullbull the fluidising point is shown on this
Curve at (E) (Coulson and Richardson 1980)
FLUIDISED BEDFIXED BED
0shyltl I VELOCITY
INCREASING
FLUIDISING
POINT
VELOCITY DECREASING
(BED OF MAXIMUM I
POROSITY)
I
I I
LBG (Ve) FIG 21 PRESSURE DRep eVER FIXED AND FLUIDISED
BEDS
23 Heat transfer
Fluidised beds have good heat transfer properties and are ideal in a
system where close control of temperature is reQuired The intimate
mixing which takes place in the bed ensures that heat transfer
throughout the system is very rapid and that uniform temperatures are
Quickly attained
Three mechanisms have been suggested to explain this improvement in heat
transfer coefficient An increase of up to one-hundred fold as compared
with the value obtained with a gas alone at the same velOCity can be
attained by the presence of the sol id Coulson and Richardson (1980)
stated that the particles whose heat capacity per unit volume IS many
times greater than that of the gas act as heat transferring agents As
a result of their rapid movement within the bed they pass from the bulk
of the bed to the layers of gas in close contact with the heat transfer
44
surface exchanging heat at this point and returning to the body of the
bed This together with the extremely short physical contact time of
the particle with the surface ensures that the thermal conductivity of
the particle is not an important factor The second mechanism proposed
by Coulson and Richardson (1980) is the erosion of the 1amminar sub1ayer
by the particles and the subsequent reduction in its effective
thickness A third mechanism suggested by Mickley and Fairbanks (1955)
is that packets of particles move to the heat transfer surface and an
unsteady heat transfer process takes place
Many equations are available in the 1 iterature to calculate the
convection heat transfer coefficient of the gas solid system One
equation which seems to be the most re1 iab1e is that of Dow and Jakob
(1951) The Nusse1t number with respect to the tube diameter is
expressed as a function of four dimensionless groups the ratio of tube
diameter to length ratio of tube to particle diameter ratio of heat
capacity per unit volume of the sol id to that of the fluid and finally
the tube Reynolds number These relations are combined as shown below
where h is the heat transfer coefficient
k is the thermal conductivity of the gas
d is the particle diameter
dt is the tube diameter
is the 1ength of the bed
E is the bed voidage
P is the density of the sol i d
p is the density of the gas
c is the specific heat of the sol id
c is the specific heat of the gas
v is the viscosity of the gas and
Uc is the superficial velocity based on the empty tube
At the present stage of our knowledge the above equation seems the most
re1 iab1e and will thus be used to estimate heat transfer coefficients
and optimum particle diameter
24 F1uidising medium
Various materials were investigated It was assumed that each material
had a discreet size fraction As a high heat transfer coefficient was
important if the f1uidised bed was to perform its function effectively
45
the equation developed by Dow and Jakob (1951) as discussed abov~ was
used to compare the various sol ids Furthermore two bed temperatures
were used to identify any changes in heat transfer coefficients as a
function of bed temperature The results are shown in Figures 22 and
23 It can be seen from these figures that a maximum exists at a
particle size of approximately 150 ~m and that the convective heat
transfer coefficient drops slightly as the bed temperature is increased
Copper powder gave the best results a heat transfer coefficient in
excess of 1000 Wm2 K for a particle of 150 ~m The explosive and toxic
nature of meta1l ic dust at the temperatures reached during calCination
made this an undesirable solution Sand however was less dependant on
both the particle size and bed temperature is totally inert and readily
available It was thus decided that sand would be used as fluidising
medium
241 Sand data
Two sands were readily available These were coded by the manufacturer
as No1 and No 12 Their size distributions are shown in Table 21 As
the actual material had a size range rather than a discreet particle
size an effective particle diameter had to be establ ished Using the
relation suggested by Leva (1959)
where d is the effective particle size and Xi is the size fraction of
particles of size dt the effective particle size was calculated
The efficiency of f1uidisation (Leva 1959) of sands with wide (No 12)
as opposed to narrow (No2) size distributions effectively eliminated
sand No 12 from further consideration
25 Optimisation of the fluidised bed
As discussed In Section 21 a bed of sol ids becomes fluidised only when
the superficial velocity exceeds the minimum fluidisation veloCity As
it is important for the bed to be totally fluidised the minimum
fluidising velocity has to be found For this reason the system was
modified as shown in Figure 24 An attempt was made to measure the
pressure drop across the bed Itself but was Tound not to be pOSSible as
the fluidislng medium would block the tapPIng point at the bottom of the
bed
46
c 11 00
N ltl L 900 3
bull bull 700
LL LL W ~ U 500
bull IshyU 300 W gt z CSJU 100
(J=SAND ()=CepPER amp=lINC +=ALUNINIUN X =cepPER ax 1DE 0=ZINC aXIDE
~~---e------pound9-__
00 500 1000 1500 2000 2500 3000 3500
PRRTICRL DIRMETER UM FIG 22 CBNVECTIBN CBEFFICIENT (WMa2 K) VS
PRRTICRt SIZE (UM) 25C shy
c 900
N ltl L
3 700 bull
LL lLW 500
~ U
bull I- 300 U W gt z CSJ U 100
+=ALUNINIUN x =capPER ax I DE 0=lINC eXIDE
(J=SAND ()=cepPER amp=ll NC
00 500 1000 1500 2000 2500 3000 3500
PRRTICRL DIRMETER UM FIG 23 CBNVECTIBN CBEFFICIENT (WMa2 KJ VS
P R R T 1 CAt S I Z E (U M ) 190 bull C
47
11
FIG 24 REACTOR MODIFICATIONS TO MEASURE PRESSURE DROP
48
Key to Figure 24
1 Feed in 1et
2 Feed preheater
3 Product outlet
4 Integral reactor
5 Reactor support
6 Thermowe 11
7 Tubular embedded element (10 kW)
8 Mica band elements (05 kW)
9 Insulation
10 Fluidised sand bed
11 Gas distributor
12 Rotameter
13 Air supply
14 Oisengagement zone support
15 U-tube manometer
The procedure used to determine the data to prepare a plot of pressure
drop across the bed vs the superficial velocity through the bed is
discussed below
Table 21 Sand size fractions
Size No 12 No 2
(vm) (wU) (wU)
-420
420-350
350-297
297-250
250-210
210-177
177-149
149-125
125-105
105-74
74 shy
Mean size
06
190
336
289
155
22
02
(101m) 1668
01
04
21
86
202
153
242
125
117
49
1243
49
251 Airflow optimisation
The calibration chart of the rotameter could be approximated usin9
Vc = 1983 + 0S8SmiddotTR + 0005 TR2
where Vc is the volumetric flowrate in lmin at lSC (Tc) and 760 mmH9
(Pc) and TR is the rotameter tube readin9 Usin9 ideal 9as behavior
this can be corrected to the actual temperature (Tr) and pressure (Pr)
in the rotameter usin9
Vr = (Vc Pc Tr ) I (Tc P r )
where Vr is the volumetric flowrate at rotameter temperature
and pressure
The pressure in the rotameter was that measured at the inlet to the bed
and was use to calculate the actual flowrate at each tube readin9 If
the 109 of the pressure drop across the bed and 4Ha was plotted a96inst
the 109 of the superfiCial velocity a strai9ht line was obtained The
9raph is shown in Fi9ure 25 The shape of this curve does not
correspond to that of the curve as discussed in Section 21 This is due ( l _ -- i~ -()~
to the fact that the pressure drop across the d~sk was included in the
calculation
200
60 0
IT I-shy--J W 20 0
D ~
080--J
040
-27 -25 -23 -2 -9 - 7 - 5
LBG (Vel FIG 25 PRESSURE DRBP VS SUPPERFICIRL VELBCITY
RCRBSS DISK RND BED
50 - ~
Having previously determined the pressure drop across the d~ the
actual pressure in the bottom of the bed could be calculated at each
rotameter tube reading using
Pb = Pr - Pd
where Pb is the pressure in mmHg at the bOttOM of the bed above the
disk and Pd is the pressure in mmHg in the rotameter when no sand was
in the bed
This corrected pressure was then used to calculate the actual flowrate
through the bed The temperatures of the rotameter and bed were assumed
to be identical and so
where Vb is the air flowrate at the bottom of the bed in lmin Using
the above procedure and plotting the log of the pressure drop across the
bed (Pb) against the log of the superficial velocity (Vb) a Curve of the
classic shape is obtained as shown in Figure 26 without the integral
reactor and in Figure 27 with the integral reactor in the bed In both
cases the minimum fluidisation veloCity was round to be 121 llmin
(Point E on Figures 26 and 27) and channel ing was absent (Part CD in
Figures 26 and 27 is flatgt
a
IT Ishy--J W 0 --
0 ~
1 70
1 50
1 30
10
090
070
050
-26 -26 -24 -22 -20 -1 6 -1 6
LBG (VC) FIG 26 PRESSURE DRep VS SUPPERFICIAL VELeCITY
INTEGRAL REACTeR ABSENT
51
1 70
shy
I 50
CL 1 30
CI f shy~ W 1 10 0
0900 a ~
070
050
-28 -26 -24 -22 LBG (Ve)
-20 -1 8 -1 6
FIG 27 PRESSURE INTEGRRL
DRBP VS RERCTBR
SUPPERFICIRL PRESENT
VELBCITY
252 Temperature correction
As the temperature in the bed increased to reaction conditions the
superficial velocity increased at a fixed rotameter setting This
resulted in a change in the Quality of fluidisation It was thus
desirable to develop a relationship between the bed temperature and the
rotameter tube reading at the minimum fluidisation velocity As the
temperature of the gas was raised to 330degC within 25 mm above the
distributor as shown by Heertjie and McKibbins (1956) the only
assumptions that had to be made was that the pressure drop across the
bed and di-~k-~as independent of temperature and that the i deal gas 1aw
applied Thus
To find the tube reading which corresponds to the air flowrate
calculated above the value had to be corrected to the rotameter
cal ibration conditions using
Vc = (VrTcPr)(PcTr)
Combining the above eQuation with that used to approximate the rotameter
cal ibration chart and solving for TR we get
52
TR = -585 + laquo30234 + 200Vr )s)
Tne resultin~ ~rapn is snown in Fi~ure 28 Usin~ tnis ~raph it was
ensured that the superficial velocity in the bed was close to the
minimum fluidisation velocity at any bed temperature
0 Z 0 CI W 0
W CO J I shy
200
180
160
14 0
120
100
80
60
00 400 800 1200 1600 2000 2400 2800
TEMPERRTURE C FIG 28 BED TEMPERATURE ( C) VS RBTAMETER
SETTING VB=121 LIMIN
53
3 EXPERIMENTAL METHODS
31 The reactor system
311 Layout
All experimental work was done in an inte~ra1 hi~h pressure reactor
system A dia~ram of this system is shown in Fi~ure 31 The feed a 41
mixture of propenepropane obtained from SASOL was contained in a
number seven Cadac cy1 inder mounted bottom up to ensure that only 1i~uid
emanated from it Water and entrained impurities were removed from the
feed by passin~ it throu~h a bed of Union Carbide 3 A molecular sieves
and through a 1 ~m sintered metal filter
The vapour pressure of the feed had to be lowered before it could be
pumped by the Lewa hi~h pressure diaphragm pump To achieve this the
feed was piped throu~h a heat exchan~er held at -1SC The pump head was
also cooled to this temperature In this way cavitation was prevented
and efficient workin~ of the pump was ensured From the delivery side of
the pump the feed was piped throu~h a preheater where it was heated to
within 20C of the operatin~ temperature to the top of the integral
reactor
The products from the reactor were piped throu~h a heat exchanger held
at 6C and a 20 ~m sintered metal filter to the Grove Mity Mite back
pressure re~ulator Here the materials were released to atmospheric
pressure The back pressure re~u1ator had to be heated to 60C to
prevent freezin~ of the products due to a Joule Thomson expansion and
subse~uent failure of the unit To achieve this a water bath was used
the liquid bein~ pumped throu~h a pipe wrapped around the outside of the
unit
The products were then piped via a heat exchan~er to a double walled
catchpot where ~as-1 iQuid separation occurred To ensure total
separation the 1 iberated ~as was passed through a Davies double surface
condenser held at -1SC with the condensate fed back to the catchpot
The catchpot was periodically drained and the liquid stored for later
analysIs The flue gas was then piped through a 10 1 surge tank to the
wet ~as flow meter Finally the flue gas was passed through a sampl ing
loop which could be removed from the system and vented to the
atmosphere
54 regshy --
--8
regshyL-------r
middot x lJJ l shymiddotI ltI)
middot I
I gtshyltI)bull
I 0
I C I l shy
( ltr I lJJ
0 I -
rlt
e-uc1
reg-r-------- r-I-rx1---1________J
regt--==-==-=--=-=--=--_==-==-~=r111_~r--------
55
Key to Figure 31
1 Monomer feed cylinder
2 Dimer feed cyl inder
3 Gas tight Quick connector
4 3A molecular sieve holder
5 1~m sintered metal filter
6 20~m sintered metal filter
7 Glycolethanol cooler
8 Glycolwater cooler
9 Glycolwater cooled catchpot
10 Glycolethanol cooled condenser
11 Monomer pump
12 Dimer pump
13 Bursting disk (70 atm)
14 Thermowell
15 Reactor
16 Fluidised sand bed
17 Feed preheater
18 150vm sintered brass disk
19 10 mm rotameter
20 Oil condenser
21 Back pressure regulator
22 Condensation unit
23 Surge tank
24 Wet gas flow meter
25 Gas sampl ing loop
26 Nitrogen bottle (hish purity)
27 Nitrogen bottle
28 Air supply
29 Hydrogen bottle (high purity)
A separate line was used to purge the reactor with wet or dry hydrogen
nitrogen or air depending on the pretreatment required by the catalyst
Vent lines were installed to prevent air locks in the system during
start up
The safety of the line was ensured by a bursting disk set at 70 atm and
a pressure re1 ief valve in the pump which permitted internal circulation
if the del ivery side pressure exceeded the set point
Two cooling Circuits were employed An ethylene glycolwater mixture at
6C was used to cool the catchpot and all product heat exchangers while
56
an ethanolwater mixture at -10C was used to cool the feed heat
exchanger pump head and the flue gas condenser
32 Reactor
Before any statement could be made about the effects of temperature on a
reaction in an integral reactor the latter had to be as nearly
isothermal as possible Various attempts have been made to achieve
isothermal ity eg Hogan et a1 (1955) surrounded the reactor with an
electrically heated jacket containing a 1 iQuid which was boiled at a
temperature fixed by the pressure of inert gas applied to the top of the
reflux condenser 1mai (1968) on the other hand inserted the reactor
into a heated fluidised bed of iron powder In the present work the
system used by Imai (1968) was adopted Sand was however substituted for
iron powder as the explosive and toxic nature of metal1 ic dust at the
temperatures reached during calcination made the latter undesirable The
final result was a reactor where the temperature in the catalyst bed
could be held within 5C of the set point Each aspect of this design
was discussed in Chapter 2 while a description of the reactor is given
below The reactor consisted of two distinct parts the fluidised bed
and the integral reactor Both are shown in Figure 32
321 F1uidised Bed
The fluidised bed consisted of a rolled sheet metal chimney with a
removable disengagement zone An inverted tripod was suspended from the
top of the chimney into which the reactor was hung Air was injected
into a sealed chamber at the bottom of the bed in such a way as to
prevent impingement of the gas on the distributor (see Figure 32) The
distributor used was alSO vm sintered brass disk Great care had to be
taken to mount the gas distributor absolutely horizontally as severe
channeling and corresponding loss in heat transfer efficienCY would
result otherwise The air flow through the bed was controlled usin9 a 10
mm gas rotameter with a stainless steel float
Heat was suppl ied to the fluidised bed by five mica band elements
strapped around the outside of the chimney Each element was rated at
05 k~ The controlling thermocouple Cchromel-alumel) was situated on
the inside wall of the chimney half way up the bed To prevent heat loss
to the surrounding the entire unit was insulated using asbestos cloth
57
reg
FIG 32 INTEGRAL REACTOR AND FLUIDISED SAND BED
58
Key to Figure 32
1 Feed inlet
2 Feed preheater
3 Product outlet
4 Integral reactor
5 Reactor support
6 Thermowell
7 Tubular embedded element (10 kW)
8 Mica band element
9 Insulation
10 Fluidised sand bed
11 Gas distributor
12 Rotameter
13 Air supply
14 Disengagement zone support
322 Integral Reactor
The reactor was a multi-component single seal unit with a bed diameter
of 25 cm Two distinct sections could be identified cross-sections of
which are shown in an exploded form in Figure 33
The insert consisted of the top flange through which the thermowell and
feed were passed and the catalyst bed jacket which was screwed into the
bottom of this flange The catalyst bed jacket was stoppered at its
lower end by a perforated plug which prevented bed entrainment and
centered the bottom end of the thermowell Holes were drilled through
the top flange to allow passage of the securing bolts The sleeve
consisted of the bottom flange to which the reactor jacket was welded
which in turn was sealed at its lower end by a Concave plug through
which the products were taped off Securing bolts were anchored in the
top surface of the bottom flange Sealing was achieved by a groove in
the bottom flange and a ridge in the top flange These served as a seat
for a laminated graphite nickel seal
Separation of the units upon completion of a run was achieved with the
aid of two 6 mm bolts These bolts were screwed through holes in the top
flange onto the top surface of the bottom flange In this way the units
could be forced apart
Heat was supplied to the unit by a 1 kW tubular imbedded element wrapped
around the outside of the reactor jacket This element was used only
59
o
e- _ _--+-shy
FIG 33 INTEGRAL REACTOR
60
Key to Figure 33
1 Reactor sleve
2 Plug
3 Seal ing bolts
4 Sealing groove
5 Bottom flange
6 Top flange
7 Reactor insert
8 Feed inlet
9 Thermowell inlet
10 Sealing ridge
11 Thermowe 11
12 Bed seath
13 Purforated plug
14 Sealing bolt channel
15 Seperation bolt channel
during calcination The controll ing thermocouple (chromel-alume1) was
placed halfway up the thermowel1 running down the center of the catalyst
bed
Temperatures of the reactor fluidised bed and feed were monitored using
a Digitron temperature display connected to 11 iron-constantan
thermocouples Ten of these were situated at regular intervals in the
central thermowe11 to record the catalyst bed temperature profile and
feed temperature The fluidised bed thermocouple was mobile and could be
moved throughout the bed
33 Operation
331 Loading
For every run the reactor was packed in a similar way as shown in Figure
34 Four distinct regions were identified These were from the bottom
up
1 A region of void capped with a wire mesh which prevented the
catalyst and beads from blocking the reactor exit
2 A layer of glass beads which served as a disengagement zone and
prevented catalyst entrainment
3 The catalyst bed which Consisted of 11~ inch extrudates mixed with
2 mm glass beads in a ratio of 11 by volume The beads served as a
heat sink and catalyst diluent
4 A plug of glass beads capped by a wire mesh This ensured preheating
and prevented movement of the bed during sudden pressure drops
The depth of each layer was accurately measured to fix the number and
position of the thermocouples in each region
332 Calcination procedure
Prior to each run the catalyst was calcined The purpose of calcination
was to burn off organic intermediates incorporated in the catalyst
during synthesis and to convert all the nickel nitrate to nickel oxide
At the same time the catalyst was freed of all but a trace of moisture
(Hogan et a1 1955)
Calcination for all experimental work was carried out in-situ Dry air
was passed through the bed at a rate of 500 m1-gasm1-cat-h while the
temperature was stepped up in 50degC increments at intervals of 10 min
The activation was continued for an additional 4 h at 500degC
Upon completion of this step the activated catalyst was purged with dry
nitrogen until the temperature of the bed dropped to 250degC When this
temperature was reached the reactor was sealed at a pressure of 10 atm
under dry nitrogen before being allowed to cool to room temperature
35 ml of 2 mm 91ass beads
18 m1 of catalyst mixed
with 2 mm glass beads in
a ratio of 11 (vv)
Total volume 80 ml
50 ml of 2 mm glass beads
void
FIG 34 REACTOR BED
62
333 Start-up
Prior to introducing the reactants into the system the cooling circuits
and water bath were allowed to operate for a sufficiently long time to
ensure that the temperatures reached steady state The back pressure
regulator was set to the desired value and the fluidising air set to the
value determined previously
The feed cyl inder was then opened and the reactants allowed to flow to
the inlet of the sealed reactor All air was removed from the low
pressure side via a vent 1 ine and the pump started At this time the
reactants were allowed to flow through the reactor and into the rest of
the line When the pressure in the system reached its set point the
pump setting was altered to give the correct feed rate Once this had
been achieved the temperature of the bed was set to the desired value
When the first drops of liquid were collected the feed cyl inder was
changed and the catchpot emptied This was taken as time zero Although
a certain amount of data was lost during start-up this persisted over a
relatively small time fraction of the entire run Little significant
information was therefore lost Furthermore in this way the liquid left
in the line and reactor at the end of a run did not affect the mass
balance
334 Steady state operation
To monitor the performance of the isothermal reactor and the catalyst
the following readings were taken at selected time intervals
- bed temperature profile
- fluidised bed temperature
- fluidising air flow
- 1 iQuid mass and volume
- tail gas meter reading
- tail gas temperature
- GC analysis of tail gas
- GC analysis of 1 iquid
The feed cyl inder was changed when necessary The mass of the used and
fresh cylinder was noted
335 Shut-down
When shutting down the system the feed pump was switched off and the ~~
procedure as outlined above followed The feed cyl inder was however not
replaced Once the relevant data had been collected
- the temperature controllers were switched off
- the coolant and heating flows were stopped
- the system pressure was released to atmosphere
Temperature runaways did not oCcur during start up However it was
found that the degree of control that could be exercised was sensitive
to sand height and the pOSition of the contro11 ing thermocouple in the
fluidised bed which were consequently monitored by visual inspection
throughout the run
34 Data analysis
The data and collected during the run was analysed using a variety of
procedures These are discussed below
341 Computation of results
A computer program was util ised to analyse the data obtained during the
runs The following was computed
Mass balance The percentage mass loss was calculated using
(total liquid out + total gas OUU]X mass loss = 1 - - 100
[ (total weight of feed in)
where the (total liquid out) is measured directly by adding the weight
of all 1 iquid sampled The (total gas out) was calculated using
(P-V-M)total gas out =
(Z-R-rgt
where P = pressure in atm
V = total volume of fl ue gas in 1 i ters
M = molecular weight based on mean over entire run
Z = compressibility factor (0986)
R = universal gas constant (S21xlO- 2 atmlgmoleK) and
T = gas meter temperature In K
64
Two limiting cases of where mass loss could OCcur would be 1) all mass
was lost before the reactor in which case the mass out would be equal to
the effective mass in and 2) all mass was lost after the reactor in
which case the mass in would be equal to the mass out plus the mass
lost To account for the mass lost it was assumed that the rate of mass
loss was constant throughout the run and that the mass was lost in the
form of gas The calculated WHSV and conversion would depend upon where
the mass loss occured The equations used to calculate these are shown
below
Wei9ht Hourly Space Velocity This was the rate of feed in per hour per
gram of catalyst and was calculated usin9
(mass of propene and propane passing over the catalyst)WHSV =
(total time)(catalyst mass)
where n = 1 if it was assumed that all mass was lost before the reactor
n =2 if it was assumed that all mass was lost after the reactor
Liquid production rate This is an indication of the activity of the
catalyst and is expressed in terms of grams of liquid product obtained
per gram of catalyst per hour As it was assumed that all mass lost was
gas the mass of liquid out was that measured and the LPR was calculated
using
(mass of liquid out - mass of dissolved gas)LPR =
(total time)(mass of catalyst)
Liquid mass X conversion This is calculated using the formula
mass X conversion =[ (LPR) ] 100 WHSVn(w)
where n = 1 if it was assumed that all mass was lost before the reactor
n = 2 if it was assumed that all mass was lost after the reactor
w is the mass fraction of propene in the feed
Liquid sample composition The liquid product was grouped into 01 igomers
of propene as dimer trimer tetramer etc The liquid composition was
based on the mass percent output the response factors havin~ been set
equal to one It can be used to compare 01 i~omer production rate between
different runs and variations with time in a particular run
65
Gas sample composition This data is expressed in terms of mass X since
all GC response factors have been determined
Apart from the mass balance data all other results could be presented in
graphiCal form as functions of time on stream ~hen the data was plotted
in this wayan average time between two sampling pOints was used Data
was recorded only from the time that the first drop of product was
collected this time being defined as time zero
35 Analytical procedure
351 Gas analysis
Both the feed gas and flue gas were analysed on a Gow-Mac 750p gas
chromatograph whose responses from the detector were monitored by a
Varian 4270 intergrator The packing used for this work was n-Octane
Poracil C in a 55 m glass column with an inner diameter of 4 mm Table
31 shows the typiCal composition of the feed used The GC settings
used together with a typical chromatogram of the feed with its retention
times and response factors are shown in Appendix A as is a discussion
of the calibration procedure
Table 31 Feed Composition
Hydrocarbon MassX
Methane 00
Ethane 09
Propane 20
Propene 78
Iso-Butane 02
N-Butane 02
1-Butene 04
Iso-Butene 01
T2-Butene 01
C2-Butene 01 C5+ 02
352 LiQuid analysis
LiQuid samples were analysed by a Varian 3400 together with a Varian
8000 auto sampler The packing used for this work was 3 3i1 iconOV-lDl
66
on Chromosorb W-HP 100120 mesh in a 3 m long glass column with an inner
diameter of 4 mm The responses from the GC were monitored by the
Varian Vista 401 data system This system could be programmed to give an
integral analysis of the results The GC settings as well as a
discussion of the optimisation and cal ibration procedure used are given
in Appendix A
Due to the complex nature of the liquid products the analysis of the
liquid spectra was difficult To facilitate product analysis it was
decided that the 1 iquid product analysis be based on carbon number
groupings rather than on individual Components The groupings chosen are
shown in Table 32
Table 32 Carbon number groupings used for 1 iquid analysis
Group Range
Monomer (C3 ) C3 -c Dimer (C ) C~ -C7
Trimer (C ) Ca -Ct 0
Tetramer (C t 2 ) Ctt-Ct3
Pentamer (C t ~ ) Ct -Ct
Heptamer (Cta ) Cn -C
Hexamer (C2 t ) C20+
353 Nuclear magnetic resonance
The hydrocarbon functional group distribution of C to Cta propene
oligomerisation products was determined using lH NMR Conventional
methods of spectral analysis for propene 01 igomers were inadequate
because of the great variety of head to tail and tail to tail fragments
generated and because of the greater influence from end groups
As 13C NMR was not available at the time of this work only a partial
analysis of the 1 iQuid products was possible The information thus
obtained was that of the type of proton present primary secondary or
tertiary The characteristic proton chemical shift for the relevant
protons are shown in Table 33 (Galya et a1 bullbull 1985)
67
Table 33 Structure definitions of terms and NMR spectral
positions and area code (Galya et al bullbull 1985)
Species Structure Area
(ppm) Code
Protonated aromatic
Olefinic CH2
Olefinic CH
Aromatic CH
Aliphatic region
or to aromatic CH2
or to aromatic CH3
or to olefinic
CH CH2
or to olefinic
CH3
11 to olefinic
CH CH2
CH2 between
isopropyl end
groups and CHs
Term i na 1 CH3
Internal CH3
and olefinic region_
R-CH=CH2
R-CH=CH-R
ltO~CH2-CH2-R
ltO~CH3
R2-CH-CH=CH-CH2-R
R-CH=CH-CH3
CH3 -(CH2)2 -CH=CH-R
R-CH(CH3 )-(CH2 )2 -CH=CH-R
450-475 L
475-575 M
650-730 N
230-300 A
210-230 B
180-210 C
1 40-1 80 o
100-140 E
092-1 00 F
084-092 G
070-084 H
68
Using the equations developed by Galya et a1 (1985) for the C6 to Cta
oligomerisation products of propene each lH area was first converted to
a carbon area before the percentage of each was calculated
The carbon area of CH3 was calculated using
(Area G + Area 0 + Area B + Area H)CH3 carbon area =
3
and the carbon areas of CH2 and CH were calculated using
(Area E + Area A + Area C) (Area H)CH2 carbon area = --------------------------- + Area F
2 6
Area HCH carbon area = + Area F
3
The degree of branching ie the CH3 to CH2 CH3 to CH and CH to CH2
ratios could be approximated (Ga1ya et al bullbull 1985) using
2middot(AREA G + AREA 0 + AREA B + AREA H)= CH2 3middot(AREA E + A~EA A + AREA C) - AREA H + 6middotAREA F
(AREA G + AREA 0 +AREA B +AREA H)= (AREA H + 3-AREA F)
CH = CH2 3middot(Area E + Area A + Area C) - Area H + 6middotArea F
The above equations will be used to analyse the NMR spectra in this
work
354 TGOTA
Thermogravimetry (TG) involves measuring the changes in sample mass with
temperature using a thermobalance This is a combination of a suitable
electronic microbalance with a furnace and aSSOCiated temperature
programmer The balance is in an enclosed system so that the atmosphere
can be controlled Differential Thermal Analysis (OTA) involves
measuring the difference in the temperature between the sample and a
reference material while both are being subjected to the same
temperature program Both TG (mass loss In wtX) and OTA (temperature
difference between sample and reference material) are recorded as a
function of furnace temperature The furnace used in this work was a
STA-780 Series with a Stanton Redcroft Thermal Analyser The balance was
69
controlled by a Stanton Redcroft Balance Controller while the
temperature in the furnace was controlled by a Stanton Redcroft
Temperature Controller The si~nals were amplified by a Stanton Redcroft
DC amplifier and recorded by a Bondwe11 Personal Computer
In this work 20 m~ of sample was placed in the furnace and the
temperature raised from 40C to 850C at a rate of lOCmin in flowin~
air or nitro~en
355 Water content determination
The water content of the feed was determined by measurin~ the dew point
temperature of the water in the feed usin~ a Panametrics Hy~rometer
ltModel 7000) with an aluminium oxide sensor Approximately 48 h was
needed for the system to stabilise Once this temperature had been
measured the vapour pressure of the water in the feed was determined (at
1 atm) and the mole fraction of water in the feed determined Usin~ the
above procedure it was found that the feed contained approximately 112
ppm (vv) water
356 Distillation
The 1 iquid products obtained from the high pressure reactor runs were
distilled in a glass distillation column shown in Fi~ure 35 to
separate the C from the heavier fractions After the still was filled
up to 3 liters per batch it was placed into a heatin~ mantle and
connected to the column with a Gduick-fit connector Upon heating the
vapours from the still passed via a column packed with berl saddles to a
condenser Here the condensate was either directed back to the column as
reflux liquid (plun~er down) or to the catchpot (plun~er up) as
product This separation was controlled by a solenoid operatin~ a ma~net
fused to the plun~er The solenoid in turn was controlled by a timing
device with which the total cycle time and reflux time could be set The
reflux ratio was then calculated by the ratio of the time the plun~er
was up to the time that the p1un~er was down For all cases the reflux
ratio used was 29 The cut off temperature was set by a thermostat at
the top of the column When the desired temperature was reached power
to the solenoid was discontinued and subsequently the plunger remained
down (total reflux) The cut point temperature used was 6ZC The
coolant used in the condensers was water Dissolved gases did not
condense and were vented to the atmosphere
70
1-+-+----1 5
FIG 35 BATCH DISTILLATION UNIT
71
Key to Fi9ure 35
1 Still
2 Berle saddle column
3 Reflux condenser
4 Magnet at top of plunger
5 Plunger assembly
6 Gas tappin9 point
7 Distillate receptacle
36 Catalyst synthesis
361 Support preparation
The silica-alumina support was received from Kal i Chemie in the form of
4 mm spheres which were crushed in a ceramic ball mill to -500 ~m The
silica to alumina ratio was 91 on a wei9ht basis
362 Impregnation
A previously determined mass of metal salt was dissolved in 500 ml of
distilled water to which 50 9 of silica alumina was added The solution
was boiled under reflux for 1 h with vigorous agitation throughout The
vessel was then opened to the atmosphere and while being a9itated most
of the water boiled off The concentrated solution was transferred to a
ceramic pie dish and placed into an oven at 120C where the remaining
water was evaporated Once the material was completely dry it was
crushed sieved and stored The above was adopted from work by H09an et
a1 (1955) and Holm et a1 (1957)
3621 Nickel concentration
The Quantity of nickel needed to make a catalyst of known metal content
was determined in a separate experiment Using a constant mass of sil ica
alumina but varyin9 the amount of nickel nitrate hexahydrate a loadin9
curve was constructed The synthesis procedure used was that as
discussed above The nickel content of the material was determined usin9 b
atomic a_sorption spectrophotometry The loadin9 Curve is shown in
Figure 36
363 Hom0geneous decompOSition deposition
In this method 45 9 of nickel salt was dissolved in 500 ml ot distilled
water to which 50 9 of silica alumina was added The solution was then
heated under reflux to 100C at which point 25 9 ot urea crystals were
added This was taken to be time zero The solution was then ret1uxed
72
while continuously being agitated for a previously determined period of
time as discussed below Excess water was removed by filtration in a
Buchner funnel and the catalyst washed with 20 volumes of hot (90C)
distilled water per volume of catalyst The catalyst was then dried at
110C in a ceramic pie dish for 12 h before being crushed and stored
The above synthesis procedure was adopted from work done by Van Dillen
et a1 (1977) Richardson and Dubus (1978) and Hermans and Geus (1979)
120 IMP LOADING CURVE
SOG S i 02 I A h 03 ~
SOOml H2O(f) 100
(f)
a L
60 bull
IshyZ 60 CD U
40-1 W
-~ U 20
Z
00
00 100 200 300 400 500 MRSS G
FIG 36 NICKEL CONTENT (MASSJ VS MRSS OF NICKEL NITRRTE HEXRHYDRRTE (GJ
3631 Nickel concentration
The time required to load a desired Quantity of nickel was determined in
a separate experiment All quantities of materials used were as
discussed above but while the mixture was boil ing under reflux samples
of solution (5 m1) were taken at discrete intervals These samples were
than washed and dried in the usual manner and their nickel content
determined using atomic adsorption spectrophotometry In this way the
loading Curve was constructed from which the time required to produce a
catalyst of known metal content could be read Two sets of startins
conditions were used as shown in F1gure 37
73
200 1I=509 Ni(N03h6H20
309 Si02A1203~ (j) 259 (NH2CO (j) 160 600ml H20CI L
bull 120bull
() 45c1 Ni (N03 h 6H20
503 S i 02 A 12 03
253 (NH-z )CO
50Om 1 H-z 0IshyZ 8 U 80
--J W ~
40U - Z
00
00 1000 2000 3000 4000
TIME MIN FIG 37 NICKEL CBNTENT (MRSS) VS TIME (MIN)
364 Coprecipitation
Two solutions were prepared One contained 180 3 of sodium meta silicate
in 1200 ml of distilled water and the other contained 42 3 of aluminium
nitrate nonahydrate and 117 3 of nickel nitrate hexahydrate in 1000 ml
of ~istilled water It was important that the pH of the final solution
was kept in the ran3e of 8 ~ 05 To achieve this caustic soda could be
added to the sodium solution or nitric acid to the solution of the
nitrates In this work 82 ml of nitric acid (70 wtX HN031 was added to
the solutions ot the nitrates The two solutions were mixed in a ~ 1
CSTR while being vigorously agitated and the pH adjusted using 5 9 of
sodium hydroxide in 100 ml of water A 3e1 formed after about 30 sand
was allowed to stand for 1 h This material was then filtered using a
Buchner funnel broken up and dried for 12 h at 110middotC The dried sol id
was washed twice by decantation with water and then washed ~ith six or
seven successive portions of 5X ammonium chloride The ammonium ~ash
involved soaking the catalyst for 1 h at 70C In an excess of solution
which was then drained using a Buchner funnel In thiS way any sodium
held in the sol id was removed by base exchange The catalyst was then
washed with distIlled water and dried at 110C for 12 h before being
74
crushed sieved and stored (Holm 1957) The si1 ica to alumina ratio of
the final catalyst was 91 while the nickel content was 4 wt~
365 Determination of nickel content
To determine the nickel content of the catalyst an accurately weished
sample approximately 025 s was added to 5 ml of hydrof1uric acid in a
teflon beaker The solution was left for 12 h after which 5 m1 of
concentrated sulphuric acid and 5 m1 of distilled water were added This
was again allowed to stand before being made up to 250 m1 in a
volumetric flask In this way the catalyst was broken down into its
individual elements and the nickel contents determined usins the Varian
SpectrAA-30 Atomic Adsorption spectrophotometer
366 Extrudate manufacture
The powder form of nickel oxide silica alumina was found to be too fine
for effective use in the hiSh pressure intergral reactor as it caused an
excessive pressure drop and downstream plugging problems Breck (1980)
suggested the use of an inorganic binder such as kaolinite in the
formation of extrudates This approach was found to be effective if the
Quantity of binder was sreater than approximately 35 wt At lower
binder mass fractions the material could not be extruded
The binding process consisted of mixins the binder with the catalysts to
form a homogeneous paste the amount of water used carefully judged by
visual inspection When the paste had the desired consistency it was
loaded into a previously wetted stainless steel piston and plunger
assembly and extruded onto filter paper The catalyst was then dried at
80C for 12 h
Breck (1980) further suggested that the extrudates be baked at 370C for
12 h to convert the clay to an amorphous binder of considerable
mechanical strength It was however found that this was not necessary as
the extrudates had sufficient strength after drying at 80middotC
75
4 RESULTS
Various types Ot catalyst synthesis procedures were examined These were
homogeneous decomposition deposition (HOD) i mpregnati on (IMP) an d
brietly coprecipitation (SGb as well as the catalytic properties Ot
the silica alumina support (SA) The si1 ica to alumina weight ratio used
throughout was 9 to 1 The criterion whereby the activity Ot the
catalyst was measured was the 1 iQuid production rate (LPR) The
selectivity of the catalyst expressed in terms Ot massX 1 i~uld
composition gave an indication ot the relative amounts Ot the various
01 igomers formed
The reaction conditions used were a temperature of aoc and a pressure
of 40 atm unless otherwise stated The catalyst size fraction used was
-500 IJm which was made into 110 inch extrudates using 35 wt~ kaol inite
as binder
As mentioned previously the feed used was a 41 mixture ot
propenepropane with trace impurities of C4 and C2 hydrocarbons unless
otherwise stated The exact composition ot the feed is shown in Table
31
The reaction conditions used in all experiments are summarised in Table
41 The WHSVt and WHSV2 were calculated assuming the mass loss occurred
before the reactor and after the reactor respectively in the torm of
gas For the purpose of plotting the results it was assumed that all
mass was lost betore the reactor ie bull ldHSVt was used in all the
figures
41 Reproducibil ity of Data
Two runs were carried out under identical conditions Ot temperature
pressure and WHSV The catalyst used in both runs was an HOD type
catalyst with a nickel content of 15 wt~
Figure 41 shows the LPR for each run as a function of time It can
clearly be seen that the largest discrepancies occurred during start-up
76
Table 41 Reaction data
CommentCode Nickel Press WHSVt (wU) (atm) (ggh)
HDD-1 15 80 40 42 45 HDD-2 1S 80 40 53 56 Reproduc i b i 1 ity
HDD-3 15 80 40 52 56 Reproducibil ity
HDD-4 15 80 40 51 55 Wet feed
HDD-5 15 80 40 47 48 Regenerated HDD-4 HDD-6 15 200 40 49 55 Temp runaway
HDD-7 15 80 40 54 56 Regenerated HDD-6 HDD-8 15 150 40 43 47 HDD-9 15 210 40 66 73
HDD-10 22 80 40 50 55 HDD-ll 72 80 40 42 47 HDD-12 117 80 40 49 52 HDD-13 113 SO 40 54 57 HDD-14 113 80 40 108 117 HDD-15 113 80 40 116 132 HDD-16 117 80 20 67 74 HDD-17 117 80 50 50 52 HDD-1S 15 aO200 40 55 LiQuid feed (C )
HDD-19 15 80 40 SS li QU i d gas f~ed
HDD-20 15 200 40 77 liquid gas feed
IMP-1 OS SO 40 47 4S IMP-2 19 SO 40 53 56 IMP-3 22 SO 40 4S 49 IMP-4 46 80 40 33 39 IMP-5 63 SO 40 49 54 IMP-6 71 80 40 44 48
IMP-7 9S 80 40 52 55 IMP-S 98 SO 20 59 66 IMP-9 9S 80 50 50 53
SG-1 15 SO 40 52 55 SG-2 15 80 20 59 61 SG-3 30 80 40 37 41
SA-1 80 40 40 41 SA-2 150 40 62 63 SA-3 200 40 35 42
77
ceOE NIOll) TR( middotC) P(ATHI WHSV 600 J=HOO-2 1 5 80 40 53
()=HOO-3 I 6 80 40 62
600
300 bull
e 0- 200
bull
1 00
000
00 40 60 80 100 120
TIME H FIG 41 LIQUID PRSDUCTISN RRTE (GHGJ VS TIME (H)
J=O I MER )()=TR I HER HOO-2 =TETRAHER
lUOO
~ +=PENTAHER (j)
X=OI HER )(j) 800 ~=TRIHER HOO-3 IT +=TETRAHER L )( =PENTAHER
bull 600 Il )((j)
o 0- L 400 o U
bull o 200
e
IJ RI00
00 20 40 60 80 100 TIME H
FIG 42 LIOUID CSMPSSITIBN (MRSS) VS TIME (Hl
78
Once steady state had been obtained approximately after 4 h on stream
conversions were similar and the reproducibility acceptable
Figure 42 shows selectivity as a function of time on stream Here it
can be seen that the dimer trimer tetrameter and pentamer were
produced in similar Quantities throughout the two runs
It was thus concluded that at steady state adequate reproducibil ity was
attained with respect to both selectivity and LPR
42 Nickel content
In the case of HOD type catalysts the nickel content was varied from
15 wtX to 117 wt It can be seen from Figure 43 that while the LPR
differed from run to run this variation was due to WHSV differences
and no trend with increasing nickel content was observed The LPR
remained between 3 and 4 grams of product per gram of catalyst per hour
over the range of nickel loadings examined The selectivity of the
catalyst as shown in Figure 44 was also found to be essentially
independent both with respect to nickel content and time on stream
although a sl ight decrease in dimer Yield was observed ~ith increasing ltshy
n lkel content
In the case of IMP type catalysts the nickel content was varied from
10 wtX to 98 wtX An accurate statement about the effect of nickel
content on the activity of IMP type catalysts could not be made due to
differences in the WHSV The selectivity as a function of both time on
stream and nickel content is shown in Figure 46 The catalyst with 08
wtY nickel exibited the greatest selectiVity towards trimers and the
dimer Yield inCreased sl ightly with increasing nickel content No other
marked changes in the selectivity were observed as a function of nickel
content or time on stream
43 Effect of ressure
In Figure 47 the lPR vs time on stream is shown for an HOD type
catalyst with a nickel content of 113 wtX at three different pressures
It can be seen from this figure that as the pressure was decreased from
50 atm to 20 atm the lPR remained constant although the WHSV was higher
at lower pressures This suggests that the activity c~ the catal~sts
dropped with decreasin9 pressure The selectiVIty shown in FI9ure 43
as a function of time on stream and pressure was also dependent ~n the
pressure used It Can be seen from Figure 4S that at 20 atm propene
dimer accounted for approximately 70 wt of the 1 iQuid pr0Juct ~hile at
79
600
o 500
r 400o
bull 300
a
bull CL 200
-1 1 00
000
ceOE Il =HOO-J ()=HOO-I0 4 =HOO- I I +=HOO-12
NI(WTtJ 1 5 22 72 11 7
TR bullC) P(ATMI WHSV 80 40 42 80 40 50 80 40 42 80 40 49
00 20 40 60 80 100 TIME H
FIG 43 EFFECT OF NICKEL CONTENT (MASS) ON
1000
~ (f)
(f) 800 a L
bull 600 (f)
o CL L 400 o U
o 200
00
LIQUID PRODUCTION RATE (GHGl HOD
1l0 I MER l()=TRIMER 4 H eN STREAM 4TETRAMER +PENTAMER XOIMER l~TR[MER 8 H eN STRERM TETRAMER ~ PENTRMER
$lt ~ ~ ~
- - bull ~ J shy
00 20 40 60 80 100 120
NICKEL CONTENT MRSSi FIG 44 EFFECT OF NICKEL CBNTENT (MASS) ON
LIQUID COMPOSITIBN (MRSS) HOD
I
o
o
bull a
bull CL
bull
6middot00
500
400
300
200
ceOE ll=IMP-l ()=INP-2 = I MP-3 +=IMP-4 X=IMP-5 0= INP-6 P=IMP-7
NI(HTI) 08 t9 22 46 63 71 98
TR( middotC) 80 80 80 80 80 80 80
80
P(ATNI 40 40 40 40 40 40 40
HHSV 47 53 48 33 49 44 52
000
00 40 60 80 100 120 TIME H
FIG 45 EFFECT BF NICKEL CBNTENT (MASS) BN LI QU I D PRBDUCT IBN RATE (GHG l IMP
1000
~ (j)
(j) 800 a L
bull 600 (j) (2]
CL L 400 (2]
U
o 200
00
Il=DIMER ()=TR I MER =TETRRMER +=PENTAMER X=Dl MER0=TR IMER P=TETRRMER ~=PENTRMER
~- ~ ~ ~======~
~ ~ JlJl1 -l
) 4 H aN STRERM
1 8 H aN STREAM
00 20 40 60 80 100NICKEL CBNT MRSSi
FIG 46 EFFECT BF NICKEL CeNTENT (MRSS) BN LIQUIDCOMPOS I T I eN (MRSSi) IMP
81
o
600
500
ceDE Il=HDD-16 e)=HDD-13 AHDD-17
NI(WTZ) 117 113 117
TR( C) 80 80 80
P(RTMI 20 40 50
WHSV 67 54 50
r 400 o
bull bull 300
0
bull Q 200
000
00 20 40 60 80 100
TIME H FIG 47 EFFECT OF PRESSURE (RTM) ON LIQUID
PRODUCTION RRTE (GHG) HOD
1000
~ en en 800 a 2
bull bull 600
en ~ Q
2 400 ~ U
bull (3 200
00
Il =0 I MER )e)=TR 1 MER 4 H eN STRERM A=TETRRMER +=PENTRMER X=D I MER ~=TRIMER H 8N STREAMI 8 +=TETRRMER X =PENTRMER
~ e -0
-=+
=
Ii if
100 200 300 400 500 600
PRESSURE RTM FIG 48 EFFECT OF PRESSURE (RTM) ON LIQUID
COMPOSITION (MRSS) HOD
82
50 atm the liquid product Contained only 50 wt~ dimer The observed
shift to li~hter products with decreasin9 pressure is consistent with
thermodynamiC predictions althou9h increasin9 the WHSV and hence
decreasln9 the contact time would result in the same shift in product
spectrum
In the case of an IMP type catalyst containin9 98 wtX nickel the LPR
as well as the selectivity were very sensitive to the pressure used The
LPR at three distinct pressures is shown in Fi9ure 49 as a function of
time on stream It can be seen that at 20 atm the catalyst rapidly
deactivated and was practically inert after 7 h on stream At the other
pressures examined ie bullbull 40 and 50 atm no difference in the LPR was
observed The selectivity of the catalyst is shown in Fi9ure 410 as a
function of pressure At 20 atm the 1 iquid product contained
approximately 30 wt~ dimer which inCreased to 67 wtl at 40 atm dropping
to 62 wt~ at 50 atm This trend althou9h opposite to that observed for
HOD type catalysts is in ailreement with the data reported in the
literature (Takahash i et a 1 bullbull 1969)
The LPR of a SG type catalyst with a nickel content of 15 wtr is shown
in Fiilure 411 at two distinct pressures At 40 atm the LPR was
comparable to that of HO~ and IMP type catalysts while at 20 atm the
catalyst was totally inert The selectivity of the SG type catalyst at
40 atm differed markedly from that of an IMP and HOD type catalyst In
that the liquid not only contained a larile percentage Ot dimers (40 wt~)
but also an equally larile percentage of trimers
44 Bed temperature profile
Before any statement as to the effect of temperature could be made the
temperature throughout the bed had to be constant and not fluctuate
excessively durin9 a run
In Fiilure 413 the temperature profile through the entire reactor is
shown at 4 discrete times ~urin9 a run The catalyst bed started at
position 4 and extended for 172 em down the reactor to position 8 In
this re9ion of the reactor viz bullbull over the catalyst bed a temperature
deviation from the set point of not more than 4C was observed at th~
times shown In FI9ure 414 ~he temperature fluctuations with time were
plotted at positions 4 6 and 8 From this figure it can be seen that
the amplitude of the temperature fluctuations with time were 4C for
position 4 and 6 and 3C for POSition 8 It can thus be concluded that
at aoc the temperature throu~hout the bed and over the period of the
83
600 ceOE Il =I HP-8
N I ( WT ) 98
TRIC) 80
PIATHI 20
WHSV 59
() =I MP-7 98 80 40 52 =lHP-9 98 80 50 50
cJ 500
- I - 400 cJ
bull 300
0
bull 0 200
bull
000
0middot0 20 40 60 80 100
TIME H FIG 49 EFFECT BF PRESSURE (ATM) BN LIQUID
PRBDUCT IBN RATE (GHG) IMP
Il=OIMER 11000 ()=TR 1MER 4 H 6N STRERM 4I=TETRRMER
~ +=PENTRMER (j)
(j) 800 IT L
bull 600
(j) ()
0 L 400 ()
U
bull (3 200
00
100 600
FIG 410 EFFECT SF PRESSURE (ATM) BN LIQUIDCBMPBSITIBN (MRSS) IMP
~---l--_--1-+
200 300 400 500
PRESSURE RTM
84
600 ceDE Nt (WT J TR ( bull C) PlATM) WH5V [J =5G-1 1 5 80 40 52 ()=SG-2 I 5 80 20 59
CJ 500
- I - 400 CJ
bull 300
Ct
bull D- 200
-J 1 00
~-----elE9----egt000
00 20 40 60 80 100
TIME H FIG 411 EFFECT eF PRESSURE (RTM) eN LIQUID
PReDUCTIeN RRTE (GHG) SG
600 [J=O IMER ()=TR I MER ~=TETRAMER
~ +=PENTAMER(J)
(J)
IT L
(J)
~ CL L ~ U 200
~~------~A----~____A_____________6 o
400
00
00 20 40 60 80 100
TIME H FIG 412 LIQUID CBMPBSITIBN (MRSSJ VS TIME (HJ
RT 40 RTM SG
85
1000 Il=TEMPERATURE AFTER ~=TEMPERATURE AFTER A=TEMPERATURE AFTER +=TENPERATURE AFTER
11 H ~N STREAM 35 H ~N STREAM 60 H BN STREAM 93 H eN STREAM
U 900
W 0 800 =)
I shyCI 0 700 W (L
L W I- 600
500
PBSITIBN Z FIG 413 BED TEMPERATURE PRBFILE (tC) VS
PBSITIBN (Z) SET PBINT 80C SG-1
00 10 20 30 40 50 60 70 80 90 100
1000
U 900
Il=TEMPERATURE FLUCTUATleNS AT Z=4 ~=TEMPERATURE FLUCTUATUINS AT Z=6 A=TEMPERATURE FLUCTUATI~NS AT Z=8
W 0 800 =)
I shyCI 0 700 W (L
L W I shy 600
500
20 40 60 8000 100 TIME H
FIG 414 BED TEMPERATURE FLUCTURTIBNS (tC) VS TIME (H) SET PBINT 80C SG-l
86
run was controlled accurately enough to examine the effect of reaction
temperature
In Figure 415 the temperature profile through the bed is shown for 3
different times during a run at 210middotC During this run from positions 4
to 7 ie bullbull over 75 of the catalyst bed the temperature deviation
from the set point was less than SmiddotC at the times shown while the
temperature at position 8 was approximately 10degC below that of the rest
of the bed In Figure 416 the temperature variation with time at 3
different positions in the bed is shown Excluding the start-up period
the ampl itude of the temperature fluctuations with time at positions 4
and 6 was 3C while the amp] itude of the temperature fluctuations at
position 8 although approximately 10degC below the set point was 2middotC
Thus although a deviation from the set point existed at 2l0middotC the
profile did not change markedly with time on stream
441 Effect of temperature
The LPR for an HOD type catalyst with a nickel content of 15 wt~ is
shown In Figure 417 as a function of time on stream at 4 different
temperatures It Can be seen from this figure that at 80degC and 40 atm
ie bull when the system was In the I iquld phase the LPR was higher than
when the system moved into the vapour phase As the temperature was
raised from BOdegC to lSOdegC a 50~ decrease in LPR was observed while the
WHSV was lower by 18 Upon raising the temperature to 200degC a Further
drop In LPR of 10~ was recorded although the WHSV was higher by 14~ At
210degC the high WHSV used makes a meaningful4 comparis$on impossible
However from the recorded LPR it can be concluded that the activity of
the catalysts decreased further
Figure 418 shows I iquid composition as both a Function of time on
stream and temperature Increasing the temperature and moving into the
vapour phase caused a dramatic drop in the dimer yield and an Increase
in trimer yield IncreaSing the temperature still further resulte~ In
the dimer recovering until at 210middotC dimers and trimers were formed in
equal Quantities
As at higher temperatures ie bull above IS0degC at 40 atm Bil iea aluml~a
exhibits catalytiC properties the relationship between its activit and
temperature was also examined In Figure 419 the LPR as a function of
time on stream IS plotted For SA at 3 different temperatures R~ducln9
the temperature Fr~m 200C to lS0C resulted In the maximum activity
87
220
U 210 po
wa 200 =gt l-CC a 190 W a L W I- 180
170
~=TEMPERATURE AFTER 14 H aN STREAM ~=TEMPERATURE AFTER 37 H aN STREAM amp=TEMPERATURE AFTER 61 H aN STREAM
00 10 20 30 40 50 60 70 80 90 100 PBSITIBN Z
FIG 415 BED TEMPERATURE PROFILE (C) VS POSITION (ZJ SET POINT 210C HDD-9
230
U 220 po
wa 210 =gt l-CC 0 200 W a L w I- 190
~=TEMPERATURE FLUCTUATlaNS AT Z=4 ~=TEMPERATURE FLUCTUATUINS AT Z=6 amp=TEMPERATURE FLUCTUATlaNS AT Z=8
180
20 40 60 60
TIME H FIG 416 BED TEMPERATURE FLUCTUAT IONS ( C)
VS TIME (HJ SET POINT 210C HDD-9
00
88
600
CJ 500
400CJ
bull bull 300
0
bull 0- 200
--J 1 00
000
ceDE []=HDD-2 ()=HDD-8 amp=HDD-6 +=HDD-9
N (lH) 1 5 1 5 1 5 1 6
TR( middotC) P(ATM) I1HSV 80 40 53 150 40 43 200 40 49 210 40 66
00 20 40 60 80 100 120 TIME H
FIG 417 EFFECT BF TEMPERRTURE (Cl BN LIQUID PRBOUCTIBN RRTE (GHGl HOD
600
~ (f) (f)
a ~
400 bull
(f)
~ 0shy~ ~ U 200
bull
[]=D IMER 1()=TRIMER 4 H eN STREAM amp=TETRAMER +=PENTAMER X=DI MER 10=TRIMER 8 H eN STRERM i=TETRAMER j =PENTAMER
_----~=i
00
600 900 1200 1S00 1800 2100 2400 TEMPERRTURE C
FIG 418 EFFECT BF TEMPERRTURE (Cl BN LIQUID CBMPBSITIBN (MRSS) HOD
600
89
C) 500
- r - 400 C)
bull 300 ~
Q 2 )0
bull
---l 1 00
000
TR ( bull C) P(ATH) HHSV BO 40 40 150 40 62 200 40 35
ceOE fI =SA-l ()=SA-2 ~=SA-3
N[(HTZl 00 00 00
~e
tI eJ
e e e)
00 20 40 60 80 100 120 TIME H
FIG 4 bull 19 EFFECT BF TEMPERATURE ( bull C ) BN LIQUIDPRBOUCTIBN RATE ( GHG) SA
600
0 (f) (f)
a I
400 (f)
~ Q I ~ U 200
C2I 1--1
---l
00
fI=O IMER )()=TRIHER 4 H aN STREAM ~=TETRAMER +=PENTRMER
+ +
600 900 1200 1500 1800 2100 2400 TEMPERRTURE bull C
FIG 420 EFFECT I3F TEMPERATURE ( C) BN L I QU I 0 CI3MPI3SITII3N (MASS) SA
90
falling by approximately 72X while the WHSV increased by 5S~ At aoc the catalyst was inert At 200C the preferential product of sil ica
alumina was propene trimer which can be seen in Figure 420 where
1 iQuid composition is plotted against temperature Decreasing the
temperature to lSOC caused the trimer yield to increase at the expense
of the dimer Decreasing the temperature further resulted in the
catalyst becoming inert and so no 1 iQuid data was available
45 Lifetime and selectivity
The 1 ifetimes of HOD IMP SG and SA type catalyst were examined as well
as their selectivity in long runs In Figure 421 the LPR and WHSV as a
function of time are plotted for an HOD type catalyst with a nickel
content of 15 wt From this it can be seen that the LPR fluctuated
with time due to WHSV fluctuations Upon comparing points with eQual
WHSV it was found that the conversion had dropped by 12 after 100 h on
stream The selectivity with time on stream is shown in Figure 422
Selectivity chansed sl ightly during the run ie bull the Quantity of dimer
formed increased by 25~ after 120 h at the expense of the tetramer and
pentamer
In Figure 423 the LPR as a function of time is plotted for an IMP type
catalyst with a nickel content of 19 wt After a h on stream the
activity of the catalyst dropped by 24 of its initial value The
selectivity shown in Figure 424 remained approximately constant with
the dimer yield increasing sl ightly at the expense of the tetramer and
pentamer over the period of the run
In Figure 425 the LPR as a function of time is plotted for an SG type
catalyst with a nickel content of 15 wtx After 10 h on stream the
catalyst showed no signs of deactivation The sel~ctivlty shown as a
function of time in Figure 426 also showed no changes over this
period ConseQuentely from the available data no conclusive statement
with respect to the 1 ifetime of this catalyst could be made
The 1 ifetime of a SA type catalysts was examined at a temperature of
200C and the LPR as a function of time is shown in Figure 427 Upon
comparing points with eQual WHSV it was found that the ConverSion had
dropped by 24 over a period of 75 h As shown in Figure 428 10
significant change occurred in the selectivity over the perlo~ of this
run
91
700
6(10 o I 500
o 400
bull a 3 00
bull 0
200
1 00
000
CODE NI(WT~) TR(C) P(ATM) HDD-3 15 80 40
~=HEIGHT HeURLY SPACE VELeCITY ~=LIQUIO PReOUCTleN RATE
WHSV 52 700
600
600
400
0
I 0
300
200
gt (j)
I 3
100
000
00 200 400 600 800 1000 1200
TIME H FIG 421 LIQUID PReDUCTIeN RRTE (GHGJ RND WEIGHT
HeURLY SPRCE VELeCITY (GHGJ VS TIME (H)FeR HDD-3
800
~ (j) (j)
IT L
600
bull
(fJ
~
0 L
400
~ U
bull 200
o
~O IMER ~=TR IMER amp=TETRAMER +=PENTAMER
+
FIG 422 LIQUID ceMPeSITIeN (MRSS) VS TIME (H) FeR HDD-3
92
700
600 CJ
r 500
CJ 400
bull 0 300
bull 0
200
t 00
000
CODE NI(WT~) TR(JC) P(ATM) WHSV IMP-2 19 80 40 53
m=HEIGHT HeURLY SPACE VELeCITY ~=LIQUIO PReOUCTleN RATE
er----El---f9----et-_-poundJ
700
600
600 CJ
r 400 shy
CJ
300 gt
(J)
r 200 ~
t 00
000
00 20 40 60 60 100 120
TIME H FIG 423 LIQUID PRBDUCTIBN RRTE (GHG) RND WEIGHT
HBURLY SPRCE VELBCITY (GHGJ VS TIME (H)FBR IMP-2
CL
93
700
600 cJ shyc 500 shycJ
400 0 300
200
I 00
000
CODE SG-1
NI(Wn) 15
TR(C) eo
P(ATM) 40
WHSV 52 100
rn=WEIGHT HeURLY SPACE VELaCITY ~=LIQUID PReOUCTlaN RATE 600
-eJ 500
400
cJ shyc shycJ
300
200
gt U)
c 3
100
000
00 20 40 60 80 100
TIME H FIG 425 LIQUID PRSDUCTIBN RATE (GHGl AND WEIGHT
HBURLY SPACE VELSCITY (GHGJ VS TIME (HlFeR SG-1
600
~ U) U)
a L
400 bull
U)
~ CL L ~ U 200
bull
rn=D 1MER ~TRIMER
41 =TETRAMER +=PENTANER
amp~----------A------______A__________________~bull
+
Oor ~-~I~------~I--------~I-------+I-------+I-------+I~
00 20 40 60 80 100
TIME H FIG 426 LIQUID CBMPSSITIBN
FeR SG-1 (MASS) VS TIME (H)
94
600 CODE NIIWTX) TRIC) PIATN) WHSV SA-3 200 40 35
m=WEIGHT HeURLY SPACE VELeCITYo 600 ~=LIQUIO PReOUCT6N RATE shyI - 4 00o
bull 300
et
bull CL 200
~ 100
000
00 20 40 60 60 100 120 14 0
TIME H FIG 427 LIQUID PRBDUCTIBN RATE (GHGl AND WEIGHT
HBURLY SPACE VELBCITY (GHGJ VS TIME (HJFBR SA-3
600
500
0 400 shy
I shy0
300 gt (f)
200 I s
1 00
000
600
~ (j)
(j)
IT L
400 (j)
o CL L o U 200
o
m01MER ~TR IMER 6=TETRAMER +PENTAMER
___-tl----------~I-----------r--~V I I
E9 m(9 E9 u El
i I I00 20 40 60 80 100
TIME H FIG 428 LIQUID CBMPBSITIBN (MRSS) VS TIME (H)
FBR SR-3
00
95
46 Effect of WHSV
The effect of the WHSV on the LPR and selectivity was examined In
Fi~ure 429 the LPR of an HOD type catalyst with a nickel content
ranging from 113 to 117 wt~ is shown at four different WHSV Figure
429 shows that increasing the WHSV increased the LPR and the rate of
deactivation
In Fi~ure 430 the selectivity as a function of both time and WHSV is
shown This figure demonstrates how increasing the WHSV and consequently
decreasing the conversion resulted in a higher dimer content of the
liquid product at the expense of the tetramer and the pentamer The
quantity of trimer was not affected by changing WHSV in the range
examined
47 Effect of temperature runaway
The effect of operating the catalyst at 80C was examined after
operating it at 200middotC The aim of this experiment was to establ ish
whether the activity or selectivity of the catalyst when rerun at 80C
was affected in any way by operating it first at a temperature higher
than 80middotC Between the two runs the catalyst was calcined in the normal
manner
In Figure 431 the LPR of an HOD type catalyst with a nickel content of
15 wtX at 200C is shown as a function of time on stream After 11 h
the run was stopped and the catalyst calcined in the -normal manner and
rerun at SOmiddotC The LPR as a function of time at aodegc IS shown In Figure
431 together with the data obtained using a fresh catalyst at SOmiddotC It
can be seen from this figure that usin~ the catalyst first at ZOOC did
affect the activity and from Figure 432 the selectiVIty causing a drop
in LPR of 17X at steady state and a shift to 1 ighter products at the
expence of the tetramer when the catalyst was re-used at 80middotC
4S Effect of water contamination
The aim of thIS experiment was to establ ish the effect of water on the
activity and selectivity of an HOD type catalyst with a nickel content
of 15 wtX (HOD-4) and to determine whether the catalyst could be
regenerated to its normal activity and selectiVity For this ~urDose the
feed containing 112 ppm (vv) water was not dried bef0re ent~rln9 the
bed and the activity with time was recorded ~nder normal running
CL
96
caOE N I (1HZ J TR ( middotc I P(ATNI HHSV1000 (l =HOO-I 2 I I 7 80 40 49 ()=HOO-13 II 3 80 40 54 t =HDD-14 It3 80 40 108 +=HOO-tS 1t 3 80 40 I I 6
cJ 800
I
cJ 600
a 400
bull 200-J
000
00 20 40 60 80 100
TIME H FIG 429 EFFECT BF WHSV (GHG) BN LIQUID
PRBDUCTIBN RRTE (GHG) HOD
800
~ (j) (j)
a 600 L
(j)
~ 400 CL L ~ U
bull 200 C3
00
(l=D I MER )()=TRIMER 4 H eN STREAM t=TETRAMER +=PENTRNER
X=OINER Ie=TRIMER 8 H aN STRERM TETRRMER ===----shyX=PENTANER
~~e-------------------~i~~
20 40 60 80 100 120 t 40WHSV GHG
FIG 430 EFFECT BF WHSV (GHG) BN LIQUIDCBMPBSITIBN (MRSS) HOD
140
97
600
o 500
bull 300
0
bull CL 200
-1 1 00
000
ceDE N I ( loin) TR( C J PlATH) WHSV Il =HDD-6 15 200 40 49 ()=HDO-7 15 60 40 54 AHDD-2 15 60 40 53
00 20 40 60 60 100 120 14 0
TIME H FIG 431 EFFECT BF TEMPERATURE RUNAWAY BN LIQUID
PRBDUCTIBN RATE (GHGl HDD-6 AND HDD-7 CBNSECUTIVE RUNS USING SAME CATALYST
700
~ (f) 600 (f)
IT L 500
bull
(f) 400
cJ CL L 300
cJ U
200
bull CI 100 -1
00
Z=D 1HERIiOIMER 1 XOIMER 1 ()TRIMER HOO-6 ~=TRINER HDD-7 Y=TR I MER HDD-2 ATETRRNER +=TETRRHER )(TETRRHER
+=PENTRNER ~=PENTRNER If =PENTRHER 1 Z~
~ eEl egt
Gshy
E9 fl
)lt~~ V ~
t shy amp
)IE ~ )(
+~ of f -+ J~ R
20 40 60 80 100 12000
TIME H FIG 432 EFFECT BF TEMPERATURE RUNRWRY BN LIQUID
CBMPBSITIBN (MASS)
98
conditions It can be seen from Figure 433 how rapidly the catalyst
deactivated becoming totally inert In 4 h The selectivity as shown in
Figure 434 was also affected with the dimer rapidly becoming the main
product
Upon regenerating and operating the catalyst in the normal manner (HOOshy
5) the catalyst showed an initial LPR higher than in HDD-l due to a
high WHSV which rapidly dropped to that of a catalyst in a dry run For
comparison the LPR vs time relation for a dry run using a fresh catalyst
is also shown in Figure 433 (HOD-l) With regard to selectivity no
difference was observed for the regenerated or normal catalyst as shown
in Figure 434
In this experiment the -69C fraction (dimer) from previous runs was fed
through the reactor at 40 atm and 30C Once the catalyst had
deactivated the temperature was raised to 200C and the run continued
The catalyst used was a HOD type catalyst with a nickel content of 15
wt~ The feed composition was 994 wt~ Cb and 06 wt~ Cl
To monitor the activity of the catalyst throughout the run the LPR was
calculated using
LPR = (mass Cn-b in - mass of Cn-b out) ltI) (time)(mass of catalyst)
while the Conversion was calculated using
Mass~ Cn_b converted =[mass Cn- in - mass ou t ) 1bull 100 ltII)Cn
mass Cnab In
It can be seen from Figure 435 that at aoc the catalyst rapidly lost
its activity This also became apparent from the changes in the 1 iquid
composition with time on stream as shown in Figure 436 Upon raising
the temperature to 200C the catalyst regained activity the conversion
beIng 64~ after 27 h on stream The composition of the 1 iQuid product
also changed markedly the most abundant specIes in the product being a
Cb dimer (CI2) with trace Quantities of Cl and trimer (CIS)
410 Liquid and gas feed (C + C3)
In this case dimer (C ) and monomer (el) were fed simultaneously to the
reactor The ratio of Cb to C3 was held at 11 9 C9 Cl throughout Two
runs using the same catalyst were carried out one at 80C and one at
I
99
600 CeDE NJOHI) TR( middotC) PlATH) HHSV FEED Il=HDD-4 15 80 40 51 HET ~=HOO-5 15 80 40 47 DRY AHOD-I 15 80 40 42 DRY
CJ 500
shy
shy 4 00 CJ
bull 300
0
bull (L 200
1 00
000
00 20 40 60 80 10middot0
TIME H FIG 433 EFFECT BF WRTER BN LIQUID PRBDUCTIBN RRTE
(GHGJ HDD-5 REGENERRTIBN RFTER HDD-4
800
~ (J) (J)
(I 600
(J)
~ 400 (L
L ~ U
bull 200
o
[]=o 1MER 1 ~=TR I MER HOO-4 1 TETRAMER +=PENTAMER
X=OIMER ]~=TRIMER HOO-S +=TETRAMER X=PENTAMER
Zo I MER 1 Y=TRIMER HOO-l )( = TETRAMER =PENTAMER
~ eiICJ)
P=~ if --- I~
Igt(
~
~~ j
)(
00 20 40 60 80 100
TIME H FIG 434 EFFECT SF WRTER CBNTRMINRTIeN eN
LIQUID CBMPeSITIBN (GRHGR1 HOD
00
100
CODE NI (Wa) TR ( C ) P(ATM) WHSV 800600 HDD-18 15 801200 40 55
l =CaNVERS 1aN ~ ~LtQUtO PRaOucTtaN RATE (j)D
(j) r 600 600 a
200degC
L D
bull Z 400 a
bull 400
0 (j)
a CL
bull w gt200bull 200 Z
--J a
000shy
u
00
00 20 40 60 60 100
TIME H FIG 435 LIQUID PRBDUCTIBN RRTE (GHG) RND
CBNVERSIBN (MRSS) VS TIME (H) LIQUIDlaquo69C FRRCTIBNl FEED HDD-18
1000
~ (f)
(f) 600 IT L
bull 600
(f)
a CL L 400 a u
C3 200
l =0 t MER ~=TR t MER TETRAMER +=PENTAMER X=HEXRMER
20 40 60 6000 100
TIME H FIG 436 LIQUID CBMPBSITIBN (MRSS) VS TIME (H)
LIQUID laquo69C FRRCTIBNJ FEED HOD-IS
101
200middotC The catalyst a~ain an HOD type catalyst with a nickel content of
15 wt~ was activated in the normal manner between the runs
To monitor the monomer utilization throu~hout the run the equations
shown above for LPR and conversion with n=3 were used ie a propene
balance was done assumin~ no mass loss The results are shown in Fi~ure
437 for the run at BOdegC and in Fi~ure 439 for the run at 200degC
Figure 438 shows that at eoc the activity rapidly declined as the
composition of the 1 iQuid product rapidly approached that of the Co
feed At 200middotC however as shown in Figure 440 the 1 iQuid composition
was steady and contained about 40 wtY dimer after 8 h on stream
411 TGOTA
In Figure 441 the TO and OTA Curves for a fresh HOD type catalyst with
a nickel content of 117 wt~ are shown The catalyst was held under
flowin~ nitrogen throughout
Up to SOOC an exothermic peak probably indicating the removal of
chemisorbed water was recorded At approxlmately 530C the Curve
became endothermic probably due to the decomposition of the Ni-Urea
complex to form NiO
From the TO Curve It can be seen that the intermediate species formed
were not stable until the final endothermiC event at 530middotC Beyond this
temperature the TO Curve levelled out indicating that a stable species
was formed The overall mass loss from the catalyst was 14 wtY
To determine the quantity of water that the catalyst adsorbs a
oreviously calCined catalyst was exposed to air and the TG and OTA
curves were subsequently recorded The results of this run using the
same catalyst as before are shown in Figure 442 This figure shows a
broad exothermic peak up to 600degC and an overall mass loss of 367 wtX
To establ ish the quantity of hydrocarbons adsorbed on the catalyst the
TG and OTA curves were recorded for a catalyst after it had been used
for the 01 igomerisation of propene The catalyst ysed was an HO~ type
catalyst with a nickel content of 117 wtX The catalyst was exposed to
flowing air while recording the TG and OTA Curves The r~sults are shown
In Fi9ure 443
102
00 20 60 TIME H
FIG 437 LIQUID PRODUCTION RATE (GHGJ AND CONVERSION (MASS) FOR PROPENE VS TIME (H) LIQUID laquo69C FRACTION)AND GAS FEED HDD-19
600
bull 300
a
bull 0 200
bull J 1 00
000
CODE NI(Wn) TR(C) P(ATM) WHSV HDD-19 15 80 40 88
~=PRePENE ceNVERSlaN ~=LIQUIO PR60UCTIeN RATE
600
~ 600 (j)
(j)
IT 400
Z
300 ~
(j)
a 200 w
gt z ~ 100 u
00
1000
~ (j)
(j) 800 a
600bull
(j)
~ 0 400 8 U
bull Cl 200 -J
00
~OIMER ~TR IMER l =TETRRMER +=PENTRMER
00 20 40 60 TIME H
FIG 438 LIQUID CGMPOSITION (MASS) OF ENTIRE LIQUID EFFLUENT VS TIME (H) LIQUIDlaquo69C FRACTION) AND GAS FEED HDD-19
103
bull 200 -1
gt200 Z
o U
CODE NI(WTX) TR(C) P(ATMl WHSV 800800 HDD-20 15 200 40 77
m=PRBPENE CBNVERSIBN RATE~=LIQUIO PRBOUCTIBN
~ o (f)
(f)- 600 600 I IT - L o
Z 400 0bull 400
a (f)
bull a 0 w
000 00
00 20 40 60 80 100
TIME H FIG 439 LIQUID PRBDUCTIBN RATE (GHGl AND
CBNVERSIBN (MASS) FBR PRBPENE VS TIME (H) LIQUID laquo69C FRACTIBN)RND GAS FEED HDD-20
II=OIMER600 ~=TR I MER to =TETRAMER +=PENTANER X=HEXANER ltgt=HEPTAttER
bull
(f)
o 0 L o
400
U 200
-00
00 20 40 60 80 100
TIME H FIG 440 LIQUID CBMPBSITIBN (MASS) BF ENTIRE
LIQUIO EFFLUENT VS TIME (H) LIQUIDlaquo69C FRACTIBN) RND GRS FEED HDD-20
104
u
-w u z ~ W 0 -(j)W
(j)U U 0 I 0
(j) (j)w
0 4 =gt x IshyltC 0 w Q x W Ishy
200 400 600 800
TEMPERATURE C
FIG 441 MASS lOSS (~) AND TEMPERATURE DIFFERENCE (OC) VS
FURNACE TEMPERATURE (OC) FOR A FRESH CATALYST 20 m~ sample
10
5
0
-5
-10
-15
CODE NI(WTX) GAS HDD-O 11 3 N2
~
o
10 u
-w u z 5 w
~0 w u (j) shyu (j)
0 -0 0I W (j)0 (j)=gt 4Ishy J4 0 w Q J
-5 W Ishy
-10~ CODE
-15cNIltWn) GAS
113 Nz
I r I I
0 200 400 600 BOO TEMPERATURE C
FIG 442 MASS LOSS (X) AND TEMPERATURE DIFFERENCE (ac) Vs FURNACE TEMPERATURE (OC) FOR A CALCINED tATALYST
WHICH HAS BEEN EXPOSED TO AIR 19 m~ sample
105
The OTA curve was exothermic below 400middotC probably as a result or
combustion of the adsorbed hydrocarbons No other thermal events
occurred The TG curve showed that the overall mass loss was 96 wt~
To establish the eftect Ot synthesis techni~ue the TG and OTA curves Ot
a SG IMP and HOD type catalyst were recorded under tlowing air In each
case the catalyst had been used for the 01 Igomerlsation Ot propene
In Figure 444 the TG and OTA data for an IMP type catalyst with a
nickel content of 083 wt~ are shown There were an exothermic peak at
340degC and a shoulder at approximately 400C probably due to the
combustion of the adsorbed hydrocarbons The TG curve also shown in
Figure 444 shows that the overall mass loss was 173 wt~
In Figure 445 the TG and OTA curves for an HOD type catalyst with a
nickel content ot 15 wt are shown The OTA curve showed a broad
exothermiC peak between 300 and 400 o e The overall mass loss was 12 wt
In Figure 446 the TG and OTA data for an SG type catalyst with a nickel
content of 151 wt are shown The OTA curve showed that an exothermic
peak in the vicinity Ot 300degC The TG curve showed a continual mass
loss up to 600degC the overall mass loss being 244 wtY-
412 NMR
The 1H MNR spectra recorded were those of the bulk I i~uid collected
throughout a run For each type of catalyst the spectrum determined was
that of the I i~uid collected at the reaction conditions deemed optimum
viz bull aoc and 40 atm over a catalyst with a nickel content of 15 wt
The results obtained are shown In Table 42 and Table 43 while the
spectra are shown in Figures 447 448 and 449
106
10 u
UJ
I u 5 z UJ a
~
UJ (f)U (f)u 0
~
0 I
0 J
(f)UJ (f) gt~ middot1a 4 I~
l- x 4 a UJ 0-
-5 x UJ Ishy
-10
CODE NI(WT~) TR ( C) P(ATM) WHSV GAS HDD-13 113 80 40 54 AIR
-15 I
0 200 400 600 800
TEMPERATURE degC
FIG 443 MASS LOSS (~) AND TEMPERATURE DIFFERENCE (GC) VS
FURNACE TEMPERATURE (OC) FOR A USED CATALYST
HDD-13 185 mg sample
15
10
5 u
UJ 0 U Z UJ a
~
UJ -5-(f)U (f)U 0
0 J -10 (f)UJ (f)a
~ 4 l- x -15 4 a UJ 0- -20x UJ Ishy
CODE NI(Wn) TR ( C) P(ATM) WHSV GAS -25 IMP-1 08 80 40 42 AIR
-30 0 200 400 600 BOO
TEMPERATURE e
FIG 444 MASS LOSS (X) AND TEMPERATURE DIFFERENCE (OCl VS
FURNACE TEMPERATURE (OCl FOR A USED CATALYST
IMP-l 18 mg sample
107
15
10
5 u
~
UJ 0 U Z UJ ~ IX UJ -5R
U () U () 0- 0 a J -10 UJ () IX ()
gt lt l- I -15 lt IX UJ ~ I -20 UJ I shy
CODE NI (Wn) TR(C) P(ATM) WHSV GAS -25 HDD-l 15 80 40 42 AIR
-30 600 BOO0 200 400
TEMPERATURE c
FIG 445 MASS LOSS (X) AND TEMPERATURE DIFFERENCE (OC) VS
FURNACE TEMPERATURE (OC) FOR A USED CATALYST
HDD-l 17 mg sample
to)
~
UJ 0 to)
Z ~UJ
IX UJ -5R
()U ()U 0
a J -10 ()UJ ()IX
gt lt l- I -15 lt IX UJ ~ I -20 IJJ I shy
CODE NI(WTX TR(C) P(ATM) WHSV GAS SG-3 30 80 40 37 AIR
-30 I I I 0 200 400 600 BOO
TEMPERATURE C
FIG 446 MASS LOSS (X AND TEMPERATURE DIFFERENCE 1degC) VS
FURNACE TEMPERATURE (OC) FOR A USED CATALYST SG-3
17 mg sample
-25
108
c
-I 0 J gt-lt
Z ) 0
J 0 0 U
I shyU ) Cl 0 0 0
0 gt-lt ) 0 gt-lt J
U 0
ltt 0 I shyU W 0 ()
0 J Z
Cl J
co
M
I
I l--r
JiI I
I LLf)
t
r-shyq q
0 gt-lt u
T~
------H
G
F
E
o Q
o
FIG 448 IH NMR SPECTRA OF LIQUID PRODUCT FROM RUN SO-3
BA L
M
---L
1-shy
5 4 3 2 1 o 6
c
110
LL o o
-I C C x z )
cx I 0 cx LL
I-U ) C 0 a a c -) C -J
u 0
ltr cx I-U UJ a (J
a I Z
x
0-lt1
U1
lt1
lt) shyu
111
Table 42 Integrated areas
Run code Area code
A B C o E F G H L M N
IMP-l 00 10 120 320 205 145 250 195 10 125 00
SG-3 20 30 190 430 305 220 365 225 15 158 00
HDD-l 75 50 230 490 332 235 355 222 20 220 00
Table 43 Carbon areas and branching
Code CH CHJ CH
IMP-l 258 275 210 094 123 076
SG-3 350 253 295 079 123 067
HDD-l 372 517 309 072 120 060
112
5 DISCUSSION
The effect of the synthesis procedure on metal distribution and
dispersion in nickel silica catalysts was examined in detail by amongst
others Hermans and Geus (1979) Blackmond and Ko (1984) Montes et al
(1984) and in a more general sense by Maatman and Prater (1957)
The conclusions reached by these workers as to how the synthesis
procedure effects the metal distribytion and dispersion and hence
catalytic activity has been discussed in Section 13 and are briefly
summarised below Using their Conclysions an attempt was then made to
explain the activity of an HOD type n i eke 1 oxide s i 1 i ca alumina
catalyst
Impregnation as discussed in Section 132 and 362 involves the the
homogeneous increase in concentration of the nickel precursor by the
evaporation of the solvent In terms of preCipitation theory as
discussed in Section 13 the homogeneous increase in the concentration
of the metal salt results in the formation of a 1 imited number of large
nuclei which are evenly distributed over the support The reason for
this is that providing the concentration of the solution is kept
homogeneoys the rate of increase in concentration is equal to the rate
of Crystal growth Consequently the concentration of the solution Will
remain between that of the solubil ity and supersolubil ity curves where
no new nuclei can develop This has been disc~ssed in Section 1331
Th is was in fact foun d to be t he case by Montes et a 1 (1984) ljho in the
case of an inpregnated Ni silica catalyst recorded an average nickel
particle diameter of 52 nm They further suggested that only a weak
interaction exists between the metal preCursor and the support If this
were so then upon calcination the crystal size should increase (Section
1324) and the metal should be present in a form 31milar to that of
the bulk oxide They in fact found this to be so ie bull the average
nickel particle size inCreased to 45 nm after calcination for 16 h at
450degC in dry air The fact that the metal was present in a form similar
to that of the bulk oxide In calcined Impregnated nickel silica
catalysts had been established earlier by Houalla and Delmon (198ll
In the case of impregnated nickel sl1ic3 alumina catalysts no data was
available indicating the degree of interacton between the support and
the metal It is however assumed that in the case of this ta+almiddotst
the interaction between the support and the metal pr~Cursor are also
113
weak and that a similar redistribution and corresponding increase in
crystal size occurs during calcination It is also suggested that the
metal is present in a form similar to that of the bulk oxide
It is well known that for optimum catalyst activity a large specific
surface area and hence a finely divided sol id is required (Hermans and
Geus 1979) Small crystallites ensure high specific metal areas but
increasing nickel concentration results in agglomeration In the case of
impregnation the drying and calcination procedures result in the
formation of a heterogeneity of crystal sizes when the nickel content is
greater than about 5 wt~ Increaslng the nickel content beyond 5 wt~
results in broad and even binodal crystal size dispersion which not only
affects the activity due to loss of surface area but also the thermal
stability ie bullbull resistance to sintering (Richardson and Dubus 1978) It
is proposed that this fact accounts for the observed loss in propene
01 igomerisation activity recorded by Hogan et al (1955) and Holm et al
(1957) over impregnated nickel oxide sil ica alumina catalysts when the
nickel content was raised beyond 5 wt~ Thls proposal was further
supported by Dorl ing et al (1971) who predicted that when increasing the
nickel content below 5 wt~ the number of crystall ites would increase but
that the mean crystal size would remain approximately constant Beyond 5
wt~ nickel on the other hand they predicted that the number of
crystall ites would remain constant as the nickel content was increased
but that the crystall des woul d increase in size This has been
discussed in detail in Section 1323
From the above discussion it can thus be concluded that the activity of
impregnated catalysts is only a function of the the extent of metal
distribution and dispersion which in turn is a function of the metal
content
It would thus be desirable to produce a catalyst in which the crystals
generated during synthesis are held by the support and thus are
prevented from migrating and agglomerating during subsequent heat
treatments One such method is co-precipitation In the case of this
synthesis procedure as discussed in detail in Section 134 and 364
a reaction oCcurs between the support and the metal ie the meta] is
held by the support and the crystals are uniformly distibuted
throughout the matrix This type of catalyst was found to be much more
active for the 01 igomerisation of propene than impregnated cata list s
According to Holm et al (1957) th is is due to the hish extent of
distribution and dispersion of the nickel Ions present in thiS catalyst
However the same 1 imitations of nickel content on the activity were
114
observed ie the catalysts with a nickel content between 3 and 5 wt
were the most active (Holm et al 1957) In the case of SG type catalyst
this cannot be explained in terms of loss of dispersion with increasing
nickel content as it has been shown by Holm et al (1957) that the
crystal size remained unchanged as the nickel content was raised from 3
to 20 wt~ The reason that the activity did not increase as the nickel
content was raised beyond 5 wt may either be due to the inaccessibility
of the reactant molecules to the nickel or due to the nickel being in
an unsuitable form ie Nio as opposed to Ni+ 2 (NiO) after
calCination The latter was supported by the fact that the nickel was
diffiCult to reduce ie bullbull a reduction of only 50 was achieved after 2
h on stream at 500degC by Holm et a1 1957gt
It is thus proposed that although crystal dispersion remained unchanged
in co-precipitated nickel silica alumina catalysts up to a nickel
content of 20 wt the location and form of the crystals prevent total
utilisation of the available metal
Since most unsupported catalytically active materials sinter rapidly at
the conditions of calCination andor reaction (Hermans and Geus 1979)
the active compound has to be attached to a highly porous thermostable
support such as s11 ica or silica alumina This support which is often
not catalytically active itself increases the dispersion of the
catalytically active material Also the support is used most effectively
when the active material is distributed densely and uniformly over it
and is firmly held by the support A rapid transportation of the
reactants and products through the porous catalysts is also a
prerequisite for an active solid catalyst Sil ica alumina is such a
support but the available method of loading rlicke1 onto it viz bull
impregnation does not lead to an adequate degree of interaction between
the support and the metal An alternative method of loading ~lckel onto
sil ica alumina is thus required in which a uniform dispersion and
distribution could be ensured together with a strong interaction between
the support and the metal
In the case of nickel sir ica catalysts such a method was developed by
van Dillen (1976) and was termed homogeneous decompOSition deposition
(HOD) In this method as discussed In detail in SectIon 133 and
Section 363 the high degree of penetration or the solute into the
support during impregnation was combined with a controlled Ion exchanse
type preCipitation
115
In the case of nickel silica catalysts prepared by HOD measurements of
particle size distribution indicate a range of between 1 and 3 nm for
loadings of up to 30 wt~ nickel (Richardson and Dubus 1978) Furthermore
a strong interaction exists between the support and the metal and
conseQuently this type of catalyst was extremely resistant to sintering
Thus in the case of an HOD nickel sil ica catalyst with a nickel content
of 83 lilt Montes et al (1984) showed that after calcination in dry air
at 450degC for 16 h the averase diameter of the nickel particles decreased
from 51 to 46 nm In the case of an impregnated nickel sil ica
catalysts with the same nickel content the average nickel particle size
after calcination at the same conditions was 45 nm From this it may be
concluded that in the case of HOD nickel si 1ica catalysts the metal is
not present in the bulk oxide form This was in fact confirmed by Montes
et al (1984) usins X-ray diffraction The exact nature of the form of
the metal on the surface is not known Also the crystall ites in HOD
nickel si1 ica were readily accessible This was inferred from the
results of Blackmond and Ko (1984) who recorded 100~ reduction after 4 h
on stream at 500degC
From the discussion presented above it can be seen that the method of
homogeneous decomposition deposition produces a nickel sil ica catalyst
where the nickel is distributed densely and uniformly over the support
and that a strong interaction betweenthe support and the metal exists
In the case of nickel oxide si 1 ica alumina catalysts prepared by
homogeneous deComposition deposition no data was avai1ab1e in the
1 iterature either on the degree of dispersion or distribution or on the
support-catalyst interaction It is however thought that in view of the
results obtained from nickel si1 ica catalysts a high degree of
interaction occurs and that the crysta1l ites are uniformly and densely
distributed throughout the support
In this work the extent of metal distribution and dispersion on the
support phase and the nature of the support metal interact ion of nickel
oxide silica alumina catalysts prepared by homogeneous decomposition
depOSition were not investigated However the catalytic activity and
selectivity of this catalyst for the 01 igomerlsation of propene were
examined in detail and compared with the activity and selectivity of
nickel oxide si 1 ica alumina catalysts prepared by impregnation and coshy
preCipitation A discussion of each aspect of the work is now given
The reproduCibll ity study (Section 411 indicated that the experimental
results obtained in this study were reliable Once steady state
116
operation was reached both the selectivity and LPR showed 1ittle
variation between runs at similar reaction conditions
The reaction conditions used were unless otherwise stated (see iable
41) 80degC and 40 atm It can be seen from the phase diagram shown in
Appendix B that the reactants were in the 1 iQuid phase ConseQuently a
two phase system was studied When the temperature was raised above the
feed bybb1e point temperature of 86degC at 40 atm ie when the
reactants were in the vapour phase a three phase system was studied
The aim of this study was to compare the characteristics of a nickel
oxide si1 ica alumina catalyst synthesised via the HOD method adapted by
the author from the work done by van Dillen (1979) on nickel oxide
si1 ica catalysts with those of a catalyst prepared by the standard
impregnation techniQue (referred to as IMP) and co-precipitation
(referred to as SG) as discussed by Holm et al (1957gt
The effect of synthesis procedure on the propene ollgomerisation
properties of nickel oxide sil ica alumina was investigated by Holm et al
(1957) for an IMP type catalyst and a coprecipitated (SG) type catalyst
They found that the oligomerisation activity of SG type catalysts was
approximately 15 times that of IMP type catalysts HOD type catalysts
on the other hand had an activity similar to that of IMP type catalysts
but their performance was not as sensitive to the reaction conditions
and nickel content as IMP and SG type catalysts were With this in ~ind
a comprehensive study of the effect of reaction conditions using nickel
oxide sil ica alumina a catalysts prepared by homogeneous deComposition
deposiUon impregnaUon and to a 1 imited extent cODrecipltation were
carried out
Firstly the effect of the Quantity of nickel loaded onto the catalysts
was Investigated In the case of IMP type catahsts Hogan et al (1955)
had found that a nickel content between 3 and 5 wt gave the most
active catalyst Holm et al (1957j examinin9 the propene 01 igomerisaticn
actIvity of IMP as well as SG type catalysts found that irrespective of
syntheSis techniQue catalysts with a nickel content between 3 and 5 wt~
were the most active
In the case of IMP type catalysts examined in ~he present study no such
trend was observed IncreaSIng the nickel content from 22 wt to 63
wt~ at an average WHSV of 48 and 49 ghg respectiv~ly caused the LPR
to decrease by 42 Using on the other hand catal S With a nlck~l
content of 19 and 98 wtl at an avera~e WHSV of 53 and 52 9h~
117
respectively an increase of 5X In LPR was recorded In view of the
conf1 icting results obtained in this study and the differences In WHSV
from run to run no statement as to the effect of nickel content on the
activity of impregnated nickel oxide sil ica alumina catalysts could be
made
In the case of an HOD type catalyst increasing the nickel content did
not lead to a marked change in the LPR Differences in the WHSV and the
fact that the conversion was greater than 90 wtX in all the runs make a
comparison of the results diffiCult However comparing runs with
identical average WHSV viz bull 42 ghg showed that changing the nickel
content from 15 wtX to 72 wtX did not affect the LPR Similarly at a
WHSV of 49 and 50 ghg identical LPR were observed for catalysts with
nickel contents of 117 and 22 wtre
Thus although the study of the effect of the nickel content on the LPR
in the case of both IMP and HOD type catalysts is not unambiguously
conclusive the available data seems to indicate that the activity of an
HOD type catalyst was relatively independent of the nickel content and
that irrespective of nickel content HOD type catalysts were on average
20r more active than IMP type catalysts
It was observed while examining the effect of WHSV on the activity and
selectivity over HOD type catalysts that the selectivity was a function
of the Conversion ie bullbull a shift to 1 ighter products was recorded when
the conversion decreased Neither IMP type catalysts nor HDD type
catalysts exhibited a strong dependence of product composition on nickel
content In the case of IMP type catalysts the catalysts with 08 wt
nickel did show a greater selectivity towards trimers but the overall
trend observed was a gradual increase in dimer yield with increasing
nickel content at the expense of the trimer (Section 42) The small
Increase in dimer yield with increasing nickel content observed in this
work was in agreement with the data reported by Takahashi et al (1969)
who recorded the maximum dimer Yield for an impregnated nl~kel oXlde
sil ica alumina catalyst with a nickel content of 97 wt ~
The selectivity of HOD type catalyst was independent of the nickel
content when the nickel content was held between 1 3nd 7 wt~ At a
higher nickel content viz bull 11 wtX a decrease of 10 In dimer yield was
observed After careful examination of the data however it was found
that after 4 h on stream the WHSV for the catalysts with 22 and 17
wtY nickel were 53 and 49 respectively This 8 decrease in WHSV
between the runs may explain the observed decrease in Jimer yjel~
118
It may thus be concluded that the activity and selectivity of HDD type
catalysts were independent of the nickel content with in the range of
nickel loadings of 15 to 117 wtX In the case of IMP type catalysts
increasing the nickel content caused a shift to 1 ighter products with no
discernible effect on the activity
The effect of varying the pressure at a fixed temperature on the
activity and selectivity of an IMP type catalyst was investigated in
detail by Takahashi et al (1969) In the present work the effect of
varying the pressure at a fixed temperature of 80 c C for an IMP as well
as for HOD and SG type catalysts was investigated For an IMP type
catalyst the results obtained were similar to those of Takahashi et a1
(1969) Thus in the case of IMP type catalysts a drop in activity was
recorded when the pressure was lowered from 40 atm to 20 atm at a
constant temperature of 80 c C ie bullbull when the system moved into the
vapour phase In the case of an SG type catalyst it was found that the
catalyst was inert at 20 atm
In the case of a HOD type catalysts differences in WHSV and the fact
that the conversion was greater than 88 wtX in all runs make an
interpretation of the results difficult From the available data it can
however be seen that although the average WHSV increased from run to
run the LPR over HOD type catalysts remained constant as the pressure
was dropped from 50 atm to 20 atm From this it may be concluded that
the activity of HO~ type catalysts decreased as the pressure was
deCreased
In respect of the effect of pressure on product selectivity Takahashi
et al (1969) found that when the system moved into the vapour phase at a
constant temperature a shift to heavier products occurred Using an IMP
type catalyst this was also observed in this stJdy ie bull a dr0P or
in dimer yield mainly in favour of the trimer was observed when the
pressure was dropped from 40 atm to 20 atm In the case of HOD type
catalysts an opposite trend was observed viz bull decreasing the pressure
from 50 atm to 20 atm resulted in an almost 1 inear increase in dImer
i e 1 d
From the above discussion It can be seen that IMP type catalysts
contradict thermodynamics with regards to selectivity It was expected
from thermodynamics that as the pressure was decreased From 50 to 20 atm
the dimer yield should increase In the case of an HDD type eatalst
thiS was found to be the case Tn the case of IMP type catalysts
however an opposite trend was was observed Ie a ShiH to heavier
119
products as the pressure was decreased from 50 to 20 atm The observed
shift to heavier products with decreasing pressure may be explained if
it is assumed that at the lower pressures the heavier products are able
to evaporate off If this were so then in the case of HOD type catalysts
the yield of heavier products should also increase as the pressure was
decreased This was infact found to be the case although the increase in
trimer yield was very small In the case of both IMP and HOD type
catalysts the activity decreased as the pressure was decreased
To complete the study of the effect of reaction pressure and temperature
on the selectivity and activity the effect of varying the temperature
at a fixed pressure was investigated Since the above results for IMP
type catalysts were in agreement with those of Takahashi et al (1969)
and much information is available in the 1 iterature on IMP type
catalyst no further experimental work using IMP type catalysts was
done ConseQuently the results obtained from the 1 iterature were used to
compare IMP and HOD type catalysts
In the case of IMP type catalysts Takahashi et al (1969) foun d that
moving into the vapour phase ie when the temperature was raised
above approximately 90degC at a pressure of 50 atm a sl ight drop in
activity was observed Increasing the temperature beyond the bubble
point of the feed was accompanied by a shift to heavier products The
reason that the catalyst activity decl ined only sl ightly with increasing
temperature at 50 atm was that the sil ica alumina support becomes active
at the higher temperatures At 35 atm on the other hand crossing the
phase boundary results in a rapid decl ine in propene conversion with
increasing temperature The reason for this is that si 1 ica alumina is
only sl ightly active at 35 atm for the 01 igomerisation of propene
ltTakahashi et a11971gt The shiH in product spectrum ie a shiH
to heavier products can also be explained in terms of silica alumina
activity This is so because the preferential product of silica alumina
when the latter is used for the 01 igomerisation of propene is a propene
trimer (Feldblyum and Baranova 1971 Takahashi et a1 1971)
The nature of the products formed over si 1 ica alumina wheuron Jsed for the
01 igomerisation of propene and the effect of temperature on the activity
and selectivity were examined The results obtained were in agreement
with those of Takahashi et al (1972) liz silica alumina was actve
for the 01 igomerisatlon of propene as long as the system temperature
remained above 150degC Also the activity Jropped with decreasing reaction
temperature At 80degC Ie in the 1 iquid phase at 40 atm the catalyst
was inactive This was not in agreement with the results of Feldblyum
120
and Baranova (1971) who in a batch reactor recorded 6X conversion at
64degC and 50 atm The reason for the difference in the results was
properly due to the different pressures used ie bullbull 40 atm in this work
as opposed to their 50 atm and the di fferent process ie batch as
opposed to fixed bed reactor The product spectrum obtained agreed with
that foun d by other workers viz bull decreasing trimer yield With
increasing temperature and propene trimer being the main product
In the case of an HOD type catalyst increasing the temperature at a
fixed pressure resulted in the LPR dropping by approximately 50r when
the system moved into the vapour phase Increasing the temperature
further did not result in any marked changes in the LPR Thus although
the average WHSV increased from run to run the LPR remained
approximately constant as the temperature was increased From this fact
it may be concluded that the activity of the catalysts decreased as the
temperature was increased
The overall shift to heavier products when raising the temperature from
80degC to 150degC ie bullbull an increase in propene trimer at the expense of the
propene dlmer was expected in view of the catalytiC role of the sil ica
alumina support at the elevated temperatures The increase In dimer
yield as the temperature was raised further from 150degC to 210degC could be
explained in terms of the increasing WHSV and hence decreasing activity
of the catalyst (See Section 441)
From the different trends in product spectrum recorded when operating in
the vapour phase ie bullbull an increase in trimer yield with increasing
temperature when using nickel oxide sil ica alumina as opposed to a
decrease in trimer yield when uSing silica alumina observed in this work
it could be concluded that in supported nickel catalysts the ni~kel
still played a role at the elevated temperatures ThiS conclusion was
also supported by the results of Takahashi et al (1972) who found that a
physical mixture of sll iea alumina and nickel oxide had the same
activity as sil ica alumina alone thus indicatin9 the importance of
supporting the nickel Also the conversion over nickel oxide s11 ica
alumina was less senSitive to the reaction temperature then was the case
for silica alumina when the system was operated in the vapour phase at
40 atm Thus in the case of si 1 iea alumina a drQP in LR of 83~ was
recorded when the temperature was dropped by 50degC from ZODoC while in
the case of a HOD type catalyst3 an increase In LPR of 30 was recorded
when the temoerature was decreased over the same range
The 1 ifetimes of the catalysts were examined by the changes in the
activity over the first 10 h on stream In the case of an IMP type
catalyst data was avai lable in the 1 iterature on the 1 ifetime when this
type of catalyst was used for the 01 igomerisation of butene (Hogan et
al 1955 Allum 1974) The results obtained by these researchers was
that the activity of the catalyst did not change markedly after 100 h
and 21 days on stream respectively No data was however available on
the 1 ifetime of this catalyst when used for the 01 igomerisation of
propene
As using the changes in activity over the first 10 h on stream as an
indication of 1 ifetimes was very sensitive to WHSV fluctuations both
the changes in LPR and WHSV have to be recorded The average WHSV in
this run was 53 ghg In the case of an IMP type catalysts the LPR
dropped by 175X after 5 h on stream during which time the WHSV dropped
by 1X In view of the fairly constant WHSV and the large drop in LPR it
may be assumed that IMP type catalysts deactivate rapidly when used for
the oligomerisation of propene A slight shift to lighter products was
also observed during this run which was expected in view of the
decreasing activity
In the case of SG type catalysts the LPR dropped by 96~ while the WHSV
dropped by 21~ after approximately 6 h on stream The average WHSV
during this run was 52 ghg The change in the WHSV was considered
acceptable and so it may be concluded that this type of catalyst
deactivates less rapidly than IMP type catalysts do when used for the
01 Igomerisation of propene This conclusion was also reached by Holm et
al (1957) In the case of this catalyst a slight shift to lighter
products was also observed with time on stream
In the case of a sil ica alumina when operated at 200degC the LPR dropped
by 315~ while the WHSVover the same time period of 76 h dropped by
28X The average WHSV during this run was 35 gh9 From these results
it can be seen that this catalyst rapidly deactivates when used for the
01 igomerisation of propene at 200degC A very sl ight shift to 1 ighter
products was observed during this run
In the case of an HOD type catalyst no data as to the 1 ifetime ~as
available and hence a long run was performed The LPR fluctuated during
this run due to WHSV fluctuations The average WHSV during this run was
52 ghg USing data pOints 105 h apart with nearly Identical WHSV of
56 and 57 ghg respectively it was found that the Conversion
decreased by 126X over this period The selectivi~y also changed during
122
this run ie bullbull the Quantity of dimer formed increased by 25~ at the
expense of the tetramer and pentamer after 120 h on stream
The I ifetime of the catalysts as measured by the drop in activity over
the first 10 h on stream are in order of decreasing length HODgt sa gt
IMPgt SA It may thus be concluded that HOD type catalysts are superior
with respect to 1 ifetime when used for the 01 igomerisation of propene
than any of the other catalysts studied
The effect of varying the ~HSV on the activity and selectivity of IMP
type catalysts was examined by Takahashi et al (1969) and by Hogan et a1
(1955) who also examined the effect of feed composition They found as
discussed in detail in Section 1524 that the rate of polymer
production increased 1 inear1y with propene concentration ie bull a first
order relationship between propene concentration and rate of polymer
formation was obtained The optimum space velocity for maximum
conversion was less than 2 ~ of propene per ~ of catalyst per hour
(Takahashi et a1 bull 1969) At higher ~HSV Takahashi et al (1969) found
that the conversion dropped rapidly
In the case of HOD type catalysts the LPR increased with the ~HSV
However the catalysts deactivated rapidly at the higher WHSV ie bull a
WHSV greater than 11 ghg in this work resulted in a drop in the LPR of
28X after 7 h on stream As expected the overall conversion decreased
with increasing WHSV droPPing from 96~ at the lowest WHSV of 49 ghg
to 77~ at a WHSV of 116 ghg
The selectivity was also affected by the changing WHSV viz a shift to
1ighter products and an increase in dimer Yield was observed with
increasing WHSV This trend is OPPOSite to that observed by Takahashi et
a1 (1969) who found using IMP type catalysts that dimer selectivity
decreased for a WHSV greater than 32 ghg Why this shoyld be so is
not known The trends In conversion are however identical viz bull
Conversion decreased with increasing WHSV
The effect of operating the catalyst initially at ZOOdegC and then reusing
ii at SOdegC was examined The catalyst was calCined in the normal man~er
between the two runs The effect on LPR and selectivity of operating the
catalyst at 200degC has already been discussed
From the results obtained in this study It was found that the actiVity
of the catalyst at sooe was affected by operating it first a~ 200degC and
the steady state Conversion after 4 ~ on stream e11 by 28~ from that
123
of a catalyst used under normal conditions The selectivity ~as also
affected by this procedure a shift to 1 ighter products being recorded
The reason for the decrease in activity ~as probably the same as that
suggested by Hogan et al (1955) in the case of IMP type catalysts
~hereby the nickel oxide promoter under~ent changes such as sintering or
a change in oxidation state during the repeated calcination and high
reaction temperature ~hich caused the activity to decl ine The catalyst
~hen operated under normal conditions did not deactivate to any marked
extent and hence no data as to the effect of repeated calcination on
the activity and selectivity ~as available
The effect of feed contaminants ~as examined in detail by Hogan et al
(1955) using an IMP type catalyst This ~as discussed in detail in
Section 1525 In this ~ork only the effect of ~ater on the activity
and selectivity ~as examined In the case of an IMP type catalysts Hogan
et al (1955) found that if the catalyst ~as allo~ed to absorb as little
as 05 ~t~ moisture the catalyst deactivated They found that this type
of contamination ~as totally reversible
In the case of an HDD type catalyst using an undried feed containing 112
ppm (vv) ~ater the catalysts deactivated after J5 h on stream as
opposed to the more than 120 h recorded ~hen using a dry feed Using the
average WHSV of 51 ghg to calculate the quantity of ~ater fed to the
reactor and assuming that al 1 the ~ater entering the bed ~as absorbed by
the catalyst the mass of ~ater absorbed by the catalysts ~as 510- 3
9H20gcat or 05 ~t~ This result is consistent ~ith to that obtained
by Hogan et al (1955) for IMP type catalysts Furthermore the
contamination ~as totally reversible as the catalysts regained its
normal dry feed properties ~ith respect to activity and selectivity
after regeneration
To examine the catalytic properties of the HDD type catalysts when used
for the ollgomerisation Ot propene dimer (C6) the lt 69degC fractIon from
previous runs ~as fed to the reactor To quantify the activity of the
catalyst the equations as discussed in Section 49 ~ere used to
calculate the LPR and conversion At 80degC the catalyst was active for
the oligomerisation of C6 but deactivated rapidly This ~as probably due
to the hl9h molar ~ei9ht products formed viz a propene tetramer
(CI2) stallng on the catalysts and so blocklng the active sites Upon
raiSing the temperature to 200degC the catalysts raPldl~ re9ained activity
reaching a steady state conversion of 64 The only product formed
124
during this run to any significant extent was a propene tetramer
(Ct2)
Feeding Co and CJ simultaneously also caused the catalyst to deactivate
after approximately 3 h on stream at 80degC The maIn product formed
during this run was a propene trimer (C9) The reason for the rapId
deactivation was probably the same as above ie bullbull the accumulation of
the propene trimer (C9) in the system and consequent blocking of the
active sites After regeneration and reusing the catalyst at 200degC the
catalyst was again active for the 01 igomerisation of the CJCo mixture
In thIS case the main product was also a C9 01 igomer with Ct2 through
C2 t formed in reasonable quantities Co-feeding Co with CJ thus has the
effect of increasing the average molecular weight of the products over
that when pure CJ was fed although different temperatures are needed to
ensure reasonable activity when Co or a CoC] mixture was used
The oligomerisation activity of the si1 ica alumina support when feeding
Co or C]C6 at 2DDoC was not examined That the support does playa role
can not be disputed as si1lca alumina is catalytically active for the
01 igomerisation of propene at temperaturesgt 1SDoC The large Quantity
of C9 formed when co-feeding CJ and Co could be explained in two ways
Firstly it could be assumed that the co-o1 igomerisation of Co and CJ was
more rapid than the dimerisation of Co or secondly that the
trimerisation of propene was the main source of the trimer The second
option seems more 1 ikely as the preferential product of si 1 ica a11Jmina
when used for the 01 igomerisation of propene at 20DoC is a propene
trimer
In the case of Ni-lSM-5 Miller (1984) suggested the use of a two stage
system whereby a high Yield of propene tetramer was possible The system
suggested by Miller (1984) was that propene should first be dimerised in
the normal way over Ni-lSM-5 at 27 to 93degC and 27 to 109 atm followed by
a distillation to separate the dimer fr~m the other products The
second stage woul d then be the 01 igomer ig3t ion of the Co stream it 121
to 232degC and 14 to 54 atm to propene tetramers both reactions being
conducted in the liQuid phase The final liQuid product )btained
contained as much as 60 wtX propene tetramer ~rom the results obt31ned
in the present work it becomes apparent that HOD t~pe nickel oxide
Silica alumina also achieves this prodlct spectltJm The reactiCn
conditions used in thiS work were 80degC and 40 atm for stage one the
product containln3 65 wt dimer and 20DoC at 40 atm For stage two Yere
both reactions were also In the 1 iquld phase and the flnal product
obtained contained appr~ximately 45 wt propene tetramerlf on th~ ot~er
125
hand the feed to stage two is a mixture of C3 and C also at 20Doe and
40 atm the final 1 iQuid product contained 20 wt~ C9 with e12 to C21
also being formed in reasonable Quantities Thus depending on the feed
used the products obtained can range from predominantly dimer obtained
when pure e3 is fed to almost pure tetramer when a C feed is used to
a high molecular weight product C to e21 when C3 and C are fed No
information was however available as to the degree of branching of the
products formed
The effect of the activation procedure in the case of IMP type catalysts
was studied in detail by Takahashi et a1 (1969) with respect to aCidIty
structure and propene dimerisation activity They found that a
temperature between 500degC and 600degC was needed to activate the catalyst
and that the activity increased with increasing activation time up to 5
h above which the activity did not change A more detailed discussion on
the effect of activation procedure on the nature of the catalyst is
given in Section 1526
In the case of an HOD type catalyst using TOoTA the only thermal event
recorded was an endotherm between 500 0 e and 600degC This was probably due
to the decomposition of organic intermediate incorporated in the
catalysts during the synthesis to nickel oxide Below bOOoe the mass
loss was 122 wtra while 15 wt was lost between 600 and 800degC In view
of the work done by Takahashi et a1 (1969) as discussed above it was
assumed that in the case of HOD type catalysts the optimum calcinatl0n
temperature also lay in the region of 500 to 600 0 e
To determine the Quantity of water that the catalyst absorbed the
previously calcined catalysts was re-exposed to aIr and the mass loss
recorded In this run the rate of mass loss was fairly ynlform the
overall mass loss bein3 37wt From the results obtained it was
concluded that below 600degC ie bull below the endothermic event observed
In the case of the unused catalyst the onl) species removed frOM the
catalyst was water
To determine the Quantity of hydrocarbon held by the catalyst aft~r it
had been used for the 01 i90merisatlon of propene as a function of nl~~el
content the TOoTA Curves for 3n HOD type catalysts With a nlck-l
content of 113 and 15 wt~ were recorded In vIew of the abQv~
discussion the mass loss recorded below 6COo~ was probably due t) the
removal of water and in this case 1 i3ht hydrocarbons As +he catagtsts
uDon completion of a run were not stored In air ~i3ht c1ntainers ~hey
probably absorbed water from the atmosp~ere Consequent ~ ~~ mak~ t~~
126
comparison meaningful only the mass loss above 600degC was considered
Below 600 0 e the mass loss recorded were 81 and 105 wt~ for HOD type
catalysts with a nickel content of 113 and 15 wt~ respectively From
this result it can be seen that the higher the nickel content the lower
the amount of adsorbed hydrocarbon and hence the lower the degree of
active site contamination In view of this result it may be concluded
that a high nickel content is desirable to ensure a long catalyst
lifetime Above 600 0 e the mass loss was independent of the nickel
content and In both cases was approximately 15 wt~
To compare the effect of synthesis procedure and the Quantity of
hydrocarbon held by the catalyst after it had ~een used for the
01 Igomerisatlon of propene the TGDTA Curves for an IMP HOD and SG
type catalyst were recorded In this case the total mass loss was
considered and it was found that the sa type catalyst had the highest
mass loss (244 wtX) followed by the IMP type catalyst which had a mass
loss of 173 wt~ and an HOD type catalyst which showed a mass loss of
120 wtX From these results it can be seen that the HOD type catalysts
held the least amount of hydrocarbon which gave a further indication
that the extent of deactivation of this catalyst was not as great as
that of the other catalysts examined
The products obtained when propene ~as 01 igomerised over an IMP type
catalyst were found by Hogan et al (1955) to contain as much as 70 vol~
Co of which 35 vol~ were linear hexenes In the case of this work the
degree of branching ie the CH3 to CH2 and CH to CH ratio was
determined using 1H NMR From the results obtained the products formed
over the IMP type catalyst were the most branched followed by the
products formed over SG type catalysts The products formed over HDO
type catalysts were the least branched From the above results if it is
assumed that the degree of branching found in this work for the products
formed over IMP type catalysts correspond to the product spectrum Quoted
by Hogan et al (1955) then the products ormed over HOD and SG type
catalysts contain more 1 inear Cos than the products formed over IMP
type catalysts do
From the present work two Questions arise They are
(1) Why is nickel oxIde silica alJmlna active for the ol190merlsation
of Dropene at sooe and sil ica alumina only at temperatures great~r
than 150degC
127
(II) Why is the preferential product of nickel oXide silica alumina
when used for the oligomerisation ~f propene a propene dimer
while that of si1 ica alumina when used for the same reaction a
propene trimer
It is proposed that the differences observed are due to the nature of
the active site and hence the 01 igomerisation mechanism
In the case of silica alumina the nature of the active site is
controversial because of the lack of conclusive evidence The various
schemes that have been proposed (8 in total) are diSCussed in Section
1231 It can however be concluded from the structure of the products
formed as establ ished in detail by Feldblyum and Baranova (1971) and
discussed in detail in Section 1232 that sil ica alumina 01 igomerises
propene via a carbonium ion meChanism ThiS in turn would explain why a
high reaction temperature is needed for silica alumina to be active for
the 01 igomerisation of propene
In the case of nickel oxide silica alumina 5 schemes have been
formulated as to the nature of the active site and hence 01 i90merisation
mechanism The various schemes proposed have been discussed in Section
1241
An early indication of the nature of the active site was given by Clark
(1953) who sugsested that the nickel crystals in nickel oxide sil ica
alumina contained an excess of metal ions Hence the active center may
either be an anion vacancy or a nickel atom not directly linked to an
oxygen atom and situated at lattice or interstitial p~ints This
sU9sestion was used by Feldblyum et a1 (1974) who then continued to
draw a compar I son between the 01 I gomer i sat ion mecran ism over nom0geneous
catalysis based on nickel salt and organoaluminium compounds and
heterogeneous catalysts based on nickel OXide on acid carriers This has
been discussed in detail In Section 1242 and summarised In Table
11 The conclusion reached by Feldblyum et a1 (1984) was that the
01 igomerisatlon of propene over nickel oxide sll iea alumina proceeds via
a complex hydride This mechanism proposed by them accounts for t~e
observed activity and selectivity of nickel oxide sll i3 alumina
Thus although no eVidence eXists to support or discount the mech~~lsm
proposed by Feldblyum and Baranova (1971) to expain the activity and
selectivdyof Silica alumina and FeldblYJm et a1 (1974) to $ltplaln
the activity and selectivity of nickel oxide 811 ica alumina they s~r~e
128
as a 900d model It is however clear that more work is reQuired to
explain these observations
In conclusion
ltI) The incorporation of nickel into sil ica alumina enhances the
catalyst activity at low temperatures and affects the
selectivity ie bullbull causes a shift to I ishter products
(II) The method of incorporating the nickel affects the activity and
selectivity o~ this catalyst
(III) The activity and selectivity o~ nickel oxide sil ica alumina
catalysts prepared by the HOD method are independent o~ the
nickel content In the case of IMP and SG type catalysts this is
not the case
ltIV) The selectivity and activity of HOD SG and IMP type catalysts
are all sensitive to the reaction temperature and pressure
(V) The 1 i~etime of HOD type catalysts when used for the
01 igomerisation of propene was 3uperior to that of the other
catalysts studied
(VI) HOD type catalysts are more active than any of the other
catalysts examined
(VII) HOD IMP and SG type catalysts are all sensitive to the feed
moisture content The introduction of a wet feed results in hish
initial activity followed by rapid deactivation The rapid
deactivation may be due to the conversion of Lewis aCld sites
to Bronsted acid sites in the presence of water
(VIII) The product spectra of HOD and IMP type catalysts are similar 3G
type catalysts however exhibit a greater selectivity towards
heavier products
(IX) HOD type catalysts can be used for the 01 igomerisation 0 hl9h
molar welght 01 igomers
129
REFERENCES
Allum KG bullbull United States Patent Appl ication No 3816555 (1974)
Bartlett PO Condon FE bullbull and Schneider Abull J Am Chem Soc bullbull 66
1531 (1944)
Blackmond DG and Ko E Appl Catal 13 49 (1984)
Boreskov OK bull in Preparation of Catalysts (Delmon Bbullbull ed)
Elsevier Amsterdam 223 (1976)
Brookes CS bull and Christopher GLM J Catal 10 211 (1968)
Cartwright PFS bullbull Newman EJ and Idilson DId bullbull The Analyst 92
663 (1967)
Cervello J bullbull Hermana E Jimlnez J bull and Milo F bullbull in Preparation of
Catalysts ltDelmon Bbullbull eds) Elsevier Amsterdam 251 (1976)
Clark Abullbull Ind Eng Chem bullbull 45 1476 (1953)
Coulson JM bull and Richardson JF bullbull Chemical Engineering Vol II
Pergamon Press New York (1980)
Couper A and Eley D Dbull Discussions Faraday soc 8 172 (1950)
Dorling LA Lynch 13 IdJ and Moss LL bull JCatal 20190 (1971)
Dow IdM and Jakob Mbull Chem Eng Pro 47 637 (1951)
Dowden DA J Chem Soc bullbull 242 (1950)
Dutkuwicz RK bullbull Energy 1980 An Energy Pol ICy DiScussion Document The
Energy Research Institute- UCL 1980
Evans AG bullbull and Polantl ~L NatJre 152 733 (1947)
Feldblyum VSh bull and Baranova rT ZhlJrnal Orsanichesoi Kiml 7
2257 (1971)
130
FeldblyYm V Sh bullbull Petryshanskaya NV bullbull Lesheheva AI bullbull and Baranova
11 Zhyrnal Organischeskoi Khimii 10 2265 (1974)
Finch JN bullbull and Clark A JCatal bullbull 13 147 (1969)
Fontana CM bullbull and Kidder GA bullbull J Am Chem Soc bullbull 70 3745 (1948)
Forni L bullbull Catalysis Reviews Vol 8 (Heinemann Ht ed) Marcell
Dekker New York (1974)
Galya LG bullbull Occelli ML bullbull and Yoyng DC J Mol Cat 32 391
(1985)
Heertjiesl PM and Mc Kibbins SiAl Chem Eng SCi bullbull 5161 (1956)
Hermans LAM bullbull and Geys JN in Preparation of Catalysts II
(Delmont Bbullbull Grange P bullbull and Jacobs P eds) Elsevier The
Netherlands (1979)
Higley DP EYropean Patent Appl ication No 843052143 (1984)
Hill FN bullbull and Selwood PW J Am Chem Soc 71 2522 (1949)
Hirschler AE Am Chem Soc Meet Chica30 Sept 1970 Reprints
Div of Petrol Chem 15 A97 (1970)
Hogan JP Banks RL Lanning WC bullbull and Clark Abullbull Ind Ens Chem
47 LI (1955)
Holm VCF bullbull Bailey GC bullbull and Clark A Ind Eng Chem bullbull 49 250
(1957)
Holm VCF and Bailey GC bull and Clark A bullbull JPhys Chem 63 129
(1959)
Hoyalla M and Delmon B bullbull Surface and Interface Anal 3 103 (1981)
Hunter WH bullbull and Yohe RV bullbull J Am Chem Soc 55 1248 (1933)
Imal Hbullbull and Uchida Hbull Bull Chem Soc Japan 38 925 (1965)
Imai H Hasesawa L and Uchida H Bull Chem 30c Japan 41 45
( 1968)
131
Johnson 0 bullbull J Am Chem Soc bullbull 59 827 (1955)
Langlois GE bullbull Ind Eng Chem 45 1470 (1953)
Leva Mbullbull Fluidisation McGraw and Hill (1959)
LevensPlelO bullbull Chemical Reaction Engineering 2nd ed bullbull John Wiely and
Sons (1972)
Maatman RW bullbull and Prater CD Ind Eng Chern bullbull 49 2 (1957)
McNair HM bullbull and Bonell i EJ bullbull BasiC Gas Chromatography 5th ed
Varian Instrument Division (1969)
Mickley HS bullbull and Fairbanks DF bullbull AI Ch EJ 1 374 (1955)
Miller SJ bullbull US Patent 4608450 (1986)
Mizuno K bullbull Ikeda Mbullbull Imokawa T bull Take J bull and Yoneda Ybullbull Bull
Chem Soc bullbull Japan 49 1788 (1976)
Montes Mbullbull Penneman de Bosscheyde Cbullbull Hodett BK bullbull Delannay F bull
Grange P bullbull and Delmon B bullbull Appl Catsl 12 309 (1984)
Norrish RGIJ and Russell KE bullbull Trans Faraday Soc bull 43 91 (1952)
Ozaki Abullbull and Kimura K JCatal 3 395 (1964)
Ozaki Abullbull Ali H and Kimura K bullbull FOJrth Int Cong Catal Moscow 40
(1968)
Peri JB JCatal 41 227 (1976)
Ramser JH and Hill PB bullbull Ind Eng Chem bull 501 (1958)
Richardson JT and Dubus RJ bull J Catal 54 207 (1978)
Sato Mbullbull Aonuma T and Shiba T Poc Third Int Con-l Catal
Amsterdam 1964 1 396 (1965)
Schmerl ing L and Ipatieff )N bull Advances in catalysIs II New York
AcademiC Press Inc 21 (1950)
sc h u lt z R G S c h tJ C k J M and IJ i 1 d I B Cbullbull J Cat a1 6 385 (1 966
132
Shepard FE Roohes JJ bullbull and Kemball Cbullbull JCatal 1 379 (1962)
Smith JM bullbull and Van Noss HC bullbull Introduction to ChemIcal Engineering
ThermodynamiCs 3rd Edition McGraw and Hill International Book Company
New York (1981gt
Takahashi Kbullbull Sasaki 0 bullbull Aomura Kbullbull and Ohtsuka H Hokkaido Daisaku
Kogakubu Kenkyu Hokoku 53 201 (1969)
Takahashi K bullbull NishiH Yoneda Nbullbull and Ohtsuka Sekiyu Gakkai Shi 15
482 (1972)
Tamele MW bullbull Ind Eng Chem 8 270 (1950)
Thomas CL Ind Eng Chem bullbull 37 543 (1945)
Ublad AG bullbull Mills GA Heinemann Hbullbull Polymerization of Olefins
Emmet (ed) Catalysis 5 New York (1958)
Uchida H and Imai Hbullbull Bull Chem Soc Japan 35 995 (1962)
Van Dillen JA bullbull Geus JW bullbull Hermans LAM bullbull and Van Der Mejden Proc
Sixth Int Congo Cata] B7 (1976)
Walton AG bullbull in Dispersion of Powders in liquids (Parfitt GD bullbull ed)
Elsevier Amsterdam 122 (1969)
Ward JW bullbull and Hansford RC bullbull J Catal 13 154 (1969)
Weeks TJ bullbull Jr bullbull Angell CL Ladd IR bullbull and Bolton AP JCatal
33 256 (1974)
Whitmore FC Ind En2l Chern 26 94 (1934)
Yagi S bullbull and Kunii Dbullbull Fifth Int Symp on Combustion Reinhold (ed)
New Yor k 231 (1955)
133
APPENDIX A
1 Gas chromato~raph data
11 Gas samples
The settin~s used on the Gow-Mac 750p ~as chromato~raph tor all teed and
tail ~as analyses are 1 isted below
Chromatograph Go Mac 750p
Detector Flame ionisation
Attenuat ion 1
Range 10- t 0 ampsmV
Data system Varian 4270
Column length 55 m
Column diameter 4 mm
Column pressure 28 psi at 50C
Pack ing n-OctanePoracil C
N2 tlowrate 41 mlmin
H2 fl owrate 31 mlmin
Air flowrate 300 mlmin
Injector temp 150C
Detector temp 250C
Temp pro~ 10 min at 50C 10Clmln b 120C
5 min at 120C
Sample volume 10~1
111 Cal ibration
It IS well establlshed in the 1 iterature that the area percents of
components are not directly proportIonal to the mass percent ie
different components have different detector responses It IS therefore
necessary to determine correction factors Once determined these
correction factors can be ~sed to calculate the composition on a mass
basis Two gas standards were avaIlable the compOSition of which ere
shown in Table A-l
134
Tab1e A-l Gas standards composition
Stan dar d Species Mole ~ Mass
1 Methane
Ethane
Propane
Butane
228
292
298
182
101
243
363
293
2 Propane
Propene
520
480
532
46S
Each standard was injected M times (M L 3) into the GC and the area
Counts and retention times recorded The results were then normal ized to
el iminate any discrepancies while injectin9J usin9 the eQuations shown
below These eQuations were adopted from McNair and Bonell i (1969) To
normal ize area counts use
For i = 1 to M
where
M is the number of samp1es
N is the number of components
ACI J is the area count of component in sample as recorded by
theGC bullbull and
APi is the mean area percent or component i
and to normal ize retention times use
RIi = J1 (~IijACiJ For i = 1 to MI
t ~1 J ~1 AC i I
Ilhere
Ri ij IS the retention time of comoonent i In samp1e j and
RIi is the mean retention time of Component 1
135
Once the mean area percent of each component had been establ ished the
rat io (AR) of the area percent (APt) to mass percent (MPt) was
calculated using
The response factors (RF i ) are calculated using
These factors are relative to propane ie the response factor for
propane was arbitrarily set equal to unity A detailed sample
calculation using the above procedure is ~iven in Table A-2
Table A-2 Area percent and retention tIme normalisation
Standard 1
Spec i es Methane Ethane Propane Butane
(N=4) ( i =1) ( i=2) ( i =3) ( i =4)
AC i j t 94792 241206 346861 371930
RT i j t 35 43 62 111
AC i j 2 82857 213323 308409 332568
RT i j 2 35 43 62 111
ACijJ 86832 215668 314257 322218
RT i j bull J 35 43 61 111
APi 90 229 331 350
RTi 35 43 61 111
MPi 101 243 363 293
AR 089 094 Dl 12
RFi 102 097 100 076
136
Table A-2 Area percent and retention time normalisation (continued)
Standard 2
Species Propane Propene
(N=2) ( i =2)
ACij-t 521001 593387
RT i j bull t 61 74
AC i j 2 55278 64241
RT i j 2 62 74
AC i J J 45750 56275
RT i j J 61 74
APi 466 534
RTi 61 74
MPi 532 468
ARi 088 114
RFi 1000 077
Under the same detector conditions these factors can be used time and
time a9ain to calculate the mass percent of the components in the
standards relative to propane
To calculate the composItion on a mass basis of an unknown mixture the
equation used is
MPi
A sample calculation usin9 the above equation and the GG output from
an independent injection of Standard 1 is shown In Table A-3
137
Table A-3 Error determination
Species MPI MPcalc Error
Methane 109318 102 101 103 16
Ethane 273475 097 243 243 03
Propane 394953 100 363 364 01
Butane 414146 076 293 290 09
~ (E 2 ) = 34
A typical spectrum obtained (f~ed gas) is summarised in Table A-4 and
shown in Figure A-i Traces of species found in the feed but for which
no standards were available were assigned response factors of vnity As
the total contribution of these on an area basis was less than one
percent the error introduced should be negl i~lbly small
Table A-4 Feed composition
Species Retention time Response factor Mass r
Methane 35 102 00
Ethane 43 097 092
Propane 61 100 198
Propene 74 077 780
Iso-Butane 110 100 019
N-Butane 11 1 076 023
i-Butene 136 100 043
Iso-Butene 147 1 00 004
T2-Butene 153 100 009
C2-Butene 159 1 00 005
C5 + 193 100 017
138
I m ~ t gt z m
ImiddotIi Ii I
il I
I
I I i
l~~0 0 Z z -ln n 0 0 Vgt I I VgtNN deg OgtJJ COOIIdeg 0 0 ICC 1ClliX) gt m Cll -l -lCllCC Z Z Cgt mC-l-l m m -l Z Z-lmm
gt m m m Z Z z zmm m m
Fi~ A-I GC SPECTRA OF FEED
139
12 Liquid samples
The settin9s I isted below were used for all I iQuid samples
Chromatograph Varian 3400
Auto sampler Varian 8000
Data system Varian CDS 401
Detector Flame ionisation
Attenuat ion 1
Range 10- Of ampsmV
Column length 3 m
Column diameter 4 mm
Column press 18 psi at 40 C
Packing 31 Sil iconOV-10l on Chromosorb W-HP
100120 mesh
Nz flowrate 30 mlmin
Hz flowrate 30 mllmin
Air flowrate 300 mlmin
Injector temp 250C
Detector temp 300C
Temp Pro9 5 min at aoc lOCmin to l80C
30Cmin to 300C 5 min at 300C
Sample volume 1 ~I
121 Calibration using mass spectroscopy
Due to the complex nature of the I iQuid products the analysiS of the
I iQuid spectra was difficult To facil itate product analysis it ~as
decided that the liquid product analYSis be based on carbon number
groupings rather than on indiVidual components A direct comparison
between the spectra obtained by the GC and MS was not possible due
to hardware and software differences The trends in the spectrum
obtained were however the same and in this way carbon number~ could b~
allocated to the GC spectrum
A typical spectrum of the GC-MS is shown in Fi9ure A-2 The
molecular wei9hts of the components ~esponsible For the peaks as
determined by mass spectroscmiddotpy are shown In this FIJre As a
comparison a sas chromatogram uSln3 the Varian 3400 IS shown In
140
r------------y-~
+ cO -shy
U
LJ -shy
u Ishy
= c - 0
t-Clt 0 a~
t Cl-=gt ct- l shy J
C-~ IL ~ 0 r (t
ot- l shy
f u w Q ~ (j)
co t~ (j)r-J
Gl u [- u
t~ ~
J lt u shyCI gtshyl-
N I
W lt
(JshyU
U ~
IL
M U
Hlpoundl
---------
---- ---
141
~Lgt-------- --- -------_____
_____~L
ltlt
I
C1 U
---~~------- --~-----~------~~--
u___---s-----======~--=-----~~a
1 -------------- ----------shy
142
F i 3ure A-3 Us i ns the data from the M S carbon numbers cou 1 d be
assisned to the peaks on the sas chromatosram and so the start and end
times of the various sroups established The groupings used are shown in
Table A-5 as is a typical 1 iquid compositIon
Table A-5 Typical liquid composition and retention time windows
Group Mass r Retention times
start stop
Monomer 495 000 102
oimer 610 102 470
Trimer 243 470 112
Tetramer 813 112 157
Pentamer 162 157 185
Hexamer 000 185 205
Heptamer 000 205 280
The response factors of these groups were taken as unity which was
justified in VIew of work done by Dietz (1967) on the relative
sensitivity of hydrOCarbons The results reoorted in mass oercent are
therefore a reasonable representation of the actual composition
0 200 0
100 VAPeUR PHASE
Jgt
600+ m z 0 x
w 500+
fLUID PHASE
L 400I-a III
1I QU I D PHASE W 0 300 =gt III
(f) III(f)
t WW
00
-600 --300 -100 100 300 600 700 900 1100
TEMPERRTURE C
FIG B-1 DEW pe I NT TEMPERATURE ( C) AND BUBBLE pe I NT TEMPERATURE (C) VS PRESSURE (ATM)
20 MelEi PRePANE AND 80 MelEi PRePENE ~
I J