Embed Size (px)
Citation preview
GROUNDFISH SURVEY METHODS
by
M. D. Grosslein
Bureau of Commercial Fisheries Biological Laboratory Woods Hole, Massachusetts Laboratory Reference No. 69-2 11 April 1969
(Not to be cited without permission of the author)
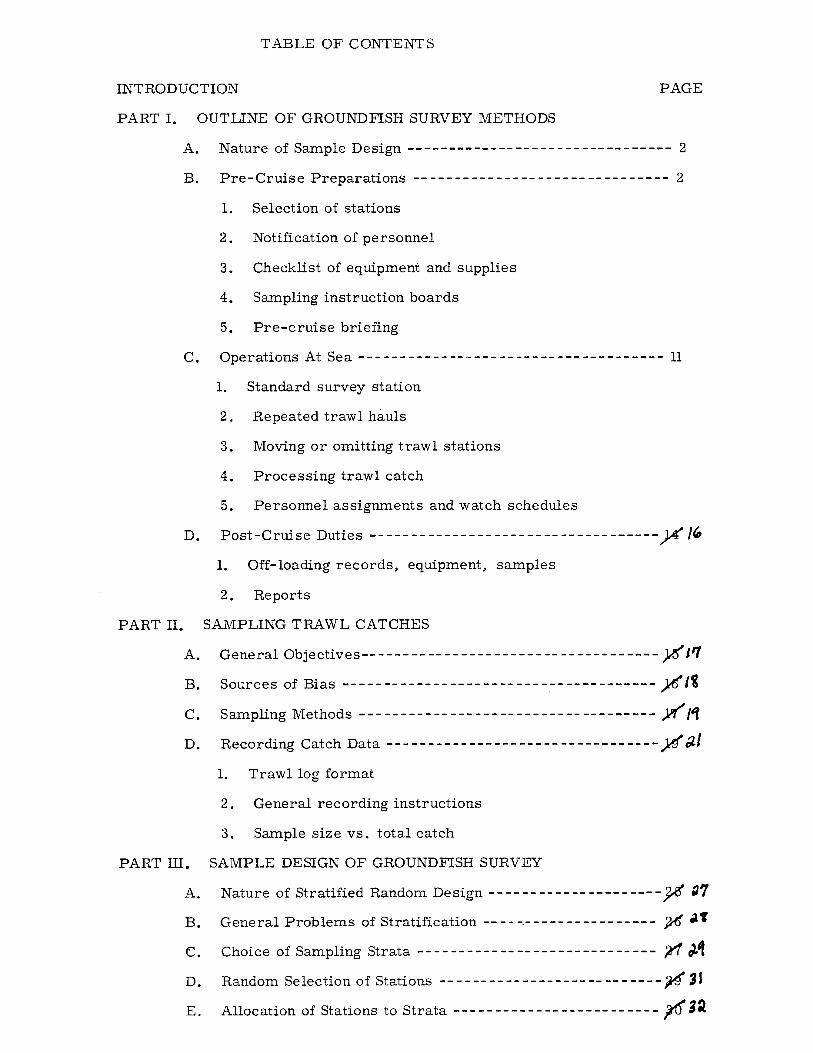
TABLE OF CONTENTS
INTRODUCTION PAGE
PART I. OUTLINE OF GROUNDFISH SURVEY METHODS
A. Nature of Sample Design -------------------------------- 2
B. Pre-Cruise Preparations -- -- - -- -- - - -- -- -- - - -- -- -- - - -- -- 2
1. Selection of stations
2. Notification of personnel
3. Checklist of equipment and supplies
4. Sampling instruction boards
5. Pre-cruise briefing
C. Operations At Sea ------------------------------------- 11
1. Standard survey station
2. Repeated trawl hauls
3. Moving or omitting trawl stations
4. Processing trawl catch
5. Personnel assignments and watch schedules
D. Post-Cruise Duties -----------------------------------y '" 1. Off-loading records, equipment, samples
2. Reports
PART II. SAMPLING TRAWL CATCHES
A. General Objectives------------------------------------ )l5'1'1
B. Sources of Bias -------------------------------------- ~/~
C. Sampling Methods ------------------------------------ )!f'1'i
D. Recording Catch Data --------------------------------- y.f Oll
1. Trawl log format
2. General recording instructions
3. Sample size vs. total catch
PART III. SAMPLE DESIGN OF GROUNDFISH SURVEY
A. Nature of Stratified Random Design ---------------------~ ~7
B. General Problems of Stratification -- -- -.- - - -- -- -- -- -- --- p6 .at
C. Choice of Sampling Strata ----------------------------- ;rl ~1
D. Random Selection of Stations -- - - -- -- -- -- ------ -- -- - --- - rt JI
E. Allocation of Stations to Strata ------------------------- ,c1'iQ.
GROUNDFISH SURVEY METHODS
by
M. D. Grosslein
Bureau of Commercial Fisheries, Biological Laboratory
Woods Hole, Massachusetts
INTRODUCTION
Since 1963 otter trawl surveys in New England waters have been
conducted regularly (at least once each fall) by the research vessel
Albatross IV.!..! These surveys have been a major part of the Laboratory's
field program with the principal objectives of determining factors controlling
groundfish distribution and abundance, and assessing fish production
potential of all groundfish species.
An important characteristic of Albatross IV groundfish surveys is
that sampling procedures have been reasonably consistent thus making
results of all the surveys comparable. However details of the methods used
had not been documented previously, and a reference manual was needed to
help maintain standardization as well as for training new people.
This report is divided into the following three parts:
I. Outline of groundfish survey procedures
II. Methods of sampling trawl catches
III. Survey sampling design
Part I is intended only as an outline with chief emphasis on the more import-
ant steps in planning and conducting a groundfish survey, and including very
brief descriptions of the topics in Parts II and III. If only a general under
standing of the survey is desired, Part I will suffice. Parts II and III go
into some detail on methods of sampling catches and recording catch data
at sea, and the rationale underlying the basic sample design. Eventually
it may be desirable to expand Parts I and II into a more complete field
manual. Basic features of Parts II and III are being incorporated into a
paper for publication.
1/ Otter trawl surveys were also made during the period 1948-1962, but
these surveys had variable objectives, used different ships and methods,
and in many instances had incomplete catch records. See Laboratory
Report # 69-4 for details.
- 1 -
PART I
OUTLINE OF GROUNDFISH SURVEY PROCEDURES
A. Nature of Sample Design
The basic sample design is the well known stratified random sampl
ing design which is widely used for sample surveys in general. The prin
cipal operational features as applied to our groundfish survey are:
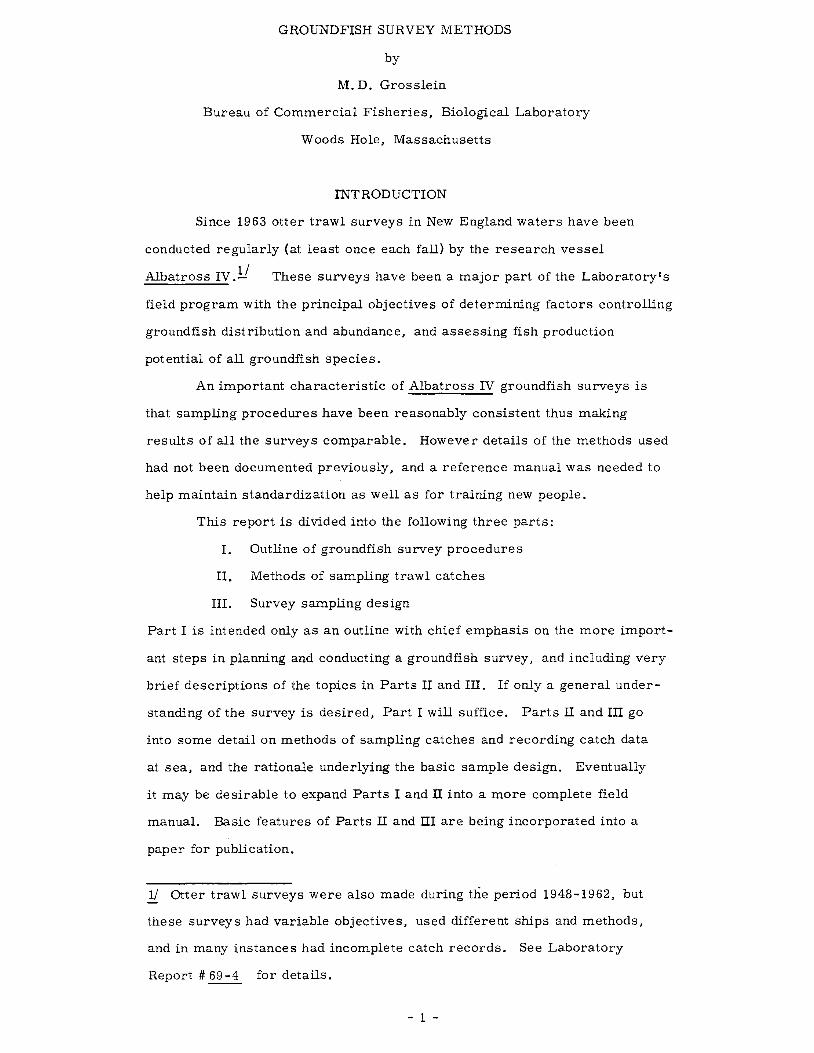
1) The continental shelf inside 200 fathoms from Cape Hatteras
to western Nova Scotia is subdivided into 58 sampling
strata which correspond to geographic and hydrographic
subdivisions which are significantly related to fish
distribution (Fig. 1).
2) Locations of trawl stations are randomly pre-selected
within each stratum.
3) A total of approximately 270 stations are occupied in
the entire survey area (about 75,000 square miles
including non-trawable areas) which is roughly one
station per 300 square miles.
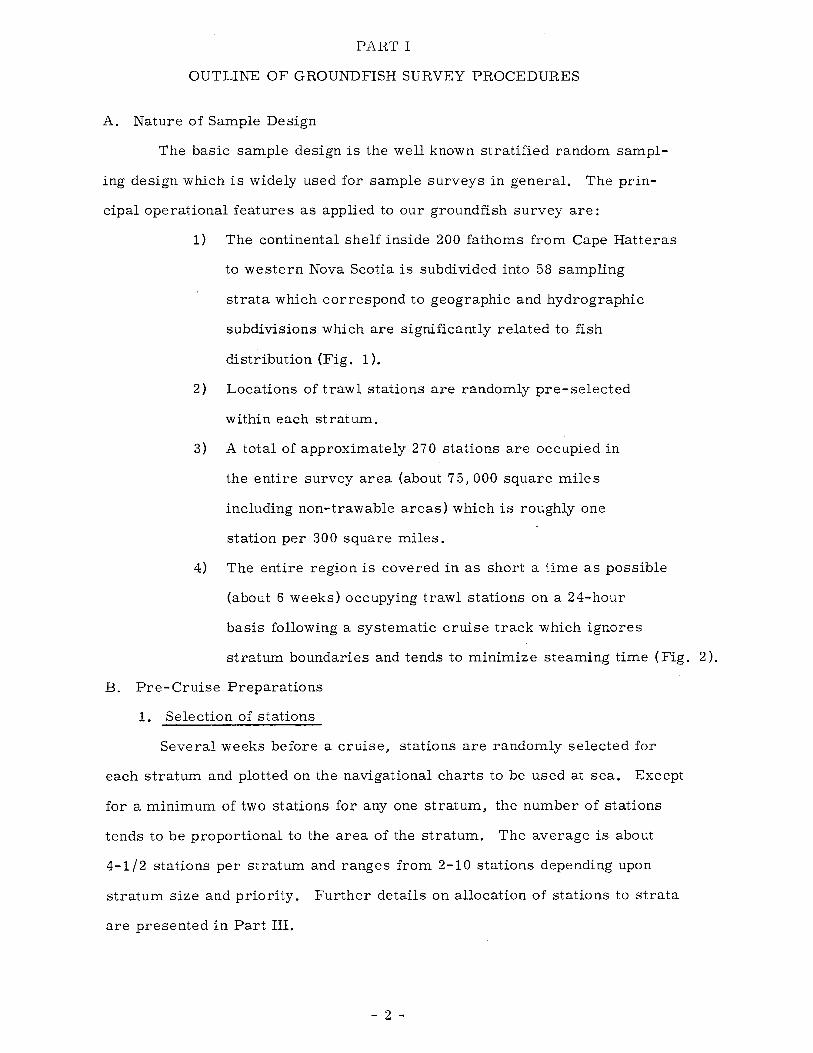
4) The entire region is covered in as short a time as possible
(about 6 weeks) occupying trawl stations on a 24-hour
basis following a systematic cruise track which ignores
stratum boundaries and tends to minimize steaming time (Fig. 2).
B. Pre-Cruise Preparations
1. Selection of stations
Several weeks before a cruise, stations are randomly selected for
each stratum and plotted on the navigational charts to be used at sea. Except
for a minimum of two stations for anyone stratum, the number of stations
tends to be proportional to the area of the stratum. The average is about
4-1/2 stations per stratum and ranges from 2-10 stations depending upon
stratum size and priority. Further details on allocation of stations to strata
are presented in Part III.
- 2 -
"
8-8 I _
ID 1\
[J.'.' fl.·. " .. IU mfJ
.~
Figure l. --Sampling strata of groundfish survey by Bureau of Commercial
Fisheries, Biological Laboratory, at Woods Hole, Massachusetts.
>w > a::: :::> Cf)
I Cf)
lI... o Z :::> a a::: (!)
> Cf) Cf)
a a::: ~ (D -.J <r
<r ra <.) Cf)
~ a z a r-Cf)
<r a::: w r-~ I
w a.. <r <.)
f"-~ (J)
0 w 0
I
1-= <.) a
Figure 2. --Distribution of trawl stations on a groundfish survey.
Random selection of stations is accomplished by means of a table of
random numbers and a full scale master chart (on tracing paper) of each
stratum, subdivided into consecutively numbered blocks of standard size
(see Part III). Selected stations are plotted on the master charts with
removable drafting symbols, and then transferred (along with stratum
boundaries) to the corresponding navigation charts (current edition) using
each master chart as an underlay on a light table. Stations are numbered
consecutively within each stratum (in sequence from south to north for
convenience) and these same numbers eventually are used to identify the
station within a stratum on cards containing catch data, regardless of the
sequence in which the stations actually were occupied. On the cruise, a
sequential haul number (from 1-270, say) is recorded on each trawl log in
addition to the stratum - tow number.
Random selection of stations in certain very narrow deep strata along
the edge of the shelf is actually a two-stage process both ashore and at sea.
That is, a station is first located with respect to latitude and longitude and
then a specific trawling depth is selected. The second step is necessary
because the deSign specifies that trawling be done along depth contours, and
navigation alone is not sufficiently accurate to pinpoint a depth contour along
a steep edge (see Part III). As an example, for a stratum in the 100-200
fathom zone, one of four depth intervals (101-125, 126-150, 151-175, 176-200
fathoms) is randomly selected for each station in the stratum. Selections
are without replacement since no more than 3 stations are allocated to such
narrow strata. The selected trawling depth interval is recorded beside the
station on the navigation chart for convenient reference at sea.
2. Notification of personnel
People outside the Laboratory often partiCipate in the scientific party
on survey cruises. Consequently making up a scientific party involves
considerable communication via phone calls and letters, and it should be
done well in advance to permit time for assembling materials for collecting
samples at sea. Also there are a number of different people within the
laboratory in charge of the various kinds of equipment used routinely on the
groundfish surveys, and the cruise coordinator or chief scientist should
check with these individuals well in advance of a cruise. For all types of
- 5 -
cruises including surveys, official written sailing orders are prepared shortly
before sailing, giving a final list of cruise personnel and a description of the
general cruise plan including type of time to be used (i. e. daylight saving vs.
standard).
3. Checklist of survey equipment and supplies
The following checklist contains the major categories of equipment and
supplies which must be provided or at least checked by scientific personnel
before sailing time. A more detailed checklist, particularly of miscellaneous
supply items, is filed in the groundfish survey project.
a. Standard Survey Trawl. The specifications of the trawl used on all
Albatross IV surveys is described here for the first time (Figure 3, Table 1).
Prior to each survey it is mandatory that the cruise coordinator and the
mate in charge of trawl gear, compare assembled trawls with the standard
specifications. Experience indicates it is far too easy for undesirable
modifications to slip in as a result of temporary repairs becoming "permanent",
or because of a lack of proper spare net sections or other parts, changes in
crew, etc ..
b. Other Nets. Currently the only other biological sampling gear used
routinely on groundfish surveys are Bongo plankton nets, 8" in diameter
(. 03m2) with. 505 mm mesh, and towed with a 4' V-fin depressor. This gear
is described by Posgay (ICNAF Res. Doc. # 68-85, 1968).
c. Instrumentation. Basic ,instruments used on routine surveys are
bathythermographs (mechanical and expendable), echo sounders (Elac and
Simrad, the latter connected to Precision Graphic Recorder, all in Sonar
room for use by biologists), a salinity-depth-temperature recorder, and
miscellaneous minor instruments such as thermometers, stop watches,
odometers, counters, etc.. All of these instruments require maintenance,
and their condition (including supplies of slides for BT's and paper for
sounders)should be checked before each cruise.
d. Paper Supplies. A variety of field logs, data sheets, paper
envelopes and labels, cardboard boxes, and recorder paper (echo sounders)
are used for recording data and preserving samples.
- 6 -
...J
~ a:: ......
lJ..en 00 20 =>0 0;: a:: (!) u.:OU a:: m <I: o Z
~ en
o~
o~
00 oz LlW
f------ t>9-----t-- g£ + ~£ -+- Og --1--- Og --1
CJ)
W :1:0 CJ)z
W::> ~O ocr 00«
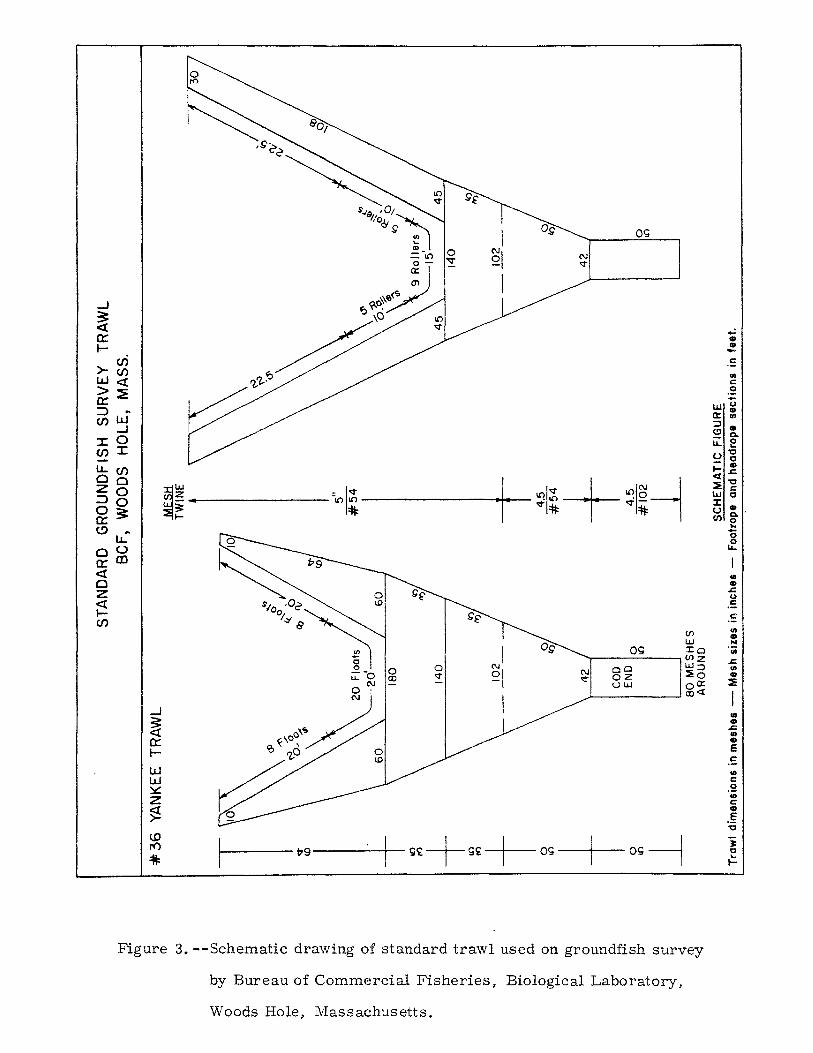
Figure 3. --Schematic drawing of standard trawl used on groundfish survey
by Bureau of Commercial Fisheries, Biological Laboratory,
Woods Hole, Massachusetts.
..: • • -c
.. • .s::. u c:. c .., • N ';;; .s::. .., • ::IE
I .. • .s::. .. • e .: .. c .2 .. c • .S "0
J: 0 .... I-
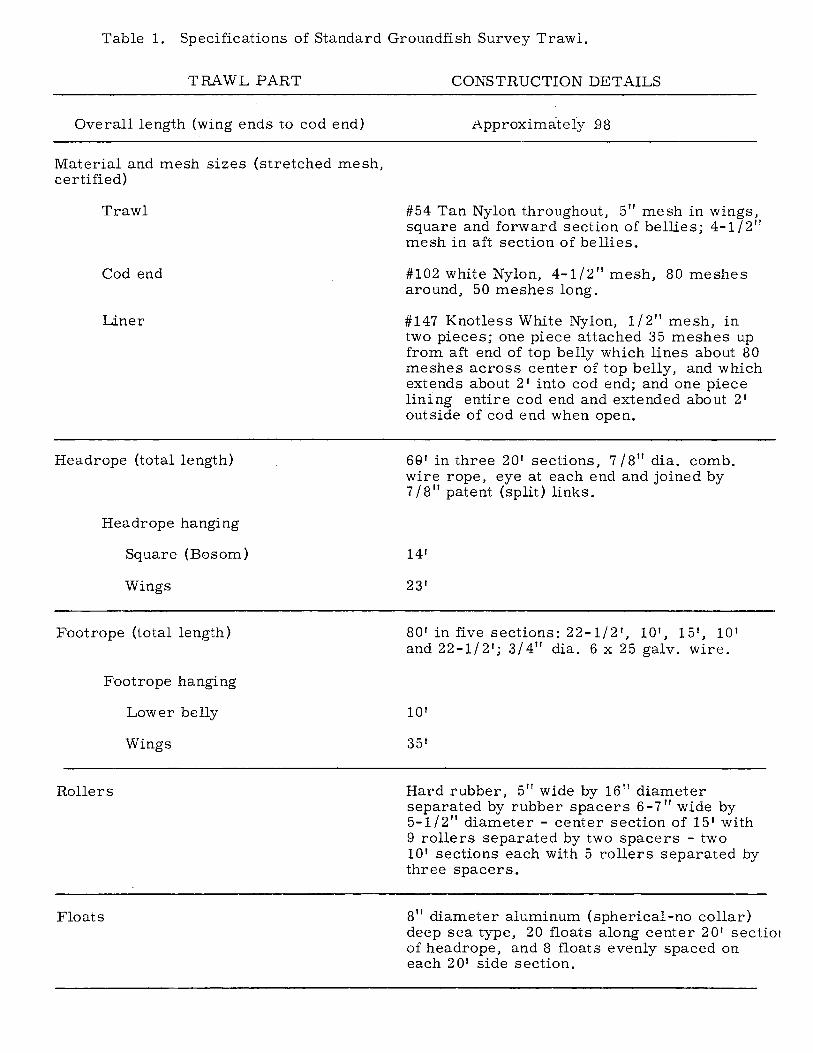
Table 1. Specifications of Standard Groundfish Survey Trawl.
TRAWL PART
Overall length (wing ends to cod end)
Material and mesh sizes (stretched mesh, certified)
Trawl
Cod end
Liner
Headrope (total length)
Headrope hanging
Square (Bosom)
Wings
Footrope (total length)
Footrope hanging
Lower belly
Wings
Rollers
Floats
CONSTRUCTION DETAILS
Approximately .98
#54 Tan Nylon throughout, 5" mesh in wings, square and forward section of bellies; 4-1/21! mesh in aft section of bellies.
#102 white Nylon, 4-l/21! mesh, 80 meshes around, 50 meshes long.
#147 Knotless White Nylon, 1/2" mesh, in two pieces; one piece attached 35 meshes up from aft end of top belly which lines about 80 meshes across center of top belly, and which extends about 2' into cod end; and one piece lining entire cod end and extended about 2' outside of cod end when open.
69' in three 20' sections, 7/8" dia. comb. wire rope, eye at each end and joined by 7/8" patent (split) links.
14'
23'
80' in five sections: 22-1/2', 10', 15', 10' and 22 -1 /2'; 3/4" dia. 6 x 25 gal v. wire.
10'
35'
Hard rubber, 51! wide by 16" diameter separated by rubber spacers 6 -7" wide by 5-1/2" diameter - center section of 15' with 9 rollers separated by two spacers - two 10' sections each with 5 rollers separated by three spacers.
8" diameter aluminum (spherical-no collar) deep sea type, 20 floats along center 20' sectiol of headrope, and 8 floats evenly spaced on each 2 A' side section.
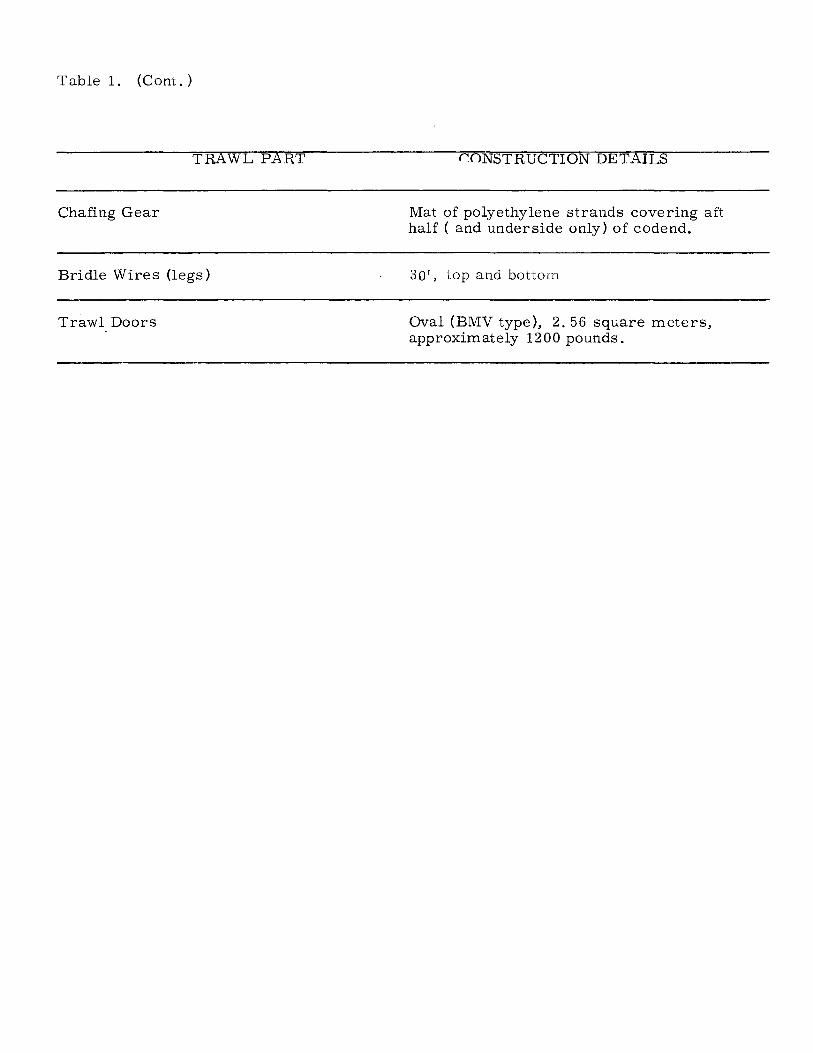
Table 1. (Cont.)
TRAwL pART
Chafing Gear
Bridle Wires (legs)
Trawl Doors
r.ONSTRUCTION DETAILS
Mat of polyethylene strands covering aft half ( and underside only) of codend.
30', top and bottom
Oval (BMV type), 2.56 square meters, approximately 1200 pounds.
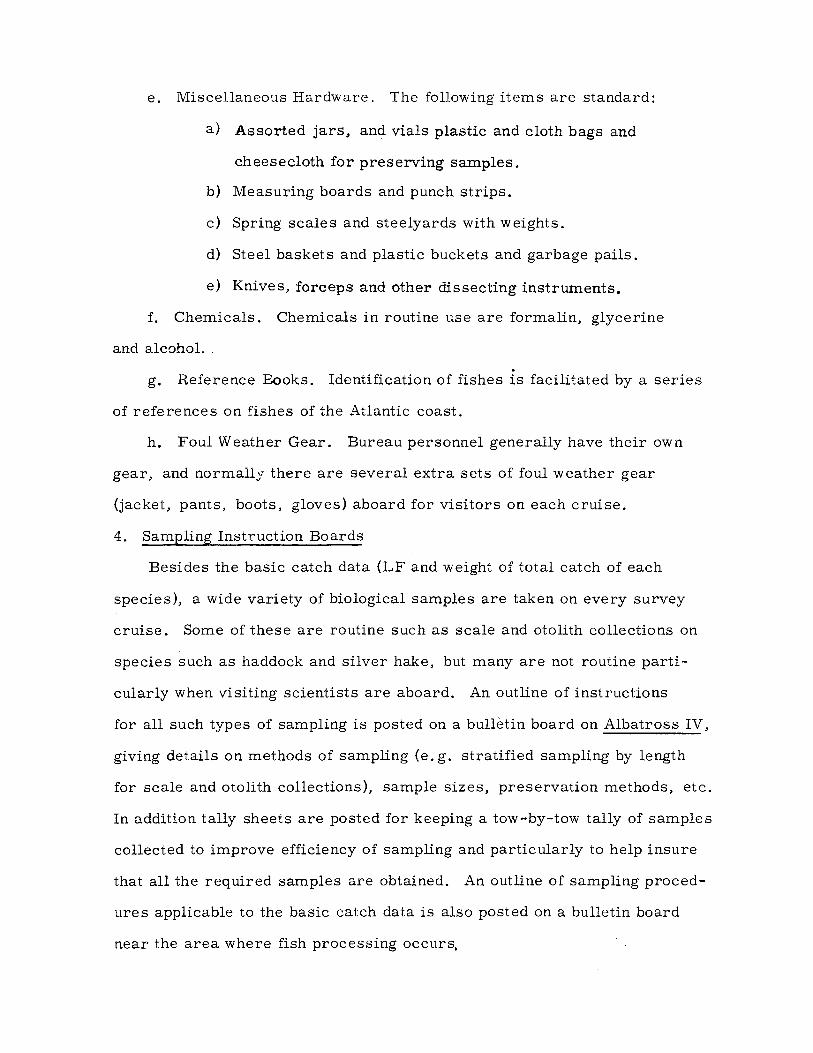
e. Miscellaneous Hardware. The following items are standard:
a) Assorted jars, and vials plastic and cloth bags and
cheesecloth for preserving samples.
b) Measuring boards and punch strips.
c) Spring scales and steelyards with weights.
d) Steel baskets and plastic buckets and garbage pails.
e) Knives, forceps and other dissecting instruments.
f. Chemicals. Chemicals in routine use are formalin, glycerine
and alcohol. .
g. Reference Books. Identification of fishes is facilitated by a series
of references on fishes of the Atlantic coast.
h. Foul Weather Gear. Bureau personnel generally have their own
gear, and normally there are several extra sets of foul weather gear
(jacket, pants, boots, gloves) aboard for visitors on each cruise.
4. Sampling Instruction Boards
Besides the basic catch data (LF and weight of total catch of each
species), a wide variety of biological samples are taken on every survey
cruise. Some of these are routine such as scale and otolith collections on
species such as haddock and silver hake, but many are not routine parti
cularly when visiting scientists are aboard. An outline of instructions
for all such types of sampling is posted on a bulletin board on Albatross IV,
giving details on methods of sampling (e. g. stratified sampling by length
for scale and otolith collections), sample sizes, preservation methods, etc.
In addition tally sheets are posted for keeping a tow-by-tow tally of samples
collected to improve efficiency of sampling and particularly to help insure
that all the required samples are obtained. An outline of sampling proced
ures applicable to the basic catch data is also posted on a bulletin board
near the area where fish processing occurs,

5. Pre-Cruise Briefing
A pre-cruise briefing is necessary, preferably the day before sailing.
The vessel Captain and mates, electronic technicians, and the entire
scientific party should be present. Our experience shows that even routine
procedures must be reviewed. An outline of a typical briefing is as follows:
a.. General Cruise Plan
1) Principal objectives of cruise
2) Proposed cruise track and return date (ETA)
3) Radio communication schedule
4) Time to be used (daylight saving or standard)
5) Miscellaneous
b. Operations by Officers and Crew
1) Review specifications of gear to be used including rigging
and handling.
2) Describe any new data or data forms to be recorded or used
by ship's officers.
3) Review basic requirements of sample design with respect to
depths of stations relative to stratum boundaries and depth
intervals within strata along shelf.
c. Operations by Scientific Party
1) Review all types of data to be collected, and kinds of records
to be kept.
2) In particular review procedures for processing trawl catches
including methods of sampling catches and recording basic
catch data on trawl logs (see item ~ in next section and
Part II).
C. Operations At Sea
1. Standard Survey Station
A standard survey station consists of a bathythermograph cast
{surface to bottom} followed by a 3~-minute haul with the survey trawl at
3.5 knots (speed through the water as indicated by ship's magnetic log).
The haul commences when sufficient wire has been payed out to obtain the
desired scope (3:1 except in water::> 150 fathoms when use 2-1/2:1), and
-11-
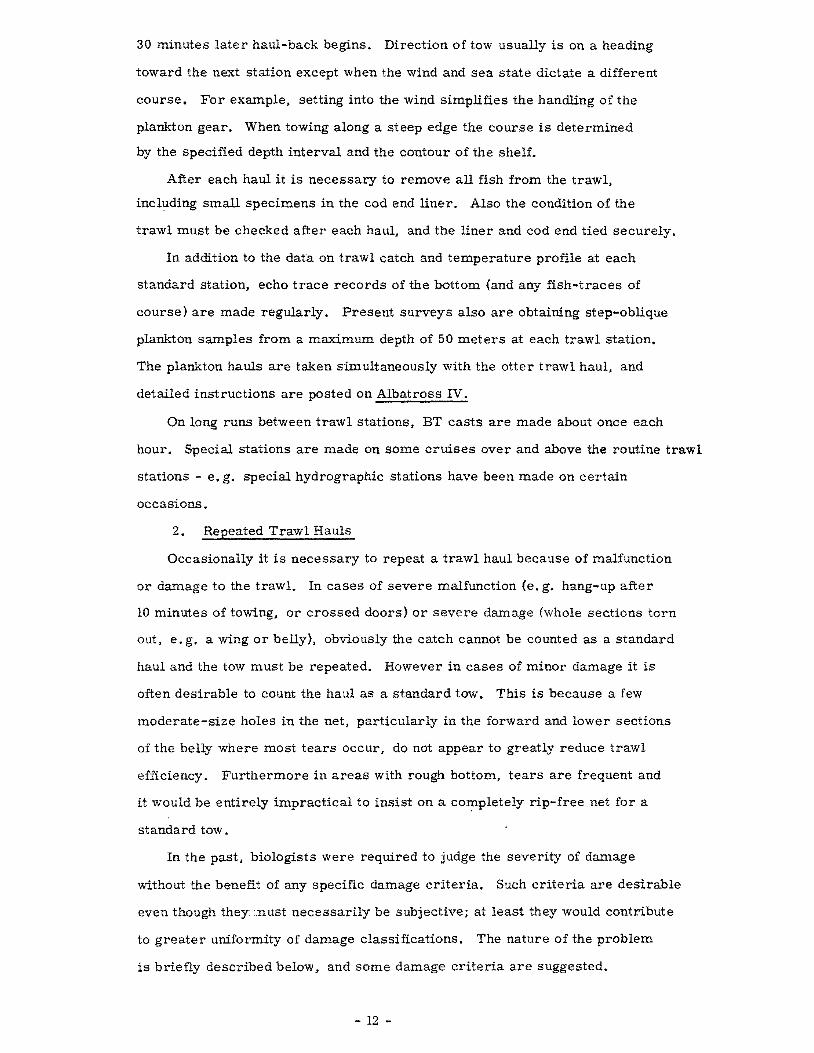
30 minutes later haul-back begins. Direction of tow usually is on a heading
toward the next station except when the wind and sea state dictate a different
course. For example, setting into the wind simplifies the handling of the
plankton gear. When towing along a steep edge the course is determined
by the specified depth interval and the contour of the shelf.
After each haul it is necessary to remove all fish from the trawl,
including small specimens in the cod end liner. Also the condition of the
trawl must be checked after each haul, and the liner and cod end tied securely.
In addition to the data on trawl catch and temperature profile at each
standard station, echo trace records of the bottom {and any fish-traces of
course} are made regularly. Present surveys also are obtaining step-oblique
plankton samples from a maximum depth of 50 meters at each trawl station.
The plankton hauls are taken simultaneously with the otter trawl haul, and
detailed instructions are posted on Albatross IV.
On long runs between trawl stations, BT casts. are made about once each
hour. Special stations are made on some cruises over and above the routine trawl
stations - e. g. special hydrographic stations have been made on certain
occasions.
2. Repeated Trawl Hauls
Occasionally it is necessary to repeat a trawl haul because of malfunction
or damage to the trawl. In cases of severe malfunction (e. g. hang-up after
10 minutes of towing, or crossed doors) or severe damage (whole sections torn
out, e. g. a wing or belly), obviously the catch cannot be counted as a standard
haul and the tow must be repeated. However in cases of minor damage it is
often desirable to count the haul as a standard tow. This is because a few
moderate-size holes in the net, particularly in the forward and lower sections
of the belly where most tears occur, do not appear to greatly reduce trawl
efficiency. Furthermore in areaS with rough bottom, tears are frequent and
it would be entirely impractical to insist on a co~pletely rip-free net for a
standard tow.
In the past, biologists were required to judge the severity of damage
without the benefit of any specific damage criteria. Such criteria are desirable
even though they.uust necessarily be subjective; at least they would contribute
to greater uniformity of damage classifications. The nature of the problem
is briefly described below, and some damage criteria are suggested.
- 12 -
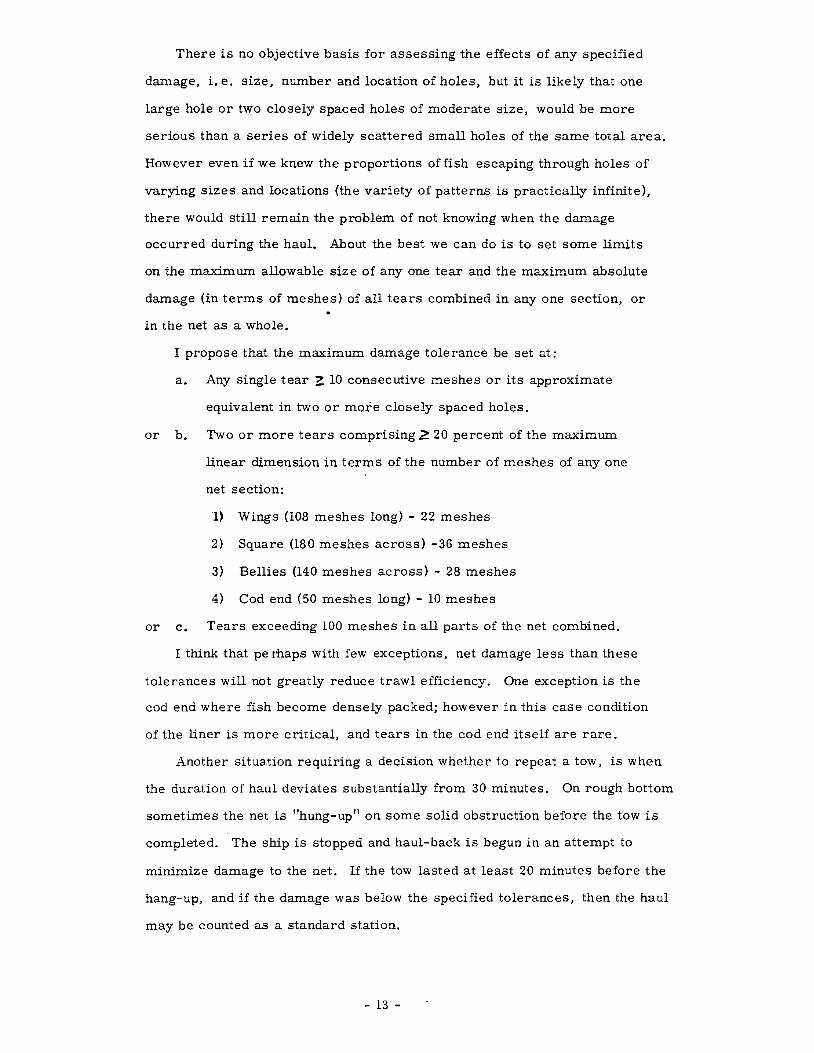
There is no objective basis for assessing the effects of any specified
damage, i. e. size, number and location of holes, but it is likely that one
large hole or two closely spaced holes of moderate size, would be more
serious than a series of widely scattered small holes of the same total area.
However even if we knew the proportions offish escaping through holes of
varying sizes and locations (the variety of patterns is practically infinite),
there would still remain the problem of not knowing when the damage
occurred during the haul. About the best we can do is to set some limits
on the maximum allowable size of anyone tear and the maximum absolute
damage (in terms of meshes) of all tears combined in anyone section, or
in the net as a whole.
r propose that the maximum damage tolerance be set at:
a. Any single tear Z 10 consecutive meshes or its approximate
equivalent in two or more closely spaced holes.
or b. Two or more tears comprising;2 20 percent of the maximum
linear dimension in terms of the number of meshes of anyone
net section:
1) Wings (l08 meshes long) - 22 meshes
2) Square (180 meshes across) -36 meshes
3) Bellies (140 meshes across) - 28 meshes
4) Cod end (50 meshes long) - 10 meshes
or c. Tears exceeding 100 meshes in all parts of the net combined.
I think that pe rhaps with few exceptions, net damage less than these
tolerances will not greatly reduce trawl efficiency. One exception is the
cod end where fish become densely packed; however in this case condition
of the liner is more critical, and tears in the cod end itself are rare.
Another situation requiring a decision whether to repeat a tow, is when
the duration of haul deviates substantially from 30 minutes. On rough bottom
sometimes the net is "hung-up" on some solid obstruction before the tow is
completed. The ship is stopped and haul-back is begun in an attempt to
minimize damage to the net. If the tow lasted at least 20 minutes before the
hang-up, and if the damage was below the specified tolerances, then the haul
may be counted as a standard station.
- 13 -
On rare occasions the duration of haul may exceed 30 minutes because
of malfunction of the winch. In such cases, the haul may be counted as a
standard station providing it does not exceed 40 minutes, and of course
assuming any damage is below the tolerance level.
3. Moving or Omitting Trawl Stations
Under normal circumstances trawl stations may be moved or omitted
only after consultation with the scientist in charge. Stations should not be
moved without good reasons (e. g. the location is judged too close to some
charted obstruction, or the haul results in severe damage to the net). If a
station is moved it should be located nearby in the same sampling stratum
and at the same depth as the original station. If a second haul at a station
(or near vicinity) results in above-tolerance damage then a new location
should be tried (along the track to the next station) in the same stratum, or
else the station should be dropped entirely.
Occasionally it will be necessary to drop stations without a trial haul
in order to meet a cruise schedule, depending upon priorities and circum
stances applicable to individual cruises. The only guidelines are that there
must be at least two stations per stratum, and stations with high probability
of tear-up generally are dropped first.
4. Processing Trawl Catches
a. Data collected. The minimum routine data obtained on trawl catches
is the total weight and length frequency of each finfish species in the catch,
plus scale or otolith samples for a few important commercial species
(particularly haddock). A few invertebrates (lobsters, shrimp, scallops, and
squid) are also recorded routinely. Depending upon specific data requests
and availability of personnel, other common kinds of samples or observations
include:
1) stomach contents
2) frozen or preserved specimens
3) parasites
4) gonads
5) meristic or morphological observations
- 14 -
b. Routine Processing Methods. The catch is dumped into a waist-high
checker (box about 4 x 8 x 11 slotted at one end) from which fish are either
picked out or pushed through the slot, and placed in steel baskets of 1 and 2
bushel capacity, usually sorted by species. The catch of each species or
sample of it IS weighed to the nearest whole pound on a simple balance (steel
yard) which swings free from a single point of attachment. The accuracy of
this method is to within 10 percent for 10 lb. of fish or more in any Single
basket, but the accuracy is within only 25 percent for less than about 10
pounds of fish. Therefore, small catches are usually weighed in a small
plastic pail ona simple spring scale which is hand-held.
Measuring boards (some fitted with punch strips for large numbers of
fish) are used for obtaining length frequencies to the nearest whole centimeter
as described by McDermott (1962). l:.J Fork lengths are used except where
not applicable, and then total length is recorded. Carapace lengths are
taken for lobsters, mantle lengths for squid, wing-width for rays, and shell
lengths for scallops; shrimp are weighed only.
Whenever practical, the entire catch of each species is weighed and
measured. When sampling is employed, we try to meet the following three
requirements:
1) obtain a representative sample of each species
2) obtain a sample large enough for a good estimate of total weight
and length frequency of each species.
3) clearly indicate size of sample (weight, volume, number) relative
to the total catch
Further details on sampling trawl catches and recording catch data are
presented in Part II.
::J McDermott, J. P. 1962. Aluminum punch strip method for measuring
fish. Progressive Fish-Culturist. vol. 24, no. 2, p. 87.
- 15 -
5. Personnel Assignments and Watch Schedules
The deck crew and the scientific party are on a 6-hours on and 6-hours
off watch schedule, and operations continue around the clock with each man
working 12 out of every 24 hours. On each watch there are 4 deck crewmen
and usually 3 or 4 members of the scientific party. The crew assists biolo
gists with processing catches (chiefly weighing and me asuring fish) when
possible, and an average catch (under 2, 000 pounds) can be weighed and
measured in about 30 minutes. As with any such operation, maximum
efficiency is achieved when each individual has a specific set of duties at each
station. This practice is followed on surveys routinely except when training
new people.
The chief of the scientific party has the responsibility for general conduct
of the survey, and except for cases which in the Captain's judgement involve
the safety of personnel or the vessel, the chief scientist must approve any
departures from the general cruise plan. The scientist in charge of each
watch directs the survey operations on his watch, and his most important
responsibilities are to insure that the condition and handling of gear are
standard, and to supervise the sampling of trawl catches.
D. Post-Cruise Duties
1) Off-loading records, samples, equipment
The Chief Scientist and (or) technical personnel in charge of special
gear and equipment are responsible for proper disposition of equipment and
biological samples at the end of a cruise.
2) Post-Cruise Reports
A post-cruise meeting is desirable immediately after the ship docks,
including laboratory head, chief scientist and ship's Captain, particularly
if there are problems requiring immediate attention. Also the Chief Scientist
submits a written checklist to the vessel-coordinator regarding maintenance
problems with scientific equipment and q~arters. Within a few days, the Chief
Scientist submits a written cruise report describing the general conduct of the
cruise, preliminary results, and any departures from standard procedures
which could significantly affect the data.
- 16 -
PART II
SAMPLING TRAWL CATCHES
A. General Objectives
In Part II we are concerned chiefly with the basic routine catch data,
L e. weight and length frequency of each species in each catch. The major
work of the survey is to accurately record these quantities for each
haul. For the majority of hauls this is accomplished simply by weighing
and measuring practically the entire catch of each species. This is feasible
because most catches with the #36 trawl are considerably smaller than the
capacity of the checker (about 2,000 lb). These can be processed entirely
within a half-hour, with sampling restricted to a length frequency sample
of only 1 or 2 abundant species.
Sampling is employed whenever a sufficiently accurate estimate of
the length frequency or weight of a catch can be obtained with measurements
on substantially less than the total number of individuals in the catch. Specify
ing the actual precision required is a very complicated problem,
and determining the precision actually obtained with various size samples is
also somewhat involved. Suffice to say here that we consider it desirable
to be within a few percent of the true proportion of lengths in each centimeter
interval for a single catch of a single species. Since there is considerable
variability among catches even within a single stratum, we can ill afford
to add further variability by inadequate sampling if we hope to measure
differences among strata particularly with respect to size composition.
Our information on the relation between precision and sample size
is far from complete but our preliminary decisions on sample sizes required
to approach the desired level of precision stated above, are outlined in the
next section. Further treatment of the general problem of preciSion will
appear in a later report.
Note that age-length data are also collected routinely, and not in
frequently other important data are obtained on surveys, e. g. stomach contents
and gonad conditions. Usually the needs of these types of data can be met
with relatively small stratified subsamples of the samples required for
estimating total length frequency. Proper expansion of stratified estimates
- 17 -
of course depends upon knowledge of the total length frequency distribution,
and this is another reason for being concerned with precision of overall
size composition.
B. Sources of Bias
Basic to all sampling methods is the requirement that the sample
be unbiased, i. e. representative of the catch. There is a possibility of
a biased sample if when the catch is dumped onto the deck or into the
checker there is a different composition on one side of the pile or checker
as compared with the other side. We have not attempted to study the
actual distribution of fish on deck or in the checker, but have generally
observed the fish to be rather evenly mixed in most cases. Nevertheless,
when taking samples without first sorting by species we routinely take a
systematic sample, i. e. spread the sample baskets more or less evenly
throughout the pile or checker, thereby guarding against gross bias from
an uneven distribution within the pile.
Another potential source of bias is in the purposeful selection of
individual fish when filling sample containers by hand, as when sorting a
catch by species before sampling. The well known subconscious tendency
to select larger individuals first must be avoided. We do this by instructing
every person involved in sorting catches to sort every fish (and all species)
in a given section of the pile or checker before moving on to a new section.
This procedure is believed to provide an adequate safeguard against bias,
and is elaborated on below.
Finally it is important to remember that when any portion of the catch
is discarded, it is essential to fill all baskets evenly. This should be an
obvious requirement but it can be overlooked since discards are the excep
tion rather than the rule. It is the responsibility of the scientist in
charge of each watch to supervise all pro~essing of the catch.
C. Sampling Methods
1. Sampling sorted catches.
The catch is first sorted by species in practically every case where
sampling is employed. Species are sorted into baskets taking care that
size selection is avoided; as noted above this is done by each sorter
picking up all fish in his section of a pile or checker, regardless of size,
and tossing them into appropriate nearby baskets. Our experience has
indicated no marked tendency for anyone species to be unevenly distri
buted in the checker (or pile) according to size of fish. Therefore the
possibility of bias through choice of sample baskets is not great, and in any
case could be avoided by taking baskets of the same species from different
parts of the checker.
After sorting, the total catch of each species is weighed except in
cases where it is desirable to weigh (and measure) only a sample. In the
latter case a representative sample of the catch is saved and the remainder
discarded (neither weighed nor measured). Prior to any discard it is of
course necessary to make a judgement as to the size of sample needed for
estimating weigh~ of discard and length frequency for the species in question.
With respect to estimating weight of discard I recommend a minimum of
three volumetric units (more for larger species) in the weighed sample for
computing average weight per unit. The number of discarded volumetric
units must be counted of course, and all units. both discard and sample,
must be evenly filled. Partially filled baskets may form part of a length
frequency sample but should not be used for estimating weight of discard.
In certain cases (large species such as dogfish) it is more efficient to
sample and discard individual fish rather than baskets; the same principles
apply.
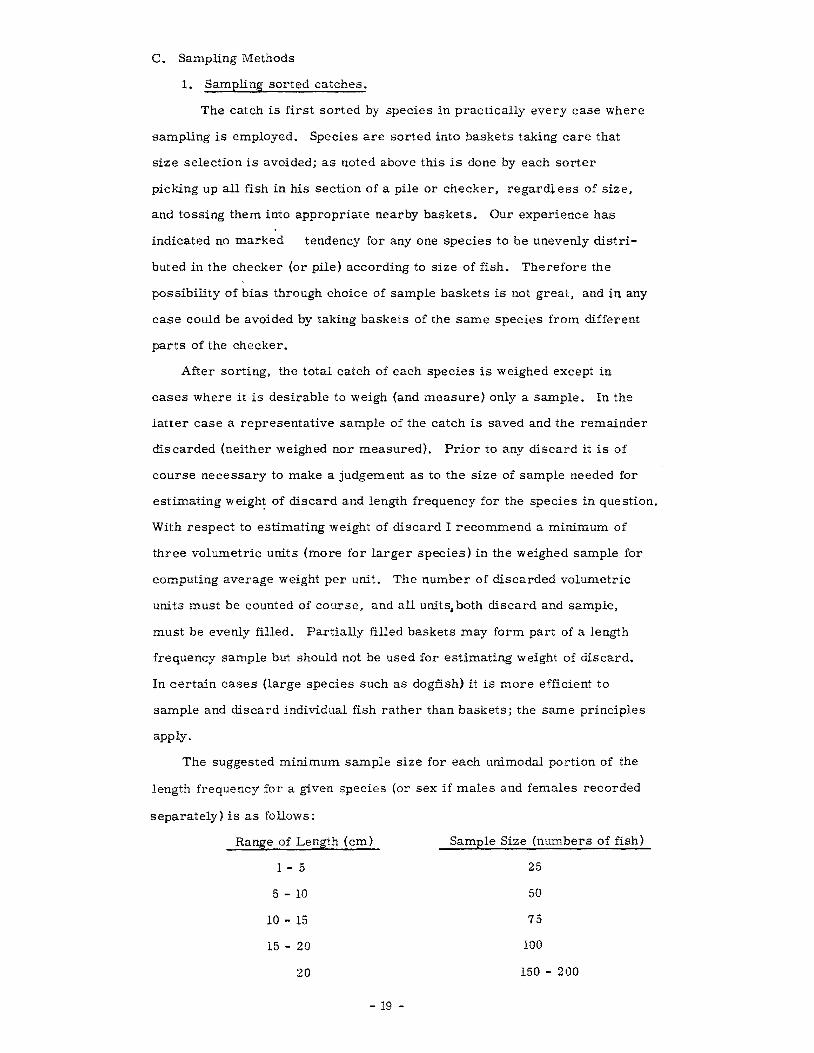
The suggested minimum sample size for each unimodal portion of the
length frequency for a given species (or sex if males and females recorded
separately) is as follows:
Range of Length (cm)
1 - 5
5 - 10
10 - 15
15 - 20
20
- 19 -
Sample Size (numbers of fish)
25
50
75
100
150 - 200
It will be noted that assuming lengths were uniformly distributed throughout
their range, the above sample size would provide 5 fish in each cm
interval on the average (except for ranges ::::020 cm where the frequency
would be less per cm interval). However as is well known, length
frequencies usually approximate a normal distribution, and therefore the
above sample sizes result in considerably more than 5 fish per cm interval
near the center of the distribution, and fewer than 5 per cm interval in
the tails of the distribution. It is felt that the above sampling rates give
adequate descriptions of length frequencles.
A rough guide for estimating approximate numbers of fish per (bushel)
basket is shown below:
Average Size Fish (cm)
20
30
40
50
Approximate No. in 1 bushel
200 +
100 +
50
25
Obviously numbers per bushel vary with shape, spines, etc. as well as
length, and therefore this is only a crude guide.
Note that weight rather than volume is the preferred unit for
indicating size of a length frequency sample, because it is a more accurate
measure than an eyeball-estimate of the degree of fullness of a container.
However for very small fishes (e. g. squid 1-3 cm) an adequate length
frequency sample may be too small to weigh and in this case a volumetric
unit (pint jar, say) must be used to indicate size of sample or subsample.
This requires that the number of volumetric sample (or subsample) units
per catch (or large volumetric unit) be determined. For example a catch
of 3-1/2 gallon (pails) of small squid may require only a length frequency
sample of 1 pint; the number of full pints per gallon pail must be determined
to provide a basis for expanding the sample length frequency.
- 20 -
2. Sampling Unsorted Catches
It is desirable to sample an unsorted catch when the catch (or portion
of it) is very large and is predominantly composed of two or more species
that are roughly the same size. In such cases fish are not handled individu
ally but are scooped up with shovels or pushed through the slot at the end
of the checker into baskets, and a systematic sample of baskets is taken
in accord with the guidelines described above. Usually a mixed (unsorted)
sample of at least 6 bushels should be set aside to insure adequate length
frequency samples for all species. Sample bushels are weighed individu
ally in the mixed condition to provide a basis (average weight per basket)
for estimating discard weight as before.
Usually there are a relatively few large fish (cod, skates, etc.
which are large relative to baskets) mixed in with the smaller fish. These
are removed and processed in entirety to avoid the potentially large
variations contributed by the effect of just one large fish on the contents
of a single basket.
After weighing, the unsorted sample is sorted, and reweighed by
individual species, and finally the sample of each species is measured.
If only a subsample is measured, then the weight (or relative volume for
very small fishes) of subsample must be determined also.
D. Recording Catch Data
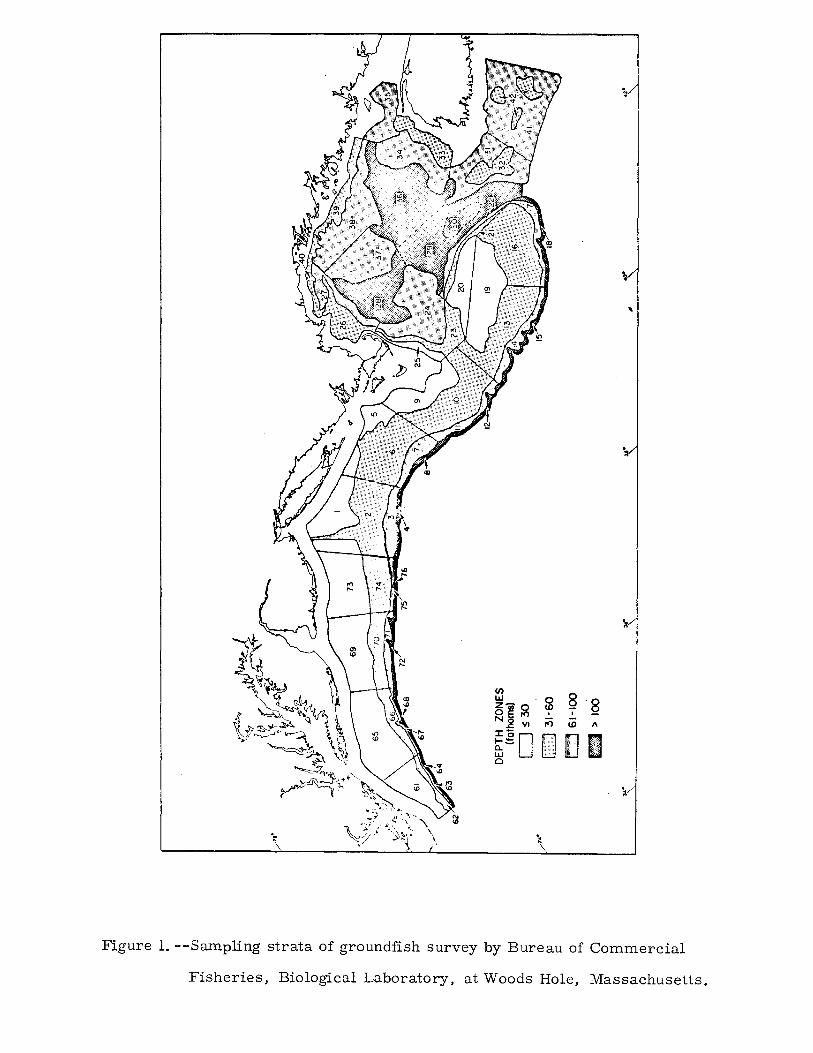
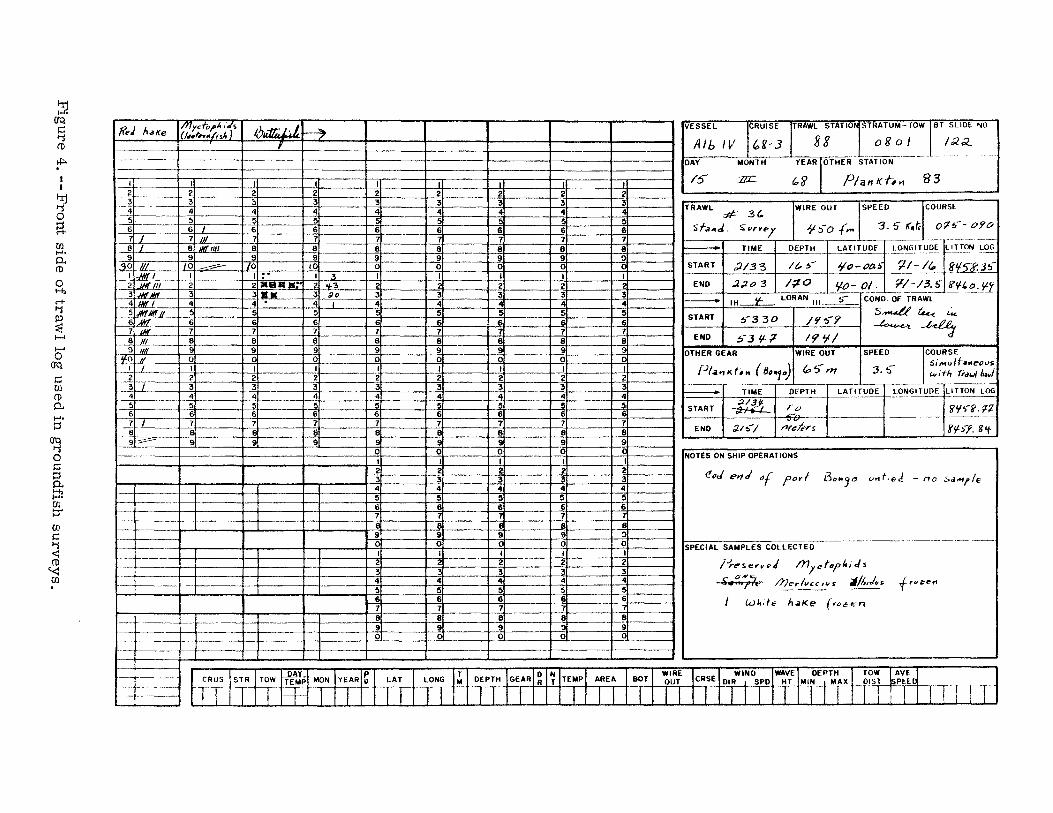
1. Traw I Log Format
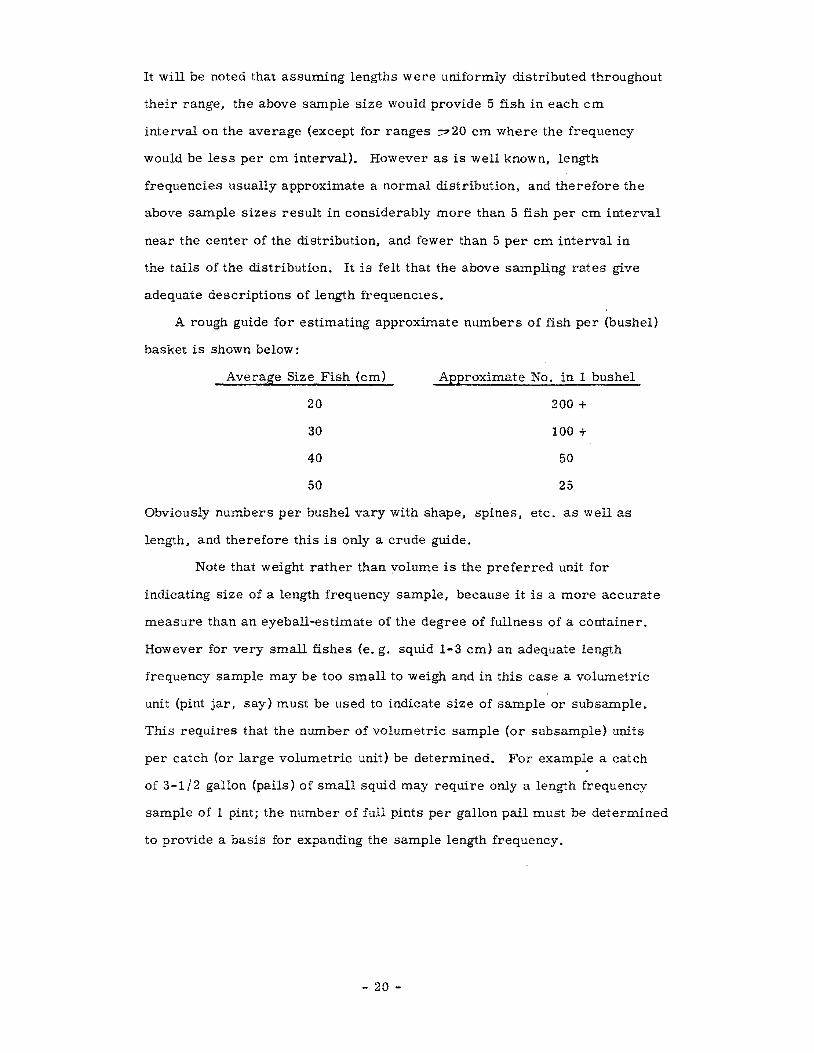
Accuracy and completeness of field records require the use of a
special record format, the trawl log. All station data (locatio'n, time, etc.)
are recorded in a block on one side of the log along with length frequency
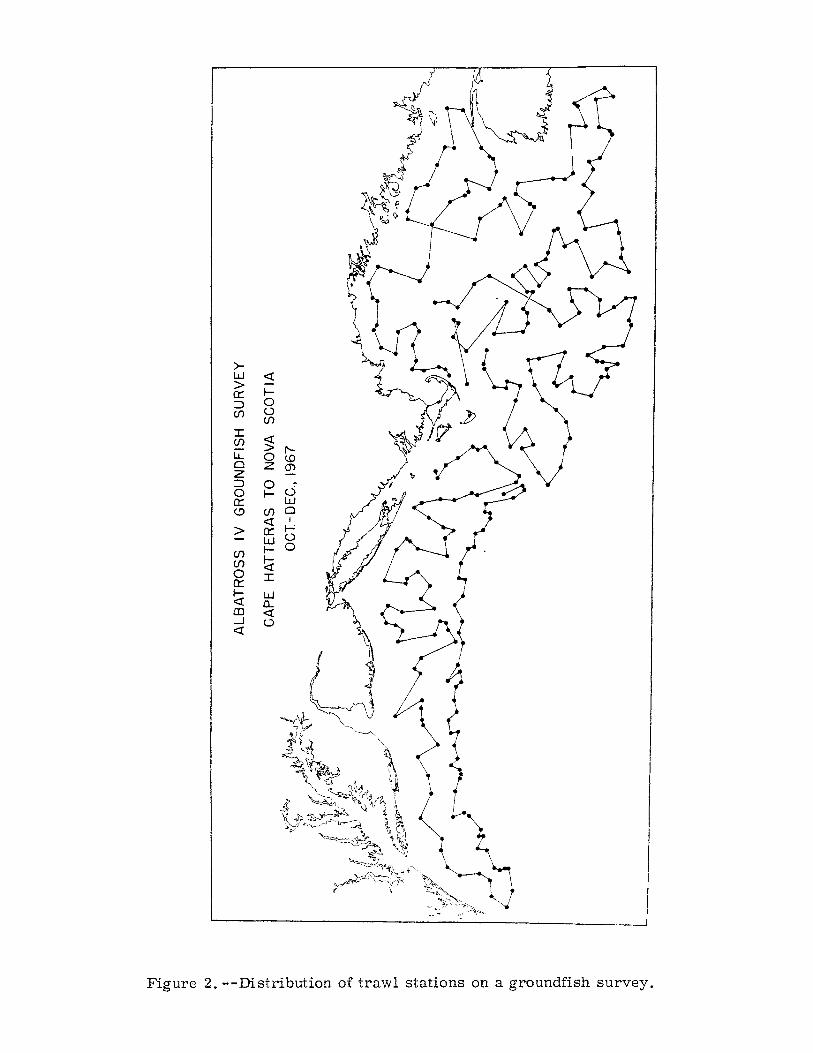
data (Figure 4). Data on the weight, volume and length frequency of the
catch, and sampling of the catch, are recorded on the other side of the log
(Figure 5). It is rare that more than one log (9-1/2 x 14", actual size) is
required to record the data for a single haul.
Our trawl log serves the dual purpose of providing:
a) an original written record of all the basic catch data for
each trawl haul on a single log sheet
b) a coding form from which the coded data are punched
directly onto cards
As a result of this dual purpose the format is a compromise between the
needs of a field log and a coding form. We have tried to simplify the
- 21 -
~ (J'q
8 (l)
H::.. . I I
I-:!:j '1 o a. Ul 1-" P.(l)
o H,
<"+ '1
~ ...... ...... o
(J'q
~ Ul (l)
P.-I-" ;j
(J'q '1 o ~
5. ::n Ul ~
Ul ~
~ (l)
«: Ul
I lnycf1,;7. ;.1. ReJ h .. Ke {/""te,d,',1r J 0~M
f
II II I II 21 I 21 I 21 I 2 2 2 2 2 2
VESSEL rRUISE TRAWL STATIO STRATUM TOW18.T SLIDE NO
All" IV c,g-J 88 0801 1;2;(.
DAY MONTH YEAR rTHER STATION -- -. -
/5' JlL t:.1? PlanKi4 11 83
* I ;1----1 ~I I ~ 3 3 3 3 3' 4 4 4: 4
51' I 51 I 51 I 5: 5, 5i 61 I 61 I I 61 I 6 6 6 6 6 61 711.. Iti I 71 I 7 71 71 7, 7 7 a1 I I 81 //If IHI I al I 8 a 8 a a 8 91 I 91 I 91 I 9 9 9 9 91
.101 1// 1101 ~ 1101 I 10! o 01 o 01 Il-Mi I It ._. I 11:- I 11 3 21.J1([..111 L_.i'L ___ .. 1 21 lIlfil a .. .., 111'1-3 2 2 3!JItf.AW I 31 I 31__ I 31;/0 I 31 1 3 3, 3 3 41//1f I I 41 I 41 - I 41 I I 41 1 4 41 5~ I 51 I 51 I 51 1 51 I 51 I 51 I 5 5 SI~_.L...§L __ J . §l_ ......l.61 1 61 I 61 .. I 61 1 6 71 JHf I 71 I 71 I 11 I 11 1 71 I 71 I 1 l' alJll I 81 I al I 81 I al I 81 I 81 I a 8
TRAWL
*' 3~ WIRE OUT SPEED COURSE
sf .. "J, . "'",..e-r 1'5"0 f ... 3. S' (.t;. o;t!>-- o?o
r--- TIME DEPTH LATITUDE f~;!';:!~; ~'----
START ,;113 '3 It. ~- 'Io-tJb.t. --1----'----- . -.-END ;l:J () :3 /~O 'It) - 01 111-13.5 £'!f.f!.:'t'L
f-----t- IH~ LORAN IH S- COND. Of' TRAWL
START 5"'330 /'1";)9 s-..u -tic..: '-«.
~ ~ END !a'l-7 If! If 1 91,HIL I 91 I 91 I 91 I 91 1 91 I 91 I 91 ~ 101 101 101 101 101 101 10
t i~' ,I ~I 1 il 1 ~I I il I il I il I ~I I il I 41 I 41 I 41 I 41 1 41 I 41 I 41 I 41 I 4 51 I 51 I 51 I 51 I '51 I 51 I Il/ I (\ 61 I 61 I 61 I 61 I sl I 61 I 61 I 6 71 I I 71 1 71 1 71 1 71 1 71 I 71 I 7 7 sl 181 181 lal lal 181 181 18 8
OTHER GEAR WIRE OUT SPEED COURSE
PI • .,Kt ... (8,,"1") (P?I?'/ 3.5' si ... ult .... eovs IN it;, thl"" I.,u'
I--- TIME DEPTH LATITUDE LQ,NG I T UD_E. LITTON LOG
;;J/ij, /"--
START ~ ':-0 'iJ't'f(.17 ,-f--------
END ;)./~I meier, K'l-S't. Kif ------ --
91 =- I 91 I 91 I 91 1 91 1 91 I 91 I 9 9 o 01 I 01 I 0
/I I II I I NOTES ON SHIP OPERATIONS
21 I 21 I 2 2 2: 31 I 31 I 3 3 3 41 I 41 I " 4 4
(!qJ t?'>1J "f Fort i3o"']l:l u"t,.,d - no Sd ... ,/e
5 51 I lSI I '5 51 6 ...§I I 61 1 6 6 7 n I n I 7
~ I ~ I 8
...... +- -+- + II 1 I ~ I ~ II III I ~ I ,~,~ /~::~:.:~"';:<f.?.;,-_, " c= 17 I~H I j II II II ~··:t.~::~·~:«~~·J·· i'···· --+------+ -+ 1 1 1 I I 01 OJ I 01 I 01 OJ ----+----_____+_ I " I I
~-+---- -- ILlI;' I >:>rUljl 1""1 IWljAI I'~II r

~ crq ,:: Ii <D
t.n . I I
to lU (j
~
til ,.... 0.. <D
o ...., <+ Ii
~ ...... ...... o
crq ,:: til <D 0.. ,.... ::s ~ o § 0.. ::n til :::; til ,:: Ii <: ~ til .
,
i
LENGTHS OF SPECIES spp WEIGHED PART OF CATCHY DISCARD ~OTAL LF TOTAL CATCH
INDIVIDUAL (use every other CODE OTHER (Votor No.)
ATCH E.pan. I BU 2 BU (Vol.) Factor
FISH (CM) line when possible) NO. (lb. gross) (lb. gross) lb. net)
LB(net) NO.
~I 2. t.~. f"-;) l.::r "3
~J..., ... 1-S" A
Sk«. LL 1/1. (,,. (",,) fI~. 11 J;.,
S~ • (,~ "" 'f,f 5'~. i1%""
S...;..... J-U ~ 1/3 I/~ II' " , ,fll ~ ~'f
mixed 8p"ciEl; ,g 1'5 11/ ill ~M.. !.'-h.
;:{ Is,ut!J .t...A..,. 3:1. -Ltt;;..J.· ~ 30 ~ 1::1..
(J
-
~~.(,'1,'7'i (!.vJl 31
oS....... ~. 3 -J
IU J.J..., 'f~
59 I m~c:t eo ...... J4J- If
'/-0 5'3 W.tJ;. ~ ~~ -
[------ m .t_~. JI" JJ Alo¥OjS Indicate I) Discard (valor no neither weighed nor measured) ~nd 2) measured port 01 catch If INVERT CATCH NOT SHOWN
less 1hon W~UQh8d port eire!. QrOS$ wt. boskeH,) measured. otherwlSI (.cord n.t __ " (or yol.) measured ABOVE If less than enhre contents of basket
,.. f?1~ I ~~.~_~I'+~"""'" ~ ()~~
'" " 17..41-(~ ~ . Y 5~( -u.:.. ~ -tr ~ J IU - .... 4'lt .IJ '" n?~ bX 1t- (...1-) ~ ONDU~--
II /?l~ ~ ~ .t.v ~ ~ J.! J.
S""":J-I.J S~J..L.; ~ ::LJ.
<P -_._----
I I I I
2 2 2 2 3 3
4 I 4 4 4
5 I 5 5 6 J 6 6 ~ 6 7 7 7 II 7 I 8 8 8 3<} B ./1111/ 9 II 9 9 .33 HIIII
!to I 110 .lt0 ~~ /0 ./fff.lflf /Iff.- fill I /II I I 2t:> I #ff JII( JHt,#t1 I 2 2 2 /I 2 IN(''''''' :3 I 3 :5 10 :5 Nd III 4 I 4 I 4 'I 4 1111
5 HII 5 5 I 5 I
6 11 6 I 6 6 _.
7 1/ 7 I T I 7
8 /l{(1 B 8 8 9 .JHf I 9 9 9
10 lUI go 30 I :lO I III I I -:::::. I
2 /Iff 2 2 2 S~ 3 /I 3 3 3 ~ 4 II/I 4 4 4 --5 II 5 5 .~
6 II 6 6 € :I-7 /I 7 7 S..u. 7
8 /II 8 8~ 8~,=_ 9 III 9 I J 9 I
'10 0 .cCC :LO 30 I I I I I , :L 2 I 2 2 It! 2 1-.. _---:5 3
3 " 3 Z .-
4 4 4 III 4 I 5 I 5 5 II 5 I 6 6 6 I 6 I
---I 7 R..-J,· 7 7 I.J-
~ 8~ 8=-- 8 ~--9 --T 9 d 9 9 ;2. __ 0 ..,;. /0 13 0 'j.Q...-L __ --" ..... ! ;1.-; I _~ __ '1 ___ -2 2 ;z. .- 2 Ii _ 1: __ .. 3 3 ~ 3 j I :l 4 4 4 <\
j---
5 5 5 -~ ;t. --
-----~-
6 6 6 6 I _~
7 7 7 7
8 8 8 6 9 9 --- f9~--J·· I -.;; ---j-o ___ 0 o 0 r--.- ---- - --~
c--f-------r-~= --, --!._~ ___ _ .. _-, --_. 1-.

recording of the data at sea as much as possible without sacrificing accuracy
or completeness of the original records. At the same time we have tried to
maintain the consistent arrangement of data necessary for efficient keypunch
ing directly from the field log. Both functions are served reasonably well.
2. General Recording Instructions
Survey station data are recorded by the ship's officers, and all data on
the catch are recorded by the scientific party. It is the responsibility of the
chief scientist (and watch chiefs of scientific party) to see that trawl logs are
properly filled out.
Some general rules for recording are:
a) use mediutn-soft (#2 or 2-1/2) black lead pencil; ink or colored
pencils smear when logs get wet.
b) do not erase original entries; cross out errors and enter correc
tion with appropriate explanation if necessary.
c) do not make entries in columns or boxes set aside for code
numbers, or in the columns headed "LF Expan. Factor" and
"Total Catch-Ib (net), No. ", Figures 4, 5. Experience has
shown that too many errors result when field parties attempt to
do the coding, or calculate expansion factors and estimate net
weight or number in total catch.
d) strive for neatness and consistency; do not crown entries - use
a second log for the same station if necessary.
e) when recording catch data do not rush; a recorder should not
attempt to record more than one type of information at a time.
f) use common names of fishes if well established, otherwise use
scientific names.
g) use the same cruise number for the various parts of a given
survey, and number stations consecutively from the first
station of Part I to the last station of the last part. Do not
assign a number to any trawl station where the haul is judged
not to be standard.
h) use only one time (i. e. daylight saving or standard) on anyone
segment of a cruise, and specify this at least on the first log.
- 24 -
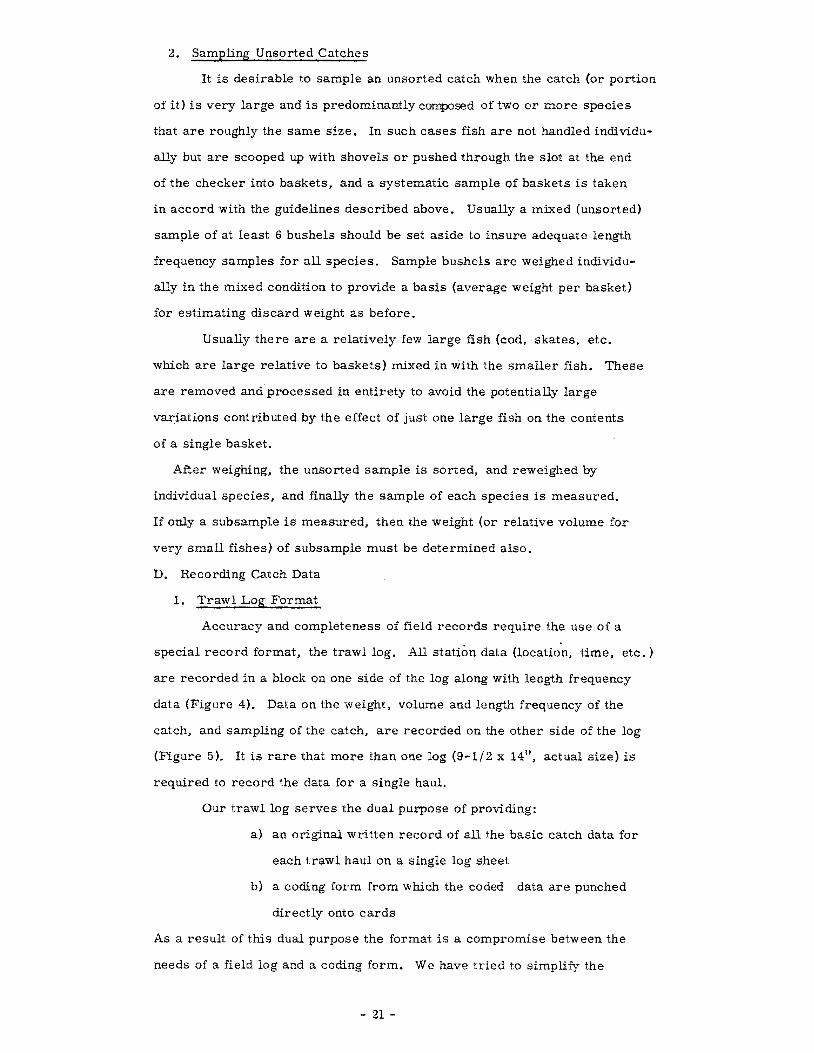
3. Weight and Volume of Sample size vs Total Catch
The portion of the log for recording weight and volume of the catch
is arranged such that the size of sample as well as total catch may be
designated simply and clearly. Hypothetical entries illustrating different
types of sampling are shown in Figure 5.
With respect to the weighed part of the catch note that gross weights
are recorded when fish are weighed in standard 1 or 2 bushel baskets;
otherwise net weight is recorded if fish are weighed in other types of
containers, or without containers in the case of large specimens. The
volume represented by the weighed part of the catch, plus any discard, is
equal to the total volume of catch, as shown for silver hake, scup and
mixed species on the sample log (Figure 5). It is desirable to record
total volume of catch when there is discard (although it doesn't add any
new information) because it serves as an on-the-spot mental, check on
the accuracy of the sample and discard quantities-. Also it serves to call
attention to cases where sample baskets are not full, as shown for scup.
When discard is in terms of numbers of individual fish as shown for female
dogfish, then it serves no useful purpo se to calculate total number of
individuals while at sea. If there is no discard, then the entries under
the section "Weighed part of catch" represent the total catch and there is
no need to record the total volume. Note again the definition of discard -
that portion of catch which is neither weighed nor measured.
Several conventions are used to indicate size of length frequency samples
and these are outlined in a footnote on the log (Figure 5). When the
measured part of a catch is less than the weighed part, the gross weight
of each measured basket is circled, provided the entire contents of the
basket were included in the sample, as shown for haddock and silver hake.
If all fish recorded under "Weighed part of catch" are measured, then no
circles are used - it being understood that the total quantity of fish weighed
were also measured.
When the measured part of a catch is less than the entire contents of a
basket, this may be indicated with an asterisk, and the net weight (or vol. )
measured is recorded below as shown for round herring, scup and butterfish
(Figure 5). Note that the 14 containers of round herring tossed over the side,
were not recorded under "discard" since they had been weighed although not
measured. Finally note that it is desirable to identify the basket (s) of a
series of baskets containing mixed species, which were sorted and reweighed
as shown by footnote 2 in Figure 5; this provides a better basis for detecting
errors in recording weights. In the case of the mixed species the sorted
basket was not circled because the entire contents were not measured.
4. Length Frequency Data
When there are only a few individuals of a species it is convenient to
record their lengths as shown for cod, white hake. and Merluccius albidus
(Figure 5). For larger numbers of fish the length frequency should be recorded
in numbers or with stroke- or dot-tallies, being careful to record the proper
centimeter intervals for each frequency (Figures 4 and 5). Frequencies
recorded with tallies must be converted to number frequencies before they
can be conveniently punched onto cards, therefore it is desirable to leave
space for this purpose. That is, if tallies fill up the column or run into
the next column, leave space in the adjacent column for writing the number
length frequency (see butterfish, Figure 4).
PARTm
SAMPLE DESIGN OF GROUND FISH SURVEY
A. Nature of Stratified Random Design
The stratified random design is best suited to fulfilling our survey
objectives chiefly for two reasons. First and foremost by virtue of
random sampling within each stratum this design produces unbiased
abundance indices of known statistical precision. Second it provides an
efficient station pattern from the standpoint of revealing fish distribution
in relation to hydrography as well as geography.
Other sampling plans such as the simple grid pattern (Systematic
design) or the transect method do not employ randomization and therefore
do not provide valid estimates of the sampling error (variance) of
abundance indices. Also these other plans provide a less efficient station
pattern. A strictly uniform grid will leave wide gaps in the sampling of
the deeper depths along steep slopes, and the transect plan leaves wide
gaps between transects. Reasonable uniformity in the distribution of
stations is desirable but it should be controlled so that there is a measure
of the relation between catches and depth in all parts of the survey area.
This is accomplished with the stratified design by sampling in every
stratum, where each stratum represents a depth zone as well as a geo
graphic subdivision.
With respect to bias, the stratified random design is superior to
any systematic design on theoretical grounds because of the possibility
that density gradients (in terms of abundance and species composition
in our case) might fall into phase with a systematic sampling pattern. For
example the results of a series of inshore-to-offshore transects along
the shelf could vary considerably depending upon the locations of transects
relative to large estuaries and associated canyons. Elements of randomi
zation can be introduced into a systematic design which reduces the
potential for bias, and of course the risk decreases with increase in the
intensity of sampling. It is desirable to avoid the risk entirely and at the
same time provide an objective measure of precision, and hence the
stratified random design is the best choice.
- 27 -
The bias which we are concerned with here refers to the representa
tiveness of relative abundance indices rather than to our inability to deter
mine absolute abundance. Ultimately of course we would like to be able to
convert our relative abundance indices into absolute terms but this is another
problem. Thus with the stratified random design, the estimated mean density
(average catch per haul of fish available to the trawl) for a given stratum, is
unbiased in the sense that every ecological habitat is trawled with probability
proportional to the area occupied by that habitat within the stratum.
Another general advantage of the stratified design is that in comparison
with simple random sampling, it has the potential for increased efficiency
in terms of smaller variance for fixed cost, (time at sea) depending upon
the success of choosing strata such that the fish population is homogeneous
within individual strata but substantially different among different strata.
Finally it should be noted that the stratified random design permits consider
able flexibility in analysis, and computations are simple. Strata may be
combined in: many ways and for each combination a stratified mean index
and associated variance can be computed easily.
B. General Problems of Stratification
The basic strategy in constructing strata is to choose stratum boundaries
such that the change in abundance of a species between adjacent strata is maximized,
thus permitting the most efficient use of resources as suggested above; but at
the same time maintain a sufficiently uniform station pattern to provide an
adequate description of hydrographic as well as geographic distribution of the
species. These two objectives lead in opposite directions - the first one tend-
ing toward large strata and the second one dictating relatively small strata.
The problem is further complicated if more than one species and season are
involved, and conflicting priorities very quickly tend to mitigate the value of
stratification for anyone species or season. In addition to the problem of
stratum size an important practical consideration is that quantitative compari-
sons among cruises or among various parts of the survey region are facilitated
if the stratum boundaries are fixed.
- 28 -
With the above factors in mind it is clear that depth is the single
most useful criterion for stratification because it is a precisely known
static factor and because of its obvious correlation with the distribution
of groundfish. Other factors such as temperature, benthic fauna and
sediment types, undoubtedly are more important than depth per se in
controlling groundfish distribution, but temperature is not static, and
sediment types and benthic fauna are not so precisely known. Whatever
the true significance of each of the above environmental factors, it is
a fact that stratification by depth results indirectly in stratification by
temperature (to the extent that the water column is thermally stratified)
and alsoinageneral way by sediment types and benthic fauna.
C. Choice of Sampling Strata
The present stratification plan was first established in 1964
(Albatross IV cruise 64-10) for the area from Hudson Canyon to Western
Nova Scotia. Four depth zones (see Figure 1) were chosen and essentially
these same four zones were used to subdivide each of four subareas
(Southern New England, Georges Bank, Gulf of Maine, Western Nova
Scotia) which are unique in one or more aspects of the groundfish community
and hydrography. The specific choices of depth zones and geographic
boundaries were based on a subjective evaluation of the various factors
referred to in the previous section, plus some practical limitations on vessel
operations. It should be remembered that while certain groundfish species
have high priority, particularly haddock, the Albatross IV surveys were
desigi::ted to provide useful data on all species available to the traw 1.
The basic depth boundaries - 15, 30, 60, 100 and 200 fathoms -
provide four depth zones which delineate the depth boundaries of most of
the sampling strata. The 15-200 fathom range represents the depth zone
within which the bulk of the most important commercial species are found.
Ideally the survey should extend into waters shoaler than 15 fathoms because
certain species (and young stages of some offshore species) are found there
in abundance. However considerations of safety in operating a vessel as
large as Albatross IV, as well as time limitations were involved in the
choice of the I5-fathom minimum.
- 29 -
The 30 and 60 fathom boundaries were chosen because it was believed
they would best subdivide the intermediate depths on Georges Bank and
southern New England, with respect to the known distribution of principal
species and also with respect to seasonal changes in bottom temperature.
The 60-fathom contour represents the approximate depth limit of marked
seasonal changes in bottom temperature in these two areas, and therefore
is an obvious choice of boundary for the purpose of monitoring the general
relation between fish distribution and temperature. The 30-60 fathom zone
on Georges Bank represents the depths in which the bulk of fishing
traditionally occurred for haddock, a principal species for the New England
fishery and the on'e with top priority in our surveys. The 30 and 60 fathom
boundaries coincide with those selected by Rounsefell (1957) :.; and still in
current use for estimating abundance of haddock and other groundfish on
Georges Bank, from commercial statistics of catch and effort. The 30-
fathom contour is also a useful stratum boundary for flounders, especially
the yellowtail which is the most important commercial flounder and which
is most abundant in waters shoaler than 30 fathoms particularly on the
southern New England grounds.
In the Gulf of Maine and off Western Nova Scotia bottom temperatures
exhibit much smaller seasonal fluctuations than on Georges Bank, and
below 30 fathoms temperature is essentially independent of depth.
Nevertheless the 30 and 60 fathom contours bear some relation to distri-
bution of species (e. g. redfish occur chiefly in waters deeper than 60
fathoms) and it was convenient to use these same boundaries where Georges
Bank and the Gulf of Maine strata come together. However on western Nova Scotia
grounds, the 50 fathom contour was used instead of the 60 fathom contour
because 3 more even subdivision of the area was thereby achieved.
Choice of the deeper boundaries was rather arbitrary and based on
judgement regarding depth distribution of principal species as well as
practical factors such as area of resulting strata. The 100 and 200 fathom
contours were used for the entire shelf from Eastern Georges Bank to Cape
Hatteras, and 100 and 110 fathom contours were used to the north of Georges
Bank. Georges Basin was set aside as a separate stratum (No. 30) with
a 160 fathom contour.
2 / - Rounsefell, G. A. 1957. A method of estimating abundance of groundfish
on Georges Bank. U. S. Fish and Wildlife Service, Fishery Bulletin, vol. 57,
no. 113: 265-278 - 30 -
D. Random Selection of Stations
Random selection of stations within strata is accomplished essentially
as follows. Each stratum is subdivided into rectangles of 5 minutes of
latitude by 10 minutes of longitude, and each of these rectangles is regarded
as a homogeneous sampling unit within which only one trawl haul is necess-
ary to characterize that unit. Each of the 5 x 10' rectangles are further
subdivided into 10 smaller rectangles (each 2-1/2' Lat x 2' Long) and
these are numbered throughout the entire stratum, with the 10 numbers
within anyone 5 X 10' rectangle being in consecutive order. Numbers are
then drawn from a table of random numbers (subject to the restriction that
no more than one number is chosen within any given 5 x 10' rectangle)
until the required number of 5 x 10' rectangles is obtained, corresponding
to the number of trawl stations specified for the given stratum. Number-
ing and random selections are done independently in each stratum. With
the above procedure every possible trawling site in each stratum has an
equal chance of being selected, and the probability of sampling a particular
depth (or ecological niche) within the stratum is proportional to the area
represented by that depth (or niche) within the stratum.!L
Occasionally random sampling results in a clustering of stations
such that there is a rather large area without a Single station. In such
cases extra stations are deliberately placed along the cruise track to fill
such a gap. This is done to insure more uniform coverage for hydrographic
observations as well as groundfish and plankton sampling. No more than
3 or 4 such extra stations have been added to anyone cruise for the entire
survey region from Hatteras to Nova Scotia. This represents less than
2 percent of the total number of randomly pre-selected stations and thereJore
the effect on variance estimates is negligible.
V Since stratum boundaries are irregular relative to lines of latitude and
longitude, it is not possible to subdivide the entire stratum into uniform
5 X 10' rectangles. This is particularly true around stratum perimeters
and in long narrow strata. The problem is largely circumvented by form-
ing irregular - shaped blocks where necessary, with the area of each block
equivalent to that of a 5 x 10' rectangle, and subdividing and numbering as
before. In strata 41 and 42, 5 X 10' rectangles are not subdivided because of
the small scale of the chart for that area.
- 31 -
E. Allocation of Stations to Strata
Stations are allocated to individual strata roughly in proportion to
stratum areas except for the required minimum of two stations in anyone
stratum. It is necessary to have at least two observations to compute a
variance. This requirement results in "over-sampling" the deep strata
with small areas along the steep edges of the shelf, in the sense that
it departs from strictly proportional allocation. However it is not over-
sampling in view of our interest in these deep areas where certain species
concentrate in winter and spring.
Ideally one should employ optimum allocation which will minimize
variance of a stratified mean for fixed cost, which in our case represents
a fixed total number of stations for the entire cruise. Preliminary analysis
of a portion 6f one Albatross IV cruise, for several principal species
combined, suggests that optimum allocation (based on stratum variances
and areas) yields little gain in precision over proportional allocation (based
on stratum areas alone). Consequently it is likely that the disproportionality
in our present allocation doesnft cost much in terms of reduced precisiun
even for those species which donft concentrate in deep strata. The
relation between precision and allocation of effort will be treated in more
detail in a future paper.
The number of proposed stations for each stratum (and the total
possible number of stations which is directly proportional to trawlable
area) on a recent cruise are listed in Table 2. Breakdown of sampling ~
effort by subregions is shown in Table 3, where the ratios of proposed to
possible stations indicate the general priority assigned to each subregion
of the survey area. Note that since sampling is not directly proportional
to stratum area within as well as among subregions, these ratios reflect
in part the relative differences between subregions in area of deep vs
shallow strata. The average sampling intensity over the entire survey
area (Cape Hatteras to Nova Scotia-about 75,000 square miles including
non-trawlable areas) represents roughly one trawl haul every 300 square
miles.
- 32 -
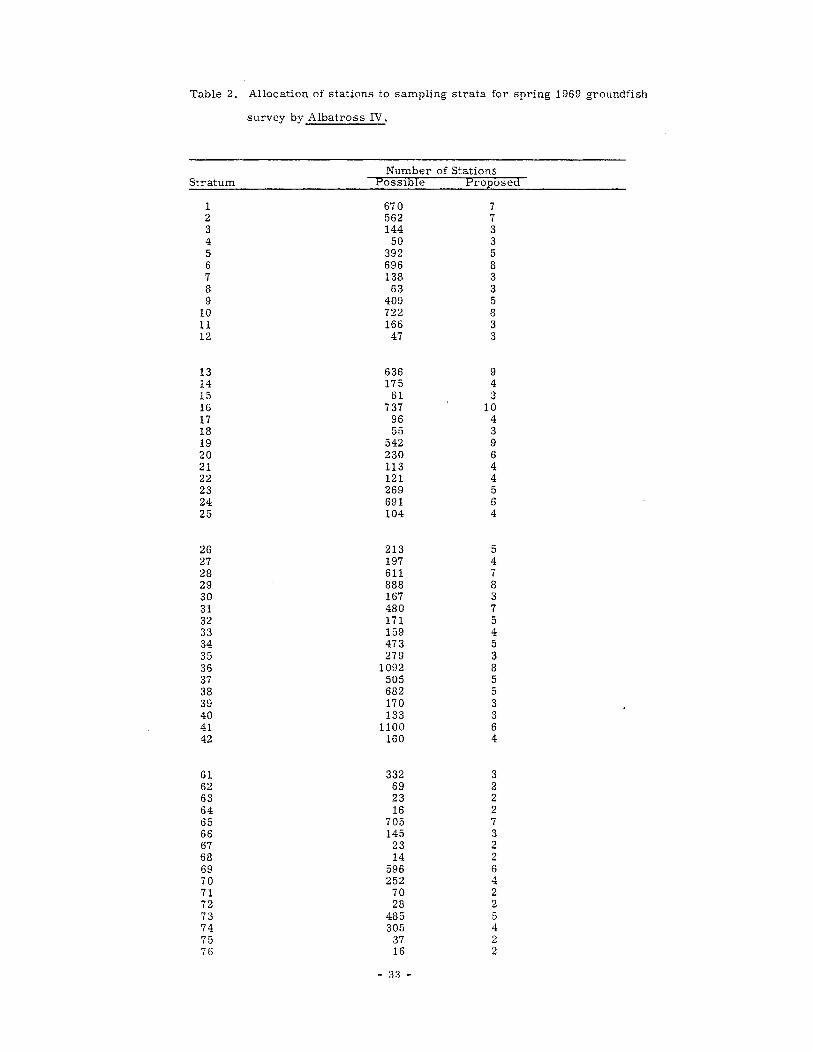
Table 2. Allocation of stations to sampling strata for spring 1969 groundfish
survey by Albatross IV.
Number of Stations Stratum PossIble Proposed
1 670 7 2 562 7 3 144 3 4 50 3 5 392 5 6 696 8 7 138 3 8 63 3 9 409 5
10 722 8 11 166 3 12 47 3
13 636 9 14 175 4 15 61 3 16 737 10 17 96 4 18 55 3 19 542 9 20 230 6 21 113 4 22 121 4 23 269 5 24 691 6 25 104 4
26 213 5 27 197 4 28 611 7 29 888 8 30 167 3 31 480 7 32 171 5 33 159 4 34 473 5 35 279 3 36 1092 8 37 505 5 38 682 5 39 170 3 40 133 3 41 1100 6 42 160 4
61 332 3 62 69 2 63 23 2 64 16 2 65 705 7 66 145 3 67 23 2 68 14 2 69 596 6 70 252 4 71 70 2 72 28 2 73 485 5 74 305 4 75 37 2 76 16 2
- 33 -
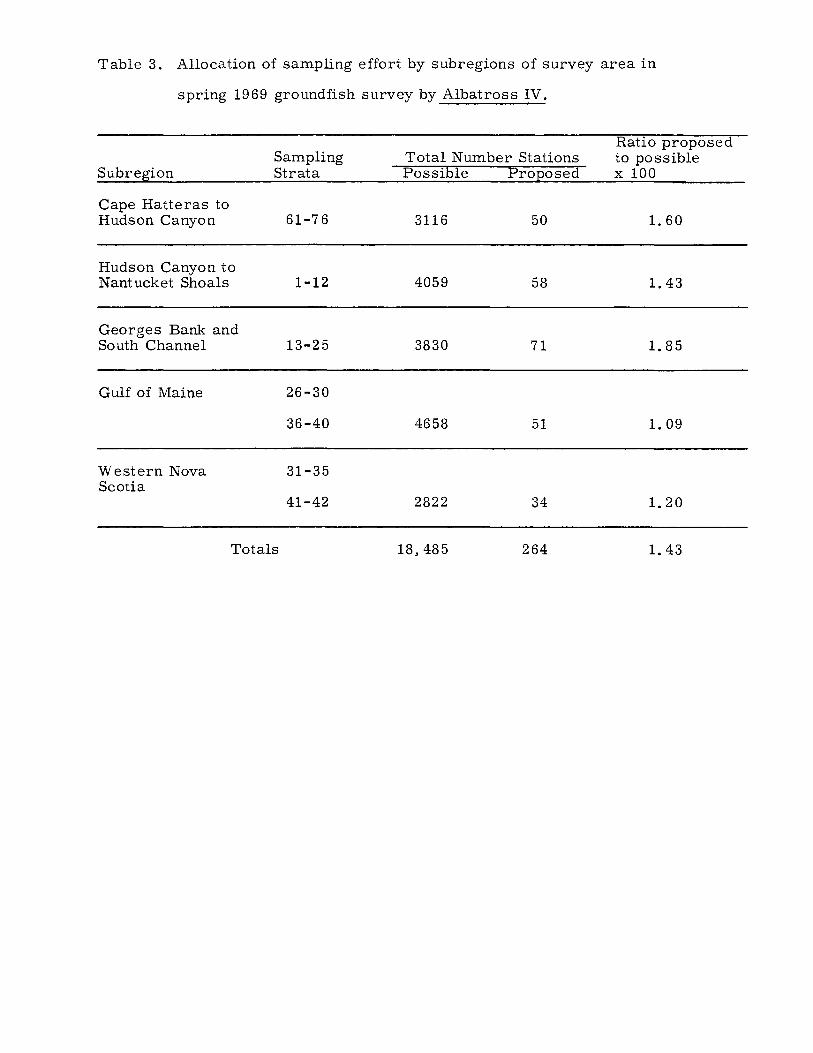
Table 3. Allocation of sampling effort by subregions of survey area in
spring 1969 groundfish survey by Albatross IV.
Subregion
Cape Hatteras to Hudson Canyon
Hudson Canyon to Nantucket Shoals
Georges Bank and South Channel
Gulf of Maine
Western Nova Scotia
Sampling Strata
61-76
1-12
13-25
26-30
36-40
31-35
41-42
Totals
Total Number Stations Possible Proposed
3116 50
4059 58
3830 71
4658 51
2822 34
18,485 264
Ratio proposed to possible x 100
1. 60
1. 43
1. 85
1. 09
1. 20
1. 43