Embed Size (px)
Citation preview

By Patrizia Cella and Mirella Morrone (ISTAT- Italy)
21° Meeting of the Wiesbaden Group on BR-Roundtable on Business Survey Frames
Session 6A: Entrepreneurship indicators, Business Demography and SMEs
An Empirical Analysis to investigate on High Growth definition
Paris, November 24-27, 2008

Outlines:21th Meeting of Wiesbaden Group on BR – Roundtable
on Business Survey Frames
Paris, November 26, 2008
1. Purposes
2. The Potential High Growth
3. The High Growth definition
4. Shift-share analysis
5. Performance Indicators
6. Conclusions

Paris, November 26, 2008
The purpose of this work is to investigate on the definition of High Growth enterprises, described in the EUROSTAT-OECD Manual on Business Demography Statistics.
In particular, various strategies for determining HG rates and their impacts on entrepreneurship are tested, especially with regards to wealth and employment creation contribution. For this purpose different sets of potential high-growth enterprises are compared in terms of employment and turnover.
Purposes:21th Meeting of Wiesbaden Group on BR – Roundtable
on Business Survey Frames
Paris, November 26, 2008
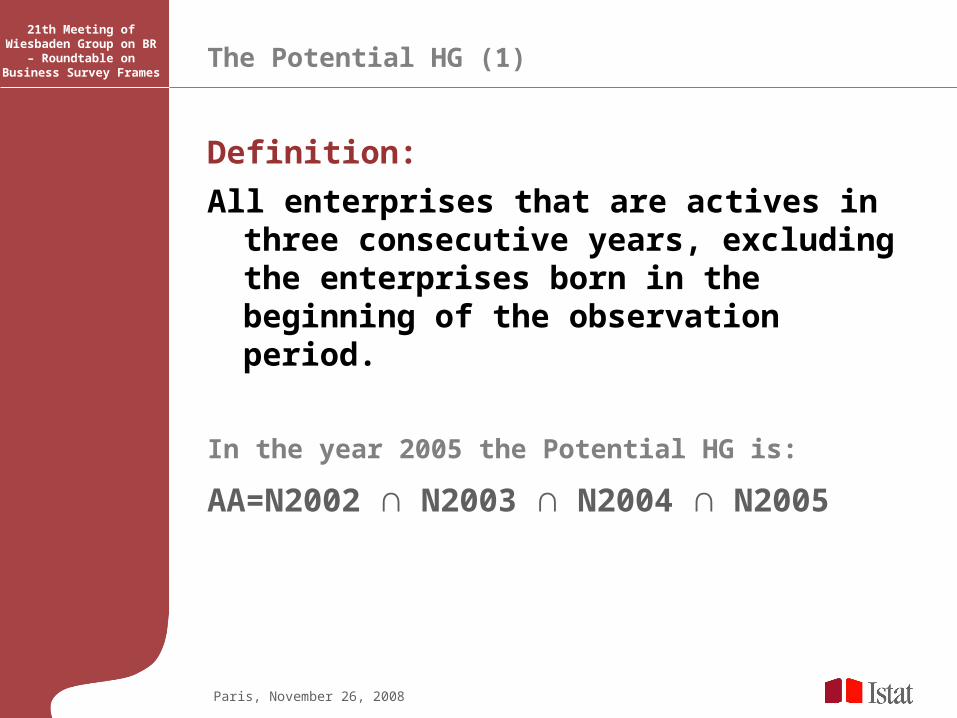
Definition:
All enterprises that are actives in three consecutive years, excluding the enterprises born in the beginning of the observation period.
In the year 2005 the Potential HG is:
AA=N2002 ∩ N2003 ∩ N2004 ∩ N2005
The Potential HG (1)21th Meeting of Wiesbaden Group on BR – Roundtable
on Business Survey Frames

The Potential HG (2)
Paris, November 26, 2008
21th Meeting of Wiesbaden Group on BR
– Roundtable on Business Survey Frames
Potential Population for HG
0 1 2-4 5-9 10-14 15-19 20+C 716 292 621 599 340 148 299 3,015D 176,413 47,051 71,460 49,190 25,256 12,562 31,143 413,075E 807 113 173 137 97 35 295 1,657F 226,429 49,649 56,870 25,730 8,547 3,240 5,021 375,486G 709,497 96,445 89,829 33,340 10,791 4,201 8,086 952,189H 96,378 30,515 33,543 12,949 3,568 1,439 2,423 180,815I 77,511 10,245 13,183 7,283 2,848 1,310 3,804 116,184J 31,204 5,549 6,915 1,645 406 191 1,026 46,936K70.71.73 113,743 8,308 4,534 1,091 326 135 305 128,442K72 33,920 6,069 8,966 4,025 1,407 583 1,498 56,468K74 370,322 40,698 33,797 10,853 3,406 1,346 4,319 464,741Totale 1,836,940 294,934 319,891 146,842 56,992 25,190 58,219 2,739,008
NACESize class of employees (year 2002)
Total

The Potential HG (3)
Paris, November 26, 2008
21th Meeting of Wiesbaden Group on BR
– Roundtable on Business Survey Frames
Where:
Entropy average (MH)=
i
i
ii N
AA
Alog
1exp
Potential Population for HG
arithmetic entropyaverage average
C 12.03 26.83D 8.58 29.37E 63.46 229.02F 2.04 9.09G 1.43 12.89H 2.61 12.52I 7.00 62.30J 8.69 159.02K70.71.73 0.43 9.67K72 3.80 23.04K74 1.73 30.18Total 3.13 24.02
NACE

Paris, November 26, 2008
Definition:
All enterprises with average annualised growth greater than 20% per annum, over three year period should be considered as high-growth enterprises. Growth can be measured by the number of employees or by turnover
The HG definition (1)21th Meeting of Wiesbaden Group on BR – Roundtable on Business Survey Frames
728.13_ xxemplxxemplemplHG
728.13_ xxturnxxturnturnHG

Paris, November 26, 2008
The HG definition (2)21th Meeting of Wiesbaden Group on BR – Roundtable on Business Survey Frames
HG_rate = 9.1%
What is the meaning of this high-growth rate?
What is the impact that these high-growth enterprisesare on the economy?
Employment
65.6%
34.4%
Rest of pHG HG
Turnover
40.4%
59.6%
Rest of pHG HG

Paris, November 26, 2008
The HG definition (3)21th Meeting of Wiesbaden Group on BR – Roundtable on Business Survey Frames
Employment
0%
10%
20%
30%
40%
50%
60%
70%
80%
90%
100%
C D E F G H I J K70.71.73 K72 K74 Total
Rest of pHG HG
Contribution of high-growth enterprises by sectors of economic activity
Paris, November 26, 2008
The HG definition (4)21th Meeting of Wiesbaden Group on BR – Roundtable on Business Survey Frames
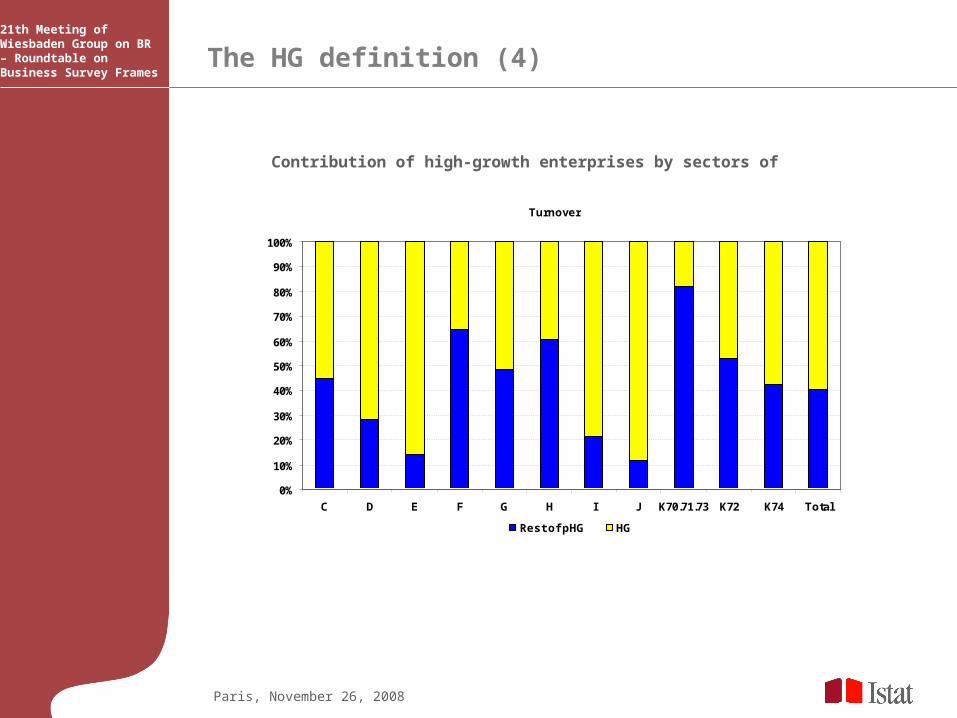
Contribution of high-growth enterprises by sectors of economic activity
Turnover
0%
10%
20%
30%
40%
50%
60%
70%
80%
90%
100%
C D E F G H I J K70.71.73 K72 K74 Total
Rest of pHG HG
Paris, November 26, 2008
Shift-share analysis (1)21th Meeting of Wiesbaden Group on BR – Roundtable on Business Survey Frames
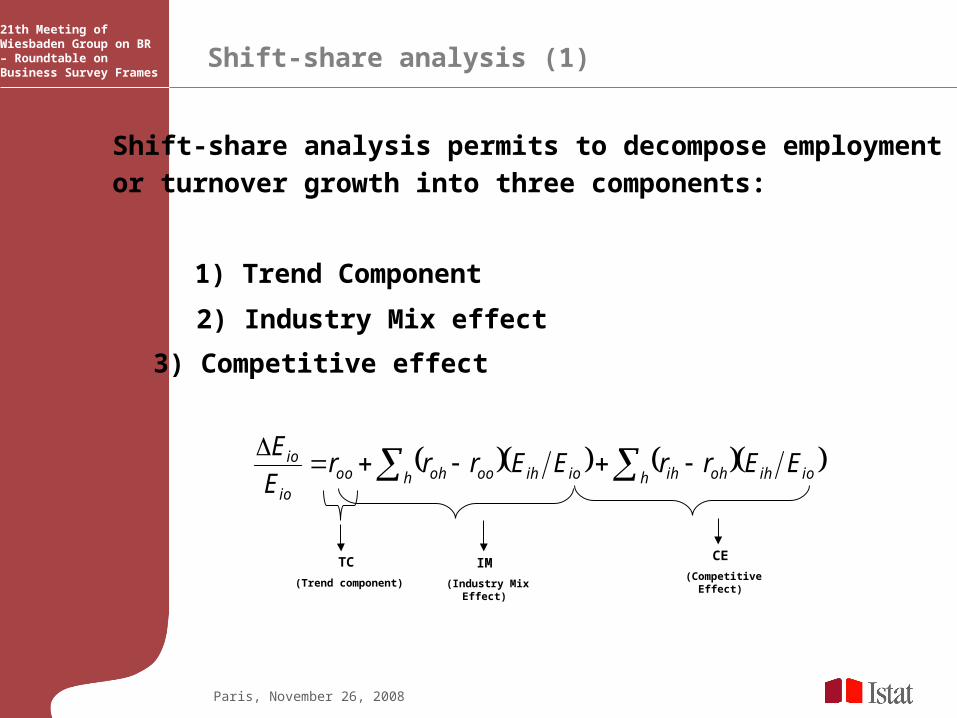
Shift-share analysis permits to decompose employment
or turnover growth into three components:
1) Trend Component
2) Industry Mix effect
3) Competitive effect
ioihh ohihioihh ooohooio
io EErrEErrrE
E
TC
(Trend component)
IM
(Industry Mix Effect)
CE
(Competitive Effect)
Paris, November 26, 2008
Shift-share analysis (2)21th Meeting of Wiesbaden Group on BR – Roundtable on Business Survey Frames
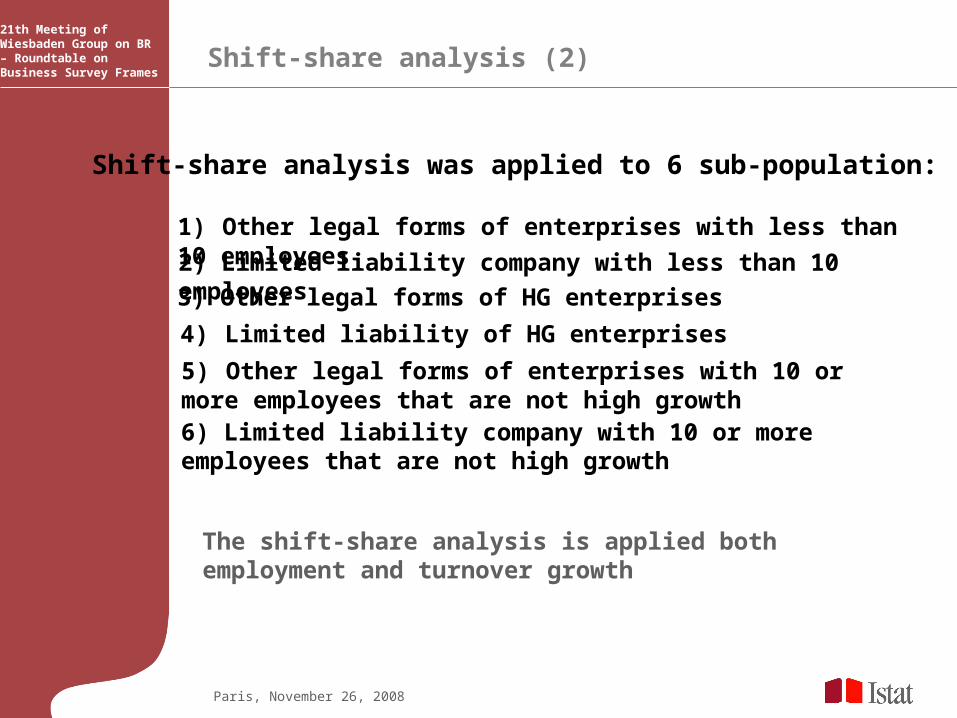
Shift-share analysis was applied to 6 sub-population:
1) Other legal forms of enterprises with less than 10 employees
2) Limited liability company with less than 10 employees
3) Other legal forms of HG enterprises
4) Limited liability of HG enterprises
5) Other legal forms of enterprises with 10 or more employees that are not high growth
6) Limited liability company with 10 or more employees that are not high growth
The shift-share analysis is applied both employment and turnover growth
Paris, November 26, 2008
Shift-share analysis (3)21th Meeting of Wiesbaden Group on BR – Roundtable on Business Survey Frames
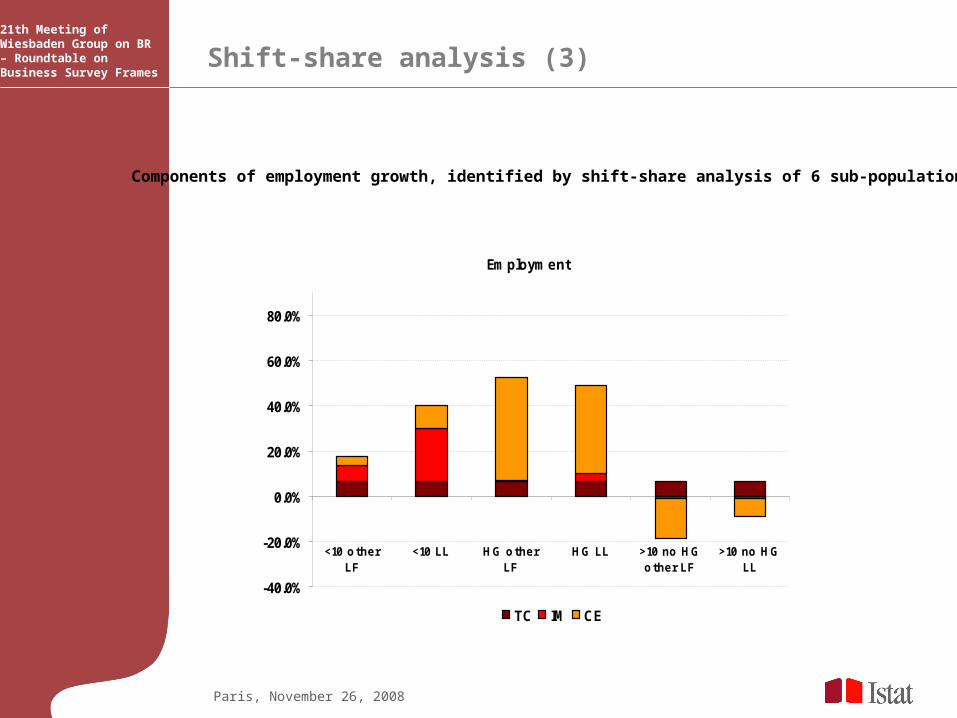
Employment
-40.0%
-20.0%
0.0%
20.0%
40.0%
60.0%
80.0%
<10 otherLF
<10 LL HG otherLF
HG LL >10 no HGother LF
>10 no HGLL
TC IM CE
Components of employment growth, identified by shift-share analysis of 6 sub-populations

Paris, November 26, 2008
Shift-share analysis (4)21th Meeting of Wiesbaden Group on BR – Roundtable on Business Survey Frames
Components of turnover growth, identified by shift-share analysis of 6 sub-populations
Turnover
-40.0%
-20.0%
0.0%
20.0%
40.0%
60.0%
80.0%
100.0%
120.0%
140.0%
160.0%
<10 other LF <10 LL HG other LF HG LL >10 no HGother LF
>10 no HG LL
TC IM CE

Paris, November 26, 2008
Performance Indicators (1)21th Meeting of Wiesbaden Group on BR – Roundtable on Business Survey Frames
Four economic performance indicators from balance-sheet accounts are used as significant instruments to quantify the economic and financial performance of the HG enterprises
1) The turnover by persons employed
2) The value added by persons employed
3) The ROE (Return on Equity)
4) The ROS (Return on Sales)
1) Limited liability company with less 10 employees
2) Limited liability of HG enterprises3) Limited liability company with 10 or more
employees that haven’t high growth
These four indicators are calculated only for the limited liability companies:

Paris, November 26, 2008
Performance Indicators (2)21th Meeting of Wiesbaden Group on BR – Roundtable on Business Survey Frames
1) The turnover by persons employed
This indicator represents the most immediate measure of business output.It is calculated as ratio among the revenues of the sales and the number of persons employed
Turnover by persons employed (thousands of euro)
0.0
100.0
200.0
300.0
400.0
500.0
600.0
Industry Costruction Trade Services
HG <10 >= 10

Paris, November 26, 2008
Performance Indicators (3)21th Meeting of Wiesbaden Group on BR – Roundtable on Business Survey Frames
2) The value-added by persons employed
This indicator represents the “real” wealth created by the processes of production of goods and services that pay for all the production factors. It is calculated as ratio between the characteristic value added (the difference between the value of the production and the costs of subjects, services and enjoyment of goods) and the number of the persons employed
Value-added by persons employed (thousands of euro)
0.0
10.0
20.0
30.0
40.0
50.0
60.0
70.0
80.0
90.0
Industry Costruction Trade Services
HG <10 >= 10

Paris, November 26, 2008
Performance Indicators (4)21th Meeting of Wiesbaden Group on BR – Roundtable on Business Survey Frames
3) The ROE (Return on Equity)
This indicator represents the productivity obtained by the proper capital in terms of profit. It expresses the return that a firm has had on the net property (that is the “inside” source of financing). It is calculated as ratio between the profits of exercise and the net property
ROE
0.0
2.0
4.0
6.0
8.0
10.0
12.0
14.0
16.0
18.0
20.0
Industry Costruction Trade Services
HG <10 >= 10

Paris, November 26, 2008
Performance Indicators (5)21th Meeting of Wiesbaden Group on BR – Roundtable on Business Survey Frames
4) The ROS (Return on Sales)
This indicator measures the profitability of the sales in terms of characteristic management. Is an indicator influenced by the sector in which the firm operates. It serves for measuring the return of the sales on the profits
ROS
0.0
1.0
2.0
3.0
4.0
5.0
6.0
7.0
8.0
9.0
10.0
Industry Costruction Trade Services
HG <10 >= 10
An Empirical Analysis to investigate on High Growth definition
Conclusions:
The analysis carried out in this work shows that the high growth are the enterprises with more performance than others, above all in terms of turnover.
The performance economic indicators show that the high growth are the best in terms of profitability, especially in the sector of Industry less in the sector of services.
The threshold of 10 employees according to which the high growth are identified, is too much restrictive for those sectors characterized by micro and small enterprises.
To use a growth composite indicator (we are going to work on this issue) that take account of both the arithmetic average and the characteristic dimension of the economic activity sectors, would be desirable.
Paris, November 26, 2008