Embed Size (px)
Citation preview
DEPARTMENT OF MINERALS AND ENERGY
GEOLOGICAL SURVEY OF WESTERN AUSTRALIA
REPORT77
GOVERNMENT OFWESTERN AUSTRALIA
BASIN DEVELOPMENT AND PETROLEUMEXPLORATION POTENTIAL OF THE
LENNIS AREA, OFFICER BASINWESTERN AUSTRALIA
by S. N. Apak and H. T. Moors
GEOLOGICAL SURVEY OF WESTERN AUSTRALIA
REPORT 77
����������� ��������������� ��������������������������������������������������������������������
byS. N. Apak and H. T. Moorswith a contribution by K. A. R. Ghori
Perth 2001
MINISTER FOR STATE DEVELOPMENT; TOURISM;SMALL BUSINESS; GOLDFIELDS–ESPERANCEThe Hon. Clive Brown MLA
DIRECTOR GENERALL. C. Ranford
DIRECTOR, GEOLOGICAL SURVEY OF WESTERN AUSTRALIATim Griffin
Copy editor: L. Day
REFERENCEThe recommended reference for this publication is:APAK, S. N., and MOORS, H. T., 2001, Basin development and petroleum exploration potential of the Lennis area, Officer Basin,
Western Australia: Western Australia Geological Survey, Report 77, 42p.
National Library of AustraliaCataloguing-in-publication entry
Apak, Sukru N.Basin development and petroleum exploration potential of the Lennis area, Officer Basin, Western Australia.
Bibliography.ISBN 0 7307 5688 2
1. Petroleum — Prospecting — Western Australia — Officer Basin.2. Petroleum reserves — Western Australia — Officer Basin.3. Geology, Stratigraphic — Western Australia — Officer Basin.I. Moors, H. T. (Henry Theodore), 1942–.II. Title. (Series: Report (Geological Survey of Western Australia); 77).
553.2809941
ISSN 0508–4741
Printed by Optima Press, Perth, Western Australia
Copies available from:Information CentreDepartment of Minerals and Energy100 Plain StreetEAST PERTH, WESTERN AUSTRALIA 6004Telephone: (08) 9222 3459 Facsimile: (08) 9222 3444www.dme.wa.gov.au
Cover photograph:A view of the spinifex and sandplains of the Lennis area, western Officer Basin.
iii
Contents
Abstract ................................................................................................................................................................. 1Introduction .......................................................................................................................................................... 1
Previous investigations .................................................................................................................................. 3Current GSWA investigation ........................................................................................................................ 3Location and access ....................................................................................................................................... 4Physiography, climate, and vegetation .......................................................................................................... 5
Stratigraphy .......................................................................................................................................................... 6Neoproterozoic .............................................................................................................................................. 7
Townsend Quartzite and Lefroy Formation ........................................................................................... 7Browne Formation .................................................................................................................................. 8Hussar Formation ................................................................................................................................... 8Kanpa Formation .................................................................................................................................... 8Steptoe Formation ................................................................................................................................ 10Wahlgu Formation ................................................................................................................................ 10McFadden Formation equivalent ......................................................................................................... 11
Palaeozoic .................................................................................................................................................... 12Table Hill Volcanics ............................................................................................................................ 12
Sequence stratigraphy ......................................................................................................................................... 12Geophysics .......................................................................................................................................................... 14
Seismic data ................................................................................................................................................. 14Data coverage ....................................................................................................................................... 14Data quality .......................................................................................................................................... 14
Structural interpretation ...................................................................................................................................... 16Faulting ........................................................................................................................................................ 16Folding ......................................................................................................................................................... 17Salt movement ............................................................................................................................................. 18
Structural history ................................................................................................................................................ 20Base Browne Formation horizon or near-base salt ..................................................................................... 20Intra-Browne Formation marker and near-Top Browne Formation horizon ............................................... 21Top Kanpa Formation horizon .................................................................................................................... 21Base McFadden Formation equivalent unconformity ................................................................................. 22Top Table Hill Volcanics horizon ............................................................................................................... 22
Petroleum potential ............................................................................................................................................. 23Previous drilling .......................................................................................................................................... 23Petroleum generation ................................................................................................................................... 23
Source-rock type ................................................................................................................................... 23Source-rock maturation and petroleum generation .............................................................................. 24
Reservoir potential ...................................................................................................................................... 25Townsend Quartzite ............................................................................................................................. 25Lefroy Formation ................................................................................................................................. 25Browne Formation ................................................................................................................................ 25Hussar Formation ................................................................................................................................. 25Kanpa Formation .................................................................................................................................. 26Steptoe Formation ................................................................................................................................ 26Wahlgu Formation ................................................................................................................................ 26McFadden Formation equivalent ......................................................................................................... 26
Seals ............................................................................................................................................................. 27Traps ............................................................................................................................................................ 27
Fault traps ............................................................................................................................................. 27Normal faults ................................................................................................................................. 27
Drape folding ........................................................................................................................................ 28Lateral salt seals ................................................................................................................................... 28Fractured reservoirs .............................................................................................................................. 28Stratigraphic traps ................................................................................................................................ 29
Unconformity truncations ............................................................................................................. 29Pinchout traps ................................................................................................................................ 29Facies changes ............................................................................................................................... 29Erosive channels or valleys ........................................................................................................... 29
Prospectivity ................................................................................................................................................ 29References .......................................................................................................................................................... 32
iv
Appendix
1. Thermal history of the Lennis area ........................................................................................................... 34
Plates (in pocket)
1. Key seismic horizon maps, Officer Basin2. Seismic isochron maps, Lennis area, Officer Basin
Figures
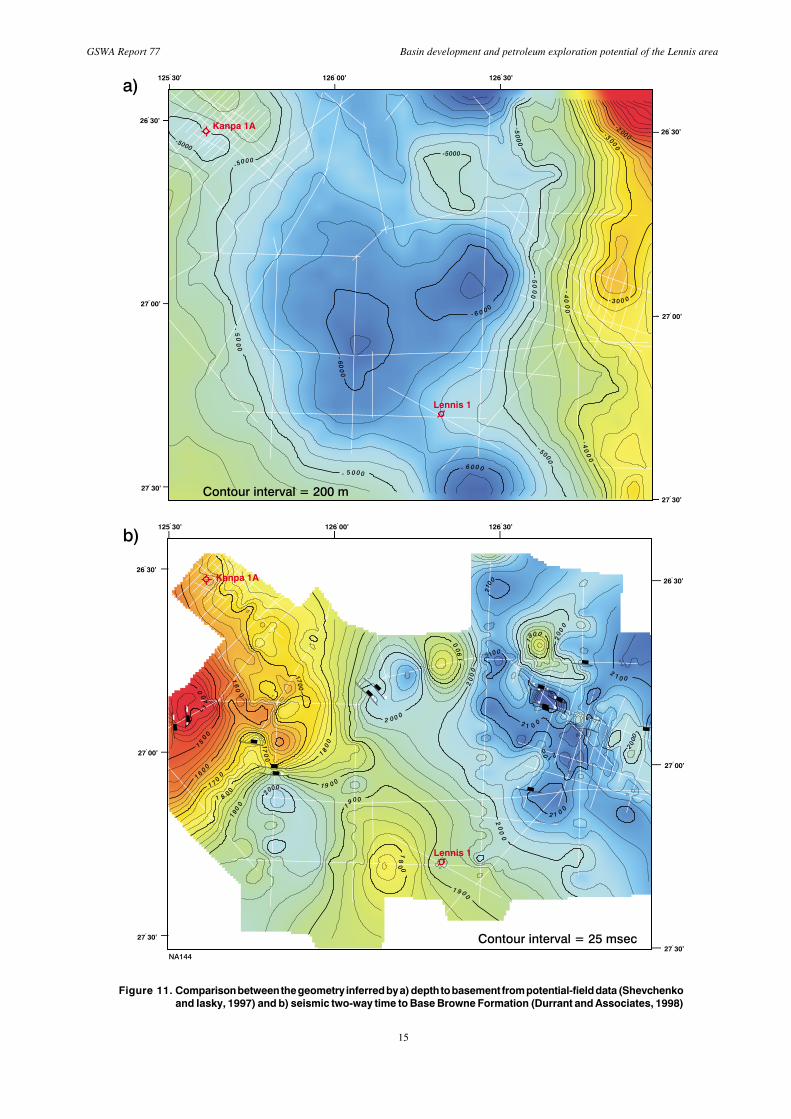
1. The western Officer Basin, showing major structural elements and sub-areas ......................................... 22. Seismic and well control: a) in the western Officer Basin; b) in the Lennis area ..................................... 43. Access routes in the western Officer Basin and location of 1:250 000 map sheets ................................... 64. Generalized stratigraphy and tectonic events in the Yowalga–Lennis area ............................................... 75. Depositional model for the Browne Formation .......................................................................................... 96. Depositional model for the Hussar Formation ........................................................................................... 97. Seismic line T82-136, showing erosion of the units underlying the Base McFadden Formation
equivalent .................................................................................................................................................. 108. Depositional model for the Kanpa Formation .......................................................................................... 119. Seismic line T82-138, showing the seismic character of the Wahlgu Formation .................................... 12
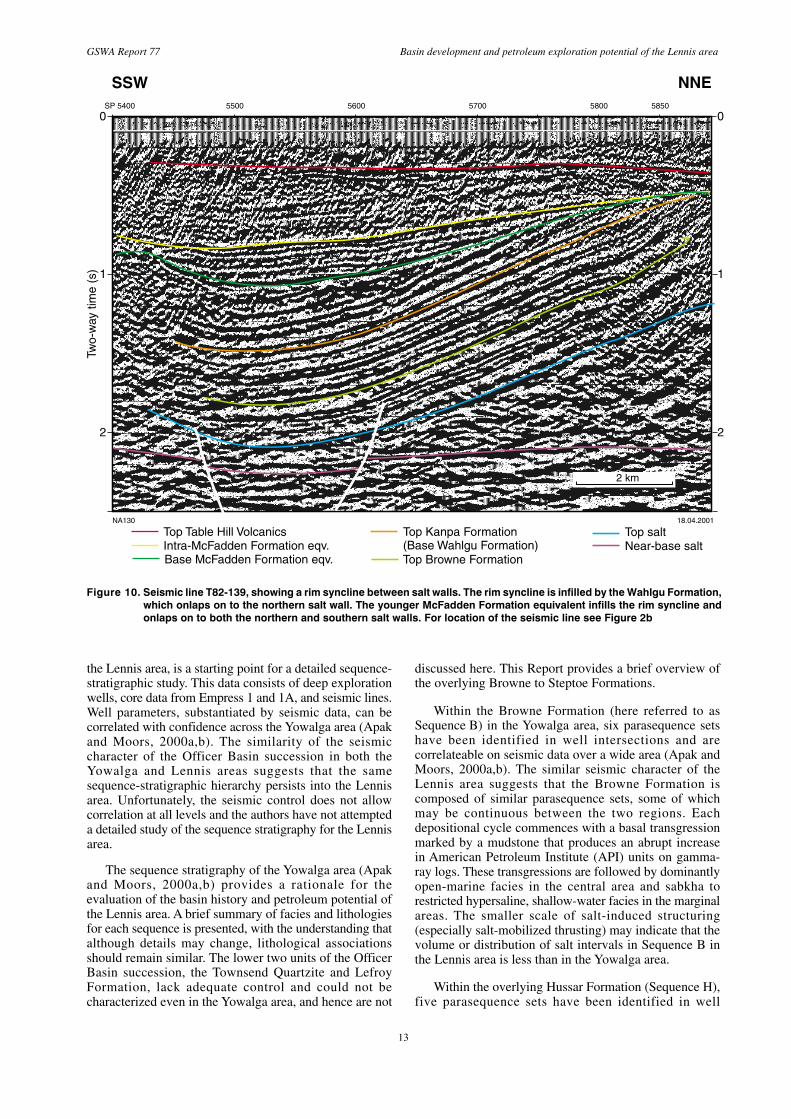
10. Seismic line T82-139, showing salt walls and rim synclines infilled by the Wahlgu and McFaddenFormation equivalent Formations ............................................................................................................. 13
11. Comparison between the geometry inferred by potential-field and seismic data in the Lennis area ...... 1512. Seismic line 80-3A, showing a low-amplitude anticline with structuring from Supersequence 1 to
the Table Hill Volcanics ........................................................................................................................... 1713. Seismic line 80-3B, showing rejuvenated, salt-lubricated listric thrusting in the
Browne Formation .................................................................................................................................... 1814. Seismic line T82-137, showing a salt wall with horizontal displacement due to salt movement ........... 1915. Seismic line 80-5, showing salt movement post-dating the Table Hill Volcanics .................................. 2016. Petroleum-generating potential of source beds in the western Officer Basin .......................................... 2417. Type of kerogen in source rocks in the western Officer Basin ................................................................ 2418. Schematic petroleum play types in the Lennis area ................................................................................. 28
Table
1. Seismic lines used in this Report .............................................................................................................. 16
1
GSWA Report 77 Basin development and petroleum exploration potential of the Lennis area
Basin development and petroleumexploration potential of the Lennis area,
Officer Basin, Western Australia
by
S. N. Apak and H. T. Moors
AbstractThis Report provides a new interpretation for the petroleum systems and play types of the Lennis area,based on an analysis of all available seismic data. The consistent seismic character of the Browne, Hussar,Kanpa, and Steptoe Formations allows them to be correlated with confidence from the Yowalga area to theLennis area, and indicates that their Neoproterozoic environments of deposition and structural historieswere similar.
Regional structural events that affected the western Officer Basin were not particularly severe in theLennis area. However, the presence of thick sections of the seismically interpreted Wahlgu Formation(Supersequence 3) and McFadden Formation equivalent (Supersequence 4) in the Lennis area indicates thepresence of active tectonism and subsidence that was complicated by reactivation of salt movement duringdeposition of these formations.
As in the Yowalga area, the authors are confident that source rocks, reservoirs, and seals for petroleumare also present in the Lennis area. A number of trapping styles, from simple fault traps, simple anticlines,and stratigraphic traps (depositional and erosional) to halokinetic traps, are present. Some of these featuresare potentially large, and may have an excellent chance for multiple pays. Geothermal modelling of thedeepest part of the area suggests that an oil charge would probably have been expelled from Supersequence 1strata during the Cambrian. This represents a favourable relationship with respect to timing of the initialdeformation during the Areyonga Movement (c. 750 Ma). Further deformation during deposition of theWahlgu Formation and McFadden Formation equivalent may have breached early traps, but deposition atthis time also triggered a later phase of petroleum generation, and the new traps were in place for this latercharge. The facies within the rim synclines adjacent to the salt walls may have different reservoir, source-rock, and seal potential to that of the remaining area, thereby providing additional exploration targets.
Additional stratigraphic drilling would be required to provide local control for the composition of thevarious formations present in the Lennis area. This is especially important for the Wahlgu Formation andMcFadden Formation equivalent, which have significant depositional thicknesses in this area and have yetto be adequately tested. The data presented here indicates that the petroleum potential of the Lennis areacould be significant.
KEYWORDS: geological structure, stratigraphy, sequence stratigraphy, geochemistry, basin analysis,petroleum potential, structural evolution, Lennis area, Officer Basin, Western Australia
IntroductionThe Officer Basin (Fig. 1) is the third largest onshore basinin Australia. It covers an area of 320 000 km2 in WesternAustralia and has a sedimentary section in excess of6 km. Because of the volume of sedimentary rock present,and the high content of carbonate and salt that else-where in the world is associated with prolific petroleum
reserves (Warren, 1989; Alsharan and Nairn, 1997),the petroleum potential of the basin has been highly ratedby recent workers (Perincek, 1997, 1998; Carlsen et al.,1999; Apak and Moors, 2000a,b). Historically, aNeoproterozoic age has been considered unfavourableby the petroleum industry (Phillips et al., 1985);however, giant oil- and gasfields are known fromrocks of this age in Russia (Kontorovich et al., 1990;
2
Apak and Moors
Kuznetsov, 1997) and Oman (Alsharan and Nairn,1997).
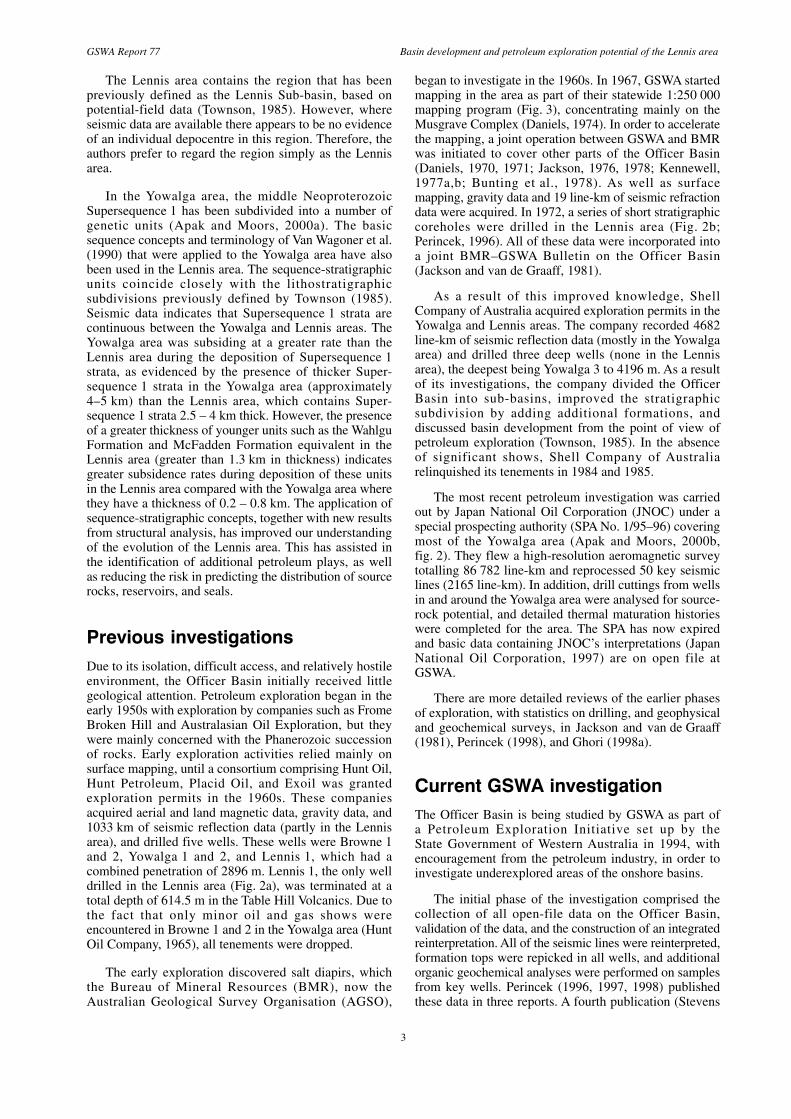
In an effort to encourage the petroleum explorationindustry to realise the potential of the Officer Basin, theGeological Survey of Western Australia (GSWA)commenced a review of available data in 1994. Thisreview has been supplemented by additional data fromstratigraphic corehole drilling, geophysical surveys, andgeochemical analyses in critical areas (Fig. 2a; Carlsenet al., 1999). The Yowalga area has the greatest seismic
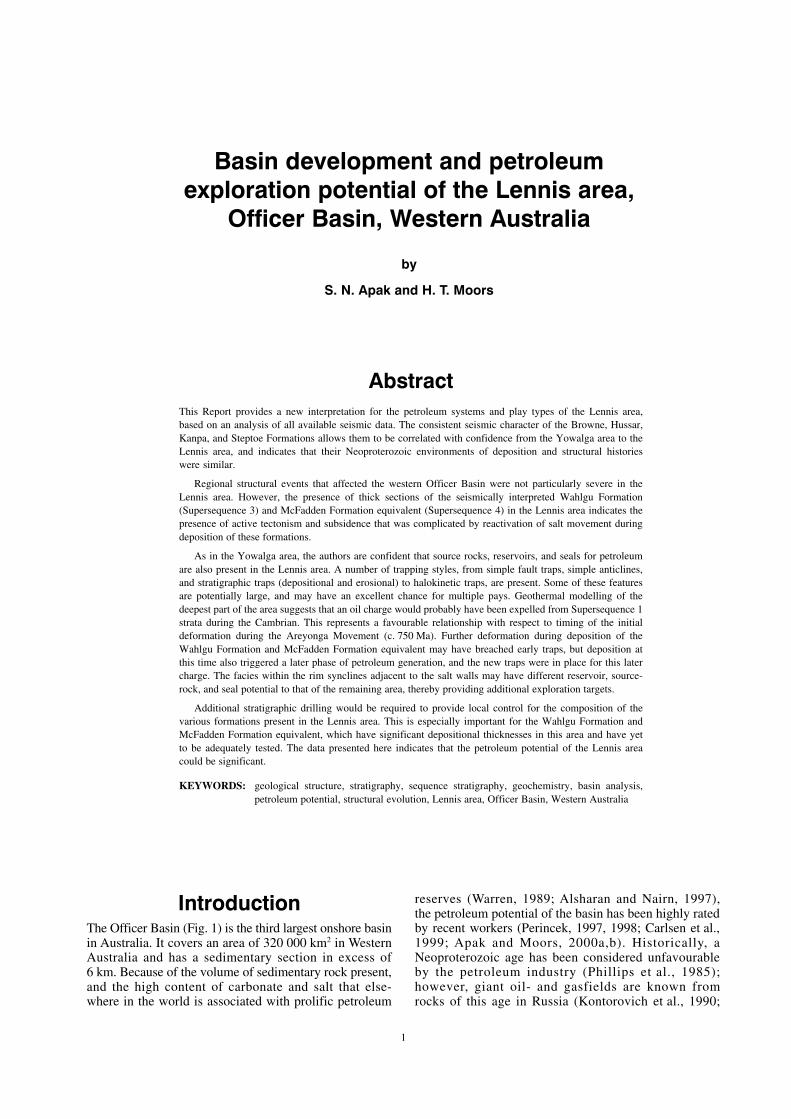
and well control within the basin and was chosen asthe first area to be studied in detail, in order to providea useful template for other portions of the basin (Apakand Moors, 2000b). This Report on the Lennis area(Fig. 1) is the second detailed Report in this series on aspecific region of the basin. The Lennis area is locatedimmediately east of the Yowalga area, but contains only1200 km of regional seismic data and one well, Lennis 1,with a penetration of 614.5 m. Therefore, some of thisReport relies heavily on the preceding Report that dealswith the Yowalga area.
Figure 1. The western Officer Basin, showing major structural elements and sub-areas
100 km
MUSGRAVECOMPLEX
AMADEUSBASIN
BASINCANNING
aW
rriRidge
Anketell
–
01.06.01
Marloo
Fault
L
K
YLG
B
H
DH
B
LG Lungkarta
E
L Lennis 1
WF Westwood Fault
S.A
D
YILGARNCRATON
K Kanpa 1A
Empress 1/1A
E
Dragoon 1
Hussar 1
Drillhole
OfficerBasin
Kingston Shelf
OFFICERBASIN
Yowalga 3Y
zone
Normal fault
Thrust fault
Inferred fault
Lennisstudyarea
WF
Alban
y–Fr
aserW.A.
NA95
Savoryarea
Gibsonarea
Waigenarea
Yowalgastudyarea
Browne 1, 2
Paterson Orogen
EARAHEEDYBASIN
GUNBARREL
BASIN
EUCLABASIN
Officer Basin
Gunbarrel Basin
Gunbarrel Basin(over Officer Basin)
24°00'
26°00'
122°00' 124°00' 126°00' 128°00'
28°00'
30°00'
3
GSWA Report 77 Basin development and petroleum exploration potential of the Lennis area
The Lennis area contains the region that has beenpreviously defined as the Lennis Sub-basin, based onpotential-field data (Townson, 1985). However, whereseismic data are available there appears to be no evidenceof an individual depocentre in this region. Therefore, theauthors prefer to regard the region simply as the Lennisarea.
In the Yowalga area, the middle NeoproterozoicSupersequence 1 has been subdivided into a number ofgenetic units (Apak and Moors, 2000a). The basicsequence concepts and terminology of Van Wagoner et al.(1990) that were applied to the Yowalga area have alsobeen used in the Lennis area. The sequence-stratigraphicunits coincide closely with the lithostratigraphicsubdivisions previously defined by Townson (1985).Seismic data indicates that Supersequence 1 strata arecontinuous between the Yowalga and Lennis areas. TheYowalga area was subsiding at a greater rate than theLennis area during the deposition of Supersequence 1strata, as evidenced by the presence of thicker Super-sequence 1 strata in the Yowalga area (approximately4–5 km) than the Lennis area, which contains Super-sequence 1 strata 2.5 – 4 km thick. However, the presenceof a greater thickness of younger units such as the WahlguFormation and McFadden Formation equivalent in theLennis area (greater than 1.3 km in thickness) indicatesgreater subsidence rates during deposition of these unitsin the Lennis area compared with the Yowalga area wherethey have a thickness of 0.2 – 0.8 km. The application ofsequence-stratigraphic concepts, together with new resultsfrom structural analysis, has improved our understandingof the evolution of the Lennis area. This has assisted inthe identification of additional petroleum plays, as wellas reducing the risk in predicting the distribution of sourcerocks, reservoirs, and seals.
Previous investigationsDue to its isolation, difficult access, and relatively hostileenvironment, the Officer Basin initially received littlegeological attention. Petroleum exploration began in theearly 1950s with exploration by companies such as FromeBroken Hill and Australasian Oil Exploration, but theywere mainly concerned with the Phanerozoic successionof rocks. Early exploration activities relied mainly onsurface mapping, until a consortium comprising Hunt Oil,Hunt Petroleum, Placid Oil, and Exoil was grantedexploration permits in the 1960s. These companiesacquired aerial and land magnetic data, gravity data, and1033 km of seismic reflection data (partly in the Lennisarea), and drilled five wells. These wells were Browne 1and 2, Yowalga 1 and 2, and Lennis 1, which had acombined penetration of 2896 m. Lennis 1, the only welldrilled in the Lennis area (Fig. 2a), was terminated at atotal depth of 614.5 m in the Table Hill Volcanics. Due tothe fact that only minor oil and gas shows wereencountered in Browne 1 and 2 in the Yowalga area (HuntOil Company, 1965), all tenements were dropped.
The early exploration discovered salt diapirs, whichthe Bureau of Mineral Resources (BMR), now theAustralian Geological Survey Organisation (AGSO),
began to investigate in the 1960s. In 1967, GSWA startedmapping in the area as part of their statewide 1:250 000mapping program (Fig. 3), concentrating mainly on theMusgrave Complex (Daniels, 1974). In order to acceleratethe mapping, a joint operation between GSWA and BMRwas initiated to cover other parts of the Officer Basin(Daniels, 1970, 1971; Jackson, 1976, 1978; Kennewell,1977a,b; Bunting et al., 1978). As well as surfacemapping, gravity data and 19 line-km of seismic refractiondata were acquired. In 1972, a series of short stratigraphiccoreholes were drilled in the Lennis area (Fig. 2b;Perincek, 1996). All of these data were incorporated intoa joint BMR–GSWA Bulletin on the Officer Basin(Jackson and van de Graaff, 1981).
As a result of this improved knowledge, ShellCompany of Australia acquired exploration permits in theYowalga and Lennis areas. The company recorded 4682line-km of seismic reflection data (mostly in the Yowalgaarea) and drilled three deep wells (none in the Lennisarea), the deepest being Yowalga 3 to 4196 m. As a resultof its investigations, the company divided the OfficerBasin into sub-basins, improved the stratigraphicsubdivision by adding additional formations, anddiscussed basin development from the point of view ofpetroleum exploration (Townson, 1985). In the absenceof significant shows, Shell Company of Australiarelinquished its tenements in 1984 and 1985.
The most recent petroleum investigation was carriedout by Japan National Oil Corporation (JNOC) under aspecial prospecting authority (SPA No. 1/95–96) coveringmost of the Yowalga area (Apak and Moors, 2000b,fig. 2). They flew a high-resolution aeromagnetic surveytotalling 86 782 line-km and reprocessed 50 key seismiclines (2165 line-km). In addition, drill cuttings from wellsin and around the Yowalga area were analysed for source-rock potential, and detailed thermal maturation historieswere completed for the area. The SPA has now expiredand basic data containing JNOC’s interpretations (JapanNational Oil Corporation, 1997) are on open file atGSWA.
There are more detailed reviews of the earlier phasesof exploration, with statistics on drilling, and geophysicaland geochemical surveys, in Jackson and van de Graaff(1981), Perincek (1998), and Ghori (1998a).
Current GSWA investigationThe Officer Basin is being studied by GSWA as part ofa Petroleum Exploration Initiative set up by theState Government of Western Australia in 1994, withencouragement from the petroleum industry, in order toinvestigate underexplored areas of the onshore basins.
The initial phase of the investigation comprised thecollection of all open-file data on the Officer Basin,validation of the data, and the construction of an integratedreinterpretation. All of the seismic lines were reinterpreted,formation tops were repicked in all wells, and additionalorganic geochemical analyses were performed on samplesfrom key wells. Perincek (1996, 1997, 1998) publishedthese data in three reports. A fourth publication (Stevens
4
Apak and Moors
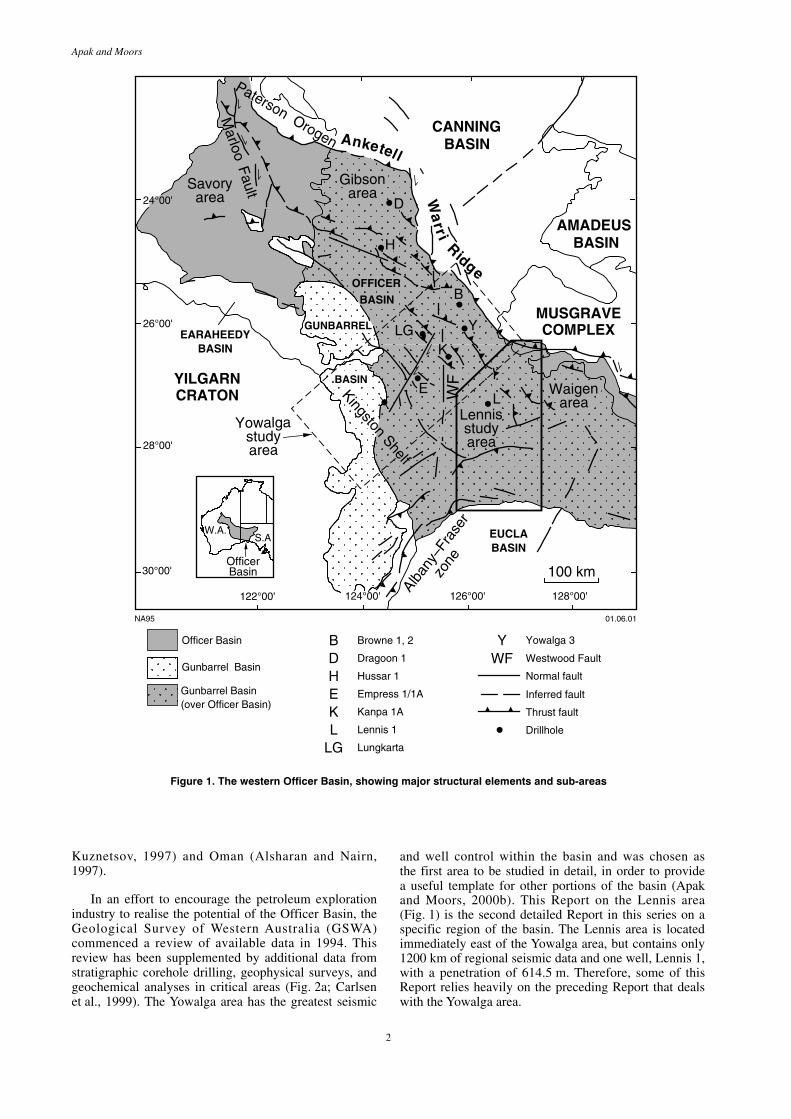
Figure 2. a) Location of petroleum exploration wells, stratigraphic tests, mineral exploration drillholes,and complete seismic coverage over the western Officer Basin
Akubra 1
BMR Browne 1
BMR Yowalga 1,2,3BMR Yowalga 4
Boondawari 1
Browne 1Browne 2
Dragoon 1
GSWA Trainor 1
Hussar 1
Kanpa 1/1A
Lennis 1
Lungkarta 1
Mundadjini 1
Yowalga 3
CANNINGBASIN
MUSGRAVECOMPLEX
EUCLA BASIN
SAVORY AREA
WAIGEN AREA
AMADEUSBASIN
ARUNTAOROGEN
OFFICERBASIN
GIBSON
AREA
WE
ST
ER
N A
US
TR
ALI
AS
OU
TH
AU
ST
RA
LIA
200 km30°00'
28°00'
26°00'
22°00'
24°00'
126°00'124°00'122°00' 128°00'
NA79 01.06.01
Yowalga 1, 2
YILGARNCRATON
GSWAEmpress 1/1A
Exploration well
Stratigraphic well
RUDALLCOMPLEX
Seismic line
Japan National OilCorporation SPA
LENNISSTUDYAREA
Paterson OrogenOfficer Basin
Gunbarrel Basin
Gunbarrel Basin(over Officer Basin)
EARAHEEDYBASIN
GUNBARREL
BASIN
Drillhole (some cored)
and Carlsen, 1998) covers the ‘Savory Sub-Basin’, nowreferred to as the northwestern Officer Basin (Bagas et al.,1999). Corehole drilling of Trainor 1 (Stevens andAdamides, 1998) and Empress 1 and 1A (Stevens andApak, 1999) provided additional information for a fifthpublication (Carlsen et al., 1999) that concentrates on thepetroleum potential of the basin in relation to a newsource-rock model developed from Empress 1 and 1A.Recently, in a sixth publication, Apak and Moors, (2000b)described the Yowalga area, where the greatest amount ofseismic and well data are available. The application ofsequence stratigraphy has provided a new interpretationof the configuration and evolution of the western OfficerBasin, as well as a better definition of its petroleum
systems. In this Report, the seventh publication of theproject, an attempt has been made to assess the petroleumpotential of the adjoining Lennis area, using conceptsestablished for the Yowalga area, even though the Lennisarea has less seismic control and no significant wellcontrol (Fig. 2a).
Location and accessThe Lennis area is a remote and underpopulated regionof Western Australia, and is 1300 km northeast of Perth.Nearby population centres include Cosmo Newbery,Warburton, Jameson, Blackstone, and Wingellina. There
5
GSWA Report 77 Basin development and petroleum exploration potential of the Lennis area
BMR Yowalga 1,2,3
Lennis 1
Yowalga 1, 2
20 km
LENNISSTUDYAREA
Kanpa 1/1A
Fig. 12
Fig.
9
Fig.
7
Japan NationalOil Corporation SPA
NA112 30.04.01
Stratigraphic well
Seismic section
Seismic section (in Report)
27°00'
27°30'
26°30'
127°00'126°00'
Fig. 15
Fig. 13
Fig.
10
Fig.
14
Yowalga 3
Exploration well
Stratigraphic well, gas show
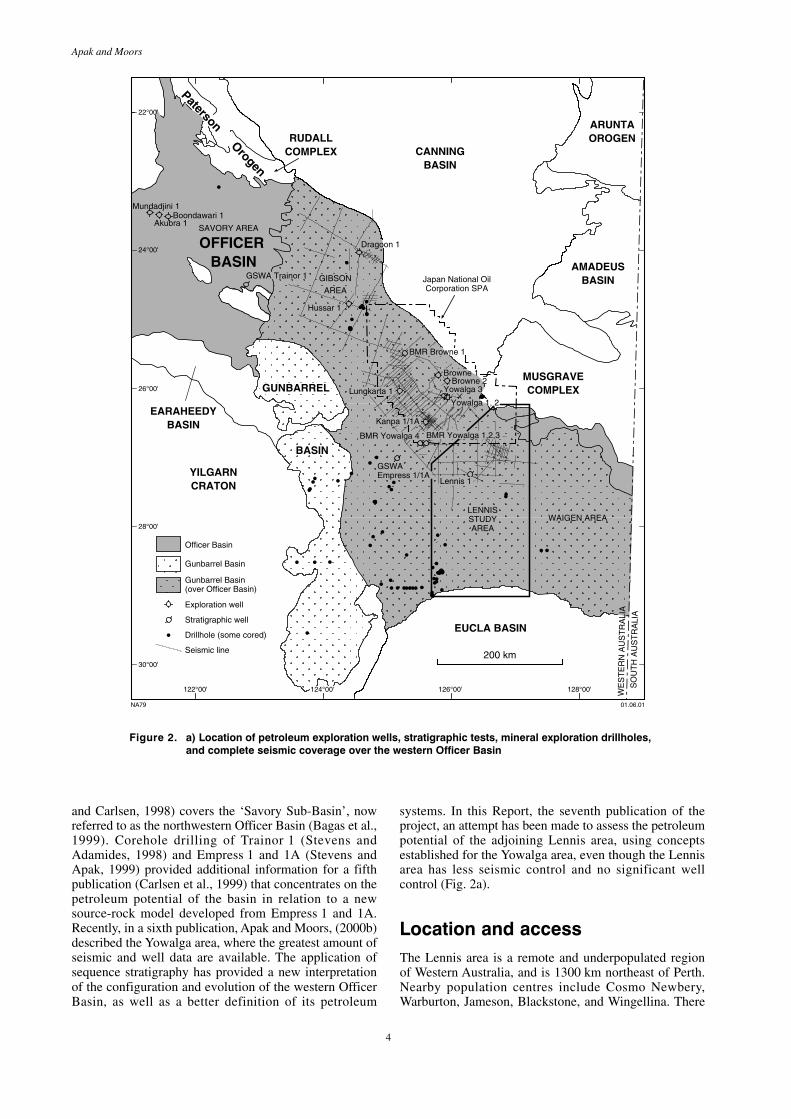
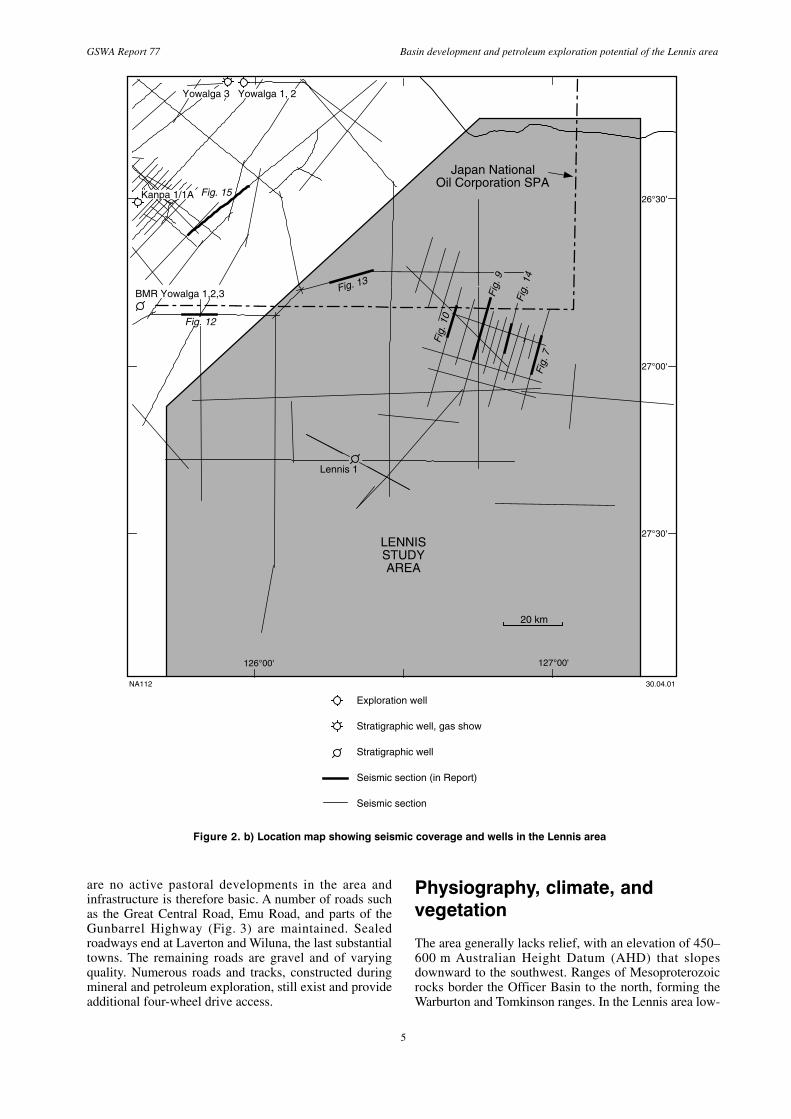
Figure 2. b) Location map showing seismic coverage and wells in the Lennis area
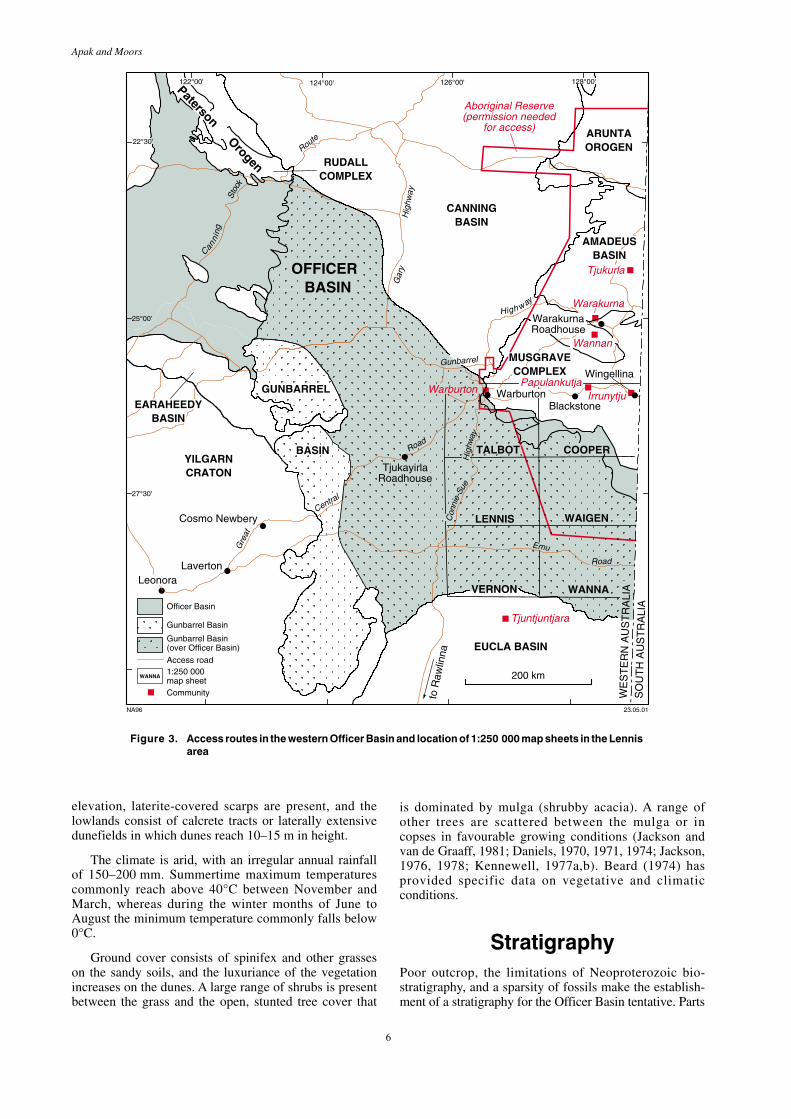
are no active pastoral developments in the area andinfrastructure is therefore basic. A number of roads suchas the Great Central Road, Emu Road, and parts of theGunbarrel Highway (Fig. 3) are maintained. Sealedroadways end at Laverton and Wiluna, the last substantialtowns. The remaining roads are gravel and of varyingquality. Numerous roads and tracks, constructed duringmineral and petroleum exploration, still exist and provideadditional four-wheel drive access.
Physiography, climate, andvegetation
The area generally lacks relief, with an elevation of 450–600 m Australian Height Datum (AHD) that slopesdownward to the southwest. Ranges of Mesoproterozoicrocks border the Officer Basin to the north, forming theWarburton and Tomkinson ranges. In the Lennis area low-
6
Apak and Moors
elevation, laterite-covered scarps are present, and thelowlands consist of calcrete tracts or laterally extensivedunefields in which dunes reach 10–15 m in height.
The climate is arid, with an irregular annual rainfallof 150–200 mm. Summertime maximum temperaturescommonly reach above 40°C between November andMarch, whereas during the winter months of June toAugust the minimum temperature commonly falls below0°C.
Ground cover consists of spinifex and other grasseson the sandy soils, and the luxuriance of the vegetationincreases on the dunes. A large range of shrubs is presentbetween the grass and the open, stunted tree cover that
is dominated by mulga (shrubby acacia). A range ofother trees are scattered between the mulga or incopses in favourable growing conditions (Jackson andvan de Graaff, 1981; Daniels, 1970, 1971, 1974; Jackson,1976, 1978; Kennewell, 1977a,b). Beard (1974) hasprovided specific data on vegetative and climaticconditions.
StratigraphyPoor outcrop, the limitations of Neoproterozoic bio-stratigraphy, and a sparsity of fossils make the establish-ment of a stratigraphy for the Officer Basin tentative. Parts
Figure 3. Access routes in the western Officer Basin and location of 1:250 000 map sheets in the Lennisarea
Aboriginal Reserve(permission needed
for access)
Tjuntjuntjara
Warakurna
Tjukurla
PapulankutjaIrrunytju
Warburton
Route
Gunbarrel
Gar
y
EmuGre
at
Central
Road
Road
Hig
hway
Con
nie-
Su
e
Highw ay
Can
ning
Stoc
k
122°00' 124°00' 126°00' 128°00'
25°00'
LeonoraLaverton
Cosmo Newbery
Warburton
WE
ST
ER
N A
US
TR
ALI
AS
OU
TH
AU
ST
RA
LIA
NA96
to R
awlin
na
1:250 000map sheet
WANNA
23.05.01
Hig
hway
Access road
COOPERTALBOT
LENNIS WAIGEN
WANNAVERNON
Paterson Orogen
ARUNTAOROGEN
MUSGRAVECOMPLEX
CANNINGBASIN
RUDALLCOMPLEX
YILGARNCRATON
EARAHEEDYBASIN
EUCLA BASIN
GUNBARREL
BASIN
OFFICERBASIN
Officer Basin
Gunbarrel Basin(over Officer Basin)
Gunbarrel Basin
200 km
TjukayirlaRoadhouse
WarakurnaRoadhouse
AMADEUSBASIN
Blackstone
Wingellina
27°30'
22°30'
Community
Wannan
7
GSWA Report 77 Basin development and petroleum exploration potential of the Lennis area
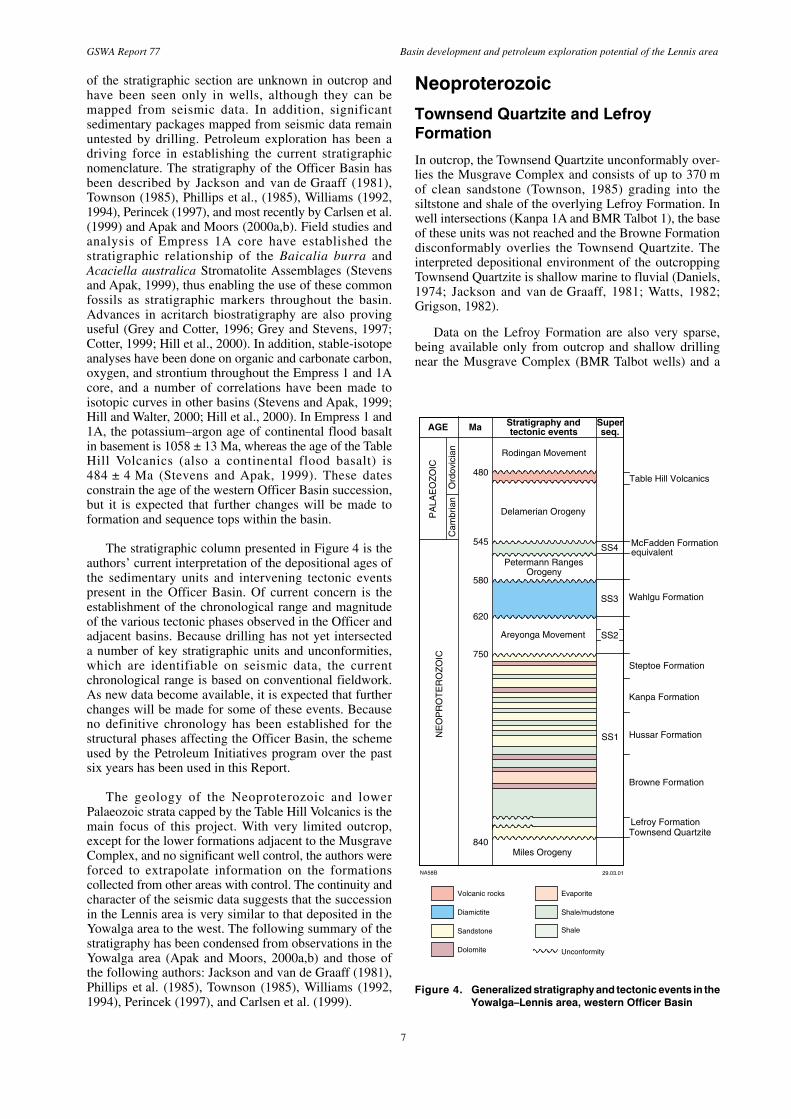
of the stratigraphic section are unknown in outcrop andhave been seen only in wells, although they can bemapped from seismic data. In addition, significantsedimentary packages mapped from seismic data remainuntested by drilling. Petroleum exploration has been adriving force in establishing the current stratigraphicnomenclature. The stratigraphy of the Officer Basin hasbeen described by Jackson and van de Graaff (1981),Townson (1985), Phillips et al., (1985), Williams (1992,1994), Perincek (1997), and most recently by Carlsen et al.(1999) and Apak and Moors (2000a,b). Field studies andanalysis of Empress 1A core have established thestratigraphic relationship of the Baicalia burra andAcaciella australica Stromatolite Assemblages (Stevensand Apak, 1999), thus enabling the use of these commonfossils as stratigraphic markers throughout the basin.Advances in acritarch biostratigraphy are also provinguseful (Grey and Cotter, 1996; Grey and Stevens, 1997;Cotter, 1999; Hill et al., 2000). In addition, stable-isotopeanalyses have been done on organic and carbonate carbon,oxygen, and strontium throughout the Empress 1 and 1Acore, and a number of correlations have been made toisotopic curves in other basins (Stevens and Apak, 1999;Hill and Walter, 2000; Hill et al., 2000). In Empress 1 and1A, the potassium–argon age of continental flood basaltin basement is 1058 ± 13 Ma, whereas the age of the TableHill Volcanics (also a continental flood basalt) is484 ± 4 Ma (Stevens and Apak, 1999). These datesconstrain the age of the western Officer Basin succession,but it is expected that further changes will be made toformation and sequence tops within the basin.
The stratigraphic column presented in Figure 4 is theauthors’ current interpretation of the depositional ages ofthe sedimentary units and intervening tectonic eventspresent in the Officer Basin. Of current concern is theestablishment of the chronological range and magnitudeof the various tectonic phases observed in the Officer andadjacent basins. Because drilling has not yet intersecteda number of key stratigraphic units and unconformities,which are identifiable on seismic data, the currentchronological range is based on conventional fieldwork.As new data become available, it is expected that furtherchanges will be made for some of these events. Becauseno definitive chronology has been established for thestructural phases affecting the Officer Basin, the schemeused by the Petroleum Initiatives program over the pastsix years has been used in this Report.
The geology of the Neoproterozoic and lowerPalaeozoic strata capped by the Table Hill Volcanics is themain focus of this project. With very limited outcrop,except for the lower formations adjacent to the MusgraveComplex, and no significant well control, the authors wereforced to extrapolate information on the formationscollected from other areas with control. The continuity andcharacter of the seismic data suggests that the successionin the Lennis area is very similar to that deposited in theYowalga area to the west. The following summary of thestratigraphy has been condensed from observations in theYowalga area (Apak and Moors, 2000a,b) and those ofthe following authors: Jackson and van de Graaff (1981),Phillips et al. (1985), Townson (1985), Williams (1992,1994), Perincek (1997), and Carlsen et al. (1999).
Neoproterozoic
Townsend Quartzite and LefroyFormation
In outcrop, the Townsend Quartzite unconformably over-lies the Musgrave Complex and consists of up to 370 mof clean sandstone (Townson, 1985) grading into thesiltstone and shale of the overlying Lefroy Formation. Inwell intersections (Kanpa 1A and BMR Talbot 1), the baseof these units was not reached and the Browne Formationdisconformably overlies the Townsend Quartzite. Theinterpreted depositional environment of the outcroppingTownsend Quartzite is shallow marine to fluvial (Daniels,1974; Jackson and van de Graaff, 1981; Watts, 1982;Grigson, 1982).
Data on the Lefroy Formation are also very sparse,being available only from outcrop and shallow drillingnear the Musgrave Complex (BMR Talbot wells) and a
AGE MaP
ALA
EO
ZO
ICN
EO
PR
OT
ER
OZ
OIC
Rodingan Movement
Delamerian Orogeny
Wahlgu Formation
Miles Orogeny
480
545
580
620
750
840
SS3
SS1
SS2
SS4
Sandstone
Shale/mudstone
Dolomite
Diamictite
Steptoe Formation
Browne Formation
Hussar Formation
Kanpa Formation
Table Hill Volcanics
Petermann RangesOrogeny
29.03.01
Stratigraphy andtectonic events
Superseq.
Evaporite
Unconformity
Areyonga Movement
McFadden Formationequivalent
Volcanic rocks
Ord
ovic
ian
Cam
bria
n
Townsend QuartziteLefroy Formation
Shale
NA58B
Figure 4. Generalized stratigraphy and tectonic events in theYowalga–Lennis area, western Officer Basin
8
Apak and Moors
possible short intersection in Empress 1A (Stevens andApak, 1999). In Empress 1A, the ?Lefroy Formationunconformably overlies the pre-Officer Basin strata witha thin, basal lag conglomerate. Lithologies identified aregrey or maroon, well-bedded siltstone, claystone, and finesandstone. The sediments were deposited in a low-energy,deeper water marine environment close to or below wavebase. Apak and Moors (2000b) have suggested that theLefroy Formation is a deeper water facies of the TownsendQuartzite.
Browne Formation
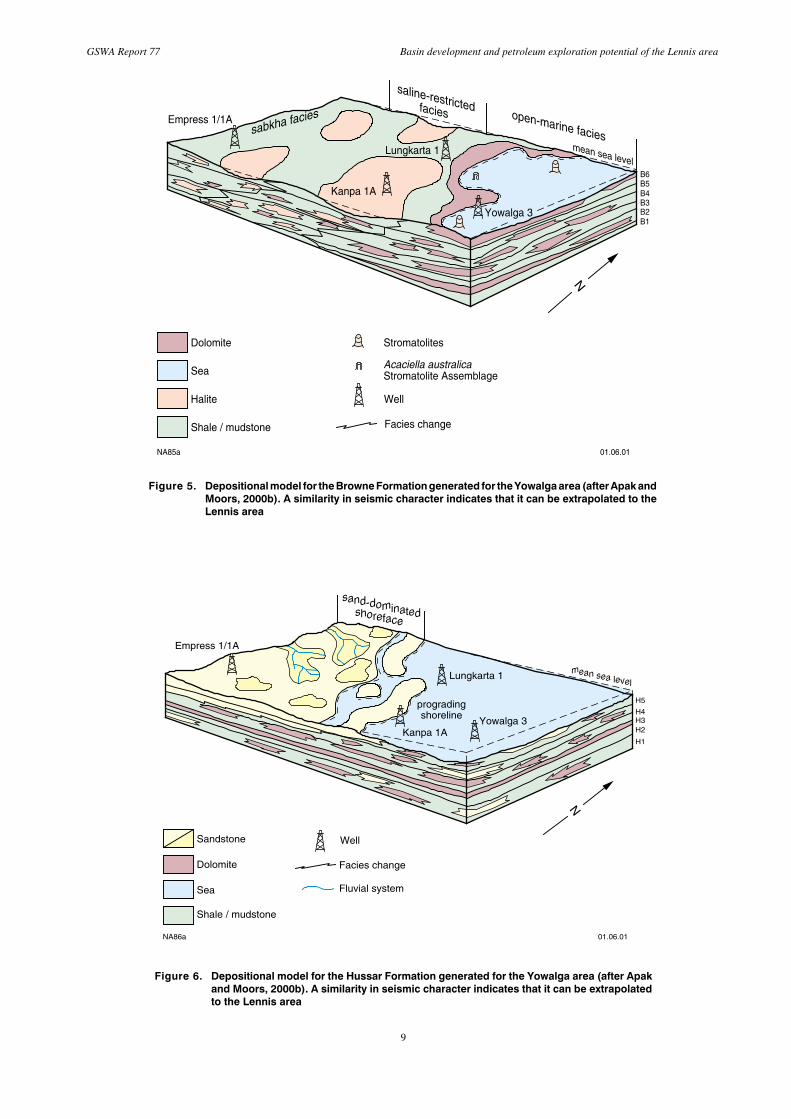
There is no outcrop of the Browne Formation in theLennis area. Jackson (1976) first used the name ‘BrowneEvaporites’ for the evaporites in shallow wells onBROWNE*. Yowalga 3 and Kanpa 1A were the firstsignificant intersections of this unit and it was named theBrowne Formation by Cockbain and Hocking (1989). Thelower contact of the Browne Formation is disconformableon the ?Lefroy Formation in Empress 1A and theTownsend Quartzite in Kanpa 1A. Its upper contact isconformable with the overlying Hussar Formation, exceptin areas of diapiric intrusion such as in Browne 1 and 2where it may be unconformably overlain by Palaeozoicor younger strata. The formation has been intersected inthe Yowalga area in Browne 1 and 2, Empress 1A,Kanpa 1A, and Yowalga 3, which has the thickest section(greater than 2308 m). The Browne Formation iscomposed predominantly of red shale and siltstoneinterbedded with stromatolitic dolomite, halite, minoranhydrite, and sandstone. Thick halite deposits are presentin Empress 1A, Kanpa 1A, and Yowalga 3. Units of solidhalite up to 10 m thick were cored in Empress 1A. Welldata also indicate much thicker halite beds, interbeddedwith thin silty and shaly horizons, in Yowalga 3 andKanpa 1A (Apak and Moors, 2000a,b). Although nottested by drilling, the similar seismic character to that ofthe Yowalga area, including halokinetic features, suggeststhat similar lithologies are present in the Lennis area.
In the Browne Formation (Fig. 5) the narrow range offacies variations, from shallow marine to sabkha, indicatestectonic stability and a balance between sediment inputand the creation of accommodation space duringdeposition. It is difficult to define any structural controlon deposition because of the poor resolution of subsaltseismic data and the lack of wells that fully penetrate theformation. The Acaciella australica StromatoliteAssemblage has been identified in the dolomite of theBrowne Formation in Yowalga 3 and Empress 1A, and isa useful correlation tool.
Hussar Formation
The name ‘Hussar beds’ was proposed informally byTownson (1985), and later elevated to Hussar Formationby Cockbain and Hocking (1989). The Hussar Formationconformably overlies the Browne Formation, and isconformably overlain by the Kanpa Formation. The
Hussar Formation has been penetrated in Hussar 1,Kanpa 1A, Lungkarta 1, Yowalga 3, and Empress 1A, andthe greatest thickness was penetrated in Yowalga 3(897 m).
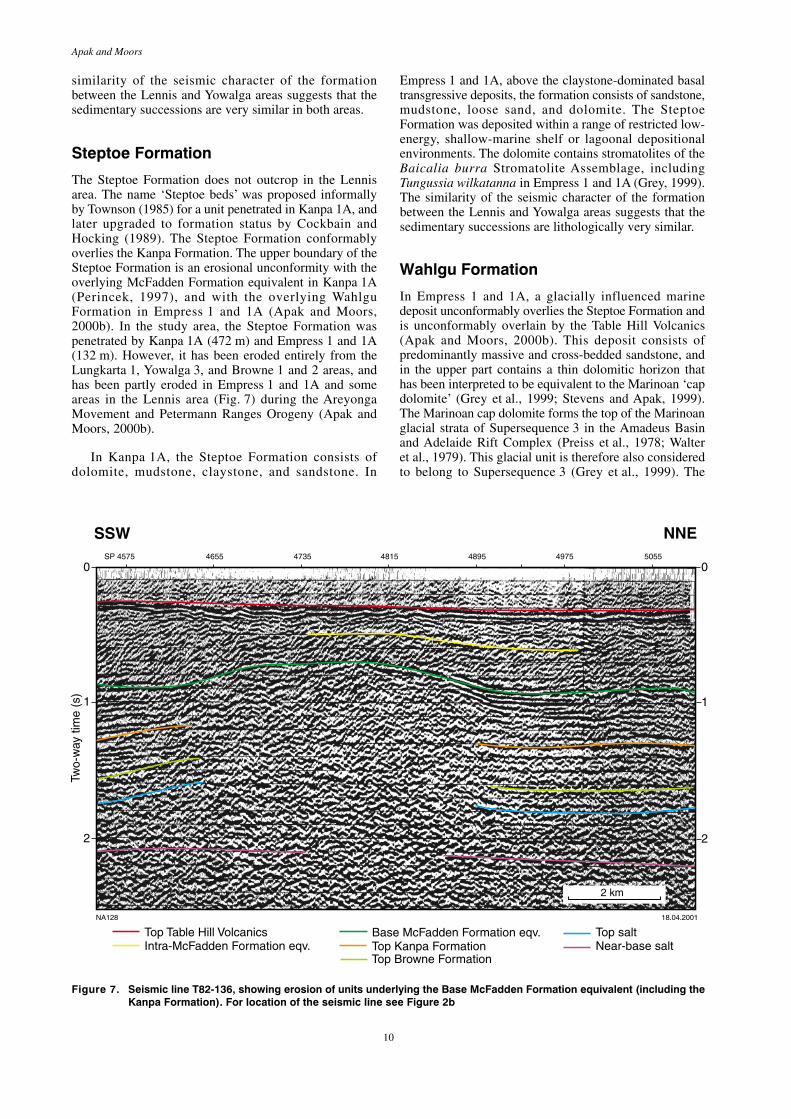
The Hussar Formation is composed of sandstone,mudstone, dolomite, and minor evaporite, with conglom-erate locally developed. The formation contains repeatedprogradational cycles deposited in shelf, shoreline, tidalflat, and fluvial environments in which upward-coarseningshoreface sandstones predominate. Some of these units areconsidered to be the principal reservoirs in the westernOfficer Basin. The depositional model and faciesvariations for the Hussar Formation are shown in Figure 6.A very low-relief basinal setting is proposed. Dolomiteunits contain ?Tungussia form indet. and the Baicaliaburra Stromatolite Assemblage, and the planktonicacritarch Cerebrosphaera buickii is present in siltstone andmudstone sections in Empress 1A (Grey, 1999). Thesimilarity of the seismic character of this formation in theLennis and Yowalga areas suggests that the sedimentarysuccessions in both areas are similar.
Kanpa Formation
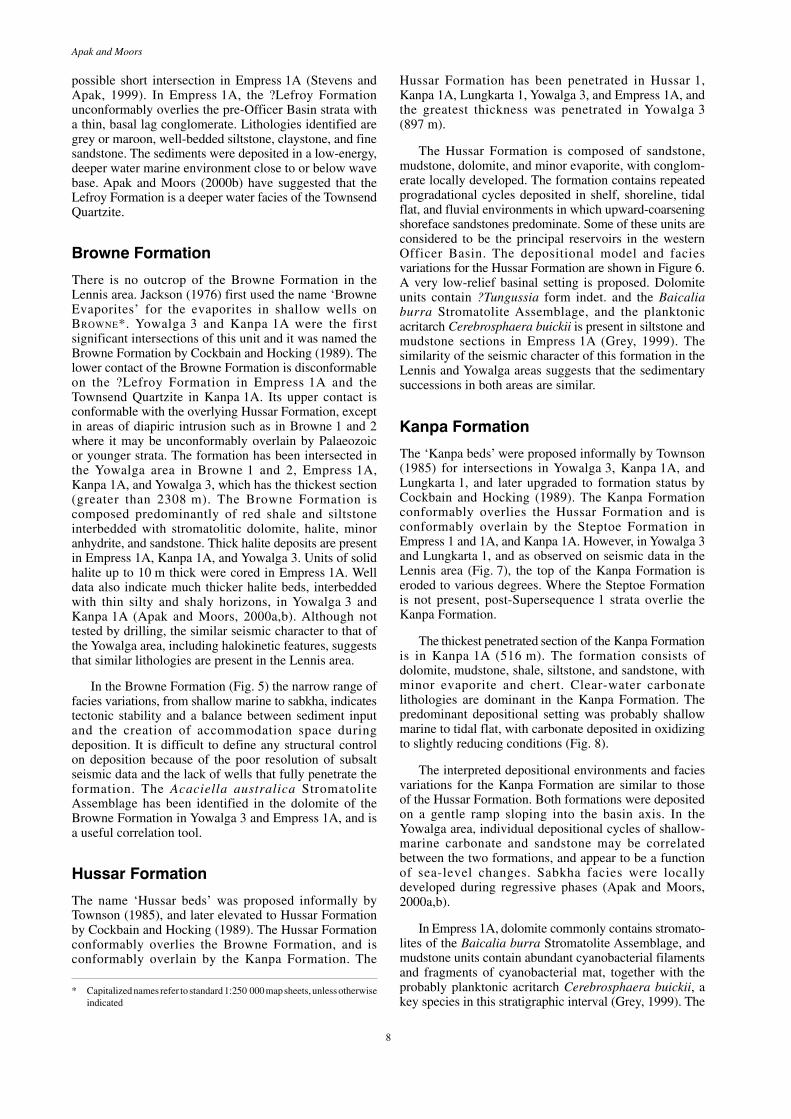
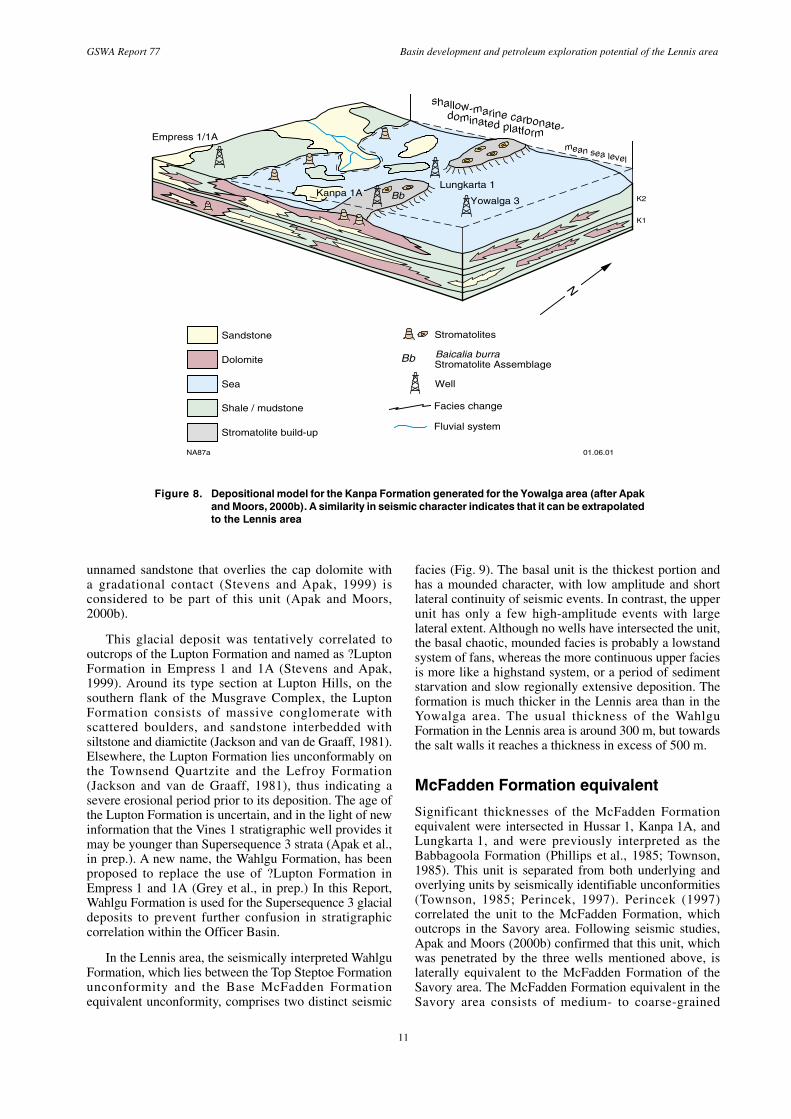
The ‘Kanpa beds’ were proposed informally by Townson(1985) for intersections in Yowalga 3, Kanpa 1A, andLungkarta 1, and later upgraded to formation status byCockbain and Hocking (1989). The Kanpa Formationconformably overlies the Hussar Formation and isconformably overlain by the Steptoe Formation inEmpress 1 and 1A, and Kanpa 1A. However, in Yowalga 3and Lungkarta 1, and as observed on seismic data in theLennis area (Fig. 7), the top of the Kanpa Formation iseroded to various degrees. Where the Steptoe Formationis not present, post-Supersequence 1 strata overlie theKanpa Formation.
The thickest penetrated section of the Kanpa Formationis in Kanpa 1A (516 m). The formation consists ofdolomite, mudstone, shale, siltstone, and sandstone, withminor evaporite and chert. Clear-water carbonatelithologies are dominant in the Kanpa Formation. Thepredominant depositional setting was probably shallowmarine to tidal flat, with carbonate deposited in oxidizingto slightly reducing conditions (Fig. 8).
The interpreted depositional environments and faciesvariations for the Kanpa Formation are similar to thoseof the Hussar Formation. Both formations were depositedon a gentle ramp sloping into the basin axis. In theYowalga area, individual depositional cycles of shallow-marine carbonate and sandstone may be correlatedbetween the two formations, and appear to be a functionof sea-level changes. Sabkha facies were locallydeveloped during regressive phases (Apak and Moors,2000a,b).
In Empress 1A, dolomite commonly contains stromato-lites of the Baicalia burra Stromatolite Assemblage, andmudstone units contain abundant cyanobacterial filamentsand fragments of cyanobacterial mat, together with theprobably planktonic acritarch Cerebrosphaera buickii, akey species in this stratigraphic interval (Grey, 1999). The
* Capitalized names refer to standard 1:250 000 map sheets, unless otherwiseindicated
9
GSWA Report 77 Basin development and petroleum exploration potential of the Lennis area
Stromatolites
B1B2
B6B5B4B3
mean sea level
saline-restrictedfacies open-marine faciessabkha facies
Dolomite
Yowalga 3
Empress 1/1A
Shale / mudstone
01.06.01
Kanpa 1A
Lungkarta 1
Halite
SeaAcaciella australicaStromatolite Assemblage
Facies change
Well
NA85a
N
Figure 5. Depositional model for the Browne Formation generated for the Yowalga area (after Apak andMoors, 2000b). A similarity in seismic character indicates that it can be extrapolated to theLennis area
Sandstone
H5
H4H3H2
H1
sand-dominatedshoreface
progradingshoreline
mean sea level
Dolomite
Empress 1/1A
Yowalga 3
Shale / mudstone
Sea
Kanpa 1A
Lungkarta 1
01.06.01
Facies change
Well
NA86a
Fluvial system
N
Figure 6. Depositional model for the Hussar Formation generated for the Yowalga area (after Apakand Moors, 2000b). A similarity in seismic character indicates that it can be extrapolatedto the Lennis area
10
Apak and Moors
similarity of the seismic character of the formationbetween the Lennis and Yowalga areas suggests that thesedimentary successions are very similar in both areas.
Steptoe Formation
The Steptoe Formation does not outcrop in the Lennisarea. The name ‘Steptoe beds’ was proposed informallyby Townson (1985) for a unit penetrated in Kanpa 1A, andlater upgraded to formation status by Cockbain andHocking (1989). The Steptoe Formation conformablyoverlies the Kanpa Formation. The upper boundary of theSteptoe Formation is an erosional unconformity with theoverlying McFadden Formation equivalent in Kanpa 1A(Perincek, 1997), and with the overlying WahlguFormation in Empress 1 and 1A (Apak and Moors,2000b). In the study area, the Steptoe Formation waspenetrated by Kanpa 1A (472 m) and Empress 1 and 1A(132 m). However, it has been eroded entirely from theLungkarta 1, Yowalga 3, and Browne 1 and 2 areas, andhas been partly eroded in Empress 1 and 1A and someareas in the Lennis area (Fig. 7) during the AreyongaMovement and Petermann Ranges Orogeny (Apak andMoors, 2000b).
In Kanpa 1A, the Steptoe Formation consists ofdolomite, mudstone, claystone, and sandstone. In
Empress 1 and 1A, above the claystone-dominated basaltransgressive deposits, the formation consists of sandstone,mudstone, loose sand, and dolomite. The SteptoeFormation was deposited within a range of restricted low-energy, shallow-marine shelf or lagoonal depositionalenvironments. The dolomite contains stromatolites of theBaicalia burra Stromatolite Assemblage, includingTungussia wilkatanna in Empress 1 and 1A (Grey, 1999).The similarity of the seismic character of the formationbetween the Lennis and Yowalga areas suggests that thesedimentary successions are lithologically very similar.
Wahlgu Formation
In Empress 1 and 1A, a glacially influenced marinedeposit unconformably overlies the Steptoe Formation andis unconformably overlain by the Table Hill Volcanics(Apak and Moors, 2000b). This deposit consists ofpredominantly massive and cross-bedded sandstone, andin the upper part contains a thin dolomitic horizon thathas been interpreted to be equivalent to the Marinoan ‘capdolomite’ (Grey et al., 1999; Stevens and Apak, 1999).The Marinoan cap dolomite forms the top of the Marinoanglacial strata of Supersequence 3 in the Amadeus Basinand Adelaide Rift Complex (Preiss et al., 1978; Walteret al., 1979). This glacial unit is therefore also consideredto belong to Supersequence 3 (Grey et al., 1999). The
Intra-McFadden Formation eqv.Top Table Hill Volcanics
Top Kanpa FormationTop saltBase McFadden Formation eqv.
Top Browne Formation
Two-
way
tim
e (s
)
SP 4575
0
1
SSW NNE
2
4655 4735 4895 5055
0
1
2
4815 4975
Near-base salt
2 km
NA128 18.04.2001
Figure 7. Seismic line T82-136, showing erosion of units underlying the Base McFadden Formation equivalent (including theKanpa Formation). For location of the seismic line see Figure 2b
11
GSWA Report 77 Basin development and petroleum exploration potential of the Lennis area
unnamed sandstone that overlies the cap dolomite witha gradational contact (Stevens and Apak, 1999) isconsidered to be part of this unit (Apak and Moors,2000b).
This glacial deposit was tentatively correlated tooutcrops of the Lupton Formation and named as ?LuptonFormation in Empress 1 and 1A (Stevens and Apak,1999). Around its type section at Lupton Hills, on thesouthern flank of the Musgrave Complex, the LuptonFormation consists of massive conglomerate withscattered boulders, and sandstone interbedded withsiltstone and diamictite (Jackson and van de Graaff, 1981).Elsewhere, the Lupton Formation lies unconformably onthe Townsend Quartzite and the Lefroy Formation(Jackson and van de Graaff, 1981), thus indicating asevere erosional period prior to its deposition. The age ofthe Lupton Formation is uncertain, and in the light of newinformation that the Vines 1 stratigraphic well provides itmay be younger than Supersequence 3 strata (Apak et al.,in prep.). A new name, the Wahlgu Formation, has beenproposed to replace the use of ?Lupton Formation inEmpress 1 and 1A (Grey et al., in prep.) In this Report,Wahlgu Formation is used for the Supersequence 3 glacialdeposits to prevent further confusion in stratigraphiccorrelation within the Officer Basin.
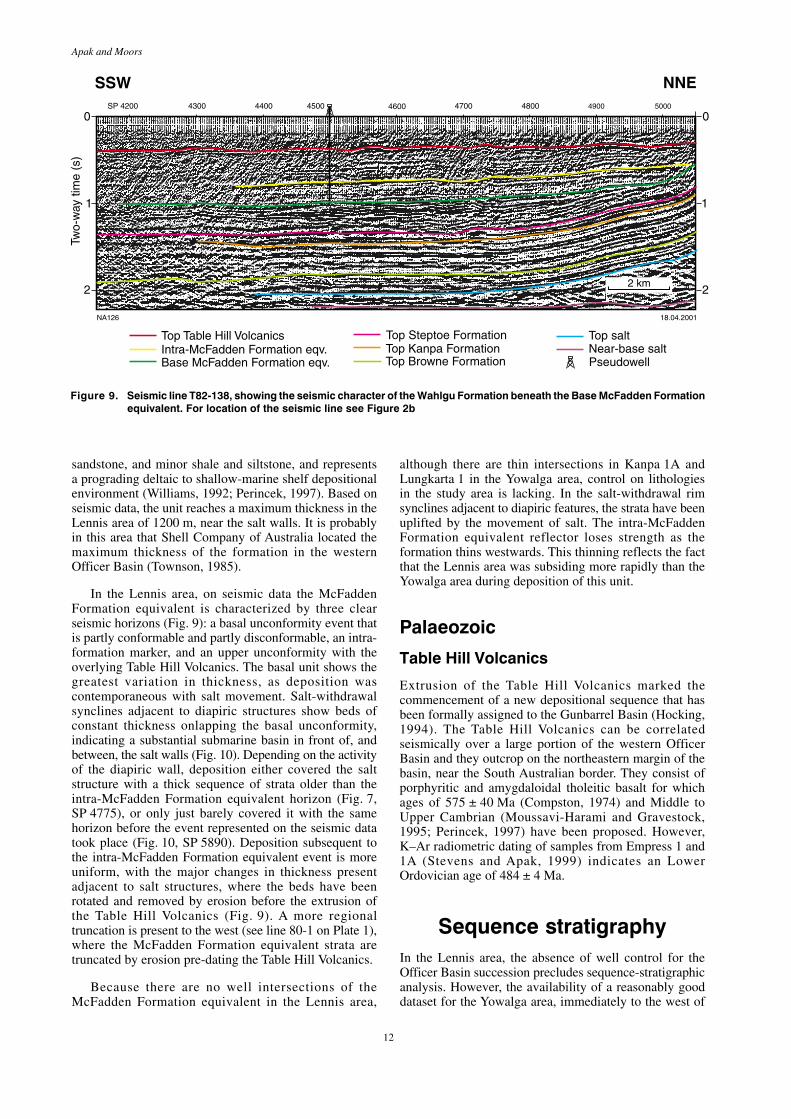
In the Lennis area, the seismically interpreted WahlguFormation, which lies between the Top Steptoe Formationunconformity and the Base McFadden Formationequivalent unconformity, comprises two distinct seismic
facies (Fig. 9). The basal unit is the thickest portion andhas a mounded character, with low amplitude and shortlateral continuity of seismic events. In contrast, the upperunit has only a few high-amplitude events with largelateral extent. Although no wells have intersected the unit,the basal chaotic, mounded facies is probably a lowstandsystem of fans, whereas the more continuous upper faciesis more like a highstand system, or a period of sedimentstarvation and slow regionally extensive deposition. Theformation is much thicker in the Lennis area than in theYowalga area. The usual thickness of the WahlguFormation in the Lennis area is around 300 m, but towardsthe salt walls it reaches a thickness in excess of 500 m.
McFadden Formation equivalent
Significant thicknesses of the McFadden Formationequivalent were intersected in Hussar 1, Kanpa 1A, andLungkarta 1, and were previously interpreted as theBabbagoola Formation (Phillips et al., 1985; Townson,1985). This unit is separated from both underlying andoverlying units by seismically identifiable unconformities(Townson, 1985; Perincek, 1997). Perincek (1997)correlated the unit to the McFadden Formation, whichoutcrops in the Savory area. Following seismic studies,Apak and Moors (2000b) confirmed that this unit, whichwas penetrated by the three wells mentioned above, islaterally equivalent to the McFadden Formation of theSavory area. The McFadden Formation equivalent in theSavory area consists of medium- to coarse-grained
Bb
mean sea level
Sandstone Stromatolites
Bb
K1
K2
Dolomite
Empress 1/1A
Yowalga 3
Sea
Stromatolite AssemblageBaicalia burra
Kanpa 1ALungkarta 1
01.06.01
Shale / mudstone Facies change
Stromatolite build-up
shallow-marine carbonate-dominated platform
Fluvial system
NA87a
Well
N
Figure 8. Depositional model for the Kanpa Formation generated for the Yowalga area (after Apakand Moors, 2000b). A similarity in seismic character indicates that it can be extrapolatedto the Lennis area
12
Apak and Moors
sandstone, and minor shale and siltstone, and representsa prograding deltaic to shallow-marine shelf depositionalenvironment (Williams, 1992; Perincek, 1997). Based onseismic data, the unit reaches a maximum thickness in theLennis area of 1200 m, near the salt walls. It is probablyin this area that Shell Company of Australia located themaximum thickness of the formation in the westernOfficer Basin (Townson, 1985).
In the Lennis area, on seismic data the McFaddenFormation equivalent is characterized by three clearseismic horizons (Fig. 9): a basal unconformity event thatis partly conformable and partly disconformable, an intra-formation marker, and an upper unconformity with theoverlying Table Hill Volcanics. The basal unit shows thegreatest variation in thickness, as deposition wascontemporaneous with salt movement. Salt-withdrawalsynclines adjacent to diapiric structures show beds ofconstant thickness onlapping the basal unconformity,indicating a substantial submarine basin in front of, andbetween, the salt walls (Fig. 10). Depending on the activityof the diapiric wall, deposition either covered the saltstructure with a thick sequence of strata older than theintra-McFadden Formation equivalent horizon (Fig. 7,SP 4775), or only just barely covered it with the samehorizon before the event represented on the seismic datatook place (Fig. 10, SP 5890). Deposition subsequent tothe intra-McFadden Formation equivalent event is moreuniform, with the major changes in thickness presentadjacent to salt structures, where the beds have beenrotated and removed by erosion before the extrusion ofthe Table Hill Volcanics (Fig. 9). A more regionaltruncation is present to the west (see line 80-1 on Plate 1),where the McFadden Formation equivalent strata aretruncated by erosion pre-dating the Table Hill Volcanics.
Because there are no well intersections of theMcFadden Formation equivalent in the Lennis area,
although there are thin intersections in Kanpa 1A andLungkarta 1 in the Yowalga area, control on lithologiesin the study area is lacking. In the salt-withdrawal rimsynclines adjacent to diapiric features, the strata have beenuplifted by the movement of salt. The intra-McFaddenFormation equivalent reflector loses strength as theformation thins westwards. This thinning reflects the factthat the Lennis area was subsiding more rapidly than theYowalga area during deposition of this unit.
Palaeozoic
Table Hill Volcanics
Extrusion of the Table Hill Volcanics marked thecommencement of a new depositional sequence that hasbeen formally assigned to the Gunbarrel Basin (Hocking,1994). The Table Hill Volcanics can be correlatedseismically over a large portion of the western OfficerBasin and they outcrop on the northeastern margin of thebasin, near the South Australian border. They consist ofporphyritic and amygdaloidal tholeitic basalt for whichages of 575 ± 40 Ma (Compston, 1974) and Middle toUpper Cambrian (Moussavi-Harami and Gravestock,1995; Perincek, 1997) have been proposed. However,K–Ar radiometric dating of samples from Empress 1 and1A (Stevens and Apak, 1999) indicates an LowerOrdovician age of 484 ± 4 Ma.
Sequence stratigraphyIn the Lennis area, the absence of well control for theOfficer Basin succession precludes sequence-stratigraphicanalysis. However, the availability of a reasonably gooddataset for the Yowalga area, immediately to the west of
2 km
Intra-McFadden Formation eqv.Top Table Hill Volcanics
Top Kanpa FormationTop salt
Base McFadden Formation eqv. Top Browne Formation
Top Steptoe Formation
Two-
way
tim
e (s
)
50004900480047004600450044004300SP 4200
0 0
1 1
2 2
Pseudowell
SSW NNE
NA126 18.04.2001
Near-base salt
Figure 9. Seismic line T82-138, showing the seismic character of the Wahlgu Formation beneath the Base McFadden Formationequivalent. For location of the seismic line see Figure 2b
13
GSWA Report 77 Basin development and petroleum exploration potential of the Lennis area
the Lennis area, is a starting point for a detailed sequence-stratigraphic study. This data consists of deep explorationwells, core data from Empress 1 and 1A, and seismic lines.Well parameters, substantiated by seismic data, can becorrelated with confidence across the Yowalga area (Apakand Moors, 2000a,b). The similarity of the seismiccharacter of the Officer Basin succession in both theYowalga and Lennis areas suggests that the samesequence-stratigraphic hierarchy persists into the Lennisarea. Unfortunately, the seismic control does not allowcorrelation at all levels and the authors have not attempteda detailed study of the sequence stratigraphy for the Lennisarea.
The sequence stratigraphy of the Yowalga area (Apakand Moors, 2000a,b) provides a rationale for theevaluation of the basin history and petroleum potential ofthe Lennis area. A brief summary of facies and lithologiesfor each sequence is presented, with the understanding thatalthough details may change, lithological associationsshould remain similar. The lower two units of the OfficerBasin succession, the Townsend Quartzite and LefroyFormation, lack adequate control and could not becharacterized even in the Yowalga area, and hence are not
discussed here. This Report provides a brief overview ofthe overlying Browne to Steptoe Formations.
Within the Browne Formation (here referred to asSequence B) in the Yowalga area, six parasequence setshave been identified in well intersections and arecorrelateable on seismic data over a wide area (Apak andMoors, 2000a,b). The similar seismic character of theLennis area suggests that the Browne Formation iscomposed of similar parasequence sets, some of whichmay be continuous between the two regions. Eachdepositional cycle commences with a basal transgressionmarked by a mudstone that produces an abrupt increasein American Petroleum Institute (API) units on gamma-ray logs. These transgressions are followed by dominantlyopen-marine facies in the central area and sabkha torestricted hypersaline, shallow-water facies in the marginalareas. The smaller scale of salt-induced structuring(especially salt-mobilized thrusting) may indicate that thevolume or distribution of salt intervals in Sequence B inthe Lennis area is less than in the Yowalga area.
Within the overlying Hussar Formation (Sequence H),five parasequence sets have been identified in well
2 km
Intra-McFadden Formation eqv.Top Table Hill Volcanics Top Kanpa Formation
(Base Wahlgu Formation)Top salt
Base McFadden Formation eqv. Top Browne Formation
Two-
way
tim
e (s
)SP 5400
0
1
SSW NNE
NA130
2
5500 5600 5700 58505800
0
1
2
Near-base salt
18.04.2001
Figure 10. Seismic line T82-139, showing a rim syncline between salt walls. The rim syncline is infilled by the Wahlgu Formation,which onlaps on to the northern salt wall. The younger McFadden Formation equivalent infills the rim syncline andonlaps on to both the northern and southern salt walls. For location of the seismic line see Figure 2b
14
Apak and Moors
intersections and can be correlated seismically over a widearea (Apak and Moors, 2000b). The dark-grey mudstoneat the base of each parasequence in the Yowalga area isinterpreted as reflecting deposition in a quiet environmentbelow storm wave base. These mudstone deposits indicaterapid and widespread transgressions that suggest rises insea level. Sandstone horizons within Sequence H exhibitmostly sharp upper and lower surfaces and representhigh-energy depositional events in a shallow-marineenvironment, probably a shoreface to lower shorefaceenvironment. They are interbedded and overlain bylaminated to thinly bedded shelf to lagoonal mudstonefacies. Once again the seismic character of the Lennis areasuggests that this formation consists of cycles similar tothose described in the Yowalga area.
In the Yowalga area, two parasequence sets havebeen identified in well intersections within both theKanpa Formation (Sequence K) and Steptoe Formation(Sequence S). These parasequences can be correlated overwide areas using seismic data. However, in some placesthe Steptoe Formation was severely eroded during theAreyonga Movement and Petermann Ranges Orogeny,and for this reason can not be correlated laterally withconfidence. As discussed above for other sequences, thesimilar seismic characteristics of the Lennis area suggestthat the Kanpa and Steptoe Formations probably consistof similar parasequence sets to those identified in theYowalga area.
GeophysicsGeophysical coverage of the Lennis area includes gravity,magnetic, radiometric, and seismic surveys (Fig. 2b).More specific data on individual surveys can be found inPerincek (1998). The section below comments mainly onthe seismic data and on the seismic interpretation ofDurrant and Associates (1998).
The recognition of sub-basins within the Officer Basinwas based on field mapping, potential-field data, and theuse of long-line aeromagnetic traverses conducted byBMR in 1954. Oil exploration in the early 1960s led to anumber of additional aeromagnetic and gravity surveys.Unfortunately, the interpretations of the gravity andmagnetic data did not concur. The differences were due,at least in part, to the character of the basement, which isvariably composed of igneous, metamorphic, andsedimentary rocks.
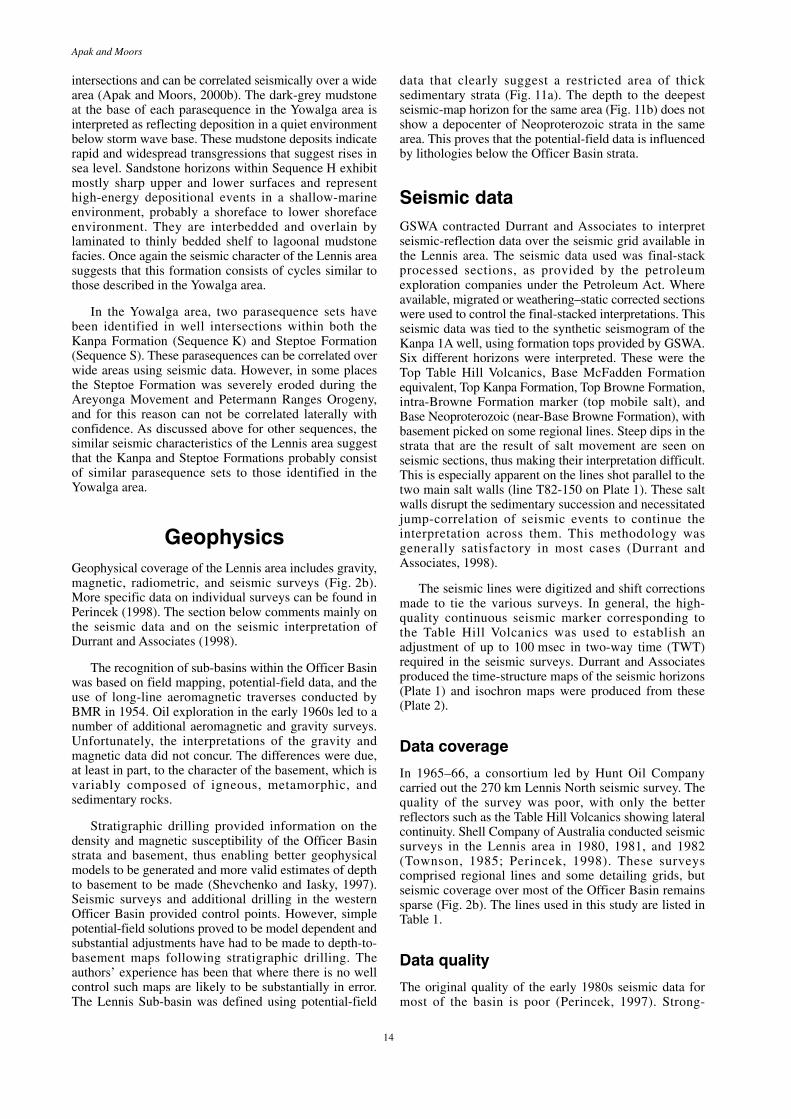
Stratigraphic drilling provided information on thedensity and magnetic susceptibility of the Officer Basinstrata and basement, thus enabling better geophysicalmodels to be generated and more valid estimates of depthto basement to be made (Shevchenko and Iasky, 1997).Seismic surveys and additional drilling in the westernOfficer Basin provided control points. However, simplepotential-field solutions proved to be model dependent andsubstantial adjustments have had to be made to depth-to-basement maps following stratigraphic drilling. Theauthors’ experience has been that where there is no wellcontrol such maps are likely to be substantially in error.The Lennis Sub-basin was defined using potential-field
data that clearly suggest a restricted area of thicksedimentary strata (Fig. 11a). The depth to the deepestseismic-map horizon for the same area (Fig. 11b) does notshow a depocenter of Neoproterozoic strata in the samearea. This proves that the potential-field data is influencedby lithologies below the Officer Basin strata.
Seismic dataGSWA contracted Durrant and Associates to interpretseismic-reflection data over the seismic grid available inthe Lennis area. The seismic data used was final-stackprocessed sections, as provided by the petroleumexploration companies under the Petroleum Act. Whereavailable, migrated or weathering–static corrected sectionswere used to control the final-stacked interpretations. Thisseismic data was tied to the synthetic seismogram of theKanpa 1A well, using formation tops provided by GSWA.Six different horizons were interpreted. These were theTop Table Hill Volcanics, Base McFadden Formationequivalent, Top Kanpa Formation, Top Browne Formation,intra-Browne Formation marker (top mobile salt), andBase Neoproterozoic (near-Base Browne Formation), withbasement picked on some regional lines. Steep dips in thestrata that are the result of salt movement are seen onseismic sections, thus making their interpretation difficult.This is especially apparent on the lines shot parallel to thetwo main salt walls (line T82-150 on Plate 1). These saltwalls disrupt the sedimentary succession and necessitatedjump-correlation of seismic events to continue theinterpretation across them. This methodology wasgenerally satisfactory in most cases (Durrant andAssociates, 1998).
The seismic lines were digitized and shift correctionsmade to tie the various surveys. In general, the high-quality continuous seismic marker corresponding tothe Table Hill Volcanics was used to establish anadjustment of up to 100 msec in two-way time (TWT)required in the seismic surveys. Durrant and Associatesproduced the time-structure maps of the seismic horizons(Plate 1) and isochron maps were produced from these(Plate 2).
Data coverage
In 1965–66, a consortium led by Hunt Oil Companycarried out the 270 km Lennis North seismic survey. Thequality of the survey was poor, with only the betterreflectors such as the Table Hill Volcanics showing lateralcontinuity. Shell Company of Australia conducted seismicsurveys in the Lennis area in 1980, 1981, and 1982(Townson, 1985; Perincek, 1998). These surveyscomprised regional lines and some detailing grids, butseismic coverage over most of the Officer Basin remainssparse (Fig. 2b). The lines used in this study are listed inTable 1.
Data quality
The original quality of the early 1980s seismic data formost of the basin is poor (Perincek, 1997). Strong-
15
GSWA Report 77 Basin development and petroleum exploration potential of the Lennis area
Figure 11. Comparison between the geometry inferred by a) depth to basement from potential-field data (Shevchenkoand Iasky, 1997) and b) seismic two-way time to Base Browne Formation (Durrant and Associates, 1998)
16
Apak and Moors
amplitude events that represent the major unconform-ities (e.g. Base Table Hill Volcanics) and transgressivesurfaces can be correlated with confidence, althoughthey are discontinuous in some places mainly due tosalt emplacement and complex faulting. In the adjacentYowalga area, Japan National Oil Corporation reprocessedsimilar acquired seismic data, which resulted in a dramaticimprovement in quality (Apak and Moors, 2000b).Modern reprocessing should also improve the data in theLennis area to a comparable degree.
Seismic control in the Lennis area is very limited, witha grid of lines 2.5 – 5 km apart over the salt-wall region,but only a 20–50 km regional seismic spacing over the restof the area. Consequently, structural control on time andisochron maps is very loose, and comments made onstructural closure or even thickness trends should beconsidered with this in mind.
Structural interpretationThe structure of the Officer Basin is complex, having beenaffected by a number of regional events (Fig. 4). Themajor structures (Fig. 1) were established in the basementrocks before Neoproterozoic deposition commenced(Myers et al., 1996). Deformation in the Officer Basinwas at least partially controlled by these basementstructures during subsequent tectonic events. None ofthese tectonic phases were particularly severe inthe Lennis area; crustal shortening being minor, asindicated by large stable, undeformed areas. Apart fromthrusting associated with the Musgrave Complex, themajor deformation was associated with salt movements.Differential subsidence between the Lennis area andother parts of the western Officer Basin such as theYowalga area is reflected in the structure of the post-Supersequence 1 strata. In the Lennis area, the substantialthicknesses of the Wahlgu Formation and McFaddenFormation equivalent probably rejuvenated salt move-ment, further complicating the pre-existing structure. Thepresent-day deformation can be shown to be thecombination of a number of phases of movement. Foldingis gentle, with low dips except in association with salt-piercement features.
FaultingAlthough Townson (1985, fig. 4) suggested abundantfaulting in the Lennis area based on aeromagnetic andLandsat data, faults are difficult to identify on seismicdata, as shown by the dearth of faulting on the Durrantand Associates maps (Plate 1). GSWA therefore carried outits own fault interpretation using a first vertical derivativeimage of the Bouguer gravity data. This image alsosuggested the presence of numerous faults, but only forthe largest faults such as the Westwood Fault did thegravity, magnetic, and Landsat interpretations coincide.This is partly explained by the fact that the three methodsrely on different physical properties of the rocks, have adifferent density of control points, and have differentalgorithms. Although the gravity data clearly identified thesalt walls, the magnetic data may have been moreinfluenced by the high magnetic susceptibility of theshallow Table Hill Volcanics. A combination of potential-field and seismic data suggests that faults are abundantin the Lennis area, but that they probably have smallthrows.
The dominant fault trend derived from the potential-field data strikes to the northwest and downthrows tothe south, whereas a subsidiary set of faults strikesorthogonally to the northeast (Townson, 1985). The majorWestwood Fault strikes to the north and there are only afew other lineaments with a similar orientation. TheWestwood Fault system orientation is the same as in thebetter understood Yowalga area to the west (Apak andMoors, 2000b). The orientation of the faults cannot bededuced from the seismic data, as few faults cut more thanone line. However, the potential-field data suggest that theorientation of the seismic data to the faulting is appropriatefor detecting faults of this orientation, so their lack ofdetection cannot be explained in this way.
Normal faults are difficult to see on the seismic data.Line T82-136 (Fig. 7) shows a number of typical offsetsof the Table Hill Volcanics (e.g. SP 4575 and 4735) thathave 20–30 msec displacements, but they do not persistwith depth. On line 80-3A, between SP 475 and 515(Fig. 12), there appears to be a more convincing normalfault with an associated antithetic fault. Throws are lessthan 70 msecs.
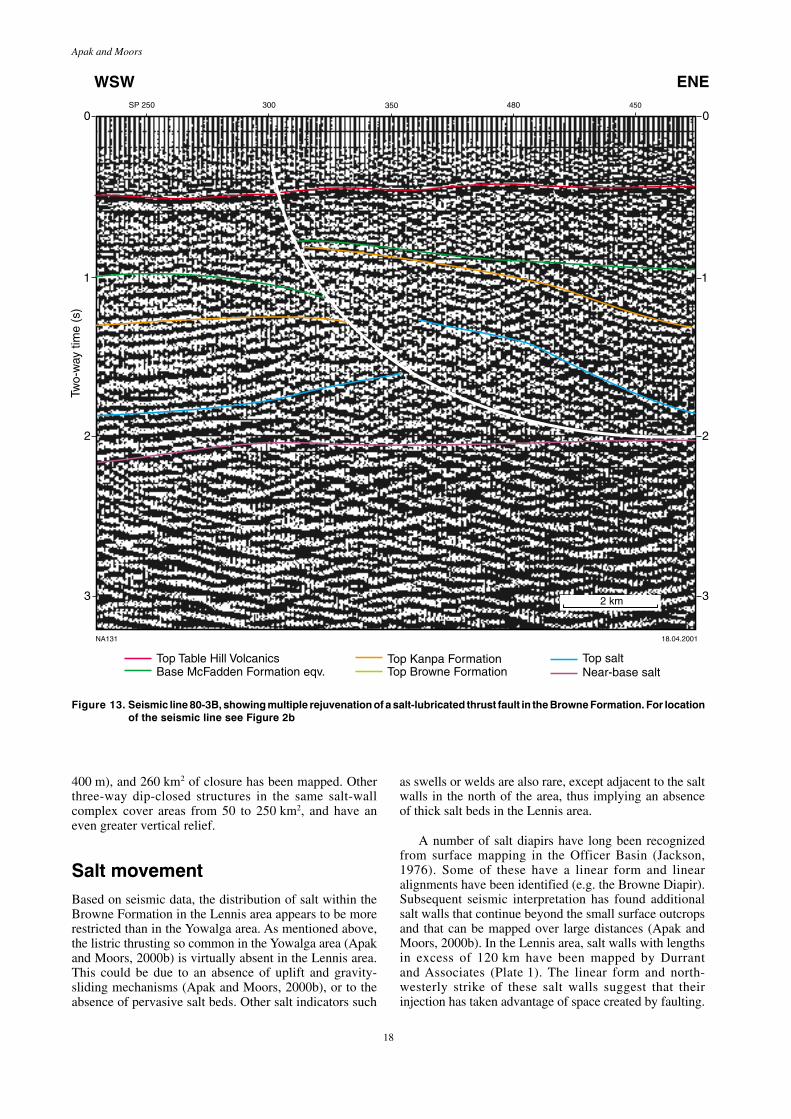
Within the Browne Formation, listric thrust faultslubricated by salt are common in the Yowalga area to thewest, but appear to be less common in the Lennis area.One of these faults can be seen on seismic line 80-3B(Fig. 13), around SP 305. The fault shown in this seismicline steepens as it rises through the section. The structureso formed has been eroded by the unconformity at thebase of the McFadden Formation equivalent. In theseismic section, this structure has also been displaced over200 msec by a later rejuvenation that persisted (althoughwith less amplitude) after the Table Hill Volcanics wereextruded.
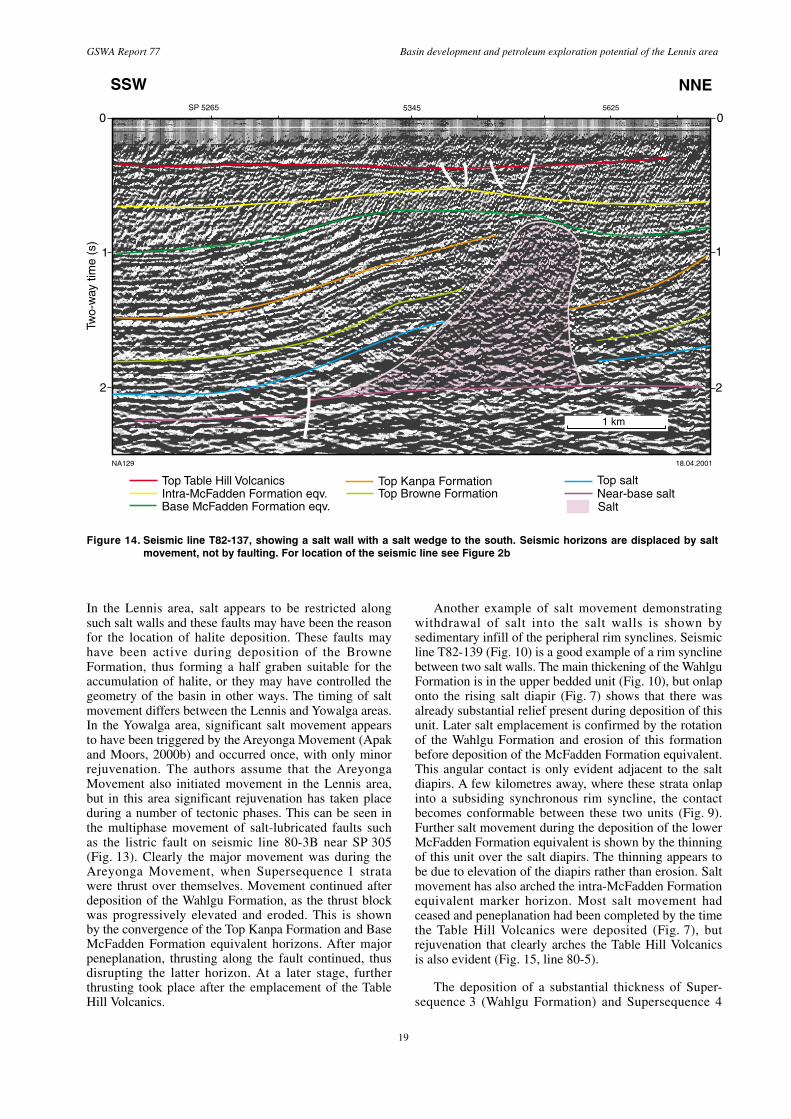
The linearity and orientation of the salt walls in thenorthern part of the Lennis area suggests that they werecontrolled by faulting. Seismic line T82-137 (Fig. 14)shows a displacement of seismic horizons on eitherside of a salt wall (SP 5465 to 5625). Careful examination
Table 1. Seismic lines used in this Report
Line number Shotpoint range
80-1 2 001 – 2 97380-3A 335 – 55580-3B 245 – 46580-5 1 800 – 2 100T82-136 4 575 – 5 055T82-137 5 225 – 5 665T82-138 4 600 – 5 000T82-139 5 410 – 5 850T82-150 2 001 – 3 325
NOTE: Details are from the K82A seismic survey and extensionsurvey
17
GSWA Report 77 Basin development and petroleum exploration potential of the Lennis area
of this seismic line shows that the displacement is notfault related, but instead is due to the presence of a wedgeof ?salt on the southern side of the fault. The presence ofthis salt wedge may indicate a depositional fault thatcreated a half graben in which the salt was locallydeposited and later assisted in its mobilization. Thereappears to be less evidence of salt within the BrowneFormation in the Lennis area than in the Yowalga area tothe west.
Maps of the major salt walls indicate a southeasterlytrend that extends from the Yowalga area into the Lennisarea (Apak and Moors, 2000b, fig. 12). Thus it is feasiblethat a major salt wall or a number of salt walls may existnorth of the limits of the seismic control in the Lennisarea.
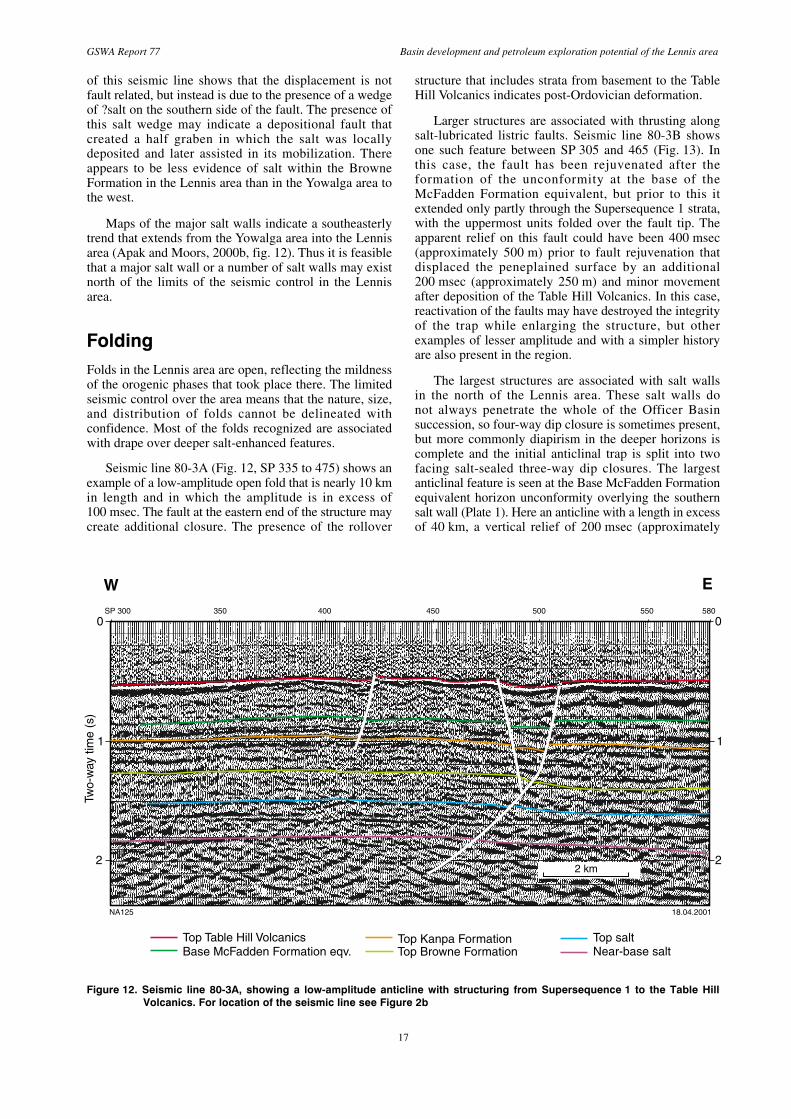
FoldingFolds in the Lennis area are open, reflecting the mildnessof the orogenic phases that took place there. The limitedseismic control over the area means that the nature, size,and distribution of folds cannot be delineated withconfidence. Most of the folds recognized are associatedwith drape over deeper salt-enhanced features.
Seismic line 80-3A (Fig. 12, SP 335 to 475) shows anexample of a low-amplitude open fold that is nearly 10 kmin length and in which the amplitude is in excess of100 msec. The fault at the eastern end of the structure maycreate additional closure. The presence of the rollover
structure that includes strata from basement to the TableHill Volcanics indicates post-Ordovician deformation.
Larger structures are associated with thrusting alongsalt-lubricated listric faults. Seismic line 80-3B showsone such feature between SP 305 and 465 (Fig. 13). Inthis case, the fault has been rejuvenated after theformation of the unconformity at the base of theMcFadden Formation equivalent, but prior to this itextended only partly through the Supersequence 1 strata,with the uppermost units folded over the fault tip. Theapparent relief on this fault could have been 400 msec(approximately 500 m) prior to fault rejuvenation thatdisplaced the peneplained surface by an additional200 msec (approximately 250 m) and minor movementafter deposition of the Table Hill Volcanics. In this case,reactivation of the faults may have destroyed the integrityof the trap while enlarging the structure, but otherexamples of lesser amplitude and with a simpler historyare also present in the region.
The largest structures are associated with salt wallsin the north of the Lennis area. These salt walls donot always penetrate the whole of the Officer Basinsuccession, so four-way dip closure is sometimes present,but more commonly diapirism in the deeper horizons iscomplete and the initial anticlinal trap is split into twofacing salt-sealed three-way dip closures. The largestanticlinal feature is seen at the Base McFadden Formationequivalent horizon unconformity overlying the southernsalt wall (Plate 1). Here an anticline with a length in excessof 40 km, a vertical relief of 200 msec (approximately
Top Kanpa Formation Top saltTop Browne Formation
2 km
Top Table Hill VolcanicsBase McFadden Formation eqv.
Two-
way
tim
e (s
)
SP 300
0
1
W E
2
400 500 550350 450 580
0
1
2
Near-base salt
NA125 18.04.2001
Figure 12. Seismic line 80-3A, showing a low-amplitude anticline with structuring from Supersequence 1 to the Table HillVolcanics. For location of the seismic line see Figure 2b
18
Apak and Moors
400 m), and 260 km2 of closure has been mapped. Otherthree-way dip-closed structures in the same salt-wallcomplex cover areas from 50 to 250 km2, and have aneven greater vertical relief.
Salt movementBased on seismic data, the distribution of salt within theBrowne Formation in the Lennis area appears to be morerestricted than in the Yowalga area. As mentioned above,the listric thrusting so common in the Yowalga area (Apakand Moors, 2000b) is virtually absent in the Lennis area.This could be due to an absence of uplift and gravity-sliding mechanisms (Apak and Moors, 2000b), or to theabsence of pervasive salt beds. Other salt indicators such
as swells or welds are also rare, except adjacent to the saltwalls in the north of the area, thus implying an absenceof thick salt beds in the Lennis area.
A number of salt diapirs have long been recognizedfrom surface mapping in the Officer Basin (Jackson,1976). Some of these have a linear form and linearalignments have been identified (e.g. the Browne Diapir).Subsequent seismic interpretation has found additionalsalt walls that continue beyond the small surface outcropsand that can be mapped over large distances (Apak andMoors, 2000b). In the Lennis area, salt walls with lengthsin excess of 120 km have been mapped by Durrantand Associates (Plate 1). The linear form and north-westerly strike of these salt walls suggest that theirinjection has taken advantage of space created by faulting.
Top Kanpa Formation Top saltTop Browne FormationBase McFadden Formation eqv.
NA131 18.04.2001
2 km
Top Table Hill Volcanics
Two-
way
tim
e (s
)
450480350300SP 250
0
1
2
WSW ENE
3
0
1
2
3
Near-base salt
Figure 13. Seismic line 80-3B, showing multiple rejuvenation of a salt-lubricated thrust fault in the Browne Formation. For locationof the seismic line see Figure 2b
19
GSWA Report 77 Basin development and petroleum exploration potential of the Lennis area
In the Lennis area, salt appears to be restricted alongsuch salt walls and these faults may have been the reasonfor the location of halite deposition. These faults mayhave been active during deposition of the BrowneFormation, thus forming a half graben suitable for theaccumulation of halite, or they may have controlled thegeometry of the basin in other ways. The timing of saltmovement differs between the Lennis and Yowalga areas.In the Yowalga area, significant salt movement appearsto have been triggered by the Areyonga Movement (Apakand Moors, 2000b) and occurred once, with only minorrejuvenation. The authors assume that the AreyongaMovement also initiated movement in the Lennis area,but in this area significant rejuvenation has taken placeduring a number of tectonic phases. This can be seen inthe multiphase movement of salt-lubricated faults suchas the listric fault on seismic line 80-3B near SP 305(Fig. 13). Clearly the major movement was during theAreyonga Movement, when Supersequence 1 stratawere thrust over themselves. Movement continued afterdeposition of the Wahlgu Formation, as the thrust blockwas progressively elevated and eroded. This is shownby the convergence of the Top Kanpa Formation and BaseMcFadden Formation equivalent horizons. After majorpeneplanation, thrusting along the fault continued, thusdisrupting the latter horizon. At a later stage, furtherthrusting took place after the emplacement of the TableHill Volcanics.
Another example of salt movement demonstratingwithdrawal of salt into the salt walls is shown bysedimentary infill of the peripheral rim synclines. Seismicline T82-139 (Fig. 10) is a good example of a rim synclinebetween two salt walls. The main thickening of the WahlguFormation is in the upper bedded unit (Fig. 10), but onlaponto the rising salt diapir (Fig. 7) shows that there wasalready substantial relief present during deposition of thisunit. Later salt emplacement is confirmed by the rotationof the Wahlgu Formation and erosion of this formationbefore deposition of the McFadden Formation equivalent.This angular contact is only evident adjacent to the saltdiapirs. A few kilometres away, where these strata onlapinto a subsiding synchronous rim syncline, the contactbecomes conformable between these two units (Fig. 9).Further salt movement during the deposition of the lowerMcFadden Formation equivalent is shown by the thinningof this unit over the salt diapirs. The thinning appears tobe due to elevation of the diapirs rather than erosion. Saltmovement has also arched the intra-McFadden Formationequivalent marker horizon. Most salt movement hadceased and peneplanation had been completed by the timethe Table Hill Volcanics were deposited (Fig. 7), butrejuvenation that clearly arches the Table Hill Volcanicsis also evident (Fig. 15, line 80-5).
The deposition of a substantial thickness of Super-sequence 3 (Wahlgu Formation) and Supersequence 4
1 km
56255345SP 5265
0 0
1
NNESSW
22
Intra-McFadden Formation eqv.Top Table Hill Volcanics Top Kanpa Formation Top salt
Base McFadden Formation eqv.Top Browne Formation
NA129 18.04.2001
Near-base saltSalt
Two-
way
tim
e (s
)
1
Figure 14. Seismic line T82-137, showing a salt wall with a salt wedge to the south. Seismic horizons are displaced by saltmovement, not by faulting. For location of the seismic line see Figure 2b
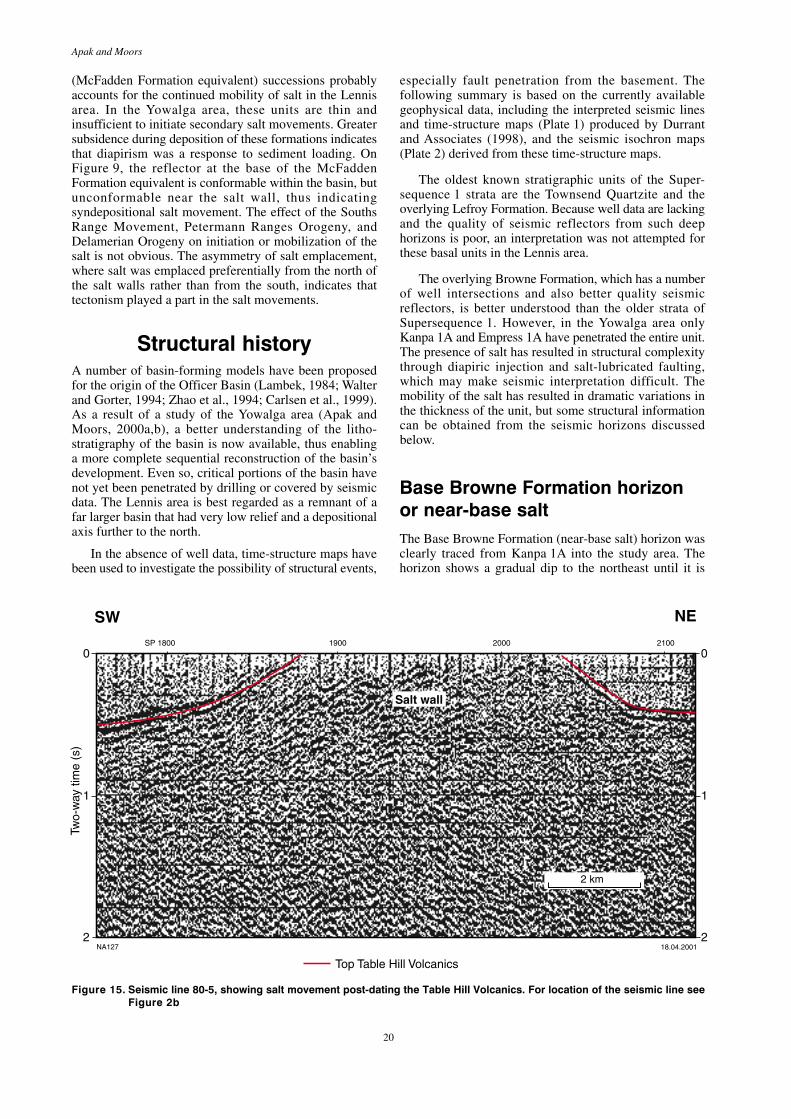
20
Apak and Moors
(McFadden Formation equivalent) successions probablyaccounts for the continued mobility of salt in the Lennisarea. In the Yowalga area, these units are thin andinsufficient to initiate secondary salt movements. Greatersubsidence during deposition of these formations indicatesthat diapirism was a response to sediment loading. OnFigure 9, the reflector at the base of the McFaddenFormation equivalent is conformable within the basin, butunconformable near the salt wall, thus indicatingsyndepositional salt movement. The effect of the SouthsRange Movement, Petermann Ranges Orogeny, andDelamerian Orogeny on initiation or mobilization of thesalt is not obvious. The asymmetry of salt emplacement,where salt was emplaced preferentially from the north ofthe salt walls rather than from the south, indicates thattectonism played a part in the salt movements.
Structural historyA number of basin-forming models have been proposedfor the origin of the Officer Basin (Lambek, 1984; Walterand Gorter, 1994; Zhao et al., 1994; Carlsen et al., 1999).As a result of a study of the Yowalga area (Apak andMoors, 2000a,b), a better understanding of the litho-stratigraphy of the basin is now available, thus enablinga more complete sequential reconstruction of the basin’sdevelopment. Even so, critical portions of the basin havenot yet been penetrated by drilling or covered by seismicdata. The Lennis area is best regarded as a remnant of afar larger basin that had very low relief and a depositionalaxis further to the north.
In the absence of well data, time-structure maps havebeen used to investigate the possibility of structural events,
especially fault penetration from the basement. Thefollowing summary is based on the currently availablegeophysical data, including the interpreted seismic linesand time-structure maps (Plate 1) produced by Durrantand Associates (1998), and the seismic isochron maps(Plate 2) derived from these time-structure maps.
The oldest known stratigraphic units of the Super-sequence 1 strata are the Townsend Quartzite and theoverlying Lefroy Formation. Because well data are lackingand the quality of seismic reflectors from such deephorizons is poor, an interpretation was not attempted forthese basal units in the Lennis area.
The overlying Browne Formation, which has a numberof well intersections and also better quality seismicreflectors, is better understood than the older strata ofSupersequence 1. However, in the Yowalga area onlyKanpa 1A and Empress 1A have penetrated the entire unit.The presence of salt has resulted in structural complexitythrough diapiric injection and salt-lubricated faulting,which may make seismic interpretation difficult. Themobility of the salt has resulted in dramatic variations inthe thickness of the unit, but some structural informationcan be obtained from the seismic horizons discussedbelow.
Base Browne Formation horizonor near-base saltThe Base Browne Formation (near-base salt) horizon wasclearly traced from Kanpa 1A into the study area. Thehorizon shows a gradual dip to the northeast until it is
2 km
Top Table Hill Volcanics
Two-
way
tim
e (s
)
SP 1800
0
1
Salt wall
SW NE
2
1900 2000 2100
0
1
2NA127 18.04.2001
Figure 15. Seismic line 80-5, showing salt movement post-dating the Table Hill Volcanics. For location of the seismic line seeFigure 2b
21
GSWA Report 77 Basin development and petroleum exploration potential of the Lennis area
noticeably ‘pulled-up’ by the high-velocity seismic dataof intrusive salt in the northeastern region of the Lennisarea. This was the most faulted horizon mapped by Durrantand Associates who identified 20 faults, but all were ofsmall displacement (Plate 1). Some structural closureshave been mapped, but all are poorly controlled by theseismic data. The largest closure is due to a pull-up belowthe salt walls. Two other large structures, north and westof Lennis 1, are single line features with no obvious origin.One of the relatively smaller structural highs on thewestern part of the seismic map for this horizon (Plate 1)is probably the result of movement on the Westwood Fault.
Intra-Browne Formation markerand near-Top Browne FormationhorizonIn contrast to the Base Browne Formation horizon (near-base salt), the intra-Browne Formation marker and near-Top Browne Formation horizon can only be correlatedwith a lower degree of confidence in the Lennis area. Theintra-Browne Formation marker horizon (near-top mobilesalt) is not clear on most seismic lines. It is, however,possible to map these horizons from their seismiccharacter, particularly where the salt has migrated andcaused truncations or seismic horizons to lose theircontinuity. The near-Top Browne Formation horizon isalso indistinct throughout the project area. It has beenmapped based on its stratigraphic location between theconformable Top Kanpa Formation above and the intra-Browne Formation marker below.
The structural maps of the intra-Browne Formationmarker and the near-Top Browne Formation horizon arevery similar, showing a general dip to the northeast, exceptin the vicinity of the salt walls where injection of salt hasresulted in upturning and uplift of these horizons. Acrossthe middle salt wall, these horizons are interpreted to behigher on the northern side than on the southern side. Asthis is not the case for the Base Browne Formationhorizon, this feature is best explained as resulting from saltwithdrawal on the southern side rather than displace-ment due to fault movement (Fig. 14). The diapiricupturning has resulted in a number of large salt-closedtraps along both sides of all three salt walls. Faulting andother anticlinal features have a low amplitude and arepoorly controlled.
Well intersections show that salt is distributedthroughout the Browne Formation in the Yowalga area. Onseismic data, the lower portion of the formation in theLennis area shows thickness variations, and these can beattributed to the migration of salt. The intra-BrowneFormation marker (top salt) to Base Browne Formationhorizon (near-base salt) isochron implies a markedthinning of this interval for approximately 20 km southof the salt walls in the northeastern region of the Lennisarea. The simple explanation for this is that salt migratedfrom this zone into the salt walls. However, as in theYowalga area (Apak and Moors, 2000b), there appears tobe a salt-budget problem associated with this interpretationbecause the salt walls could not contain all the evacuated
salt. However, because the original salt content of theBrowne Formation in this region is uncertain, the trueboundaries of the salt walls are difficult to define in thestudy area. The continuity of the near-Top BrowneFormation to intra-Browne Formation marker (top salt)isochron implies that mobile salt is absent in this part ofthe succession.
After deposition of the Browne Formation the OfficerBasin had attained its final size, with infilling of allirregularities of the depositional surfaces. Deposition inthe Lennis area continued under tectonically quietconditions during deposition of the Hussar Formation. Theoverall configuration was of a shallow, low-reliefdepression. A major marine transgression at the base ofthe Hussar Formation resulted in a thick argillaceousdeposit that covered the Yowalga area, and presumablyalso the Lennis area. In the Yowalga area, the HussarFormation consists of five parasequence sets exhibitinguniform variations in thickness, but gradually thinningtowards the basin margin in the southwest. Seismic datasuggest that similar conditions were present in the Lennisarea during deposition of the Hussar Formation.
Following deposition of the Hussar Formation, asubstantial transgression again deposited another thickbasal claystone (the basal Kanpa Formation). In theYowalga area, the Kanpa Formation exhibits a similarthickness and areal distribution to the Hussar Formation,but only two parasequence sets have been recognized. Asimilar depositional sequence is probably present in theLennis area. In the Yowalga area, these two formationswere mapped individually, but in the Lennis area theHussar and Kanpa Formations could only be mapped asa single sedimentary package. Seismic data and theseismic isochron map of the Top Browne Formation – TopKanpa Formation interval clearly imply a uniformly thickdistribution of these two formations over most of theLennis area.
Top Kanpa Formation horizonThe seismic reflector at the top of the Kanpa Formationis a strong marker horizon throughout most of the projectarea, and is conformable with the underlying stratigraphicunits that form the stiff-overburden to salt-coredstructures. This seismic reflector has been tied withconfidence to Kanpa 1A. Folding of the formation oversalt-cored structures is common and the formation istruncated over the crests of some of these structures bythe Base McFadden Formation equivalent unconformity.The Top Kanpa Formation horizon seismic map (Plate 1)is very similar to the Browne Formation horizon seismicmaps, and shows a general dip to the northeast, withupturn and elevation of the strata over the salt walls inthe northeastern portion of the Lennis area. Faulting andfolding are uncommon and of low magnitude. The TopKanpa Formation to Top Browne Formation isochron map(Plate 2) implies general thickening of these formationswestwards into the northeasterly oriented thicker zone ofstrata. This may suggest that there was some kind ofseparation between the Lennis and Yowalga areas duringdeposition of these units.
22
Apak and Moors
The Steptoe Formation, the youngest unit of Super-sequence 1, was deposited conformably on the underlyingKanpa Formation. On seismic data in the Yowalga andLennis areas, it is clear that the upper part of the SteptoeFormation, which was affected by a phase of halokineticfaulting and folding during the Areyonga Movement, iseroded in all the wells that have been drilled. Significantamounts of erosion have occurred and the SteptoeFormation has been severely eroded, together with theunderlying Kanpa Formation, particularly over salt-emplacement features (Apak and Moors, 2000a, fig. 7)and in basin-margin areas. The only well control is incrests where part of the sequence has been eroded, butcomplete sections are present off-structure. A similarerosional event during the Areyonga Movement can alsobe seen in the Lennis area (Fig. 10).
Base McFadden Formationequivalent unconformityIn the Lennis area, above the Top Kanpa Formationhorizon, the next seismic horizon of younger strata is theBase McFadden Formation equivalent unconformity,which is characterized on seismic data by a series ofsubparallel unconformities. A single unconformity isapparent on all seismic lines (Durrant and Associates,1998). Although it is not very clear on the seismic data,the underlying Wahlgu Formation seems to be less foldedor deformed than the underlying Supersequence 1 stratain both the Yowalga and Lennis areas. This seismichorizon dips towards the salt walls to the north, risesover these salt walls (with one wall penetrating thesequence) and then rises again to the north towards theMusgrave Complex. Dips are less than for the underlyingSupersequence 1 horizons. Another unconformity,between the Top Kanpa Formation and Base McFaddenFormation equivalent unconformity seismic horizons canbe recognized on seismic lines. This unconformity (Figs 9and 10) is probably equivalent to the Areyonga Movementbreak between the Steptoe and Wahlgu Formations in theYowalga area. Unfortunately, this key horizon has notbeen mapped in the study area. As can be seen on Plate 2,deposition of the glacigene Wahlgu Formation filled inmuch of the topography that resulted from the AreyongaMovement early in the Marinoan (Grey et al., 1999).
Although tillites have been described within the unit(Jackson and van de Graaff, 1981), these are nowinterpreted to be poorly sorted mass-flow deposits of asubmarine fan (Carlsen et al., 1999). Striated and facettedpebbles are present, but they are regarded as morerepresentative of the provenance of the material than theenvironment of deposition. The massive sandstone, cross-bedded sandstone, and minor laminated sandstone anddiamictite seen in outcrop and in Empress 1 and 1A areall interpreted as mass-flow or turbidite deposits. Locallysourced material derived from the salt-injection highscould also be significant. The Wahlgu Formation is muchthicker in the Lennis area than in the Yowalga area wheresubsidence was significantly greater during this period.The Wahlgu Formation has been distorted by saltinjection, proving that salt movement took place afterdeposition of this unit. Following deposition of the
Wahlgu Formation, the Petermann Ranges Orogeny isrepresented by the Base McFadden Formation equivalentunconformity in the western Officer Basin.
Deposition of the McFadden Formation equivalentfollowed the Petermann Ranges Orogeny. On seismicsections, these strata can be seen as an unconformablefilling of the basin lows that onlap on and over thestructural highs. The formation of rim synclines atthis time suggests a further phase of salt mobilization.The McFadden Formation equivalent is a siliciclasticsequence that varies from sand-dominated to shale-dominated in different parts of the western Officer Basin.The seismic isochron map (Top Table Hill Volcanics toBase McFadden Formation equivalent, Plate 2) shows apronounced thickening to over 700 msec in the region ofthe salt walls. It is probably here that Townson (1985)estimated a maximum thickness of 1200 m. The formationis much thinner in the Yowalga area, suggesting basinsubsidence was more intense in the Lennis area duringdeposition of this unit. Deposition in the Officer Basinceased with the Delamerian Orogeny, during whichtectonic highs were rejuvenated and eroded.
Top Table Hill Volcanics horizonThin, extensive flows of the Table Hill Volcanics heraldedthe beginning of the Gunbarrel Basin depositional cycle.The Table Hill Volcanics are a series of thin tholeitic basaltflows of near uniform thickness that are present across thebasin. They have been eroded at the surface on thenortheastern side of the Lennis area. The seismic responseof the top of this formation is clear and distinct on 95%of the seismic lines interpreted for this study and has beenused as a regional tie marker in both the Yowalga andLennis areas. The Top Table Hill Volcanics time-structuremap (Plate 1) shows an area of low topographic relief witha sinuous, northwesterly oriented shallow axis. Thehorizon rises gently to the southwest and northeast. Theunderlying salt walls have also influenced the seismicreflector, which suggests possible later salt movement ora differential compaction over these features. Durrant andAssociates (1998) have delineated only seven faults in thishorizon, all with a small throw. However, the manydislocations of the horizon (Fig. 7) are probably due toadditional minor faults. This subaerial unit represents thelast phase of deposition in what must have been a largelyemergent area for approximately 80 million years beforesubsidence initiated deposition of the Devonian LennisSandstone.
All the subsequent sedimentary cycles of depositionare at too shallow a depth to be effectively imaged by theexisting seismic data. After the Rodingan Movement, theshallow-marine Lennis Sandstone was deposited acrossthe basin. Lithologies range from shale to sandstone, withoccasional matrix-supported conglomerates (Jackson andvan de Graaff, 1981; Stevens and Apak, 1999). Upliftassociated with the Devonian Alice Springs Orogenyterminated deposition in the restricted depocentre of theGunbarrel Basin.
When deposition recommenced during the Carbonif-erous (Stevens and Apak, 1999), deposition of the
23
GSWA Report 77 Basin development and petroleum exploration potential of the Lennis area
Paterson Formation encroached from the Canning Basinand covered much of the underlying basins with a thinveneer of glacigene sediment. From the Permian to theCretaceous, the region was emergent until the next majorsea-level highstand transgressed this low-relief area anddeposited the argillaceous Samuel Formation. Since theCretaceous, the flat, subdued relief of the area has beenmaintained, with periodic phases of river flow and erosionduring wet periods followed by pediplanation and winddeflation during arid periods (Jackson and van de Graaff,1981). A thin, superficial blanket of sand and clay hasaccumulated in the study area, and overlies a deepweathering profile that has leached the underlyingsedimentary rocks.
Petroleum potential
Previous drillingIn 1965, a consortium led by Hunt Oil drilled the onlypetroleum exploration well (Lennis 1) in the Lennis area(Fig. 1). This well, which was stratigraphic in concept, wasdrilled to a total depth of 614.5 m in the Table HillVolcanics and not surprisingly had no shows. It did,however, identify the prominent seismic reflector as beingassociated with the Table Hill Volcanics.
As part of their stratigraphic drilling program, theBMR drilled Neale 1A and 1B, Neale 2, and Neale 3 in1972. Only Neale 1A and 1B penetrated below thePaterson Formation, but they failed to reach theNeoproterozoic sequence before being terminated at205.75 m. Well summary sheets and references to thewells can be found in Perincek (1998).
Other shallow drilling in the Lennis area (Fig. 2b) wasassociated with oil-shale and mineral exploration, butfew of these bores have a total depth of more than 200 m,and none of the bores intersected significant thicknessesof Neoproterozoic sedimentary rocks. Summary sheetsfor these bores are presented in Perincek (1998). During1997, GSWA Empress 1 and 1A were continuously coredfrom 105 m to a total depth of 1624.6 m in the Yowalgaarea (Fig. 2a). As the only completely cored sectionthrough Supersequence 1, this is the key well forsedimentological studies of the Officer Basin in WesternAustralia.
Petroleum generationIn the absence of geochemical data specific to the Lennisarea, deductions made in other parts of the western OfficerBasin, mainly from the Yowalga area to the west (Apakand Moors, 2000b), have been applied to the Lennis area.An understanding of petroleum generation within an arearequires detailed information on the quality, quantity, anddistribution of potential source rocks within a sedimentarysection, as well as the burial and thermal history of thesection. Such information for the western Officer Basinhas already been reported by Perincek (1998), Ghori(1998a,b), and Ghori (2000). Interpretation of these datasuggests that good quality oil-prone source rocks exist
throughout the Supersequence 1 strata. Maturationmodelling was also undertaken for a representativepseudowell location in the Lennis area in order to try andquantify the timing of petroleum generation for thisregion. The full maturation modelling is presented in theAppendix and is discussed only briefly below.
Source-rock type
The principal source of organic material during theNeoproterozoic was restricted to cyanobacteria and lessabundant planktonic acritarchs. Due to their reliance onphotosynthesis, such organic material was producedmostly in relatively shallow-water to periodicallyemergent conditions. Gelatinous cyanobacterial mats werecommon, as illustrated by the abundance of stromatolitesin Empress 1A in the Yowalga area. A detailed descriptionof the source-rock facies, including production, transport-ation, and the preservation of organic material, has beenpresented in Carlsen et al., (1999). Additional commentson the accumulation of organic material in shallow-wateroxic conditions typical of most of the Supersequence 1strata have been provided by Apak and Moors (2000b).
All of the source-rock intervals so far identified havebeen in thin beds. This makes their detection andquantification from ditch cuttings virtually impossible, aseach source-rock bed is diluted by non-source material inthe composite ditch-cutting samples. By selecting only themost reliable data from a large database (Fig. 16), sourcerocks in the Officer Basin have been found to becharacterized by type II kerogen (Ghori, 2000), which isas expected from a marine deposit of this age. The spreadof source-rock quality towards type III kerogen (Fig. 17)is interpreted as being due to oxidation and degradationof the original biological contribution depleting some ofthe hydrogen. Pyrolysis of the samples releases a light-oil product with a substantial aromatics component, thusreflecting the tendency towards a type III kerogen (Ghori,2000).
Strata that can be characterized as source-rocks havebeen identified by Rock-Eval in most formations ofSupersequence 1. These include the Browne Formation (inKanpa 1A and Yowalga 3), the Hussar Formation (inEmpress 1A and Yowalga 3), the Kanpa Formation (inEmpress 1A), and the Steptoe Formation (in Empress 1and 1A, and Kanpa 1A). These intervals may be correlatedwith the other wells in the Yowalga area (Ghori, 1998a,figs 5, 6, and 7) that generally show at least someenrichment of the equivalent beds. Bearing in mind thelimitations of the ability of cuttings to quantify thinlybedded source rocks, these correlations are extremelyencouraging and suggest that the source rocks arewidespread.
Not all the formations have been adequately sampled;for example, the Lefroy Formation is very poorlycontrolled. Based on geological principals, the LefroyFormation is thought to have been deposited in the portionof the basin that contains the deepest water, possibly withextensive areas of quiet anoxic conditions. If this is so,thick source rocks of large areal extent could have beendeposited in this unit and, as the Lefroy Formation
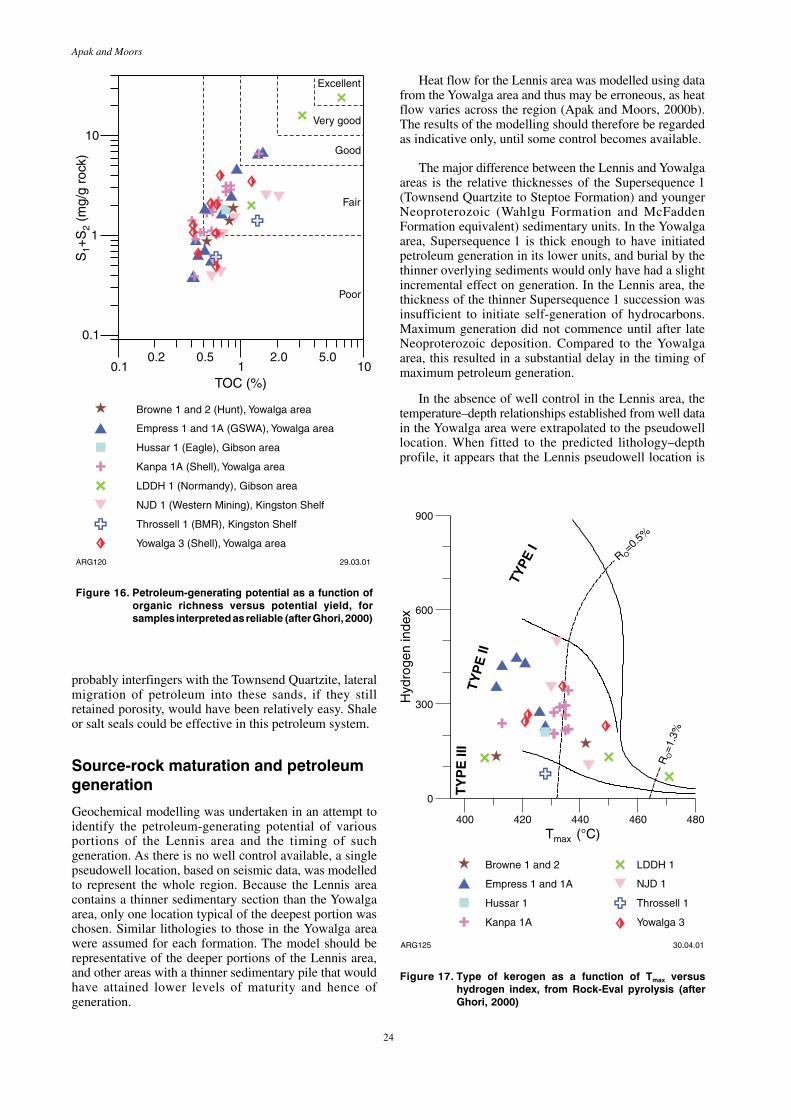
24
Apak and Moors
probably interfingers with the Townsend Quartzite, lateralmigration of petroleum into these sands, if they stillretained porosity, would have been relatively easy. Shaleor salt seals could be effective in this petroleum system.
Source-rock maturation and petroleumgeneration
Geochemical modelling was undertaken in an attempt toidentify the petroleum-generating potential of variousportions of the Lennis area and the timing of suchgeneration. As there is no well control available, a singlepseudowell location, based on seismic data, was modelledto represent the whole region. Because the Lennis areacontains a thinner sedimentary section than the Yowalgaarea, only one location typical of the deepest portion waschosen. Similar lithologies to those in the Yowalga areawere assumed for each formation. The model should berepresentative of the deeper portions of the Lennis area,and other areas with a thinner sedimentary pile that wouldhave attained lower levels of maturity and hence ofgeneration.
Fair
Good
Very good
Excellent
0.1 1 100.2 0.5 2.0 5.0
0.1
1
10
Browne 1 and 2 (Hunt), Yowalga area
Empress 1 and 1A (GSWA), Yowalga area
Hussar 1 (Eagle), Gibson area
Kanpa 1A (Shell), Yowalga area
LDDH 1 (Normandy), Gibson area
NJD 1 (Western Mining), Kingston Shelf
Throssell 1 (BMR), Kingston Shelf
Yowalga 3 (Shell), Yowalga area
Poor
S+
S(m
g/g
rock
)1
2
TOC (%)
ARG120 29.03.01
Figure 16. Petroleum-generating potential as a function oforganic richness versus potential yield, forsamples interpreted as reliable (after Ghori, 2000)
400 420 440 460 480
0
300
600
900
Browne 1 and 2
Empress 1 and 1A
Hussar 1
Kanpa 1A
LDDH 1
NJD 1
Throssell 1
Yowalga 3
Hyd
roge
nin
dex
R=0.5
%
O
R=1
.3%
O
TY
PE
IIITY
PE
II
TYPE
I
ARG125 30.04.01
T (°C)max
Figure 17. Type of kerogen as a function of Tmax versushydrogen index, from Rock-Eval pyrolysis (afterGhori, 2000)
Heat flow for the Lennis area was modelled using datafrom the Yowalga area and thus may be erroneous, as heatflow varies across the region (Apak and Moors, 2000b).The results of the modelling should therefore be regardedas indicative only, until some control becomes available.
The major difference between the Lennis and Yowalgaareas is the relative thicknesses of the Supersequence 1(Townsend Quartzite to Steptoe Formation) and youngerNeoproterozoic (Wahlgu Formation and McFaddenFormation equivalent) sedimentary units. In the Yowalgaarea, Supersequence 1 is thick enough to have initiatedpetroleum generation in its lower units, and burial by thethinner overlying sediments would only have had a slightincremental effect on generation. In the Lennis area, thethickness of the thinner Supersequence 1 succession wasinsufficient to initiate self-generation of hydrocarbons.Maximum generation did not commence until after lateNeoproterozoic deposition. Compared to the Yowalgaarea, this resulted in a substantial delay in the timing ofmaximum petroleum generation.
In the absence of well control in the Lennis area, thetemperature–depth relationships established from well datain the Yowalga area were extrapolated to the pseudowelllocation. When fitted to the predicted lithology–depthprofile, it appears that the Lennis pseudowell location is
25
GSWA Report 77 Basin development and petroleum exploration potential of the Lennis area
in a region of relatively low heat flow (Appendix). Usingthis low rate of heat flow as a constant value through timefailed to create a maturation profile similar to that in thecalibrated Yowalga area, so two models with elevatedpalaeoheat flows were run. The first model has a heatspike in the Neoproterozoic that is twice the value ofthe present heat flow of 67 milliwatt per square metre(mW/m2) and gradually reduces to the present-day heatflow of 33.7 mW/m2 (Appendix). The second model hasa constant moderate heat flow (49 mW/m2) from theNeoproterozoic to the Early Tertiary (60 Ma) andgradually reduces from that time to the present-day heatflow of 33.7 mW/m2. Although there is virtually nodifference in the present-day maturity levels between thetwo models, in the high initial heat-flow model the oilwindow is entered earlier and passed more rapidly thanin the second model (Appendix).
The kinetic modelling assumes a source rock identicalto that modelled in the Yowalga area (Apak and Moors,2000b), which is a type II kerogen with a total organiccarbon (TOC) of 1%. The generation of petroleum wasmost significantly influenced by deposition of theMcFadden Formation equivalent (Appendix). The lowerpart of the Neoproterozoic succession (TownsendQuartzite – Lefroy Formation and lowest BrowneFormation) entered mid-maturity for oil generation beforedeposition of the McFadden Formation equivalent, butwithout substantial generation (Appendix). However,stratigraphically higher units (Hussar and KanpaFormations) generated the bulk of their petroleum,dominantly oil with some gas, after the loading effect ofthe McFadden Formation equivalent (Appendix). Asmall amount of generation also followed the depositionof the Lennis Sandstone, and is relatively more significantin the model that maintained a lower but constantheat flow through to the Tertiary. In comparison to thetotal petroleum generated, this phase of generation isvolumetrically minor. The remainder of the post-Neoproterozoic section is immature for oil and gasgeneration.
Reservoir potentialThe presence of both carbonate and siliciclastic sedi-mentary rocks in the Officer Basin has produced manyopportunities for reservoir development. Potentialsiliciclastic reservoirs are present in the Lennis Sandstone,McFadden Formation equivalent, Wahlgu and LefroyFormations, and the Townsend Quartzite, whereas theSteptoe, Kanpa, Hussar, and Browne Formationspotentially contain hydrocarbon reservoirs in bothquartzose and carbonate lithologies.
In the Yowalga area, the continuous core from GSWAEmpress 1 and 1A has allowed detailed measurement ofboth porosity and permeability of the Neoproterozoicsandstones. Values in excess of 20% porosity and 1 darcy(D) permeability were recorded (Stevens and Apak, 1999,appendix 10). The availability of core data and a full suiteof electric logs has enabled the comparison of measuredand log-derived porosity and demonstrated that log-derived values are reliable (Stevens and Apak, 1999,
plate 1). Most of the carbonate beds are dolomite,although they were originally calcite. There is no porosityassociated with the transformation from calcite to dolomitebecause the replacement is mimetic and complete downto the finest detail. Other opportunities for the creation ofporosity exist in the evaporitic facies, where thedissolution of halite or other evaporites may result inleached secondary porosity.
Townsend Quartzite
Because of its diagenetic history due to its low strati-graphic position and consequent deep burial, theTownsend Quartzite is not regarded as a primary reservoirtarget unless depositional porosity has been preserved.
Lefroy Formation
Apart from an outcrop south of the Musgrave Complex,this formation has only been intersected in the Empress 1Awell, where its lithology consists of siltstone andclaystone. The Lefroy Formation is not regarded as areservoir objective.
Browne Formation
The Browne Formation consists primarily of mixedcarbonate – siliciclastic strata and a few thin-beddedsandstones. The carbonate is dolomite, which may havemimetically replaced the original calcite down to the finestdetail. Most of the carbonate has been deposited in shallowwater and subjected to frequent periods of emergence.Unfortunately, all the initial depositional porosity has beenoccluded at an early stage by cement-grain rims, equantcement-cavity fillings, and anhydrite or halite cements,thus resulting in a tight non-reservoir rock. The porosityis low, with most log-derived values being around 2%.However, log-calculated values up to 15% have beendetermined for Yowalga 3 (Shell Company of Australia,1981) and measured porosities of up to 9.5% wererecorded from some cores.
The abundance of halite and other evaporite minerals,which are easily dissolved, could result in the developmentof secondary solution porosity in this formation. Potentialexploration targets include unconformity traps withreservoirs enhanced by karstification. Any migration pathcontaining fluids capable of dissolving dolomite,anhydrite, or halite may result in secondary leachedporosity. No means of predicting such porosity is knownat this time.
Hussar Formation
In wells drilled in the Yowalga area, the Hussar Formationis a mixed siliciclastic – carbonate succession. Becausethere is more sandstone than carbonate in the formation,sandstone is the main reservoir objective. Althoughindividual sandstone beds are present, they aregenerally stacked into thicker sandy intervals up to 50 min thickness. Maximum log porosities of 15–17%were derived for sandstones in Yowalga 3, Kanpa 1A,
26
Apak and Moors
and Lungkarta 1 (Townson, 1985). Log-derived porositieswere similar in the fully cored Empress 1A and reached20%. Permeabilities were greater than 1 D, but plugand minipermeameter values were approximately100 millidarcies (md).
The Hussar Formation contains less carbonate than theBrowne Formation. In this formation, the carbonate is notpresent as thick sections, but it contains the same shallow-water to emergent facies, lithotypes, and evaporites as theBrowne Formation. Although halite is absent, anhydriteis common. As in the Browne Formation, the carbonateconsists of dolomite that has stoichiometrically replacedcalcite, with no resultant porosity. Log-derived porosityis approximately 1–2% and has been confirmed by plugmeasurements. Permeabilities are virtually zero.
The creation of porosity by the dissolution of anhydriteis a possibility, but the most likely areas for suchsecondary porosity development would be associated withunconformities, where karsting may have taken place.
Kanpa Formation
In the western Officer Basin, the Kanpa Formationhas only been completely penetrated in Kanpa 1Aand Empress 1A, where it is a mixed siliciclastic –carbonate sequence. In Kanpa 1A, the formation contains30% carbonate rocks and 28% sandstone, whereas inEmpress 1A it contains 37% carbonate rocks and 17%sandstone. Siltstone and claystone make up the remaininglithologies.
As in the older formations, the carbonate is a shallow-water facies with evidence of emergence, desiccation, anderosion. The formation does not contain halite, althoughanhydritic zones are present. The dolomitization is againstoichiometric, with no porosity formed during thetransformation from limestone. During log evaluation, a6.5 m interval of dolomite with 14.9% porosity wasrecognized in Lungkarta 1, but typically log porosity isless than 5% (Shell Company of Australia Ltd andSchlumberger, 1985). This low carbonate porosity hasbeen confirmed by plug measurements in Empress 1A.Permeability measurements for plugs in Empress 1A werevirtually zero. The carbonate rocks can generally beregarded as non-reservoir rocks; however, substantialleached secondary porosity may be found in unconformitytraps.
Within the Kanpa Formation, sandstone is only a smallproportion of the formation and is present in thicknessesof less than 10 m. Consequently, it is not an attractivereservoir target. In Empress 1A, log-derived porosities forsandstone reach up to 15% and are supported by plugmeasurements, although plug permeabilities are only inthe order of 1 md.
Steptoe Formation
As with the Kanpa Formation, the Steptoe Formationhas only been penetrated in Kanpa 1A and Empress 1 and1A. In both cases, the formation is truncated by anunconformity. The composition of the full section is
unknown, but in these wells the Steptoe Formation is amixed siliciclastic – carbonate sequence with a basalargillaceous unit overlain by interbedded sandstone andcarbonate deposits. In Kanpa 1A, the formation contained30% sandstone and 39% carbonate rocks, whereas inEmpress 1 and 1A it contained more sandstone (40%) thancarbonate rocks (28%).
In Kanpa 1A, 128 m of sandstone showing porosity inexcess of 15% was recognized from electric logs (ShellCompany of Australia Ltd, 1983a,b,c). Appropriate logcoverage is absent in Empress 1 and 1A, but a singlemeasured porosity was in excess of 22%, with apermeability of approximately 30 md. Sandstone in theSteptoe Formation is an attractive reservoir target,particulary as it can be reached at depths of less than600 m in the crests of many anticlinal structures andunconformity traps.
As in the older formations, the carbonates are ofshallow-water origin, with evidence of emergence,desiccation, and erosion. The dolomitization is againmimetic, with no porosity formed during the transform-ation. Only a single plug was cut in the Steptoe Formationcarbonate, which gave a low porosity and virtually zeropermeability when tested. Numerous permeameterreadings indicate a permeability of about 0.1 md. Thesecarbonates are not an exploration target unless secondaryporosity, such as that near an unconformity, can be found.Significant vuggy porosity and karsting was observed inEmpress 1 and 1A, although in this drillhole all the largekarst cavities were filled with sediment from the overlyingWahlgu Formation.
Wahlgu Formation
The Wahlgu Formation consists of a siliciclastic glacigenesuccession dominated by mass-flow sands. Substantiallithological changes have been observed at variouslocations, but commonly the dominant lithology is sandy.The 200 m-thick section in Empress 1 and 1A consistsmainly of sandstone, with a number of mudstone bedsabout 5 m thick. Measured core-plug porosity rangesbetween 10.9 and 32%, with an average for the five valuesof 23.5%. Permeability ranges between 0.04 and 831 md.Additional minipermeameter values were between 200and 2000 md (Stevens and Apak, 1999). The formationis much thicker in the Lennis area than in the areas wherethe formation is known from outcrop or well penetration,and the lithologies of the Wahlgu Formation in the Lennisarea could be substantially different from these otherareas.
McFadden Formation equivalent
Near the Lennis area, this unit has only been intersectedin Kanpa 1A and Lungkarta 1 to the west and the oil-shalebores Mason 2 and NRH 3 to the southeast. From seismicdata, this unit has been estimated to reach a thickness of1200 m (Townson, 1985), so the thin intersectionsobserved in wells may not be representative of the bulkof the formation. In Kanpa 1A, 18.9% log porosity hasbeen calculated for thin sandstone beds within the
27
GSWA Report 77 Basin development and petroleum exploration potential of the Lennis area
McFadden Formation equivalent (Shell Company ofAustralia Ltd, 1983a,b,c). However, the McFaddenFormation equivalent in the Lennis area may containsubstantially different lithologies, as may also be the casefor the Wahlgu Formation.
SealsSeals in the Officer Basin need to be considered from anumber of perspectives. Local seals can be effective infour-way dip-closed traps or fault-controlled traps and aslateral seals in stratigraphic traps, but regional seals arenecessary to control the migration paths of petroleum,especially for long-range migration. The effectiveness ofa seal over time is also important, as thermal-maturationmodelling shows that a petroleum charge has beenavailable in the Officer Basin since the Neoprotozoic andwould need to have been contained for more than500 million years (see Petroleum generation).
Within the Officer Basin, most of the formationscontain lithologies that would make effective seals at allscales. All formations contain both carbonate and shalethat are suitable for seals. Thinner intervals act as localseals, and thicker packages have a more regional effect.
The carbonate rocks are dolomitic and have noporosity (see Reservoir potential). They could form aneffective seal, but their brittle nature increases the risk ofthem losing integrity in a fault trap. Similarly, in a fault-seal trap their brittle nature results in a higher risk ofcarbonate losing seal potential from the point of view ofboth cross-fault sealing and fault-plane gouge sealing.
The best shale seals were deposited on floodingsurfaces and form the bases of the Kanpa, Hussar, andSteptoe Formations. These shale units reach thicknessesof over 100 m in the Hussar Formation in Kanpa 1A andcan be correlated between wells and picked on seismiclines for hundreds of kilometres across the basin andinto the Lennis area. These could form effective sealsto individual traps, but more importantly they couldact as a control on migration paths for fluids migratingupdip.
In the Yowalga area, the Browne Formation containsmassive units of halite, but individual salinas may havehad a more local distribution because not all the saltpackages can be correlated between all of the wells. Thisis probably a depositional constraint rather than a resultof salt flow. Based on seismic data, a similar distributionof salt is predicted for the Lennis area. The lateral extentof the salt is adequate for sealing all the structural traps,and such an excellent seal would control petroleummigration paths over a large portion of the region.
Salt walls penetrate from the lower part of the BrowneFormation through most of the overlying section, and evenreach the surface. Seismic mapping shows that they extendlaterally for over 100 km (Plate 1). Salt walls provideeffective barriers to petroleum migrating from structuraldeeps, thus causing a migration shadow updip behindthem. The timing of these walls with respect to thegeneration of petroleum is important.
TrapsBecause of the geographic isolation, lack of infrastructure,and harsh climatic conditions, petroleum accumulationswithin the Officer Basin need to be substantial in orderto be commercially viable. The current availability of low-cost alternative gas supplies to the surrounding marketsalso indicates that oil would be the favoured petroleumproduct. It was proposed to carry out a study to identifywhat would be the minimum size of a commercialaccumulation. However, the swift obsolescence of asimilar study for the South Australian portion ofthe Officer Basin (Alexander and McDonough, 1997)proved that each company would need to use thecurrently prevailing parameters in a ‘just-in-time’evaluation to reach a meaningful conclusion. Alexanderand McDonough (1997) concluded that oil reserves of20 million barrels would be commercially attractive undertheir constraints.
The presence of salt within the Officer Basin hasresulted in a wide range of possible trapping configur-ations. Warren (1989) defined 22 possible salt-related trapstyles, based on structure and porosity development, orocclusion. Many of these could apply to the Lennis area.In petroleum-rich Oman, the Ara Salt is the principal sealfor nearly all of the accumulations, and is considered acritical parameter for petroleum entrapment (Gorin et al.,1982). Salt is expected to have the same significancewithin the sedimentary section of a similar age in theOfficer Basin. Many other conventional structural andstratigraphic plays are also present and provide attractivetargets for petroleum exploration.
No effort has been made to quantify the trap sizeswithin the Lennis area as seismic control is inadequate,but there is the potential for some to be very large. Themain play types are summarized in Figure 18 and a briefoutline for each type is presented below.
Fault traps
Few faults have been observed in the Lennis area.Although their low frequency can be attributed, at leastin part, to the poor seismic control, there appears to havebeen little extension in this very stable area. With lessbasin uplift along the northern margin of the Lennis area,the compressive listric, salt-mobilized thrusts that arecharacteristic of the Yowalga area to the west are notcommon, but some minor examples of such thrusts maybe present, such as on seismic line 80-3B (SP 310) inFigure 13.
Normal faults
Because of the paucity of seismic control, normal faultsare drawn with a short lateral extent in the report byDurrant and Associates (1998; Plate 1). Fault orientationcannot be determined from one-line intersections, but hasbeen shown with a northwesterly strike that is parallel tothe general structural grain. The size of structuresassociated with such faults is generally too small to be ofcommercial interest at present. If proven to have a greater
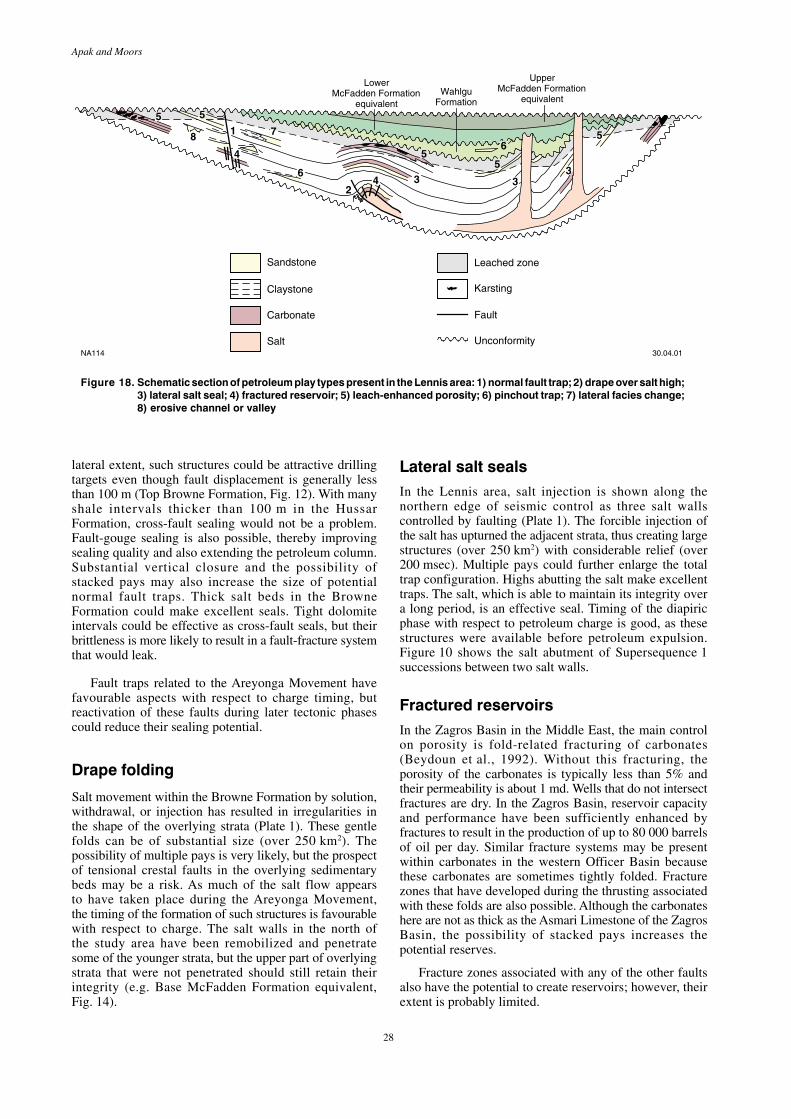
28
Apak and Moors
lateral extent, such structures could be attractive drillingtargets even though fault displacement is generally lessthan 100 m (Top Browne Formation, Fig. 12). With manyshale intervals thicker than 100 m in the HussarFormation, cross-fault sealing would not be a problem.Fault-gouge sealing is also possible, thereby improvingsealing quality and also extending the petroleum column.Substantial vertical closure and the possibility ofstacked pays may also increase the size of potentialnormal fault traps. Thick salt beds in the BrowneFormation could make excellent seals. Tight dolomiteintervals could be effective as cross-fault seals, but theirbrittleness is more likely to result in a fault-fracture systemthat would leak.
Fault traps related to the Areyonga Movement havefavourable aspects with respect to charge timing, butreactivation of these faults during later tectonic phasescould reduce their sealing potential.
Drape folding
Salt movement within the Browne Formation by solution,withdrawal, or injection has resulted in irregularities inthe shape of the overlying strata (Plate 1). These gentlefolds can be of substantial size (over 250 km2). Thepossibility of multiple pays is very likely, but the prospectof tensional crestal faults in the overlying sedimentarybeds may be a risk. As much of the salt flow appearsto have taken place during the Areyonga Movement,the timing of the formation of such structures is favourablewith respect to charge. The salt walls in the north ofthe study area have been remobilized and penetratesome of the younger strata, but the upper part of overlyingstrata that were not penetrated should still retain theirintegrity (e.g. Base McFadden Formation equivalent,Fig. 14).
Lateral salt sealsIn the Lennis area, salt injection is shown along thenorthern edge of seismic control as three salt wallscontrolled by faulting (Plate 1). The forcible injection ofthe salt has upturned the adjacent strata, thus creating largestructures (over 250 km2) with considerable relief (over200 msec). Multiple pays could further enlarge the totaltrap configuration. Highs abutting the salt make excellenttraps. The salt, which is able to maintain its integrity overa long period, is an effective seal. Timing of the diapiricphase with respect to petroleum charge is good, as thesestructures were available before petroleum expulsion.Figure 10 shows the salt abutment of Supersequence 1successions between two salt walls.
Fractured reservoirsIn the Zagros Basin in the Middle East, the main controlon porosity is fold-related fracturing of carbonates(Beydoun et al., 1992). Without this fracturing, theporosity of the carbonates is typically less than 5% andtheir permeability is about 1 md. Wells that do not intersectfractures are dry. In the Zagros Basin, reservoir capacityand performance have been sufficiently enhanced byfractures to result in the production of up to 80 000 barrelsof oil per day. Similar fracture systems may be presentwithin carbonates in the western Officer Basin becausethese carbonates are sometimes tightly folded. Fracturezones that have developed during the thrusting associatedwith these folds are also possible. Although the carbonateshere are not as thick as the Asmari Limestone of the ZagrosBasin, the possibility of stacked pays increases thepotential reserves.
Fracture zones associated with any of the other faultsalso have the potential to create reservoirs; however, theirextent is probably limited.
Figure 18. Schematic section of petroleum play types present in the Lennis area: 1) normal fault trap; 2) drape over salt high;3) lateral salt seal; 4) fractured reservoir; 5) leach-enhanced porosity; 6) pinchout trap; 7) lateral facies change;8) erosive channel or valley
UpperMcFadden Formation
equivalent
LowerMcFadden Formation
equivalentWahlgu
Formation
1
3 33
4
4
5 5
55
5
6
678
NA114 30.04.01
2
Unconformity
Leached zone
Karsting
Fault
Sandstone
Claystone
Carbonate
Salt
29
GSWA Report 77 Basin development and petroleum exploration potential of the Lennis area
Stratigraphic traps
Stratigraphic traps may represent significant opportunitiesfor the discovery of petroleum in the Officer Basin. Anumber of such traps are discussed below.
Unconformity truncations
There are large areas adjacent to salt-injection features(Fig. 10) and along basin margins where the sedimentarysuccessions have been tilted and severely eroded. Duringerosive periods, a vertical leached profile may develop andresult in increased porosity (Fig. 18). Leaching out of themore soluble components such as halite, anhydrite, andcarbonate from the sandstone and carbonate, and thedevelopment of karst within carbonates, may createextensive porosity. Evaporite cements and nodules arecommon within all the Supersequence 1 formations. Anerosional unconformity also exists between the McFaddenFormation equivalent and Wahlgu Formation that couldcreate or enhance porosity in the eroded WahlguFormation. Similar erosion of the intra-McFaddenFormation equivalent over salt intrusions has also beenobserved (Fig. 10), which may possibly have had a similareffect.
Another strength of the unconformity play is the factthat unconformities are commonly regional migrationpaths for fluids being expelled from compacting basins.These fluids could enhance porosity by dissolving solublecomponents and could also transport petroleum into thenewly created trap.
A weakness of unconformity trap configurations belowthe Wahlgu Formation is that the Wahlgu Formation maybe an ineffective seal. The principal lithology is sandstonethat, although of glacigene provenance, appears to be aninadequate seal. In Empress 1 and 1A, porosity of thebasal sandstone was in excess of 25% and permeabilitiesranged between 100 and 1000 md, which would result inan ineffective seal. In the Lennis area, the formation ismuch thicker and the untested basal strata may makeadequate seals. More work needs to be done to establishthe distribution of the Wahlgu Formation, but in areaswhere it is absent, especially over diapiric structures, theMcFadden Formation equivalent may provide an adequateseal. In Kanpa 1A, the bottom 29 m of the McFaddenFormation equivalent contain porous massive sandstone.The next 70 m above this section contain massive shalethat would be an effective seal. The lithology of theMcFadden Formation equivalent in the Lennis area isunknown. Seismic control is still inadequate, and ourunderstanding of charge timing, and potential reservoirand seal distribution for this play is uncertain. However,such traps could contain large petroleum accumulations.
Pinchout traps
As the authors’ understanding of the evolution of thewestern Officer Basin has improved from studies in theYowalga area, it has become clear that differentialsubsidence has resulted in the depositional pinchingout of units within Supersequence 1 (Fig. 18). Forexample, the bottom two parasequences of the Browne
Formation in Yowalga 3 and Kanpa 1A are not present inEmpress 1A, and the lowest Steptoe Formation para-sequence in Kanpa 1A is absent in Empress 1 and 1A(Apak and Moors, 2000b). Other examples are present inthe Wahlgu Formation and McFadden Formationequivalent in the salt rims adjacent to salt walls. Figures 9and 10 clearly show sedimentary units onlapping againstthe sides of the salt rims, thus creating numerous potentialpinchout traps. The key component for an effective trapof this type is a reservoir pinching out between a top sealand a basal seal. From the point of view of charge, thetiming of such traps is excellent, and there is a goodchance that such a configuration could be maintained overa long period of time, thus preserving any petroleumaccumulation.
Facies changes
An improved understanding of the Neoproterozoicstratigraphy has shown that lateral facies changes arepresent in the successions (Fig. 18). For example, Apakand Moors (2000b) showed that the dolomitic zone in theH 1 succession present in Kanpa 1A (2260–2400 m) isabsent in the equivalent intersection in Empress 1A. InKanpa 1A, this succession is overlain by shaly strata thatwould make good top seals. In Empress 1A, the equivalentstrata are sandy. Sandy intervals may also terminateagainst suitable shale or carbonate seals. Deposition ofisolated shoreface sands within fine-grained facies suchas an offshore bar may also develop into possiblestratigraphic traps (Fig. 18). The early timing of such trapsis excellent with respect to charge and the stable, low-angled ramp configuration of the area should enable themaintenance of trap integrity over long periods of time.
A possible variant of this type of trap is the occlusionof porosity by evaporites in more marginal settings. Thereare numerous horizons where halite and anhydrite havebeen formed in desiccation zones, thus plugging theporosity of the sediments either during or just afterdeposition. Such traps are also early with respect to chargeand could be expected to retain any accumulation over along period.
Erosive channels or valleys
Frequent emergence is well documented in much of theSupersequence 1 strata, and any channels could later befilled with high-energy, reservoir-quality sediments andsealed by the subsequent transgressive shale (Fig. 18).Again the timing with respect to charge is excellent, andthe retention of petroleum in this very stable area is likelyto be good.
ProspectivityThe potential for the discovery of substantial petroleumreserves in the western Officer Basin is good. Theapplication of modern depositional, geochemical, andsequence-stratigraphy concepts has refined the predictionof the distribution of the various components required todefine petroleum systems that may be present in theOfficer Basin. Because there have been so few exploration
30
Apak and Moors
wells drilled, and they are typically poorly locatedstructurally and commonly have not reached keyobjectives, the lack of past success is not surprising.However, the minor shows encountered prove thatpetroleum systems do exist. Key wells, such as thecontinuously cored Empress 1 and 1A, have providedinformation previously unavailable from conventional oilexploration. The following comments made on theprospectivity of the Lennis area use the Yowalga area asa model.
The lack of source rocks was seen as a negative factorin earlier assessments of the petroleum potential of thewestern Officer Basin (Phillips et al., 1985). However, thepresence of source rocks has now been confirmed in mostof the Supersequence 1 formations (Apak and Moors,2000b). Although the intervals with identified potential arethin, they prove that favourable conditions for source-rockaccumulation were present. The lateral persistence of theseintervals indicates that the conditions controlling theirdeposition were regional, rather than local in character.Greater development of source rocks is possible inuntested parts of the basin such as the Lennis area. All ofthe source rocks are very similar in nature and containtype II kerogen, which has both oil- and gas-generatingpotential.
Geochemical modelling has suggested that the timingof oil generation was very early, and hence retention ofthis charge is considered a problem. However, in theLennis area generation and expulsion probably took placeafter the main tectonic phases of the Areyonga Movementand Petermann Ranges Orogeny, therefore suitablestructures were available to trap the migrating petroleum.Later salt movements have modified some of thehalokinetic traps, and there is a suggestion of repeatedmovements up to the present day. This may have resultedin some petroleum loss, but the salt seal itself may nothave been breached. In the basin deep, as represented bythe Top Browne to Hussar Formation in the pseudowelllocation, almost all the petroleum was generated duringthe Cambrian. In shallower parts of the basin, asrepresented by the Top Kanpa Formation in the pseudo-well location, the later generation phase during depositionof the Carboniferous Lennis Formation could have beensignificant. Unfortunately, maturation at such shallowdepths of burial is not high and only a small portion ofthe potential source-rock yield has been achieved.
As indicated in the Petroleum generation section, theheat flow in the Lennis area, at present and in the past, ispoorly constrained. As in the Yowalga area, heat flow islikely to have been variable across the study area. Thusif the temperature reached in the basin was higher thanthat in the modelled pseudowell location, the amount ofpetroleum generated would have been larger. However, thetiming (dominantly Cambrian with secondary generationsduring the Carboniferous) would not change, so chargeand trap relationship for both structural and stratigraphictraps would remain very favourable.
Although many uncertainties exist, a number ofgeneralizations about petroleum generation for any partof the Lennis area can still be made. For plays in specificareas, models can be proposed with ranges of parameters
to define their sensitivities to generation and to select themost favourable traps for testing.
Reservoir presence and quality have not beenconsidered a problem in the Officer Basin. However, byanalogy with lithologies found in the Yowalga area, thepresence of carbonate rocks as well as siliciclastic unitswithin the sedimentary succession in the Lennis areaopens up the possibility of a very large range of porositytypes.
Assuming that the formations in the Yowalga areacontinue throughout the Lennis area, the TownsendQuartzite is not regarded as a reservoir target, since allthe sandstone beds appear not to be of reservoir quality.The Lefroy Formation is lacking in sand and hence is nota reservoir target. Sandstone is also thin and uncommonin the Browne Formation, but carbonates and evaporitesare present in significant quantities and have somepotential for reservoir development. The carbonates havebeen dolomitized without any porosity formation, butsecondary porosity could have developed as a result offracturing during flexure or by solution during erosion(karsting). The evaporites (halite and sulfates) are proneto solution, which may result in leached porosity. TheBrowne Formation, where such secondary porosity hasdeveloped, is the oldest potential reservoir target.
The Hussar, Kanpa, and Steptoe Formations arepredicted to contain sandstone with reservoir potential.The best reservoir-quality sandstone present in theYowalga area is within the Hussar Formation, whichcontains stacked beds of sandstone over 50 m thick. In thatarea, good porosities, and permeabilities in the range of100 md – 1 D, have been measured. This formation is alsoexpected to be the most sand-prone interval in the Lennisarea, but the availability of a sand source for this regionhas not yet been proven. Carbonate content should bemore predictable and these three formations shouldcontain significant carbonate similar to that in the BrowneFormation, with minor primary porosity but a potential todevelop secondary porosity. In all three formations,multiple pays are likely. In the Yowalga area, the WahlguFormation is an entirely siliciclastic sequence containingsandstone units with porosity up to 30% and permeabilityin excess of 1 D. This unit should be a target in the Lennisarea, where the formation is thicker than in the Yowalgaarea, but where the detailed lithology is unknown. TheMcFadden Formation equivalent is not well representedin drillholes and to date only thin sandstone beds havebeen identified. These sandstones have reservoir potentialand would be a target in thicker sections, such as in theLennis area.
Because of their thickness and lithology, seals in theOfficer Basin have a high potential for petroleumaccumulation and should be present at all stratigraphiclevels in the Lennis area. The best seal is salt, whichbecause of its plasticity has excellent retention properties.Substantial thicknesses of salt are present in the BrowneFormation, as proven on seismic sections, and salt wallsmay form lateral seals to substantial structures. Thick shaleis present in most supersequence units, and may be over100 m thick at the base of parasequence sets. These shaleswould be excellent as both top and lateral seals. In fault

31
GSWA Report 77 Basin development and petroleum exploration potential of the Lennis area
traps, these shales have the potential to form fault-gougeor cross-fault seals wherever the fault throw is less thantheir thickness. Carbonate can be an effective seal, butit is prone to fracturing in structured areas. Salt, shale,and carbonate units have a large lateral extent in theOfficer Basin, and also need to be considered assignificant controls on the migration of petroleum. Otherlocal seals that could result in petroleum accumulationsare diagenetic barriers, dolomitized carbonates, andevaporites.
A wide range of trap configurations is present in theLennis area, including depositional stratigraphic traps,folds, faults, and unconformity traps. The presence of saltfurther enhances the potential of the area, as it isassociated with large accumulations elsewhere in theworld. There have been no valid tests to date in the Lennisarea. The ultimate petroleum potential of the Officer Basinis unproven, but it may be very significant.
32
Apak and Moors
References
DURRANT and ASSOCIATES, 1998, Officer Basin regionalinterpretation project, Lennis and Gibson Sub-Basins: WesternAustralia Geological Survey, Statutory petroleum exploration report,S31319 A4 (unpublished).
GHORI, K.A. R., 1998a, Petroleum generating potential and thermalhistory of the Neoproterozoic Officer Basin, in The sedimentarybasins of Western Australia 2 edited by P. G. PURCELL andR. R. PURCELL: Petroleum Exploration Society of Australia;Sedimentary Basins of West Australia Symposium, Perth, W.A.,1998, Proceedings, p. 717–730.
GHORI, K. A. R., 1998b, Petroleum source-rock potential and thermalhistory of the Officer Basin, Western Australia: Western AustraliaGeological Survey, Record 1998/3, 52p.
GHORI, K. A. R., 2000, Appendix — Petroleum source-rock potentialand maturation history of the Yowalga area, in Basin developmentand petroleum exploration potential of the Yowalga area, OfficerBasin, Western Australia, by S. N. APAK and H. T. MOORS:Western Australia Geological Survey, Report 76, 61p.
GORIN, G. E., RACZ, L. G., and WALTER, M. R., 1982, LatePreCambrian–Cambrian sediments of Huqf Group, Sultanate ofOman: American Association of Petroleum Geologists, Bulletin,v. 66, p. 2609–2627.
GREY, K., 1999, Appendix 8 — Proterozoic stromatolite biostratigraphyof Empress 1A, in GSWA Empress 1 and 1A well completion report,Yowalga Sub-basin, Officer Basin, Western Australia compiled byM. K. STEVENS and S. N. APAK: Western Australia GeologicalSurvey, Record 1999/4, p. 40–44.
GREY, K., APAK, S. N., EYLES, C., EYLES, N., STEVENS, M. K.,and CARLSEN, G. M., 1999, Neoproterozoic glacigene successions,western Officer Basin, W.A.: Western Australia Geological Survey,Annual Review 1998–99, p. 74–80.
GREY, K., and COTTER, K. L., 1996, Palynology in the search forProterozoic hydrocarbons: Western Australia Geological Survey,Annual Review 1995–96, p. 70–80.
GREY, K., and STEVENS, M. K., 1997, Neoproterozoic palynomorphsfrom the Savory Sub-basin, Western Australia and their relevanceto petroleum and mineral exploration: Western Australia GeologicalSurvey, Annual Review 1996–97, p. 49–54.
GREY, K. G., STEVENS, M. K., APAK, S. N., CARLSEN, G. M.,and MOORS, H. T., in prep., Stratigraphic revision ofNeoproterozoic rocks of the western Officer Basin: Western AustraliaGeological Survey, Record.
GRIGSON, M. W., 1982, Sedimentology of the Townsend Quartzite,Officer Basin, Western Australia: University of Western Australia,Hons thesis (unpublished).
HILL, A. C., COTTER, K. L., and GREY, K., 2000, Mid-Neoproterozoic biostratigraphy and isotope stratigraphy in Australia:Precambrian Research, v. 100, p. 283–300.
HILL, A. C., and WALTER, M. R., 2000, Mid-Neoproterozoic (~830–750 Ma) isotope stratigraphy of Australia and global correlation:Precambrian Research, v. 100, p. 181–211.
HOCKING, R.M., 1994, Subdivisions of Western AustralianNeoproterozoic and Phanerozoic sedimentary basins: WesternAustralia Geological Survey, Record 1994/4, 83p.
ALEXANDER, E. M., and McDONOUGH, R. C., 1997, Explorationand production economics, in The petroleum geology of SouthAustralia, volume 3, Officer Basin edited by J. G. G. MORTONand J. F. DREXEL: South Australian Department of Mines andEnergy Resources, Report Book 97/19, p. 141–145.
ALSHARAN, A. S., and NAIRN, A. E. M., 1997, Sedimentary basinsand petroleum geology of the Middle East: Amsterdam, TheNetherlands, Elsevier Science BV, 843p.
APAK, S. N., and MOORS, H. T., 2000a, A sequence stratigraphicmodel of Neoproterozoic strata, Yowalga area, Officer Basin,Western Australia: APPEA Journal, v. 40 (1), p. 15–25.
APAK, S. N., and MOORS, H. T., 2000b, Basin development andpetroleum exploration potential of the Yowalga area, Officer Basin,Western Australia: Western Australia Geological Survey, Report 76,61p.
APAK, S. N., MOORS, H. T., and STEVENS, M. K., in prep., GSWAVines 1 well completion report, Waigen area, Officer Basin, WesternAustralia: Western Australia Geological Survey, Record.
BAGAS, L., GREY, K., HOCKING, R. M., and WILLIAMS, I. R.,1999, Neoproterozoic successions of the northwestern Officer Basin:a reappraisal: Western Australia Geological Survey, Annual Review1998–99, p. 39–44.
BEARD, J. S., 1974, The vegetation of the Great Victoria Desert,1:1 000 000 Vegetation Series, Explanatory Notes to Sheet 3, GreatVictoria Desert: Perth, University of Western Australia Press.
BEYDOUN, Z. R., HUGHES CLARK, M. W., and STONELEY, R.,1992, Petroleum in the Zagros Basin: a Late Tertiary foreland basinoverprinted onto the outer edge of a vast hydrocarbon-richPalaeozoic–Mesozoic passive-margin shelf: American Associationof Petroleum Geologists, Memoir, v. 55, p. 309–340.
BUNTING J. A., JACKSON, M. J., and CHIN R. J., 1978, Throssell,W.A.: Western Australia Geological Survey, 1:250 000 GeologicalSeries Explanatory Notes, 17p.
CARLSEN, G. M., APAK, S. N., GHORI, K. A. R., GREY, K.,and STEVENS, M. K., 1999, Petroleum potential of theNeoproterozoic Western Officer Basin, Western Australia, basedon a source-rock model from Empress-1A: APPEA Journal, v. 39(1), p. 322–341.
COCKBAIN, A. E., and HOCKING, R. M., 1989, Revised stratigraphicnomenclature in Western Australian Phanerozoic basins: WesternAustralia Geological Survey, Record 1989/15, 11p.
COMPSTON, W., 1974, The Table Hill Volcanics of the Officer Basin— Precambrian or Paleozoic?: Geological Society of Australia,Journal, v. 21, p. 403-412.
COTTER, K. L., 1999, Microfossils from NeoproterozoicSupersequence 1 of the Officer Basin, Western Australia: Alcheringa,v. 23, p. 63–86.
DANIELS, J. L., 1970, Bentley, W.A.: Western Australia GeologicalSurvey, 1:250 000 Geological Series Explanatory Notes, 20p.
DANIELS, J. L., 1971, Talbot, W.A.: Western Australia GeologicalSurvey, 1:250 000 Geological Series Explanatory Notes, 28p.
DANIELS, J. L., 1974, The geology of the Blackstone Region, WesternAustralia: Western Australia Geological Survey, Bulletin 123, 257p.
33
GSWA Report 77 Basin development and petroleum exploration potential of the Lennis area
HUNT OIL COMPANY, 1965, Yowalga 1, Lennis 1, Browne 1 and 2prints: Western Australia Geological Survey, Statutory petroleumexploration report, S234 (unpublished).
JACKSON, M. J., 1976, Browne, W.A.: Australia BMR, 1:250 000Geological Series Explanatory Notes, 16p.
JACKSON M. J., 1978, Robert, W.A.: Western Australia GeologicalSurvey, 1:250 000 Geological Series Explanatory Notes, 20p.
JACKSON, M. J., and van de GRAAFF, W. J. E., 1981, Geology ofthe Officer Basin, Western Australia: Australia BMR, Bulletin 206,102p.
JAPAN NATIONAL OIL CORPORATION, 1997, Geological andgeophysical survey in the western Officer Basin, Western Australia— Integrated geological interpretation study: Western AustraliaGeological Survey, Statutory petroleum exploration report, S10276(unpublished).
KENNEWELL, P. J., 1977a, Westwood, W.A.: Western AustraliaGeological Survey, 1:250 000 Geological Series Explanatory Notes,14p.
KENNEWELL, P. J., 1977b, Yowalga, W.A.: Western AustraliaGeological Survey, 1:250 000 Geological Series Explanatory Notes,15p.
KONTOROVICH, A. E., MANDEL ‘BAUM, M. M., SURKOV,V. S., TROFIMUK, A. A., and ZOLOTOV, A. N., 1990, Lena-Tunguska Upper Proterozoic–Palaeozoic petroleum superprovince,in Classic petroleum provinces edited by J. BROOKS: GeologicalSociety of London, Special Publication, no. 50, p. 473–489.
KUZNETSOV, K. G., 1997, Riphean hydrocarbon reservoirs of theYurubachen–Tokhom zone, Lena-Tunguska province, NE Russia:Journal of Petroleum Geology, v. 20 (4), p. 459–474.
LAMBECK, K., 1984, Structure and evolution of the Amadeus, Officerand Ngalia Basins of central Australia: Australian Journal of EarthSciences, v. 31, p. 25–48.
MOUSSAVI-HARAMI, R., and GRAVESTOCK, D. I., 1995, Burialhistory of the eastern Officer Basin, South Australia: APEA Journal,v. 35 (1), p. 307–320.
MYERS, J. S., SHAW, R. D., and TYLER, I. M., 1996, Tectonicevolution of Proterozoic Australia: Tectonics, v. 15, p. 1431–1446.
PERINCEK, D., 1996, The age of Neoproterozoic–Palaeozoic sedimentswithin the Officer Basin of the Centralian Super-Basin can beconstrained by major sequence-bounding unconformities: APPEAJournal, v. 36 (1), p. 61–79.
PERINCEK, D., 1997, The stratigraphic and structural development ofthe Officer Basin, Western Australia — a review: Western AustraliaGeological Survey, Annual Review 1995–96, p. 135–148.
PERINCEK, D., 1998, A compilation and review of data pertaining tothe hydrocarbon prospectivity of the Officer Basin: Western AustraliaGeological Survey, Record 1997/6, 209p.
PHILLIPS, B. J., JAMES, A. W., and PHILIP, G. M., 1985, Thegeology and hydrocarbon potential of the northwestern Officer Basin:APEA Journal, v. 25 (1), p. 52–61.
PREISS, W. V., WALTER, M. W., COATS, R. P., and WELLS, A. T.,1978, Lithological correlations of Adelaidean glaciogenic rocks inparts of the Amadeus, Ngalia, and Georgina Basins: Australia BMR,Journal of Australian Geology and Geophysics, v. 3, p. 45–53.
SHELL COMPANY OF AUSTRALIA, LTD, 1981, Yowalga 3 wellcompletion report: Western Australia Geological Survey, Statutorypetroleum exploration report, W1709 A5/V1, V2 (unpublished).
SHELL COMPANY OF AUSTRALIA LTD, 1983a, Kanpa 1/1A wellcompletion report: Western Australia Geological Survey, Statutorypetroleum exploration report, W2281 V1/A2/V1 (unpublished).
SHELL COMPANY OF AUSTRALIA LTD, 1983b, Kanpa 1/1A wellcompletion report: Western Australia Geological Survey, Statutorypetroleum exploration report, W2281 V1/A2/V2 (unpublished).
SHELL COMPANY OF AUSTRALIA LTD, 1983c, Kanpa 1/1A wellcompletion report (Officer Basin, EP 178): Western AustraliaGeological Survey, Statutory petroleum exploration report, W2281V1/A2/V3 (unpublished).
SHELL COMPANY OF AUSTRALIA LTD and SCHLUMBERGER,1985, Lungkarta 1 and Lungkarta 1, Sidetrack 1 well completionreport (enclosures): Western Australia Geological Survey, Statutorypetroleum exploration report, W2667 A4/V1 (unpublished).
SHEVCHENKO, S. I., and IASKY, R. P., 1997, Calculating depth tobasement from magnetic and gravity data, with an example fromthe western Officer Basin: Western Australia Geological Survey,Annual Review 1996–97, p. 69–75.
STEVENS, M. K., and ADAMIDES, S. N., 1998, GSWA Trainor 1well completion report, Savory Sub-basin, Officer Basin, WesternAustralia, with notes on petroleum and mineral potential: WesternAustralia Geological Survey, Record 1996/12, 69p.
STEVENS, M. K., and APAK, S. N., 1999, GSWA Empress 1 and 1Awell completion report, Yowalga Sub-basin, Officer Basin, WesternAustralia: Western Australia Geological Survey, Record 1999/4,110p.
STEVENS, M. K., and CARLSEN, G. M., 1998, A review of datapertaining to the hydrocarbon prospectivity of the Savory Sub-basin,Officer Basin, Western Australia: Western Australia GeologicalSurvey, Record 1998/5, 65p.
TOWNSON, W. G., 1985, The subsurface geology of the westernOfficer Basin—results of Shell’s 1980–1984 petroleum explorationcampaign: APEA Journal, v. 25 (1), p. 34–51.
VAN WAGONER, J. C., MITCHUM, R. M., CAMPION, K. M., andRAHMANIAN, V. D., 1990, Siliciclastic sequence stratigraphy inwell logs, cores, and outcrops: AAPG Methods in Exploration Series,no. 7, 55p.
WALTER, M. R., and GORTER, J., 1994, The NeoproterozoicCentralian Superbasin in Western Australia: the Savory and OfficerBasins, in The sedimentary basins of Western Australia edited byP. G. PURCELL and R. R. PURCELL: Petroleum ExplorationSociety of Australia; Sedimentary Basins of West AustraliaSymposium, Perth, W.A., 1994, Proceedings, p. 851–864.
WALTER, M. R., KRYLOV, I. N., and PREISS, W. V., 1979,Stromatolites from Adelaidean (Late Proterozoic) sequences incentral and South Australia: Alcheringa, v. 3, p. 287–305.
WARREN, J. K., 1989, Evaporite sedimentology — its importance inhydrocarbon accumulations: Englewood Cliffs, New Jersey, Prentice-Hall Scientific Publications, 285p.
WATTS, K. J., 1982, The geology of the Townsend Quartzite — UpperProterozoic shallow water deposit of the northern Officer Basin,Western Australia: University of Western Australia, Hons thesis(unpublished).
WILLIAMS, I. R., 1992, Geology of the Savory Basin, WesternAustralia: Western Australia Geological Survey, Bulletin 141, 115p.
WILLIAMS, I. R., 1994, The Neoproterozoic Savory Basin, WesternAustralia, in The sedimentary basins of Western Australia edited byP. G. PURCELL and R. R. PURCELL: Petroleum ExplorationSociety of Australia; Sedimentary Basins of West AustraliaSymposium, Perth, W.A.,1994, p. 841–850.
ZHAO, J.-X., McCULLOCH, M. T., and KORSCH, R. J., 1994,Characterisation of a plume-related ~800 Ma magmatic event andits implications for basin formation in central-southern Australia:Earth and Planetary Science Letters, v. 121, p. 349–367.
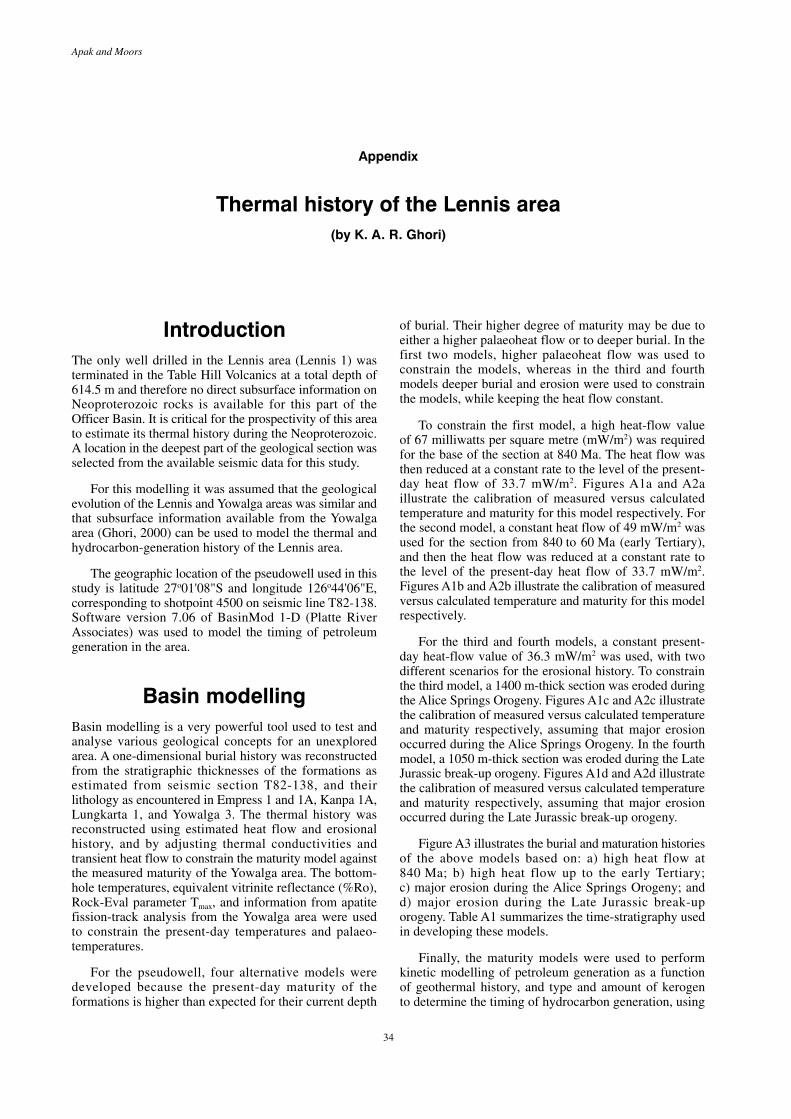
34
Apak and Moors
Appendix
Thermal history of the Lennis area(by K. A. R. Ghori)
of burial. Their higher degree of maturity may be due toeither a higher palaeoheat flow or to deeper burial. In thefirst two models, higher palaeoheat flow was used toconstrain the models, whereas in the third and fourthmodels deeper burial and erosion were used to constrainthe models, while keeping the heat flow constant.
To constrain the first model, a high heat-flow valueof 67 milliwatts per square metre (mW/m2) was requiredfor the base of the section at 840 Ma. The heat flow wasthen reduced at a constant rate to the level of the present-day heat flow of 33.7 mW/m2. Figures A1a and A2aillustrate the calibration of measured versus calculatedtemperature and maturity for this model respectively. Forthe second model, a constant heat flow of 49 mW/m2 wasused for the section from 840 to 60 Ma (early Tertiary),and then the heat flow was reduced at a constant rate tothe level of the present-day heat flow of 33.7 mW/m2.Figures A1b and A2b illustrate the calibration of measuredversus calculated temperature and maturity for this modelrespectively.
For the third and fourth models, a constant present-day heat-flow value of 36.3 mW/m2 was used, with twodifferent scenarios for the erosional history. To constrainthe third model, a 1400 m-thick section was eroded duringthe Alice Springs Orogeny. Figures A1c and A2c illustratethe calibration of measured versus calculated temperatureand maturity respectively, assuming that major erosionoccurred during the Alice Springs Orogeny. In the fourthmodel, a 1050 m-thick section was eroded during the LateJurassic break-up orogeny. Figures A1d and A2d illustratethe calibration of measured versus calculated temperatureand maturity respectively, assuming that major erosionoccurred during the Late Jurassic break-up orogeny.
Figure A3 illustrates the burial and maturation historiesof the above models based on: a) high heat flow at840 Ma; b) high heat flow up to the early Tertiary;c) major erosion during the Alice Springs Orogeny; andd) major erosion during the Late Jurassic break-uporogeny. Table A1 summarizes the time-stratigraphy usedin developing these models.
Finally, the maturity models were used to performkinetic modelling of petroleum generation as a functionof geothermal history, and type and amount of kerogento determine the timing of hydrocarbon generation, using
IntroductionThe only well drilled in the Lennis area (Lennis 1) wasterminated in the Table Hill Volcanics at a total depth of614.5 m and therefore no direct subsurface information onNeoproterozoic rocks is available for this part of theOfficer Basin. It is critical for the prospectivity of this areato estimate its thermal history during the Neoproterozoic.A location in the deepest part of the geological section wasselected from the available seismic data for this study.
For this modelling it was assumed that the geologicalevolution of the Lennis and Yowalga areas was similar andthat subsurface information available from the Yowalgaarea (Ghori, 2000) can be used to model the thermal andhydrocarbon-generation history of the Lennis area.
The geographic location of the pseudowell used in thisstudy is latitude 27o01'08"S and longitude 126o44'06"E,corresponding to shotpoint 4500 on seismic line T82-138.Software version 7.06 of BasinMod 1-D (Platte RiverAssociates) was used to model the timing of petroleumgeneration in the area.
Basin modellingBasin modelling is a very powerful tool used to test andanalyse various geological concepts for an unexploredarea. A one-dimensional burial history was reconstructedfrom the stratigraphic thicknesses of the formations asestimated from seismic section T82-138, and theirlithology as encountered in Empress 1 and 1A, Kanpa 1A,Lungkarta 1, and Yowalga 3. The thermal history wasreconstructed using estimated heat flow and erosionalhistory, and by adjusting thermal conductivities andtransient heat flow to constrain the maturity model againstthe measured maturity of the Yowalga area. The bottom-hole temperatures, equivalent vitrinite reflectance (%Ro),Rock-Eval parameter Tmax, and information from apatitefission-track analysis from the Yowalga area were usedto constrain the present-day temperatures and palaeo-temperatures.
For the pseudowell, four alternative models weredeveloped because the present-day maturity of theformations is higher than expected for their current depth
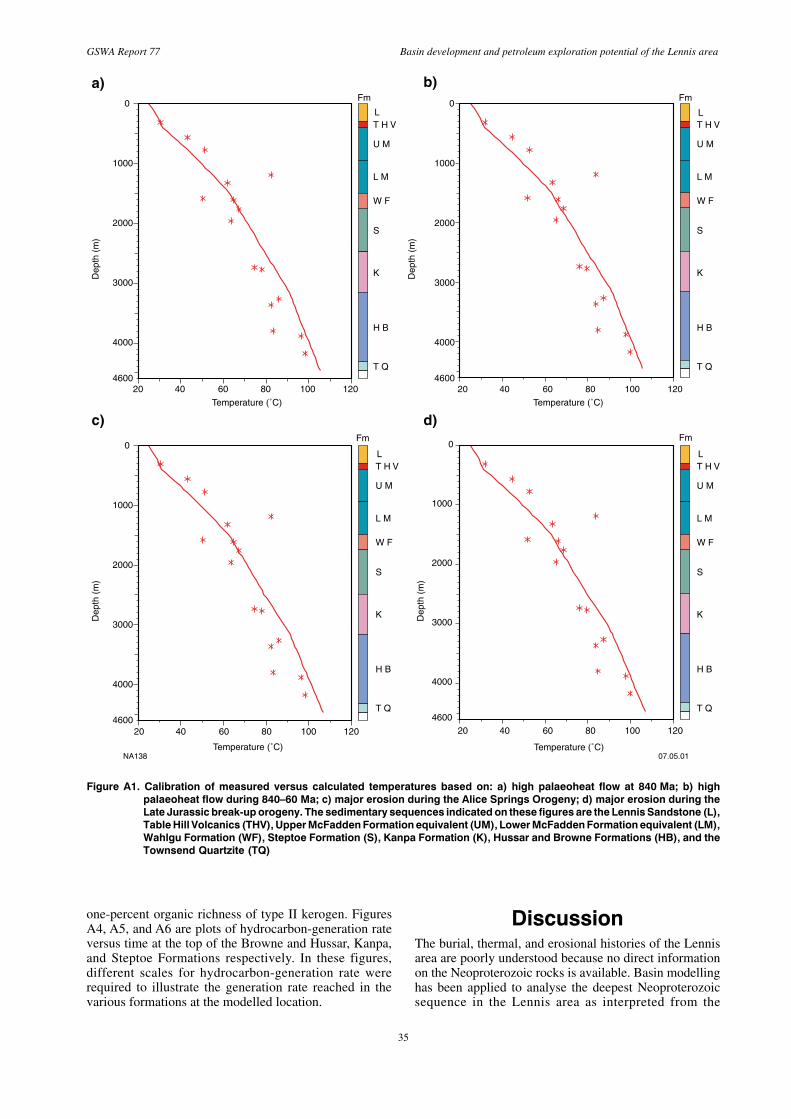
35
GSWA Report 77 Basin development and petroleum exploration potential of the Lennis area
one-percent organic richness of type II kerogen. FiguresA4, A5, and A6 are plots of hydrocarbon-generation rateversus time at the top of the Browne and Hussar, Kanpa,and Steptoe Formations respectively. In these figures,different scales for hydrocarbon-generation rate wererequired to illustrate the generation rate reached in thevarious formations at the modelled location.
DiscussionThe burial, thermal, and erosional histories of the Lennisarea are poorly understood because no direct informationon the Neoproterozoic rocks is available. Basin modellinghas been applied to analyse the deepest Neoproterozoicsequence in the Lennis area as interpreted from the
Temperature (˚C)
0
1000
2000
3000
4000
4600
Fm
Temperature (˚C)
0
1000
2000
3000
4000
4600
Fm
LT H V
U M
L M
W F
S
K
H B
T Q
FmD
epth
(m
)
Temperature (˚C)
20 40 60 80 100 120
0
1000
2000
3000
4000
4600
Dep
th (
m)
Dep
th (
m)
Fm
Temperature (˚C)
0
1000
2000
3000
4000
4600
Dep
th (
m)
a) b)
c) d)
LT H V
U M
L M
W F
S
K
H B
T Q
LT H V
U M
L M
W F
S
K
H B
T Q
LT H V
U M
L M
W F
S
K
H B
T Q
20 40 60 80 100 120
20 40 60 80 100 12020 40 60 80 100 120
NA138 07.05.01
Figure A1. Calibration of measured versus calculated temperatures based on: a) high palaeoheat flow at 840 Ma; b) highpalaeoheat flow during 840–60 Ma; c) major erosion during the Alice Springs Orogeny; d) major erosion during theLate Jurassic break-up orogeny. The sedimentary sequences indicated on these figures are the Lennis Sandstone (L),Table Hill Volcanics (THV), Upper McFadden Formation equivalent (UM), Lower McFadden Formation equivalent (LM),Wahlgu Formation (WF), Steptoe Formation (S), Kanpa Formation (K), Hussar and Browne Formations (HB), and theTownsend Quartzite (TQ)
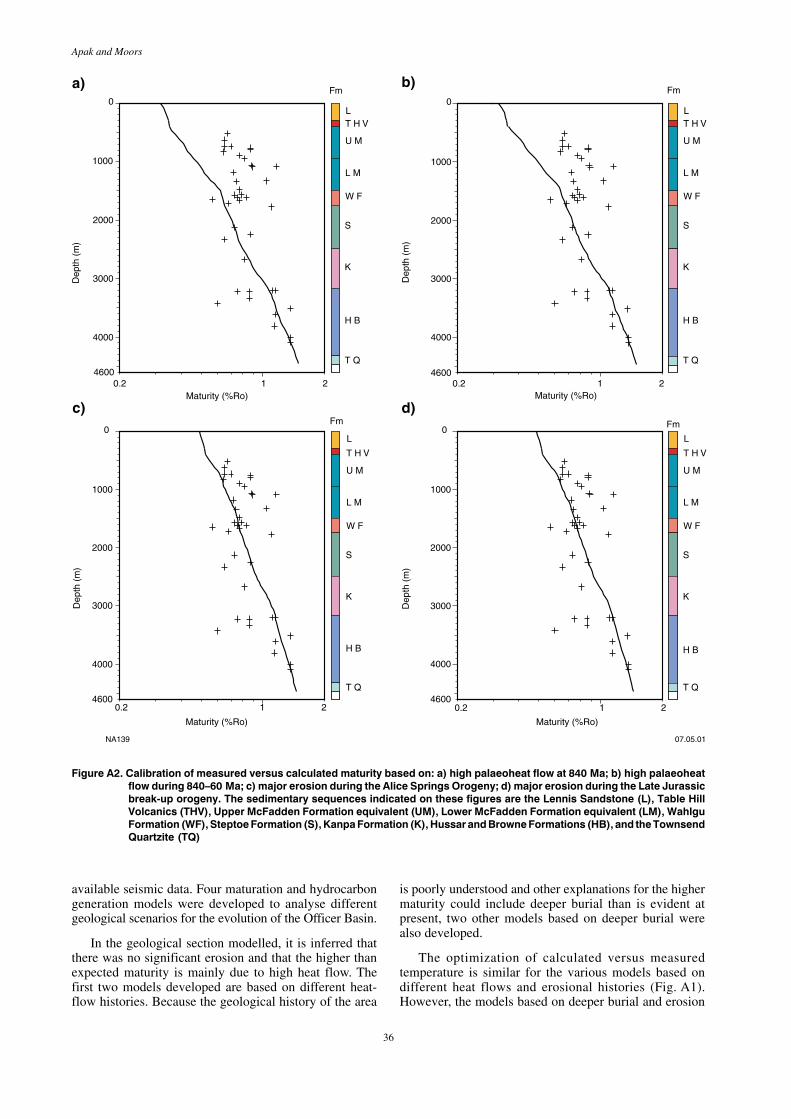
36
Apak and Moors
available seismic data. Four maturation and hydrocarbongeneration models were developed to analyse differentgeological scenarios for the evolution of the Officer Basin.
In the geological section modelled, it is inferred thatthere was no significant erosion and that the higher thanexpected maturity is mainly due to high heat flow. Thefirst two models developed are based on different heat-flow histories. Because the geological history of the area
is poorly understood and other explanations for the highermaturity could include deeper burial than is evident atpresent, two other models based on deeper burial werealso developed.
The optimization of calculated versus measuredtemperature is similar for the various models based ondifferent heat flows and erosional histories (Fig. A1).However, the models based on deeper burial and erosion
Maturity (%Ro)
0.2 1 2
0
1000
2000
3000
4000
4600
Fm
Maturity (%Ro)
0.2 1 2
0
1000
2000
3000
4000
4600
Fm
LT H V
U M
L M
W F
S
K
H B
T Q
Fm Fm
Dep
th (
m)
0
1000
2000
3000
4000
4600
Dep
th (
m)
Dep
th (
m)
0
1000
2000
3000
4000
4600
Dep
th (
m)
Maturity (%Ro)0.2 1 2
Maturity (%Ro)0.2 1 2
a) b)
c) d)
LT H V
U M
L M
W F
S
K
H B
T Q
L
T H V
U M
L M
W F
S
K
H B
T Q
L
T H V
U M
L M
W F
S
K
H B
T Q
NA139 07.05.01
Figure A2. Calibration of measured versus calculated maturity based on: a) high palaeoheat flow at 840 Ma; b) high palaeoheatflow during 840–60 Ma; c) major erosion during the Alice Springs Orogeny; d) major erosion during the Late Jurassicbreak-up orogeny. The sedimentary sequences indicated on these figures are the Lennis Sandstone (L), Table HillVolcanics (THV), Upper McFadden Formation equivalent (UM), Lower McFadden Formation equivalent (LM), WahlguFormation (WF), Steptoe Formation (S), Kanpa Formation (K), Hussar and Browne Formations (HB), and the TownsendQuartzite (TQ)
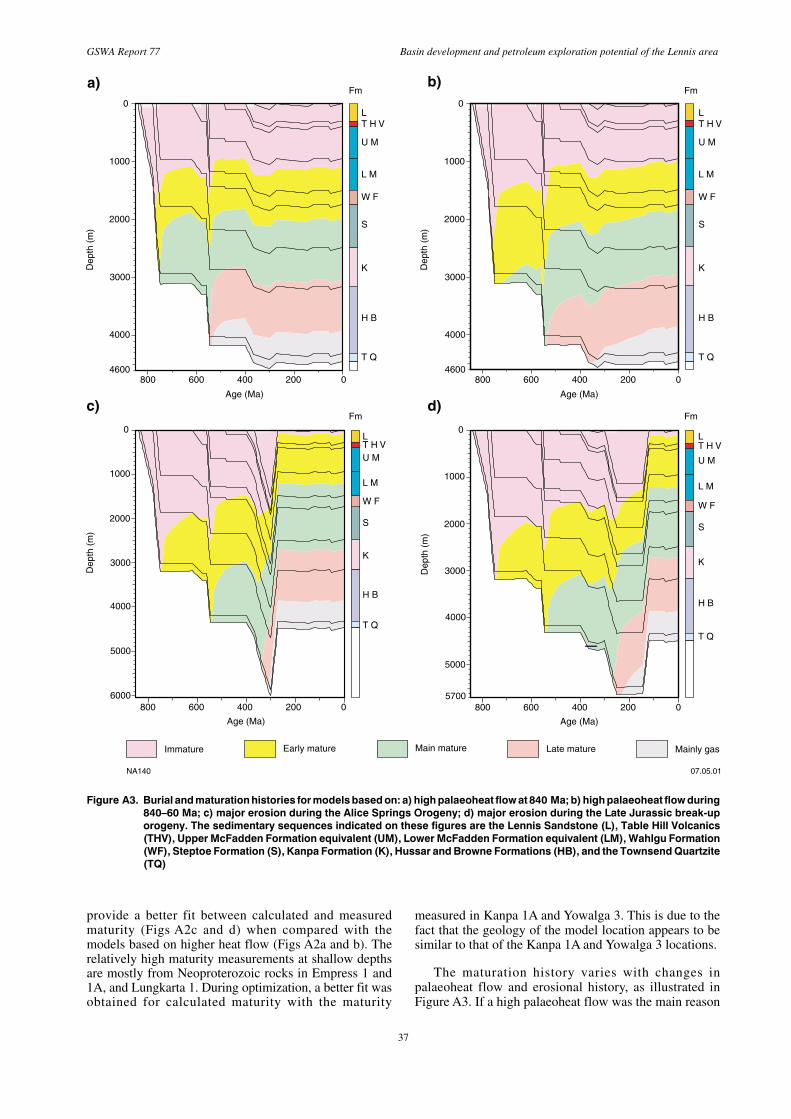
37
GSWA Report 77 Basin development and petroleum exploration potential of the Lennis area
provide a better fit between calculated and measuredmaturity (Figs A2c and d) when compared with themodels based on higher heat flow (Figs A2a and b). Therelatively high maturity measurements at shallow depthsare mostly from Neoproterozoic rocks in Empress 1 and1A, and Lungkarta 1. During optimization, a better fit wasobtained for calculated maturity with the maturity
measured in Kanpa 1A and Yowalga 3. This is due to thefact that the geology of the model location appears to besimilar to that of the Kanpa 1A and Yowalga 3 locations.
The maturation history varies with changes inpalaeoheat flow and erosional history, as illustrated inFigure A3. If a high palaeoheat flow was the main reason
Age (Ma)
200
c) d)
b)a)0
1000
2000
3000
4000
Dep
th (
m)
Fm
4600
Dep
th (
m)
0
1000
2000
3000
4000
6000
0
1000
2000
3000
4000
Dep
th (
m)
4600
LT H V
U M
L M
W F
S
K
H B
T Q
Fm
0
1000
2000
3000
4000
Dep
th (
m)
5700
LT H VU M
L M
W F
S
K
H B
T Q
0400600800
Age (Ma)
200 0400600800
Age (Ma)
200 0400600800
Age (Ma)
200 0400600800
5000
5000
NA140 07.05.01
LT H V
U M
L M
W F
S
K
H B
T Q
LT H V
U M
L M
W F
S
K
H B
T Q
Immature Early mature Main mature Late mature Mainly gas
FmFm
Figure A3. Burial and maturation histories for models based on: a) high palaeoheat flow at 840 Ma; b) high palaeoheat flow during840–60 Ma; c) major erosion during the Alice Springs Orogeny; d) major erosion during the Late Jurassic break-uporogeny. The sedimentary sequences indicated on these figures are the Lennis Sandstone (L), Table Hill Volcanics(THV), Upper McFadden Formation equivalent (UM), Lower McFadden Formation equivalent (LM), Wahlgu Formation(WF), Steptoe Formation (S), Kanpa Formation (K), Hussar and Browne Formations (HB), and the Townsend Quartzite(TQ)
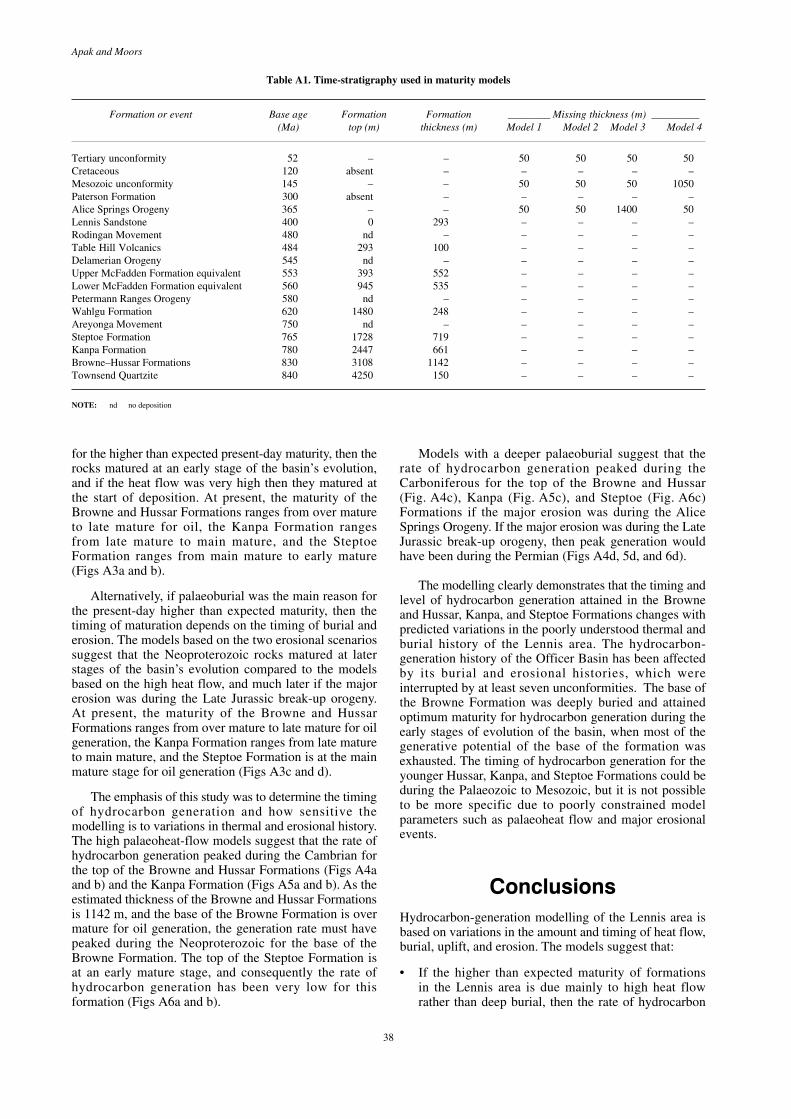
38
Apak and Moors
for the higher than expected present-day maturity, then therocks matured at an early stage of the basin’s evolution,and if the heat flow was very high then they matured atthe start of deposition. At present, the maturity of theBrowne and Hussar Formations ranges from over matureto late mature for oil, the Kanpa Formation rangesfrom late mature to main mature, and the SteptoeFormation ranges from main mature to early mature(Figs A3a and b).
Alternatively, if palaeoburial was the main reason forthe present-day higher than expected maturity, then thetiming of maturation depends on the timing of burial anderosion. The models based on the two erosional scenariossuggest that the Neoproterozoic rocks matured at laterstages of the basin’s evolution compared to the modelsbased on the high heat flow, and much later if the majorerosion was during the Late Jurassic break-up orogeny.At present, the maturity of the Browne and HussarFormations ranges from over mature to late mature for oilgeneration, the Kanpa Formation ranges from late matureto main mature, and the Steptoe Formation is at the mainmature stage for oil generation (Figs A3c and d).
The emphasis of this study was to determine the timingof hydrocarbon generation and how sensitive themodelling is to variations in thermal and erosional history.The high palaeoheat-flow models suggest that the rate ofhydrocarbon generation peaked during the Cambrian forthe top of the Browne and Hussar Formations (Figs A4aand b) and the Kanpa Formation (Figs A5a and b). As theestimated thickness of the Browne and Hussar Formationsis 1142 m, and the base of the Browne Formation is overmature for oil generation, the generation rate must havepeaked during the Neoproterozoic for the base of theBrowne Formation. The top of the Steptoe Formation isat an early mature stage, and consequently the rate ofhydrocarbon generation has been very low for thisformation (Figs A6a and b).
Models with a deeper palaeoburial suggest that therate of hydrocarbon generation peaked during theCarboniferous for the top of the Browne and Hussar(Fig. A4c), Kanpa (Fig. A5c), and Steptoe (Fig. A6c)Formations if the major erosion was during the AliceSprings Orogeny. If the major erosion was during the LateJurassic break-up orogeny, then peak generation wouldhave been during the Permian (Figs A4d, 5d, and 6d).
The modelling clearly demonstrates that the timing andlevel of hydrocarbon generation attained in the Browneand Hussar, Kanpa, and Steptoe Formations changes withpredicted variations in the poorly understood thermal andburial history of the Lennis area. The hydrocarbon-generation history of the Officer Basin has been affectedby its burial and erosional histories, which wereinterrupted by at least seven unconformities. The base ofthe Browne Formation was deeply buried and attainedoptimum maturity for hydrocarbon generation during theearly stages of evolution of the basin, when most of thegenerative potential of the base of the formation wasexhausted. The timing of hydrocarbon generation for theyounger Hussar, Kanpa, and Steptoe Formations could beduring the Palaeozoic to Mesozoic, but it is not possibleto be more specific due to poorly constrained modelparameters such as palaeoheat flow and major erosionalevents.
ConclusionsHydrocarbon-generation modelling of the Lennis area isbased on variations in the amount and timing of heat flow,burial, uplift, and erosion. The models suggest that:
• If the higher than expected maturity of formationsin the Lennis area is due mainly to high heat flowrather than deep burial, then the rate of hydrocarbon
Table A1. Time-stratigraphy used in maturity models
Formation or event Base age Formation Formation ________ Missing thickness (m) _________(Ma) top (m) thickness (m) Model 1 Model 2 Model 3 Model 4
Tertiary unconformity 52 – – 50 50 50 50Cretaceous 120 absent – – – – –Mesozoic unconformity 145 – – 50 50 50 1050Paterson Formation 300 absent – – – – –Alice Springs Orogeny 365 – – 50 50 1400 50Lennis Sandstone 400 0 293 – – – –Rodingan Movement 480 nd – – – – –Table Hill Volcanics 484 293 100 – – – –Delamerian Orogeny 545 nd – – – – –Upper McFadden Formation equivalent 553 393 552 – – – –Lower McFadden Formation equivalent 560 945 535 – – – –Petermann Ranges Orogeny 580 nd – – – – –Wahlgu Formation 620 1480 248 – – – –Areyonga Movement 750 nd – – – – –Steptoe Formation 765 1728 719 – – – –Kanpa Formation 780 2447 661 – – – –Browne–Hussar Formations 830 3108 1142 – – – –Townsend Quartzite 840 4250 150 – – – –
NOTE: nd no deposition
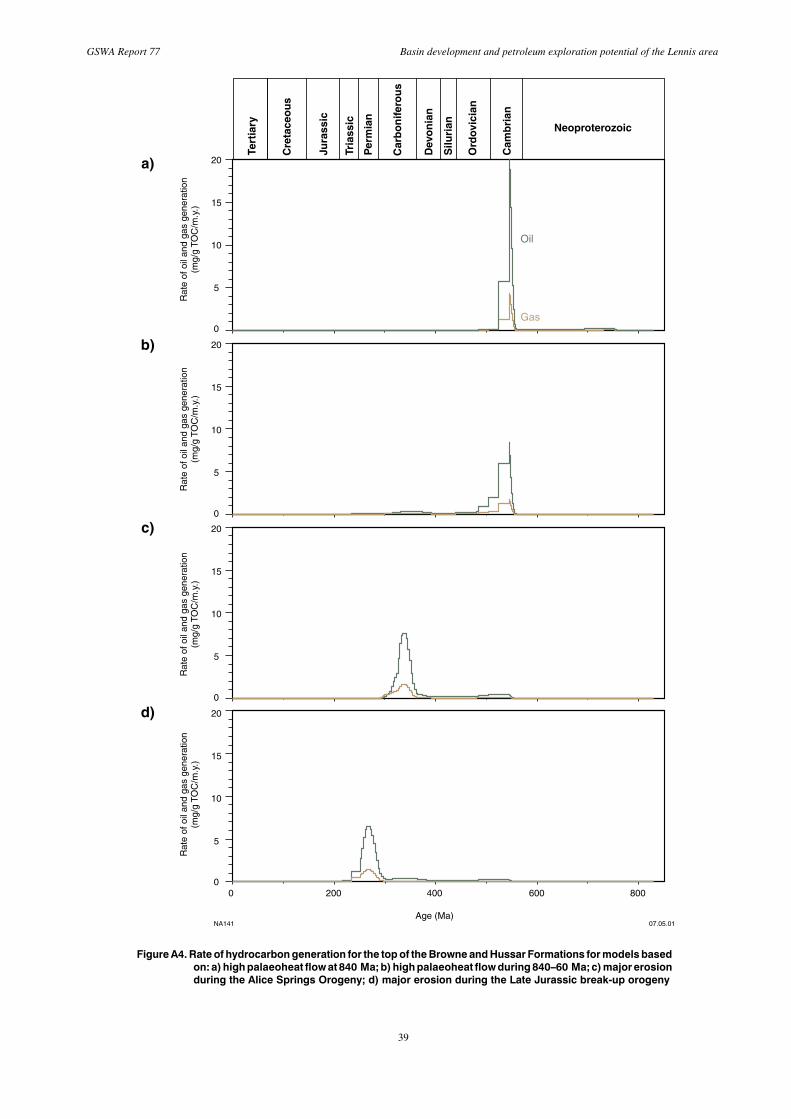
39
GSWA Report 77 Basin development and petroleum exploration potential of the Lennis area
20
Rat
e of
oil
and
gas
gene
ratio
n (m
g/g
TOC
/m.y
.)
a)
b)
c)
d)
15
10
5
0
0
Age (Ma)
200 400 600 800
20
15
10
5
0
20
15
10
5
0
20
15
10
5
0
Tert
iary
Cre
tace
ou
s
Jura
ssic
Tria
ssic
Per
mia
n
Car
bo
nif
ero
us
Silu
rian
Dev
on
ian
Ord
ovic
ian
Cam
bri
an
Neoproterozoic
Oil
Gas
Rat
e of
oil
and
gas
gene
ratio
n (m
g/g
TOC
/m.y
.)R
ate
of o
il an
d ga
s ge
nera
tion
(mg/
g TO
C/m
.y.)
Rat
e of
oil
and
gas
gene
ratio
n (m
g/g
TOC
/m.y
.)
NA141 07.05.01
Figure A4. Rate of hydrocarbon generation for the top of the Browne and Hussar Formations for models basedon: a) high palaeoheat flow at 840 Ma; b) high palaeoheat flow during 840–60 Ma; c) major erosionduring the Alice Springs Orogeny; d) major erosion during the Late Jurassic break-up orogeny
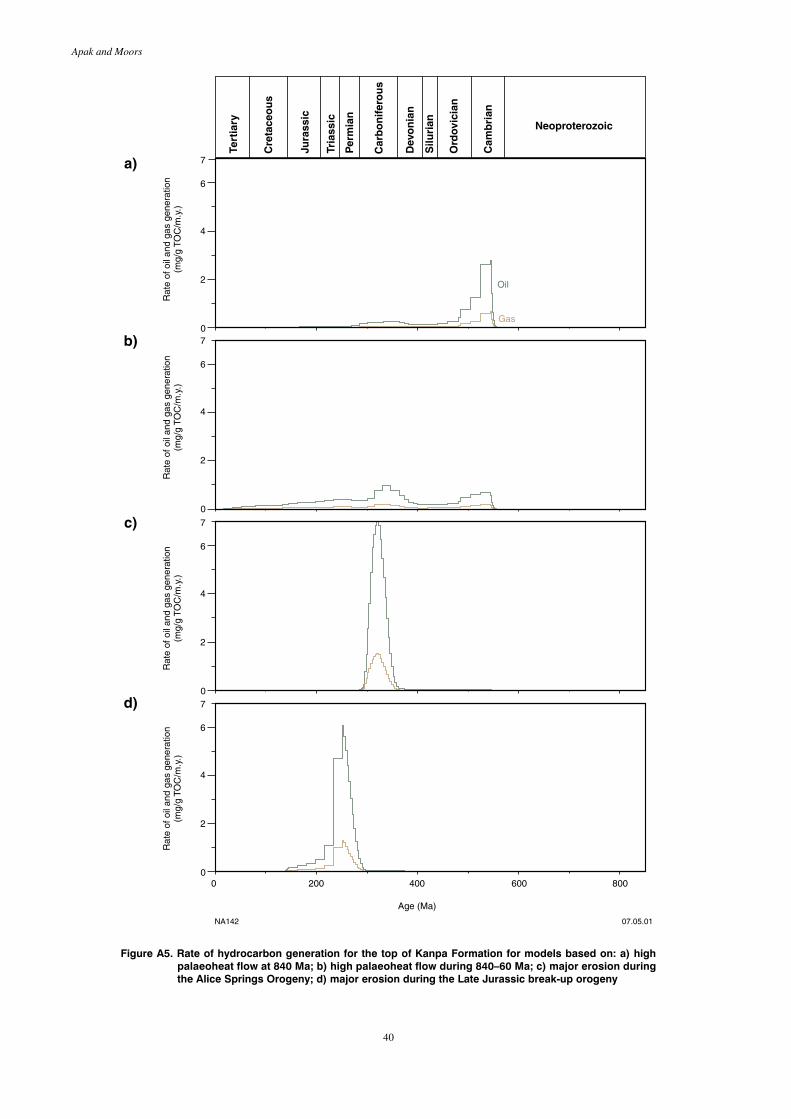
40
Apak and Moors
Oil
Gas
0
Age (Ma)
200 400 600 800
7R
ate
of o
il an
d ga
s ge
nera
tion
(mg/
g TO
C/m
.y.)
a)
b)
c)
d)
0
Tert
iary
Cre
tace
ou
s
Jura
ssic
Tria
ssic
Per
mia
n
Car
bo
nif
ero
us
Silu
rian
Dev
on
ian
Ord
ovic
ian
Cam
bri
an
Neoproterozoic
6
4
2
7
0
6
4
2
7
0
6
4
2
7
0
6
4
2
NA142 07.05.01
Rat
e of
oil
and
gas
gene
ratio
n (m
g/g
TOC
/m.y
.)R
ate
of o
il an
d ga
s ge
nera
tion
(mg/
g TO
C/m
.y.)
Rat
e of
oil
and
gas
gene
ratio
n (m
g/g
TOC
/m.y
.)
Figure A5. Rate of hydrocarbon generation for the top of Kanpa Formation for models based on: a) highpalaeoheat flow at 840 Ma; b) high palaeoheat flow during 840–60 Ma; c) major erosion duringthe Alice Springs Orogeny; d) major erosion during the Late Jurassic break-up orogeny
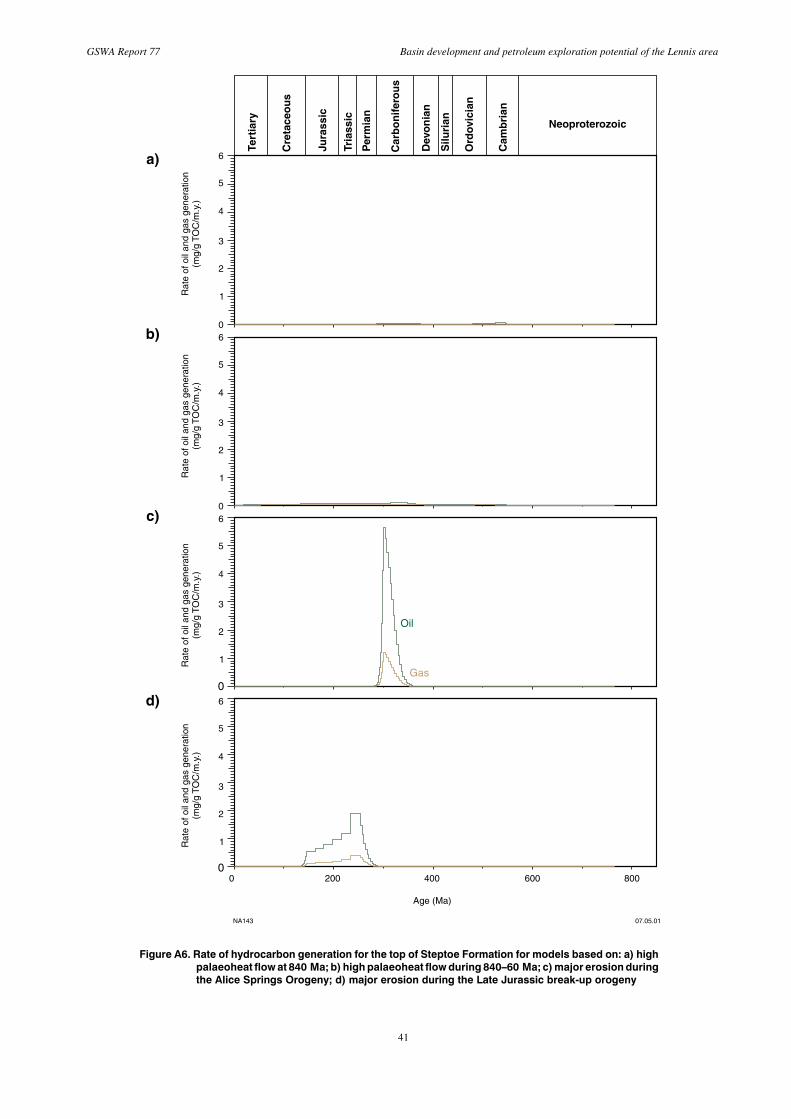
41
GSWA Report 77 Basin development and petroleum exploration potential of the Lennis area
Oil
Gas
0
Age (Ma)
200 400 600 800
6
3
2
1
0
Tert
iary
Cre
tace
ou
s
Jura
ssic
Tria
ssic
Per
mia
n
Car
bo
nif
ero
us
Silu
rian
Dev
on
ian
Ord
ovic
ian
Cam
bri
an
Neoproterozoic
Rat
e of
oil
and
gas
gene
ratio
n (m
g/g
TOC
/m.y
.)
a)
b)
c)
d)
4
5
6
3
2
1
0
4
5
6
3
2
1
0
4
5
6
3
2
1
0
4
5
Rat
e of
oil
and
gas
gene
ratio
n (m
g/g
TOC
/m.y
.)R
ate
of o
il an
d ga
s ge
nera
tion
(mg/
g TO
C/m
.y.)
Rat
e of
oil
and
gas
gene
ratio
n (m
g/g
TOC
/m.y
.)
NA143 07.05.01
Figure A6. Rate of hydrocarbon generation for the top of Steptoe Formation for models based on: a) highpalaeoheat flow at 840 Ma; b) high palaeoheat flow during 840–60 Ma; c) major erosion duringthe Alice Springs Orogeny; d) major erosion during the Late Jurassic break-up orogeny
42
Apak and Moors
generation peaked during the Cambrian for the top ofthe Browne and Hussar Formations, and the KanpaFormation. Currently, the basal part of the BrowneFormation would be over mature for oil generation andthe top of Steptoe Formation is at an early maturestage.
• If the higher degree of maturity is due to deeper thanexpected burial, then the rate of hydrocarbongeneration peaked during the Carboniferous orPermian for the top of the Browne and HussarFormations, the Kanpa Formation, and the SteptoeFormation. The timing would have depended onwhether major erosion occurred during the AliceSprings Orogeny or the Late Jurassic break-uporogeny.
• The modelling predicts that the Browne and HussarFormations, the Kanpa Formation, and the SteptoeFormation are presently within the oil window andprovides encouragement for further exploration.
ReferencesCOOK, A. C., 1995, Report on source rock type, maturation levels,
thermal history and hydrocarbon occurrence in suites of samplesfrom four wells in the Officer Basin, W.A.: Western AustraliaGeological Survey, Statutory petroleum exploration report, S31319A1, (unpublished).
GHORI, K. A. R., 1998a, Petroleum generating potential and thermalhistory of the Neoproterozoic Officer Basin, in The sedimentarybasins of Western Australia 2 edited by P. G. PURCELL and R. R.PURCELL: Proceeding of West Australian Basins Symposium,Perth, Western Australia, 1998, p. 717–730.
GHORI, K. A. R., 1998b, Petroleum source-rock potential and thermalhistory of the Officer Basin, Western Australia: Western AustraliaGeological Survey, Record 1998/3, 52p.
GHORI, K. A. R., 1999, Appendix 9 — Geochemistry, in GSWAEmpress 1 and 1A well completion report, Yowalga Sub-basin,Officer Basin, Western Australia compiled by M. K. STEVENSand S. N. APAK: Western Australia Geological Survey, Record1999/4, 110p.
GHORI, K. A. R., 2000, Appendix — Petroleum source-rock potentialand maturation history of the Yowalga area, in Basin developmentand petroleum exploration potential of the Yowalga area, OfficerBasin, Western Australia by S. N. APAK and H. T. MOORS:Western Australia Geological Survey, Report 76, p. 49–61.
HEGARTY, K. A., O’BRIEN, C., and WATSON, P. G. F., 1988,Thermal history reconstruction for the Empress 1A well (OfficerBasin) using apatite fission track analysis and reflectance: WesternAustralia Geological Survey, Statutory petroleum exploration report,S20424 A2 (unpublished).
LARTER, S.R., 1985, Integrated kerogen typing and quantitativeassessment of petroleum source rocks, in Petroleum geochemistryin exploration of the Norwegian Shelf edited by B. M. THOMAS:London, Norwegian Petroleum Society, p. 269–286.
PERINCEK, D., 1998, A compilation and review of data pertaining tothe hydrocarbon prospectivity of the Officer Basin: Western AustraliaGeological Survey, Record 1997/6, 209p.
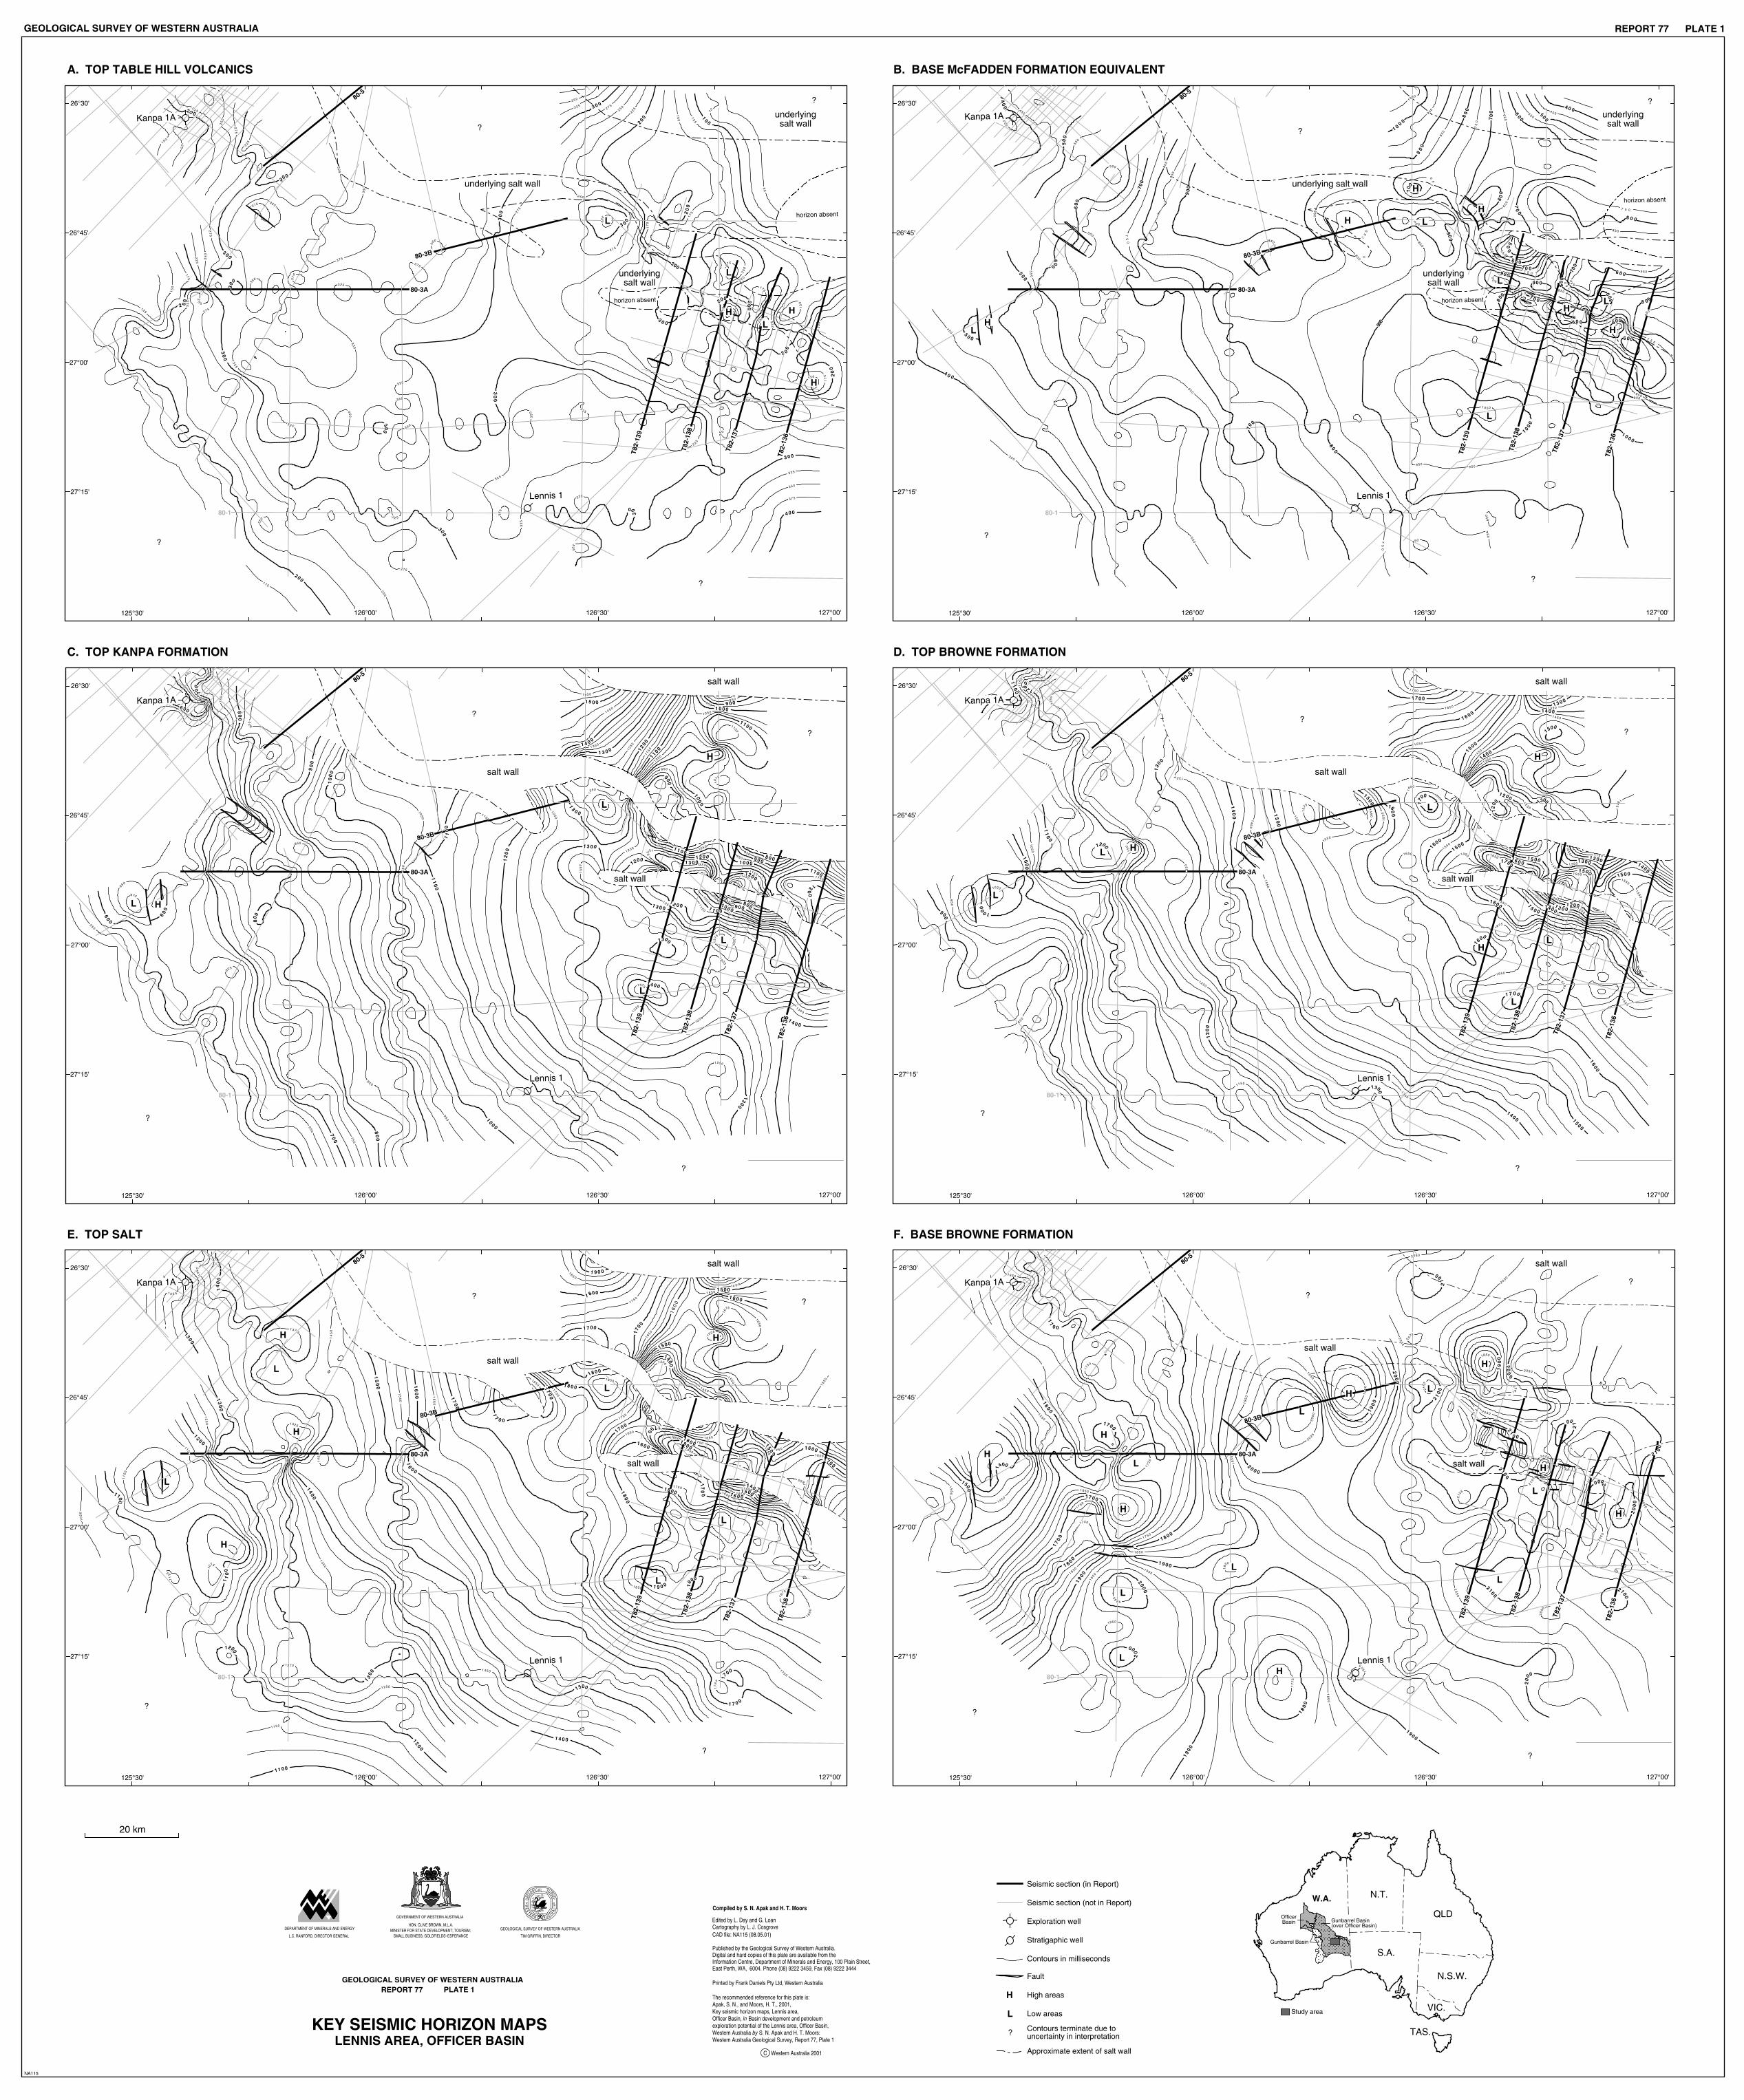
Lennis 1
horizon absent
T82-
136
T82-
137
T82-
138
T82-
139
05
57
10 0
125
12
5
05
1
051
15
0
15
0
1 5 0
051
1 7 5
175
17
5
57
1
571
1 75
175
002
200
002
20
0
2 0
0
00
2
02
2 0
0
22
5
5
2
2
22
5
2 2 5
22
52
2 5
05
2
250
0
52
2 5 0
052
05
2
052
25
0
25
0
05
2
052
572
2 75
57
2
27
5
2 7 5
27
5
572
003
0
03
003
3 0
0
30 0
003
5
2 3
523
3
2 5
523
32
5
32
5
325
3 2 5
523
523
523
5
23
523
523
053
35
0
35
0
053
05
3
05
3
053
05
3
053
053
573
5
73
5733 7 5
573
0045
72
003
00
3
053
32
5
523
053
300
20
0
522
2 25
002
57
1
00
3
00
3
30
0
underlyingsalt wall
underlying salt wall
underlyingsalt wall
27°15'
27°00'
26°45'
26°30'
Kanpa 1A
horizon absent
L
L
L
H
H
H
0
20 0
0 5 3
40
0
4 5 0
5 0 0
00
5
055
055
006
0066 0 0
60
0 60
0
65
0
056
6
50
007
007
00
7
007
05 7
75
0
00880
0
00 8
058
0 58
05
8
058
058
8 5 0
05
8
009
009
9
00
9 5 09 5 0
05 9
059
1 00
0
0001
0501
0501
00
9
05
8
8 0 0
05
8
7
50
008
057
057
05
7
009
0
05
055
006
65
0
057
00
8
007
0 5 9
40 04 5 050 0
5 5 0
60 0
65
0
00
7
057
5 5 06 0 0
0 5 6
0
8
3 5 0
009
009
058
85 0
850
007
70
0
65 0
6 5 0
600
00
8
80
0
05
7
05
7
05
5
05
5
500
4 50
4 0 0
Lennis 1
horizon absent
T82-
136
T82-
137
T82-
138
T82-
139
underlyingsalt wall
underlying salt wall
underlyingsalt wall
27°15'
27°00'
26°45'
26°30'
Kanpa 1A
horizon absent
H
H
H
H
H
L
L
L
L
L
H
0
1 0 0 0
00
6
6 00
526
056
576
800
8 0 0
8 50
850
058
8 5 0
875
9 00
900
900
9 0 0
950
9 50
950
95 0
100 0
1 0 0 0
0
001
1 00 0
05
01
1050
050
1
1 0 5 0
1 0 5 0
57
0 1
11
00
1 1 0 0
0011
11
00
1 1 0 0
0011
0
511
11
5 0
05110511
115 0
0511
00
21
12 0 0
00
2 1
1200
00210021
1200
0521
0521
05
2 1
12 5 0
12
5 0
0031
0031
13 0 0
1 3 0 0
5231
523
1135 0
05
31
0531
053
1
1 3 5 0
573
1
0041
1 4 0 0
5241
0541
0051
1 5 5 0
1 1 0 0105 0
00
8
5 5 0
05
31
0031
1300
1250
0041
0531
1 3 0 012 5 0
05 8
8 5 0
60
0
056
056
65
0
00
9
05
9
00
01
1 0 0 0
00
7
00
8
80
0
05
7
007
05
7
Lennis 1
T82-
136
T82-
137
T82-
138
T82-
139
27°15'
27°00'
26°45'
26°30'
Kanpa 1A
salt wall
salt wall
salt wall
HL
L
L
L
H
00 0 1
5201
1 15 0
0 51 1
1 2 00
0021
0021
12
50
125
0
05
21
0031
1300
1 3 0 0
1 300
13 0
0
1 3 0 0
0 5 3 1
1 3 5 0
1350
1 3 5 0
1 35 0
14
00
1 4 00
1400
14
50
0541
14
5 0
1450
1 4 5 0
05
41
14
50
1 4 5 0
15
00
1 5 0 0
1
5 0 0
1500
150 0
0051
1500
0051
0551
0551
0551
1 5 5 0
155 0
15
50
155
0
1 5 5 0
57
51
1600
1 60
0
0061
0061
1600
0061
165 00561
056
1
0561
16
7
5
5761
0071
0071
00
71
17 0 0
1 7 5 0
1 2 000521
0511
002
1
1 5
50
0051
0051 0041
8 50
11
00
0
51
1
1 3 5 01 4 00
0541
140 0
57
3 1
1 5 5 01600
05
61
0561
1150
1 150
11
00
0
0 2 1
00
21
05
2 1
1 2 5 0
10
50
1 0 50
10
00
95
0
9 00
Lennis 1
T82-
136
T82-
137
T82-
138
T82-
139
27°15'
27°00'
26°45'
26°30'
Kanpa 1A
salt wall
salt wall
salt wall
H
L
L
H
H
L
L
L
05
01
570
1
1 1 0 0
1 100
11
00
5 2
11
1 1 5 0
1150
05
11
1 2 0 0
120 0
0021
12
50
12 50
0521
5721
13
00
1 30 0
00
31
1325
0
5 3 1
13
50
0531
5
731
1 4 0 0
00
4 1
1400
1400
1400
05
41
1 4 50
1 450
05
41
1 4 5 0
0541
14 5 0
15
00
1500
1 5 00
0
051
1500
1 5 0 0
5251
05
51
1 5 5 0
15 50
05
51
15
50
0551
1 5 5 0
16
0 0
1 6 0 0
16 0 0
00
61
0061
00
61
16
50
1650
16 50
1 6 5 0
0561
16 5 0
056
1
57
61
17
00
1 7 0 0
0071
17
00
1700
00 7 1
1700
17 0 0
007
1
17 0
0
0071
5
27
1
17 50
1 7 5 0
1 7 5 0
0571
1 7 5 0
0571
18
00
1 800
1 8 0 0
18 0 0
1 800
1 85
0
1 8 50
1 8 5
0
0581
0581
18 5 0
5781
009
11 9 0 0
190 0
1 9 0 0
1 9 5 0 0061
0561
1650
05710081
0571
Lennis 1
T82-
136
T82-
137
T82-
138
T82-
139
27°15'
27°00'
26°45'
26°30'
Kanpa 1A
salt wall
salt wall
salt wall
H
L
H
H
L
L
L
L
H
1 400
1 4 5 0
1 500
1 5 5 0
155
0
1 6 5 0
0561
00
71
1700
007
1
0071
17
25
0571
1 7 5 0
0571
05
71
17
75
1 80
0
0081
1 8 0 0
05
81
0581
1 8 5 0
18
50
0581
0091
00
91
0091
1 9 0 0
19
00
19
00
1
92
5
195 0059
1
05
91
0591
05
91
1 95 0
19
50
1 9
50
20
00
00
02
20
00
000
2
20
00
2000
2 0 0 0
0
00
2
2 0 25
20
50
50
2
05
02
20
50
20
50
20
50
0502
0502
2 0 5 0
20
50
0502
0502
57
02
0012210 0
0
012
21 00
00
12 21
00
210
02
100
5
21
2
52
12
5
2 12
157
5
16
0 0
20
2 5
Lennis 1
T82-
136
T82-
137
T82-
138
T82-
139
27°15'
27°00'
26°45'
26°30'
Kanpa 1A
salt wall
salt wall
salt wallL
H
H
H
L
L
LH
L
H L
L
L
H
H
H
0
GEOLOGICAL SURVEY OF WESTERN AUSTRALIA
DEPARTMENT OF MINERALS AND ENERGY
GEO
LOGIC A L SURVEY
WE
ST E R N A U S T R
ALI
A
GOVERNMENT OF WESTERN AUSTRALIA
GEOLOGICAL SURVEY OF WESTERN AUSTRALIA
TIM GRIFFIN, DIRECTOR
REPORT 77 PLATE 1
L.C. RANFORD, DIRECTOR GENERAL
C Western Australia 2001
by
in
Seismic section (in Report)
Exploration well
Stratigaphic well
Contours in milliseconds
20 km
A. TOP TABLE HILL VOLCANICS B. BASE McFADDEN FORMATION EQUIVALENT
C. TOP KANPA FORMATION D. TOP BROWNE FORMATION
E. TOP SALT F. BASE BROWNE FORMATION
Cartography by L. J. Cosgrove
N.T.
QLD
S.A.
N.S.W.
VIC.
TAS.
Fault
REPORT 77 PLATE 1
NA115
OfficerBasin
W.A.
80-5
80-3B
80-3A
80-3A
80-3B
80-5
80-5
80-3B
80-3A
80-5
80-3B
80-3A
80-3B
80-3A
80-5
80-3B
80-5
80-3A
HON. CLIVE BROWN, M.L.A.
80-1
80-1
GEOLOGICAL SURVEY OF WESTERN AUSTRALIA
80-1
80-1
80-1
CAD file: NA115 (08.05.01)
LENNIS AREA, OFFICER BASIN
125°30' 126°00' 126°30' 127°00' 125°30' 126°00' 126°30' 127°00'
127°00'126°30'126°00'125°30'
125°30' 126°00' 126°30' 127°00'127°00'126°30'126°00'125°30'
125°30' 126°00' 126°30' 127°00'
MINISTER FOR STATE DEVELOPMENT; TOURISM;SMALL BUSINESS; GOLDFIELDS–ESPERANCE
Edited by L. Day and G. Loan
80-1
?
?
?
?
?
?
?
?
?
?
?
?
?
?
?
?
?
?
?
?
?
?
?
?
H
L
High areas
Low areas
Seismic section (not in Report)
Study area
Gunbarrel Basin(over Officer Basin)
Contours terminate due touncertainty in interpretation?
Gunbarrel Basin
Compiled by S. N. Apak and H. T. Moors
Printed by Frank Daniels Pty Ltd, Western Australia
East Perth, WA, 6004. Phone (08) 9222 3459, Fax (08) 9222 3444
Published by the Geological Survey of Western Australia.Digital and hard copies of this plate are available from theInformation Centre, Department of Minerals and Energy, 100 Plain Street,
Approximate extent of salt wall
KEY SEISMIC HORIZON MAPS
The recommended reference for this plate is: Apak, S. N., and Moors, H. T., 2001,Key seismic horizon maps, Lennis area,Officer Basin, Basin development and petroleumexploration potential of the Lennis area, Officer Basin,Western Australia S. N. Apak and H. T. Moors:Western Australia Geological Survey, Report 77, Plate 1
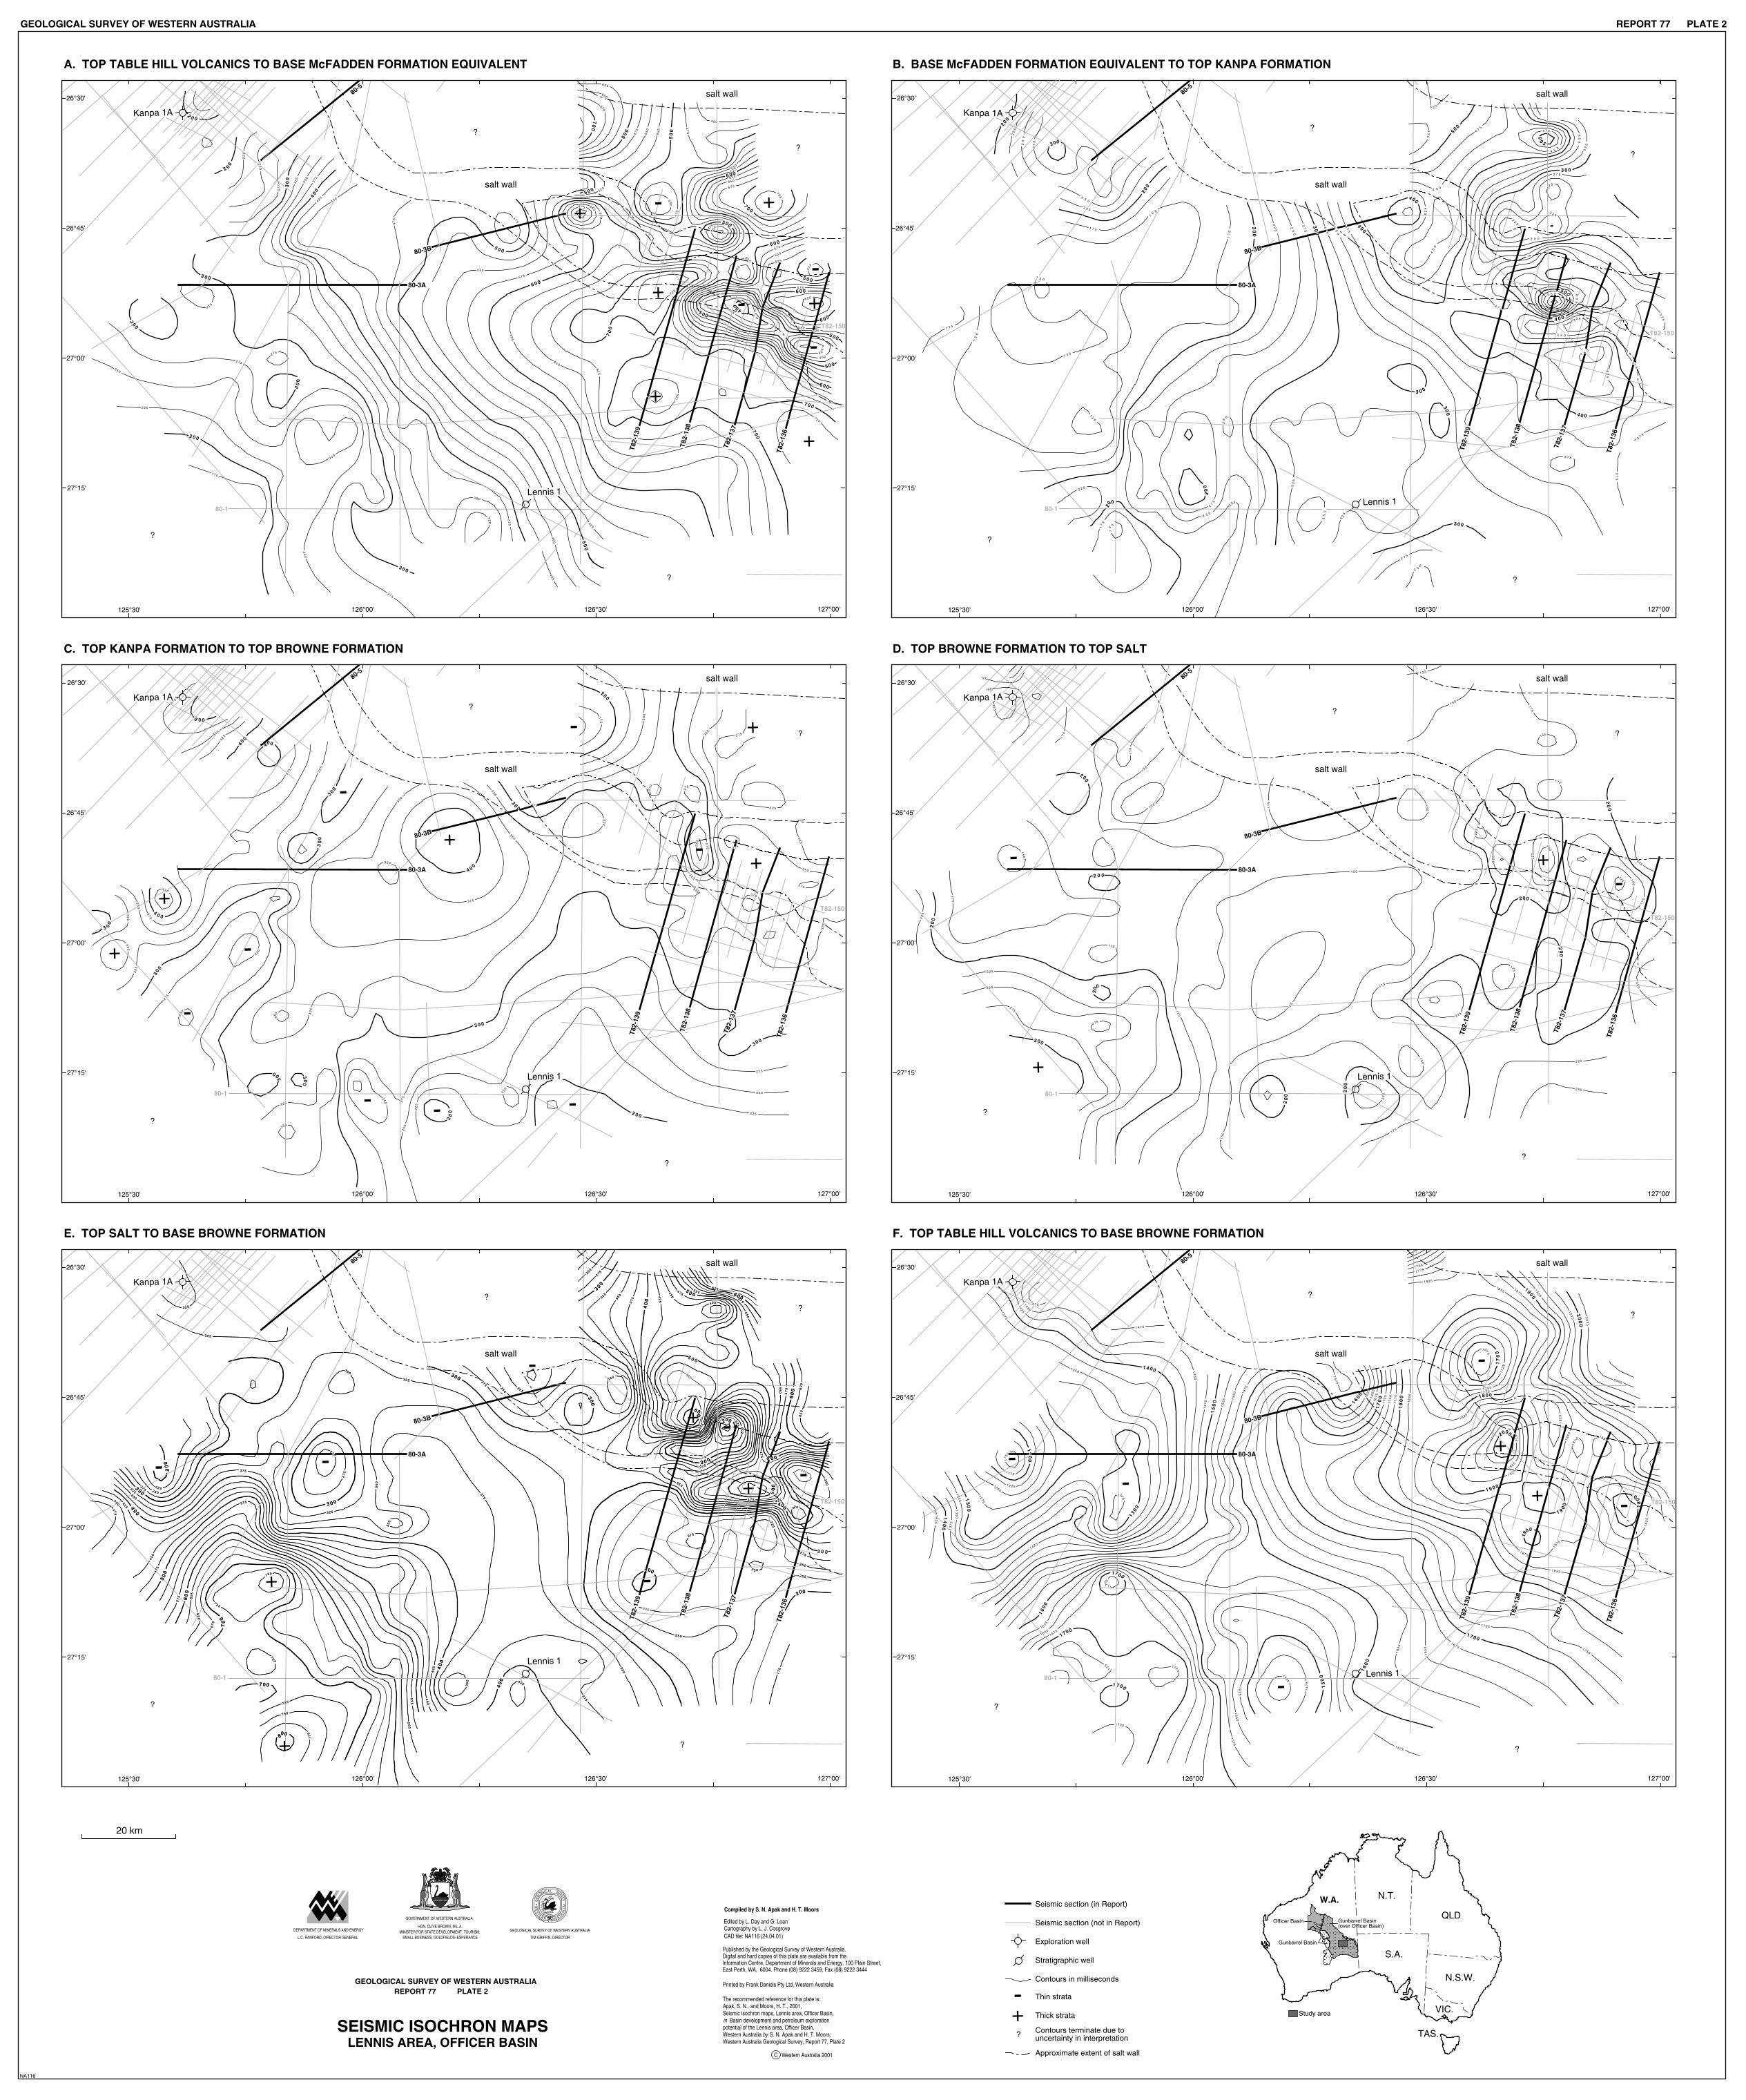
20 km
NA116
1 7 5
2 00
002
2 0 0
2 2 5
2 25
52
2
2 5 0
25
0
25
0
572
572
572
2 75
27
5
3 0 0
3 0 0
30
0
30 0
00
3
52
3
32
5
05
3
3 50
57
3
37
5
004
0 0 4
42
5
524
4 2
5
524
054
45
0
4 5 0
054
45
0
4 5 0
57
4
5
74
574
574
47
5
47
5
00
5
5 0 0
005
5 0 0
005
00
5
005
52
5
52
5
525
525
52
5
5 2 5
055
055
055
055
05
5
575
575
575
575
57
5
006
006
006
006
00
6
62
5
526
526
62
5
6 2 5
6 5 0
056
05
6
056
056
650
675
576
576
675
007
700
70
0
7
0 0
70
0
527
72
5
7 2 5
527
0
5 7
Lennis 1
+
T82-
136
T82-
137
T82-
138
T82-
139
27°15'
27°00'
26°45'
26°30'
Kanpa 1A
salt wall
salt wall
-
-
+-+
+
+
-
+
500
50 0
6 00
6 00
Lennis 1
T82-
136
T82-
137
T82-
138
T82-
139
27°15'
27°00'
26°45'
26°30'
Kanpa 1A
salt wall
salt wall
5
21
1 2 5
05
1
051
05
1
051
17
5
57
1
571
1 7 5
20
0
20
0
002
002
22
5
2
25
2 2 5
52
2522
2 2 5
52
2
52
2
25
0
2 5 0
052
05
2
2 5 0
2 5 0
05
2
572
27
5
2
75
572
57
2
003
30
0
30
0
003
3 0 0
003
003
32
5
52
3
32
5
523
52
3
35
0
35
0
3 5 0
35
0
57
3
573
37
5
573
573
573
57
3
4 0 0
4 0 0
4 00
004
52
4
42
5
054
45
0
45
0
4 5 0
4 50
574 574
005
005
0 0 5
52
5
5 2 5
055
175
20
0
002
200
22
5
2 2 5
22
5
052
05
2
052
05
2
052
2 5
0
05
2
05
2
572
57
2
2 7 5
57
2
2 7 5
5
72
57
2
003
003
30
0
3 00
300
003
3 0 0
30
0
003
3 25
32
5
32
5
52
3
32
5
3
2 5
32
5
32
5
52
3
32
5
3 2 5
053
0
5 3
35
0
053
053
35
0
053
053
053
0
53
37
5
573
3 7 5
3 7 5
573
57
3
573
4 0 0
4 0 0
004
004
524
5
24
054
574
5 0 0
Lennis 1
T82-
136
T82-
137
T82-
138
T82-
139
27°15'
27°00'
26°45'
26°30'
Kanpa 1A
salt wall
salt wall
+
+
---
-
-
+
+
+
-
-
-
125
521
1 2 5
52
1
521
15
0
051
05
1
051
05
1
051
051
051
150
051
17
5
571
17
5
571
57
1
57
1
571
17
5
17
5
57
1
57
1
571
57
1
571
00
2
20
0
20
0
20
0
00
2
002
2 00
002
200
2 2 5
22
5
522
2 2 5
522
52
2
52
2
2 2 5
522
2 5 0
052
05
2
052
2 7 5
572
3 00
Lennis 1
T82-
136
T82-
137
T82-
138
T82-
139
27°15'
27°00'
26°45'
26°30'
Kanpa 1A
salt wall
salt wall
22
5
-+
+
-
57
1
002
2 00
20
0
002
522
522
52
2
2 2 5
522
2 2 5
052
2 5 0
052
2 5 0
052
25
0
2 5 0
2 5 0
052
572
572
27 5
27
5
2 7 5
572
003
3 0 0
3 00
3 0 0
3 00
003
003
3 2 5
523
52
3
3 2 5
3 2 5
32 5
3 2 5
3 2 5
35
0
3 5 0
35
0
35
0
05
3
35 0
05
3
053
3 5 0
573
573
573
57
3
40
0
4 00
00
4
00
4
400
42
5
52
4
524
524
42
5
4 2 5
524
45
0
45
0
45 0
45
0
47
5
475
4 7 5
4 7 5
47
5
50
0
50
0
5 0 0
5 0 0
52
5
525
5 2 5
525
05
5
55
0
550
05
5
57
5
57
5
575
60
0
00
6
6 00
006
62
5
52
6
6 2 5
05
6
05
6
67
5
70
0
7 00
7 2 5
527
527
75 0
057
77
5008
57
1
002
2 00
20
0
002
522
52
2
2 2 5
522
2 2 5
052
2 5 0
052
2 5 0
052
25
0
2 5 0
2 5 0
052
572
572
27 5
27
5
2 7 5
572
3 0 0
3 0 0
3 0 0
3 00
003
003
3 2 5
523
52
3
3 2 5
3 2 5
3 2 5
3 2 5
35
0
3 5 0
35
0
35
0
05
3
35 0
05
3
053
3 5 0
573
573
573
57
3
40
0
40 0
00
4
00
4
400
42
5
52
4
524
524
42
5
4 2 5
524
45
0
45
0
45 0
45
0
47
5
475
4 7 5
4 7 5
47
5
50
0
00
5 0 0
5 0 0
52
5
525
5 2 5
525
05
5
55
0
05
5
57
5
57
5
575
60
0
00
6
6 00
006
62
5
52
6
6 2 5
05
6
05
6
67
5
70
0
7 0 0
7 2 5
527
527
75 0
057
77
5008
Lennis 1
T82-
136
T82-
137
T82-
138
T82-
139
27°15'
27°00'
26°45'
26°30'
Kanpa 1A
salt wall
salt wall
+ -
+ -
-
-
+
+
- -
5 0 0
05
11
1 1 7 5
12
00
1 2 2 5125 0
1 275
127
5
13
00
1 3 0 0
13
25
13
50
0531
57
31
13
75
14
00
0041
14
2
5
5241
14
25
05
41
14
50
14
5 01
47
5
57
41
1 4 7 5
14 7 5
15
00
00
51
52
51
52
51
05
51
05
51
57
51
1 5 7 5
57
51
15
7
5
16
00
0061
00
61
1 6 25
52
61
52
61
1 6 5 0
05
61
05
61
1 6 7 5
57
61
1 6 7 5
57
61
17 0 0
0071
00
71
1 7 0 0
0071
17
00
17 25
52
71
1 7 2 5
1725
5271
52 7 1
17
25
05
71
1 7 50
1 7 5 0
0571
57
71
1 7 7 5
5771
00
81
18
0
0
18 0 052
81
18
25
18
25
1 8 2 5
5281
1 8 50
1 8 5 0
18
50
0581
187
5
1 8 7 5
1 8 75
5
781
0091
1 9
00
1 9 0 0
1900
1 9 2 5
1925
19
50
1 9 5 0
57
91
19
75
0002
20
00
20
25
2 0 5 0
Lennis 1
T82-
136
T82-
137
T82-
138
T82-
139
27°15'
27°00'
26°45'
26°30'
Kanpa 1A
salt wall
salt wall
+
+
-
-
--
-
A. TOP TABLE HILL VOLCANICS TO BASE McFADDEN FORMATION EQUIVALENT B. BASE McFADDEN FORMATION EQUIVALENT TO TOP KANPA FORMATION
C. TOP KANPA FORMATION TO TOP BROWNE FORMATION D. TOP BROWNE FORMATION TO TOP SALT
E. TOP SALT TO BASE BROWNE FORMATION F. TOP TABLE HILL VOLCANICS TO BASE BROWNE FORMATION
80-5
80-3B
80-3A
80-5
80-3B
80-3A
80-5
80-3B
80-3A
80-5
80-3B
80-3A
80-5
80-3A
80-3B
80-5
80-3B
80-3A
REPORT 77 PLATE 2GEOLOGICAL SURVEY OF WESTERN AUSTRALIA
T82-150
80-1 80-1
T82-150
T82-150
80-1
T82-150
80-1
80-1
T82-150
125°30' 126°00' 126°30' 127°00' 125°30' 126°00' 126°30' 127°00'
127°00'126°30'126°00'125°30'
127°00'126°30'126°00'125°30'127°00'126°30'126°00'125°30'
T82-150
GEOLOGICAL SURVEY OF WESTERN AUSTRALIAREPORT 77 PLATE 2
C Western Australia 2001
by
in
Cartography by L. J. Cosgrove
Compiled by S. N. Apak and H. T. Moors
CAD file: NA116 (24.04.01)
LENNIS AREA, OFFICER BASINSEISMIC ISOCHRON MAPS
The recommended reference for this plate is: Apak, S. N., and Moors, H. T., 2001,Seismic isochron maps, Lennis area, Officer Basin, Basin development and petroleum explorationpotential of the Lennis area, Officer Basin,Western Australia S. N. Apak and H. T. Moors:Western Australia Geological Survey, Report 77, Plate 2
126°00'125°30' 126°30' 127°00'
Edited by L. Day and G. Loan
80-1
DEPARTMENT OF MINERALS AND ENERGY
GEO
LOGIC A L SURVEY
WE
ST E R N A U S T R
AL
IA
GOVERNMENT OF WESTERN AUSTRALIA
GEOLOGICAL SURVEY OF WESTERN AUSTRALIA
TIM GRIFFIN, DIRECTORL.C. RANFORD, DIRECTOR GENERAL
HON. CLIVE BROWN, M.L.A.MINISTER FOR STATE DEVELOPMENT; TOURISM;
SMALL BUSINESS; GOLDFIELDS–ESPERANCE
Seismic section (in Report)
Exploration well
Stratigraphic well
Contours in milliseconds
Seismic section (not in Report)
Contours terminate due touncertainty in interpretation?
-+
Thin strata
Thick strata
N.T.
QLD
S.A.
N.S.W.
VIC.
TAS.
W.A.
Study area
?
?
?
?
?
?
?
??
?
?
?
?
?
?
?
?
??
?
??
?
?
East Perth, WA, 6004. Phone (08) 9222 3459, Fax (08) 9222 3444
Gunbarrel Basin(over Officer Basin)
Gunbarrel Basin
Officer Basin
Published by the Geological Survey of Western Australia.Digital and hard copies of this plate are available from theInformation Centre, Department of Minerals and Energy, 100 Plain Street,
Printed by Frank Daniels Pty Ltd, Western Australia
Approximate extent of salt wall


![Morocco and the Moors[1]](https://img.pdfslide.net/doc/110x75/577ce0291a28ab9e78b2c3ee/morocco-and-the-moors1.jpg)